Abstract
Graphite, which is a key anode material for LIB, needs to have a high tap density (dt) to reach a high volumetric energy density. Since dt is directly correlated with particle size, particle size distribution, and particle shape, it can usually be improved by optimized grinding. So, determining the ideal grinding time by modeling the change in dt over grinding time can yield substantial benefits like time, energy, and economy. However, the grinding time-dependent dt modeling of graphite has never been reported before. Therefore, in this study, the relationship between the measured dt values and grinding times of graphite particles by a vibrating disc mill (VDM) was investigated. Then, the empirical time-dependent dt models were established with high R2 values. The experimental and predicted dt values were found to be close to each other. Among all tested fitting models, the exponential model (dt = ae−bt) was found to be the best-fitting model, having the highest R2 and lowest error values. This approach provides guidance in the powder flow and processing of ground mineral materials, in the preparation processes of high-density graphite LIB anode material, as well as in graphite grinding in other mills in the industry, as well as in different electrode materials.
1. Introduction
Since the development of energy storage technologies for the transportation industry is of great importance, considering fluctuating oil costs, concerns about the negative impact of hydrocarbon emissions on global climate change, and energy security, modern batteries, which power everything from electric cars to mobile phones, have completely transformed our lives. In other words, lithium-ion batteries (LIBs), the most widely used battery chemistry for electric vehicles, personal electronics, and large-scale (grid) storage, are leading the current global shift towards renewable energy [1]. Therefore, research has focused on increasing the capacity and energy density of LIBs for use in hybrid electric vehicles (HEVs), plug-in HEVs, and fully electric vehicles.
However, characterizing and improving batteries for increased longevity and performance continues to present challenges. This calls for a more thorough comprehension of the characteristics of battery materials under progressively harsher operating circumstances [2,3]. Run time, safety, cycle life, power, energy density, and cost are the main performance characteristics of a battery that are determined by the materials that make up the cathode, anode, separator, and electrolyte. Particularly, a battery’s volumetric energy density is an important factor to consider. Every day, researchers are doing extensive work to increase the energy density and power in LIBs since energy storage capacity is crucial for the LIB market. Because LIB is thought to be the best option as it offers the highest energy density of practical rechargeable batteries [4].
In this context, although there are many alternatives to LIB cathode material, graphite is the most widely used anode active material today and is, therefore, indispensable [3,5]. For example, a Tesla Model S, the most common EV, is known to use around 56 kg of graphite [1]. In addition, graphite is one of the critical raw materials that developed countries such as China, the EU, and the USA care about [6]. The growing emphasis on sustainability and environmental impact is expected to lead to a rise in the use of natural graphite because of its long cycle life, high energy density, and power density. Particularly, it has a long lifespan because of its layered crystal structure, which is perfect for the reversible intercalation of lithium ions and excellent electrical conductivity [1].
High specific capacity and high tap density (dt) electrode materials are required for LIBs with high power densities [7]. In this context, dt, which is a significant physical property of LIB anode material and influences the energy density of a LIB [4], is crucial insofar as it increases the electrodes’ packing density to store more energy with the same volume [8]. Therefore, increasing the sphericity and dt of the graphite particles is important for improving their volumetric energy density [9]. Thus, it can be used to provide a deeper comprehension of the physical characteristics of powder samples in practical applications to assess powder quality and product performance. When evaluating a powder’s flow characteristics, the dt assessment is essential since it provides important information about how the powder will be handled and processed [10]. In other words, the importance of high-dt construction for LIB electrode materials has grown in recent years. For instance, during LIB manufacturing, increasing the dt can maximize the high energy density. Whether the powder material consists of granules or flakes changes the way the particles are packed together and influences their values of dt. While tapping, the particles are increasingly packed more efficiently, reducing the powder volume and ultimately increasing the dt [11]. In fact, it can be increased by precisely optimizing several parameters, such as precursor preparation, calcination, and grinding [7,12]. The grinding performance of a mill depends on some parameters: energy consumption, efficiency, grinding size, and particle size distribution are all significantly impacted by the selection of additional grinding parameters. As a result, the fracture modes used by various mill types will influence the morphology of the particles. Thus, grinding with a suitable mill for sufficient time becomes very important as it accounts for 4% of global energy use [13].
In general, the dt parameter is considered to be largely related to particle size, particle size distribution, and particle shape [7,8,12,14]. Since it has been reported that improving the graphite particles’ volumetric energy density requires increasing dt [15], determination of the optimal and achievable dt of graphite material to produce a high volumetric energy density of LIB anode material by modeling and investigating the effect of grinding time on dt values can address this issue [7], i.e., if time-dependent dt models are used to estimate the optimal grinding time, this can help produce graphite particles with a greater dt for anode usage. Thus, the rate at which the dt value of the particles produced by grinding changes is useful knowledge for forecasting the grinding time needed, selecting an appropriate mill, and forecasting how ground graphite would behave in a subsequent operation. In other words, this approach can be used to calculate the necessary grinding time for the desired dt value of graphite particles using a more suitable mill for the intended usage, considering energy and cost savings during milling.
Although it is expected that dt can be improved by optimization of the production process, such as grinding [7], no attempts were made to investigate the rate of change in the dt of ground graphite particles by a mill with various grinding times. Previous research [16] showed that although the vibrating disc mill (VDM) has limited capacity, it has higher cost and energy efficiency advantages than the ball mill (BM). Since the energy consumption in ultra-fine micronized grinding is very high, the VDM has proven to be an economical device for efficient ultra-fine micronized grinding [17]. Moreover, the VDM grinds faster than BM, and it was suggested that the VDM can produce good results by time-based shape models [16]. Therefore, VDM was selected as the grinding process of this study, which investigates the dt changes in graphite particles as a function of grinding time.
With this study, it will be possible to intentionally adjust the attributes to match the needs of certain applications by providing fine control over the interaction between the dt of graphite particles and grinding times. Thus, the best-desired results can be obtained by optimizing the grinding to select a suitable grinding system and grinding time. In other words, the aim of this study is to establish empirical time-dependent models between the average dt of ground graphite particles and grinding time for the prediction of dt values.
2. Materials and Methods
2.1. Sample Preparation
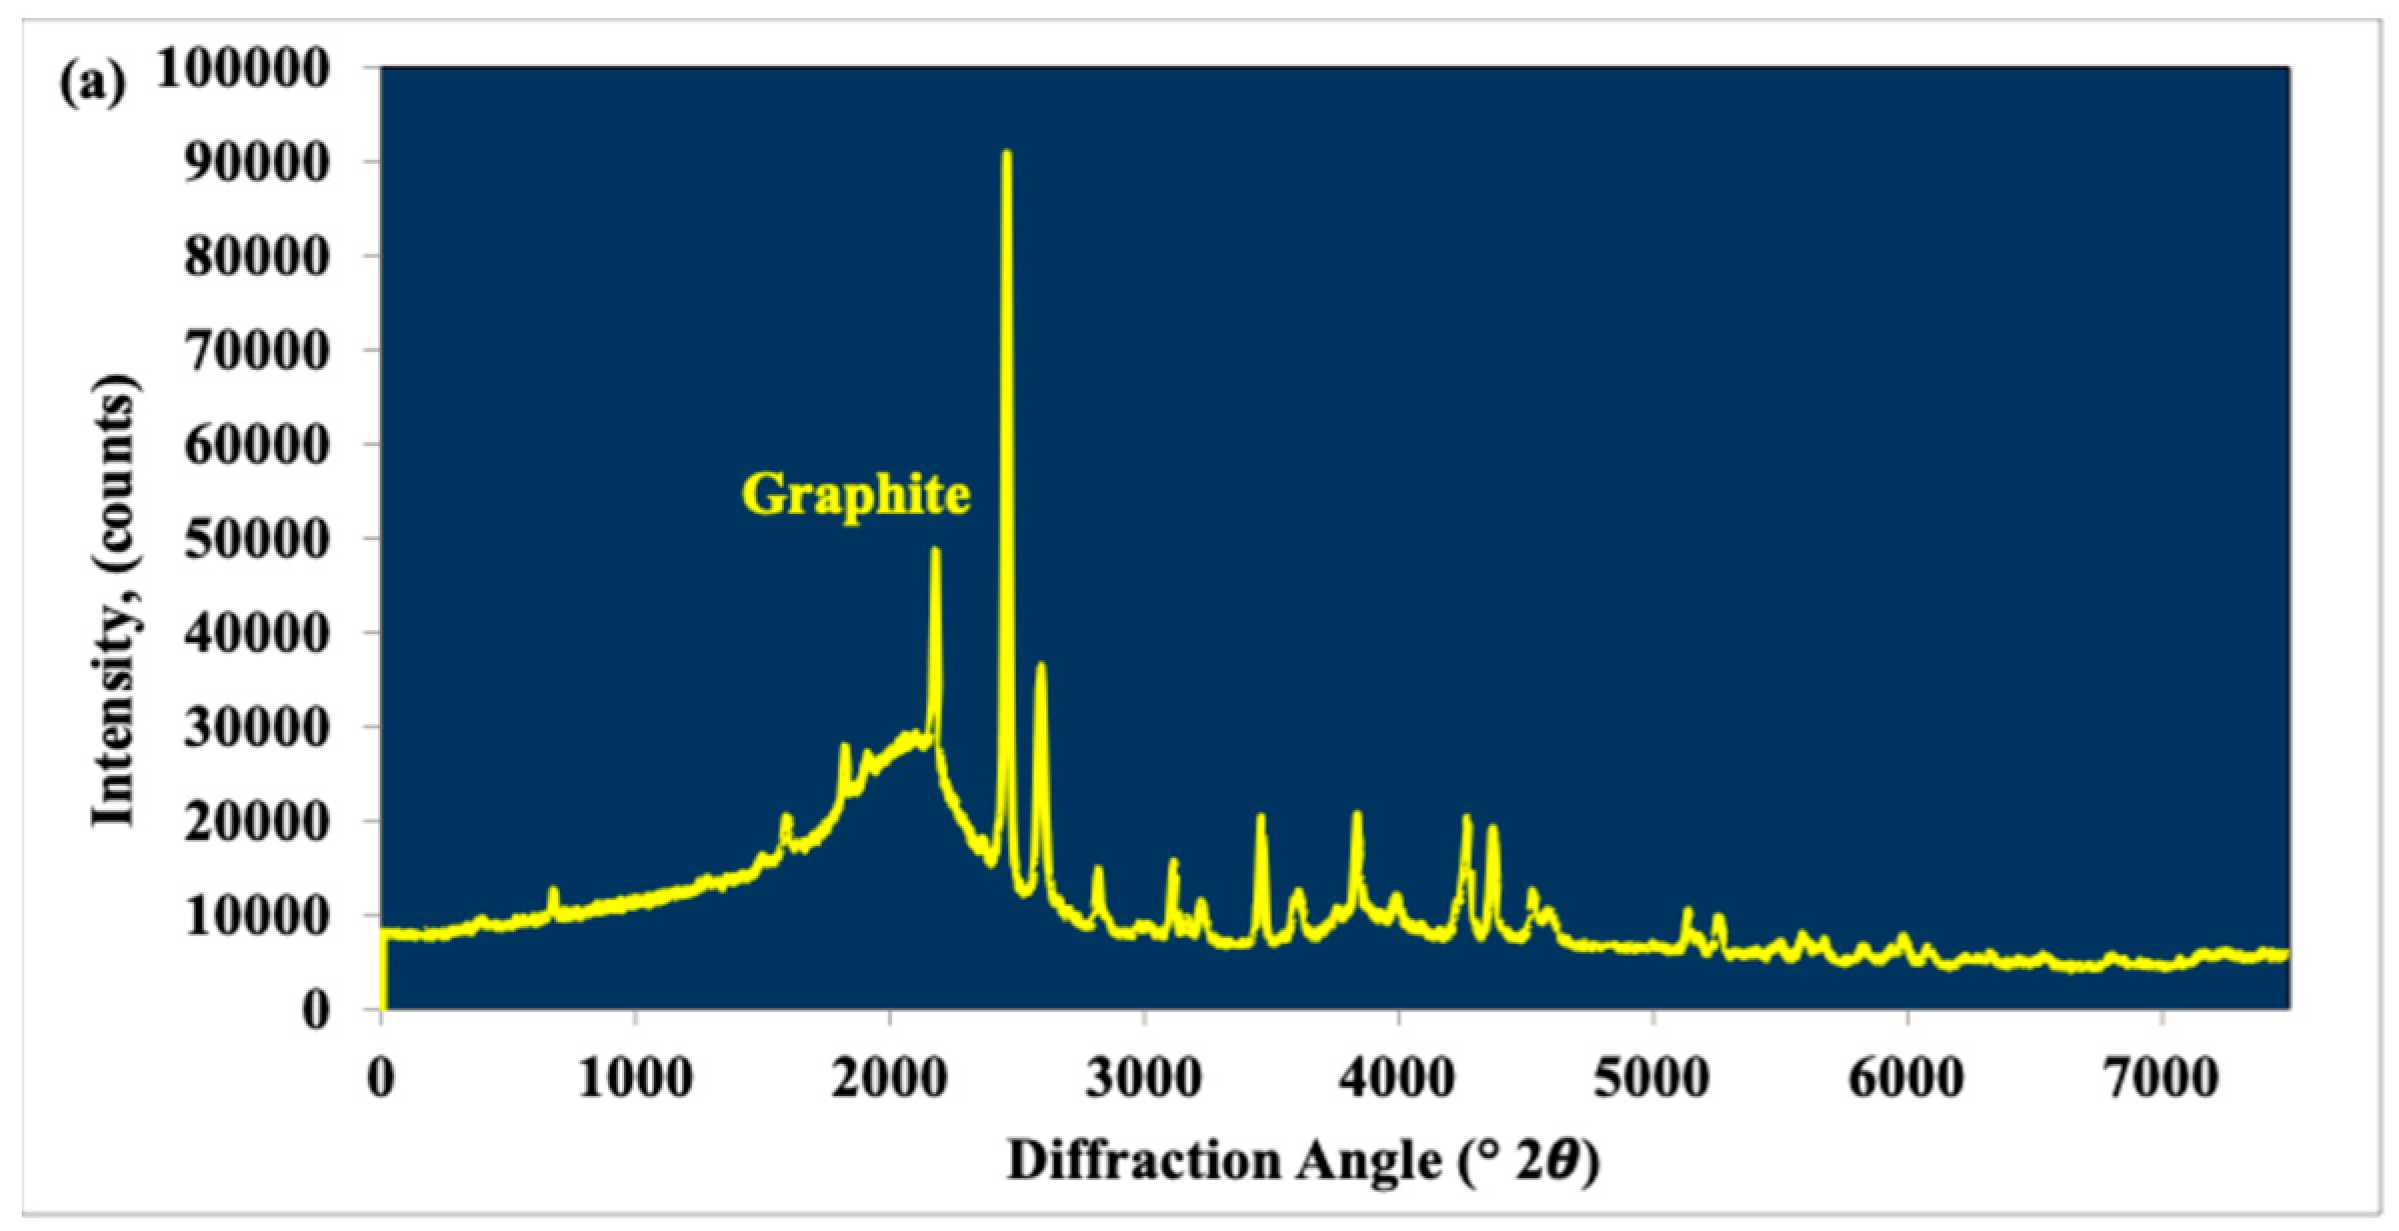
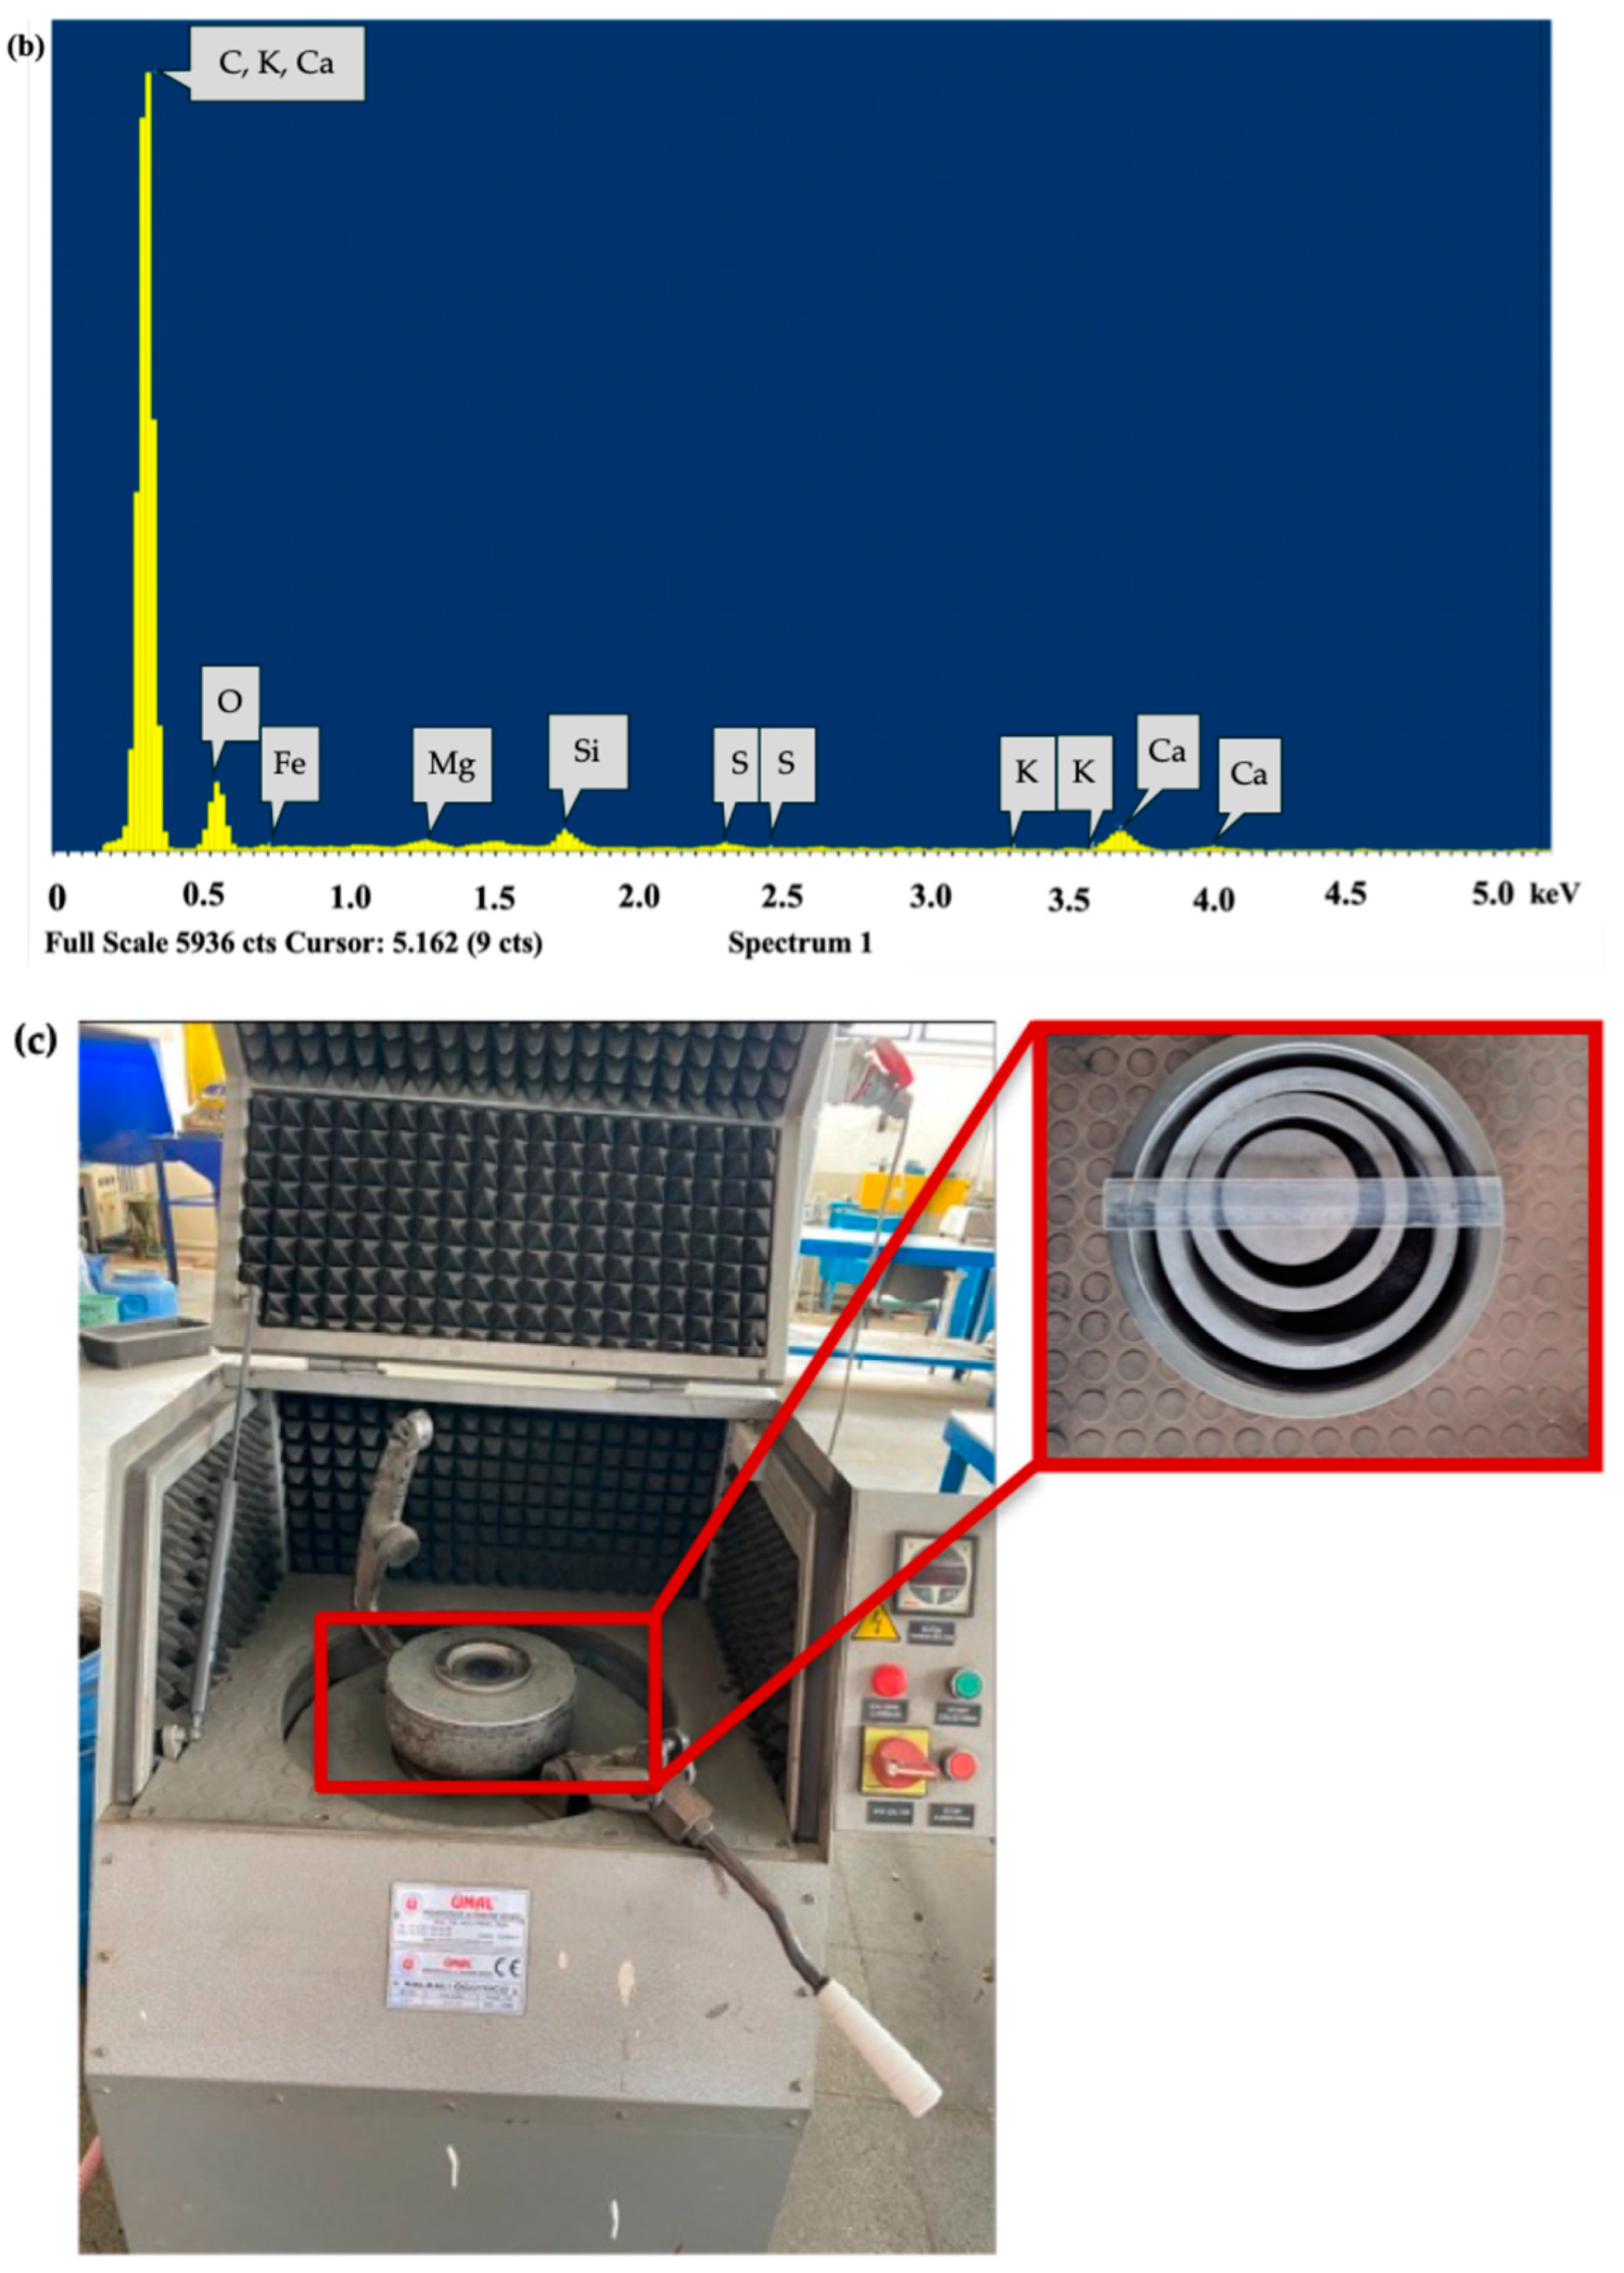
Medium-purity (72% C) graphite ore prepared by crushing and screening to a size fraction of 0.600–0.850 mm from the Oysu region of Kütahya, Turkey, was used for this research. When interpreted according to the X-ray diffraction (XRD) (Figure 1a) pattern and the X-ray spectroscopy (EDS) spectrum in scanning electron microscopy (SEM) given in Figure 1b, it is known that graphite is the major mineral and calcite, quartz, hematite, and clay group minerals are minor minerals in the ore. In this study, a laboratory-type vibratory disc mill (VDM) (Ünal Mühendislik, Turkey) with a diameter of 18.8 cm, a height of 6 cm, a volume of 500 mL, and rings with diameters of 7.4, 9.4, and 14 cm was used (Figure 1c). Sample preparation and grinding tests of graphite ore with a VDM have already been described in our previous study [16]. After the controlled crushing of the lump ore with a jaw crusher, the feedstock material of one size fraction was prepared for the grinding test with 600- and 850-micron sieves. The products obtained at the end of grinding at 10, 20, 30, 40, 50, and 60 s were separated into two narrow size fractions (0.150–0.250 mm and 0.053–0.150 mm) with 250-, 150-, and 53-micron sieves to minimize the size effect and were used in dt measurements after sizing.
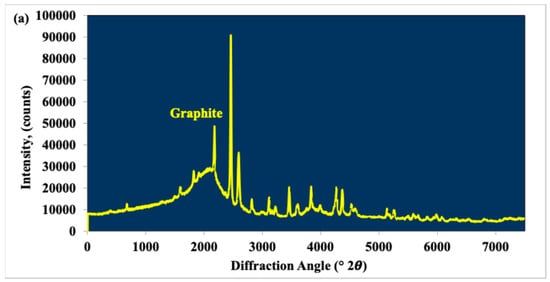
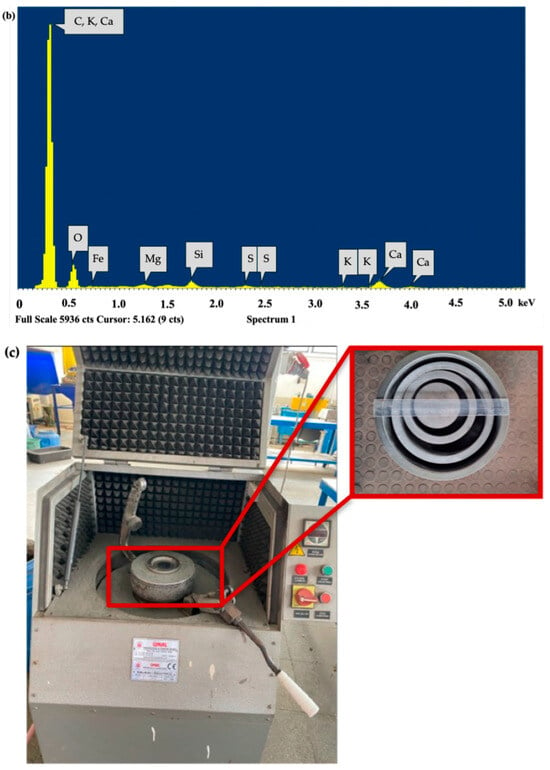
Figure 1.
Graphite sample used in this study: (a) XRD pattern, (b) SEM spectrum, (c) VDM and rings used in the study.
2.2. dt Measurements
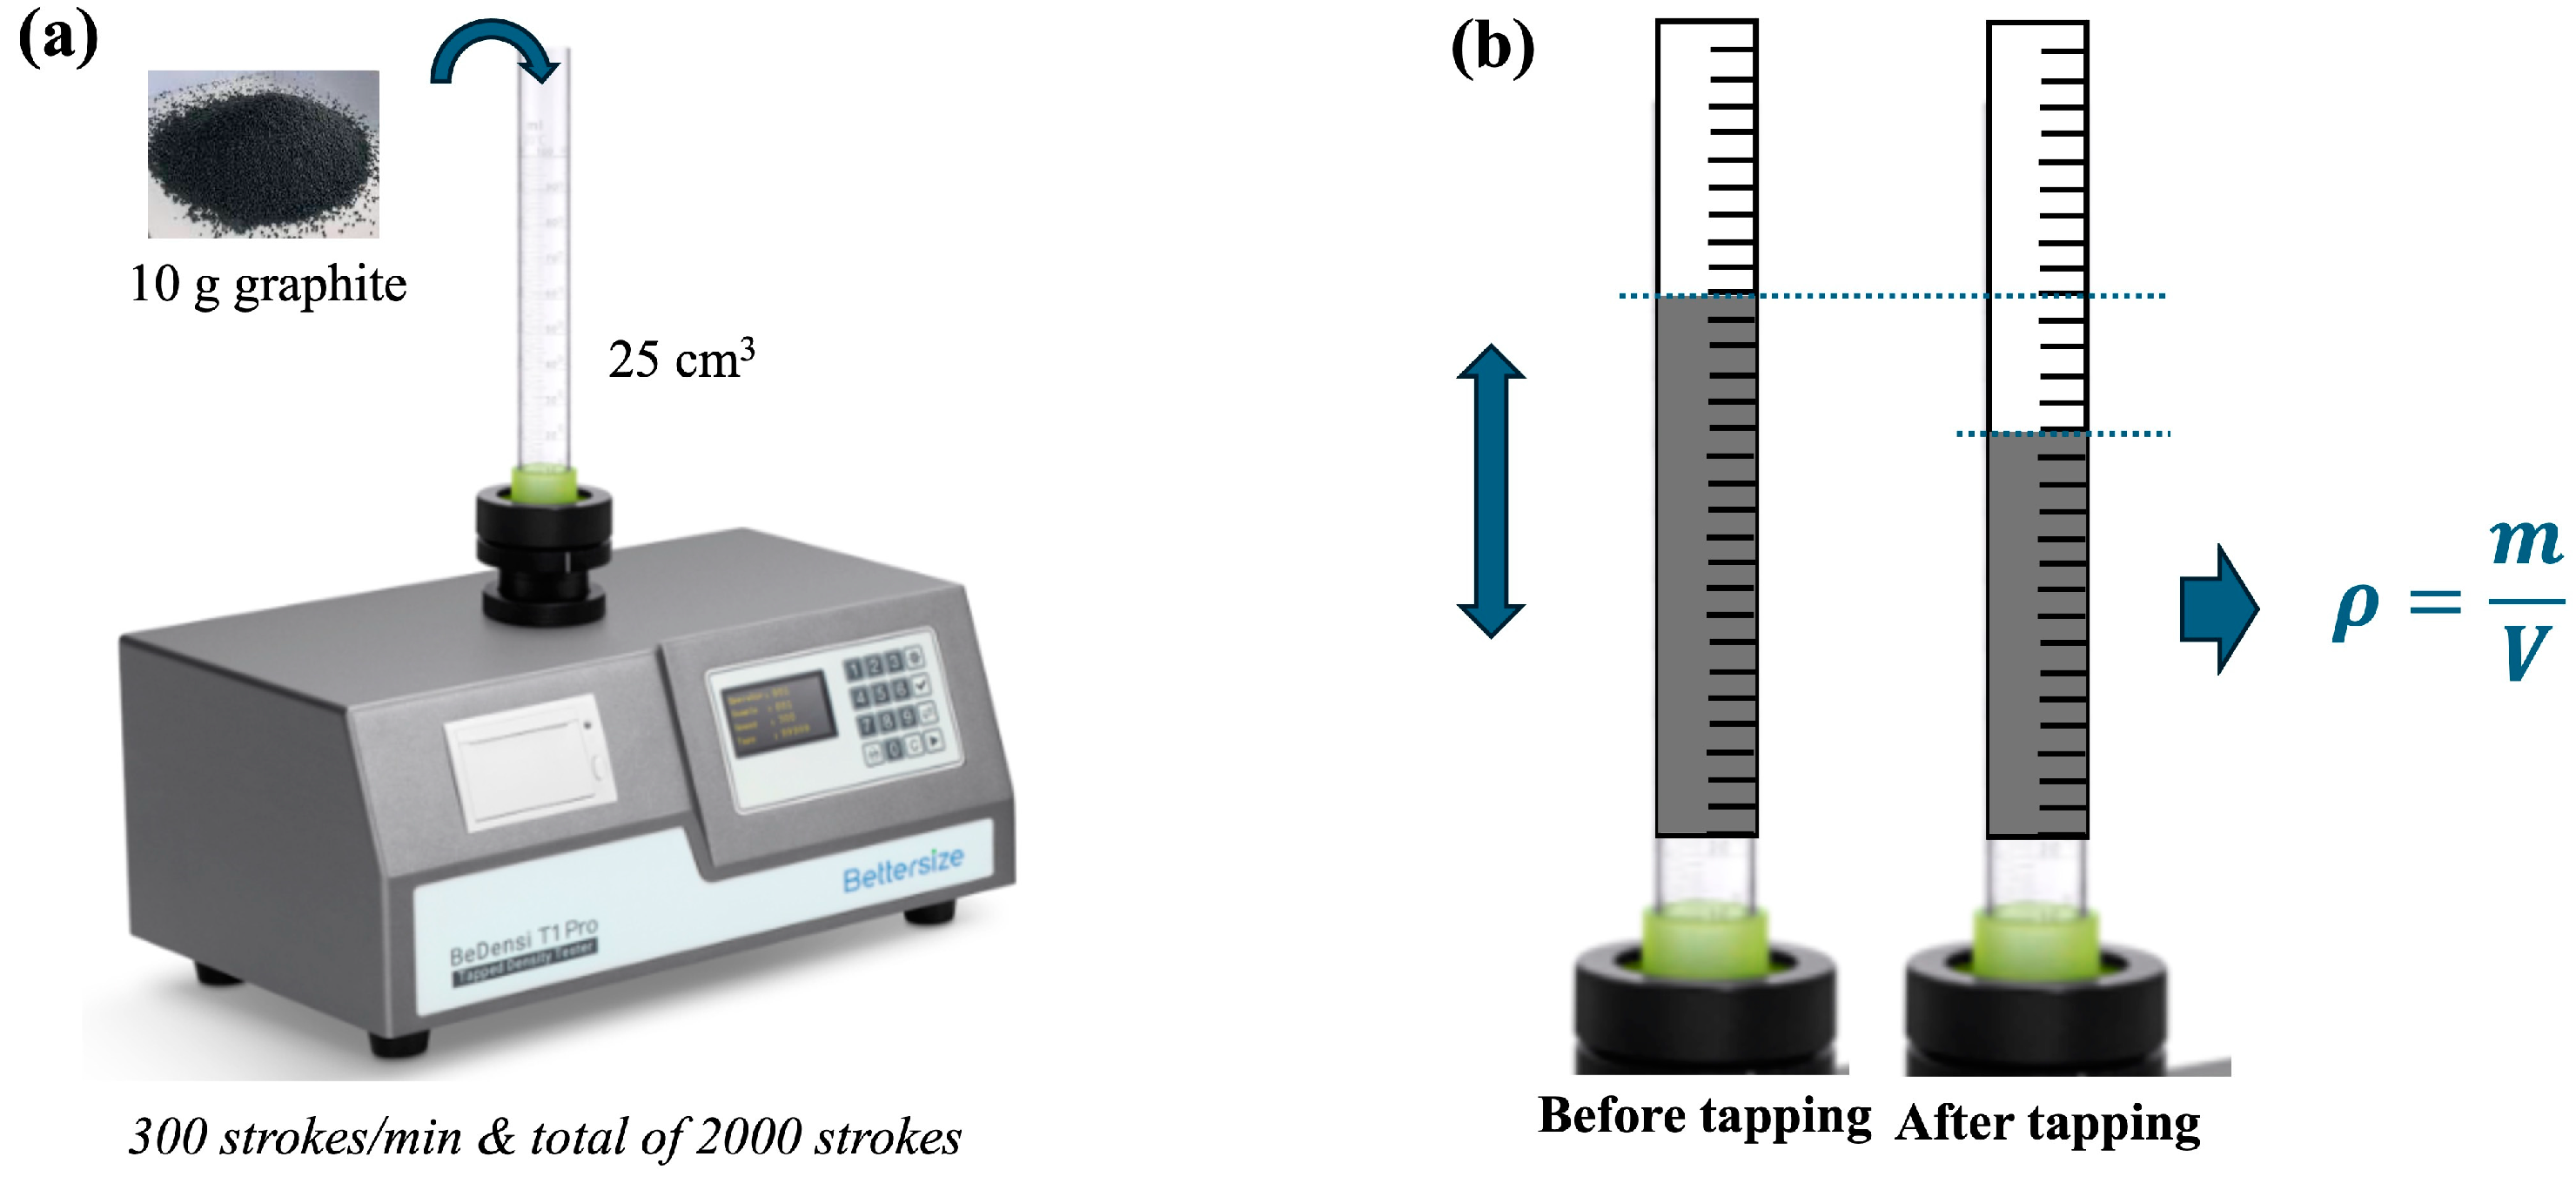
Determination of dt of graphite powder samples ground in a VDM for various grinding times and prepared in both size fractions was carried out using a dt apparatus (BeDensi T2, Bettersize Instruments Ltd., Liaoning, China) as shown in Figure 2, which has a 1.0% repeatability, complying with ISO 3953:2011 standard [18]. Approximately 10 g of graphite sample was poured into the 25 cm3 graduated glass cylinder for each test. The BeDensi T2 device was operated at a frequency of 300 strokes/min and a total of 2000 strokes. After the tapping process was completed, the final volume was recorded so that the surface of the sample was flat. Finally, the powder’s dt is calculated by dividing its mass by its volume as given by Equation (1):
where dt, m, and V are defined as tap density (g/cm3), mass of the powder (g), and volume (cm3) of the tap powder, respectively. Each experiment was repeated three times, and the dt values were calculated using the arithmetic mean of the values obtained.
dt = m/V
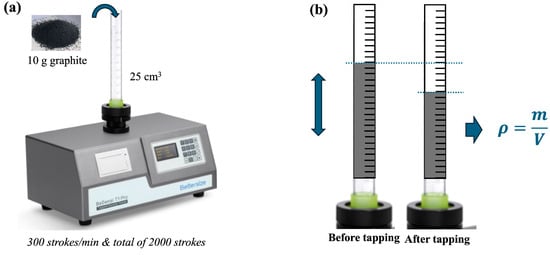
Figure 2.
(a) dt apparatus used in the study, (b) measurement of dt.
2.3. Concept of Particle Degree of Sphericity
In this study, Dynamic Image Analysis (DIA) [19,20,21,22], which has been proven to be a technique that provides the fastest and most reliable results on the shape characterization of ground mineral particles according to previously published studies, was used. Shape characterization of the same graphite particles ground by a VDM with various grinding times was previously described [16] using DIA 1.0 (Micromeritics® Instrument Corp., Norcross, GA, USA).
According to the bubble–particle attachment test results in our last [23], which investigated the attachment efficiency of spherical, cylindrical, triangular prismatic, and cubic particles to air bubbles, according to attachment efficiency, settling speed, collision efficiency, and induction time, and investigated the role of particle geometry (surface, edges, and apex) on flotation behavior; since the attachment efficiency was shown to be in the order of cubic > triangular > cylindrical > spherical, in this study, we found it appropriate to define the tap density–shape relationship as a shape parameter (degree of sphericity) that looks more like a lumped cube instead of a rectangular or elongated particle.
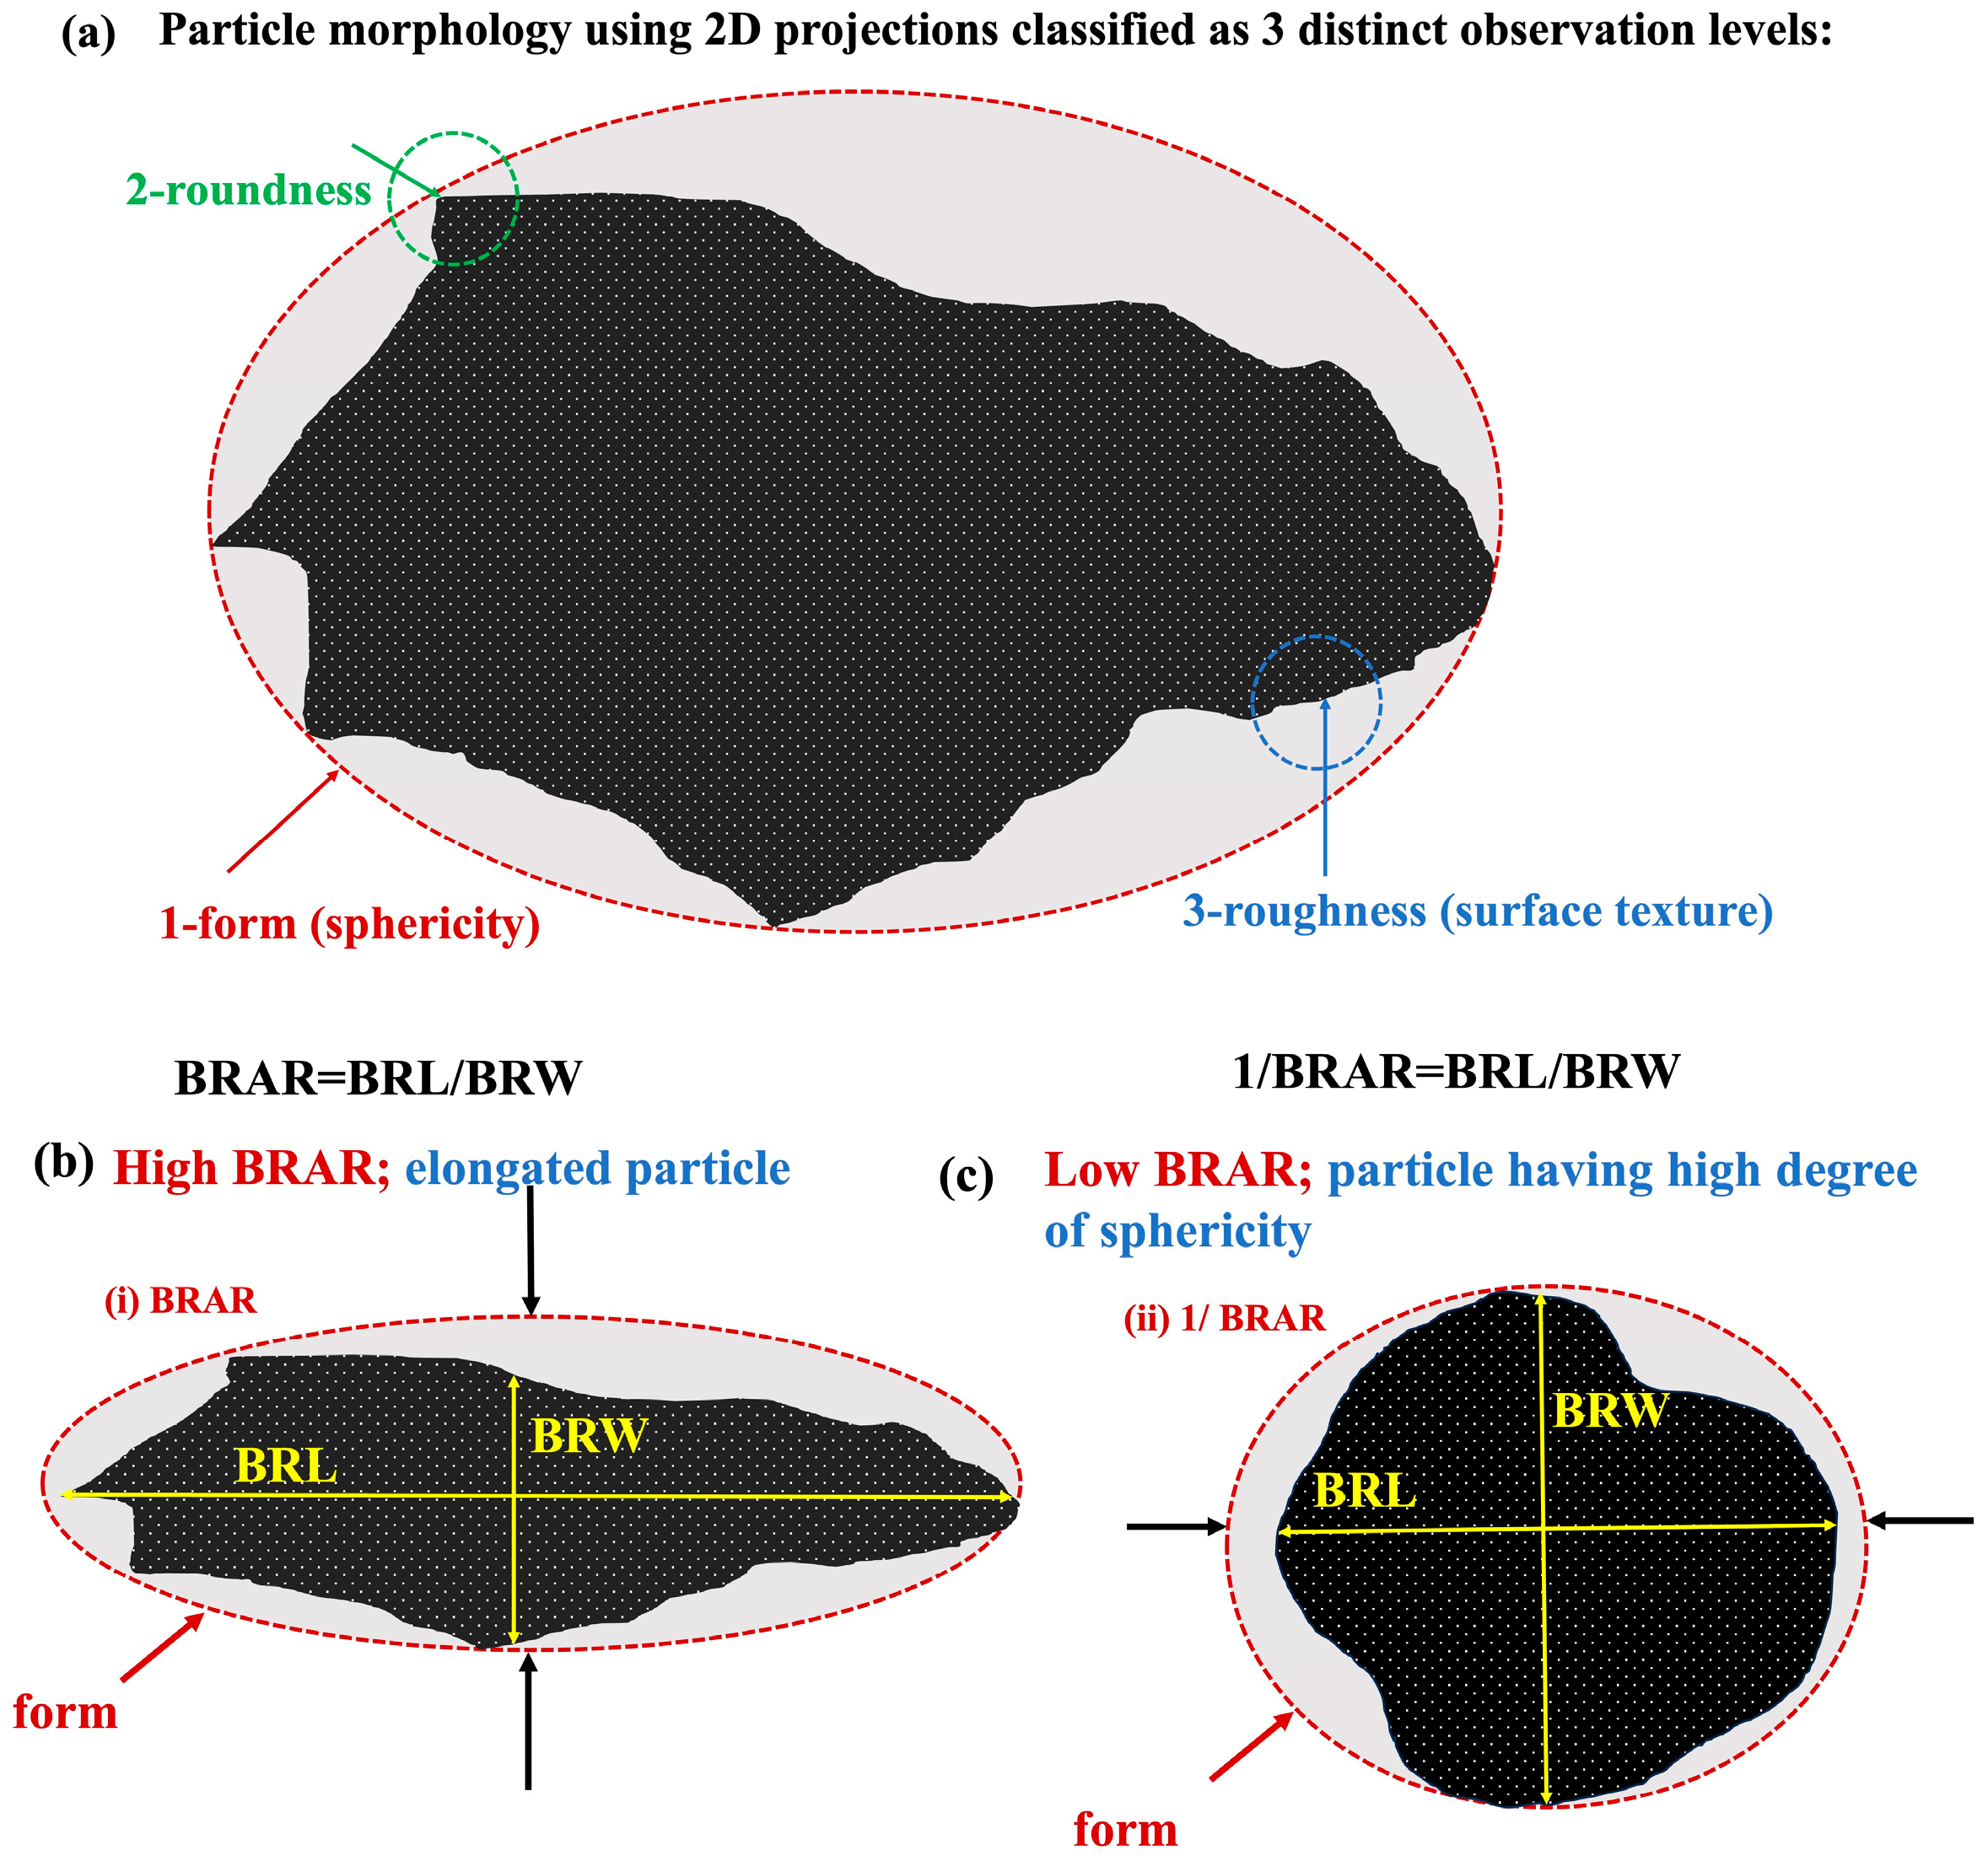
As seen in Figure 3, various related particle shape metrics, such as aspect ratio (AR), can be used to characterize particles. A common method for expressing how much a particle is stretched is the L/W ratio. As seen in Figure 3a, if the L/W ratio is greater than 1, it can be said that the particle is elongated, and if the L/W ratio is very small, it can be said that it is a compact (bulky) or highly spherical particle. Since it was stated in previous studies that the shape of ground mineral particles is best expressed by the Bounding Rectangular Aspect Ratio (BRAR) [24] with DIA (see Figure 3b), in this study, a new shape concept, called “the degree of sphericity” of particles, is used (Figure 3c) by taking the inverse of BRAR (see Equations (2) and (3)) to investigate the relationship between the dt and roundness values of graphite particles ground at various times in the VDM.
where BRL and BRW are bounding rectangle length and bounding rectangle width, respectively.
BRAR = (BRL/BRW)
1/BRAR = (BRW/BRL)
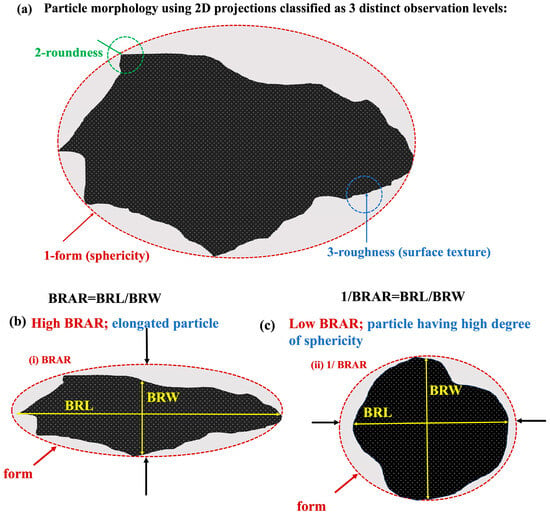
Figure 3.
Conceptual diagram of 2D particle morphology redrawn from [25,26,27,28]: (a) classified as 3 distinct observation levels; (b) elongated particle; (c) spherical particle.
3. Results
3.1. Effect of Particle Size on dt Values
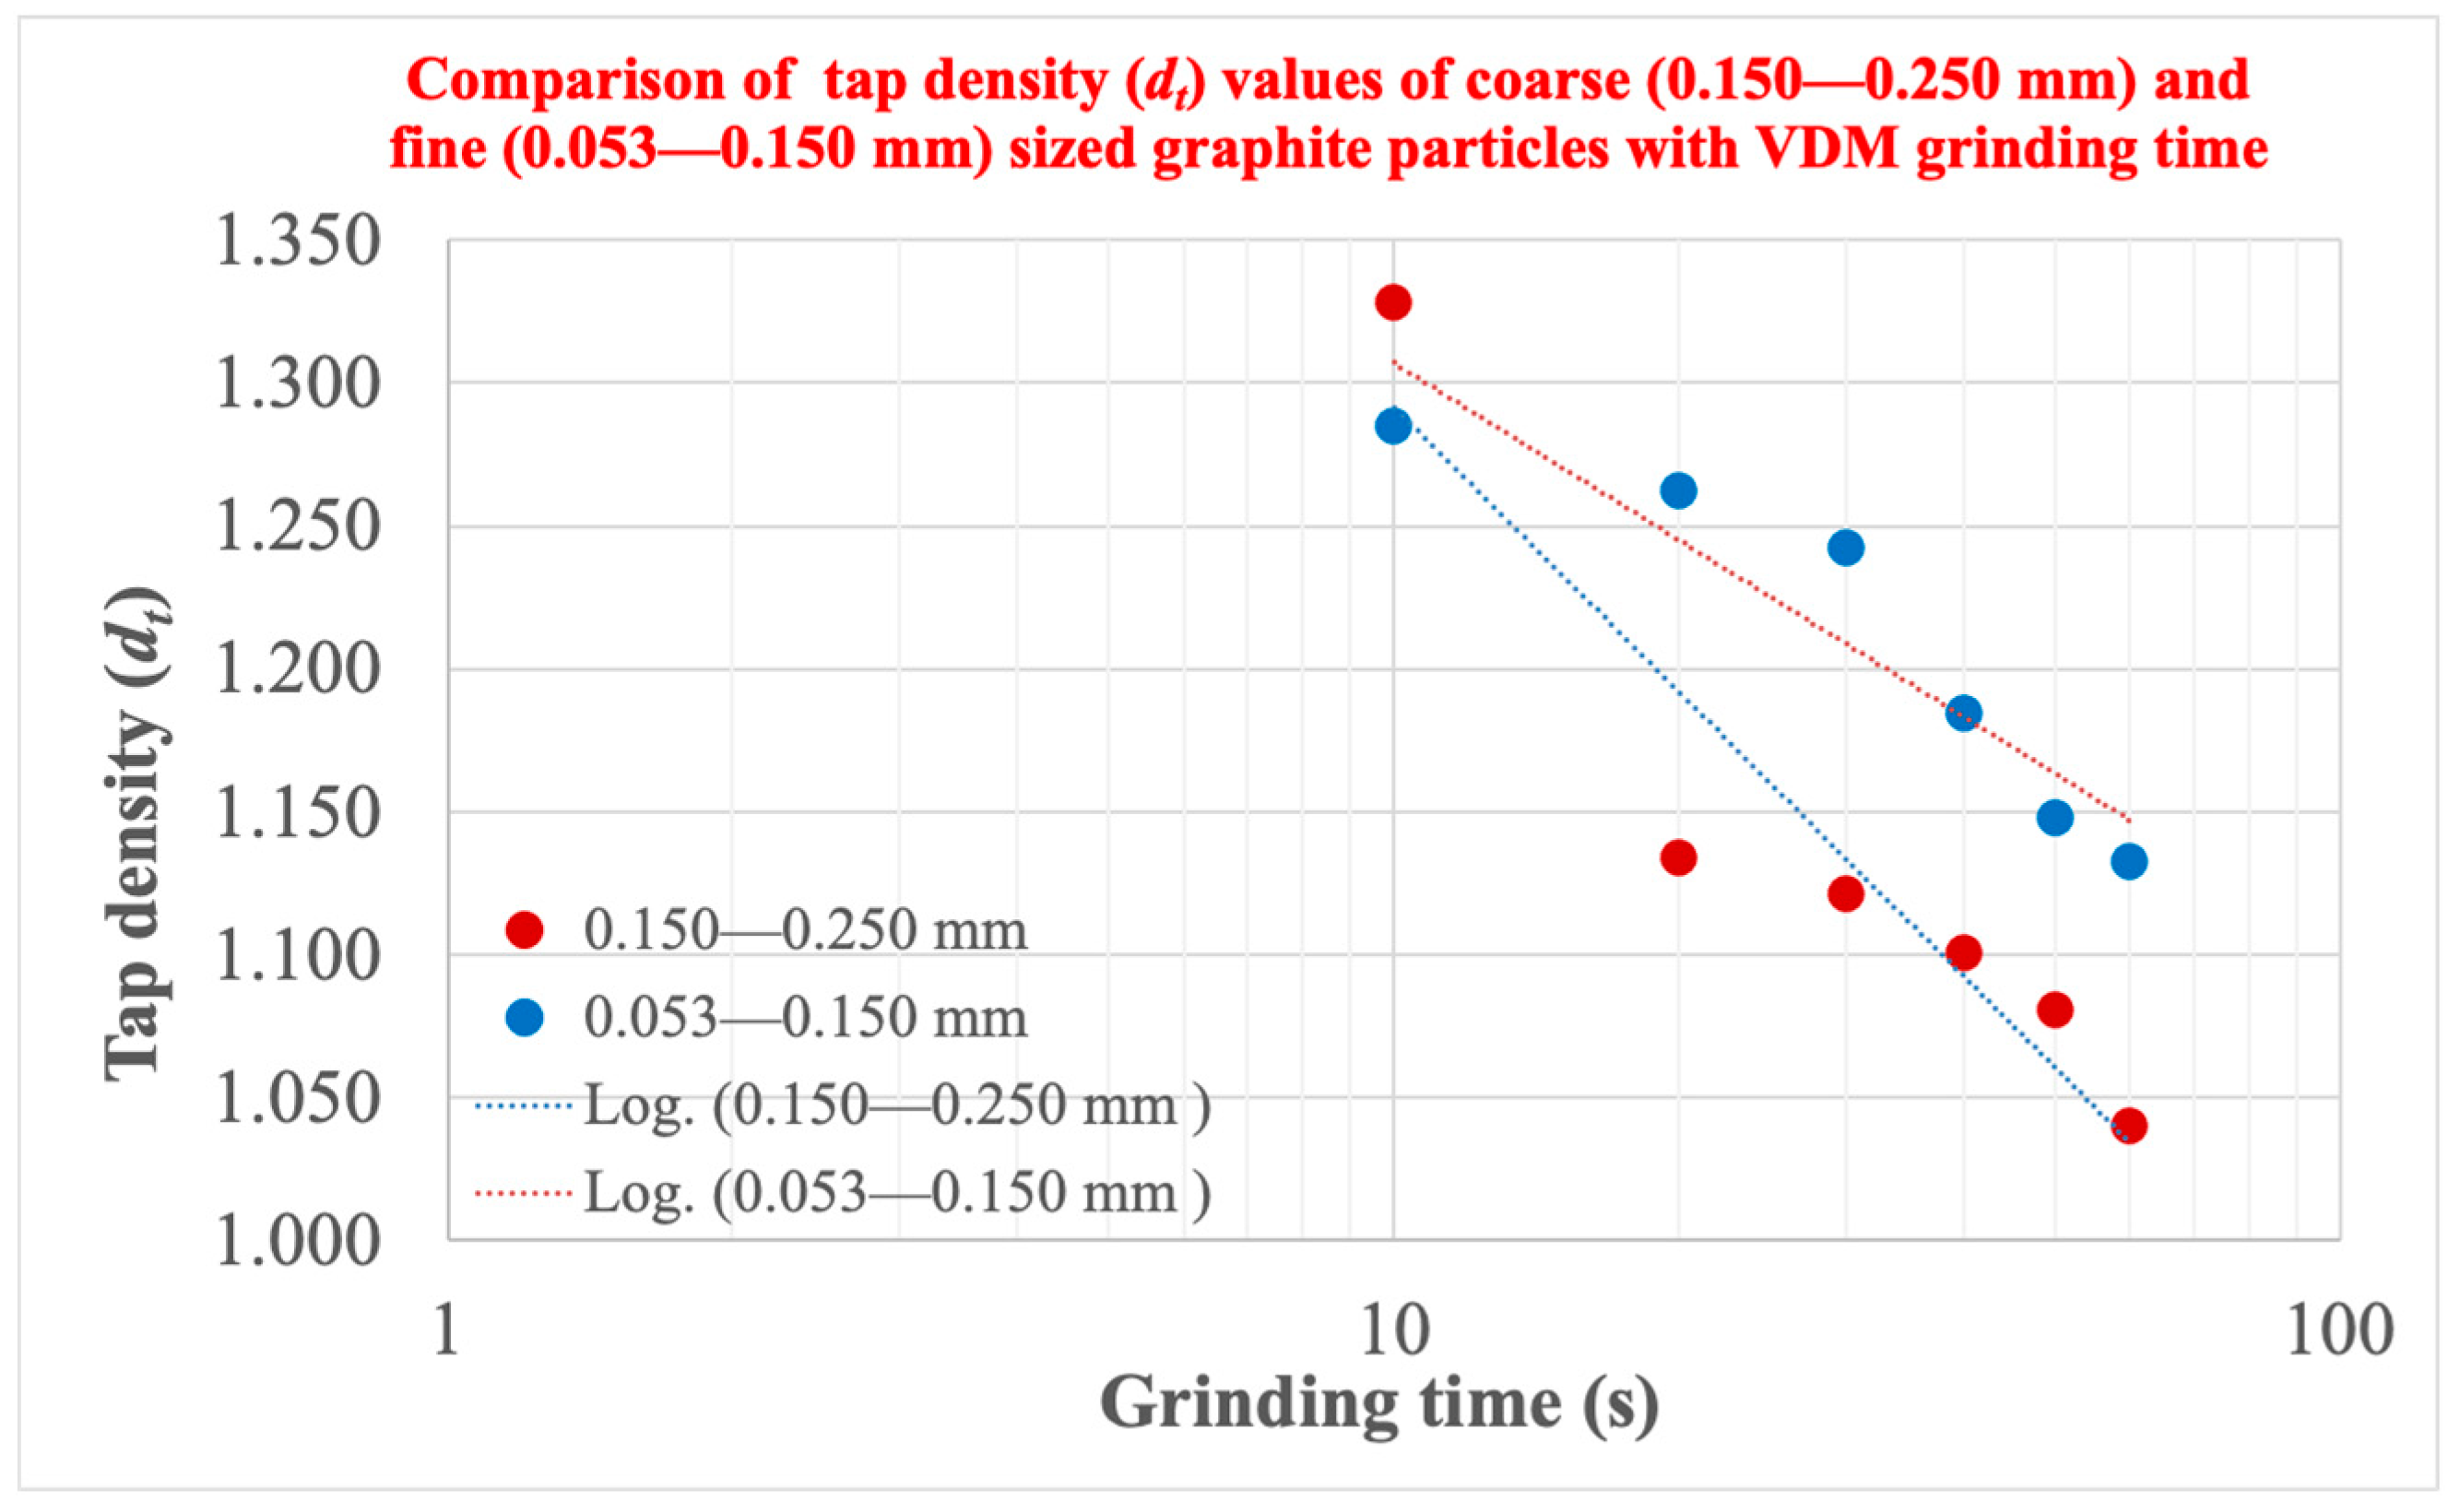
Since the tapped bulk density of natural graphite powder used as LIB anode material is generally known to be in the range of 1.0 to 1.2 g/cm3, the measured dt values are consistent with the literature. When the dt values of these size fractions were compared, it was observed that the dt values in the finer size fraction were generally higher than the dt values in the coarser size fraction, as shown in Figure 4, even though two fractions that were close to one another were prepared to examine the change in dt values of the VDM products depending on the grinding time in the same size range. This is well aligned with the previously reported study suggesting that the smaller the average particle size, the lower the dt [7,10].
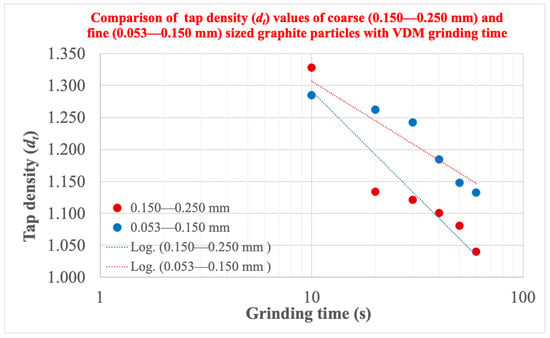
Figure 4.
Effect of particle size on changes in dt of graphite particles ground in the VDM, depending on grinding time.
3.2. Empirical Time-Dependent dt Models
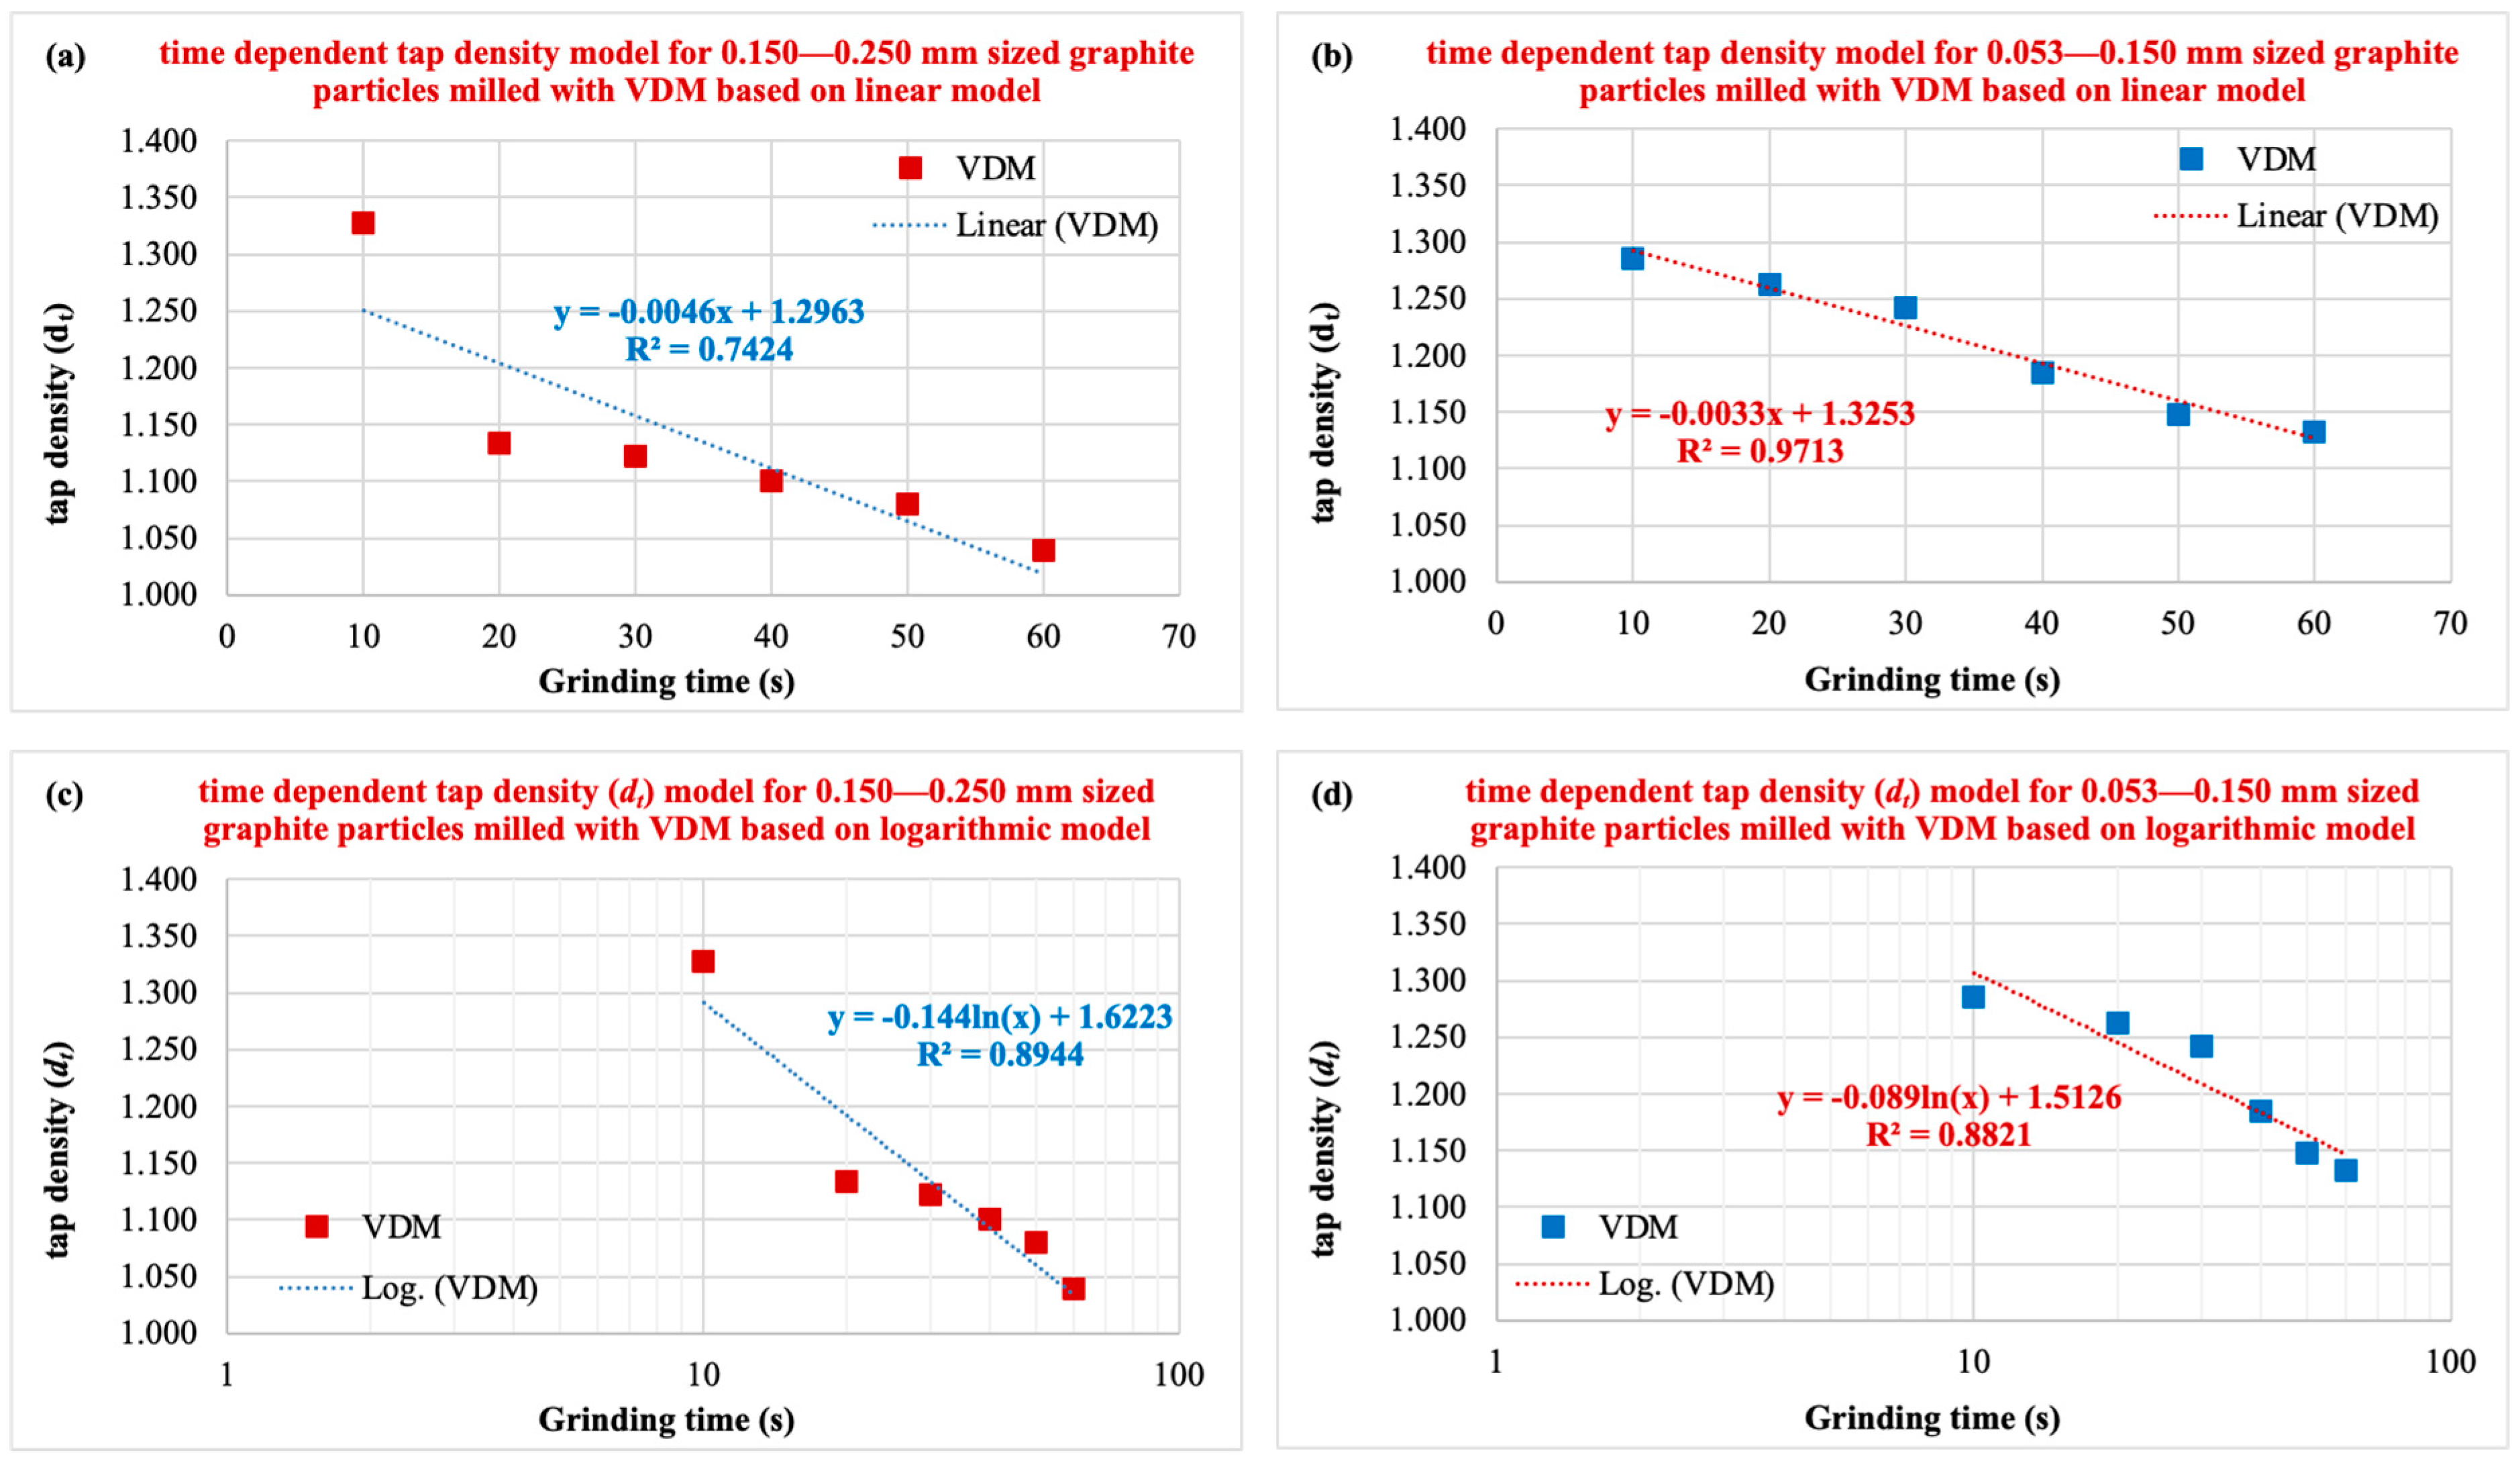
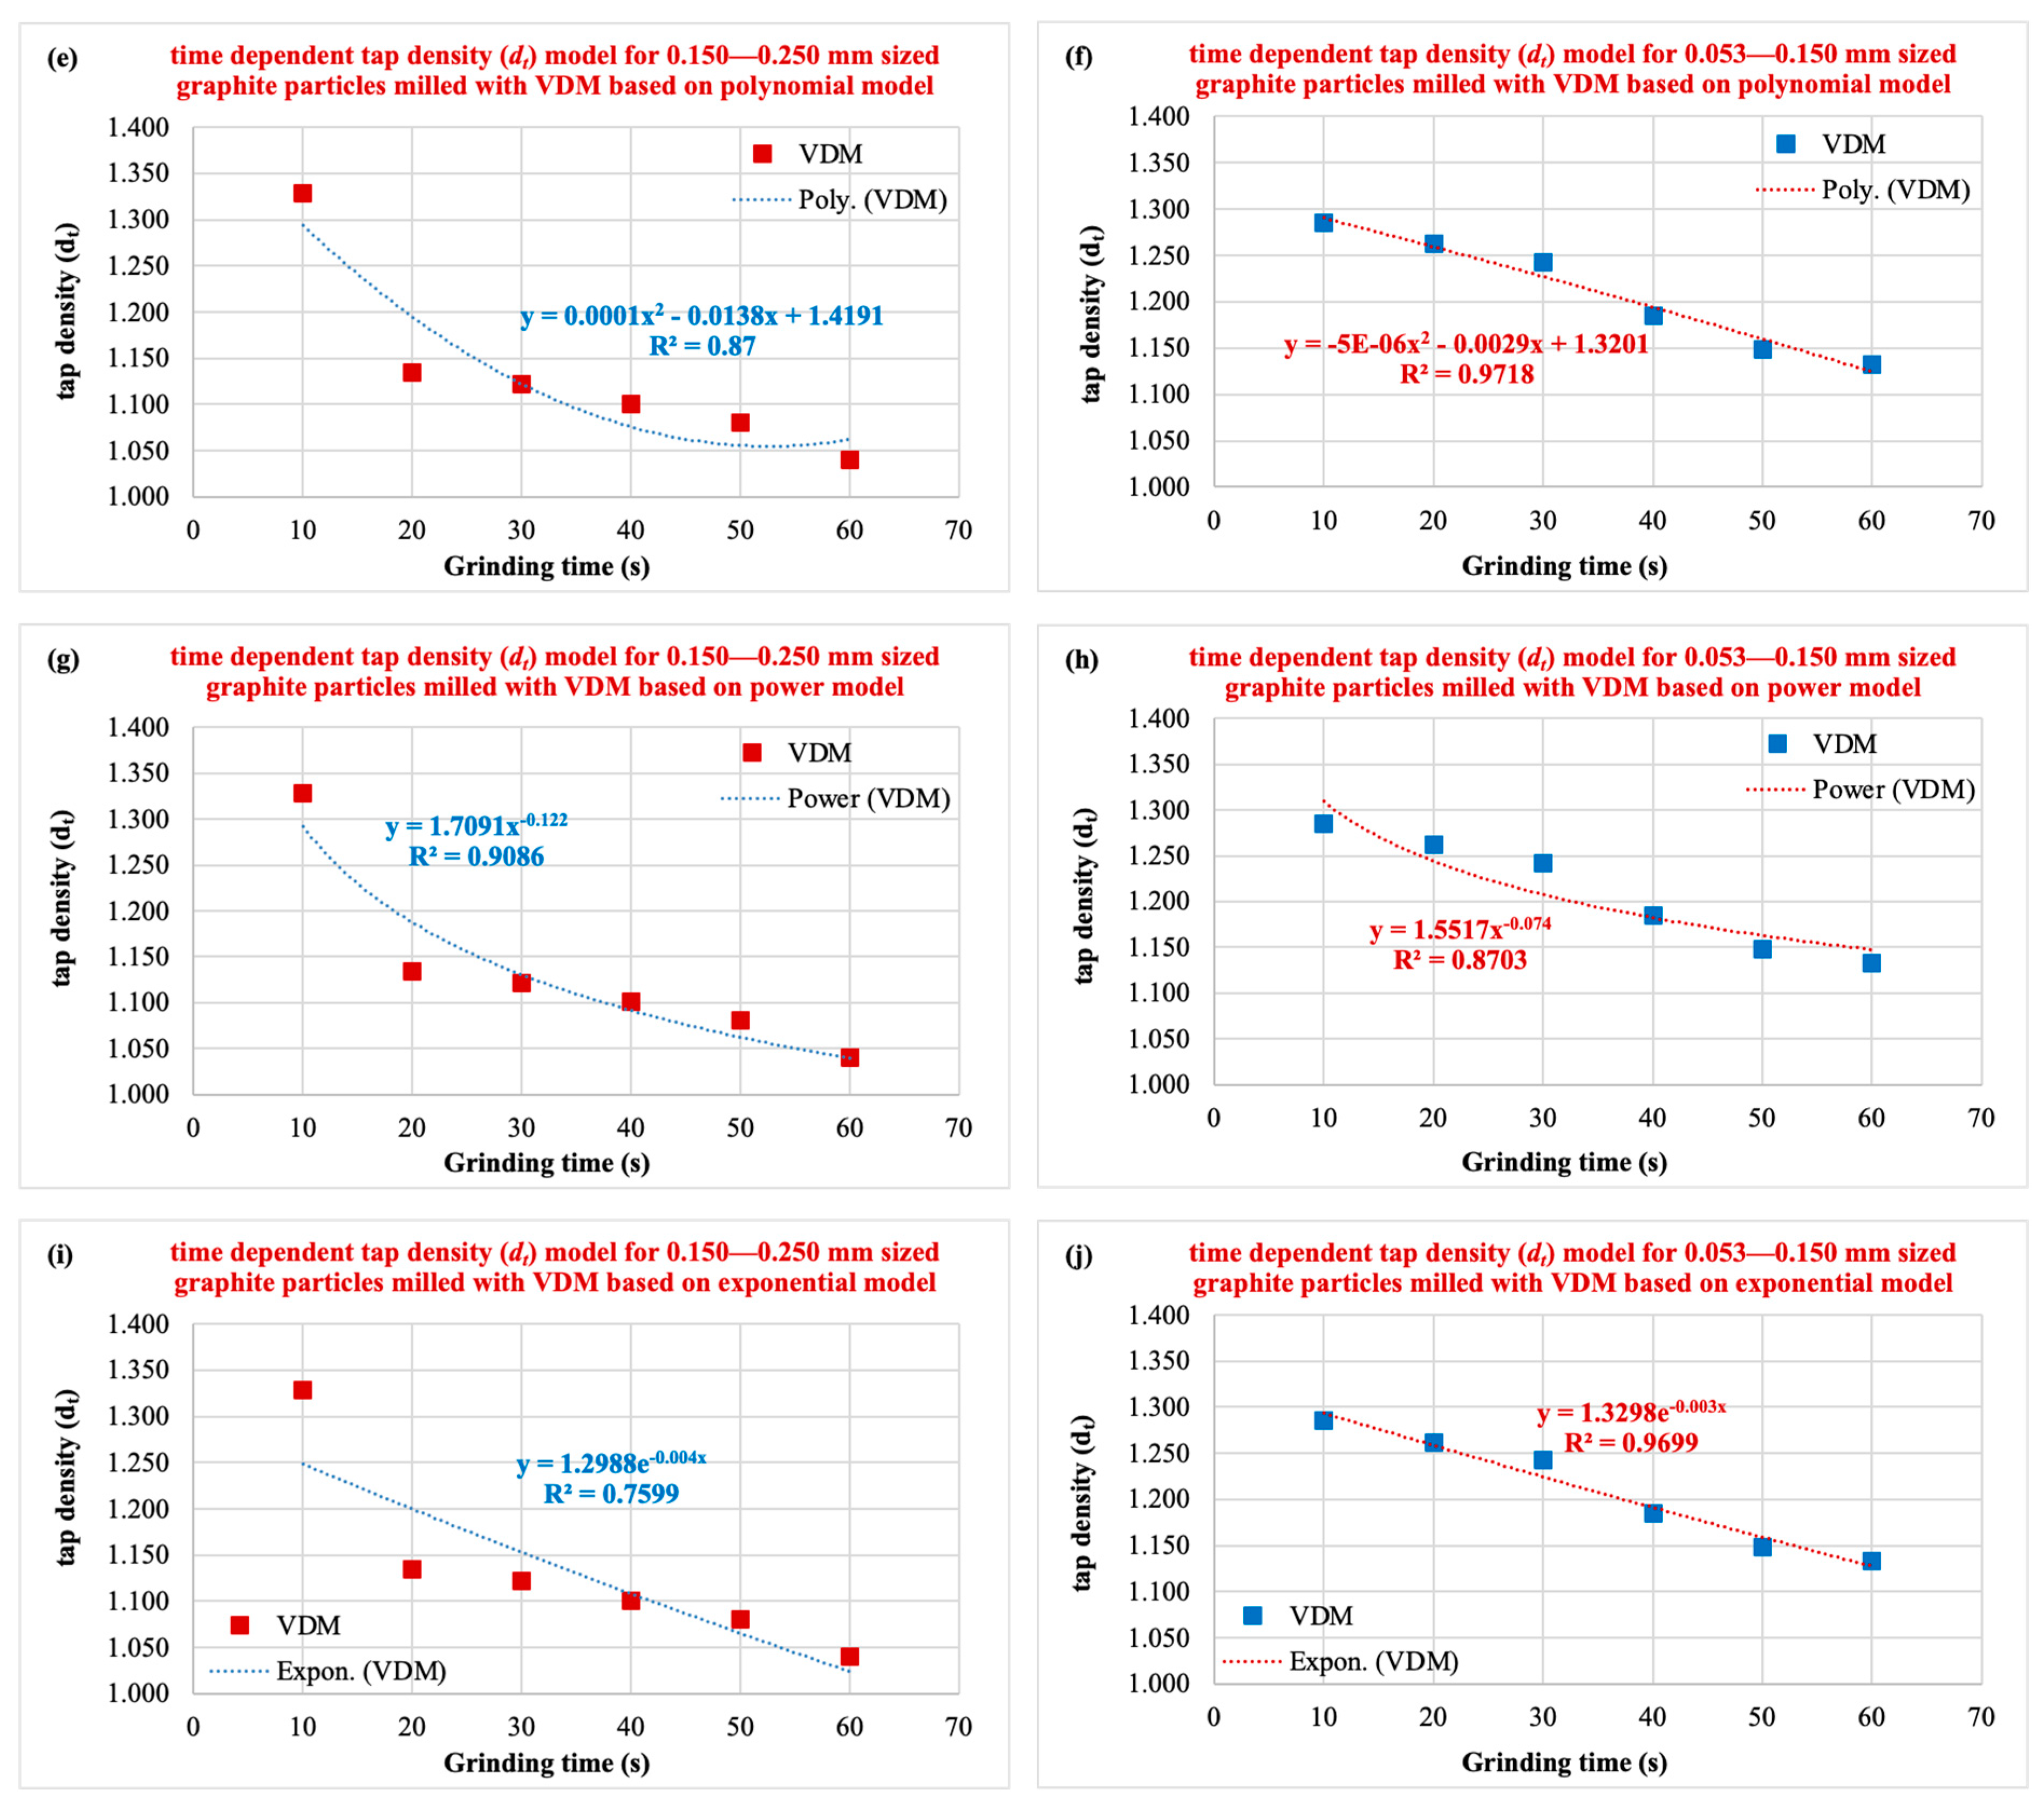
The degree to which a model generalizes to the data on which it is based is called the fitting technique. This allows for the precise prediction of approaching data points with an ideal fitting technique. Techniques that use linear, exponential, and polynomial functions to predict or explain the dependent variable based on the independent variable can capture patterns, relationships, and trends in the data, allowing for more accurate predictions and a deeper understanding of underlying connections [16]. In this section, correlations between the measured average dt values of graphite particles by a VDM and the milling time were established with various fitting models such as linear, logarithmic, second order polynomial, power, and exponential, and finally compared according to the highest R2 value, as given in Figure 5.
3.2.1. Linear Fitting Model
In the linear fitted model, the established empirical time-dependent dt models for the correlations between dt and grinding time for vibratory disc-milled graphite particles are in the form of “dt = −a.t + b” type equations (where a and b are constants), as shown in Figure 5a,b). In this model, it is seen that the R2 value of 0.7424 obtained for the coarser size fraction (Figure 5a) is smaller than the R2 value of 0.9713 obtained for the finer size fraction (Figure 5b).
3.2.2. Logarithmic Fitting Model
The established empirical time-dependent dt models for the correlations between dt and grinding time in the logarithmic fitted model take the form of equations of the “dt = −a.ln (t) + b” type, where a and b are constants. As seen in Figure 5c,d, the R2 value obtained for the coarser particle size fraction (0.8944) was found to be higher than the R2 value obtained for the finer particle size fraction (0.8821). In fact, the dt data measured for both size fractions were in close agreement with the milling time but not very strong.
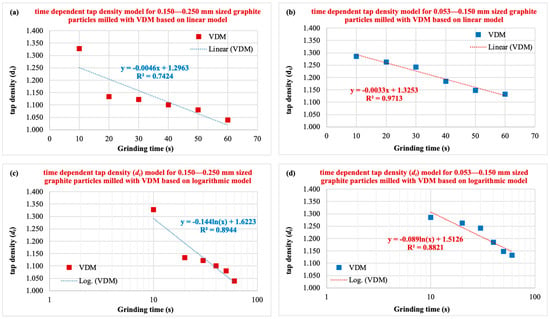
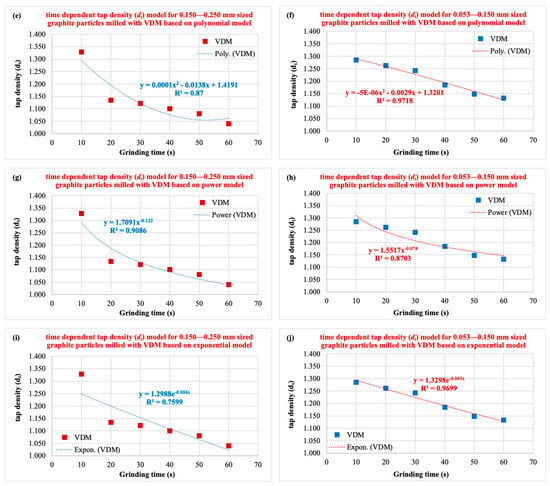
Figure 5.
Correlation of dt values of graphite particles ground in a VDM with grinding time according to various fitting models (for 0.150–0.250 mm and 0.053–0.150 mm size fractions). (a,b) linear; (c,d) logarithmic; (e,f) polynomial; (g,h) power; (i,j) exponential model.
Figure 5.
Correlation of dt values of graphite particles ground in a VDM with grinding time according to various fitting models (for 0.150–0.250 mm and 0.053–0.150 mm size fractions). (a,b) linear; (c,d) logarithmic; (e,f) polynomial; (g,h) power; (i,j) exponential model.
3.2.3. Polynomial Fitting Model
In the second-order polynomial fitted model, the established empirical time-dependent dt models for the correlations between dt and grinding times are in the form of “dt = at2 − bt + c” type equations (where a, b, and c are constants), as shown in Figure 5e,f. In this model, it is seen that the R2 value of 0.8700 obtained for the coarser size fraction (Figure 5e) is smaller than the R2 value of 0.9718 obtained for the finer size fraction (Figure 5f).
3.2.4. Power Fitting Model
In this model, the empirical time-dependent dt models established for the correlations between dt and grinding time for graphite by a VDM are in the form of equations of the type “dt = a.t(−b)” (where a and b are constants), as shown in Figure 5g,h. When comparing the R2 values of this model, it was found that the coarser size fraction giving a value of 0.9086 R2 (Figure 5g) was stronger than the finer size fraction giving a value of 0.8703 R2 (Figure 5h).
3.2.5. Exponential Fitting Model
In the last fitting model, namely the exponential model, the empirical time-dependent dt models are in the form of equations of the type “dt = a.e(-bt)” (where a and b are constants), as shown in Figure 5i,j. The correlation between dt and grinding times in the finer size fraction (0.9699 R2 in Figure 5j) is considerably stronger than in the coarser fraction (0.7599 R2 in Figure 5i).
3.2.6. Discussion
The summary of the established equations along with R2 values is given in Table 1. It was concluded that, while the power model (with a 0.9086 R2) describes the dt data for the coarser size fractions better than the alternative fitting models (linear, logarithmic, second-order polynomial, and exponential), the dt data for the finer size fractions were well represented by the linear, second-order polynomial, and exponential models, considering the highest R2 value. Particularly, very high R2 values, such as 0.97, were obtained by the linear, second-order polynomial, and exponential models for this size fraction. Considering both coarse and fine-size fractions, the best fit is the second-order polynomial model.

Table 1.
Summary of the results of the established empirical time-dependent dt models.
3.3. Validation of the Fitting Models Established: Predicted Versus Experimental dt Values
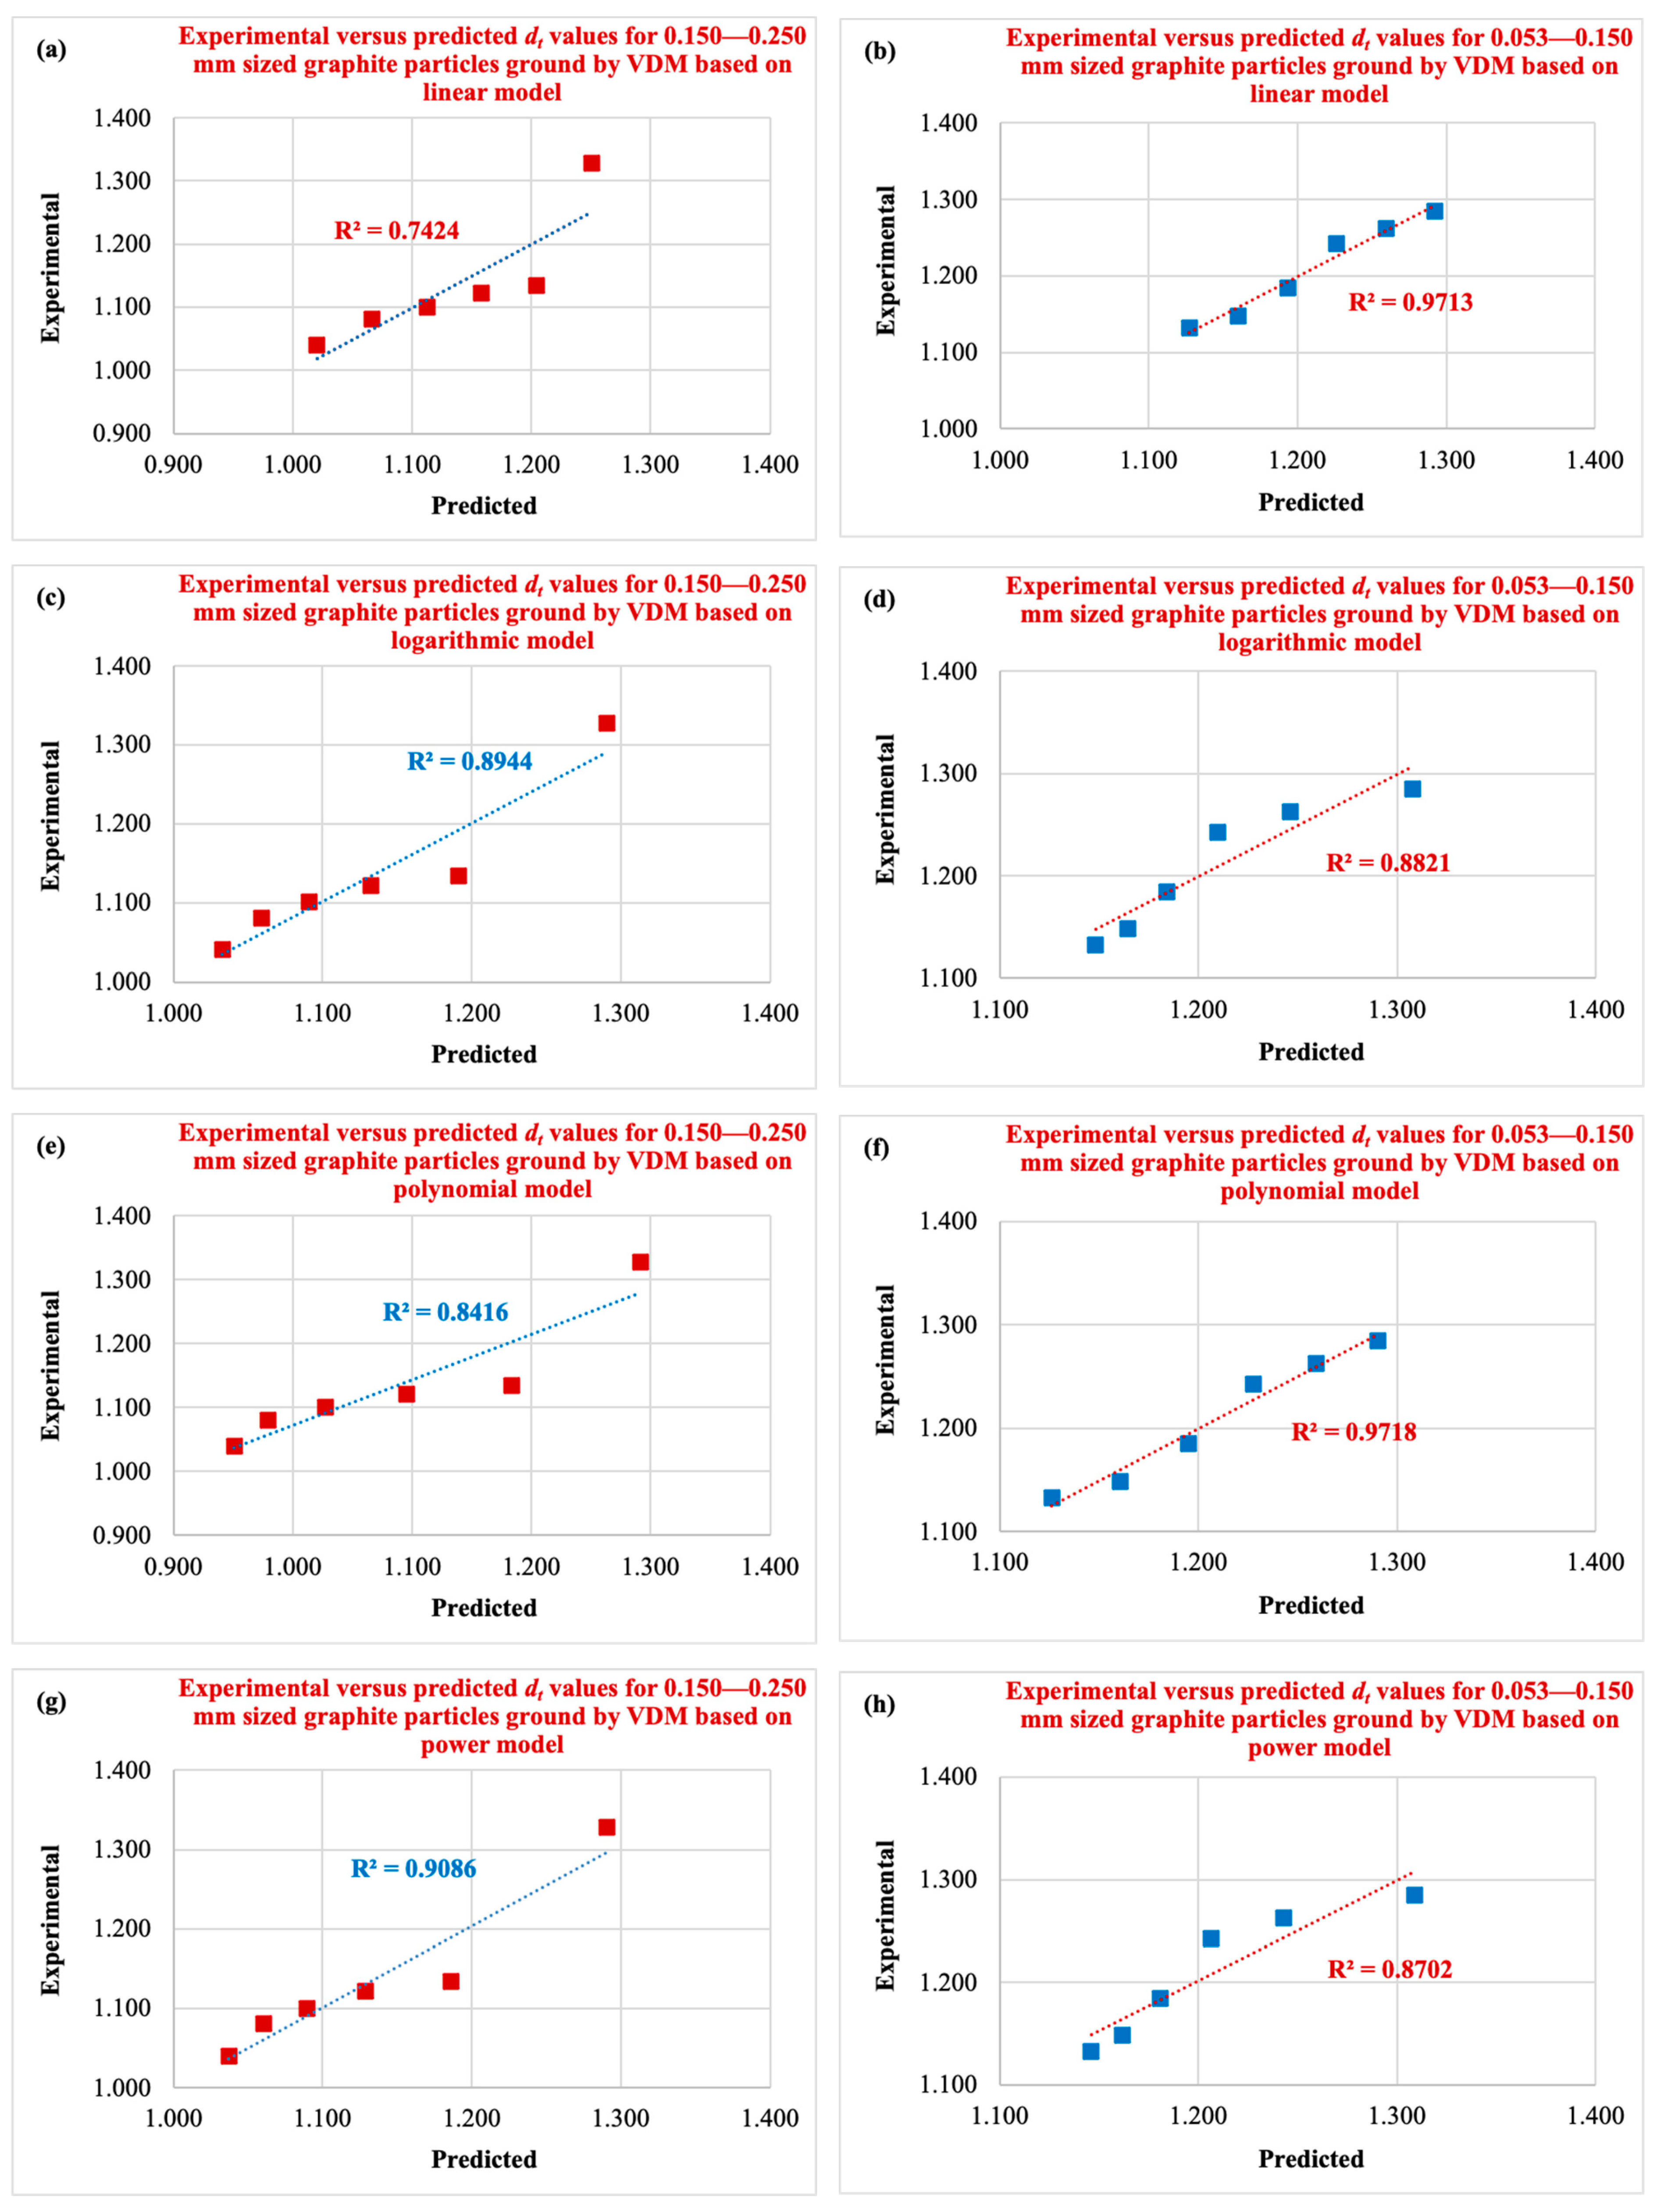
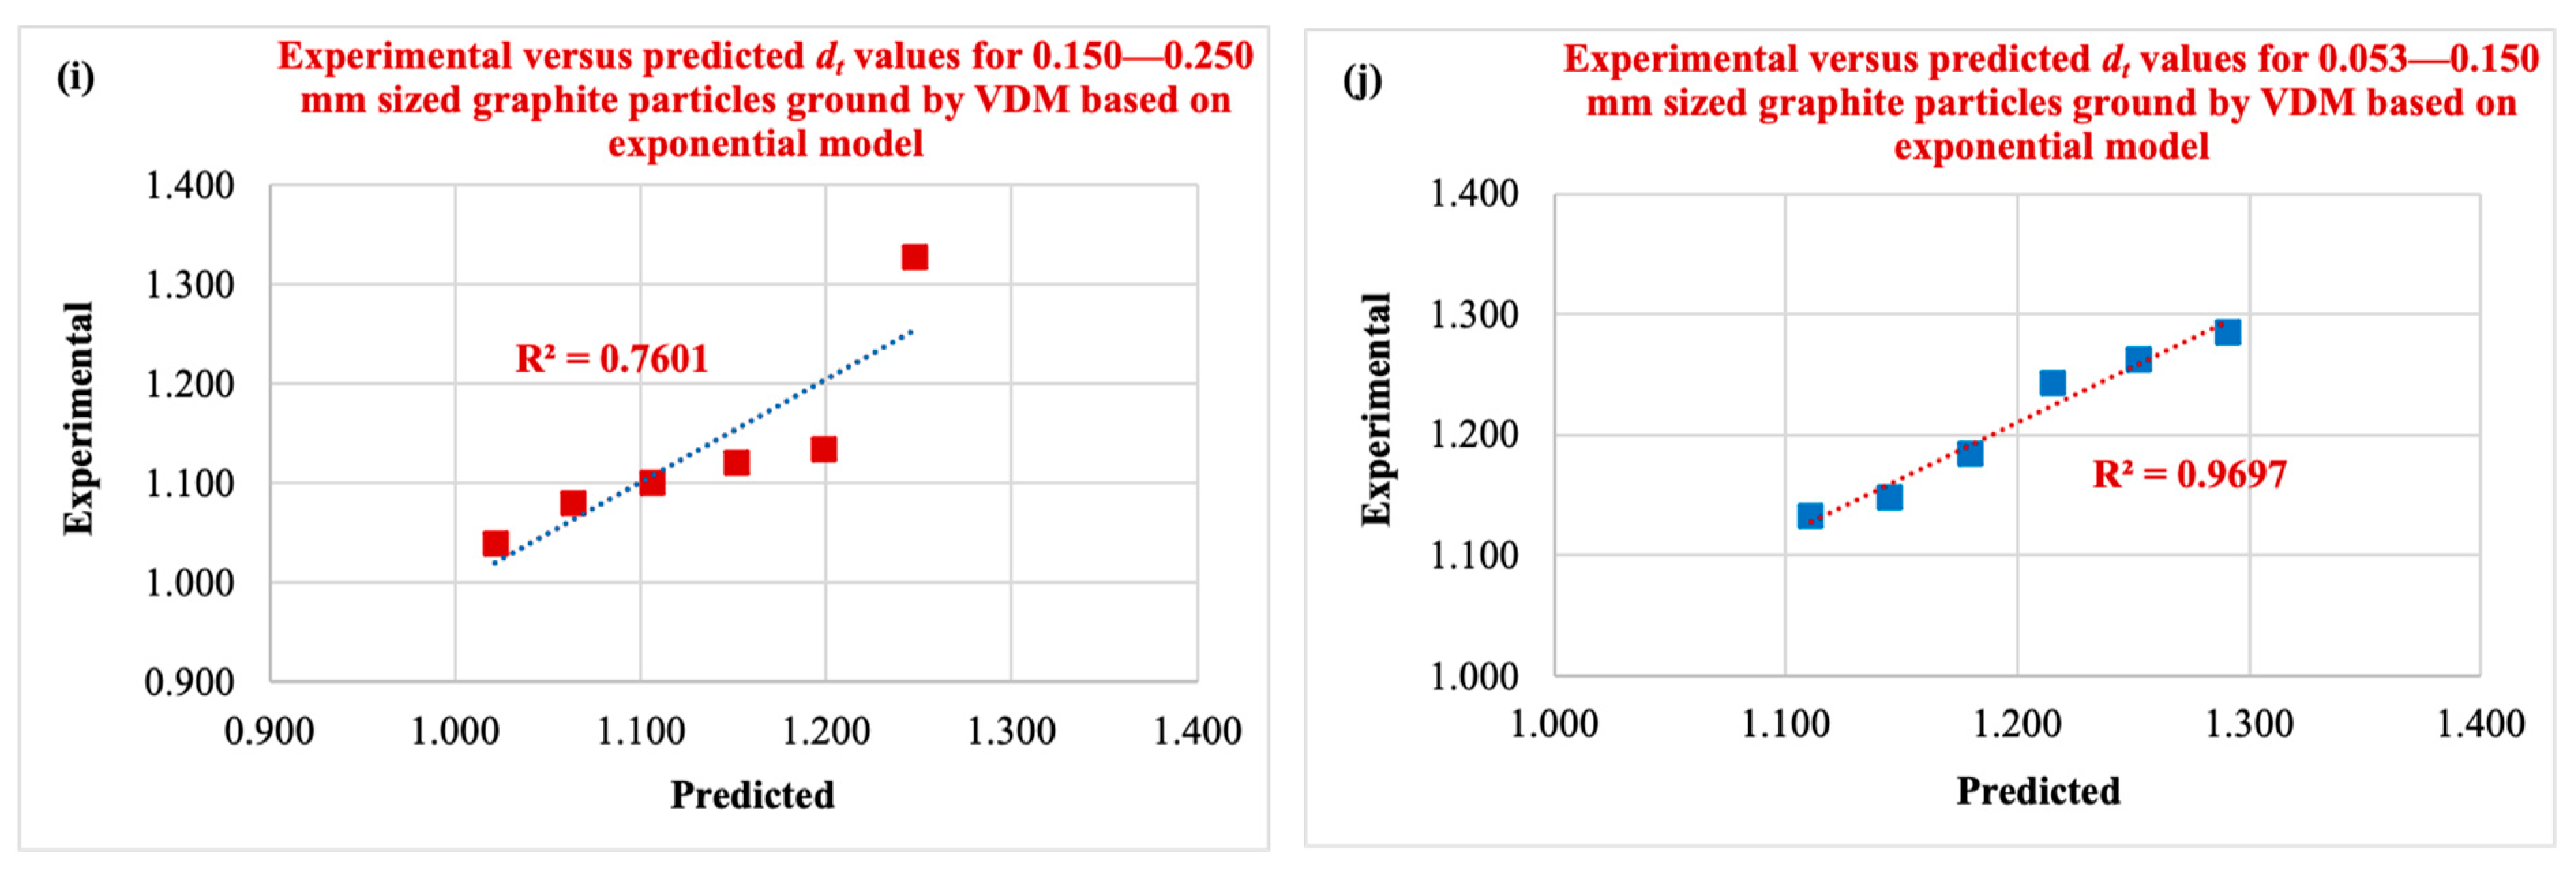
To reveal the strength of the relationship shown by the established empirical models in Figure 5, average dt values were predicted based on the experimental grinding times. While the relationships between predicted and experimental dt data for both size fractions of ground graphite particles by a VDM based on various fitting models were given in Figure 6, the experimental and predicted values of dt depending on various grinding times with absolute % errors and relative % errors were summarized in Table 2.
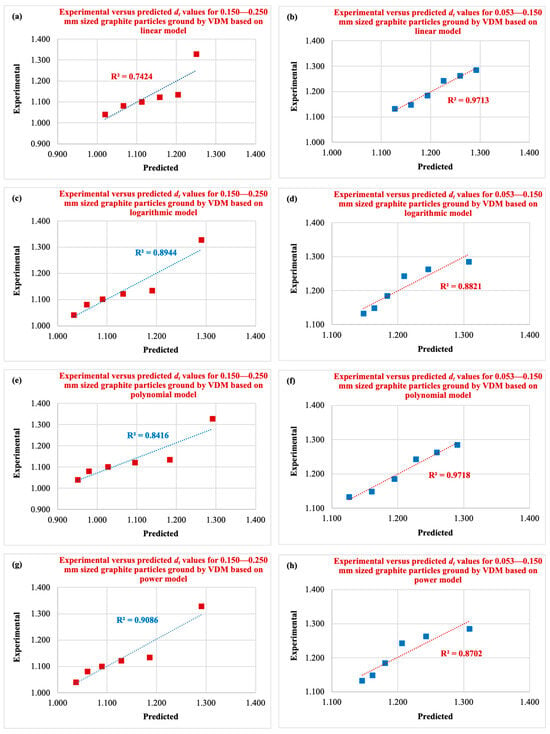
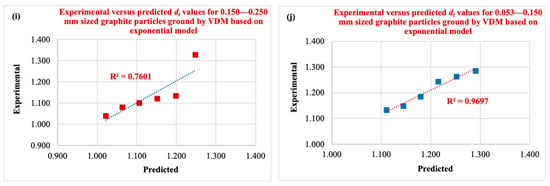
Figure 6.
Correlation of predicted versus experimental dt values of graphite particles ground in a VDM according to various fitting models (for 0.150–0.250 mm and 0.053–0.150 mm size fractions), (a,b) linear; (c,d) logarithmic; (e,f) polynomial; (g,h) power; (i,j) exponential model.

Table 2.
The error values, calculated for the dt prediction models.
It was concluded that, while the second-order power model describes the dt data for the coarser size fractions better than the alternative fitting model (linear, logarithmic, second-order polynomial, and exponential), the dt data for the finer size fractions were well represented by the linear, second-order polynomial, and exponential models, considering the highest R2 value with the lowest error values.
Considering the highest R2 values and the lowest error values together, the exponential fitting model was the best model for modeling dt values according to grinding time.
It should be noted that the derived best-fit relations (e.g., dt and time) and fitting functions depend on the initial graphite feed size or grinding parameters.
3.4. Correlation of dt and Particle Shape
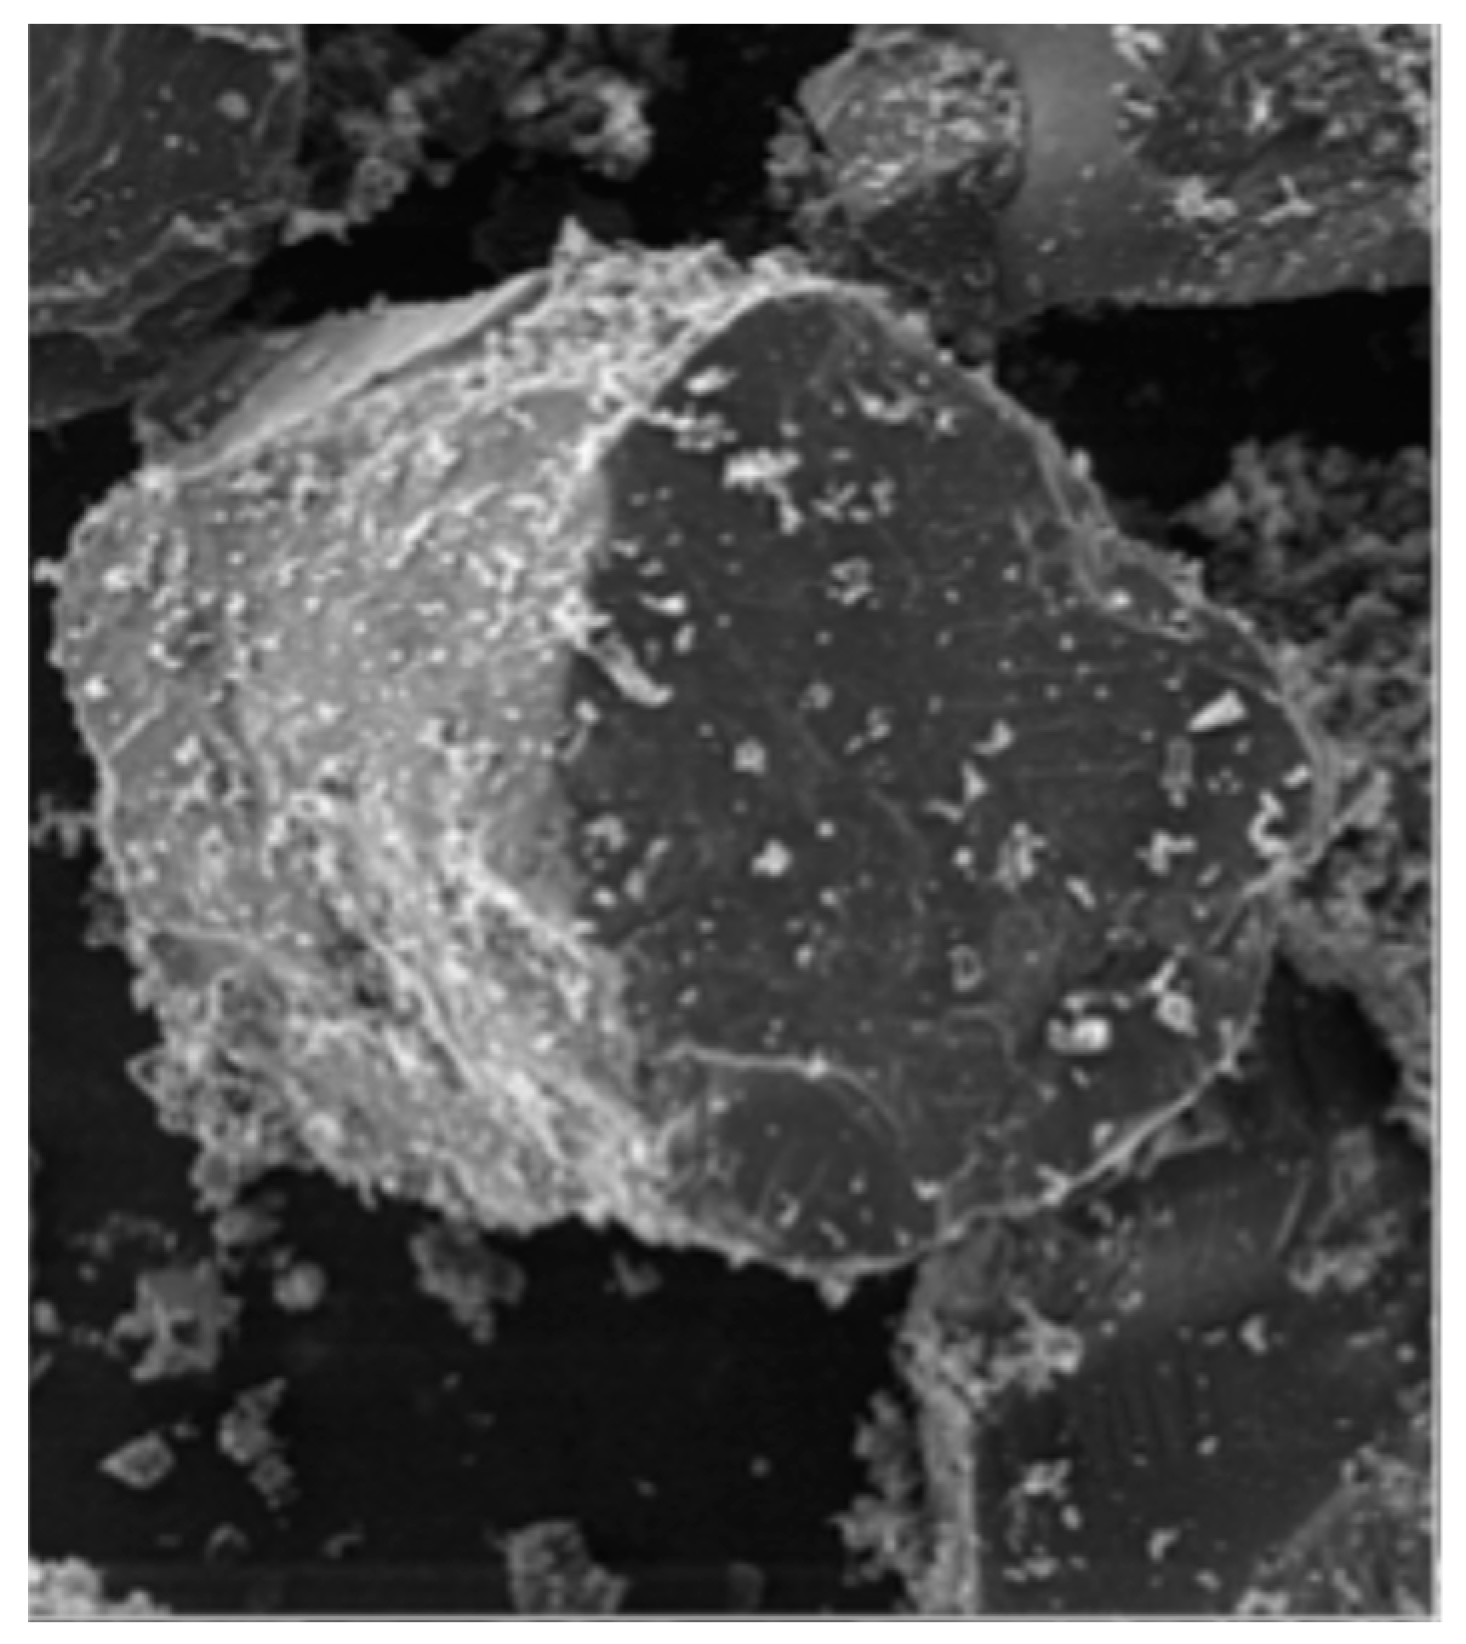
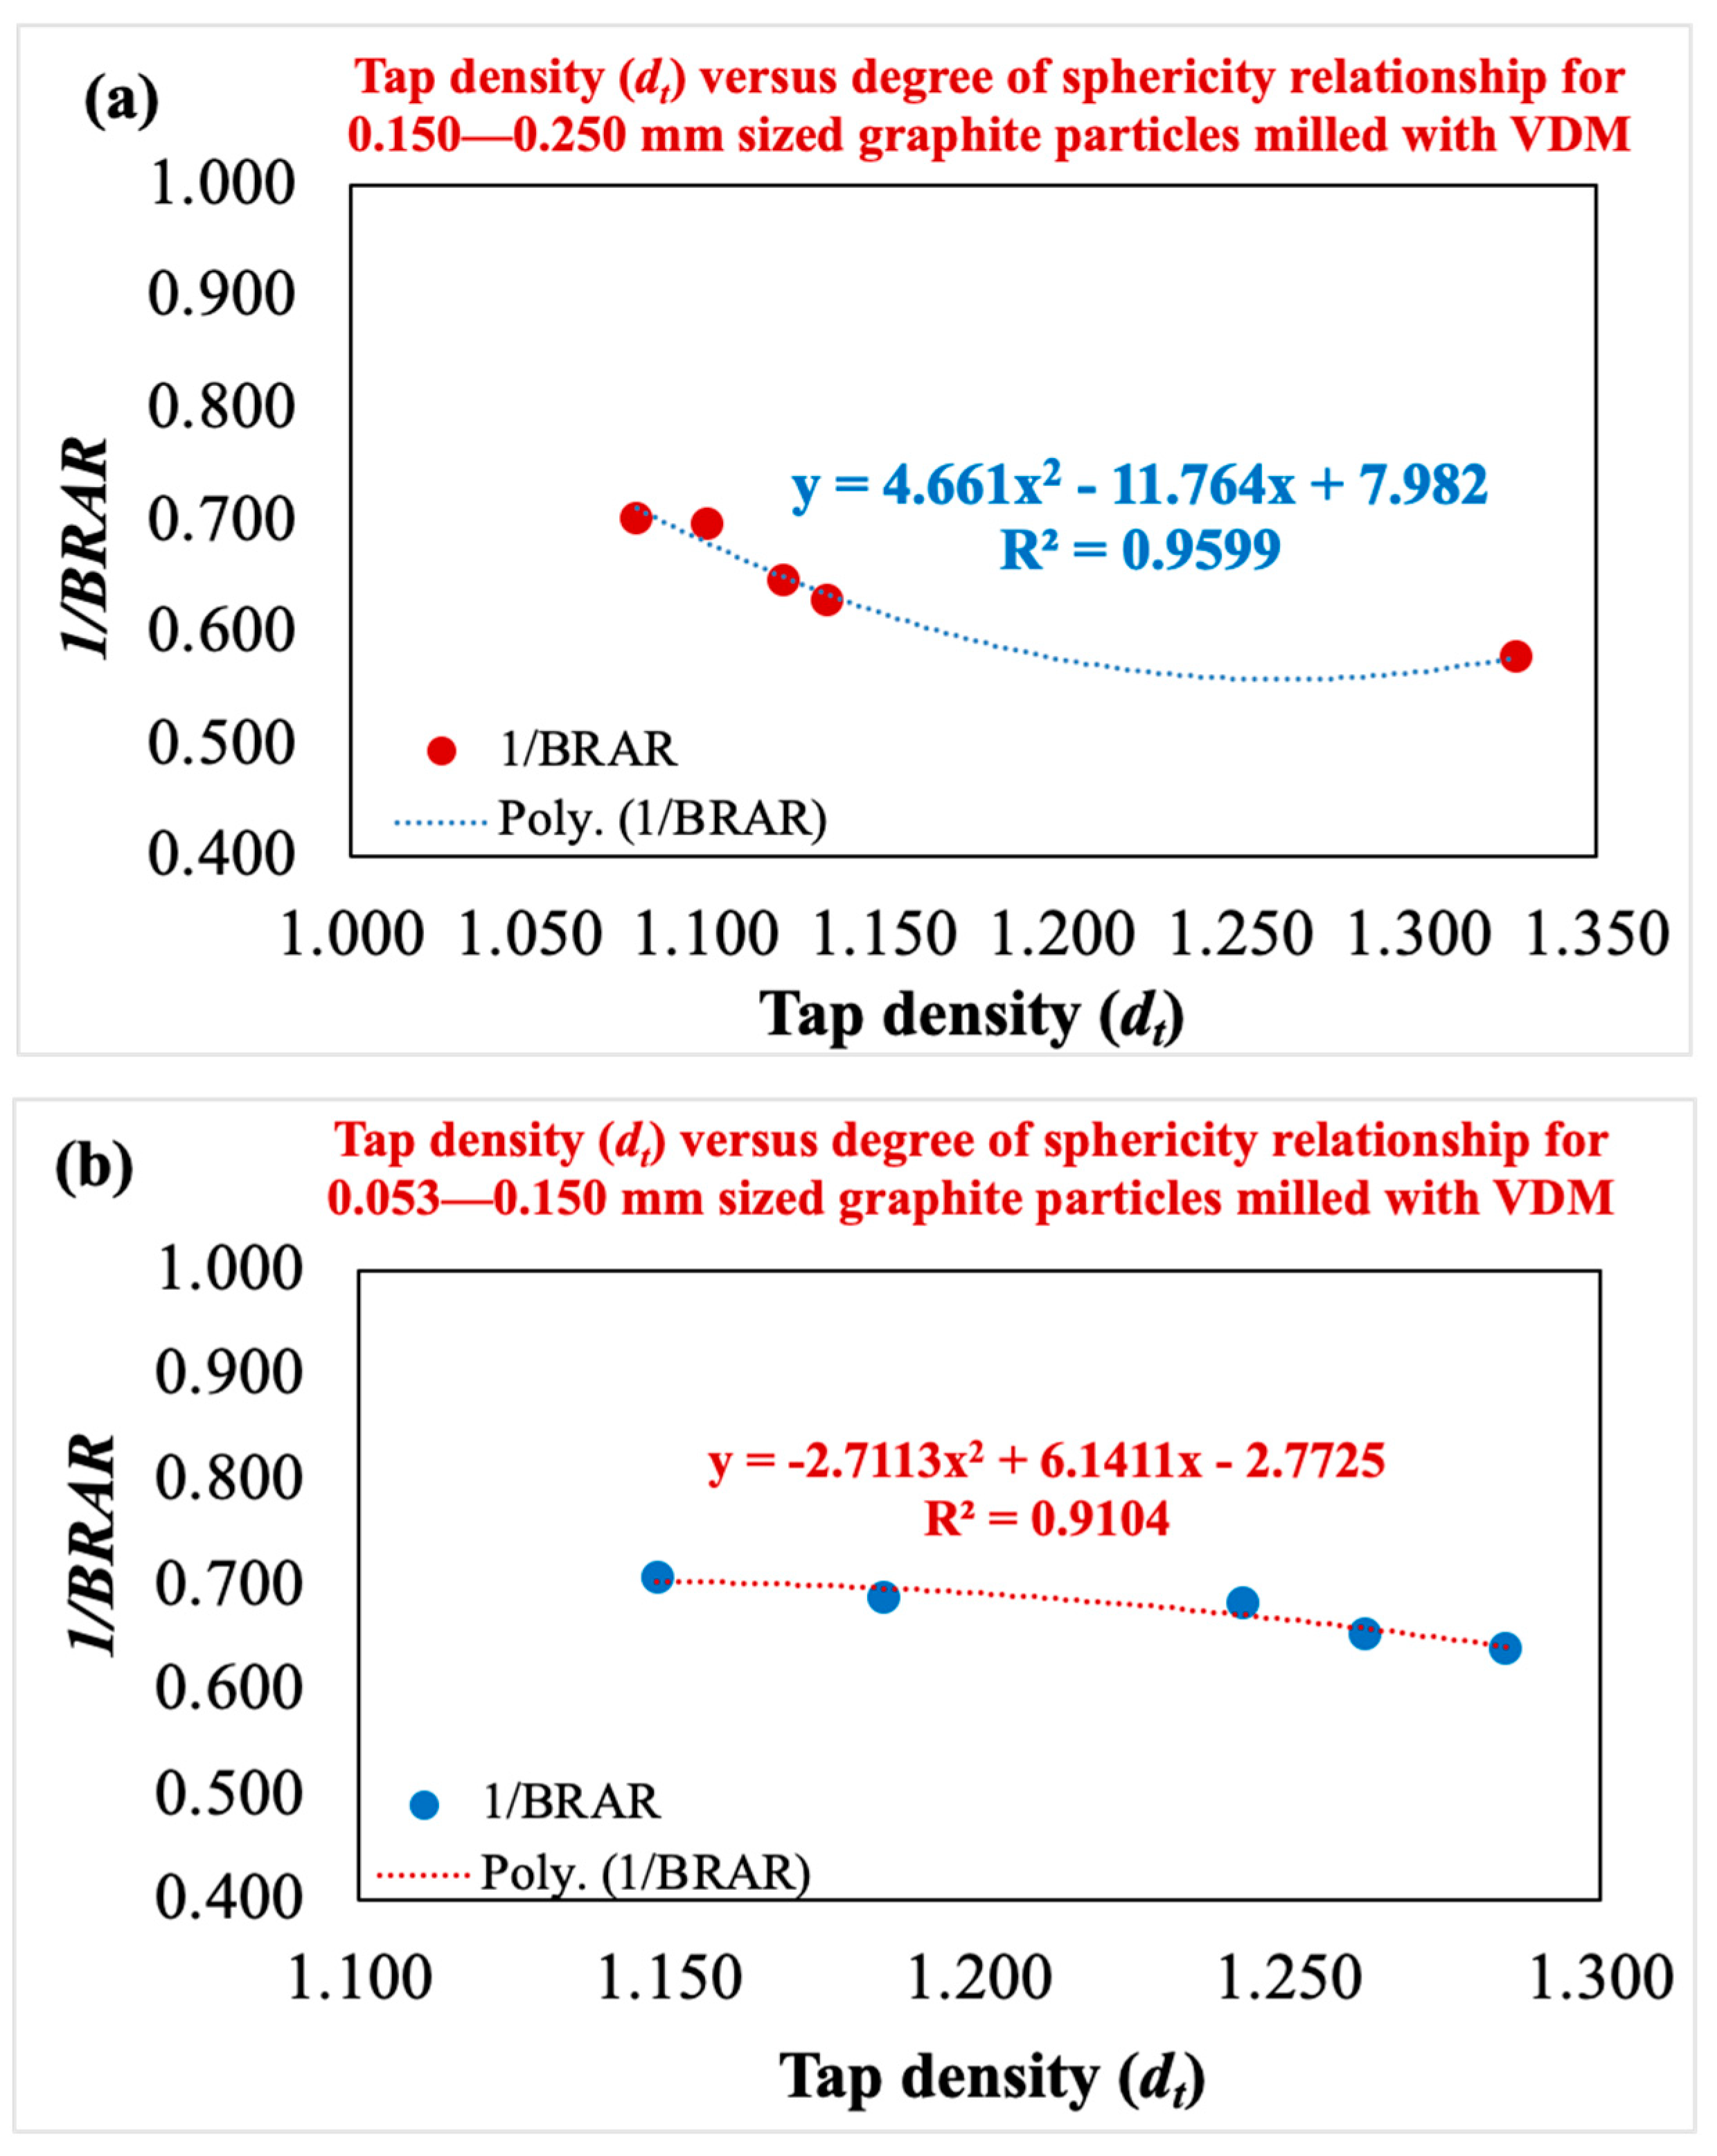
It is known that more suitable anode materials for lithium batteries can be obtained by grinding natural graphite ore in a suitable mill [29]. Thus, in our recent research using the same graphite samples to investigate the change in particle shape with grinding times [16], it has been reported that VDM particles (see Figure 7) have more spherical shapes than ball mill particles for both size fractions, and this is due to the greater abrasion force in VDM grinding compared to lab-scale ball mill grinding, which has a dominant impact force. Starting from this point, the relationship between the degree of sphericity and dt of the particles produced with the same ore only in a VDM was investigated, and correlations were established between the dt values and the degree of sphericity values of graphite samples prepared in both size fractions ground by a VDM. It was found that the degree of sphericity of the particles was negatively correlated with dt (see Figure 8). Although it is generally known that there is a positive relationship, there are also conflicting results in the literature [10]. For instance, Li et al. [30] have shown that cylinders (a proxy for elongated particles) can achieve higher ordered packing densities, supporting the hypothesis that alignment during tapping enhances density. In addition, Wang et al. [31] showed that geometrically asymmetric particles composed of poly-superquadric elements have a higher packing density than symmetric particles composed of superquadric elements. In addition, Wouterse et al. [32] presented that the packing density reached its maximum when the particle’s aspect ratio was about 1.25. Similarly, Li et al. [33] reported that ellipsoids of certain shapes are more densely packed than spheres. Furthermore, using morphology to estimate bulk density may have low precision due to agglomerated powders, as stated by Pisecky et al. [34] and Ding et al. [35]. Another reason is thought to be the ability of long particles to fit into voids or to interlock to reduce void space. Considering that tapping or vibration applies mechanical energy to the particle system, causing the particles to move and rearrange, the increasingly parallel alignment of the particles that tend to rotate and slide can reduce the gaps between the particles; they can lie closer to each other, and this aligned arrangement can lead to a more compact structure by minimizing the empty space and thus a higher dt. Furthermore, this situation is attributed to the impurity behaviors in graphite. In other words, using a sample as close to pure as possible from the ore exiting the mine in the experiments was only possible with 72% pure graphite. It is thought that the size, shape, and roughness values of other gangue minerals found with graphite also affect its tap density behavior.
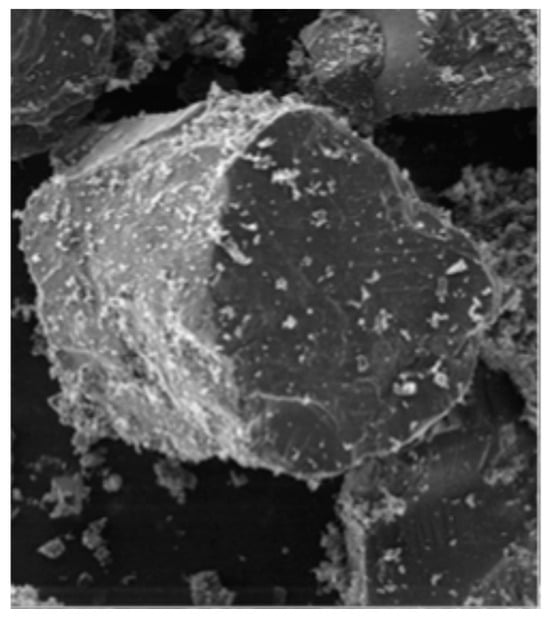
Figure 7.
10 s ground graphite particle in a VDM (SEM mag: ×500).
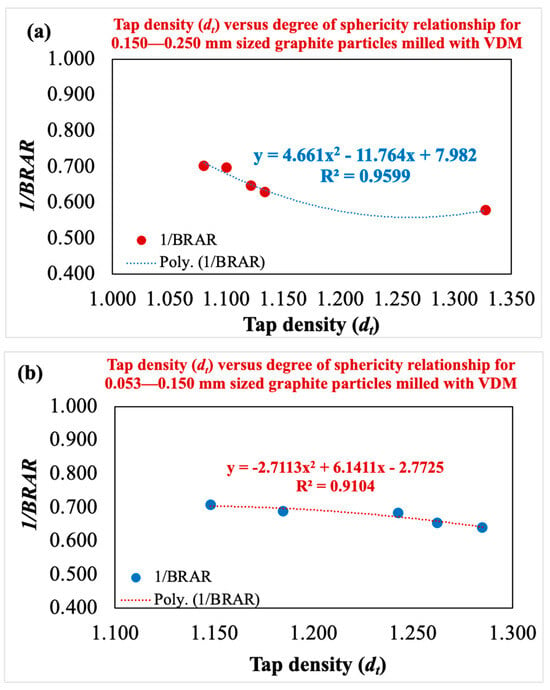
Figure 8.
Correlation of dt and degree of sphericity (1/BRARav.), which is based on the BRARav. data of graphite particles by VDM with grinding time [16] (a) 0.150–0.250 mm and (b) 0.053–0.150 mm.
4. Conclusions
Since the dt of natural graphite particles used as anode material in LIBs can generally be increased by optimized grinding to maximize the high energy density, the average dt values of graphite particles ground by a VDM at various grinding times for both size fractions were correlated with the changes in grinding time based on various fitting models.
The best-established correlations are in the form of “dt = ae−bt” type along with the exponential fitting model along with the highest R2 and the lowest error values.
Considering the high R2 values obtained, the average dt values predicted by the established time-dependent mathematical models are in very good agreement with the experimental values.
Since the grinding process is both energy-intensive and cost-intensive, the findings will benefit the graphite industry, which requires appropriate dt control, powder flow and processing, and packaging of ground natural graphite mineral materials, especially the production of graphite LIB anode material with high dt.
5. Future Recommendation
As of now, the grinding of graphite particles in LIB applications has not been optimized; this study will provide a first baseline for the performance that can be expected from different mills as well as other LIB electrode materials. In addition, future studies along these lines could examine the factors that make the exponential model the best fit, aiming to identify the physical characteristics of the material and the process parameters that the fitting constants are serving as proxies for. Moreover, an additional energy efficiency analysis is suggested as a future study, as it would significantly increase the practical value of the research.
Author Contributions
Conceptualization, U.U.; methodology, G.G., B.M., and G.B.; validation, U.U.; investigation, G.G., B.M., and G.B.; resources, F.B.; data curation, U.U.; writing—original draft, U.U.; writing—review and editing, U.U.; visualization, U.U.; supervision, U.U. and F.B. All authors have read and agreed to the published version of the manuscript.
Funding
This research received no external funding.
Data Availability Statement
Dataset available on request from the authors.
Acknowledgments
First, we are grateful to Karabacak Mining Inc. for supplying the graphite samples that were utilized in this investigation. Second, we are grateful to Emrecan Söylemez of the Faculty of Mechanical Engineering at Istanbul Technical University for permitting us to utilize the tap density instrument at their department. Thirdly, the laboratory facilities offered by Istanbul Technical University’s Mineral Processing Engineering Department and Sivas Cumhuriyet University’s Mining Engineering Department are also valued. Fourth, we are grateful to Halil İbrahim Çetintas from the Advanced Technology Application and Research Center and İlhan Danacı from the Department of Aeronautical Engineering at Sivas Science and Technology University for their XRD and SEM studies of the samples. Lastly, the authors would like to express their gratitude to Ezgi Onur Şahin of the Max-Planck-Institut für Kohlenforschung in Germany for her invaluable assistance in interpreting the graphite sample’s mineralogical composition based on the XRD results.
Conflicts of Interest
The authors declare no conflicts of interest.
Abbreviations
| 1/BRAR | Inverse of bounding rectangular aspect ratio; degree of particle sphericity |
| BRARav. | Average value of bounding rectangular aspect ratio |
| BRL | Bounding rectangle length |
| BRW | Bounding rectangle width |
| DIA | Dynamic Image Analysis |
| dt | Tap density |
| EDS | X-ray spectroscopy |
| HEVs | Hybrid electric vehicles |
| LIB | Lithium-ion battery |
| m | Mass of the powder (gr) |
| R2 | Coefficient of determination |
| SEM | Scanning Electron Microscopy |
| V | Volume of the powder (g/cm3) |
| VDM | Vibrating Disc Mill |
| XRD | X-Ray Diffraction |
References
- Future Battery Industries CRC. Natural Graphite Purification Report. AusIndustry Cooperation Research Centres Program. September 2022. Available online: https://fbicrc.com.au/wp-content/uploads/2023/11/FBICRC_Graphite-Purification-Report-VFINAL-Sept22.pdf (accessed on 27 February 2003).
- Schalkwijk, W.A.; Scrosati, B. Advances in Lithium-Ion Batteries; Kluwer Academic: New York, NY, USA, 2002. [Google Scholar]
- Qi, Y.; Guo, H.; Hector, L.G., Jr.; Timmons, A. Threefold Increase in the Young’s Modulus of Graphite Negative Electrode during Lithium Intercalation. J. Electrochem. Soc. 2010, 157, A558–A566. [Google Scholar] [CrossRef]
- Liu, P. Improving the Tapped Density of the Cathode Material to Make a Lithium-Ion Battery Hold More Energy; Application Notes; Application Research Lab, Bettersize Instruments Ltd.: Liaoning, China, 2021; Available online: https://www.bettersizeinstruments.com/learn/knowledge-center/improving-the-tapped-density-of-the-cathode-material-to-make-a-lithium-ion-battery-hold-more-energy/ (accessed on 27 February 2003).
- Lee, G.-H.; Yi, H.; Kim, Y.-J.; Lee, J.B.; An, J.-C.; Park, S.-M.; Oh, K.; Yoon, S.-H.; Park, J.-I. A Shortened Process of Artificial Graphite Manufacturing for Anode Materials in Lithium-Ion Batteries. Processes 2024, 12, 2709. [Google Scholar] [CrossRef]
- IRENA. Geopolitics of the Energy Transition: Critical Materials; International Renewable Energy Agency: Abu Dhabi, United Arab Emirates, 2023; Available online: https://www.irena.org/-/media/Files/IRENA/Agency/Publication/2023/Jul/IRENA_Geopolitics_energy_transition_critical_materials_2023.pdf (accessed on 27 February 2003).
- Ying, J.; Wan, C.; Jiang, C.; Li, Y. Preparation and characterization of high-density spherical LiNi0.8Co0.2O2 cathode material for lithium secondary batteries. J. Power Sources 2001, 99, 78–84. [Google Scholar] [CrossRef]
- Yang, S.; Wang, X.; Yang, X.; Liu, Z.; Wei, Q.; Shu, H. High Tap Density Spherical Li[Ni0.5Mn0.3Co0.2]O2 Cathode Material Synthesized via Continuous Hydroxide Coprecipitation Method for Advanced Lithium-Ion Batteries. Int. J. Electrochem. 2012, 9, 323560. [Google Scholar] [CrossRef]
- Zhang, J.-p.; Wang, D.-k.; Zhang, L.-h.; Liu, H.-y.; Liu, Z.-b.; Xing, T.; Ma, Z.-k.; Chen, X.-h.; Song, H.-h. A wet granulation method to prepare graphite particles with a high tap density for high volumetric energy density lithium-ion storage. New Carbon Mater. 2022, 37, 402–410. [Google Scholar] [CrossRef]
- Mazlan, M.R.; Jamadon, N.H.; Sulong, A.B.; Aripin, M.A.; Jamhari, F.I.; Yusof, F. Comparative Study of Particle Size and Shape Effects on Powder Packing Densities. J. Kejuruter. 2024, 36, 2563–2570. [Google Scholar] [CrossRef]
- Bettersize. BeDensi T Pro Series. 2025. Available online: https://www.bettersizeinstruments.com/products/bedensi-t-series-tapped-density-meter/ (accessed on 27 February 2003).
- Azom.com. Improving Lithium-Ion Batteries Through Measuring Tapped Density. 2021. Available online: https://www.azom.com/article.aspx?ArticleID=21056 (accessed on 27 February 2003).
- Jeswiet, J.; Szekeres, A. Energy Consumption in Mining Comminution. Procedia CIRP 2016, 48, 140–145. [Google Scholar] [CrossRef]
- Seino, K.; Golman, B.; Shinohara, K.; Ohzeki, K. Variation of packing structure of cast film with preparation conditions and particle properties. TANSO 2005, 216, 2–7. [Google Scholar] [CrossRef][Green Version]
- Qiu, X. Investigating the Particle Size and Shape Influences on Anode Energy Density of Lithium-Ion Batteries; Bettersize Application Note; Application Research Lab, Bettersize Instruments Ltd.: Liaoning, China, 2024; Available online: https://www.bettersizeinstruments.com/uploads/file/investigating-the-particle-size-and-shape-influences-on-anode-energy-density-of-lithium-ion-batteries.pdf (accessed on 27 February 2003).
- Ulusoy, U.; Burat, F.; Bayar, G.; Mojtahedi, B.; Güven, G. Modeling the change of the sphericity feature of graphite particles ground in a ball and vibrating disc mill with grinding time. J. Energy Storage 2024, 97, 112814. [Google Scholar] [CrossRef]
- Andrić, L.; Trumić, M.; Trumić, M.; Nikolić, V. Micronization of zeolite in vibration mill. RSD 2018, 11, 63–71. [Google Scholar] [CrossRef]
- ISO 3953:2011; Metallic Powders—Determination of Tap Density. Technical Committee ISO/TC 119: Stockholm, Sweden, 2011.
- Ulusoy, U. Dynamic image analysis of differently milled talc particles and comparison by various methods. Part. Sci. Technol. 2018, 36, 332–339. [Google Scholar] [CrossRef]
- Ulusoy, U. Quantifying of particle shape differences of differently milled barite using a novel technique: Dynamic image analysis. Materialia 2019, 8, 100434. [Google Scholar] [CrossRef]
- Czajkowska, M.; Sznitowska, M.; Kleinebudde, P. Determination of coating thickness of minitablets and pellets by dynamic image analysis. Int. J. Pharm. 2015, 495, 347–353. [Google Scholar] [CrossRef] [PubMed]
- Weger, R.J.; Eberli, G.P.; Baechle, G.T.; Massaferro, J.L.; Sun, Y.-F. Quantitative characterization of carbonate pore systems by digital image Analysis. AAPG Bull. 1998, 93, 1297–1317. [Google Scholar] [CrossRef]
- Ma, G.; Bu, X.; Ulusoy, U.; Xie, G. Effect of particle shape on bubble-particle attachment behavior: Roles of surfaces, edges and vertexes. J. Clean. Prod. 2023, 429, 139606. [Google Scholar] [CrossRef]
- Particle Insight Manual. Micromeritics Instrument Corp.: Norcross, GA, USA, 2013.
- Mitchell, J.K.; Soga, K. Fundamentals of Soil Behaviour, 3rd ed.; John Wiley & Sons: Hoboken, NJ, USA, 2005. [Google Scholar]
- Barrett, P.J. The shape of rock particles, a critical review. Sedimentology 1980, 27, 291–303. [Google Scholar] [CrossRef]
- Blott, S.J.; Pye, K. Particle shape: A review and new methods of characterization and classification. Sedimentology 2008, 55, 31–63. [Google Scholar] [CrossRef]
- Ulusoy, U. A review of particle shape effects on material properties for various engineering applications: From macro to nanoscale. Minerals 2023, 13, 91. [Google Scholar] [CrossRef]
- Disma, F.; Aymard, L.; Dupont, L.; Tarascon, J.-M. Effect of Mechanical Grinding on the Lithium Intercalation Process in Graphites and Soft Carbons. J. Electrochem. Soc. 1996, 143, 3959–3972. [Google Scholar] [CrossRef]
- Li, S.; Zhao, J.; Lu, P.; Xie, Y. Maximum packing densities of basic 3D objects. Chin. Sci. Bull. 2010, 55, 114–119. [Google Scholar] [CrossRef]
- Wang, S.; Marmysh, D.; Ji, S. Construction of irregular particles with superquadric equation in DEM. Theor. Appl. Mech. Lett. 2020, 10, 68–73. [Google Scholar] [CrossRef]
- Wouterse, A.; Williams, S.R.; Philipse, A.P. Effect of particle shape on the density and microstructure of random packings. J. Phys. Condens. Matter. 2007, 19, 406215. [Google Scholar] [CrossRef] [PubMed]
- Li, C.X.; Gan, J.Q.; Pinson, D.; Yu, A.B.; Zhou, Z.Y. Dynamic analysis of poured packing process of ellipsoidal particles. Powder Technol. 2021, 385, 444–454. [Google Scholar] [CrossRef]
- Pisecky, J. Handbook of Milk Powder Manufacture; GEA Process Engineering A/S: Soeborg, Denmark, 2012. [Google Scholar]
- Ding, H.; Li, B.; Boiarkina, I.; Wilson, D.I.; Yu, W.; Young, B.R. Effects of Morphology on the Bulk Density of Instant Whole Milk Powder. Foods 2020, 9, 1024. [Google Scholar] [CrossRef]
Disclaimer/Publisher’s Note: The statements, opinions and data contained in all publications are solely those of the individual author(s) and contributor(s) and not of MDPI and/or the editor(s). MDPI and/or the editor(s) disclaim responsibility for any injury to people or property resulting from any ideas, methods, instructions or products referred to in the content. |
© 2025 by the authors. Licensee MDPI, Basel, Switzerland. This article is an open access article distributed under the terms and conditions of the Creative Commons Attribution (CC BY) license (https://creativecommons.org/licenses/by/4.0/).

