Article

HLS Testwork on Spodumene and Lepidolite Samples to Determine Maximum Achievable Lithium Upgrade

Physical Separation Group, Minerals Processing Division, Mintek, Johannesburg 2125, South Africa
*
Author to whom correspondence should be addressed.
Minerals 2025, 15(4), 396; https://doi.org/10.3390/min15040396
Submission received: 11 March 2025 / Revised: 28 March 2025 / Accepted: 1 April 2025 / Published: 8 April 2025
(This article belongs to the Section Mineral Processing and Extractive Metallurgy)

Abstract

There is a growing demand for lithium as it is primarily used in the production of batteries. Two lithium bearing ores, namely spodumene and lepidolite, underwent gravity separation via heavy liquid separation (HLS) laboratory tests to determine the amenability of each ore to upgrade by gravity processes, such as dense medium separation (DMS). Each sample was crushed to −20 mm, and the −1 mm fraction was screened out to produce a −20 + 1 mm feed for HLS testwork. A 50/50 composite sample was also created to determine the performance when both ores are treated simultaneously. At a cut point of 2.9 g/cm3, lepidolite, spodumene and the composite achieved %Li2O grades of 4.28%, 3.38% and 4.59%, at recoveries of 24.6%, 2.77% and 10.1%, respectively. The grade of the composite samples is greater than the theoretical calculated grade, which may be due to the nugget effect of spodumene. At a cut point of 2.8 g/cm3, recoveries are significantly improved (>73%); however, the grade is then compromised.

Graphical Abstract

1. Introduction

The demand for lithium has been increasing as it is widely used in the production of batteries. Lithium-ion batteries have a wide variety of applications, including electronics, power tools, appliances, electric vehicles and power storage for renewable energy [1]. In comparison to traditional batteries, the advantages of lithium-ion batteries include high energy density, low self-discharge rate, good performance in both high and low temperatures, low cost and low environmental footprint [2]. This has increased lithium production worldwide as lithium-ion batteries have the potential to lessen the adverse impacts of climate change, such as emission of greenhouse gases [1]. It is estimated that >70% of lithium produced is used in the battery industry [3]. In 2010, the lithium production was 28,100 tons, which increased to 100,000 tons in 2021, and is estimated to increase to 2,000,000 tons by 2030 [4]. However, increased consumption leads to depletion of high-grade resources, and low-grade resources typically have more gangue materials that require more complex processing [5]. Thus, beneficiation routes for lithium processing need to be optimized.
Current processing techniques for lithium ores include heavy media separation, magnetic separation and flotation. Optical sorting is also a method that has been explored in recent years, and it involves separation based on color [1]. Selection of a separation technique depends on the gangue material present in the ore. This study focuses on spodumene and lepidolite, both of which occur in pegmatite deposits, which are primary sources of lithium. These deposits typically contain spodumene, lepidolite and/or petalite [1], of which spodumene is the most abundant [6]. Spodumene is a monoclinic pyroxene [1], and it is typically found in pegmatite deposits, with major gangue minerals being feldspar, micas and quartz. The head grade of spodumene ranges between 1.0% and 4.0% Li2O, where 4.0% Li2O is only found in high-grade ores [7]. Based on the mineralogy of the ore, beneficiation of spodumene is achieved through heavy media separation, magnetic separation (for removal of iron-bearing gangue), desliming and flotation [3,6]. Heavy media separation is effective for separating lithium minerals from siliceous gangue as the specific gravity of associated gangue, such as pegmatite-quartz, feldspars and micas, is lower than that of lithium minerals. The process is usually performed using a size fraction of −9500 + 850 µm. For high-grade ores, heavy media separation can produce a concentrate without subsequent processing [6]. However, for low-grade ores, pre-concentration is achieved via heavy media separation, followed by flotation to improve the grade further. However, while extensive testwork has been performed on flotation of spodumene, there is limited literature on heavy media separation of lithium ores [3]. Lepidolite is a mica mineral, with major elements being lithium, aluminum and potassium. Lepidolite is usually upgraded via flotation to remove calcite, muscovite, feldspar and quartz. The Li2O content may be 1.2%–5.9%, based on the composition of the deposit. Petalite has a monoclinic structure, and it is usually associated with other pegmatite ores, including spodumene, lepidolite and eucryptite, and it is sometimes found in trace amounts in these ores. Its lithium content typically ranges from 3.0% to 4.7% Li2O [1]; however, despite the higher lithium oxide content, petalite requires heat treatment to transform to β-spodumene to improve its amenability to leaching, resulting in higher processing costs [8].
In practice, most lithium ores being processed contain 1%–2% Li2O. A concentrate suitable for production of lithium carbonate, which is used in the production of batteries, contains 6%–7% Li2O [9]. Thus, to achieve the desired grade, a combination of heavy media separation and flotation may be required.
The results in this paper were presented at MEI’s 8th Physical Separation Conference and this paper is an extension of the extended abstract published in the conference proceedings [10].

2. Materials and Methods

Two lithium bearing ores, namely spodumene and lepidolite, underwent gravity separation via heavy liquid separation (HLS) laboratory tests to determine the amenability of each ore to upgrade by gravity processes, such as dense medium separation (DMS). Furthermore, a 50/50 composite sample was also created to determine the performance when both ores are treated simultaneously.

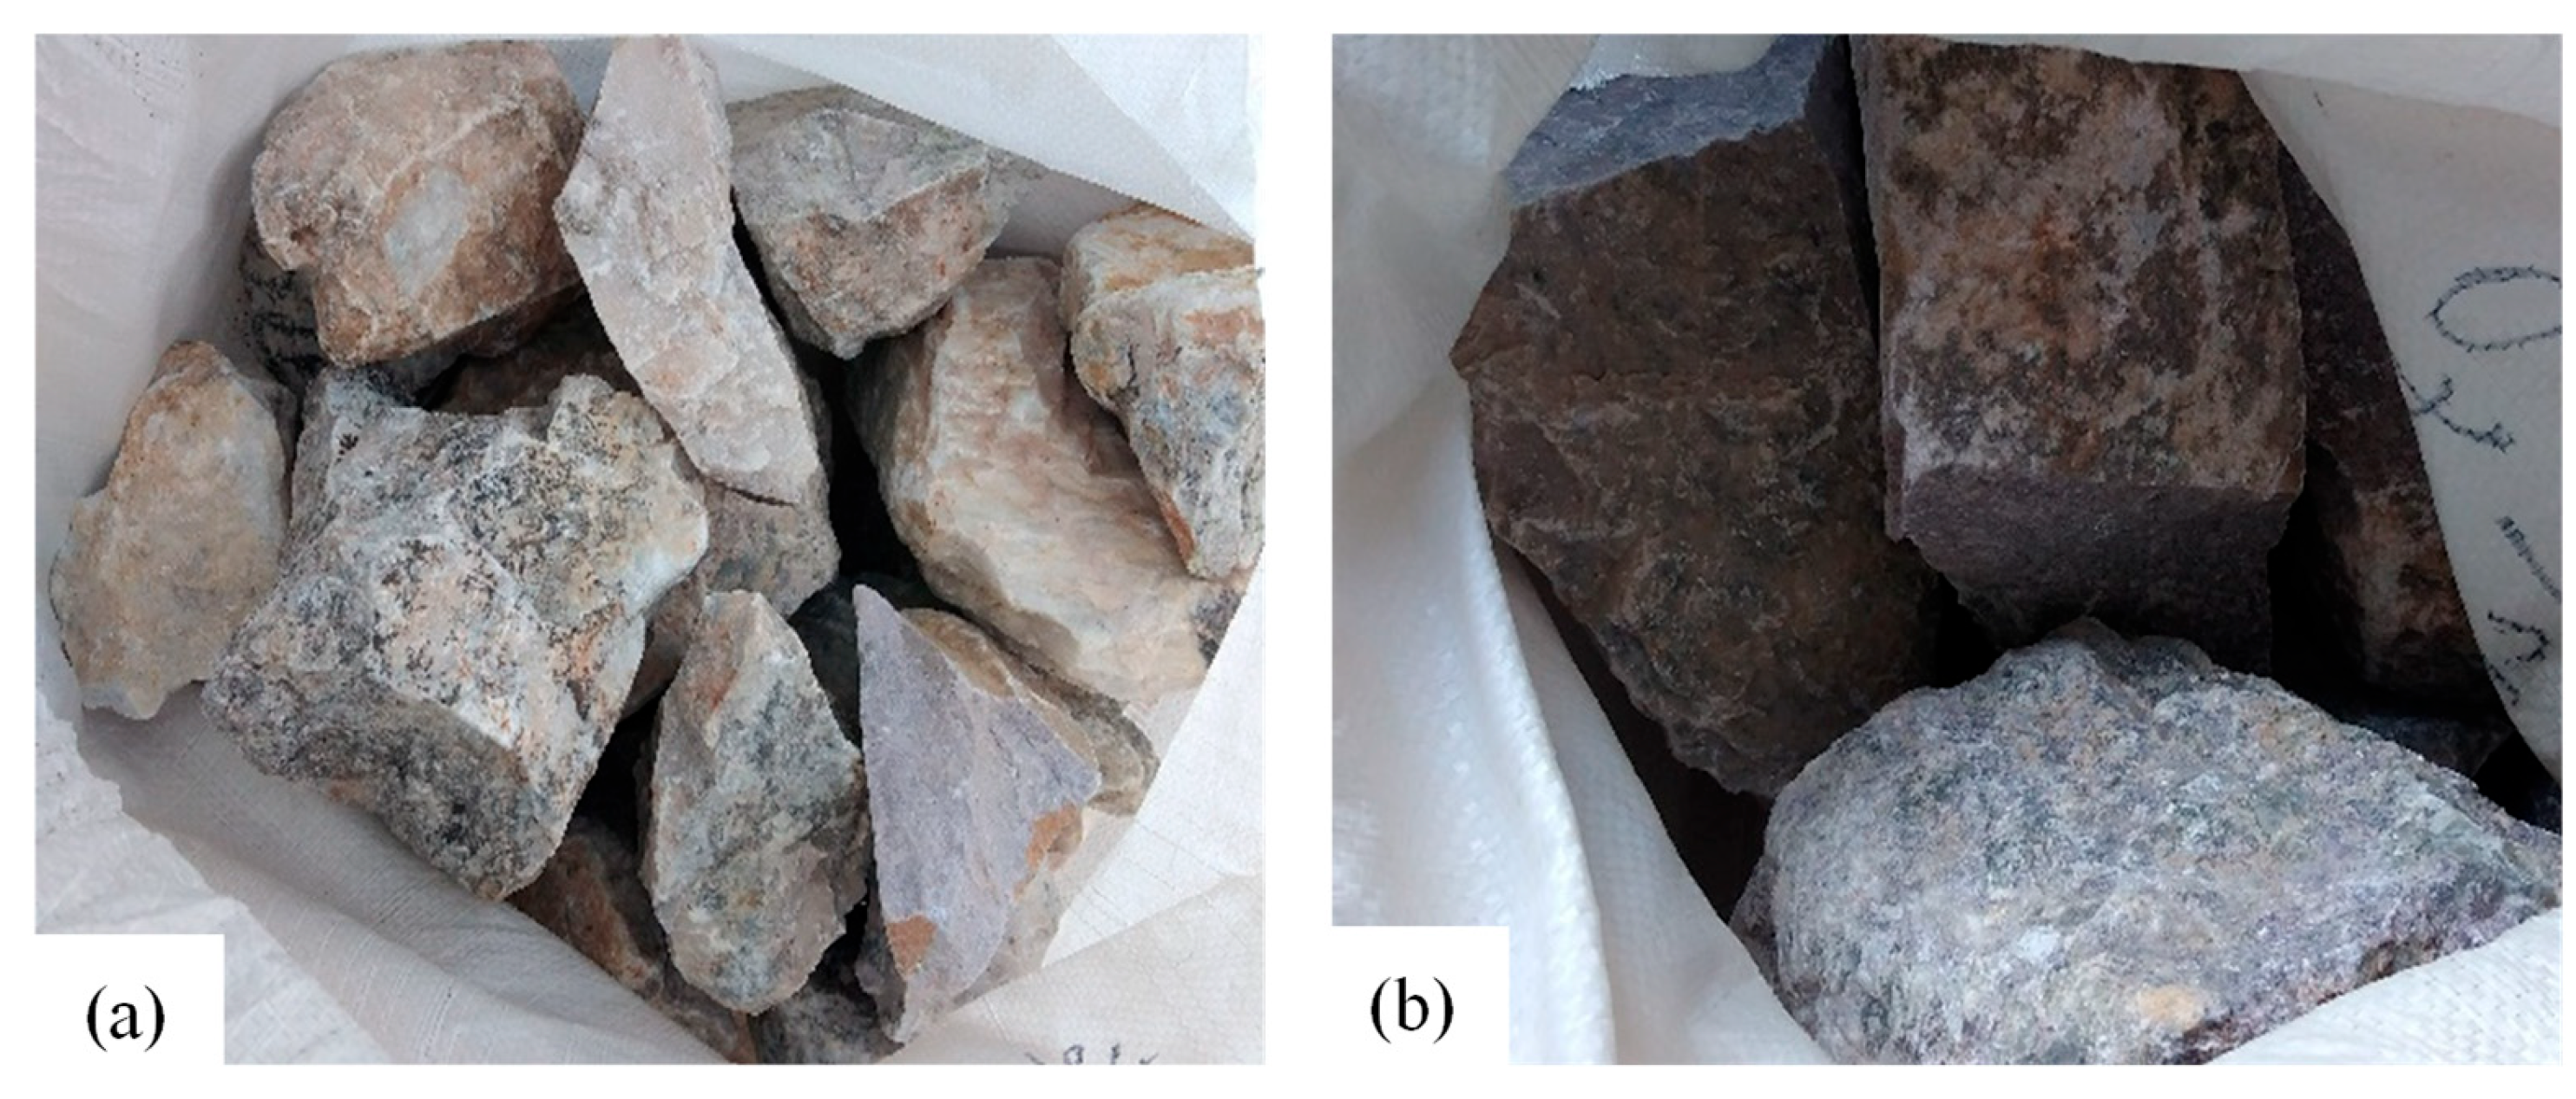
2.1. Sample Receipt and Preparation

The lepidolite and spodumene samples are from the same deposit in Zimbabwe, and both samples have a maximum size of ~300 mm. Each sample was crushed to 100% passing −20 mm. Subsamples were removed for head assay, particle size distribution (PSD), size by assay (SBA) and heavy liquid separation (HLS) testwork. All subsamples for HLS were screened at 1.18 mm to remove the fines and produce a suitable HLS feed. The as-received samples are shown in Figure 1.

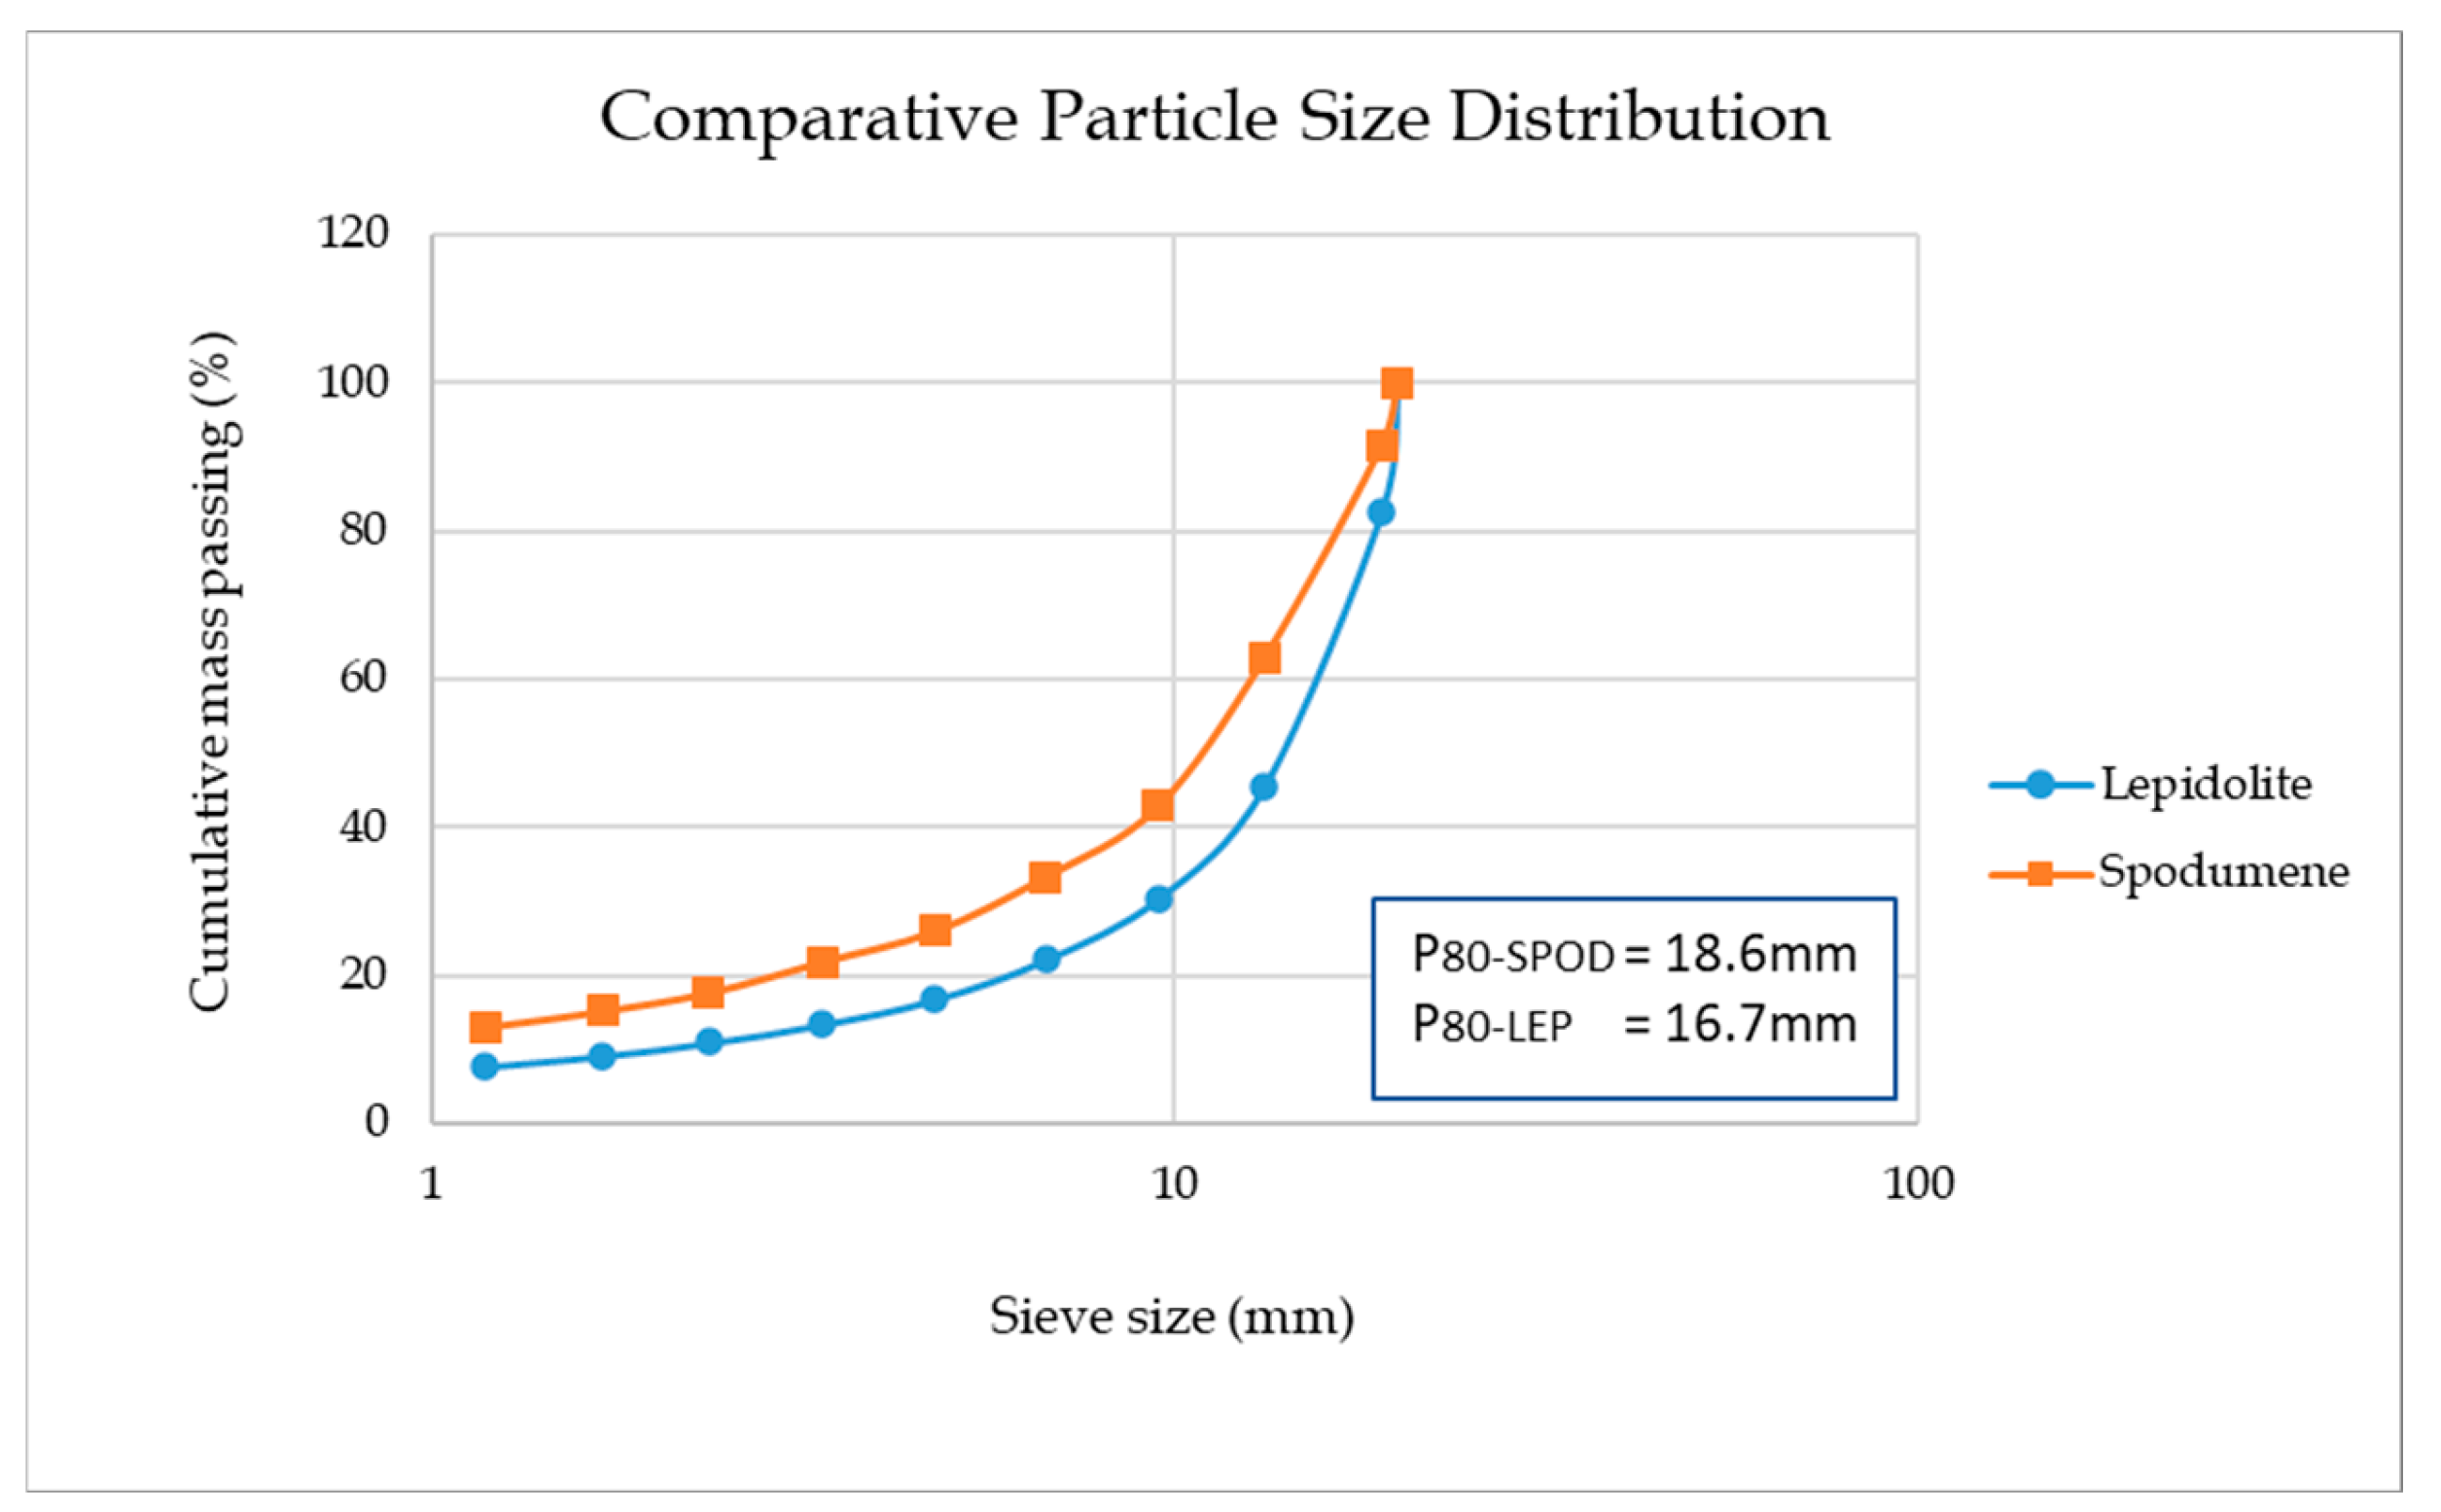
2.2. Head Assay, Particle Size Distribution and Size by Assay

Two representative 200 g subsamples of crushed −1.18 mm were pulverized for duplicate head chemical analysis. A representative 20 kg subsample of crushed −20 mm ROM was subjected to sieve analysis. The screening of the feed sample was performed from 20 mm down to 1.18 mm following the root 2-series.

2.3. Gravity Separation Testwork

Heavy Liquid Separation (HLS) Testwork

Heavy liquid separation (HLS) is a gravity separation method that achieves separation based on relative densities of minerals. The process involves the use of a high-density medium, so that lower density materials float and higher density minerals sink. HLS was conducted on three samples, namely spodumene, lepidolite and a composite sample of spodumene and lepidolite. For each sample, HLS was conducted at six (6) different relative densities of 2.5–3.0 g/cm3, at 0.1 increments. A mixture of TBE and acetone was prepared for density cut points between 2.5 and 2.8 g/cm3, and a mixture of TBE and fine atomized ferrosilicon was prepared for density cut points between 2.9 and 3.0 g/cm3. Each densimetric fraction was dried and the dry mass recorded. The entire mass of each fraction was prepared for chemical analysis. The results were used to provide mass yields, grade-recovery profiles and washability curves.

3. Results and Discussion

3.1. Head Grade Analysis

Table 1 presents the head grade analyses results for lepidolite and spodumene. The head grade results show that both samples have a similar lithium content, with only a 0.04% difference. The major gangue in both samples is quartz. The equivalent %Li2O for spodumene and lepidolite are 2.45% and 2.54%, respectively.

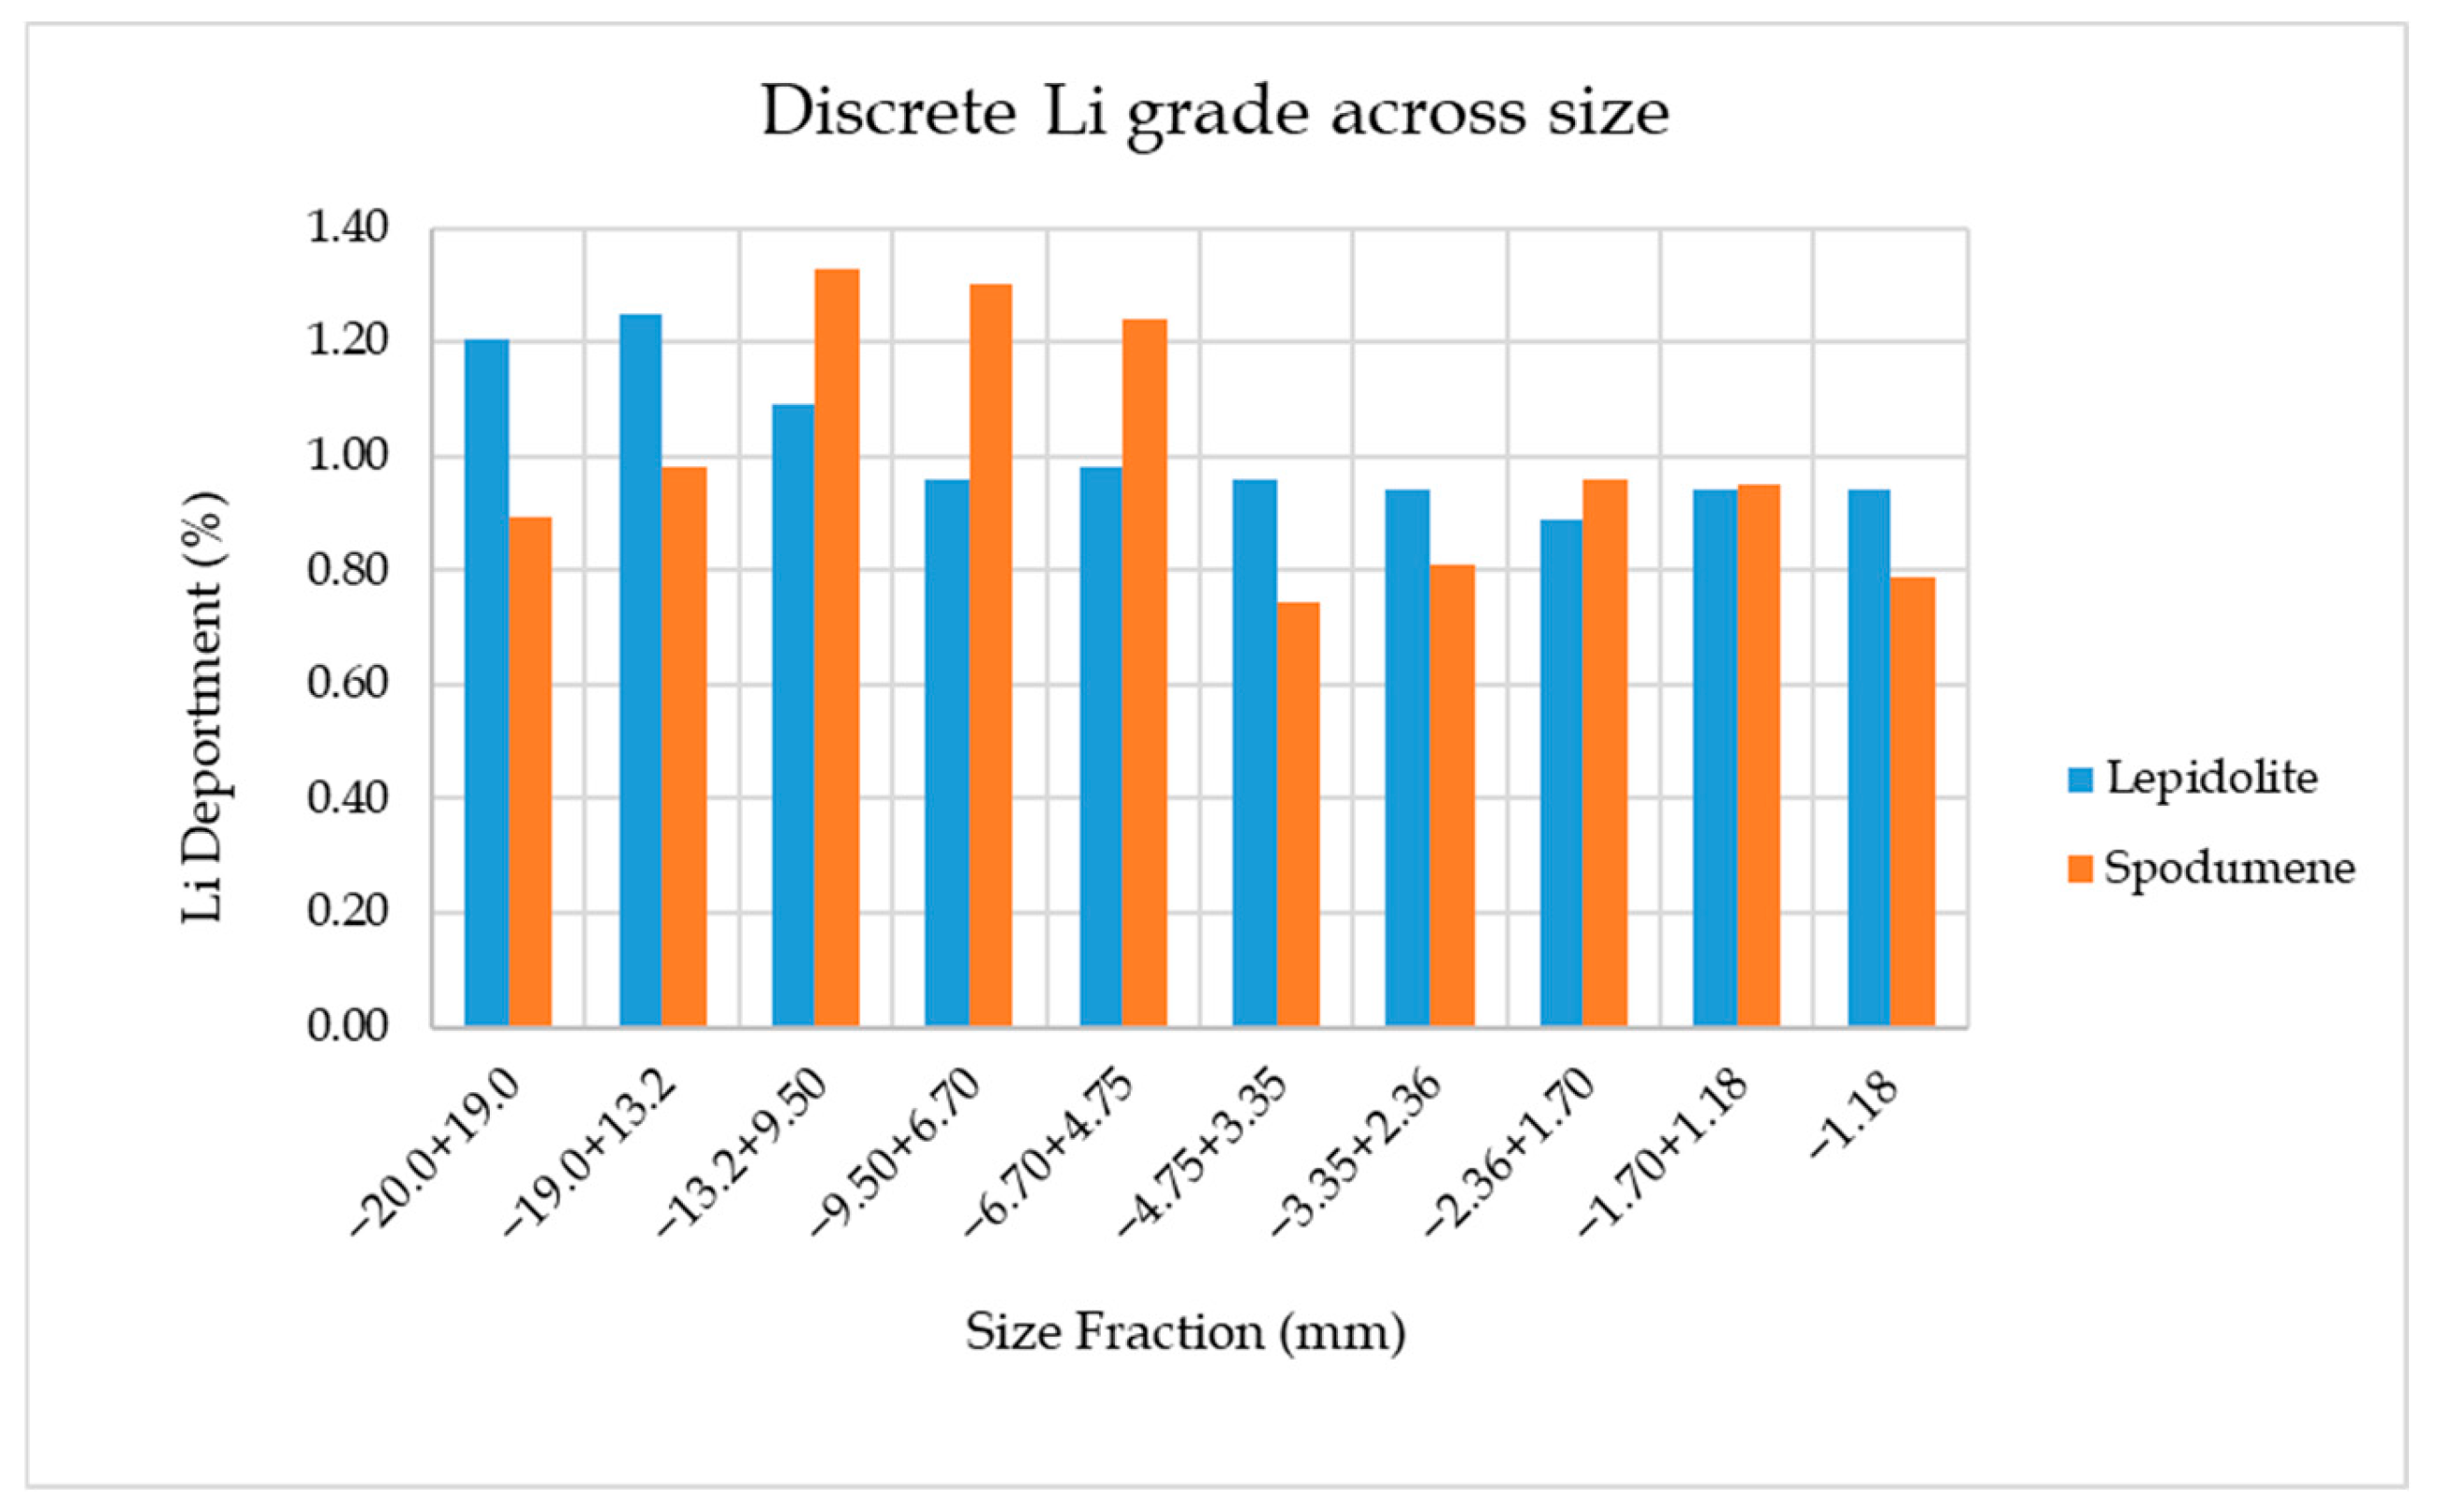
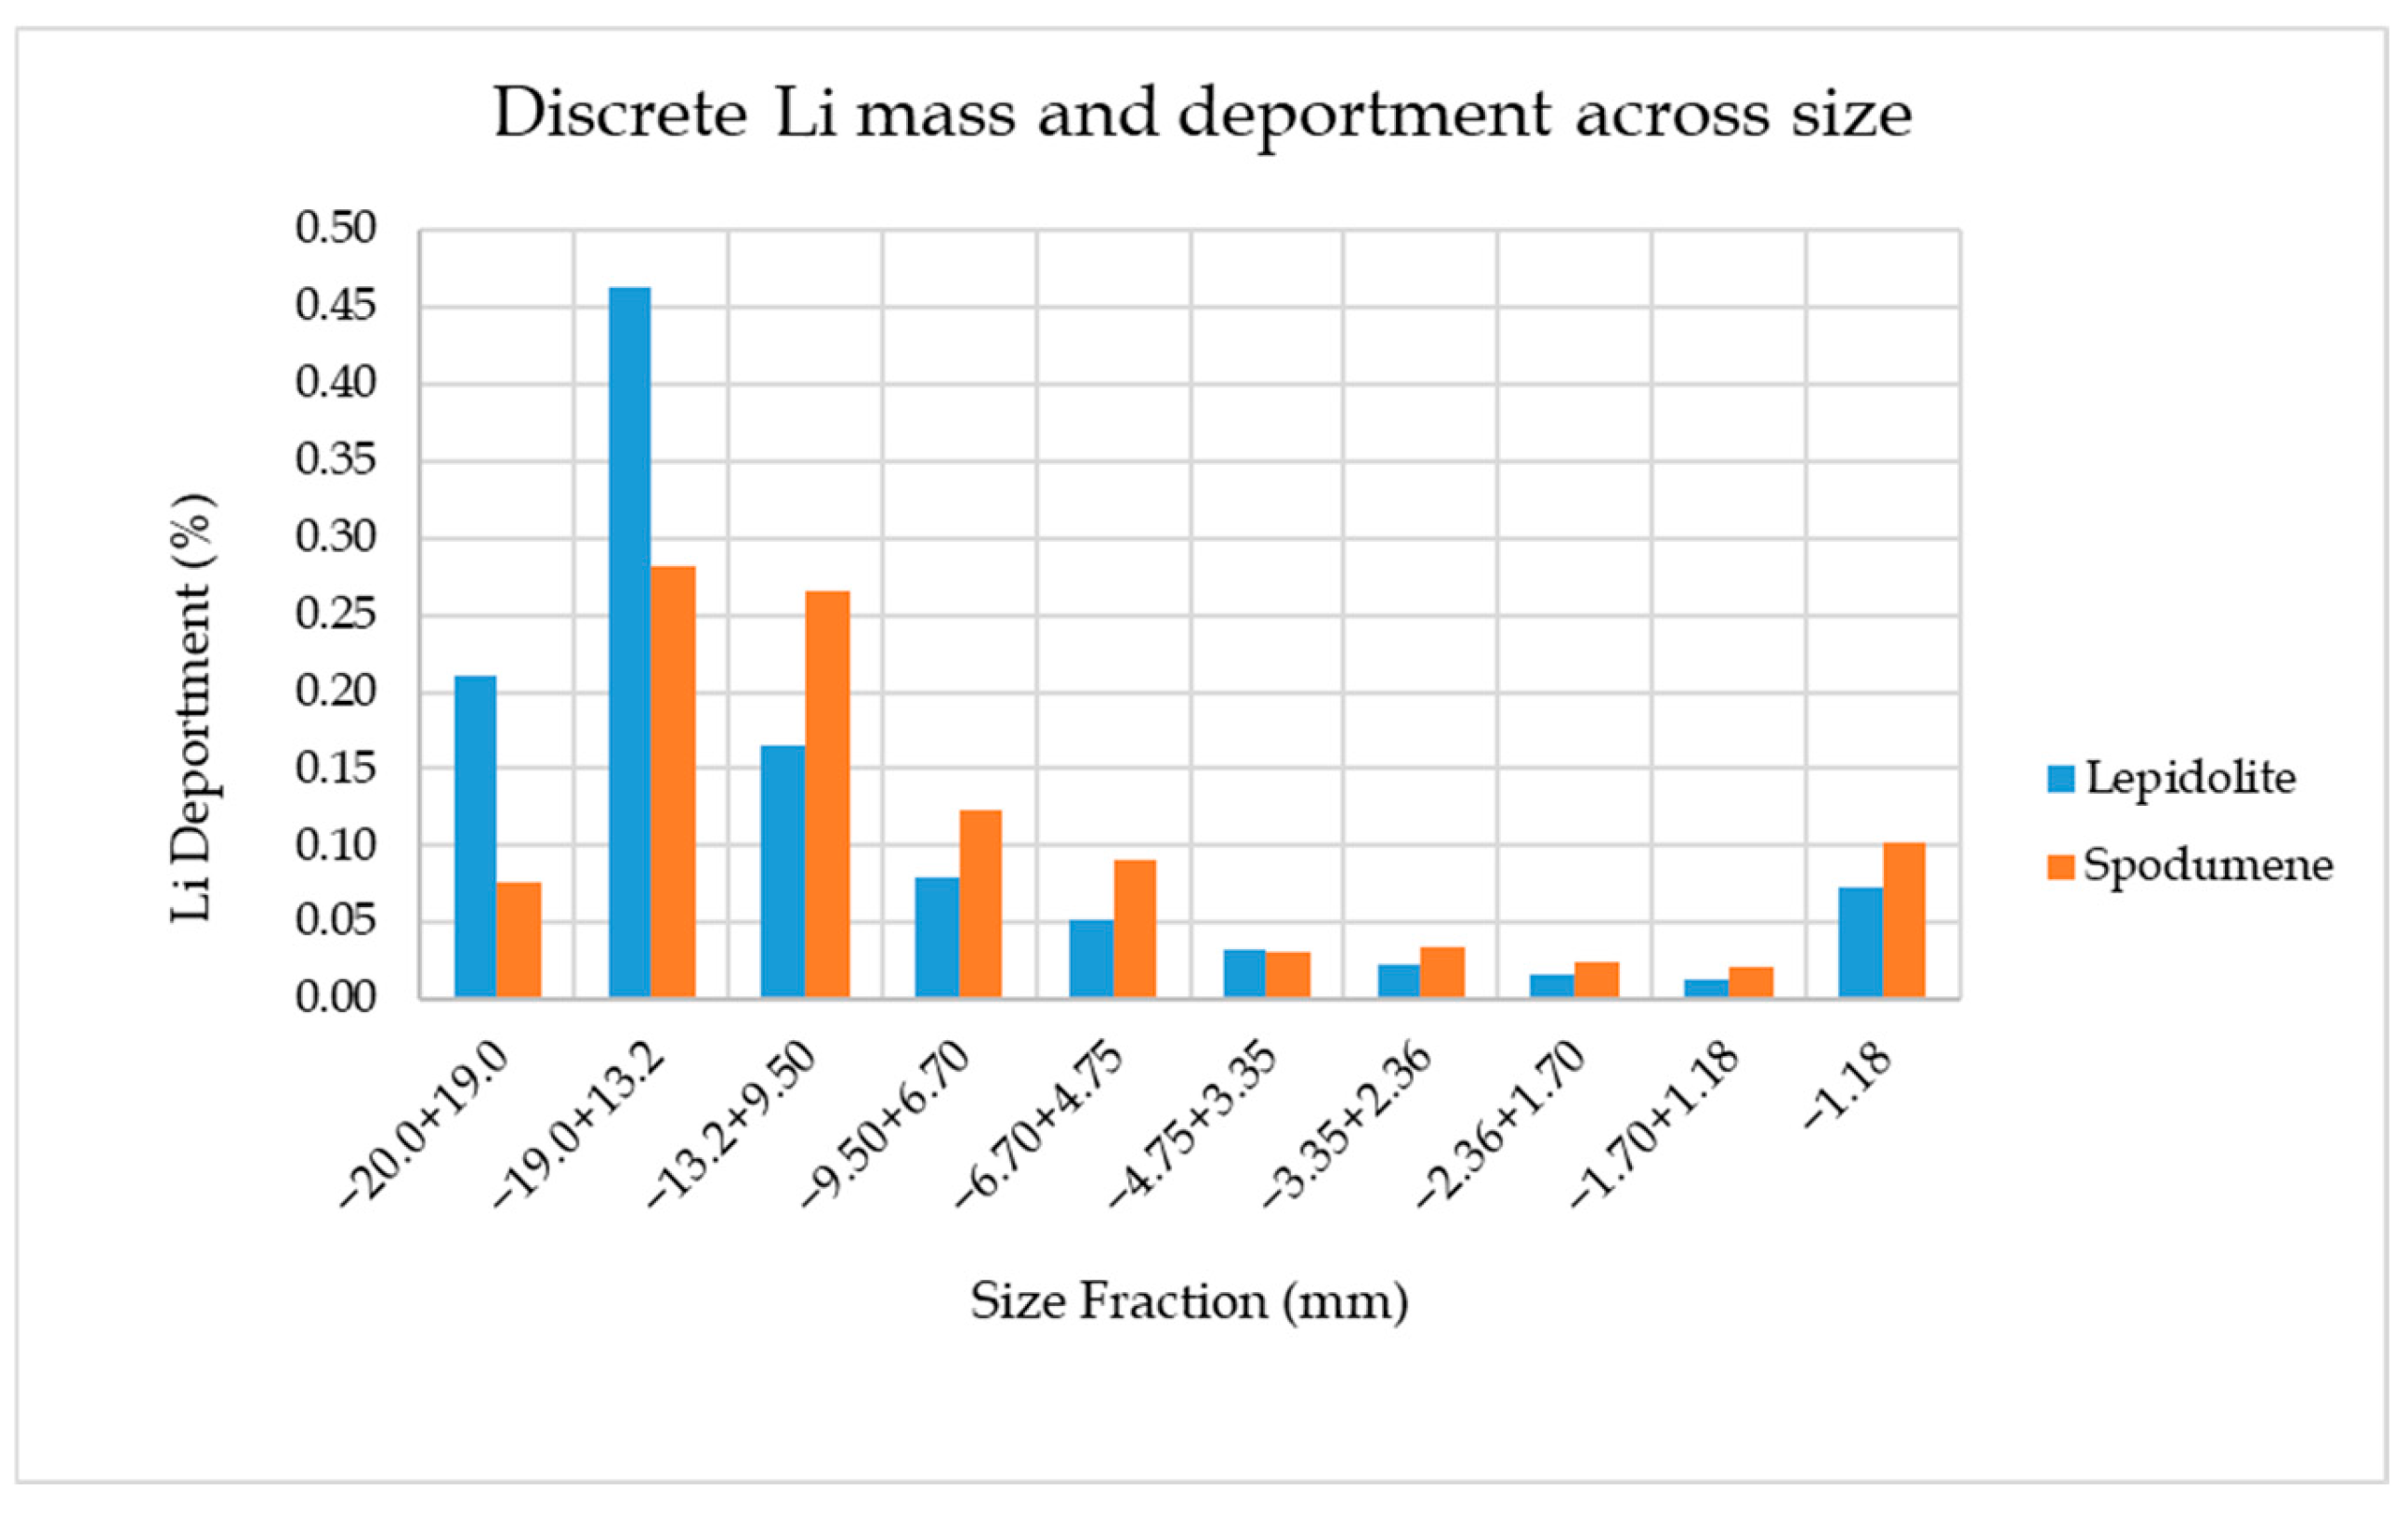
3.2. Size by Assay Analysis

The size by assay analysis was conducted on the −20 mm crushed feed. Figure 2 shows the particle size distribution of spodumene and lepidolite. The P80 of spodumene and lepidolite is 18.6 mm and 16.7 mm, respectively. This suggests that after crushing to −20 mm, spodumene is slightly coarser than lepidolite due to a higher quartz content.
Figure 3 shows the discrete Li grade across size. The graph indicates that lepidolite has a higher %Li between sizes −13.2 + 4.50 mm, while spodumene has a higher %Li between −20.0 + 9.50 mm. This implies that, for lepidolite, lithium is more liberated at smaller size fractions. Therefore, recovery may be improved if beneficiation is conducted at a lower size class, such as −10.0 + 1.18 mm.
Figure 4 presents the discrete deportment of lithium per size fraction for lepidolite and spodumene. Both samples have a bimodal mass distribution, with peaks in the −19.0 + 13.2 mm and −1.18 mm size fractions. Spodumene has significant Li deportment in the −19.0 + 13.2 mm size fraction, indicating that it is more suitable for processing at coarser size fractions. The Li deportment in lepidolite is greater than in spodumene for all size fractions below 13.2 mm, which shows improved liberation at smaller size fractions. Furthermore, approximately 0.7%–1.0% of Li reports to the −1.18 mm fraction; therefore flotation is recommended to improve recovery.

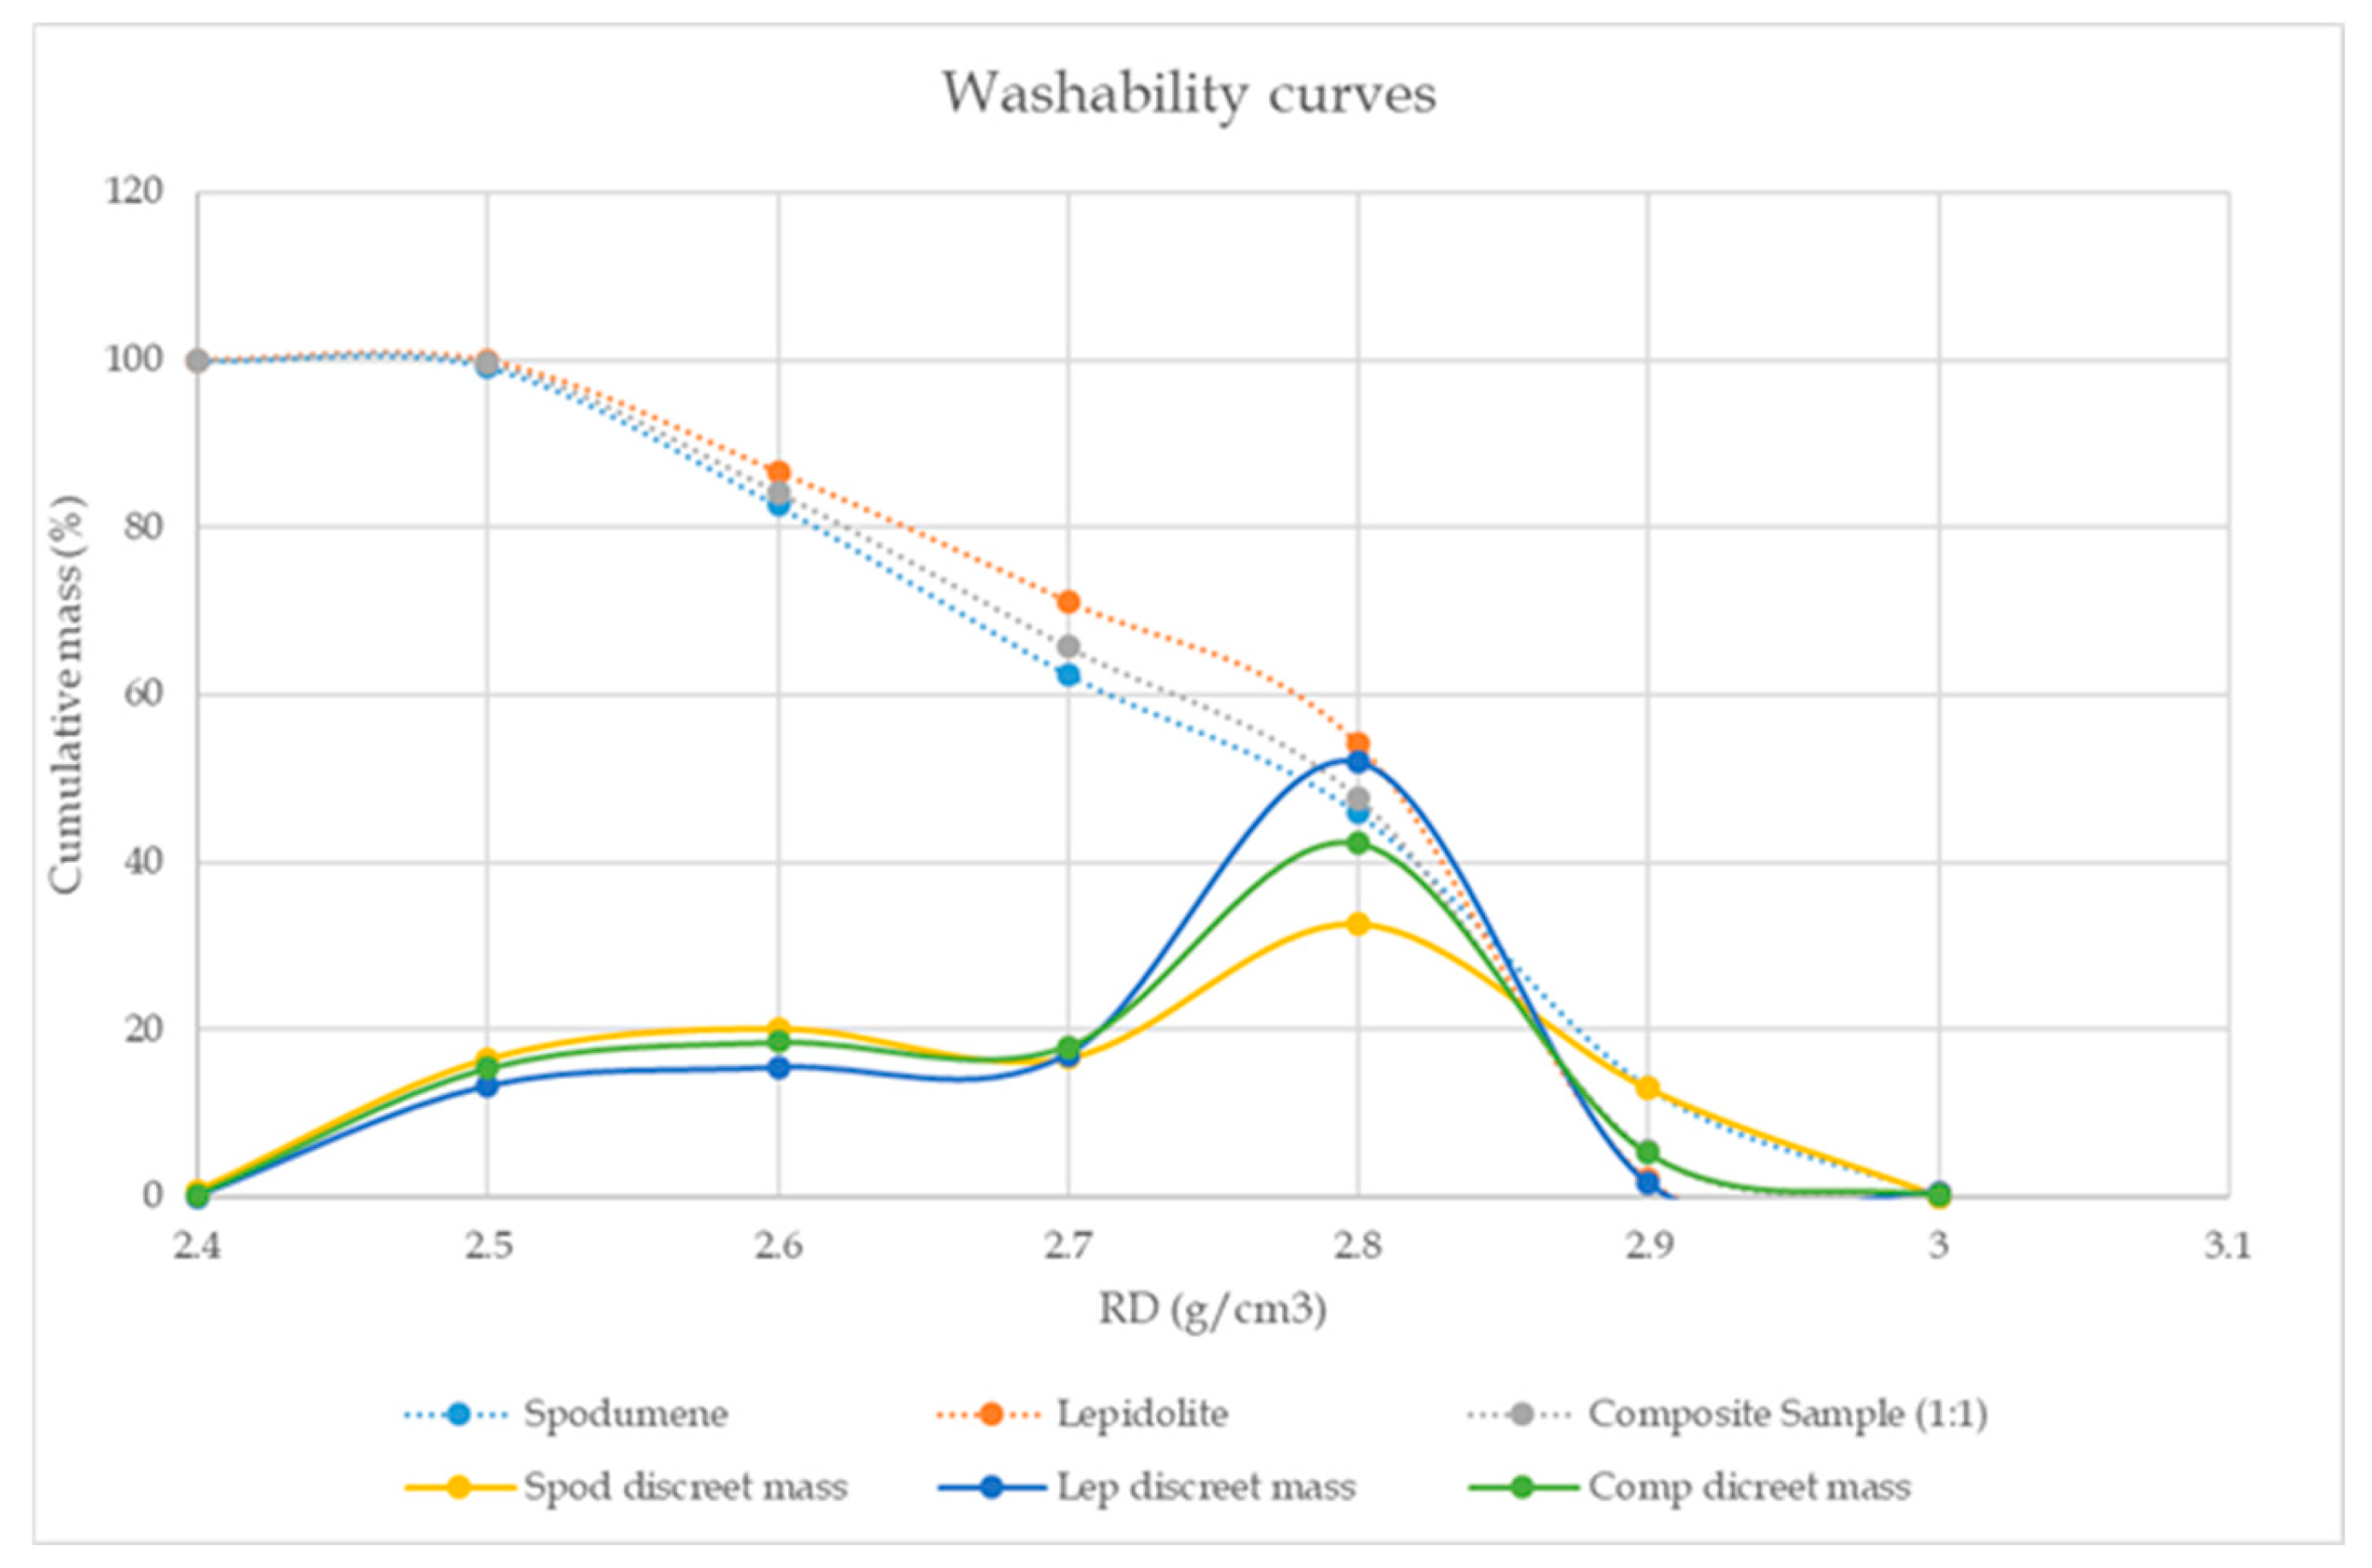
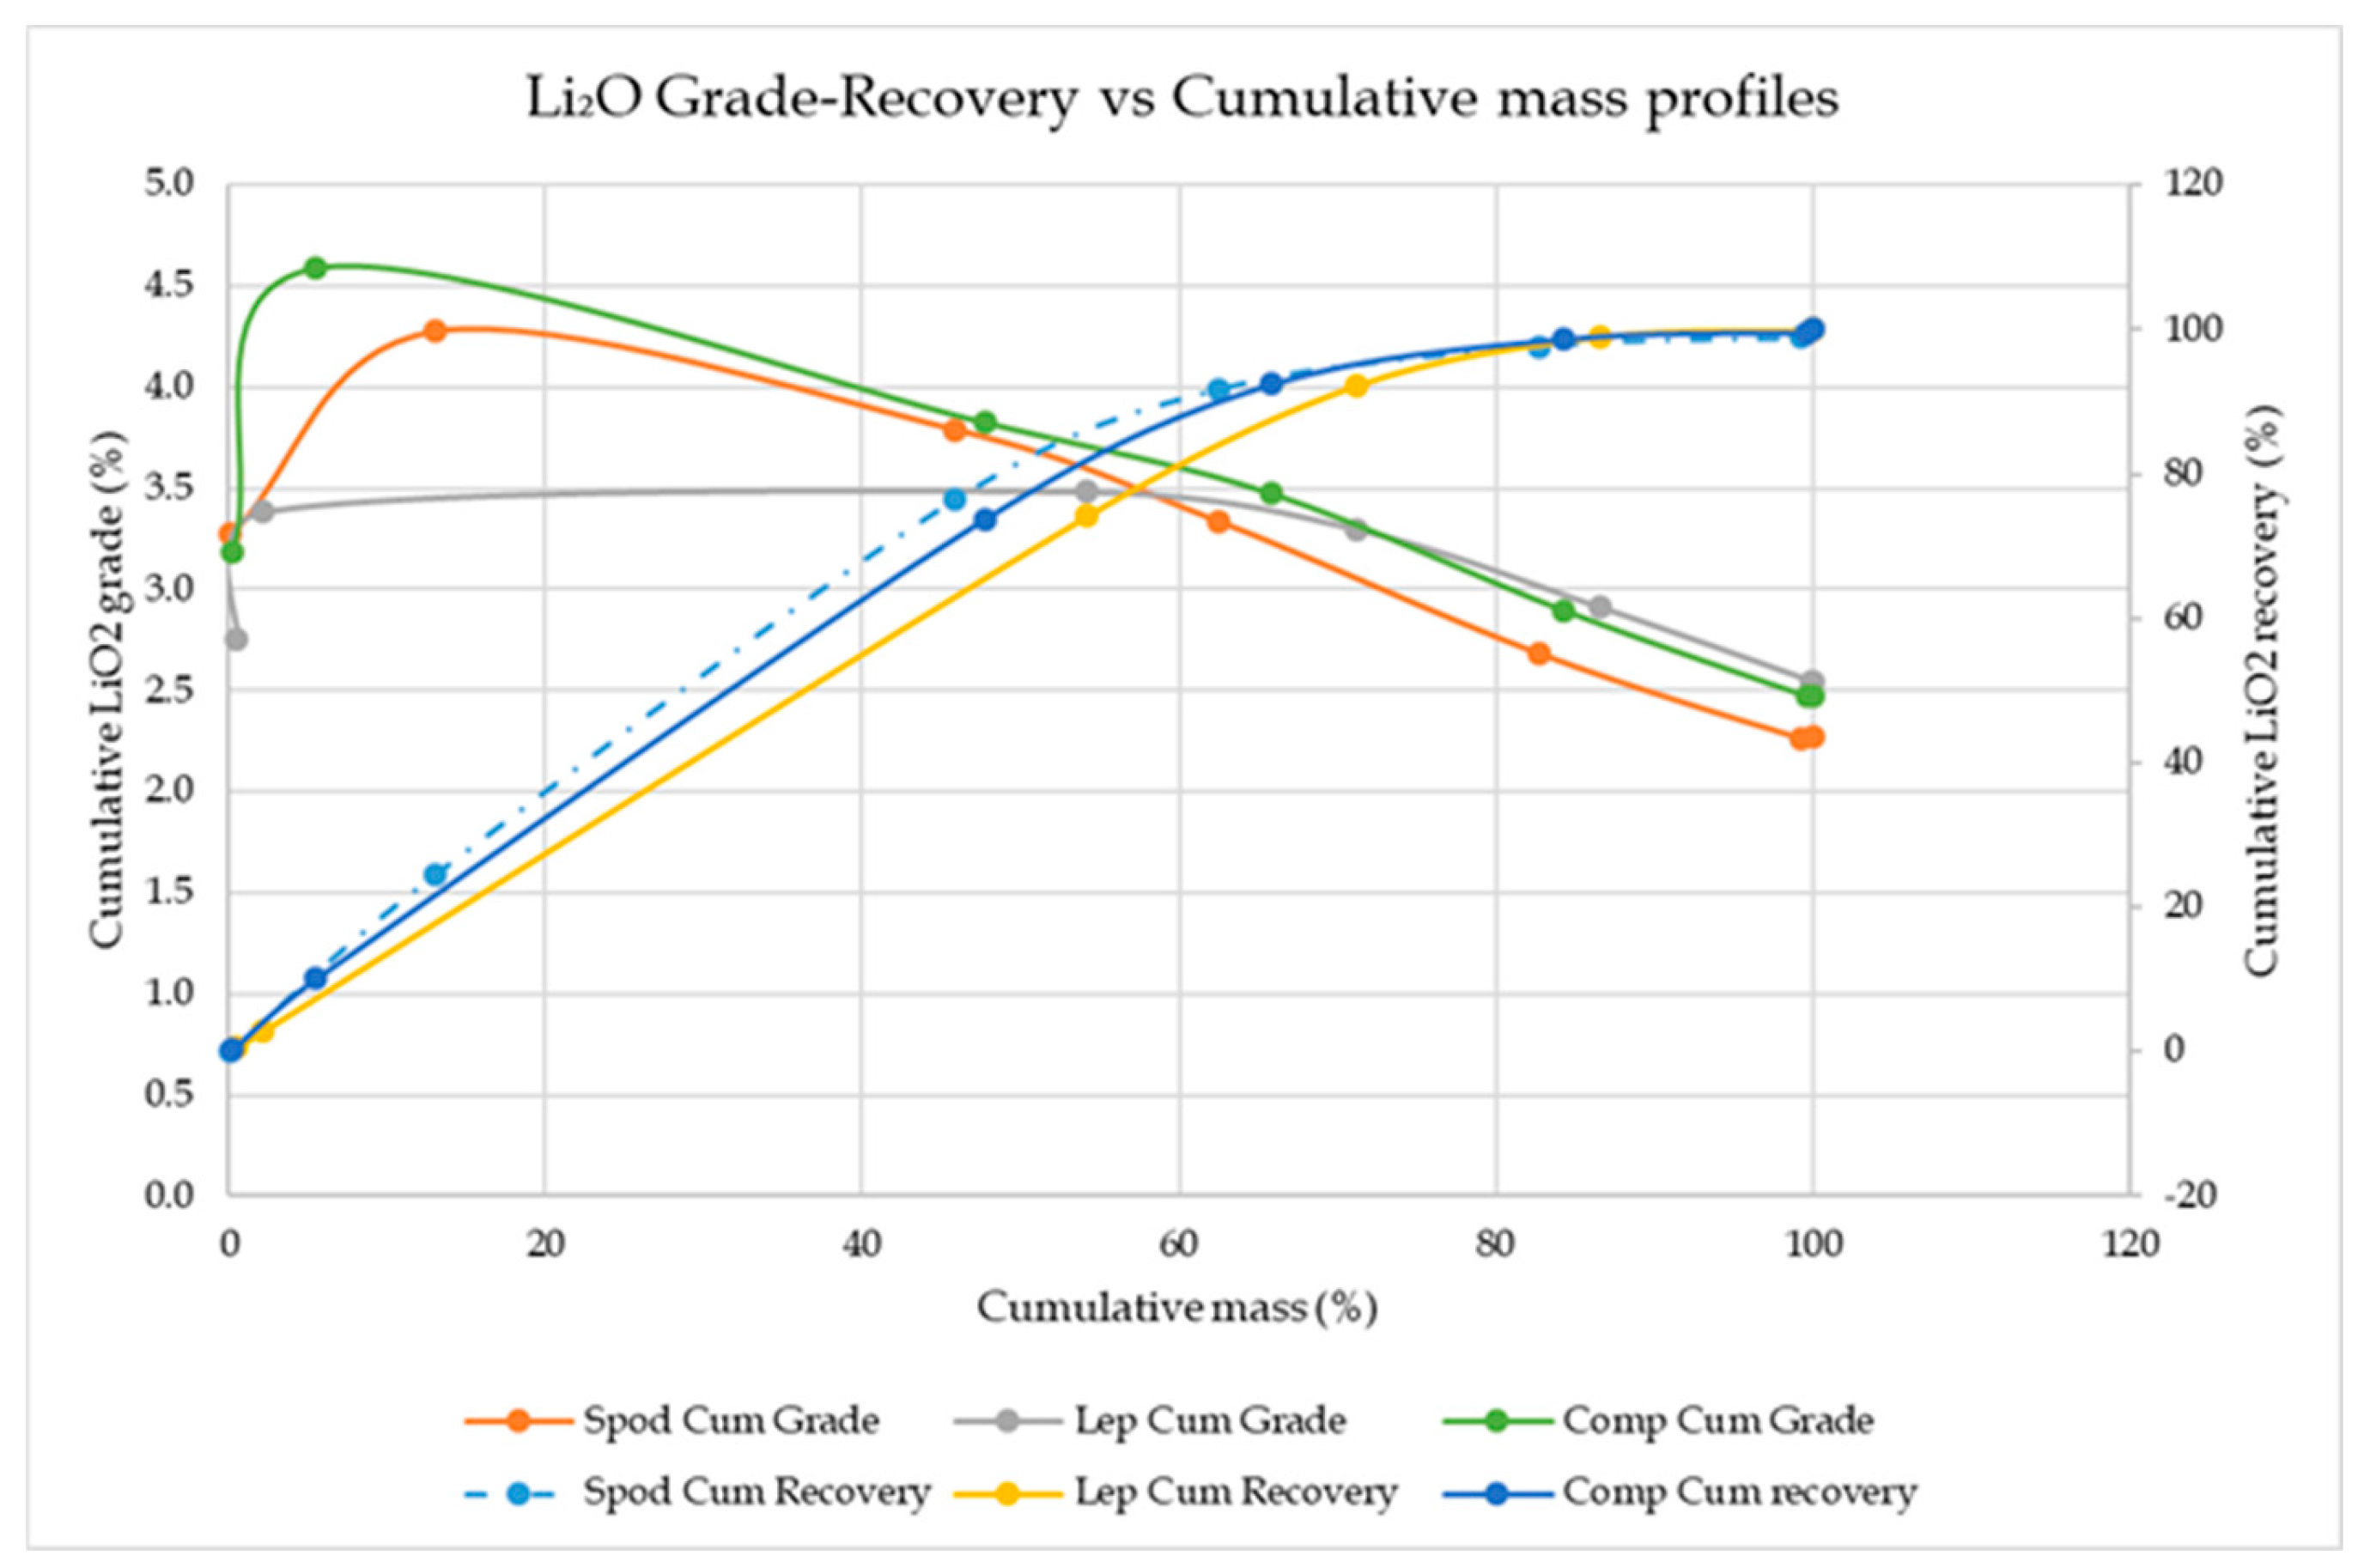
3.3. Gravity Separation: Laboratory Heavy Liquid Separation

Detailed HLS results for spodumene, lepidolite and the composite sample are presented in Table 2.
Spodumene, which has a density range of 3.03–3.23 g/cm3, can achieve a product specification of 4.28% Li2O at a cut point of 2.9 g/cm3 with a relative Li2O recovery of 24.5%. However, the mass yield is only 13.0%. In comparison, at a cut point of 2.8 g/cm3, a product specification of 3.79% Li2O, with a mass yield of 45.9% can be achieved, with a relative Li2O recovery of 76.5%. Based on the density of spodumene, the optimum grade and recovery is expected at densities above 3.00 g/cm3. However, a cut point of 3.00 g/cm3, the sinks have a grade of 3.27% Li2O, with a recovery of 0.14%. These results indicate that spodumene is not sufficiently liberated, as the recovery of lithium is high only at a cut point of 2.8 g/cm3, but the grade achieved is only 3.79%. This indicates that the mineral still contains a significant amount of gangue at this size fraction. Therefore, further size reduction is required to improve liberation prior to any subsequent processing.
Lepidolite, which has a density range of 2.80–2.90 g/cm3, can achieve a product specification of 3.48% Li2O at a cut point of 2.8 g/cm3, with a relative Li2O recovery of 74.1% and mass yield of 54.1%. Based on the density of lepidolite, maximum recovery is expected at this cut point; however, the grade is not suitable for a preconcentrate for battery production. At cut points below and above this range, the Li grade and recovery are significantly reduced, except for a cut point of 2.9 g/cm3, which has a grade of 3.57% Li2O and a recovery of 2.24%. Since the deposit contains both lepidolite and spodumene, it is possible that there is a small degree of spodumene present within the lepidolite ore, which would account for the high lithium grade but very low recovery.
The composite can achieve a product specification of 4.59% Li2O at a cut point of 2.9 g/cm3; however, the relative Li2O recovery is 10.1% and the mass yield is 5.46%. At a cut point of 2.8 g/cm3, a product specification of 3.82% Li2O, with a relative Li2O recovery of 73.8% and a mass yield of 47.8% can be achieved.
Furthermore, the 2.5 g/cm3 floats for spodumene, lepidolite and the composite sample have an elevated lithium oxide content of 3.05%, 2.02% and 3.25%, respectively. This may be due to petalite present in the ore, which has a density of 2.4 g/cm3. However, this fraction only constitutes >1.0mass%, indicating that there are only small amounts of petalite present in the ores.
The results indicate that for spodumene and the composite sample, a cut point of 2.9 g/cm3 produces a higher grade at a lower recovery. However, at a cut point of 2.8 g/cm3, recoveries are significantly improved (>73%), although grade is then compromised. Therefore, pre-concentration performed at this size fraction requires subsequent processing, such as crushing, additional gravity separation, milling and flotation, to produce a concentrate suitable for battery production. Alternatively, pre-concentration via gravity separation at finer size fractions may also produce a better grade and further processing may not be needed.
Figure 5 and Figure 6 present the washability curves, and grade-recovery profiles for lepidolite, spodumene and composite samples. The washability curve, as shown in Figure 5, indicates that the highest mass yield (~54%) is achieved by lepidolite at a cut point of 2.8 g/cm3. Figure 6, which is the Li2O grade-recovery curve, shows that the maximum grade (~4.65% Li2O) is achieved by the composite sample at a cut point of 2.9 g/cm3. However, the grade of the composite samples is greater than the theoretical calculated grade, which is 3.93% Li2O. This indicates that the maximum %Li2O is actually achieved by spodumene at 4.28% Li2O, and the higher %Li2O content in the composite sample may be due to the nugget effect of spodumene. The nugget effect is a sampling problem that was first observed in gold, where the ore grade varies significantly due to valuable mineral existing as large particles or “nuggets” within the orebody [11]. Spodumene also exhibits the nugget effect as it often exists as large crystals in the ore [12]. This nugget effect may also explain why spodumene appears to be more liberated at coarser size fractions. However, the poor upgrade indicates that lithium is not actually well liberated as indicated by the size by assay analysis. As with all mineral processing techniques, the performance of heavy media separation is dependent on mineral liberation and gangue association [3]. A study performed by Gibson et al. [7], in which (DMS) was conducted with a feed containing ~1.34% Li2O at a size fraction of −7620 + 840 µm, achieved 6.11%Li2O and ~50% Li recovery. In comparison, the size fraction is smaller and narrower than the current research, indicating that grade and recovery may be improved at smaller size fractions and narrower size ranges. Furthermore, the head grade of spodumene and lepidolite is ~2.5% Li2O, which is significantly higher than the study performed by Gibson et al., indicating that a battery grade concentrate can potentially be produced if it is treated at the correct size fraction. It further demonstrates the advantage of gravity separation, as capital and operating costs for subsequent comminution and flotation are minimized. In addition, the DMS middlings, together with the −840 µm fraction, were subjected to flotation to improve recovery [7]. This highlights the importance of flotation in lithium beneficiation, as it assists in extracting valuable mineral from near density and fine material.

4. Conclusions

The head grade of spodumene and lepidolite are similar at 1.14% and 1.18%, respectively. The P80 of spodumene and lepidolite is 18.6 mm and 16.7 mm, respectively, suggesting that after crushing to −20 mm, spodumene is coarser than lepidolite, bearing a higher Si content. Lepidolite has a higher %Li between sizes −13.2 + 4.5 mm, and spodumene has higher %Li between −20 + 9.5 mm. This implies lithium is more liberated at smaller size fractions in lepidolite. Laboratory heavy liquid separation (HLS) testwork to evaluate amenability to upgrade via gravity separation showed some potential. Spodumene can achieve a product grade specification of 3.79%–4.28% Li2O, produced at product mass yield ranging between 13.0% and 45.9% and Li2O recoveries ranging between 24.5% and 76.5%. Lepidolite can achieve a product grade specification of 3.48% Li2O, produced at product mass yield of 54.1% and Li2O recovery of 74.1%. The composite sample can achieve a product grade specification of 3.82%–4.59% Li2O, produced at product mass yield ranging between 5.46% and 47.8% and Li2O recoveries ranging between 10.1% and 73.8%. The maximum %Li achieved for the composite sample is greater than both samples individually, which may be due to the nugget effect of spodumene. Therefore, the maximum %Li2O is achieved by spodumene at 4.28% Li2O. Both samples contain small amounts of petalite as the Li2O contents in spodumene and lepidolite in the 2.5 g/cm3 floats are 3.05% and 2.02%, respectively.
From this research, it can be deduced that HLS performed at wide size fractions leads to poor separation. Furthermore, since lithium bearing ores have a low %Li2O, spodumene and lepidolite are not sufficiently liberated at 100% passing 20 mm to produce a preconcentrate suitable for battery production. Spodumene may also appear more liberated when performing a size by assay analysis due to the nugget effect.
To improve Li2O grade, it is recommended that HLS be conducted at narrower size fractions, such as −10 + 1 mm, for both spodumene and lepidolite, as >6% Li2O was not achieved. Alternatively, flotation can be conducted at finer fractions, should the process prove economical.

Author Contributions

Conceptualization, N.M. and A.S.; methodology, N.M.; investigation, N.M. and A.S.; resources, N.M.; data curation, N.M. and A.S.; writing—original draft preparation, N.M.; writing—review and editing, A.S.; supervision, A.S.; project administration, N.M.; funding acquisition, N.M. All authors have read and agreed to the published version of the manuscript.

Funding

This research was funded by Salaria Pty Ltd.

Data Availability Statement

The datasets presented in this article are not readily available because the datasets are confidential and may only be distributed to a third party by the funder.

Acknowledgments

The authors would like to acknowledge Mintek for providing the facilities required and Salaria for funding this research and providing the resources needed to complete this research.

Conflicts of Interest

Nichole Maistry and Ashma Singh are employees of Mintek. The paper reflects their views based on their technical expertise and is endorsed by the company.

References

  1. Tadesse, B.; Makuei, F.; Albijanic, B.; Dyer, L. The beneficiation of lithium minerals from hard rock ores: A review. Miner. Eng. 2018, 131, 170–184. [Google Scholar] [CrossRef]
  2. Chen, P.; Lin, Z.; Tan, T.; Zhang, Y. Lithium-Ion Battery Development with High Energy Density. Highlights Sci. Eng. Technol. 2022, 27, 806–813. [Google Scholar] [CrossRef]
  3. Gibson, C.E.; Aghamirian, M.; Grammatikopoulos, T.; Smith, D.L.; Bottomer, L. The recovery and concentration of spodumene using dense media separation. Minerals 2021, 11, 649. [Google Scholar] [CrossRef]
  4. Garside, M. Lithium—Statistics & Facts. In Mining, Metals & Minerals; Statista: Hamburg, Germany, 2022; Available online: https://www.statista.com/topics/3217/lithium/#topicheader_wrapper (accessed on 4 May 2024).
  5. Gao, T.; Fan, N.; Chen, W.; Dai, T. Lithium extraction from hard rock lithium ores (spodumene, lepidolite, zinnwaldite, petalite): Technology, resources, environment and cost. China Geol. 2022, 6, 137–153. [Google Scholar]
  6. Abaka-Wood, G.B.; Acquah, G.; Owusu, C.K.; Addai-Mensah, J. A Review of Characterization Techniques and Processing Methods for Lithium Extraction. In Proceedings of the 7th UMaT Biennial International Mining and Minerals Conference, Tarkwa, Ghana, 30 July–1 August 2022; pp. 1–10. [Google Scholar]
  7. Gibson, C.; Aghamirian, M.; Grammatikopoulos, T. A Review: The Beneficiation of Lithium Minerals from Hard Rock Deposits; Society for Mining, Metallurgy & Exploration: Denver, CO, USA, 2017. [Google Scholar]
  8. Garret, D. Handbook of Lithium and Natural Calcium Chloride, Part 1; Elsevier: New York, NY, USA, 2004; pp. 1–235. [Google Scholar]
  9. Chesnutt, J.; Qafoku, N.; Kreuzer, R. Lithium Occurrence and Concentration Grade Around the Nation. 2023. Available online: https://www.pnnl.gov/main/publications/external/technical_reports/PNNL-35152.pdf (accessed on 3 April 2024).
  10. Maistry, N.; Singh, A. HLS Testwork on Spodumene and Lepidolite Samples to Determine Maximum Achievable Lithium Upgrade. In Proceeding of the MEI’s 8th Physical Separation Conference, Cape Town, South Africa, 10–12 June 2024; MEI Conferences. Available online: https://www.min-eng.com/physicalseparation24/drafts/session2/maistry.pdf (accessed on 15 November 2024).
  11. Morgan, C. Theoretical and Practical Aspects of Variography: In Particular, Estimation and Modelling of Semi-Variograms over Areas of Limited and Clustered or Widely Spaced Data in a Two-Dimensional South African Gold Mining Context. 2012. Available online: https://wiredspace.wits.ac.za/items/6fc3aadc-75d3-462f-9d04-edc500885e2c (accessed on 21 April 2024).
  12. Shanghai Metals Market. Galaxy Resources: Q1 Produces 41874 Metric Tons of Spodumene Concentrate. 2023. Available online: https://news.metal.com/newscontent/100921168/[SMM-News]-galaxy-resources:-q1-produces-41874-metric-tons-of-spodumene-concentrate (accessed on 11 May 2024).
Figure 1. As-received samples of (a) spodumene and (b) lepidolite.
Minerals 15 00396 g001
Figure 2. Particle size distribution of spodumene and lepidolite.
Minerals 15 00396 g002
Figure 3. Discrete Li grade across size.
Minerals 15 00396 g003
Figure 4. Li deportment per size fraction.
Minerals 15 00396 g004
Figure 5. Washability curves for lepidolite, spodumene and composite samples.
Minerals 15 00396 g005
Figure 6. Li2O grade-recovery vs. cumulative mass profiles for lepidolite, spodumene and composite samples.
Minerals 15 00396 g006
Table 1. Head grade analysis of lepidolite and spodumene.
Grade %
SampleAlCaCoCrCuFeLiMgMnNiPbSiTiVZn
Spodumene8.890.160.050.050.060.111.140.050.060.050.0534.20.050.050.06
Lepidolite12.10.120.050.050.050.051.180.050.120.050.0527.00.050.050.05
Table 2. Summary of laboratory HLS results.
SampleDensity (g/cm3)Relative Density (g/cm3) % Mass%Cum Mass % Grade Recovery %
DiscreteCumulativeDiscreteCumulative
LiLi2OLiLi2OLiLi2OLiLi2O
Spodumene+3.003.000.100.101.523.271.523.270.140.140.140.14
−3.00 + 2.902.9013.013.11.994.281.994.2824.524.524.624.6
−2.90 + 2.802.8032.845.91.673.601.763.7951.851.876.576.5
−2.80 + 2.702.7016.762.50.972.091.553.3415.315.391.891.8
−2.70 + 2.602.6020.282.70.310.671.252.695.935.9397.797.7
−2.60 + 2.502.5016.599.20.080.171.052.271.251.2599.099.0
−2.502.400.781001.423.051.062.271.051.05100100
Lepidolite+3.003.000.490.491.282.761.282.750.530.530.530.53
−3.00 + 2.902.901.602.081.663.571.573.382.242.242.772.77
−2.90 + 2.802.8052.054.11.623.491.623.4871.371.374.174.1
−2.80 + 2.702.7017.071.21.262.711.533.318.218.292.392.3
−2.70 + 2.602.6015.586.60.521.121.352.916.826.8299.199.1
−2.60 + 2.502.5013.399.90.080.161.182.540.840.8499.999.9
−2.502.400.091000.942.021.182.540.070.07100100
Composite+3.003.000.230.231.483.191.483.190.300.300.300.30
−3.00 + 2.902.905.235.462.164.652.134.599.839.8310.110.1
−2.90 + 2.802.8042.347.81.733.721.783.8263.763.773.873.8
−2.80 + 2.702.7018.065.81.192.551.613.4818.618.692.492.4
−2.70 + 2.602.6018.584.30.390.841.352.906.286.2898.798.7
−2.60 + 2.502.5015.499.70.070.151.152.470.920.9299.699.6
−2.502.400.301001.513.251.152.470.400.40100100
Disclaimer/Publisher’s Note: The statements, opinions and data contained in all publications are solely those of the individual author(s) and contributor(s) and not of MDPI and/or the editor(s). MDPI and/or the editor(s) disclaim responsibility for any injury to people or property resulting from any ideas, methods, instructions or products referred to in the content.

