Article

Indication of REEs, Fe, and Mn Composition Typomorphism of Calcite in Metallogenic Fracture Zones with Respect to Local Tectonic Stress Fields: A Case Study of the Qingshan Lead–Zinc Deposit in Northwest Guizhou, China

Southwest of Geological Survey, Geological Survey Center for Nonferrous Mineral Resources, University of Science and Technology, Kunming 650093, China
*
Authors to whom correspondence should be addressed.
Minerals 2025, 15(3), 292; https://doi.org/10.3390/min15030292
Submission received: 23 January 2025 / Revised: 6 March 2025 / Accepted: 11 March 2025 / Published: 13 March 2025
(This article belongs to the Section Mineral Geochemistry and Geochronology)

Abstract

:
The Qingshan lead–zinc deposit is one of the typical deposits in the Weining–Shuicheng metallogenic belt in the northwest Guizhou mining area. This deposit is strictly controlled by tectonics, making it highly distinctive. This study used the REE, Fe, and Mn typological characteristics of calcite in the NE mineralization fault zone of the Qingshan lead–zinc deposit in Guizhou to trace the source of ore-forming materials and the local structural stress field characteristics of the fault. Through comprehensively applying structural analysis and LA-ICP-MS technology, the mechanical properties of the fault were analyzed and the REE characteristics of calcite, as well as the variation laws of Fe and Mn, were studied. The results of this study reveal that NE-trending mineralization faults controlled the production of gently inclined ore bodies; the distribution patterns of REEs in the three types of calcite are all “negative Eu-weak negative Ce-right skewed”, with the REE content in calcite near the ore body being significantly increased; furthermore, the variation pattern of Fe and Mn elemental contents in calcite indicate the local stress field characteristics of the ore-forming fault zone. The local opening space of NE-trending compressional and torsional ore-forming faults (where the dip angle slows down) is favorable for the nucleation of mineralized veins. With this study, we therefore improve knowledge regarding the relationships between tectonic stress fields and mineral exploration, serving as a potential source for the prediction of sites that are suitable for the exploitation of tectonic stress fields for mineral exploration, and show that mineral prediction is conducive to achieving the sustainable development of mines.

1. Introduction

The Qingshan lead–zinc deposit is a typical medium-sized deposit in the Weining–Shuicheng metallogenic subzone of the Northwest Guizhou mining concentration area, with an average Pb+Zn grade of about 30%, and is strictly controlled by the tectonic structure. In order to realize the sustainable production of this deposit, it is especially important to find and predict ores, and so, the role of tectonic control has always been the characteristic difficulty in research on this deposit. The germanium-rich lead–zinc deposits in the Northwest Guizhou mining area formed in the NE tectonic belt, and the main ore-control structure is “Normal fault-Anticline” [1]. The Qingshan Pb–Zn deposit was mainly subjected to NW main compressive stress in the late Indo-Chinese and early Yanshan (mineralization periods), which led to interlayer sliding of the strata in the south and west flanks of the Weishui backslope. The ore-forming fluids were thus transferred at shallow depth on the footwall of the main control faults and penetrated into the derived WNW-striking fracture zones. The WNW-oriented fracture-controlled ore body has been gradually clarified according to the formation of a capsule and massive ore body with an extension greater than the depth [2]. However, the spatial distribution and scale of the newly discovered Pb–Zn-bearing veins controlled by the NE-directed fractures are obviously different from those of the WNW-directed fractures. Therefore, this study was conducted to better understand the tectonic setting of the mineralized veins associated with the NE-striking fracture as well as to provide information about an ore deposit of potential interest for exploitation. Calcite is the most prevalent gangue mineral in mineral deposits. Under varying stress conditions, the orientation of calcite grain growth frequently differs, and this grain growth orientation can serve as an indicator of the principal compressive stress direction within the local stress field [3]. In the field work, when the minerals (e.g., calcite, quartz, and other gangue minerals, as well as sphalerite, galena and other ore minerals) within the fracture are of small particle size, homogeneous. and dense, it is not easy to observe the growth direction of the mineral grains. Han R.S. et al. [4] have pointed out that “the metallogenic tectonic system controls the mineralization system, and the mineralization system maps the tectonic system”. Tracing the characteristics of local stress fields based on the typomorphic characteristics of hydrothermal calcite in the lead–zinc metallogenic system utilizing the geochemical analysis method and laser ablation inductively coupled plasma mass spectrometry (LA-ICP-MS), the characteristics of rare earth elements in calcite were employed to trace the source of the ore-forming materials and discern their association with mineralization. Furthermore, according to the content variation characteristics of Fe, Mn, and other trace elements in calcite, the growth direction of the calcite grains was inferred, further proving the mechanical properties and stress types of ore-forming faults, as well as providing theoretical support for prospecting and exploration.
Therefore, this study focuses on characterization of the germanium-rich lead–zinc deposit in Qingshan, in order to describe the composition of calcite related to mineralization within the NE-trending fracture. We analyzed the geochemical REE composition of the three types of calcite found in association with the mineralization and their relationships with the ore deposit. This allowed us to decipher the local stress field characteristics of the ore-forming fracture sites on the basis of the Fe and Mn variations, revealing the mechanism controlling the growth of calcite along the fractures.

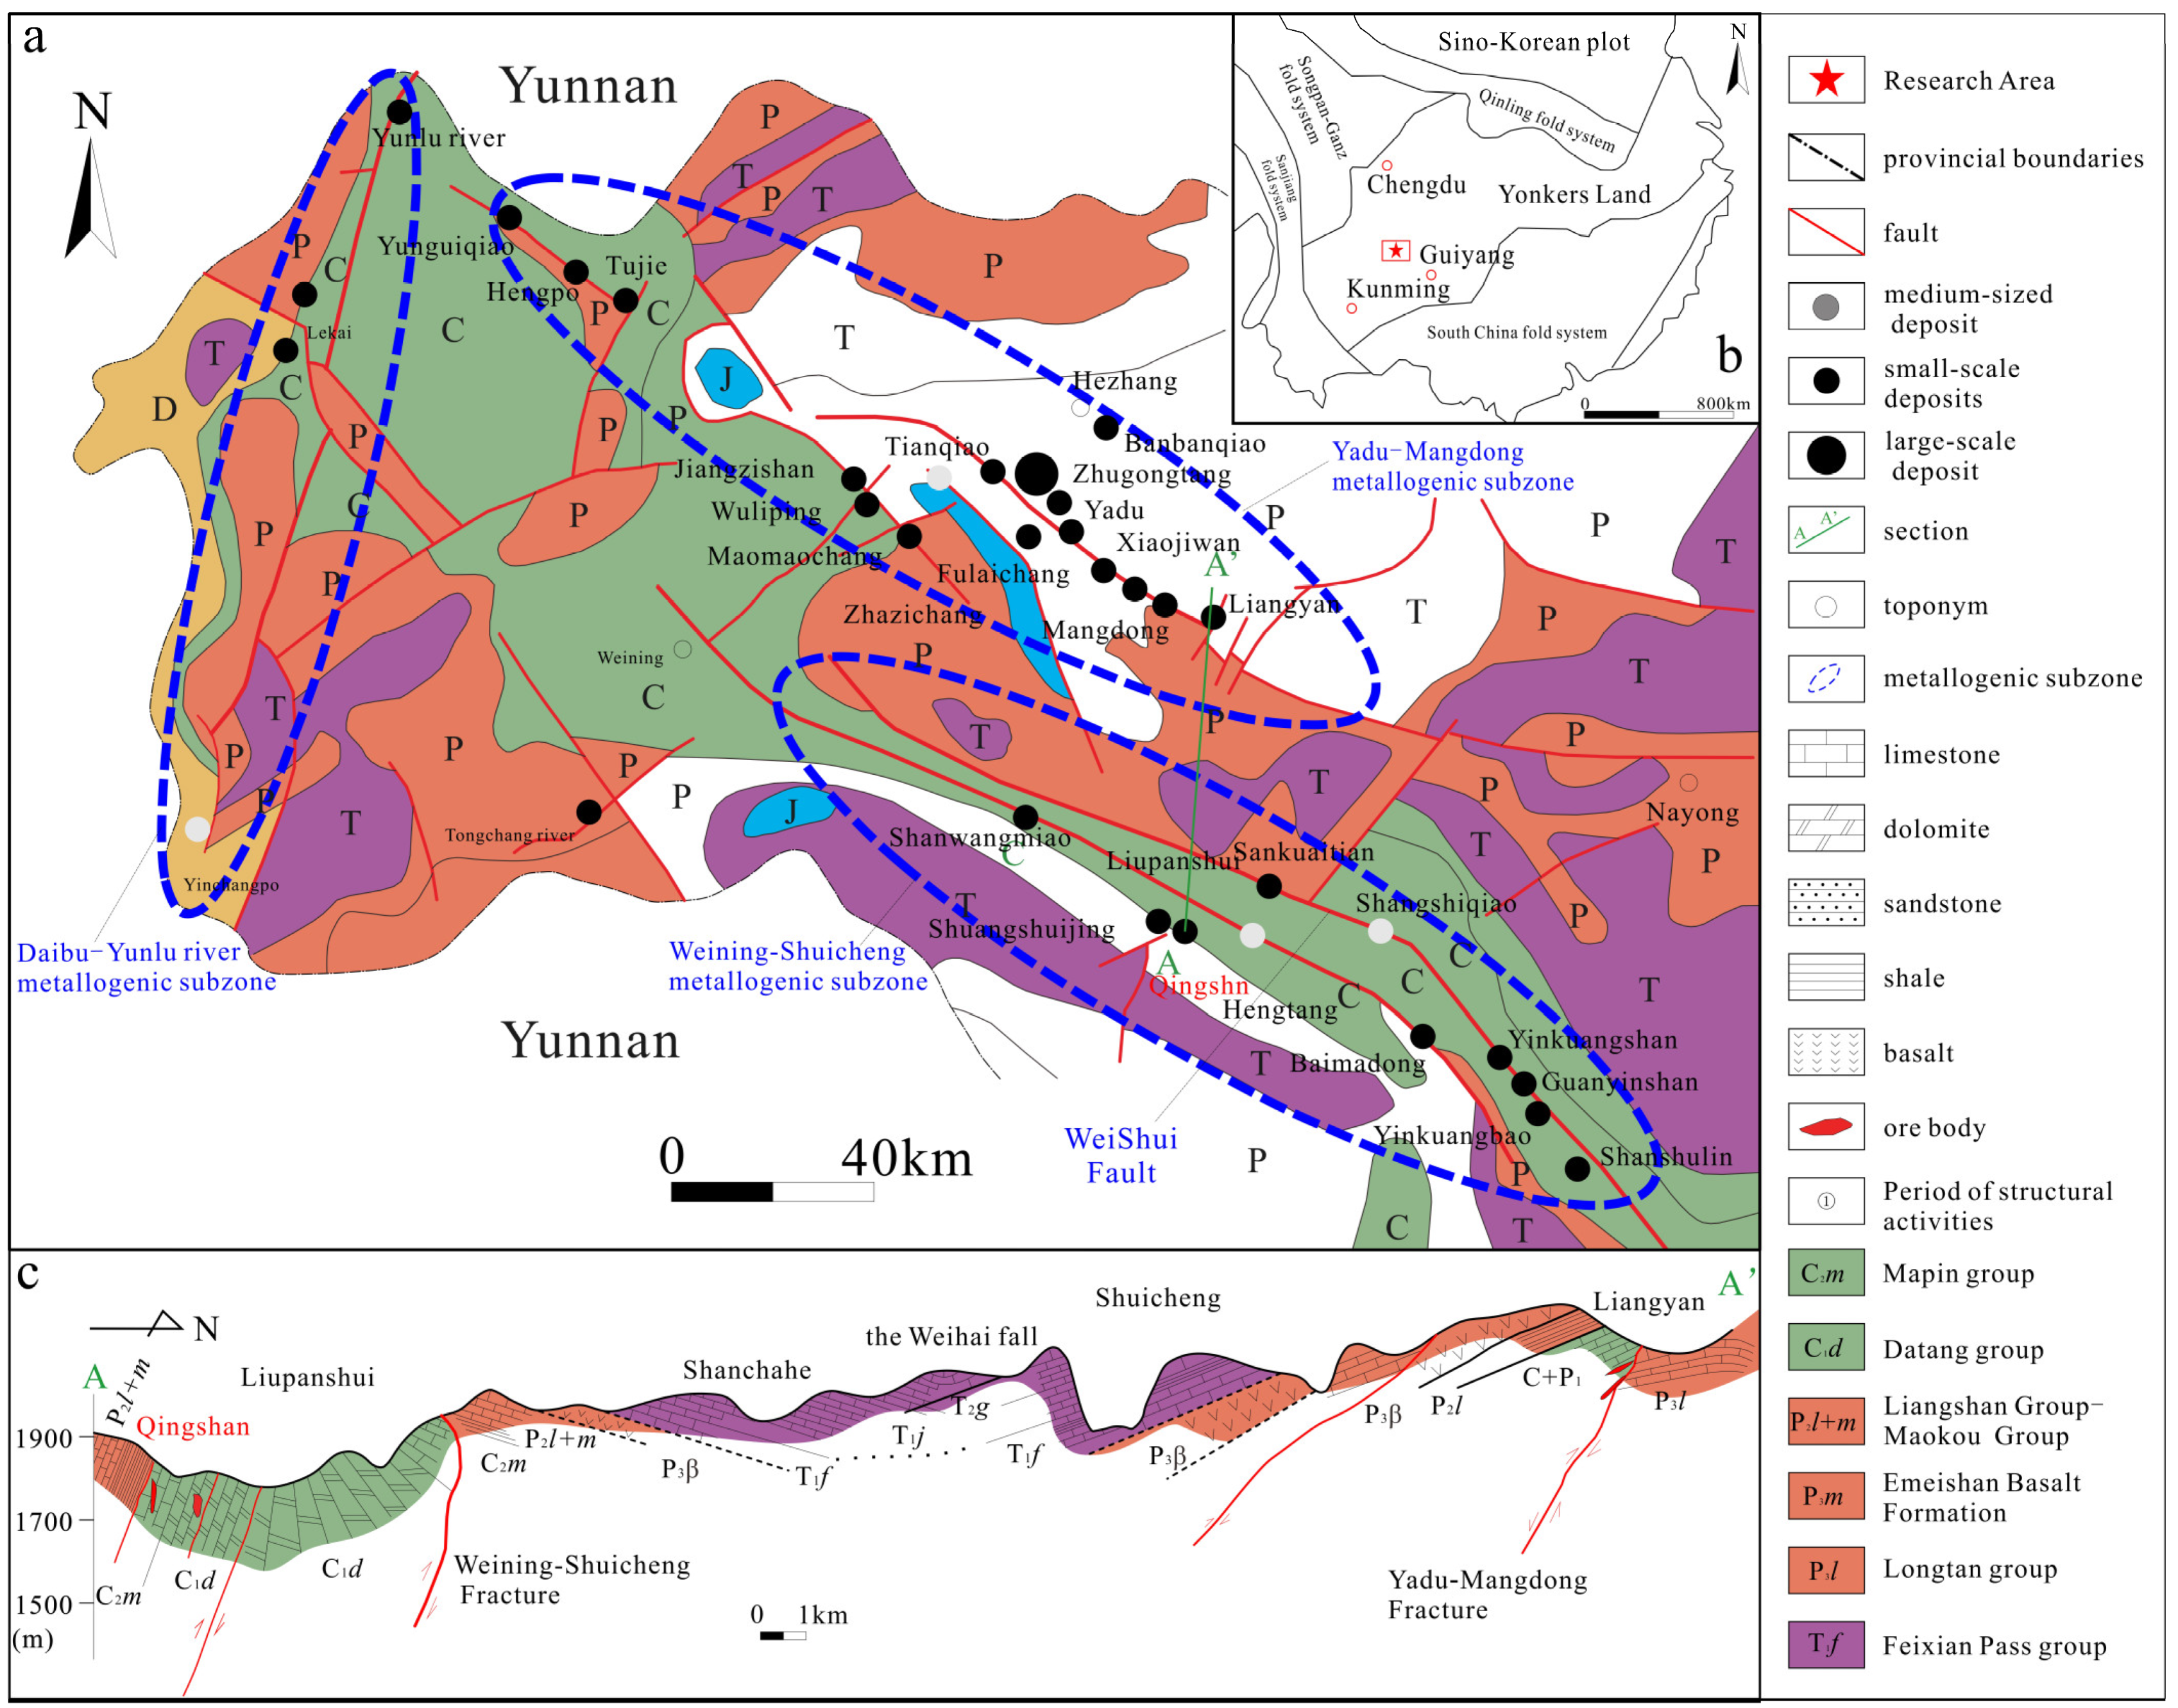
2. Regional Geological Features

The Northwest Guizhou Mining Aggregate is located on the east side of the triangle enclosed by the Xiaojiang, Ziyun–Yadu, and Mile–Shizong fracture zones (see Figure 1), and it is an important part of the lead–zinc polymetallic metallogenic area in the area bordering Sichuan, Yunnan, and Guizhou [1]. Due to its unique tectonic background and metallogenic–geological conditions, it has become one of the most important lead–zinc and other polymetallic-producing areas in China.
The geologic periods of outcrops in the area are mainly Silurian, Devonian, Carboniferous, Permian, Triassic, Jurassic, and Cretaceous, with carbonate rocks as the main lithology followed by sandstones and shales, and Permian Emeishan Basalt is found throughout the area [5]. The ore-endowed stratigraphy is characterized by “multilayered position” and “older to in the northwest and younger in the southeast” [6]. The term “multilayered” refers to the fact that the rocks hosting the mineralization include Devonian limestone, Carboniferous limestone/dolomite, and Permian sandstone/shale. The lithology of ore-bearing strata is mainly dolomite, followed by dolomitic limestone and limestone in the Qingshan lead–zinc deposit.
The tectonic development in the area can be divided into three main tectonic zones: the Yadu–Pythonkou folded tectonic zone, the Weining–Shuicheng compact folded tectonic zone, and the Yinchangpo–Yunluhe folded tectonic zone [1,7]. The ore deposits formed along the main regional axial plane foliation developed in association with the NE–NNE and NW folds. The representative deposits in the area include the Zhugongtang, Yinchangpo, Tianqiao, Xiaojiwan, Qingshan, and Shanshulin deposits. The Qingshan Pb–Zn deposit described in this study is located in the Weining–Shuicheng metallogenic subzone (Figure 1).
Only two types of magmatic rocks—Emeishan basalt and gabbro—are exposed in the area. Huang Z.L. et al. [8] suggested that Pb–Zn mineralization is closely related to Emeishan basalt; however, the two may only be spatially related and not biologically related [9] (Li Bo, 2012). More than 70 gabbroic veins have been found in the area, with magmatic ages of 283–246 Ma and 158–111.5 Ma [6].
Figure 1. (a) Geologic map of the area of the Northwest Guizhou Mineral Fields. (b) Sketch map of the location of the study area. (c) A-A′, geological profile (modified from Jin Zhongguo, 2008) [6].
Minerals 15 00292 g001

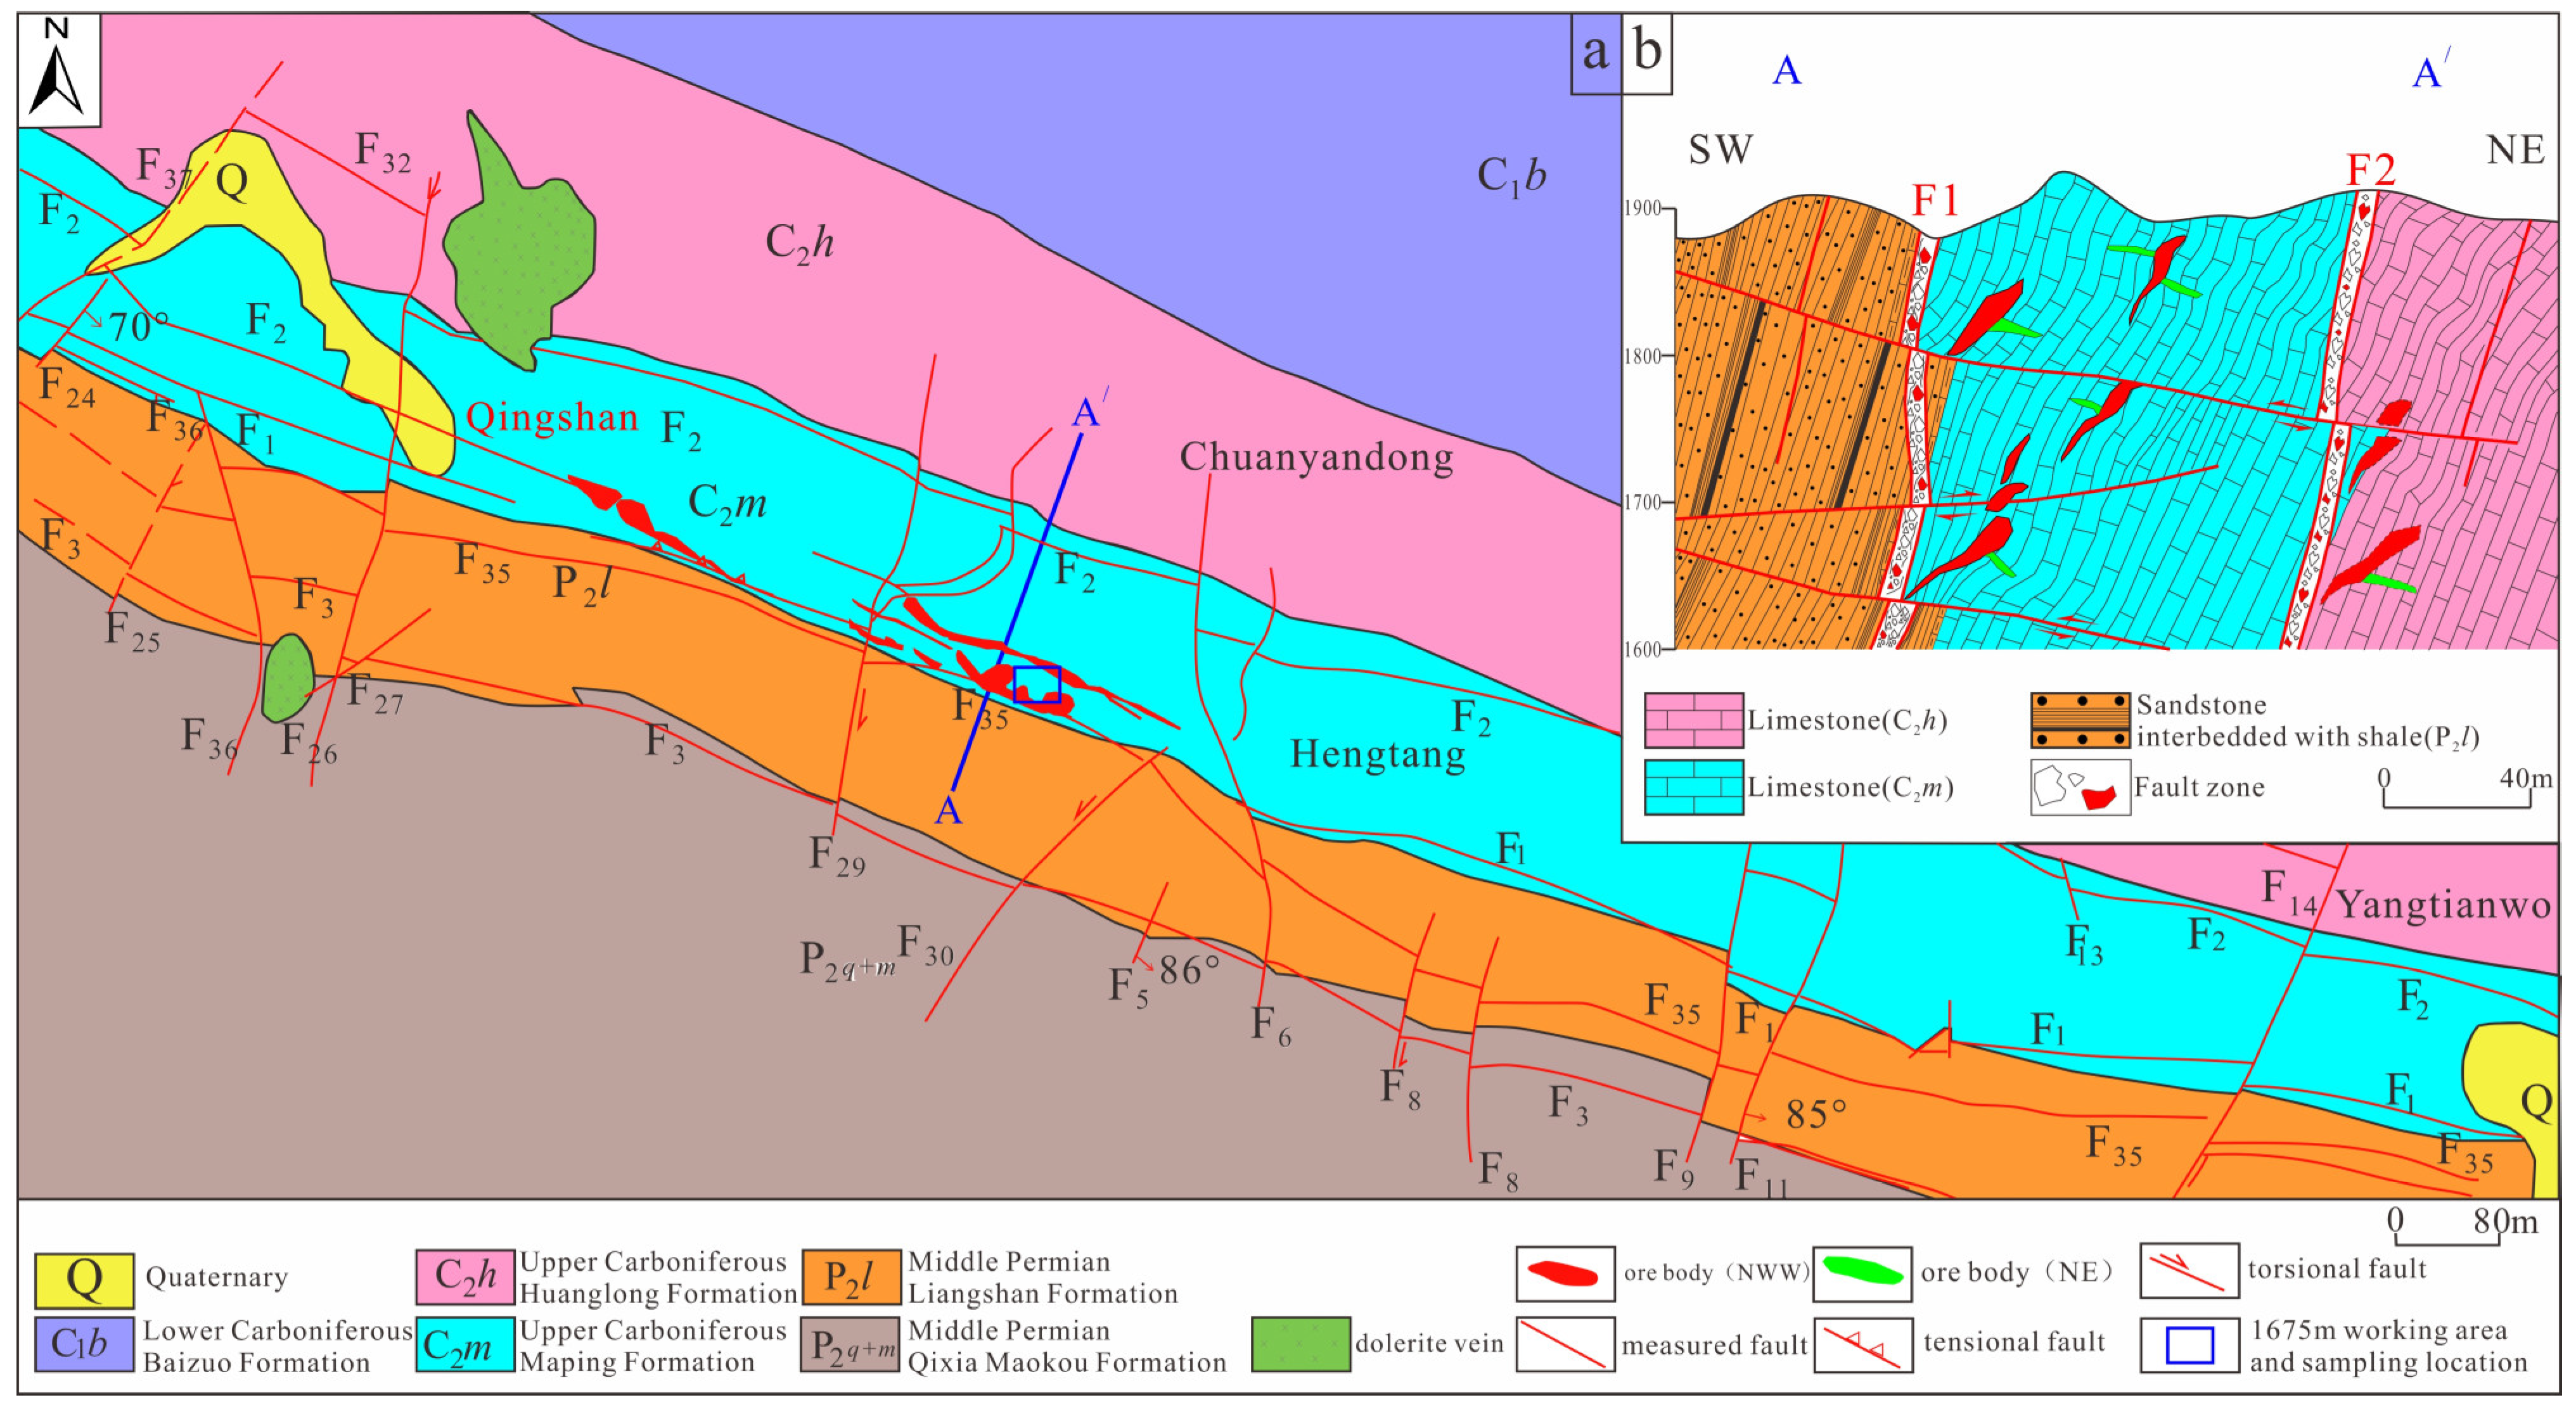
3. Geological Characteristics of the Ore Deposit

The Qingshan lead–zinc deposit is located at the southwest edge of the Weishui Fault Basin, where a series of NW-directed tight folds and NW-directed, NE-directed, and WNW-striking fractures are developed. The host rock exposed in the mining area includes (Figure 2) the Lower Carboniferous Pizuo Formation (C1b) dolomitic limestone, Upper Carboniferous Huanglong Formation (C2h) limestone, Upper Carboniferous Maping Formation (C2m) limestone, Middle Permian Liangshan Formation (P2l) argillaceous sandstone and carbonaceous shale, Middle Permian Qixia Maokou Formation (P2q+m) limestone, Upper Permian Emeishan Basalt Formation (P3β) basalt, Upper Permian Longtan Formation, and Dalong Formation (P3l+d) muddy sandstone and carbonaceous shale. The bedding strikes toward NW, and the dip is generally steep. The ore body mainly developed in the Maping Formation, into NWW- and NNE–NE-oriented fractures. The main control fractures F1 and F2 are a group of NWW interlayer fractures which are generally consistent with the bedding, dipping 75–85° toward SW. The main ore body is endowed in the backslope and interlayer fractures are derived from the footwall of F1 (Figure 3). The style of the ore-controlling structure of this deposit has the same direction as the “Normal faults–Anticlines” combination [1].
The ore body strikes between NW 75 and 80°, tends to SW, and ambles laterally towards SE. The extension direction of the main ore body is consistent with the NWW-oriented fractures and strata, with extension greater than the depth. The ore body is massive, sac-like, brecciated, and vein-like and is mainly produced in the void space of the NW and NE secondary fractures and dorsal slopes derived from the footwall of F1. The ore is dominated by sulfide ores (galena, sphalerite), with minor oxide minerals. The ores are mainly blocky, brecciated, banded, vesicular, and honeycomb. The mineral composition is relatively simple, and the main minerals are galena, sphalerite, pyrite, calcite, and dolomite. The minor minerals include fluorite, barite, and limonite, among others.
The alteration types of the surrounding rocks of the Qingshan lead–zinc deposit are mainly divided into carbonatization, pyritization, silicification, chloritization, and barite. The carbonatization is dominated by calcite, accompanied by dolomitization.

4. Sample Collection and Test

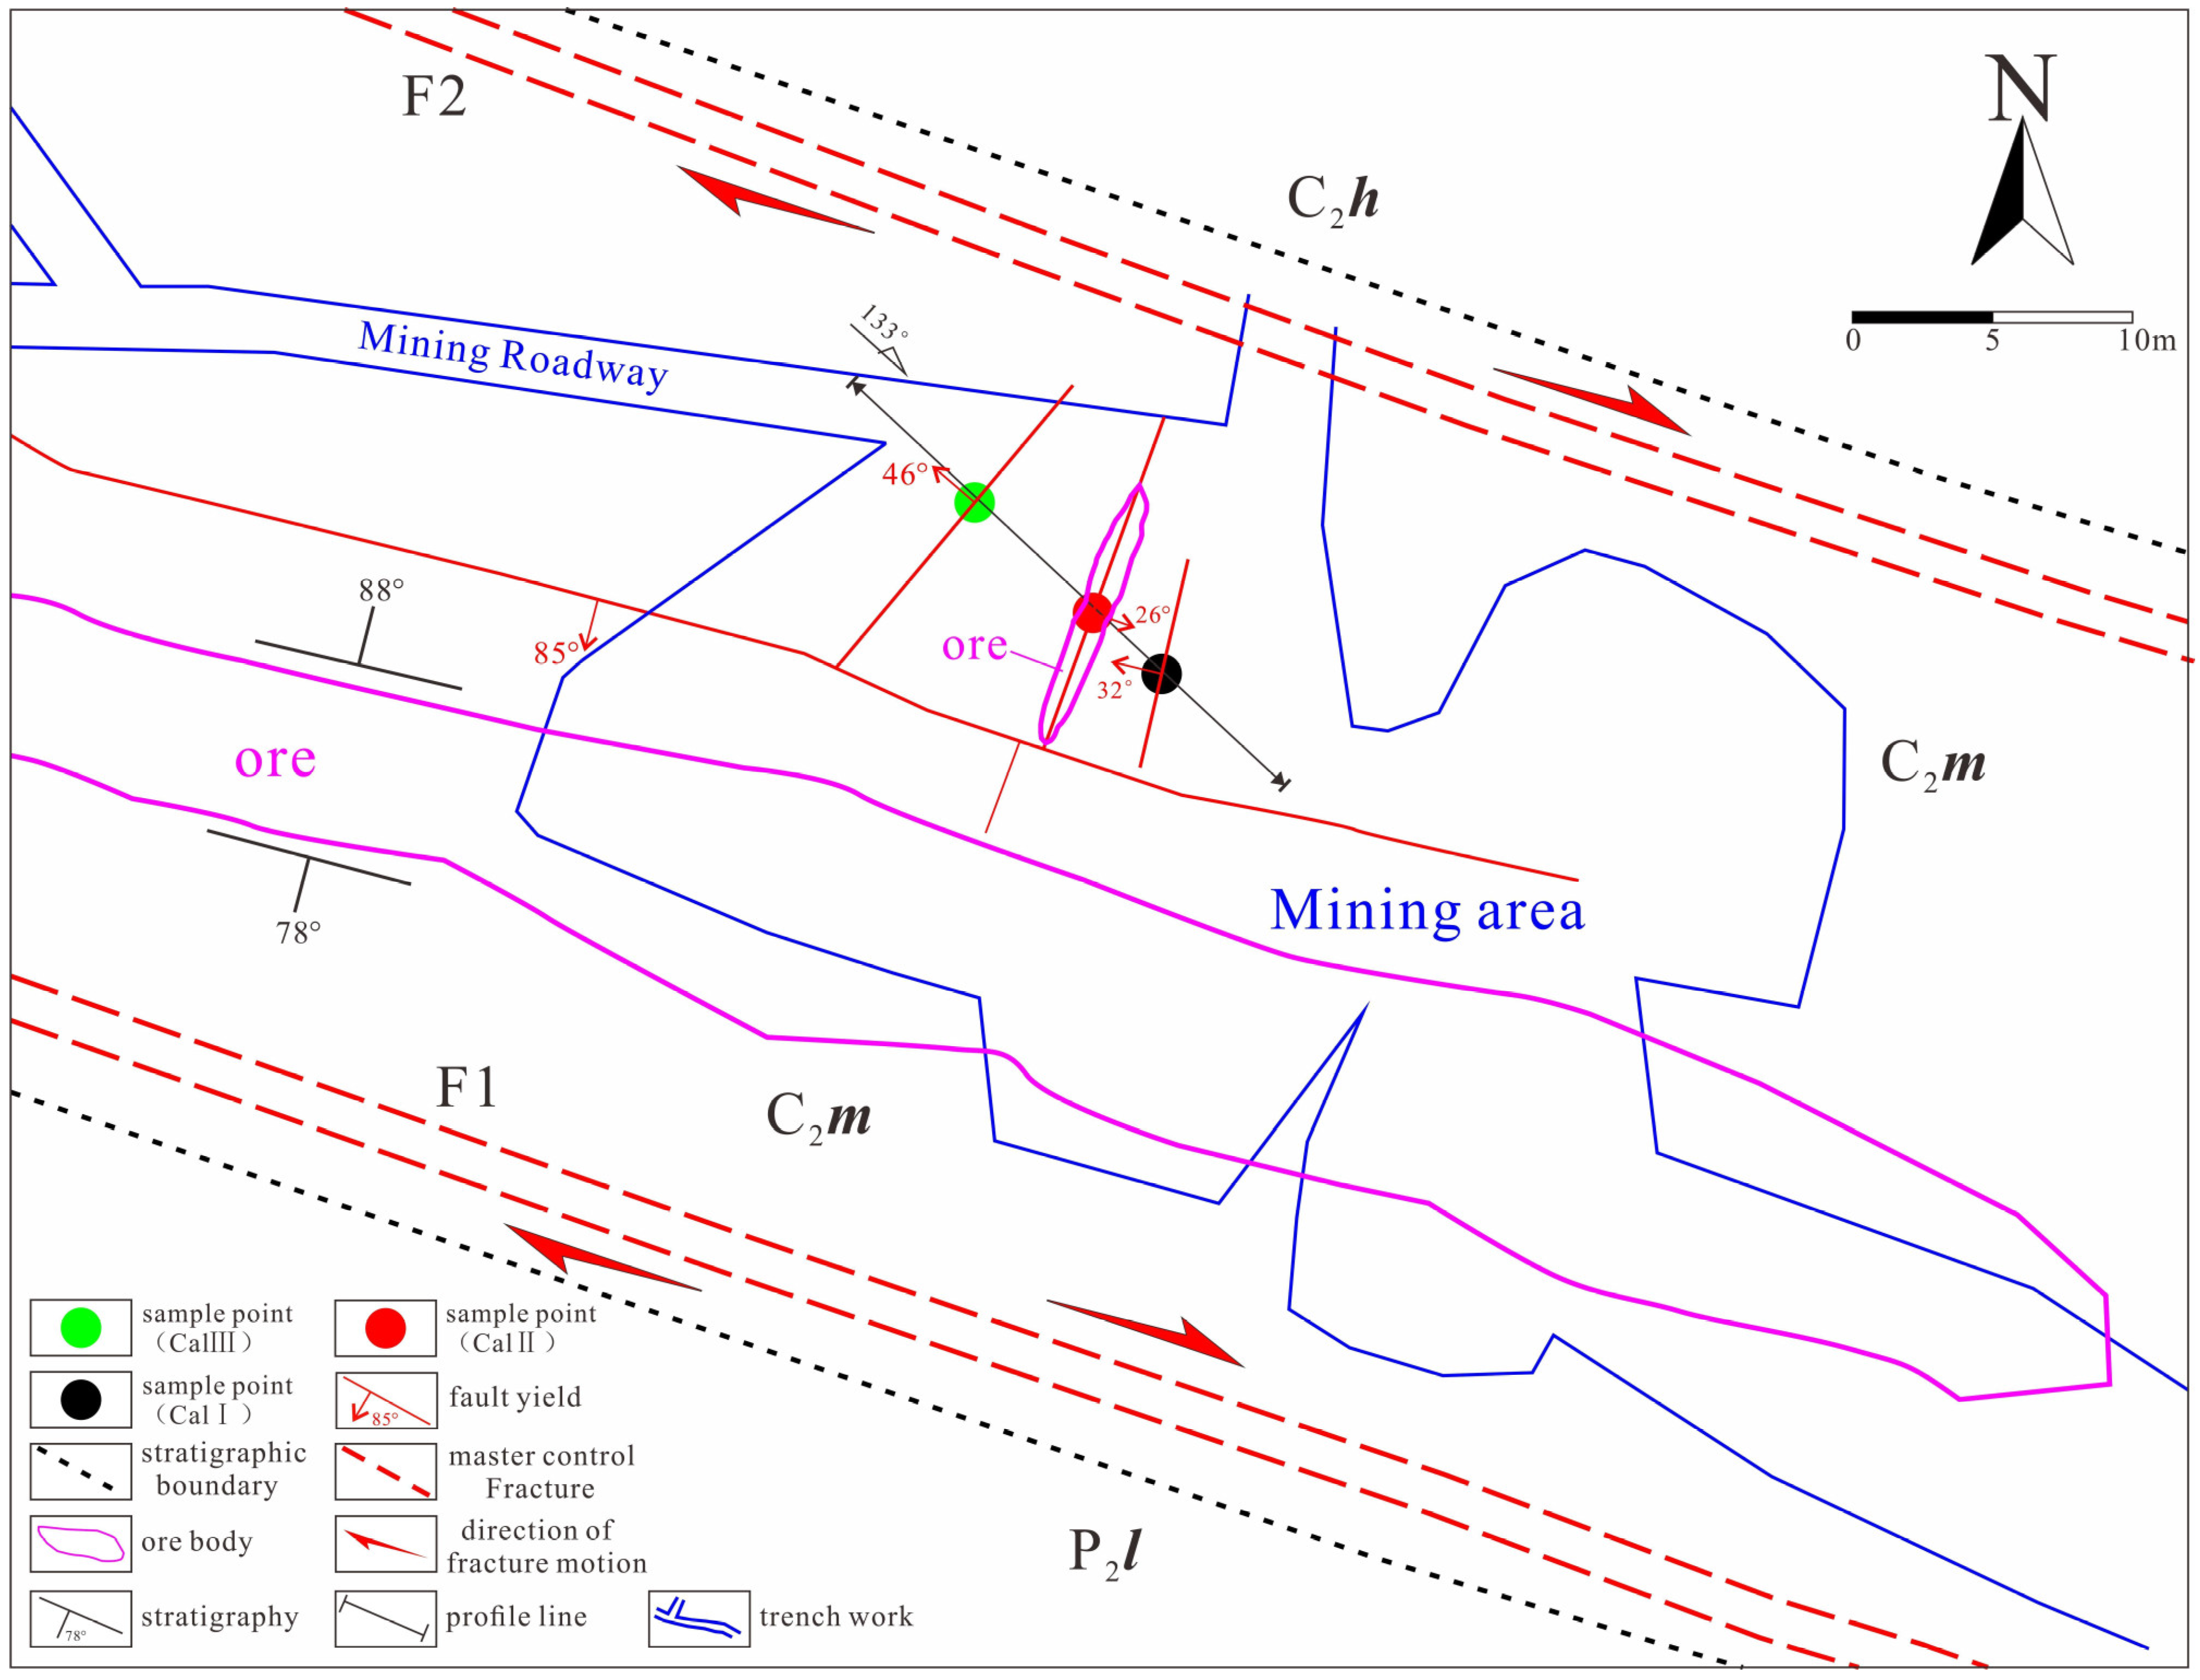
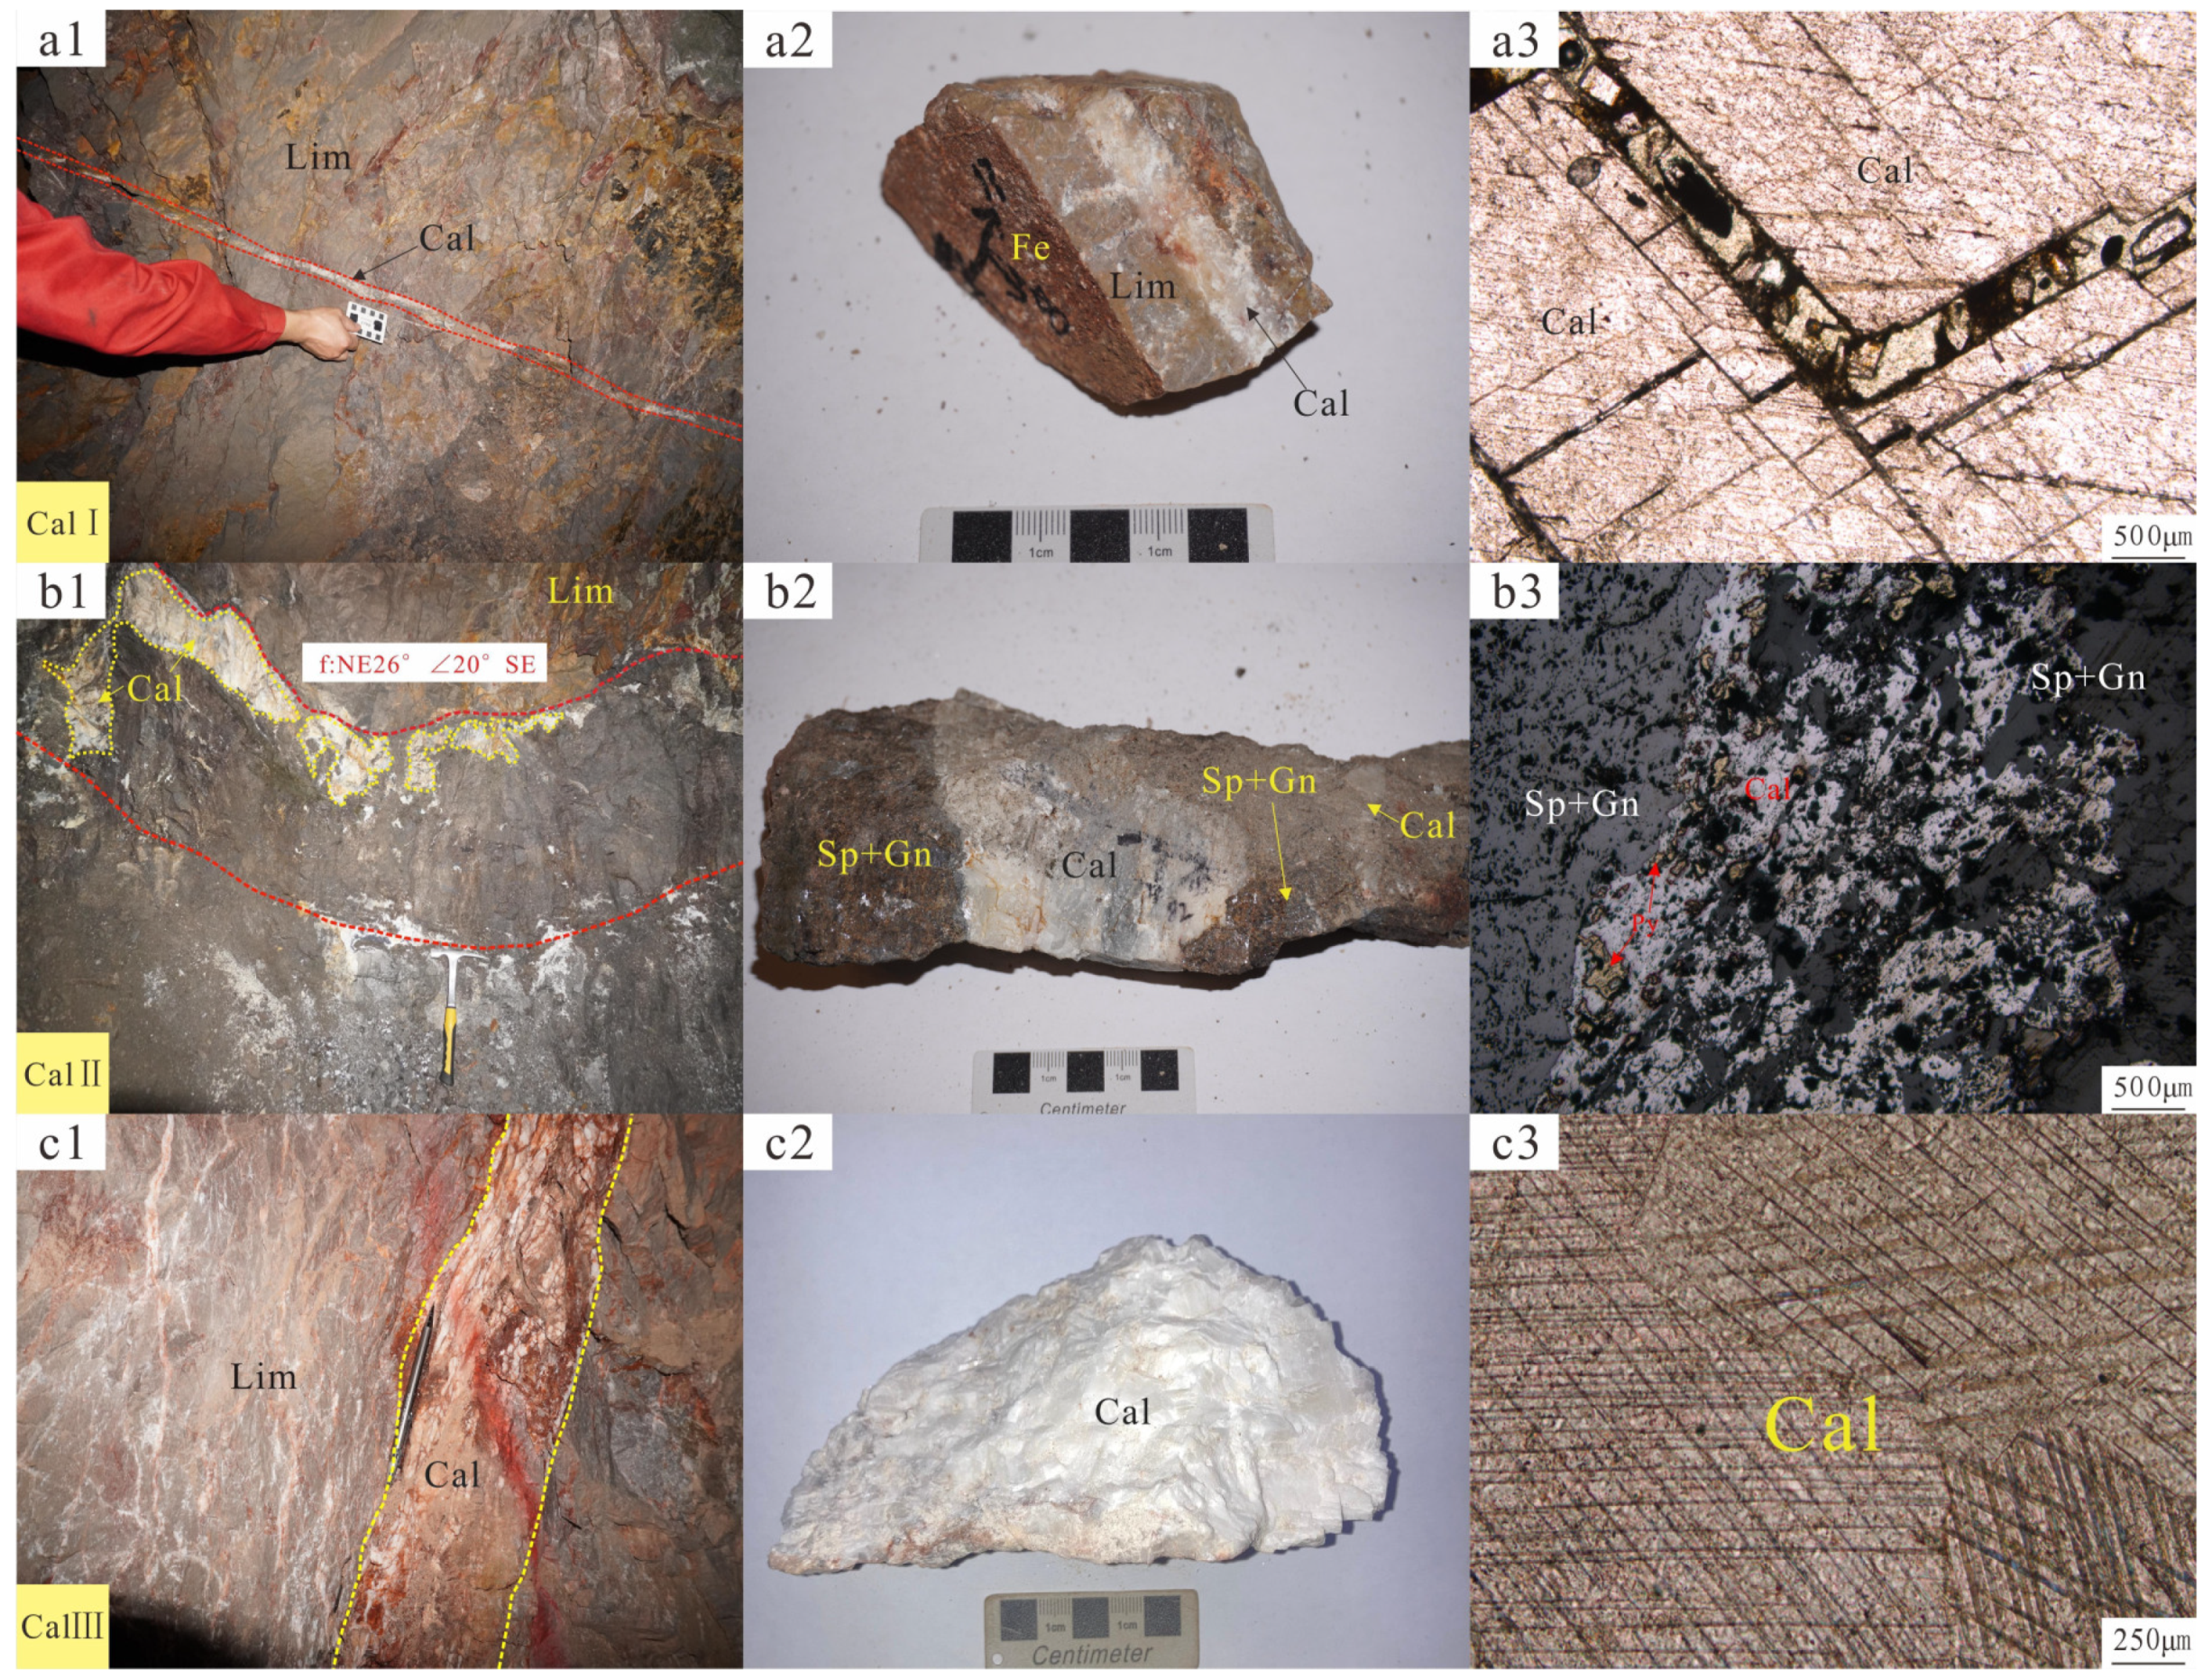
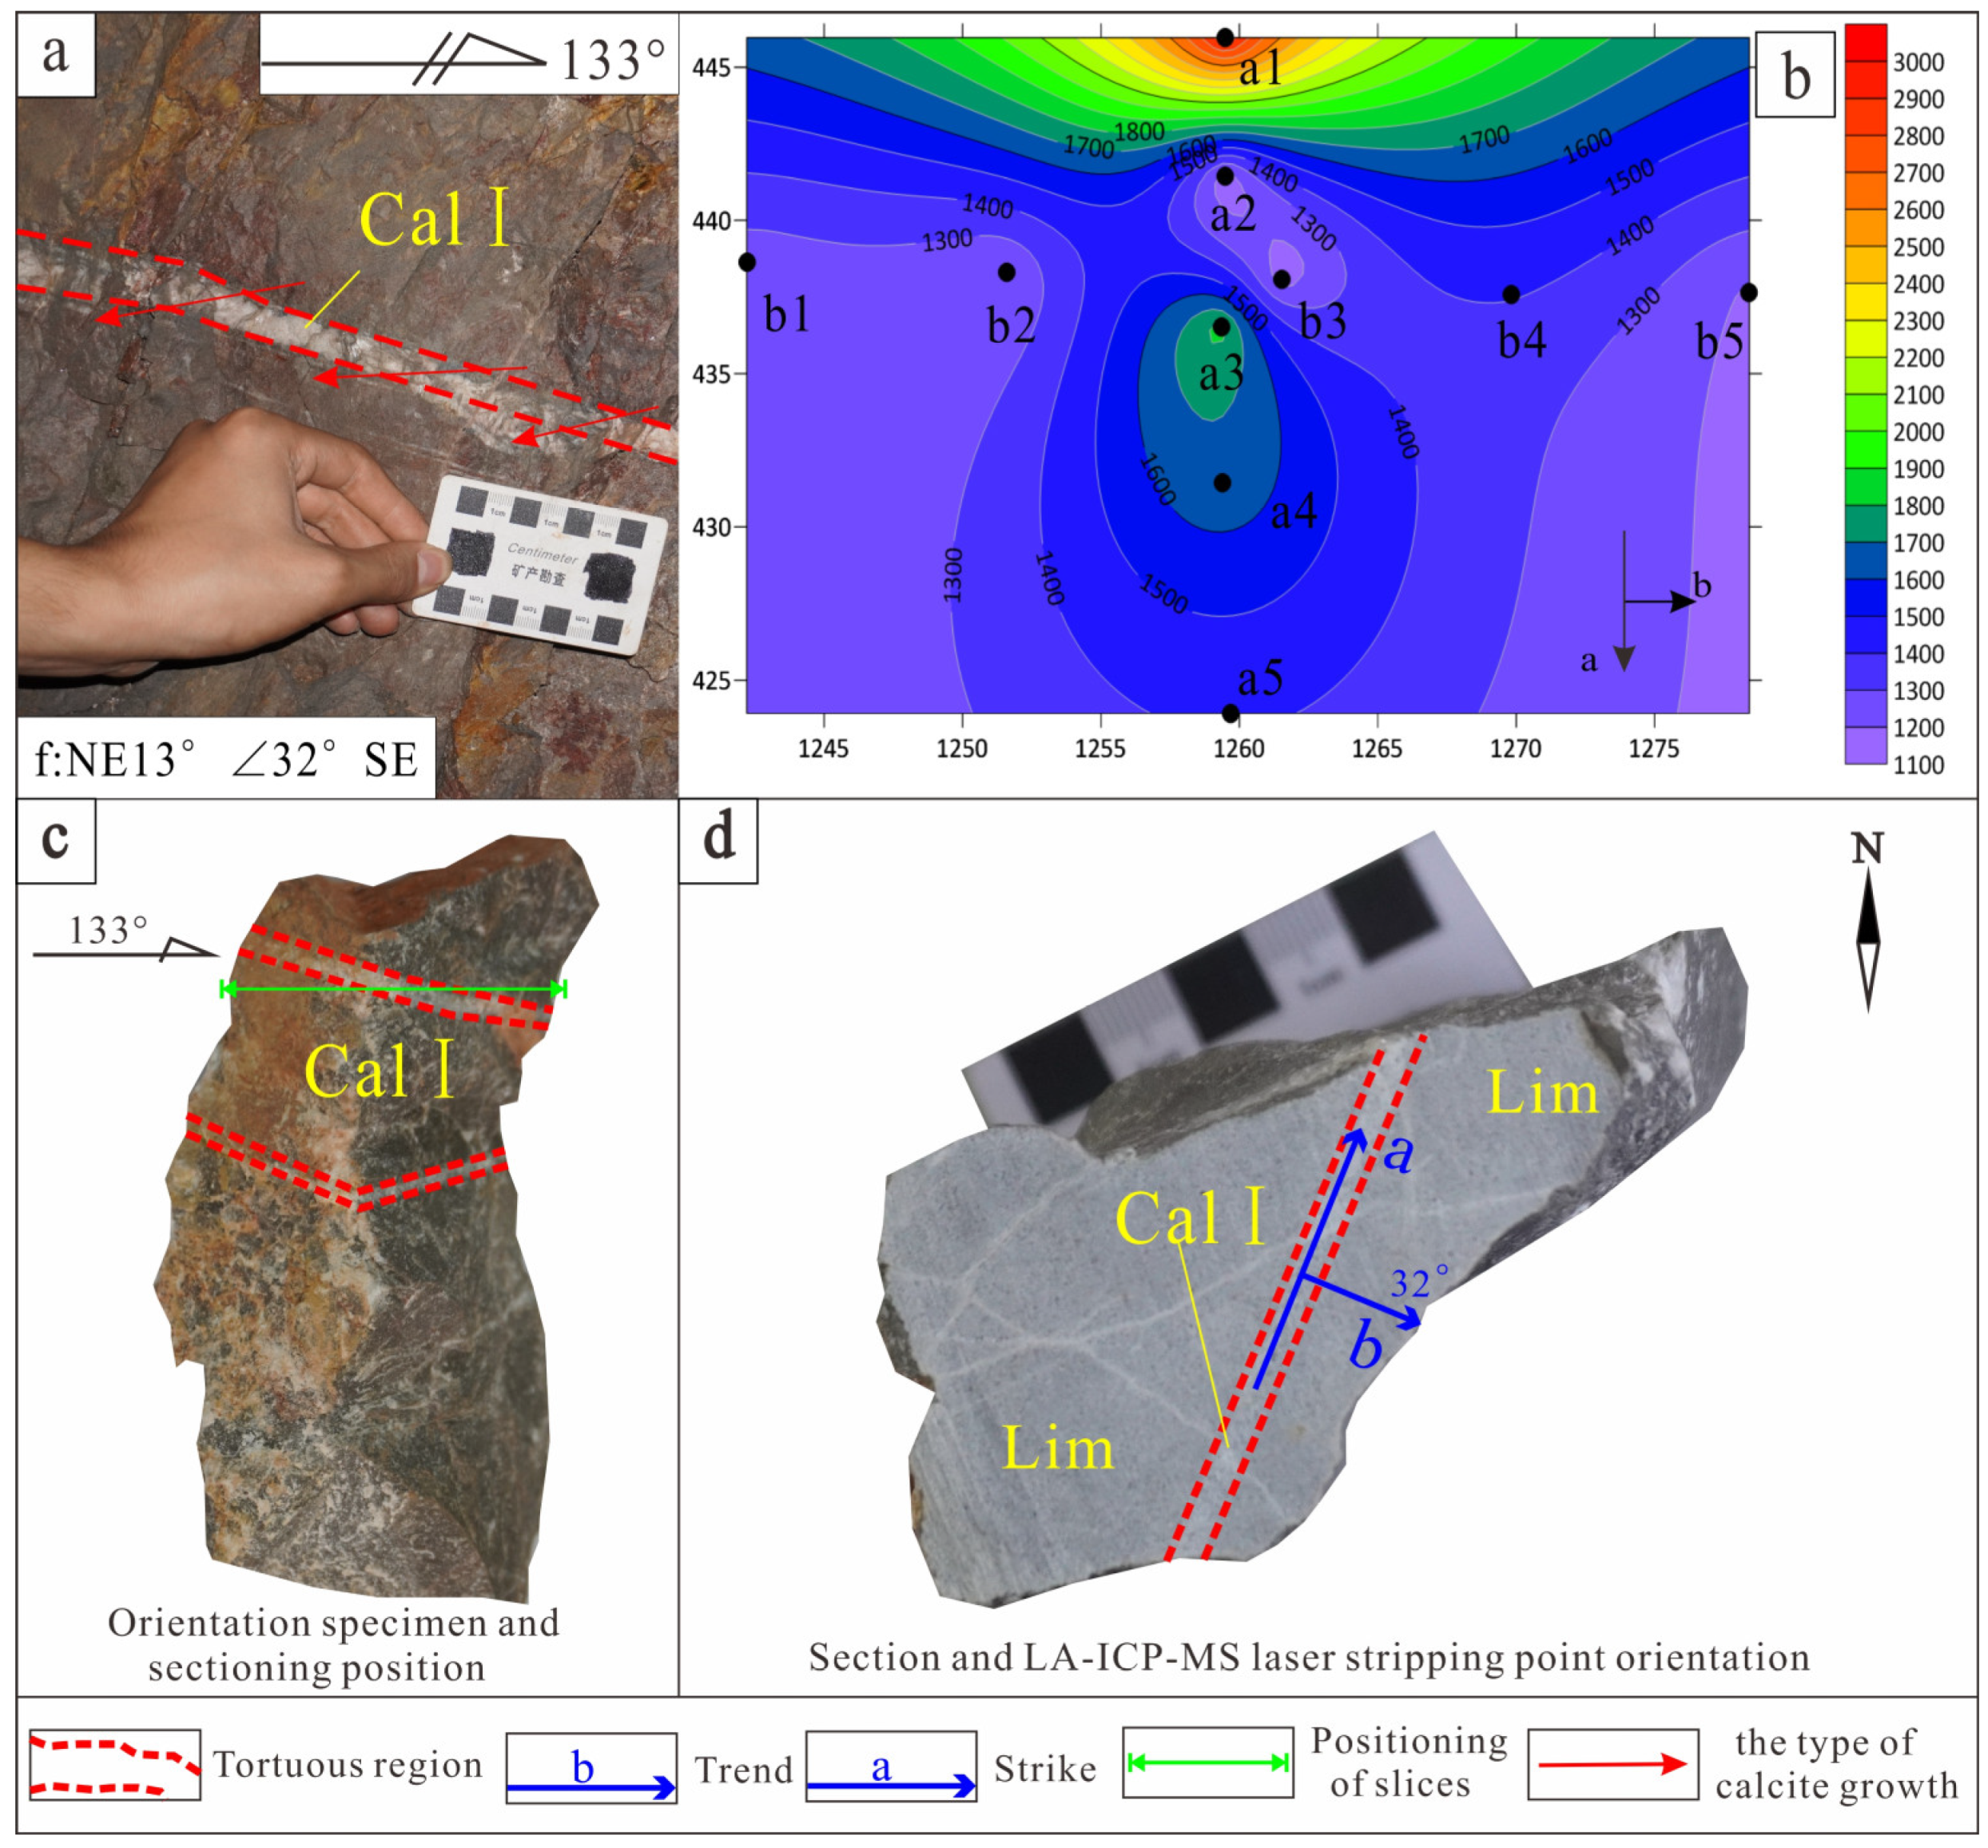
4.1. Sample Collection and Description

Eight calcite samples were collected in the main inclined shaft of the Qingshan lead–zinc deposit, which are calcites from three sectors of the NE-trending fault in the metallogenic belt and representative of the three main stages of activity: torsion, tension, and compression (Figure 4, Table 1).
The different generations of calcite observed along the fault were divided into three types, according to the geological setting and the microscale features: early metallogenic stage (CalI), main metallogenic stage (CalII), and late metallogenic stage (CalIII).
CalI appears as white and flesh-red veinlets (Figure 5(a1–a3)) with a width of about 0.3–0.5 cm, usually extending for several meters along the strike and partially broken by secondary joints. Reddish-brown iron and lead–zinc ore veinlets can be seen on both sides of the calcite vein, which are associated with it.
CalII is white and light yellow, agglomerate or comb-like (Figure 5(b1–b3)), and occasionally wrapped by galena, sphalerite, and pyrite breccia. The calcite and ore body in the fault zone present obvious zonation, and the surrounding rock shows iron impregnation and strong alteration which is visible to the naked eye.
CalIII appears as white strips (Figure 5(c1–c3)) with a width of about 15–20 cm. It occasionally cuts lead–zinc ore bodies/veins. In terms of space, the following holds: CalII → CalI → CalIII in a gradual manner in terms of distance from the ore body.

4.2. The Mineral Assemblage at the Microscale

Three types of calcites were identified by optical microscopy (Figure 5): CalI (Figure 5a), from the early metallogenic stage, is a hypidiomorphic–xenomorphic Cal with developed cleavage inside, is filled with xenomorphic Gn and Sp along the cleavage, and transmits light; CalII (Figure 5b), from the main metallogenic stage, is a xenomorphic Cal that coexists with hypidiomorphic Gn, Sp, and Py and reflects light; CalIII (Figure 5c), from the late metallogenic stage, is a euhedral Cal with a double crystal grain parallel to the long axis of the calcite rhombic cleavage, which transmits light.

4.3. Sample Test

First, all the samples were numbered and cleaned, and eight thin sections and eight laser sections were prepared. The sections were observed with an optical microscope in order to distinguish different mineral assemblages and related microstructures. In situ trace elements of calcite were then analyzed via LA-ICP-MS at Guangzhou Tuoyan Analytical Technology Co., Ltd., Guangzhou, China. A New Wave research 193 nm ArF excimer laser-ablation system was used in the laboratory in combination with a Thermo Scientific iCAP RQ Quadrupole (Thermo Fisher Scientific (China) Co., Ltd., Shanghai, China.) inductively coupled plasma mass spectrometry (ICP-MS) system. The raw isotope data were reduced using the 3D Trace Element data reduction scheme (DRS) in IOLITE software (version and model number: iolite v4) [10]. In IOLITE, user-defined time intervals are established for the baseline correction procedure in order to calculate session-wide baseline-corrected values for each isotope. Details of the used analytical techniques were previously provided by Liu et al. [11] and Chu et al. [12].

5. Results

5.1. Analysis of the NE Fault Structure

The lead–zinc mineralization of this deposit is a consequence of the mineralization response to the closure of the Paleo-Tethys Ocean, which was triggered by the collision of continental blocks during the late Indosinian period. The mineralization occurred under the influence of principal compressive stress directed northwestward [2]. The NE-trending faults studied in this study are a group of nearly parallel sliced faults on the plane. During the metallogenic period, the mechanical properties are generally left lateral, compressional, and torsional, derived from the right lateral torsion of the WNW-trending bedding faults, and belong to the fourth-grade ore-controlling structure of the deposit. Due to the change in dip angle, strike, and other occurrences, the local stress field in different positions of the fault zone changes, thus showing different mechanical properties. Three parts (different local stress fields) in the NE-trending fault zone are selected for analysis. The plane position is shown in Figure 4.

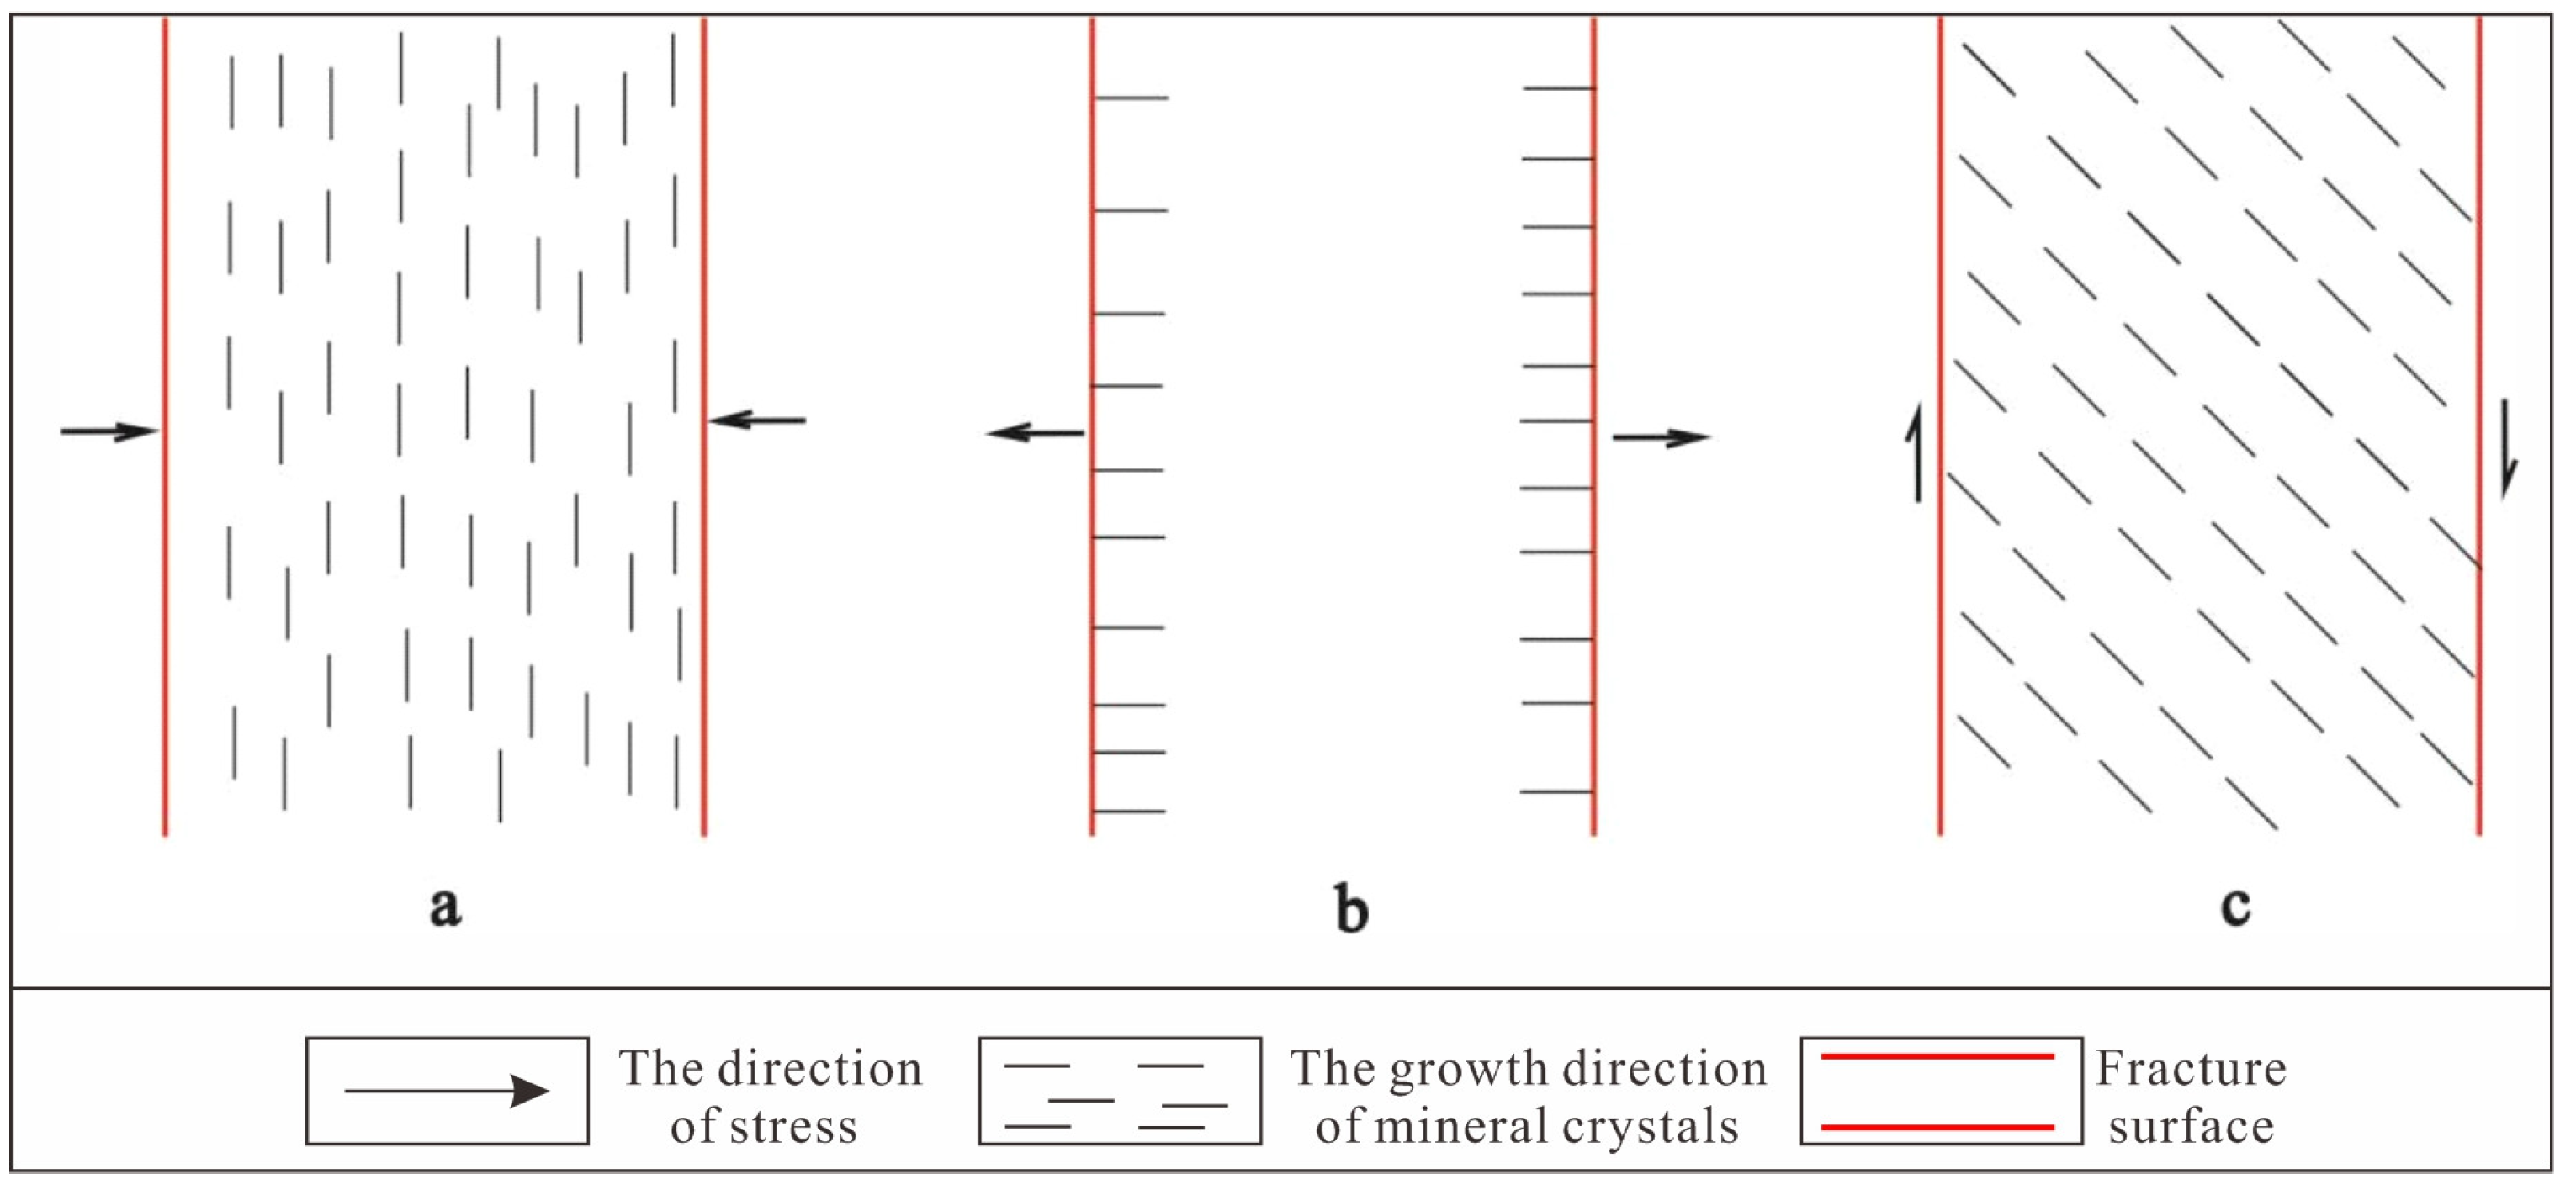
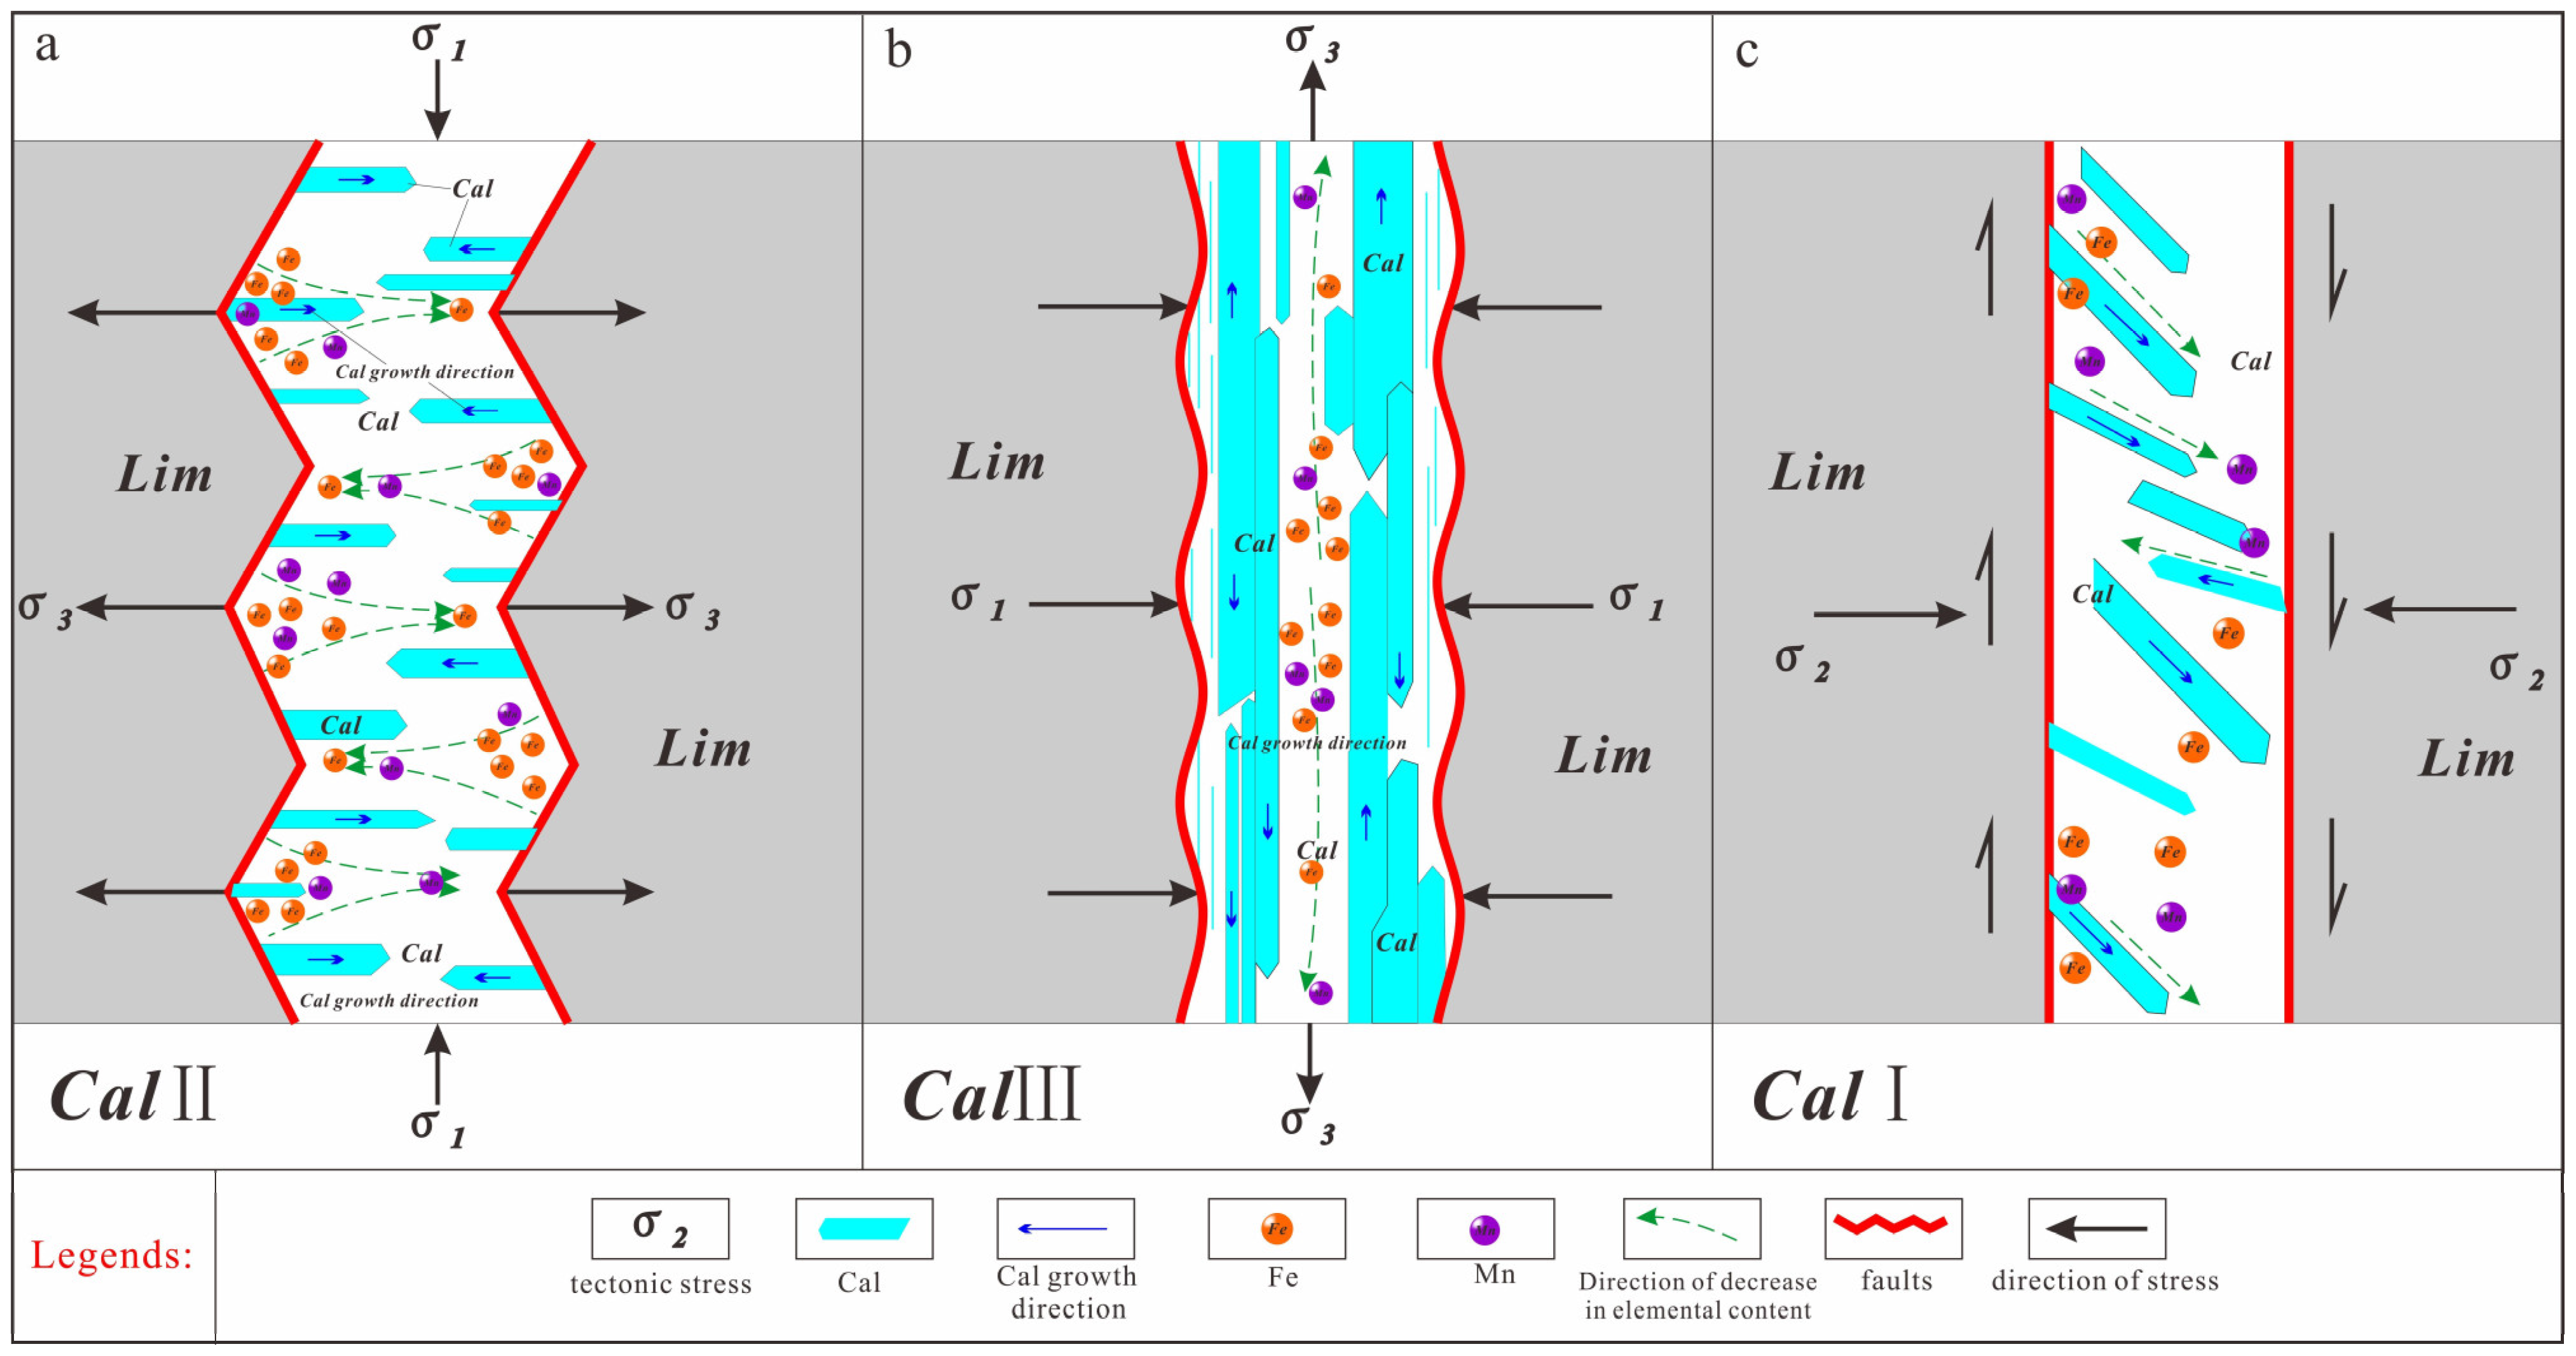
5.1.1. Action Characteristics of Torsional Stress

The occurrence of the first part (Figure 6) is NE13°∠32°NW, the fracture surface is relatively straight, the fracture bandwidth is about 0.3–0.5 cm, the width of the fracture zone has not changed significantly, calcite (CalI) has developed and filled along the fracture zone, and reddish-brown iron veinlets have developed on both sides of the calcite vein. The formation of the fracture is mainly affected by torsional stress.

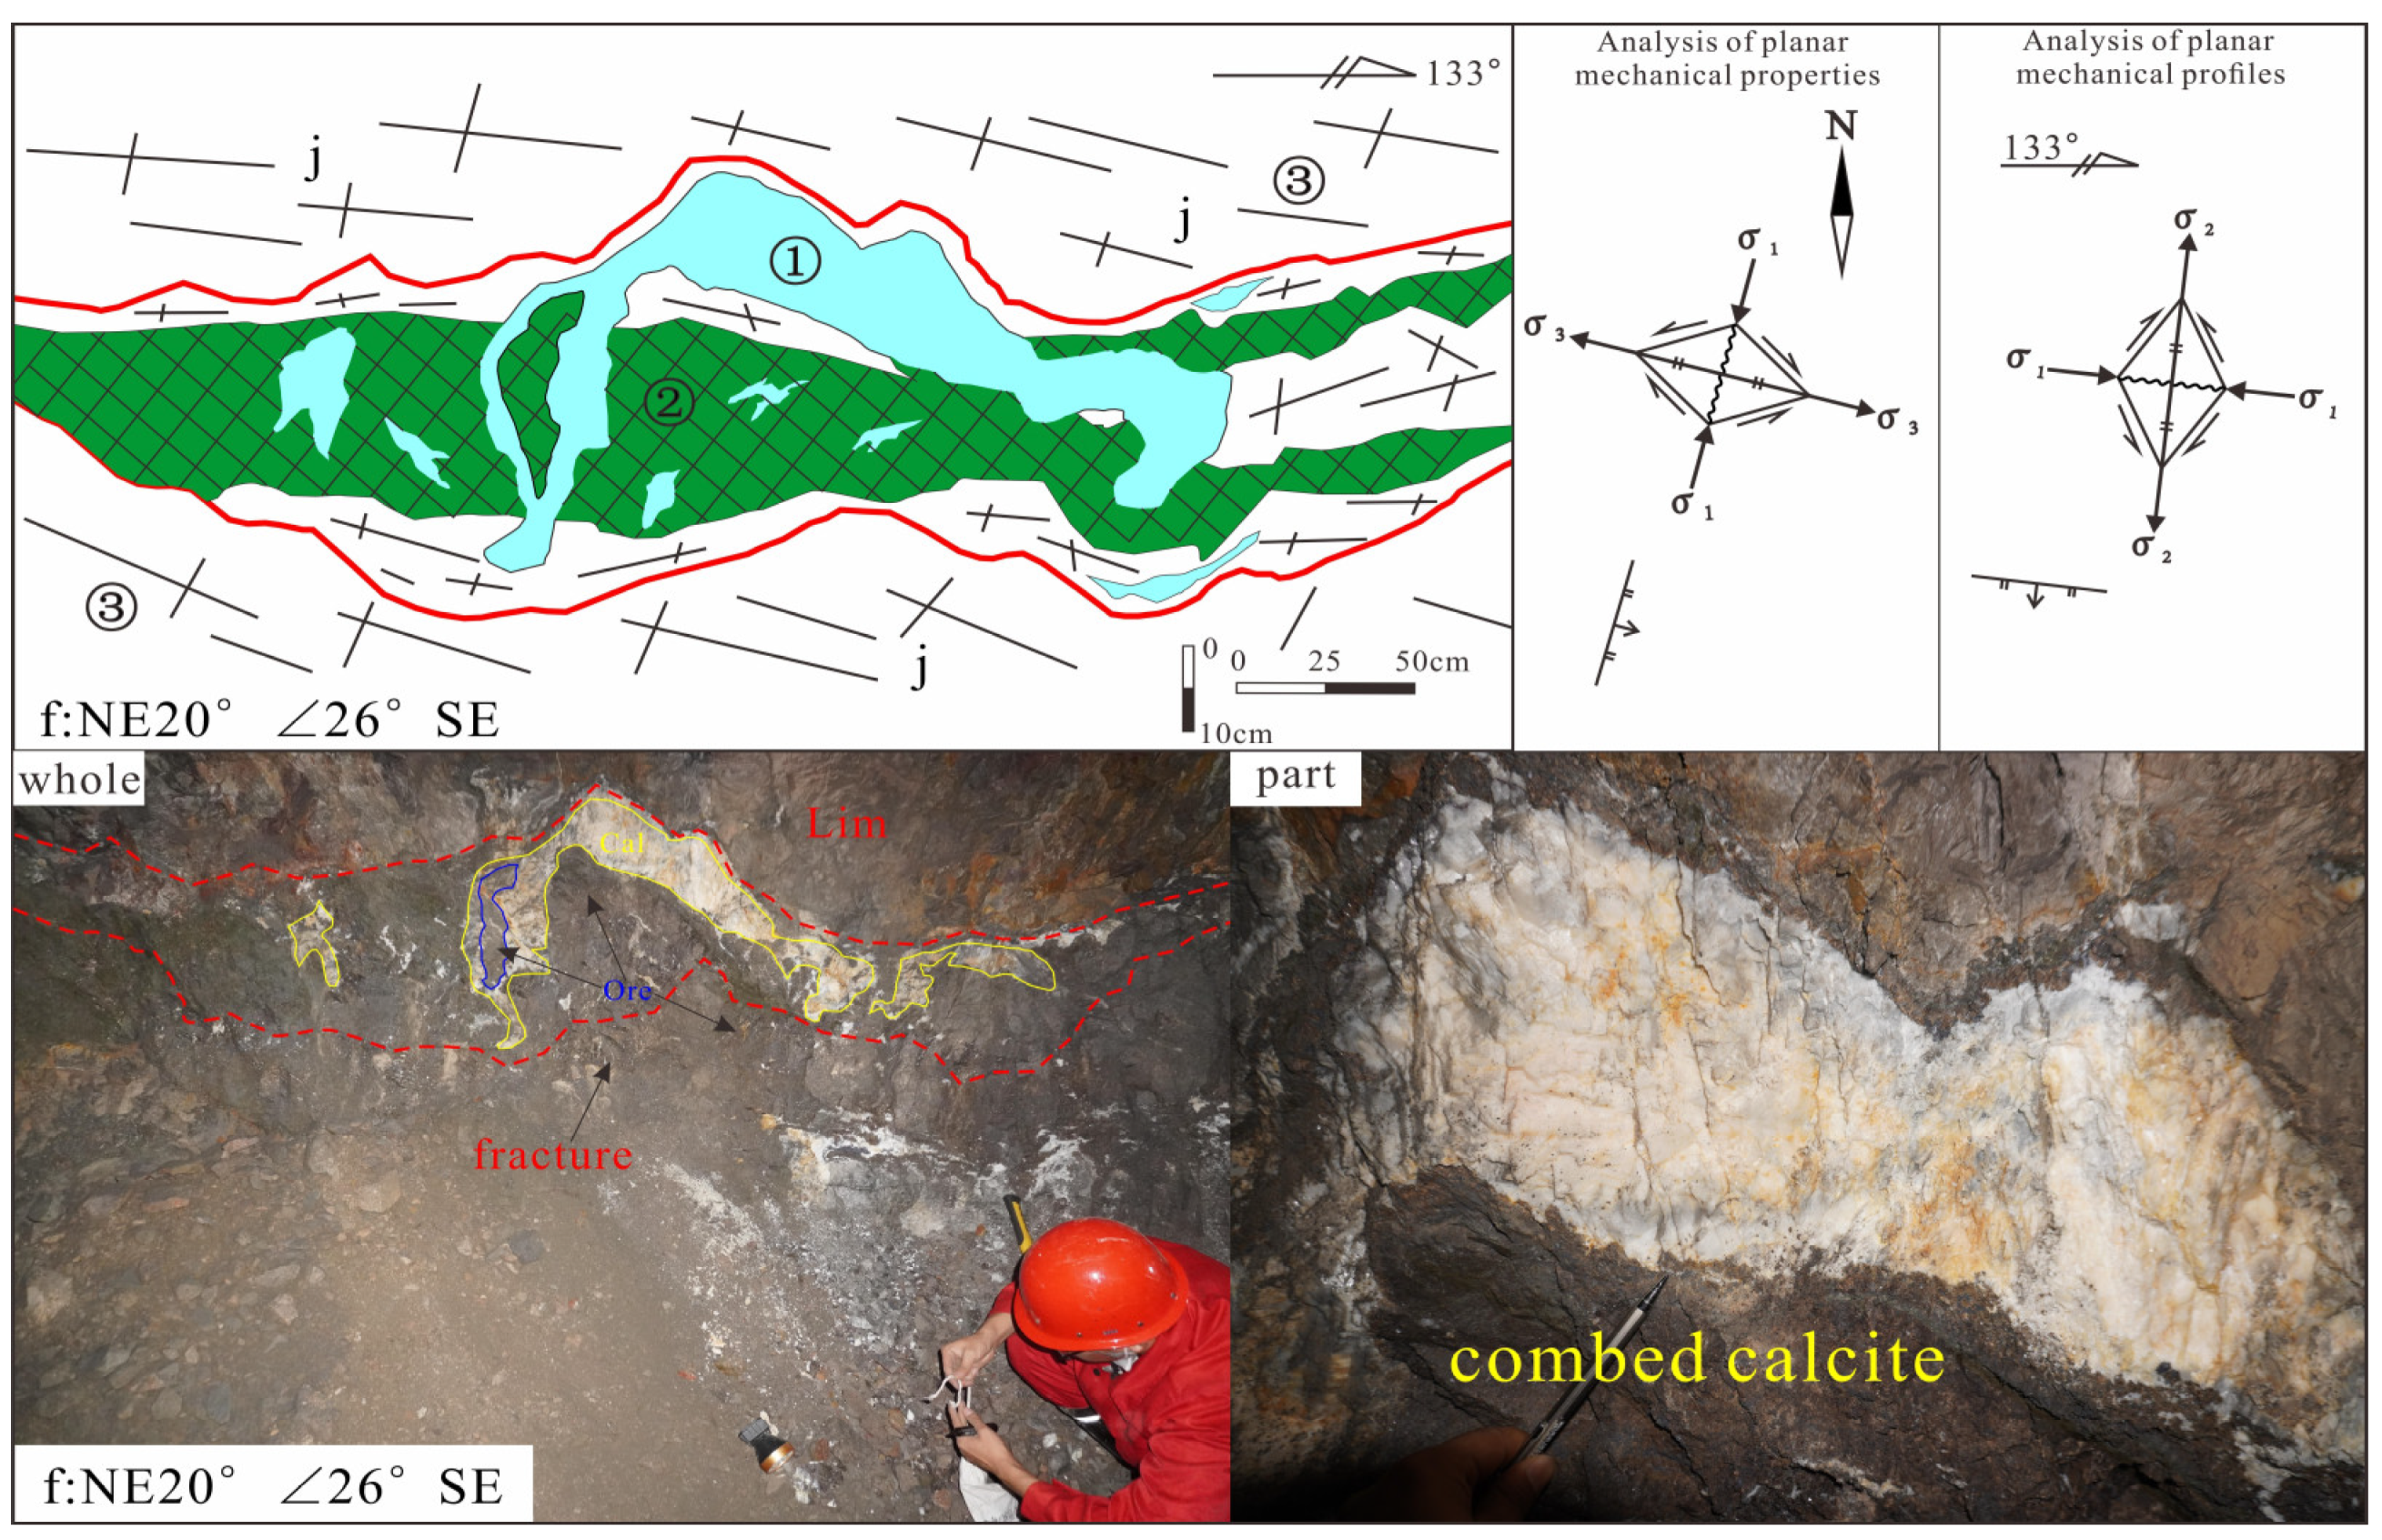
5.1.2. Action Characteristics of Tensile Stress

The occurrence of the next part (Figure 7) is NE20°∠26°SE, the fracture surface of the ore-bearing part is serrated, and the fracture bandwidth is about 20–35 cm. The fracture is filled with massive, bedded-like ore bodies, comb calcite (CalII), and massive brecciated calcareous cataclastic rocks. The lithology of the surrounding rock is gray-white fine-grained limestone. The analysis indicated that this part is mainly tensioned.

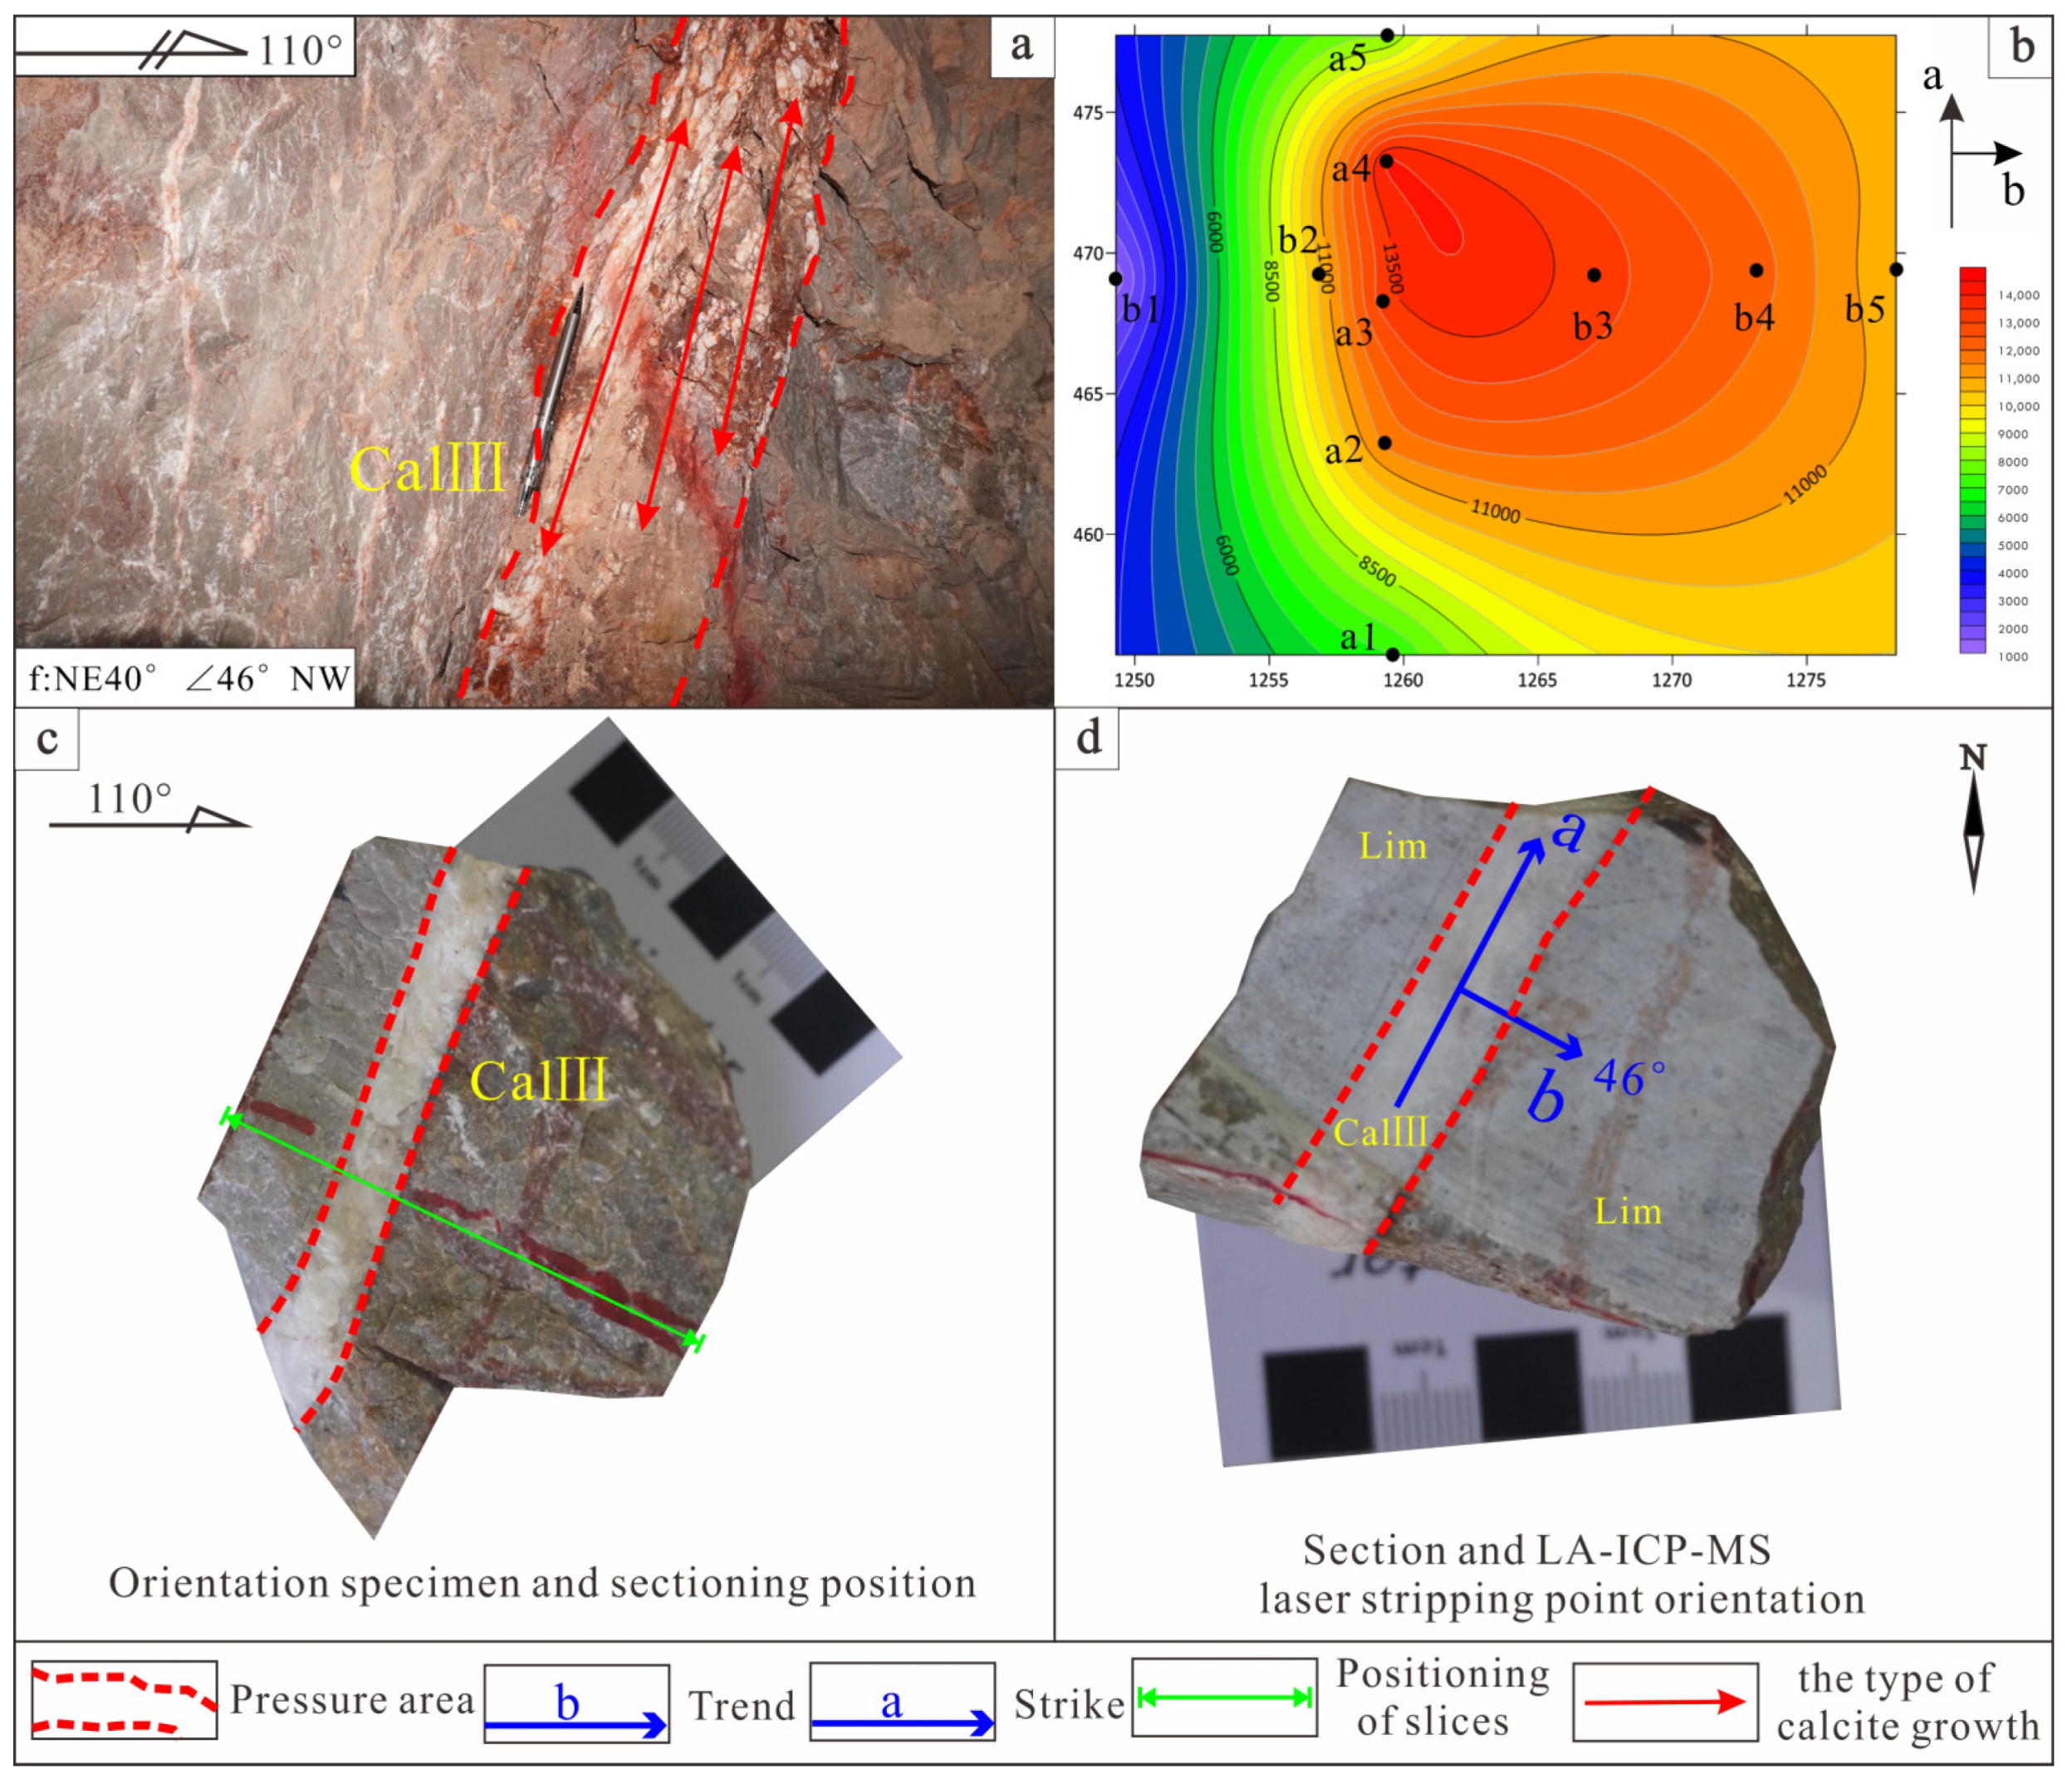
5.1.3. Action Characteristics of Compressive Stress

The occurrence of the third part (Figure 8) is NE40°∠46° NW, the fracture surface is gentle and wavy, and the fracture bandwidth is about 15–20 cm. The fracture zone is filled with lath calcite (CalIII) mixed with reddish-brown iron veinlets. The secondary compressive fractures, derived from the side of the fault, are also filled with calcite veinlets. The sharp angle between the secondary fractures and the main fault indicates that the fault is a reverse fault, and this part is mainly subject to compression.
Through the structural analysis of these three parts in the NE-trending fault zone, it can be seen that the part controlling the occurrence of gently inclined ore bodies is mainly the tension part of the fault.

5.2. Calcite REE Characterization

We assessed the REE content and related parameters of the calcite and surrounding rock (Table 2) using the chondrite standardized distribution model (Figure 9). Our findings are as follows:
  • CalII had the highest total amount of rare earth elements (ΣREE = 16.44–55.41 × 10⁻⁶), with obvious fractionation of light and heavy rare earth elements, where the light rare earth elements were the most enriched (LREE = 14.42–47.25 × 10⁻⁶), with LREE/HREE (mean) = 6.40 and (La/Yb)N (mean) = 28.24, and the pattern of the rare earth element partitioning was right-dipping, with negative Eu anomaly (δEu = 0.58–1.03) and weak negative Ce anomaly (δCe = 0.5–0.63).
  • The total amount of REEs in CalI (ΣREE = 1.41–28.93 × 10⁻⁶) was enriched in light rare earth elements, with LREE/HREE (mean) = 5.48 and (La/Yb)N (mean) = 23.75, and the pattern of rare earth element partitioning was right-dipping, with maximum negative Eu anomaly (δEu = 0.26–1.09) and weak Ce anomaly (δCe = 0.43–0.55).
  • CalIII had relatively low total rare earth elements (ΣREE = 2.03–4.68 × 10⁻⁶), was enriched in light rare earth elements, with LREE/HREE (mean) = 3.92 and (La/Yb)N (mean) = 6.19, and weak Eu (δEu = 0.5–1.46) and Ce (δCe = 0.56–0.70) anomalies.

5.3. Calcite Fe, Mn Elemental Characteristics

The calcite Fe and Mn elemental contents (Table 3) varied with distance from the mine:
  • CalII had the highest Fe + Mn content of 2186.69 × 10−6;
  • CalI had a moderate Fe + Mn content of 1066.96 × 10−6;
  • CalIII had the lowest Fe + Mn content of 904.31 × 10⁻⁶.
The Fe + Mn content within the calcite indicated a significant decrease when moving away from the main ore body.

6. Discussion

6.1. The Indicative Significance of REE in Calcite

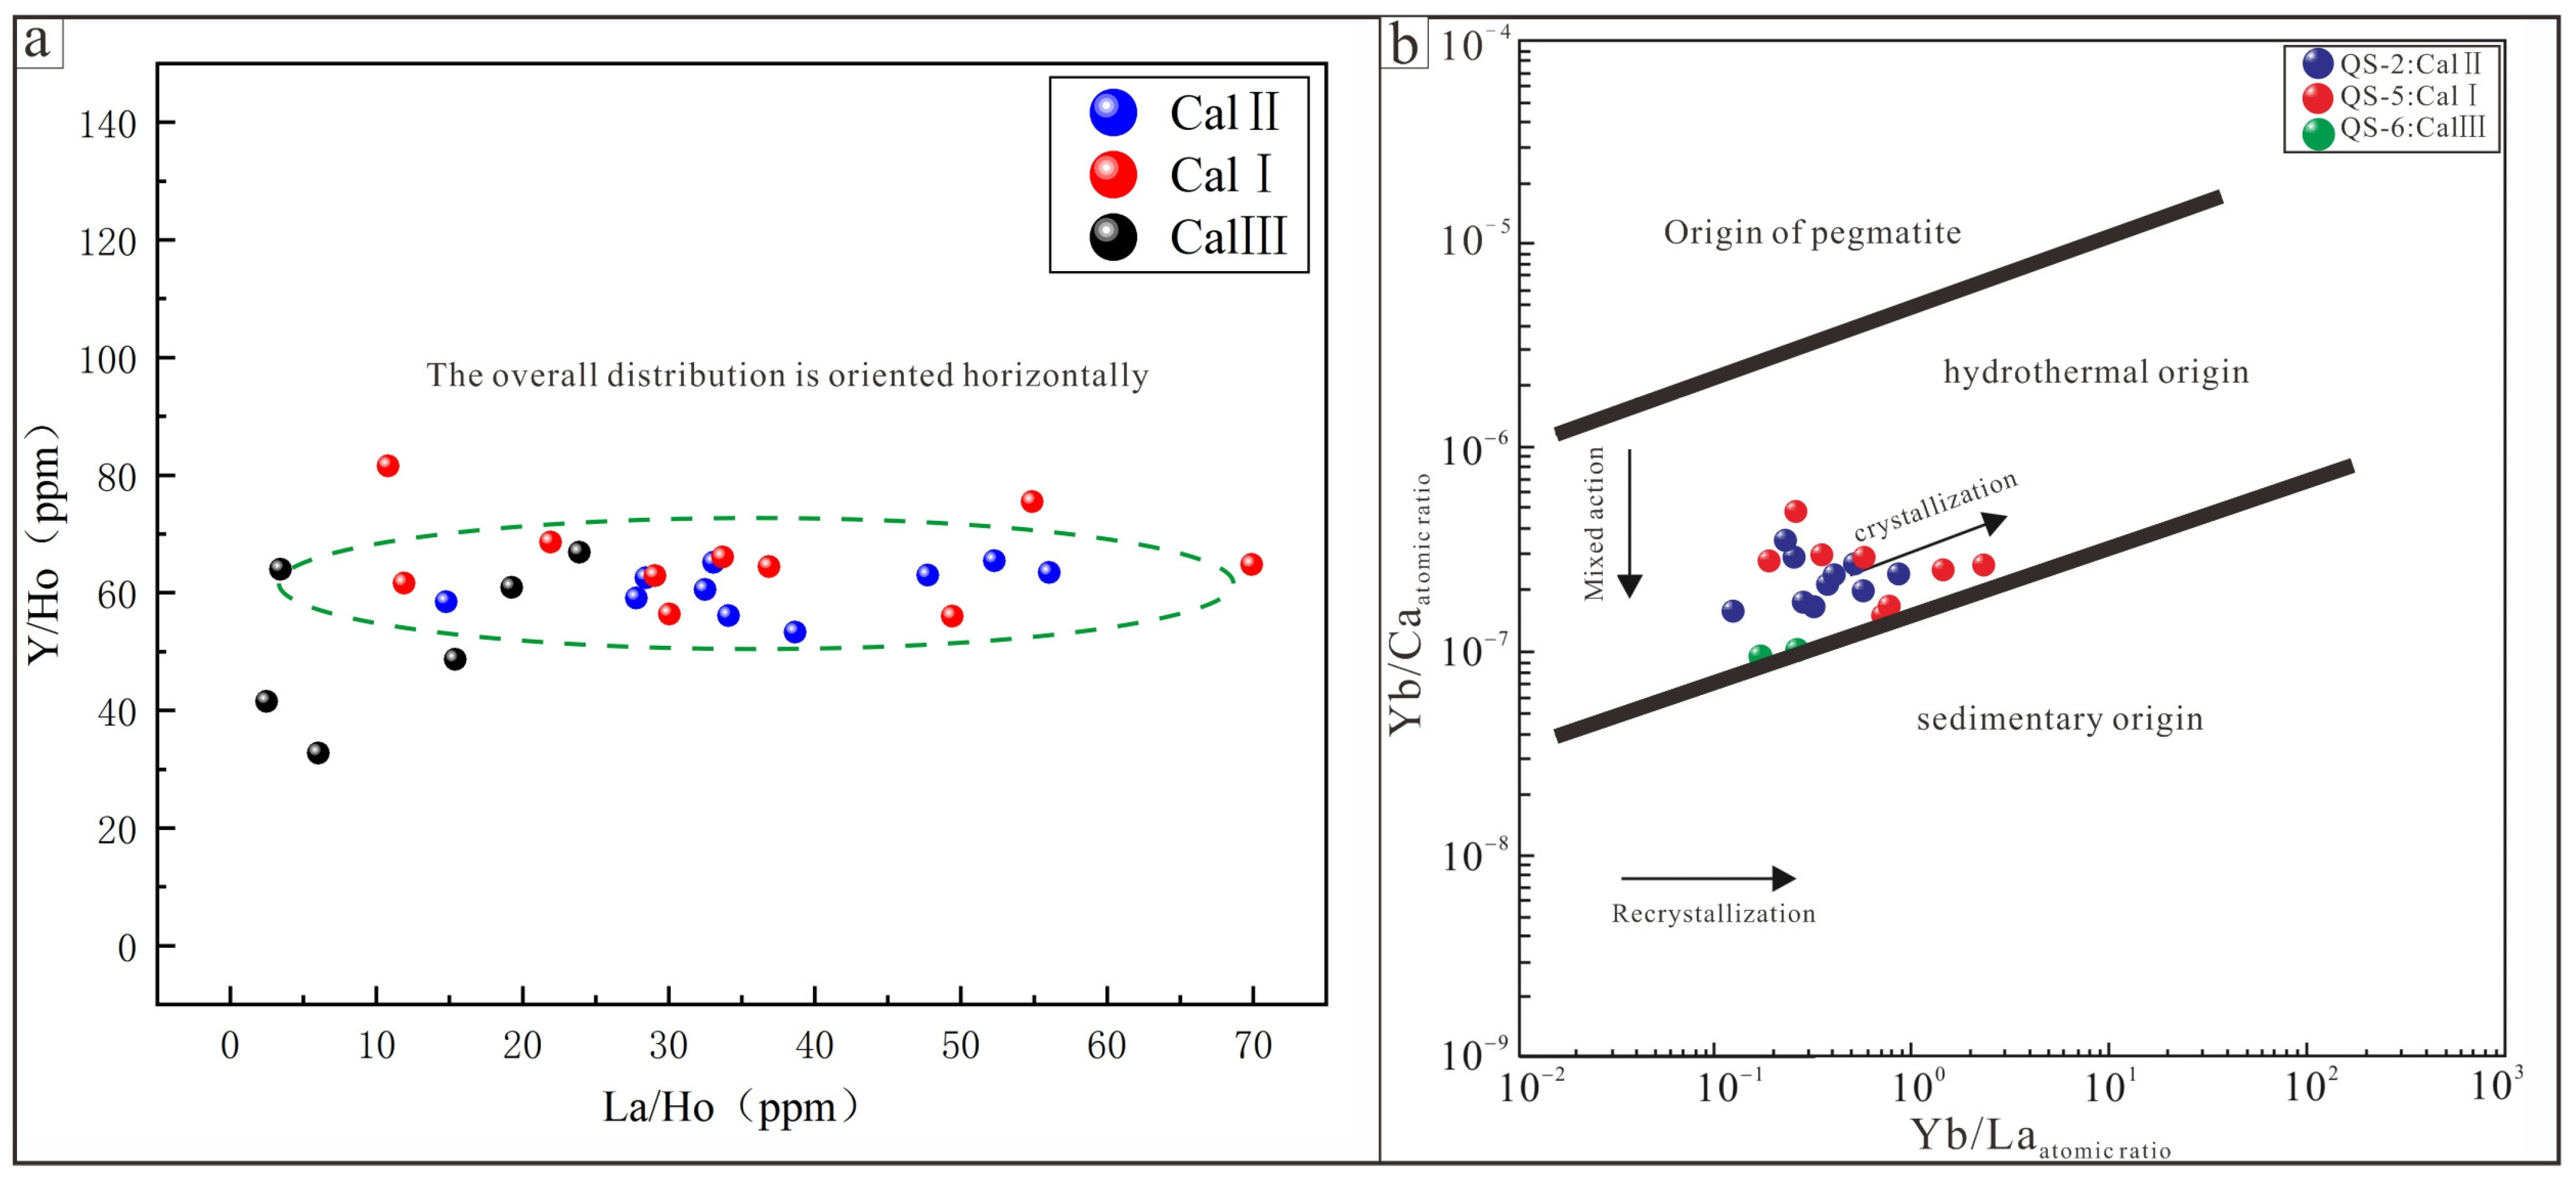
6.1.1. Characterization of REE Partitioning Patterns in Calcite

By studying the tectonic control features and the rare earth element compositions of the products formed by tectonic activities (i.e., fracture tectonics and veins filled in the fracture tectonics), we can explore the ore-controlling effects of fracture tectonics of different natures, the sources of ore-forming fluids, and the influence of the tectonics on the redistribution of rare earth elements [13]. The three different types of calcite within the NE-trending fractures were all characterized by enrichment in light rare earth elements (LREEs). The REE partitioning pattern was right-dipping (Figure 9), consistent with the REE partitioning patterns of calcites from a number of Pb–Zn deposits in the Sichuan–Yunnan–Guizhou mineralized catchment area [14,15]. The main pathway for rare earth elements to enter calcite is to displace Ca2+ in the lattice; as the ionic radii of LREEs are closer to Ca2+ than those of HREEs, it is easier for LREEs to enter the calcite lattice by displacing Ca2+ than HREEs. The REE partition coefficient in calcite fluid decreases with increasing atomic coefficients [16,17,18], which suggests that LREEs preferentially enter into the mineralizing fluid. CalI, CalII, and CalIII all presented obvious Eu negative anomalies, indicating that the calcite associated with the ore body in the crystallization and precipitation of the mineralization fluid has a reducing nature, the Eu within the fluid is reduced to Eu+2, and the rare earth partitioning pattern presents negative Eu anomalies. Farther from the ore body, the calcite did not present obvious Eu and Ce anomalies, indicating that the mineralization fluid had near-neutral characteristics, forming calcite rich in Ca2+–CO32− constitutive fluid, which may derive from the formation of the calcite.

6.1.2. Causes of the Three Types of Calcite

In order to explore whether the three types of calcites presented homology, we considered the hypothesis of Bau and Möller [19] that homologous chondritic minerals are roughly horizontally distributed on the Y/Ho–La/Ho diagram. Although the calcites differed in terms of the total REEs, partitioning patterns, and characteristic parameters with the differences in sampling locations and production conditions, the roughly horizontal distribution of the Y/Ho–La/Ho diagram (Figure 10a) may indicate that calcites from the three types of NE-trending fractures are homologous, as La/Ho shows a certain regularity between the calcite production locations (i.e., there is a continuous trend of change between CalI, CalII, and CalIII). However, the Y/Ho–La/Ho diagrams were roughly horizontally distributed, indicating that the three types of NE-directed fractures are homologous, and La/Ho showed a certain regularity with the change in calcite output location (i.e., they are presumed to belong to different stages of the same period given that CalI, CalII, and CalIII show a trend of continuous change).
The formation environment and evolution of calcite can be explained by the Yb/La–Yb/Ca diagram [20,21], as shown in Figure 10b. The calcite genesis is divided into three genesis zones: pegmatite, hydrothermal, and sedimentary. The calcite in the NE-oriented fractures under study falls into the hydrothermal genesis zone and is shown to have been formed by crystallization, in accordance with the geological fact that calcite is produced in the form of combs, veins, and laths.

6.2. Calcite Fe and Mn Elemental Variations

Chen Z.Q. [22] demonstrated that the thermoluminescence of calcite in Xitieshan lead–zinc ore is affected by its Mn2+, Fe2+, and REE3+ composition and that its intensity of thermoluminescence decreases in accordance with its location (i.e., the closer it is to the ore body, the higher the elemental content of Fe and Mn in the calcite). In the Maoping lead–zinc deposit, Pb–Zn enrichment is associated with Fe calcite mineralization [23]. The calcite formed during the mineralization period has high Fe and Mn mass fractions [24], as well as higher Fe, Mn, Pb, Zn, and other element contents relative to pre-mineralization calcite, as concluded in [25]. Based on the abovementioned studies, we may speculate that the changes in Fe and Mn elemental contents in calcite can reveal the transportation of mineralizing fluids and their evolutionary characteristics; in general, the closer to the Pb–Zn ore body, the higher the Fe, Mn, and REE contents within the calcite.
The study results indicated that when moving away from the ore (i.e., CalII → CalI → CalIII), the Fe and Mn content in calcite present a significant decrease, with the highest Fe + Mn content (2186.69 × 10−6) in CalII inside the ore body; however, as the fracture that produces calcite moves farther and farther away from the ore body, the Fe and Mn contents decrease dramatically and reach a minimum in CalIII. This indicates that during the mineralization period, the mineralizing fluid cooled down and precipitated rapidly within the fracture. At the same time, the tensile part of the fracture had a comparatively larger space such that the Fe and Mn elements within the fluid could be maximized and precipitated; thus, CalII formed by carbonate crystallization and precipitation during the same period had the highest Fe and Mn elemental contents. However, as the ore-holding space becomes smaller, the output of calcite transforms into a vein-like shape, and the contents of Fe and Mn elements are decreased. Finally, the phenomenon of gradually decreasing Fe and Mn content in calcite moving away from the ore is formed, which provides important information for the prediction of mineral locations.

6.3. Interpretation of the Ore Deposit Within the Tectonic Setting

In the process of mineralization, fractures can serve both as conduits for the uplift and transport of ore-forming fluids and as spaces where fluids are injected and fill to form veins. Fractures can control the rock (ore) veins that fill them through their mechanical properties and their own activity, which mainly derives from the structural characteristics of the fracture and changes in the local stress field. Sun J.C. and Han R.S. [3] argued that the opening of fractures of different natures and scales differs, and the structural morphology of crystallized minerals is also different; together, these factors determine the conditions for the injection of mineral fluids as well as the morphology and production characteristics of ore deposits. A large amount of geological evidence indicates that the mineral grain growth direction differs under different stresses as follows: plate-like and columnar minerals grow along the parallel vein wall under compressive stress (Figure 11a), minerals crystallized under tensile stress grow vertically along the vein wall in the form of combs (Figure 11b), and minerals crystallized within torsional fractures grow obliquely across the vein wall if torsional stresses continue to act (Figure 11c). Therefore, the direction of mineral grain growth can indicate the direction of the main compressive stress in the local stress field, which can be used as a geochemical criterion to indicate the mechanical nature of mineralized fractures.
In the process of metallogenic hydrothermal precipitation, calcite has a certain selectivity with respect to the elements in the fluid. In particular, Mn2+, Fe2+, and Zn2+ often replace Ca2+ in the calcite lattice, where CaCO3 and MnCO3 can even form a complete homogeneous sequence [26]. Wang J.S. [27] found that the Fe and Mn contents of calcite were significantly higher than those of late-mineralized calcite in the main metallogenic period of the Panqiqalin-type gold deposits in Qiandongnan and that the Fe and Mn contents of calcite were more stable in the late-mineralized period compared with non-mineralized fluids. Wang J.S. [27] also found that the Fe and Mn contents of calcite in the main mineralization period of the Panqikalin-type gold deposit in Qianxinan were significantly higher than those of calcite in the late mineralization period, that these elements are more stable in the lattice of calcite, and that the mineralization fluids have higher Fe and Mn composition compared with the non-mineralization fluids. The pattern of variation in Fe and Mn elements is also closely related to the type of rare earth enrichment in calcite, and Fe–Mn phase materials including aqueous Fe–Mn crusts, Fe-rich organic colloids, Fe–Mn surface overburden, or suspended particles can lead to enrichment in medium and heavy rare earth elements via adsorption [28,29,30,31,32,33,34]. In addition, Fe and Mn are also commonly enriched elements in Pb–Zn ore bodies, and Lin Y. [35] has suggested that the Fe/In and Mn/In plots present a positive correlation resulting from the Fe–Mn-rich nature of sphalerite in the agglomerated sulfides. Therefore, in this study, we assessed the Fe and Mn contents of three types of calcite to determine the implications of their content variation characteristics on the growth direction of calcite grains and the nature of the local stress field in different parts of the fracture.
Three groups of calcite—namely, CalII, CalI, and CalIII—were selected as representative tensile, torsional, and compressive structures of the NE-oriented fractures, respectively. Contour plots were drawn with respect to the elemental contents of Fe and Mn measured for the oriented samples in the a (strike) and b (tendency) directions, denoted as a1 to a5 and b1 to b5 for the LA-ICP-MS laser stripping point locations.
As can be seen from Figure 12, in the b direction, the Fe + Mn elemental content contour plot of CalII presents a symmetrical phenomenon of decreasing from both sides to the center; this indicates that after the Ca2+–CO32− rich metallogenic fluid penetrated into the tensile part of the fracture (open space), the vertical vein wall of the calcite (fracture surface) underwent comb-like growth. Therefore, the elemental contents of Fe and Mn varied with the direction of the growth of the calcite in a manner that decreased from both sides to the center, showing a “middle” in the direction of the vertical fracture surface. Therefore, the Fe and Mn elemental content changes with the growth direction of calcite, from both sides to the center, present a symmetrical phenomenon of “low in the middle and high on both sides” in the direction of the vertical fracture surface. This implies that during the mineralization period, the local stress field was tensile and the growth of calcite grains was controlled by the tensile stress in the mineralized part of the fracture.
As can be seen from Figure 13, the contour plot of Fe and Mn elemental content of CalIII indicates an overall increasing trend from b1 to b5 in the b direction, and the Fe + Mn content increased from 6000 × 10−6 to 11,000 × 10−6. The compressive part of the fracture presents a gentle wavy cracking surface, and the calcite in the fracture zone appears to be sheeted and grows in the form of laths and strips, characterized by an obvious compressive nature. This indicates that after fluid penetration along the fracture, the calcite was controlled by compressive stress within the local stress field and grew roughly parallel to the fracture surface in the form of laths. The elemental contents of Fe and Mn also changed with the direction of calcite growth, which had the characteristics of increasing or decreasing along the direction of calcite growth, implying that in the pressurized part of the fracture, the growth of calcite grains was controlled by the compressive stress and the local stress field was pressurized.
As can be seen from Figure 14, the Fe and Mn elemental content contour plots of CalI do not show regular changes compared with those of CalII and CalIII and thus cannot correspond to the characteristics of the mineral grain/body diagonal intersecting vein wall growth under torsional stress. The cause of this phenomenon may be that the torsional part of the NE-oriented fracture under study is in the transition position between tensile and compressive such that the local stress field in this part is not purely torsional. Influenced by both tensile and compressive stresses, the change in Fe and Mn elemental content is chaotic; meanwhile, when the position of the stress field transitions to the tensile and extrusion parts, the Fe and Mn elemental content changes in a more regular manner.
In summary, the changes in the local stress field control the output state of calcite within the fracture and the changes in the elemental contents of Fe and Mn, leading to the formation of different structural surfaces under the action of tensile, compressive, and torsional stresses. Traditional tectonic analysis characterizes the mechanical properties of different fractures from a macroscopic perspective but lacks quantitative evidence; therefore, the use of the change characteristics in the elemental contents of Fe and Mn in calcite can serve as an effective indicator of the local stress field characteristics.
Based on the above analysis, we established calcite growth direction patterns and Fe and Mn change rules in fractures under the action of different stress fields (Figure 15). Fridovsky V.Y. et al. [36] asserts that comprehensive structural analyses of ore-bearing wall rocks, encompassing both ore zones and associated deformations, can elucidate the multi-stage tectonic evolution of mineral deposits. Notably, there are significant variations in the indicator characteristics of identical minerals across different types of mineralization. The Qingshan Pb–Zn deposit is the product of the NE tectonic belt (metallogenic tectonic system), and it is the dominant tectonic system for the mineralization of the deposit. The metallogenic period occurred from the late Indosinian to early Yanshanian. Under the action of NW–SE principal compressive stress, the NW-trending bedding fault in the deposit twisted and derived a group of parallel NE-trending shear laminated compressive torsional faults. Driven by tectonic stress, the ore-forming fluid migrated from deep to shallow along the footwall of fault F1 and penetrated into the NE-trending fault. The change in the local stress field led to different mechanical characteristics at different positions in the NE-trending fault. The ore-bearing part is mainly the local opening space of the fault. The concentration variation characteristics of Fe and Mn elements in calcite and the growth mode of calcite under tensile stress are shown in Figure 15a: the concentrations of Fe and Mn in the profile show a symmetrical feature of “decreasing from both sides to the center”, suggesting that the local stress field in the ore-hosting area is dominated by tensile stress. When the ore-forming fluid penetrates, the vertical calcite vein wall grows in a comb shape under the action of this tensile stress. Within the localized compressive space of the fracture, the characteristics of Fe and Mn concentration changes in calcite and the calcite growth pattern are shown in Figure 15b: Fe and Mn contents in the profile of the parallel vein wall present increasing or decreasing characteristics, implying that the localized stress field in this site is dominated by compressive stress. Under the action of this compressive stress, the calcite parallel vein wall appears in the form of slate and presents column-like growth. Within the localized torsional space of the fracture, the characteristics of the Fe and Mn elements in calcite and the calcite growth pattern are shown in Figure 15c: the Fe and Mn element concentrations do not show regular changes in the profile, and it is assumed that the calcite grain growth mode is not pure torsional stress under the growth of the oblique intersecting vein wall, as the site is in the transition position between tensile and compressive fracture zones. It can be seen that the nature of the localized stress field of the fracture and the growth pattern of calcite at the corresponding site can be inferred from the variation characteristics of Fe and Mn.

7. Conclusions

A structural analysis was performed along NE-oriented metallogenic faults in addition to a detailed study of the characteristics of the three types of calcite, highlighting strict correlations with the distributions of Mn, Fe, and REEs.
The NE-trending metallogenic fault of the Qingshan lead–zinc deposit is a group of shear faults characterized by compressional and torsional mechanical properties during the metallogenic period. The change in the shape and occurrence of the fault zone has led different parts of the zone to have different mechanical properties, as controlled by the local stress field. The local opening space of the fault (where the dip angle becomes gentle) is the favorable location for the occurrence of lead–zinc ore bodies (veins).
In this study, we characterized three types of calcite in the NE-trending fracture zone—denoted as CalI, CalII, and CalIII—which were affected by the local stress field in different parts of the fracture during the orogenic period and are inconsistent in terms of their trace element geochemical speciation. They are the products of different stages in the same period, with all of them characterized by enrichment in light rare earth elements and a right-dipping rare earth element distribution pattern; in particular, the main mineralization period calcite (CalII) was the most enriched in light rare earth elements, differentiating it from the other types of calcite, and this feature can be used as an important factor in prediction of the mineralization of Qingshan lead–zinc deposits in the NE-oriented metallogenic rupture.
The variation in Fe and Mn elemental concentrations in calcite can indicate the nature of the local stress field at the ore-forming rupture site in the NE direction, as well as suggesting the crystallization direction of calcite. This understanding provides a quantitative/semi-quantitative basis for structural analysis of the ore body at scale, providing a better understanding regarding the metallogenic mechanism and concealed ore prediction for the Qingshan lead–zinc deposit, thus suggesting a new direction for the sustainable development of the mine.

Author Contributions

Conceptualization, R.H. and M.W.; methodology, R.H., M.W., Y.Z. and X.Z.; software, X.Z.; validation, R.H., M.W. and X.Z.; formal analysis, X.Z. and L.W.; investigation, X.Z., M.W. and L.W.; resources, R.H., M.W. and X.Z.; data curation, X.Z.; writing—original draft preparation, X.Z.; writing—review and editing, X.Z.; visualization, X.Z. and M.W.; supervision, R.H., M.W., Y.Z. and L.W.; project administration, R.H.; funding acquisition, R.H. All authors have read and agreed to the published version of the manuscript.

Funding

This research was funded by Foundation of China (Nos. 42172086, 41572060, U1133602 and 41802089), the deep and peripheral prospecting of the Hongqiao Qingshan-Shuangfeng Hengtang area in Guizhou Province (2023530103001927), the Yunnan Major Scientific and Technological Projects (No. 202202AG050014), the Program of Yunling Scholar of Yunnan Province (2014), the Projects of YM Lab (2012), the Innovation Team of Yunnan Province and Kunming University of Science and Technology (2012,2008), Talent Cultivation Fund of Kunming University of Science and Technology (kkz3202421113), and the APC was funded by the Projects of YM Lab (2012).

Institutional Review Board Statement

Not applicable.

Informed Consent Statement

Not applicable.

Data Availability Statement

The authors agree to make data supporting the results or analyses presented in this paper available upon reasonable request from the first author and corresponding author.

Acknowledgments

We are very grateful to Zhi He, a staff member of Guizhou Hongqiao Mining Industry, for his help in field work.

Conflicts of Interest

The authors declare no conflicts of interest.

References

  1. Han, R.S.; Wang, M.Z.; Jing, Z.G.; Li, B.; Wang, Z.Y. Ore-controlling mechanism of NE-trending ore-forming structural system at Zn-Pb polymetallic ore concentration area in northwestern Guizhou. Acta Geol. Sin. 2020, 94, 850–868. [Google Scholar] [CrossRef]
  2. Song, D.H.; Han, R.S.; Wang, F.; Wang, M.Z.; He, Z.; Zhou, W.; Luo, D. Structural ore−controlling mechanism of the Qingshan lead−zinc deposit in northwestern Guizhou, China and its implications for deep prospecting. Geol. China 2024, 51, 399–425. [Google Scholar]
  3. Sun, J.C.; Han, R.S. Theory and Method of Ore-Field Geomechanics; Science Press: Beijing, China, 2016; pp. 57–59. [Google Scholar]
  4. Han, R.S.; Zhao, D. Research methods for the deep extension pattern of rock/ore-controlling structures of magmatic-hydrothermal ore deposits-a preliminary study. Earth Sci. Front. 2022, 29, 420–437. [Google Scholar]
  5. Wu, S.; Ruan, W.L.; Jing, Z.G.; Zhang, M.H.; Gun, M.S. Characteristics and geological significance of trace element composition of pyrite in Qingshan lead-zinc deposit in northwest Guizhou Province. Acta Mineral. Sin. 2023, 43, 882–893. [Google Scholar] [CrossRef]
  6. Jing, Z.G. Ore-Controlling Factors, Metallogenic Rules and Prospecting Prediction of Lead and Zinc Deposits in Northwest Guizhou; Metallurgical Industry Press: Beijing, China, 2008. [Google Scholar]
  7. Jing, Z.G.; Huang, Z.L. Study on controlling ore factors of Pb-Zn deposits and prospecting model in the area of southwestern Guizhou. Acta Mineral. Sin. 2008, 28, 467–472. [Google Scholar] [CrossRef]
  8. Huang, Z.L.; Chen, J.; Han, R.S.; Li, W.B.; Liu, C.Q.; Zhang, Z.L.; Ma, D.Y. Geochemistry and Ore-Formation of the Huize Giant Lead-Zinc Deposit, Yunnan Province, China; Geological Publishing House: Beijing, China, 2004; pp. 77–118. [Google Scholar]
  9. Li, B.; Gu, X.C.; Wen, S.M.; Han, R.S.; Shen, R. Effect of Emeishan basalt in northeast Yunnan on lead and zinc mineralization. Miner. Resour. Geol. 2012, 26, 95–100. [Google Scholar]
  10. Paton, C.; Hellstrom, J.; Paul, B. Iolite: Freeware for the visualisation and processing of mass spectrometric data. J. Anal. At. Spectrom. 2011, 26, 2508–2518. [Google Scholar] [CrossRef]
  11. Liu, Y.S.; Hu, Z.C.; Gao, S. In situ analysis of major and trace elements of anhydrous minerals by LA-ICP-MS without applying an internal standard. Chem. Geol. 2008, 257, 34–43. [Google Scholar] [CrossRef]
  12. Chu, G.; Chen, H.; Zhang, S. Geochemistry and Geochronology of Multi-Generation Garnet: New Insights on the Genesis and Fluid Evolution of Prograde Skarn Formation. Geosci. Front. 2022, 14, 101495. [Google Scholar] [CrossRef]
  13. Han, R.S.; Liu, C.Q.; Huang, Z.L.; Li, Y. Characteristics of ore-controlling structures and REE composition of fault rocks in Huize lead-zinc deposit, Yunnan. Mineral. Petrol. 2000, 20, 11–18. [Google Scholar] [CrossRef]
  14. Huang, Z.L.; Li, W.B.; Chen, J.; Wu, J.; Han, R.S.; Liu, C.Q. REE Geochemistry of Calcites from Fault Zone of Huize Superlarge Pb-Zn Deposits in Yunnan Province. Miner. Depos. 2003, 22, 199–207. [Google Scholar]
  15. Zhao, D.; Han, R.S.; Wang, J.S.; Ren, T. REE Geochemical Characteristics in Lehong Large Lead-Zinc Deposit, Northeastern Yunnan Province, China. Acta Mineral. Sin. 2017, 37, 588–595. [Google Scholar] [CrossRef]
  16. Wood, S.A. The aqueous geochemistry of the rare-earth elements and yttrium: 2. Theoretical predictions of speciation in hydrothermal solutions to 350 °C at saturation water vapor, pressure. Chem. Geol. 1990, 82, 159–186. [Google Scholar] [CrossRef]
  17. Zhong, S.; Mucci, A. Partitioning of rare earth elements (REEs) between calcite and seawater solutions at 25 °C and 1 atm, and highdissolved REE concentration. Geochim. Cosmochim. Acta 1995, 59, 443–453. [Google Scholar] [CrossRef]
  18. Rimstidt, J.D.; Balong, A.; Webb, J. Distribution of trace elements between carbonate minerals and aqueous solutions. Geochim. Cosmochim. Acta 1998, 62, 1851–1863. [Google Scholar] [CrossRef]
  19. Bau, M.; Möller, P. Rare earth element fractionation in metamorphogenic hydrothermal calcite, magnesite and siderite. Mineral. Petrol. 1992, 45, 231–246. [Google Scholar] [CrossRef]
  20. SubÍas, I.; Fernández-Nieto, C. Hydrothermal events in the Valle de Tena (Spanish Western Pyrenees) as eviden ced by fluid inclusions and trace-element distribution from fluorite deposits. Chem. Geol. 1995, 124, 267–282. [Google Scholar] [CrossRef]
  21. Shuang, Y.; Bi, X.W.; Hu, R.Z.; Peng, J.T.; Li, H.; Li, D.H.; Zhu, C.S. REE, Mn, Fe, Mg and C, O isotopic geochemistry of calcites from Furong tin deposit, South China: Evidence for the genesis of the hydrothermal ore-forming fluids. Resour. Geol. 2010, 60, 18–34. [Google Scholar] [CrossRef]
  22. Chen, Z.Q. Study of thermoluminescence(tl) of quartz and calcite in the Xitieshan Pb-Zn deposit. Miner. Resour. Geol. 1996, 10, 412–416. [Google Scholar]
  23. Wei, A.Y.; Xue, C.D.; Hong, T.; Luo, D.F.; Li, L.R.; Wang, F.; Zhou, G.M.; Liu, X. The alteration-mineralization zoning model for the Maoping lead-zinc deposit northeastern Yunnan Province: Evidence from alternation-lithofacies mapping. Acta Petrol. Mineral. 2012, 31, 723–735. [Google Scholar]
  24. Zou, M.L.; Wang, Q.; Li, J.; Liang, Y.D.; Li, R. The mineralizing fluid property reflected by gochemical characteristics of calcite in polymetallic deposit. Contrib. Geol. Miner. Resour. Res. 2012, 27, 391–398. [Google Scholar] [CrossRef]
  25. Wu, W.; Song, Y.C.; Zhuang, L.L.; Huang, S.Q.; Hu, G.; Huang, G.; Tian, L.D.; Yue, L.L. Trace elemental compositions of ore-related hydrothermal calcite for Mississippi Valley-type deposit: A case study of the Duocaima giant Pb-Zn deposit, Qinghai, China. Acta Petrol. Mineral. 2023, 42, 47–70. [Google Scholar]
  26. Ji, X.Z.; Chen, Q.; Liu, X.; Ma, K.Z.; Xie, X.Y.; Han, Z.H. Geochemical and geological significance of hydrothermal calcite from Nibao gold deposit in Guizhou Province. Miner. Depos. 2020, 39, 785–804. [Google Scholar] [CrossRef]
  27. Wang, J.S.; Han, Z.C.; Li, C.; Gao, Z.H.; Yang, Y.; Zhou, G.C. REE, Fe and Mn Contents of Calcites and Their Prospecting Significance for the Banqi Carlin-type Gold Deposit in Southwestern China. Geotecton. Metallog. 2018, 42, 494–504. [Google Scholar] [CrossRef]
  28. Palmer, M.R. Rare earth elements in foraminifera tests. Earth Planet. Sci. Lett. 1985, 73, 285–298. [Google Scholar] [CrossRef]
  29. Palmer, M.R.; Elderfield, H. Rare earth elements and neodymium isotopes in ferromanganese oxide coatings of Cenozoic foraminifera from the Atlantic Ocean. Geochim. Cosmochim. Acta 1986, 50, 409–417. [Google Scholar] [CrossRef]
  30. Alt, J.C. The chemistry and sulfur isotope composition of massive sulfide and associated deposits on Green Seamount, eastern Pacific. Econ. Geol. 1988, 83, 1026–1033. [Google Scholar] [CrossRef]
  31. Bau, M.; Koschinsky, A.; Dulski, P.; Hein, J.R. Comparison of the partitioning behaviours of yttrium, rare earth elements, and titanium between hydrogenetic marine ferromanganese crusts and seawater. Geochim. Cosmochim. Acta 1996, 60, 1709–1725. [Google Scholar] [CrossRef]
  32. Johannesson, K.H.; Lyons, W.B.; Yelken, M.A.; Gaudette, H.E.; Stetzenbach, K.J. Geochemistry of rare earth elements in hypersaline and dilute acidic natural terrestrial waters: Complexation behaviour and middle rare earth element enrichment. Chem. Geol. 1996, 133, 124–144. [Google Scholar] [CrossRef]
  33. Kato, Y.; Fujinaga, K.; Nozaki, T.; Osawa, H.; Nakamura, K.; Ono, R. Rare earth, major and trace elements in the Kunimiyama ferromanganese deposit in the northern Chichibu belt, Central Shikoku, Japan. Resour. Geol. 2005, 55, 291–299. [Google Scholar] [CrossRef]
  34. Brugger, J.; Meisser, N. Manganese-rich assemblages in the Barrhorn Unit, Turtmanntal, Central Alps, Switzerland. Can. Mineral. 2006, 44, 229–248. [Google Scholar] [CrossRef]
  35. Lin, Y.; Cook, N.J.; Ciobanu, C.L.; Liu, Y.P.; Zhang, Q.; Liu, T.G.; Gao, W.; Yang, Y.L.; Danyushevskiy, L. Trace and minor elements in sphalerite from base metal deposits in South China:A LA-ICPMS study. Ore Geol. Rev. 2011, 39, 188–217. [Google Scholar] [CrossRef]
  36. Fridovsky, V.Y.; Gamyanin, G.N.; Polufuntikova, L.I. Structures, mineralogy, and fluid regime of ore formation in the polygenetic Malo-Taryn gold field, Northeast Russia. Russ. J. Pac. Geol. 2015, 9, 274–286. [Google Scholar] [CrossRef]
Figure 2. Comprehensive stratigraphic columnar diagram of Northwest Guizhou Region (modified from Jin Zhongguo, 2008) [6].
Minerals 15 00292 g002
Figure 3. Geological sketch map of the Qingshan lead–zinc deposit (revised from mine data). (a) Geologic map of the deposit. (b) Cross section of the location of the ore body.
Minerals 15 00292 g003
Figure 4. Plan of the middle section of the Qingshan lead–zinc deposit at 1675 m elevation (revised according to mine data).
Minerals 15 00292 g004
Figure 5. CalI (a1a3); CalII (b1b3); CalIII (c1c3); mineral and rock codes: Cal (calcite); Gn (galena); Sp (sphalerite); Lim (chert).
Minerals 15 00292 g005
Figure 6. Sketch map of the torsional part of the NE-oriented fracture in the 1675 m mid-mining zone. (① Finely veined calcite in the fracture zone; ② grayish-white finely crystalline massive chert; ③ reddish-brown ferruginous veins.).
Minerals 15 00292 g006
Figure 7. Sketch map of the tensile part of the NE-oriented fracture in the 1675 m mid-mining zone. (① Comb calcite in ore body; ② ore body; ③ grayish-white fine-crystalline massive chert.).
Minerals 15 00292 g007
Figure 8. Sketch map of the compressive part of the NE-oriented fracture in the 1675 m mid-mining zone. (① Slaty calcite in the fracture zone; ② reddish-brown ferruginous veins; ③ collateral derived joints.).
Minerals 15 00292 g008
Figure 9. REE partitioning pattern of three types of calcite within the NE-directed fracture of the Qingshan Pb–Zn deposit. (a) QS-2: REE partitioning model of CalII; (b) QS-5: REE partitioning model of CalI; (c) QS-6: REE partitioning model of CalIII; (d) REE partitioning model of Perimeter rock.
Minerals 15 00292 g009
Figure 10. (a) La/Ho–Y/Ho diagram of calcite; (b) Yb/La-Yb/Ca diagram of calcite.
Minerals 15 00292 g010
Figure 11. Schematic diagram of mineral grain growth direction under different stresses (modified from Sun and Han, 2016). (a) Mineral grain growth patterns under compressive stresses; (b) mineral grain growth mode under tensile stress; (c) mineral grain growth patterns under torsional stresses.
Minerals 15 00292 g011
Figure 12. Contour plot of Fe and Mn content of calcite within the fracture tensile site. (a) Fracture tensile site morphology and CalII; (b) Concentration contour plots for Fe + Mn; (c) orientation specimens of CalII; (d) section and LA-ICP-MS laser stripping point orientation.
Minerals 15 00292 g012
Figure 13. Contour plots of Fe and Mn concentrations of calcite within the fracture compressibility site. (a) Fracture compression site morphology and CalIII; (b) concentration contour plots for Fe + Mn; (c) orientation specimens of CalIII; (d) section and LA-ICP-MS laser stripping point orientation.
Minerals 15 00292 g013
Figure 14. Contour plots of Fe and Mn concentrations of calcite within fracture torsion sites. (a) Fracture torsional site morphology and CalI; (b) concentration contour plots for Fe + Mn; (c) orientation specimens of CalI; (d) section and LA-ICP-MS laser stripping point orientation.
Minerals 15 00292 g014
Figure 15. Patterns of calcite growth direction and change rule of Fe and Mn elements in the fracture under different stress fields. (a) Patterns of calcite growth direction under tensile stress with Fe and Mn change patterns; (b) patterns of calcite growth direction and Fe and Mn elements under compressive stresses; (c) patterns of calcite growth direction under torsional stress with Fe and Mn change patterns.
Minerals 15 00292 g015
Table 1. Calcite sampling locations and sample characterization.
Sample NumberSample LocationFracture Mechanical Properties of Sampling SiteSample OccurrenceColorTypeFormation Period
QS-21675 mTensionComb-likeWhiteFault zoneMain metallogenic stage (CalII)
QS-3
QS-4
QS-51675 mTorsionVeinletWhiteFault zoneEarly metallogenic stage (CalI)
QS-6
QS-71675 mCompressionLathPink Fault zoneLate metallogenic stage (CalIII)
QS-8
QS-9
Table 2. REE content (10−6) and parameters of the three types of calcite within the NE-oriented fractures in the Qingshan Pb–Zn deposit.
Sample NumberTypologyLaGePrNdSmEuGdTbDyHoErTmYbLuY∑REELREEHREELREE/HREELaN/YbNδEuδCe
QS-2CalII 9.339.811.757.231.370.281.530.201.190.240.530.060.240.0512.8533.8129.774.047.3627.840.580.60
6.957.921.556.141.290.341.710.201.290.250.620.080.430.0514.7728.8124.194.625.2311.530.690.59
5.664.440.773.110.570.240.860.070.390.100.160.020.050.026.4016.4414.781.678.8781.161.030.52
4.343.970.873.960.990.281.450.211.210.290.840.080.400.0617.1618.9714.424.543.177.820.720.50
15.2614.132.9112.222.110.622.970.362.420.461.280.130.480.0530.0655.4147.258.165.7922.720.750.52
10.3311.042.008.031.490.421.790.251.570.300.850.090.380.0517.0138.6133.325.296.3019.340.790.59
7.798.861.556.911.550.341.800.211.250.240.670.060.280.0314.5231.5627.004.565.9219.860.620.63
6.276.611.135.331.340.291.440.191.100.220.610.050.220.0313.7924.8220.973.865.4420.910.630.61
10.7810.621.867.891.570.311.750.191.120.230.610.080.260.0414.2237.3033.044.267.7529.670.580.58
11.9311.782.038.231.740.391.820.221.270.230.570.060.210.0414.9340.5236.104.428.1741.610.670.59
QS-5CalI 2.161.960.431.940.550.240.810.120.710.180.480.060.350.0411.1910.037.282.752.644.461.090.50
3.622.840.602.570.600.130.620.080.530.120.260.030.210.036.8012.2410.351.885.5012.310.640.47
1.701.340.261.190.180.020.300.030.200.030.060.010.020.001.925.324.680.647.2764.750.300.49
7.866.721.606.881.620.331.700.201.170.210.420.040.160.0213.7328.9325.013.926.3736.210.620.47
3.192.670.492.150.480.120.620.070.460.110.250.040.160.026.8910.829.101.735.2714.080.680.52
0.280.300.060.250.110.010.070.020.140.030.100.010.040.002.091.411.000.402.494.970.260.55
7.045.521.245.100.990.241.240.130.790.130.310.030.140.029.6922.9220.132.787.2335.250.650.46
7.854.720.933.700.620.180.850.090.590.110.360.040.180.027.2820.2518.012.248.0431.450.760.43
3.402.830.552.620.460.140.720.090.500.100.250.020.130.016.6711.8310.021.825.5218.510.770.51
2.812.740.633.190.650.170.920.120.630.130.330.030.130.038.8112.5010.192.314.4215.470.650.50
QS-6CalIII1.211.220.211.010.200.030.170.040.250.040.180.020.080.023.314.683.880.804.8810.500.570.59
0.740.990.180.850.160.040.180.030.270.040.110.020.110.013.233.742.960.783.794.860.660.66
0.630.680.130.560.140.040.330.010.210.050.150.010.110.023.213.072.170.902.424.080.550.59
0.550.490.050.360.120.050.090.020.090.030.130.010.040.011.432.031.610.413.898.851.460.70
1.041.220.250.930.300.050.330.050.300.030.120.010.130.022.804.793.800.993.835.580.500.59
0.420.420.080.590.230.050.080.020.080.030.050.010.090.011.412.171.790.384.723.271.000.56
WY-1Perimeter rock
(limestone)
1.862.710.561.520.260.0590.310.0470.370.0710.270.0270.220.0344.078.326.971.355.176.060.640.65
WY-22.323.280.621.950.370.0820.460.0830.430.110.390.0360.30.0424.9710.478.621.854.665.550.610.67
WY-36.157.051.425.551.010.211.290.211.280.30.890.130.860.1211.526.4721.395.084.215.130.560.58
WY-40.661.820.320.70.110.0240.160.030.180.050.20.0280.20.0332.364.523.630.884.122.370.550.97
WY-52.113.130.841.460.270.0740.410.0620.380.0990.380.0350.290.0464.579.597.881.704.635.220.680.58
WY-63.323.312.810.550.110.630.110.760.190.60.0920.660.0839.2314.2211.093.133.553.610.570.44
WY-71.682.130.671.240.180.0610.30.0410.310.0860.370.0490.340.0614.617.5185.961.563.833.540.800.49
Note: Three types of calcite samples QS-2, QS-5, QS-6 comprise a total of three laser films; each laser film is used to select 10 points for micro-area in situ trace element content testing; QS-6 multiple element content was below the lower limit of detection so only six of the groups were selected.
Table 3. Elemental concentrations of Fe and Mn in calcite (×10−6).
Sample NumberTypologyFeMnFe + MnFe + Mn Average Value
QS-2CalII1361.18 479.91 1841.08 2186.69
1341.32 439.43 1780.75
1329.19 543.06 1872.25
1324.63 1845.42 3170.05
1517.42 2425.59 3943.01
1343.03 558.60 1901.62
1322.21 770.87 2093.08
1298.94 422.68 1721.62
1340.93 513.97 1854.91
1241.81 446.67 1688.48
QS-5CalI905.07 60.06965.13 1066.96
923.67 141.571065.24
1205.53 71.311276.84
931.71 28.91960.62
QS-6CalIII881.6424.81906.45904.31
885.6816.49902.17
Disclaimer/Publisher’s Note: The statements, opinions and data contained in all publications are solely those of the individual author(s) and contributor(s) and not of MDPI and/or the editor(s). MDPI and/or the editor(s) disclaim responsibility for any injury to people or property resulting from any ideas, methods, instructions or products referred to in the content.

