Article

The Composition of Volatiles in Quartz and Pyrite from the Konduyak Gold Deposit (Yenisei Ridge, Russia)

1
Sobolev Institute of Geology and Mineralogy, Siberian Branch of the Russian Academy of Sciences, 630090 Novosibirsk, Russia
2
Institute of Non-Ferrous Metals, Siberian Federal University, 95 Krasnoyarskiy Rabochiy pr., 660025 Krasnoyarsk, Russia
*
Author to whom correspondence should be addressed.
Minerals 2025, 15(3), 278; https://doi.org/10.3390/min15030278
Submission received: 11 February 2025 / Revised: 2 March 2025 / Accepted: 4 March 2025 / Published: 9 March 2025

Abstract

:
The Konduyak gold–quartz–sulfide deposit is one of the most promising gold mines in the Ayakhta gold ore cluster on the Yenisei ridge. This article is devoted to the study of the composition of the volatile compounds in the ore-forming fluid, since this is one of the key aspects in understanding the conditions of deposit formation. The compositions of the fluids that formed quartz and pyrite in the deposit ore zone were determined using Raman spectroscopy and pyrolysis-free gas chromatography–mass spectrometry. The study of the fluid inclusions in the minerals showed that complex C-H-O-S-N multi-component fluids formed the quartz–sulfide ore zones. A range of 232 to 302 various volatile compounds were found in the fluids. The mineralizing fluids mainly consist of H2O (14.25–96.02 rel. %) and CO2 (2.07–54.44 rel. %). A high SO2 content (14.60–44.95 rel. %) is typical of fluids trapped by pyrites. Moreover, a wide range of hydrocarbons (oxygen-free aliphatic, cyclic, heterocyclic, and oxygenated) and nitrogenated and sulfur compounds were found among the volatiles in the fluid. The variable H/(H + O) ratios, from 0.51 to 0.81, and CO2/(CO2 + H2O) ratios, from 0.02 to 0.56, indicate changes in the redox conditions during ore formation.

1. Introduction

Fluid inclusion analysis is widely used in modern studies of the formation conditions for ore deposits since this allows scientists to obtain direct data on the fluid’s physical and chemical properties. Parameters such as the temperature, pressure, salinity, and chemical composition of the mineralizing fluid are the basis for understanding ore deposition processes [1,2,3,4,5]. The development of analytical methods has led to an increase in the number of articles devoted to studying fluid’s chemical composition and its correlation with the scale of the mineral deposit [6,7,8]. The presence and concentration of various volatiles in the fluid affect its enrichment with ore species [9,10]. Moreover, the fluid’s chemical composition can be used to determine the redox conditions of the mineral formation environment.
Typically, the composition of volatiles is studied using Raman spectroscopy, which is a non-destructive analysis and is relatively easy to perform. Raman spectroscopy allows for the determination of the main volatile components in individual fluid inclusions (carbon dioxide, water, methane, nitrogen, and hydrogen sulfide) [11,12,13]. A more detailed analysis of the gas mixture trapped in the fluid can be performed using gas chromatography [14,15,16,17], solid-probe mass spectrometry [18,19], or gas chromatography–mass spectrometry (GC–MS) [20,21]. The main advantage of GC-MS is its extremely low detection limits, allowing for unambiguous species identification [22,23]. Another significant advantage of the GC-MS technique used in this study is the possibility of determining the composition of volatiles in the fluid trapped in ore minerals, such as sulfides and native gold [7,20,24,25].
This paper aims to present information on the volatile composition of the mineralizing fluids in the Konduyak gold deposit. The data obtained in this study may significantly contribute to a holistic model for orogenic gold deposit formation and may be further implicated in gold exploration.

2. The Geological Setting

A huge number of deposits and ore occurrences have been found in the Yenisei gold province. One of the most promising areas for gold mining is the Ayakhta ore cluster, within which the Konduyak deposit is located. The Yenisei ridge is an ancient orogen of the collisional–accretionary type, located at the western edge of the Siberian Craton [26]. Most of the Yenisei ridge is composed of Paleoproterozoic and Meso-Neoproterozoic rocks. The geological history of the ridge’s evolution is complex and includes a succession of accretion, collision, rifting, metamorphic, stabilization, and erosion processes [27].
The Ayakhta ore cluster is located in the North Yenisei district of the Krasnoyarsk region in the central part of the Yenisei ridge. The most gold-rich part of the cluster is represented by the Ayakhta and Konduyak deposits and the Bazisny ore occurrence, which are located in the southern and south-eastern exocontacts of the Ayakhta granitoid massif (Figure 1). The Ayakhta ore cluster was first studied in 1866, when placers in the area attracted interest. At the beginning of the 20th century, mining was carried out at the Ayakhta deposit, as well as in the quartz-vein zones of small ore occurrences within the ore cluster [28,29,30,31,32,33,34].
The Konduyak deposit with gold reserves of 15 t and an average grade of 1.5 g/t is located in the central part of the Ayakhta ore cluster. The deposit has two ore zones: South and North, which lie within a steeply dipping tectonic zone of sublatitudinal strike with up to 300 m thickness. Vein-disseminated gold–sulfide–quartz mineralization is represented by several echelon-shaped quartz veins in a sublatitudinal zone with a length of about 2 km. The host rocks are quartz–biotite schists and quartz–biotite–muscovite schists with garnet, more rarely found with andalusite and sillimanite. The regional metamorphism of the rocks corresponds to greenschist and epidote–amphibolite facies. Hornfelses can be observed at the contact with granitoids.
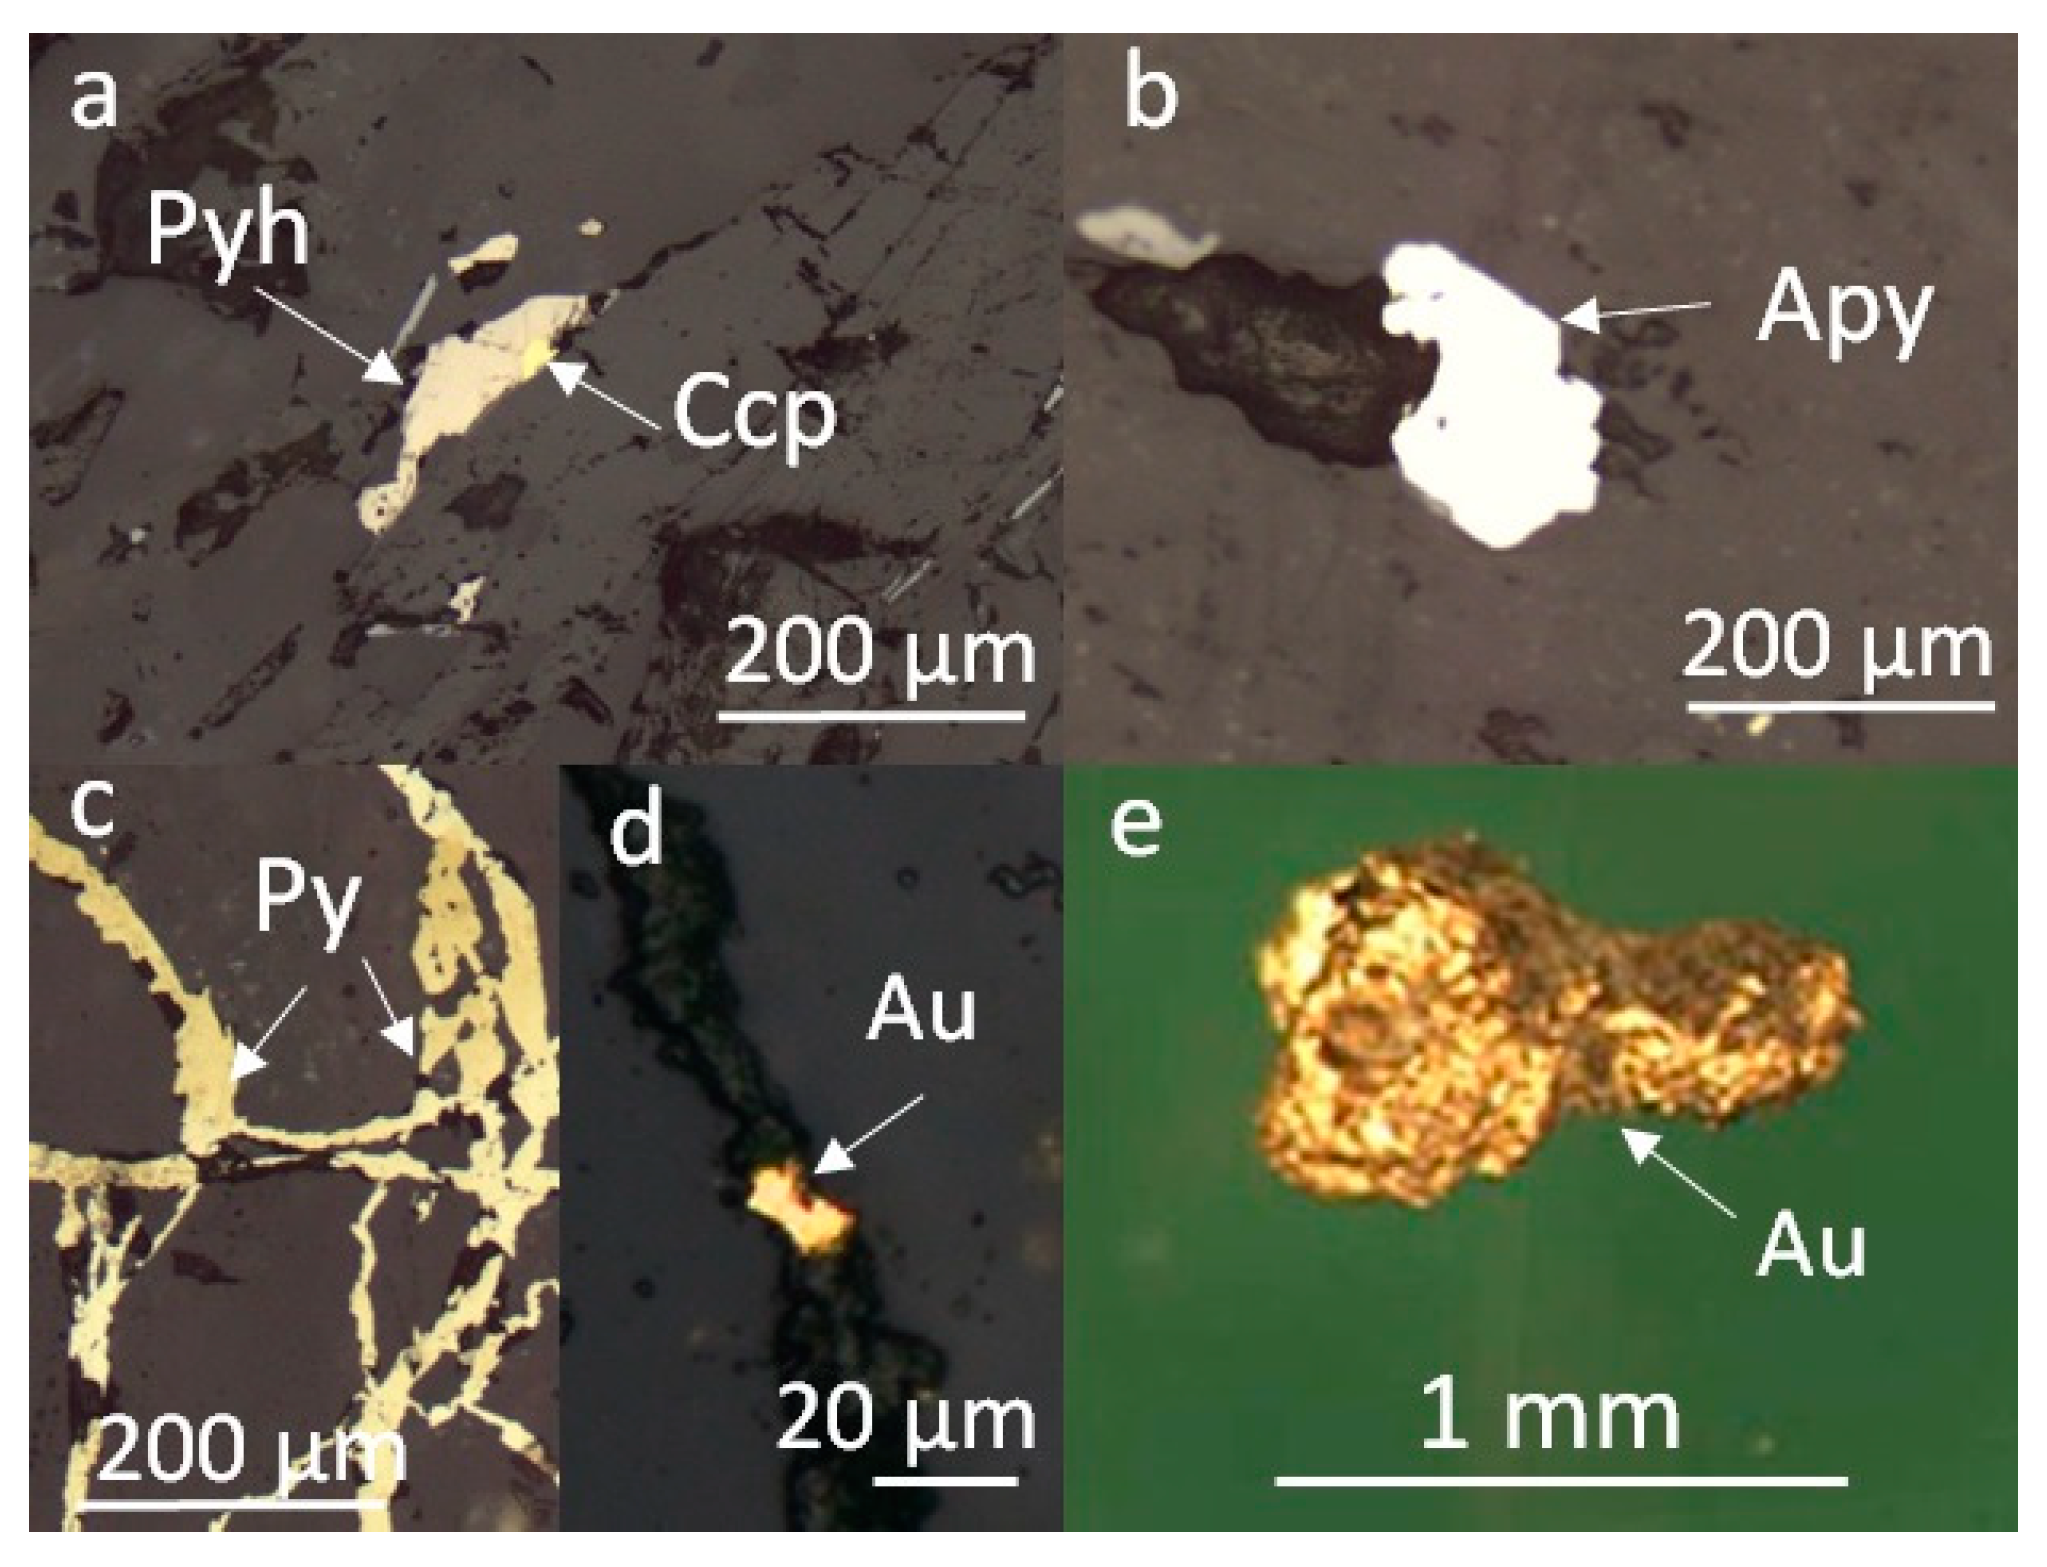
The mineral composition of the quartz-vein formations is uniform. The predominant mass of veins, lenses, and veinlets is composed of white quartz, in which a small amount (1%–3%) of minor disseminations and veinlets of ore minerals is noted. Sulfides are represented by pyrite and pyrrhotite (Figure 2), and less often so by arsenopyrite, chalcopyrite, sphalerite, and galena. Native gold is mainly found in the form of small, unevenly scattered disseminations, small nests and vein-like isolations, and at the contact of the veins with the host schists. Gold grains of 0.2–1 mm in size have a lumpy shape with polygonal recesses and protrusions and branched outgrowths. The color of the gold particles is golden yellow, and the surface is usually clean or with iron hydroxide films on the surface [36]. The gold in the ores is of medium and high fineness (877‰–914‰) [37].

3. Samples and Methods

3.1. Sampling and Preparation

Ten samples for study were collected from wells and along exploration lines in the ore zone of the Konduyak deposit. We used half of the sample to make doubly polished thin sections for studying fluid inclusions (FIs). The second half was crushed and forced through a sieve. Pure quartz and pyrite with no visible impurities were picked using a binocular magnifying glass.

3.2. Raman Spectroscopy Analysis

The study of individual fluid inclusions was performed by Raman spectroscopy [11,12]. Raman spectra were recorded using a Horiba J.Y. LabRAM HR800 spectrometer coupled with an Olympus BX41 microscope. A diode-pumped solid-state laser emitting at 532 nm (Torus, Laser Quantum, Telford, England) was used as the excitation source. The polarization of the laser emission was converted from linear to circular by placing an l/4 phase plate in the beam path. An Olympus 100× (NA = 0.90) objective was used to focus the laser beam onto the sample and to collect the Raman signal. The spectra were measured with a spectral resolution of 2 cm−1. The spectrometer was calibrated by the emission lines at 540.06 nm and 585.25 nm of a neon gas-discharge lamp. The accuracy of the band positioning in the Raman spectra was approximately ±1 cm−1. Raman detection limits may vary from 0.1 to 100 ppm for different volatiles in fluid inclusions depending on inclusion size and shape and analytical conditions [11].

3.3. Gas Chromatography–Mass Spectrometry Analysis

Volatiles from the sample were analyzed using the pyrolysis-free coupled gas chromatography–mass spectrometry (GC–MS) method with on a Focus GS/DSQ II Series Single Quadrupole MS analyzer (Thermo Scientific, Austin, TX, USA). The gas mixture was released from the fluid inclusions of the samples by means of shock mechanical destruction in a custom designed destruction cell [20]. The crusher was heated to 150 °C and flushed with He to remove adsorbed volatiles. The released mixture was entrained in a He stream, without cryogenic focusing. Each analytical run was preceded and followed by blank analyses, which later were used in data processing. The gas mixture was injected into the analytical column of the GC–MS instrument through a 6-port 2-position Valco (USA) valve thermostated at 290 °C at a constant He flow rate of 1.7 mL min−1, using vacuum compensation. The GC–MS transfer line temperature was held at 300 °C. The gas mixture was separated in a Restek Rt-Q-BOND capillary column (100% divinylbenzene used as a stationary phase; length, 30 m; inner diameter, 0.32 mm; film thickness, 10 µm). The temperature program of the GC separation comprised an isothermal stage (70 °C for 2 min) followed by two heating ramps (25 °C min−1 to 150 °C and 5 °C min−1 to 290 °C), followed by the final isothermal stage at 290 °C for 100 min. Total ion current (TIC) electron ionization spectra were collected on a quadrupole mass-selective detector in the full scan mode at an electron energy and emission current of 70 eV and 100 µA, respectively. Other experimental parameters were as follows: ion source T = 200 °C; multiplier voltage, 1500 V; positive ion detection; mass range, 5 to 500 amu; scan rate, 1 s−1; and scan rate, 506.6 amu s−1. The start time of the analysis was synchronized with the shock crushing of the samples.
The sample preparation procedure for analysis excluded its contact with any solvents and other possible contamination. The input of the mixture extracted from the sample during the shock crushing was carried out online in the He flow without concentration including cryofocus. This method does not pyrolyze the sample but heats it only in order to convert any water within the sample into the gas phase. In this case, it is a gas mixture that is analyzed in situ rather than pyrolyzate, which contains more oxidized compounds (H2O, CO, CO2, etc.) due to the reactions between the gas mixture compounds, the gas mixture and accumulator surface, and the gas phase compounds and the sample. Blank online analyses were carried out before and after the “working” analysis. The previous analysis made it possible to control the release of gases sorbed by the sample surface, including atmospheric components, and to record the system blank at the end of the process. The degree and completeness of hydrocarbon and polycyclic aromatic hydrocarbon elution from the analytical column during temperature programming in a chromatograph thermostat were determined using the results of subsequent analysis. If necessary, the analytical column was thermoconditioned to achieve the required blank. The collected spectra were interpreted using both the AMDIS 2.73 (Automated Mass Spectral Deconvolution and Identification System 2.73) software and manually, with background correction against spectra from the NIST 2020 and Wiley Registry 12th Edition Mass Spectral libraries (NIST MS Search 2.4). Peak areas in chromatograms were determined using the ICIS algorithm Xcalibur (1.4SR1 Qual Browser). This method is suitable for the detection of trace volatile concentrations exceeding tens of femtograms. The relative concentrations (rel. %) of volatile components in the studied mixture were obtained by normalizing the areas of individual chromatographic peaks to the total area of all peaks. Quantitative assessments were performed using the absolute calibration method according to internationally referenced standards. Namely, certified Scotty Inc. NL34522-PI and 34525-PI (Scott Specialty Gases Inc., PA, USA) gas standards of methane–hexane alkanes were injected into the gas stream in the splitless mode by means of a volumetric gas-tight syringe or a special valve with replaceable loops for volumes ranging from 2 to 500 µL. The calibration quality was assessed using the coefficients of determination R2 of the relationships between the peak area and the injected amount. The respective R2 values were as follows: 0.9975 (16 m/z, n = 22) for methane, 0.9963 (26 + 30 m/z, n = 16) for ethane, 0.9986 (29 + 43 m/z, n = 15) for propane, 0.9994 (29 + 43 m/z, n = 17) for butane, 0.9935 (43 + 72 m/z, n = 6) for pentane, and 0.9909 (57 + 86 m/z, n = 5) for hexane. The concentration ranges of alkanes during calibration were similar to concentrations encountered in the experiments. The relative analytical uncertainty for C1-C6 alkane determination was below 5% (2 σ), and for H2O, NH3, and CO2, it was less than 10% [20,38]. The instrumental detection limit for hydrocarbons and other volatile components is estimated to be from 5.5·10−15 to 9.5·10−15 g. For water, the instrumental detection limit is from 10·10−15 to 20·10−15 g.

4. Results

4.1. Fluid Inclusion Assemblages

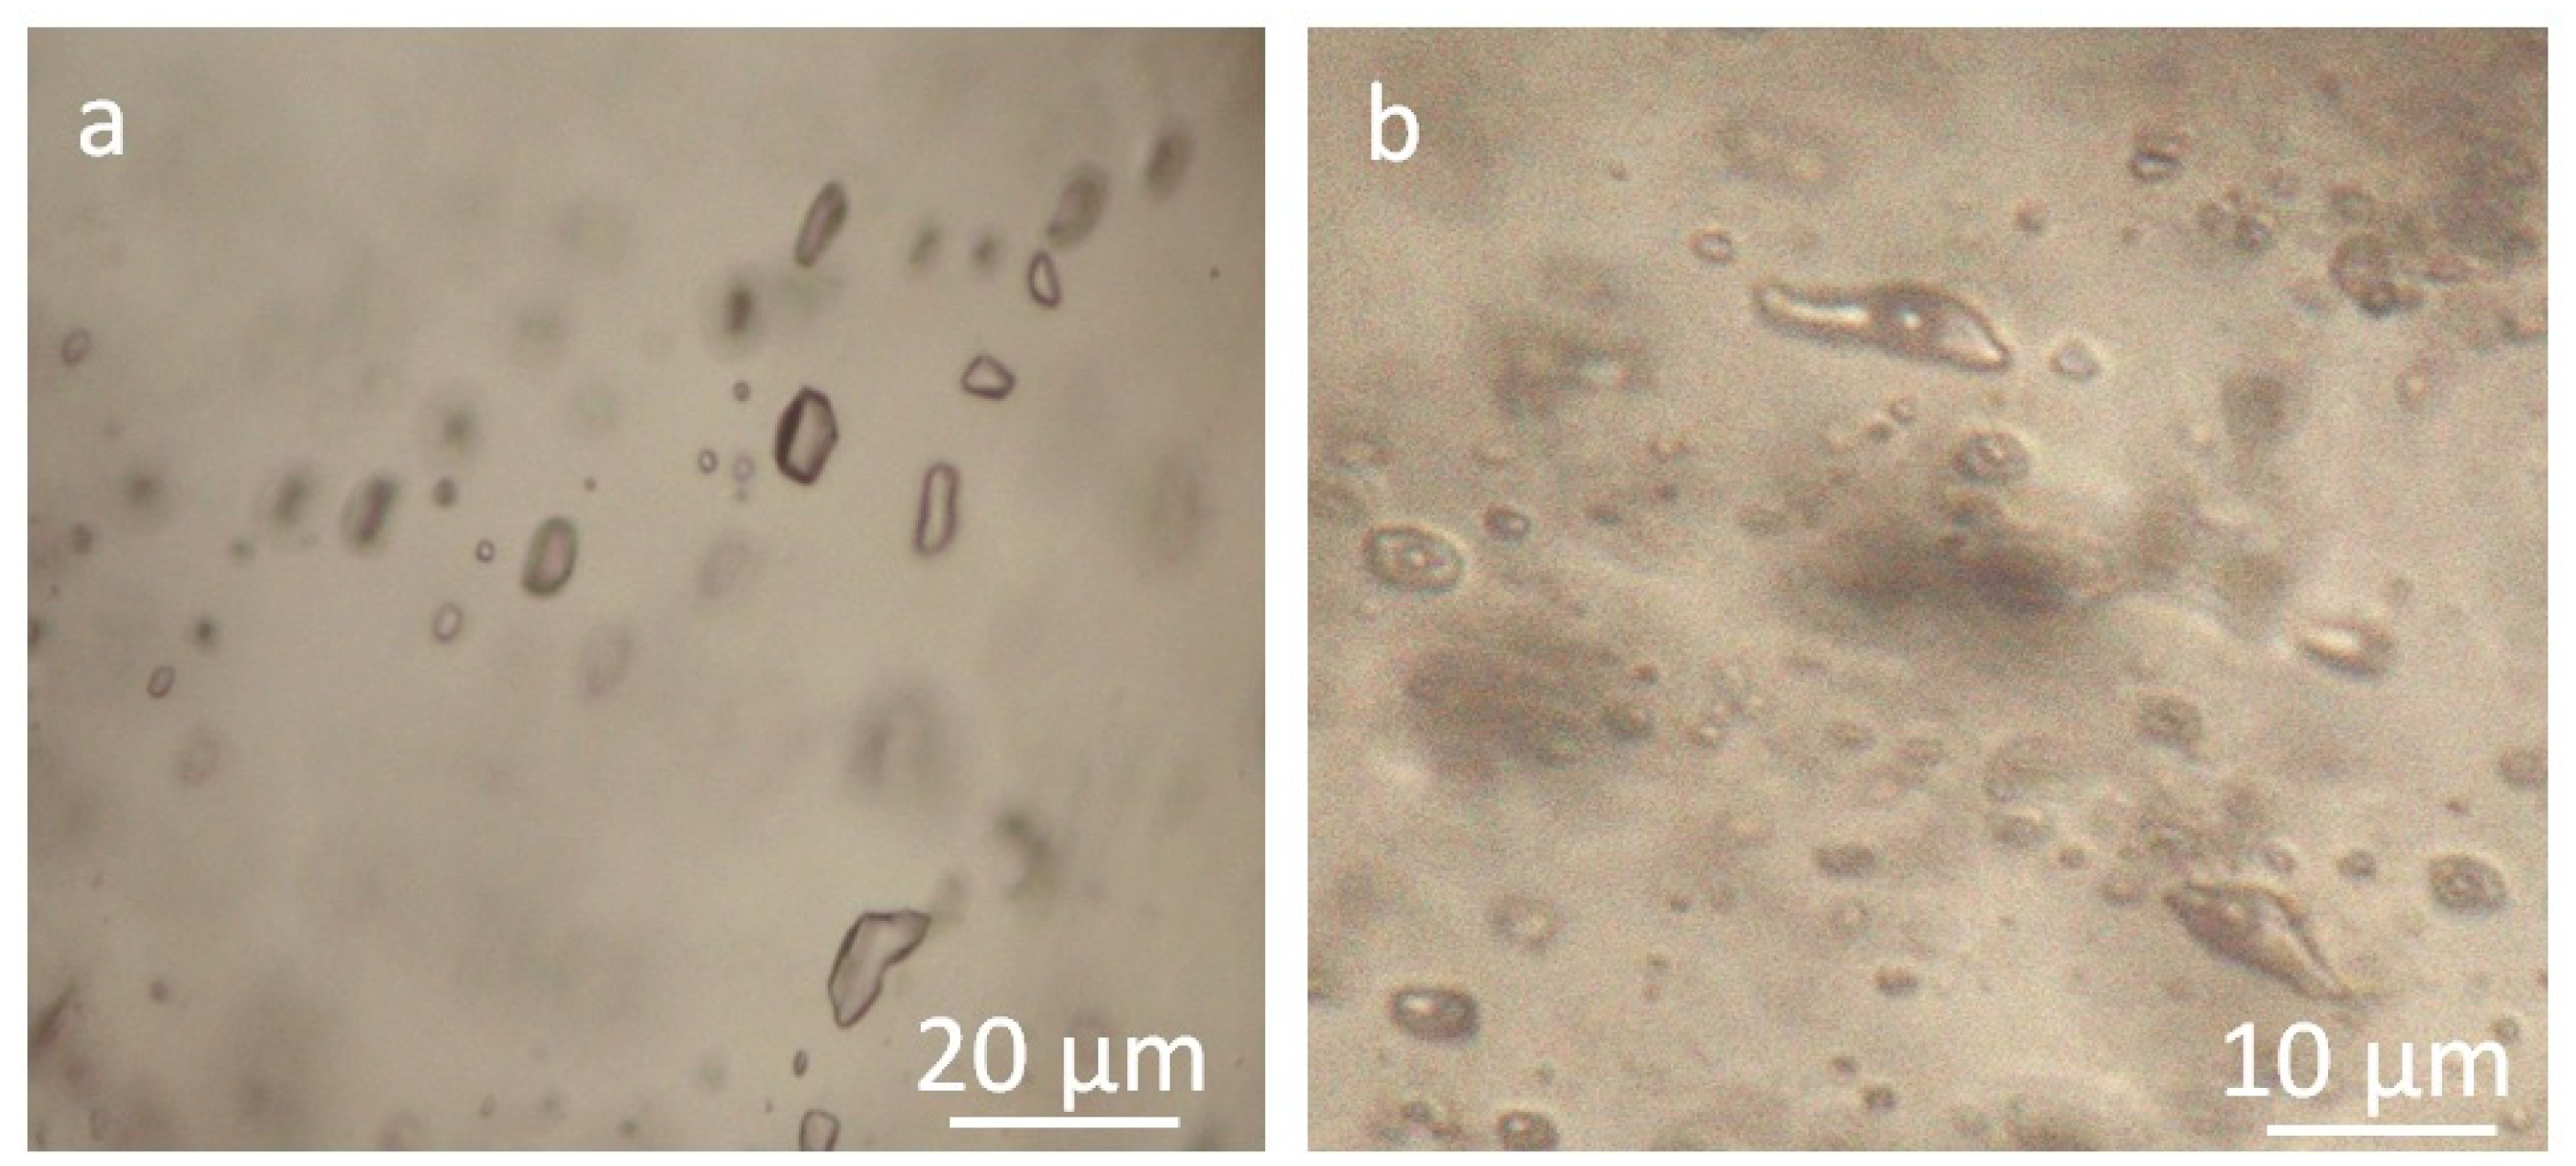
Two types of fluid inclusion assemblages (FIAs) were found in quartz: single-phase vapor or liquid and two-phase vapor–liquid (Figure 3). The size of most inclusions is 8–10 µm. The ratio of vapor to liquid in two-phase inclusions varies from 1:10 to 4:5, which is a sign of fluid boiling. The shape of the inclusions varies, with negative crystal or oval inclusions predominating. FIAs are located randomly in the grains and usually not confined to healed cracks. Therefore, they were classified as primary and pseudosecondary generations [39].

4.2. Raman Spectroscopy Data

Raman detected carbon dioxide (CO2), nitrogen (N2), methane (CH4), and water (H2O) in individual fluid inclusions in quartz. Figure 4 shows the Raman spectra of the identified compounds. The methane and nitrogen peaks are quite weak, indicating that the main volatiles in the fluid are water and carbon dioxide. In total, more than 60 individual fluid inclusions were analyzed. The set of components in both types of inclusions is the same.

4.3. GC-MS Data

Gas chromatography–mass spectrometry shows that there are from 232 to 302 various compounds in the mineralizing fluids trapped by quartz and pyrite from the Konduyak deposit (Table 1 and Tables S1–S7).
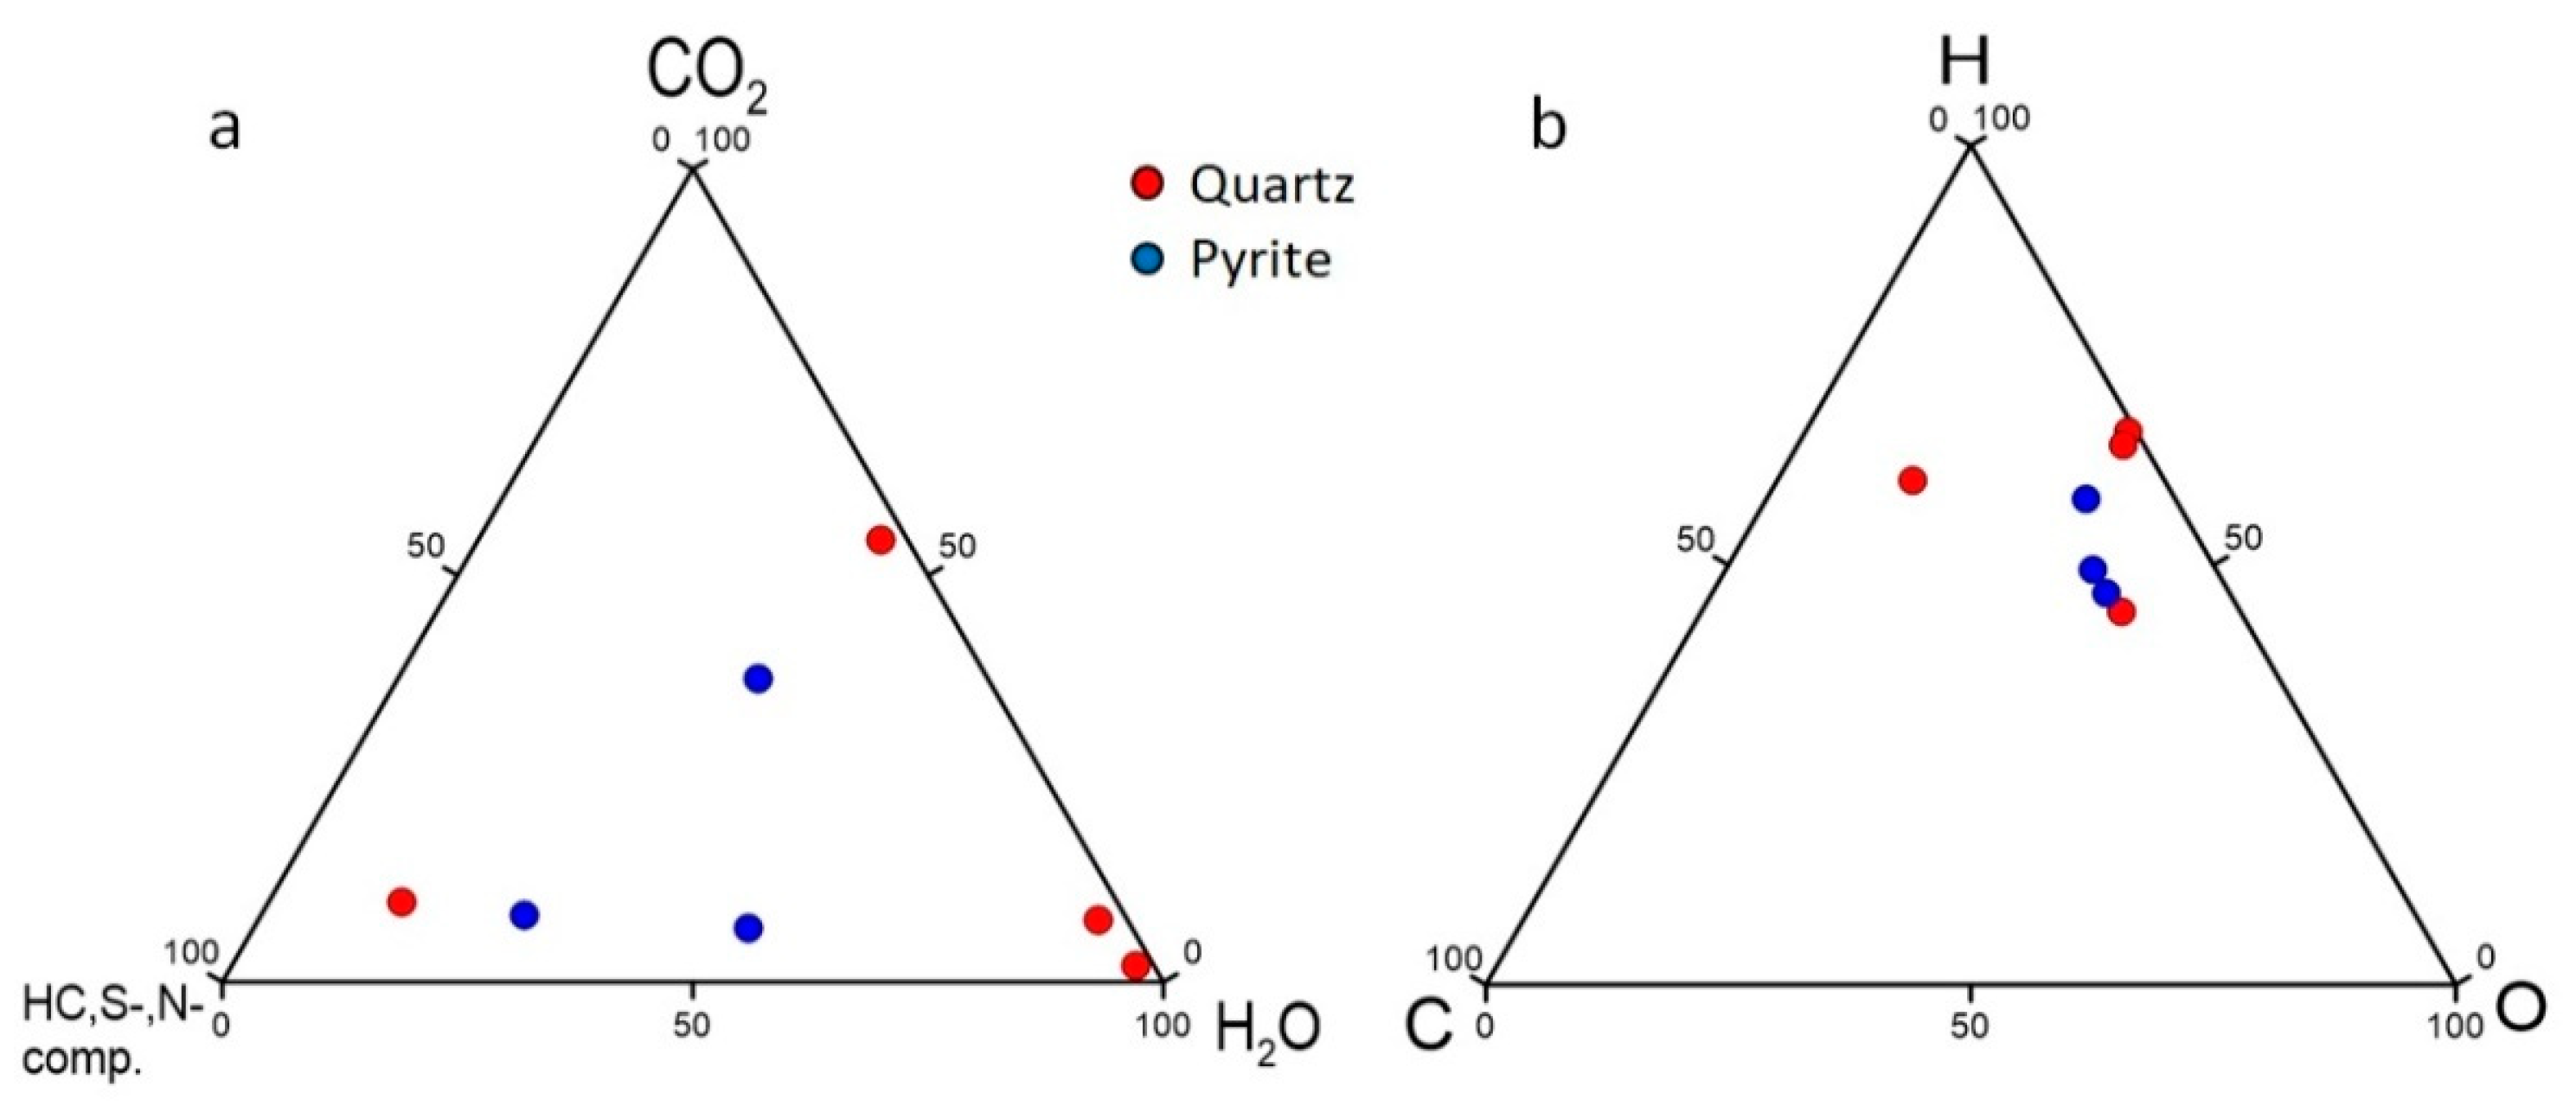
In most samples, the predominant components are H2O (14.25–96.02 rel. %) and CO2 (2.07–54.44 rel. %) (Figure 5). Moreover, a wide range of hydrocarbons and nitrogenated and sulfur compounds were found in the composition of volatiles in the fluid. The total share of these components varies from 1.91 to 75.93 rel. %. Hydrocarbons are presented by oxygen-free aliphatic (paraffins and olefins), cyclic (cyclic alkanes and alkenes, arenes, and polycyclic aromatic hydrocarbons—PAHs), heterocyclic (dioxanes and furanes), and oxygenated hydrocarbons (alcohols, ethers and esters, aldehydes, ketones, and carboxylic acids).
Aliphatic hydrocarbons are presented by paraffins and olefins. A homologous series of paraffins is from methane (CH4) to 8-methylheptadecane (C18H38), and olefins are from acetylene (C2N2) to 1-heptadecene (C17H34). In most samples, the content of both paraffins and olefins is less than 1 rel. %., while the highest amounts found in quartz 597/145.3 are 3.57 rel. % and 8.71 rel. %, accordingly.
Oxygenated hydrocarbons are presented by alcohols (CH4O–C8H10O3), ethers and esters (C4H8O–C14H26O2), aldehydes (CH2O–C18H36O), ketones (C3H6O–C16H32O), and carboxylic acids (CH2O2–C14H28O2). Their content varies greatly in both quartz and pyrite. In most pyrite samples, the proportion of these groups of oxygenated compounds is higher than their content in quartz. Quartz 597/145.3 is characterized by the highest contents of oxygenated hydrocarbons: 2.69 rel. % alcohols, 31.16 rel. % ethers and esters, 8.74 rel. % aldehydes, 3.75 rel. % ketones, and 6.45 rel. % carboxylic acids.
Heterocyclic compounds (C4H4O–C13H22O) represented by dioxanes and furans were found in subordinate amounts (0.01–0.47 rel. %) in the fluids from both quartz and pyrite.
The content of nitrogenated compounds in the mineralizing fluids varies from 0.22 to 5.62 rel. %. The predominant component in most samples is molecular nitrogen (N2), the proportion of which is 0.159–5.157 rel. %. Other nitrogenated compounds (H3N, nitriles, and amides) are found in subordinate amounts in most cases.
From 15 to 25 different sulfur compounds were found in the mineralizing fluids. Fluids from pyrite contain higher concentrations of sulfur compounds than ones from quartz. The share of sulfur compounds in quartz is 0.11–1.3, while in pyrite, it is 14.8–45.4 rel. %. The prevailing component is SO2, and its share is 14.6–44.95 rel. % in the fluids from sulfides and 0.088–0.963 rel. % in ones from quartz. Other sulfur and sulfonated compounds are found in subordinate amounts in both quartz and pyrite. The content of H2S, COS, CH4S, CS2, C2H6S, C2H6S2, and thiophenes varies from 0.001 to 0.188 rel. % (Tables S1–S7).
Halogenated compounds found in the mineralizing fluids are presented by 1-Chlorobutane C4H9Cl, 3-Chlorohexane (C6H13Cl), 1,1,1,3-Tetrachloropropane (C3H4Cl4), (Fluoromethyl)benzene (C7H7F), 5-Fluoro-m-xylene, 2-Fluoro-m-xylene, 3-Fluoro-o-xylene (C8H9F), 1-(Chloromethyl)-2-fluoro-benzene (C7H6ClF), 3,3,3-Trifluoro-1-propanol (C3H5F3O), N-Ethyl-N-isopropyl aminoethyl-2-chloride (C7H16ClN), and (4,4-Difluorocyclohexyl)methanol (C7H12F2O), whose content does not exceed 0.058 rel. % (Tables S1–S7).
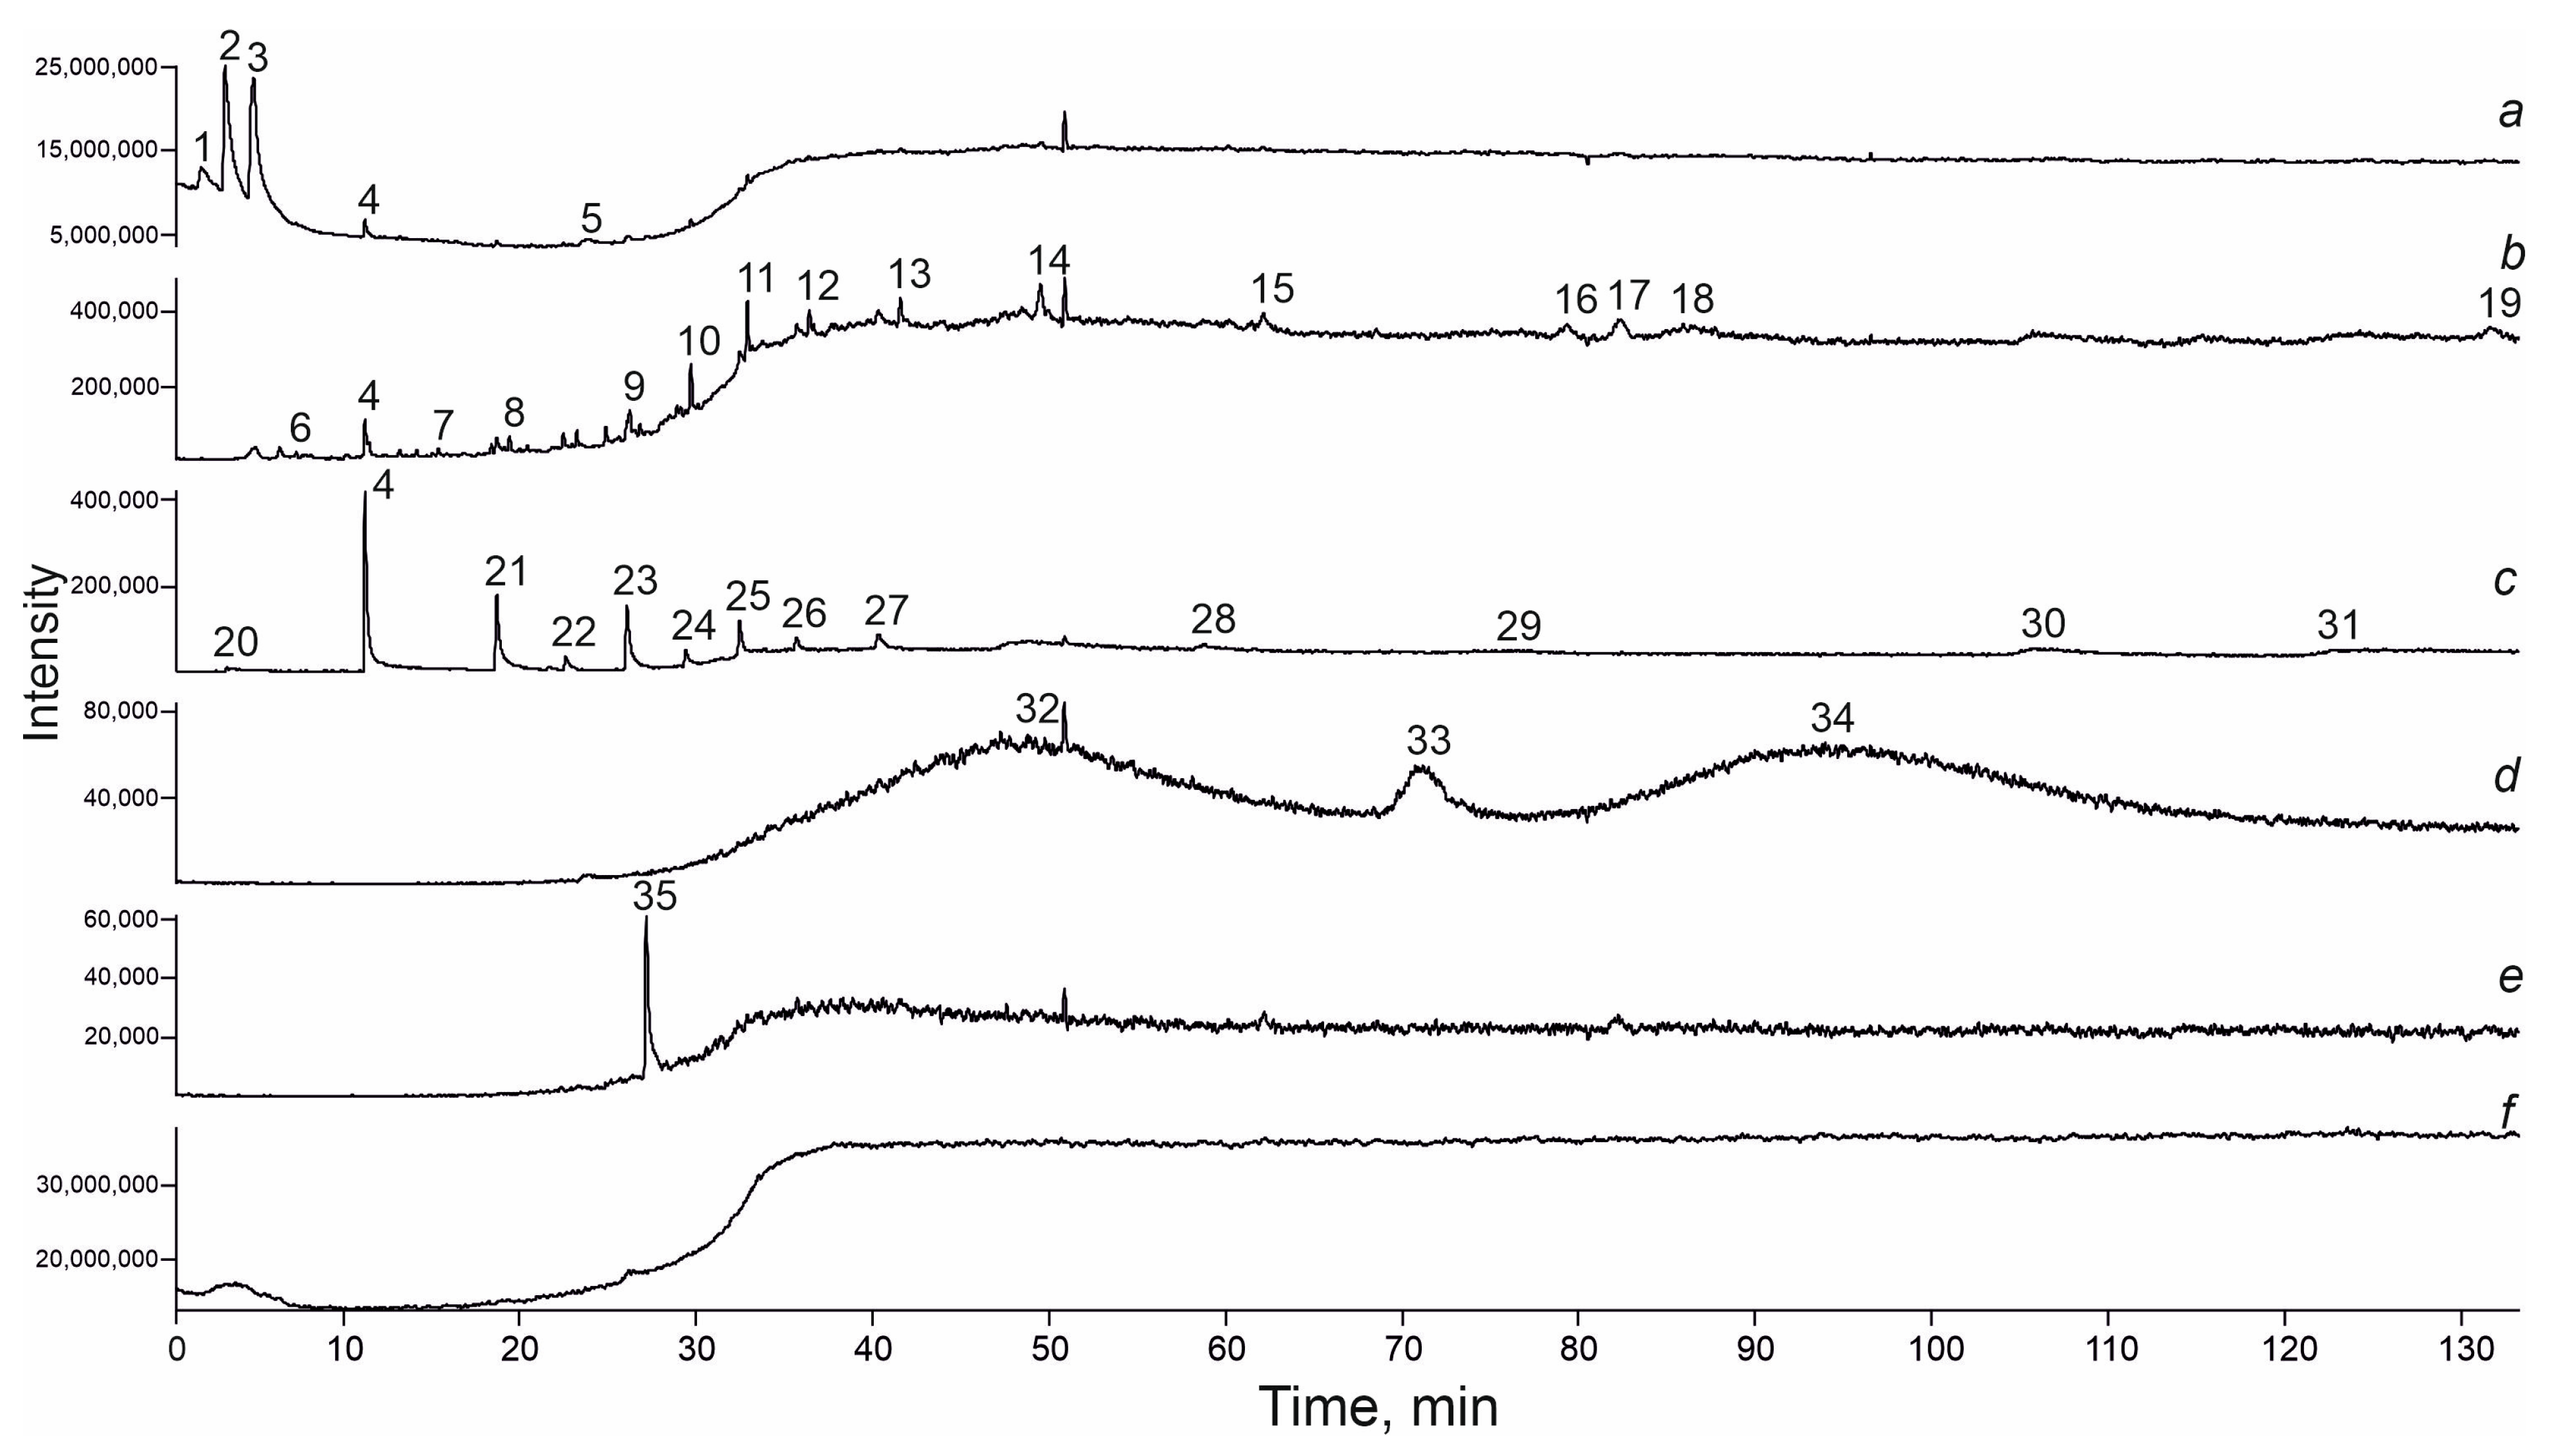
Figure 6 and Figure 7 demonstrate typical chromatograms of gas mixture released from quartz and pyrite.
The atomic ratio H/(H + O) is 0.51–0.81 in quartz and 0.53–0.64 in pyrite. The ratio CO2/(CO2 + H2O) is 0.02–0.56 in quartz and 0.11–0.49 in pyrite.

5. Discussion

5.1. Fluid Composition

From the detailed analysis of the fluid composition, we conclude that the mineralizing fluids of the Konduyak deposit were a complex C-H-O-S-N multi-component mixture (up to 302 compounds). In general, the fluid can be defined as S–N–HC–water–carbon dioxide (Figure 8). The predominant components are water and carbon dioxide; the fluid in pyrite has a high SO2 content. The change in the CO2/(CO2 + H2O) ratio from 0.02 to 0.56 and the H/(H + O) ratio from 0.51 to 0.81 indicates fluctuations in redox conditions during mineral precipitation. The difference in the composition of the fluid from quartz and pyrite can be explained by changing conditions during the fluid boiling process.
Hydrocarbons and nitrogenated and sulfur compounds are constantly present in the fluids in both quartz and pyrite (Figure 5 and Figure 8). Quite similar fluid compositions were established for other deposits of the Yenisey ridge—the Sovetskoe [20], Olympiada [24], Blagodatnoye [7], Dobroe [25], and Eldorado [40]. Organic, sulfur, and nitrogenated compounds were also found in significant quantities in the fluids trapped by the quartz, calcite arsenopyrite, pyrite, and native gold of these deposits. Between 62 and 212 compounds have been identified in their mineralizing fluids. It should be noted that the ore associations of these deposits were generally formed by fluids with a high content of organic compounds and their derivatives (up to 85 rel. %). Strong variations in CO2/(CO2 + H2O) and H/(H + O) were also found. This allows us to consider the process of the formation of the Yenisei gold-bearing metallogenic province as a multiplex evolution of a single ore system. Presumably, various volatile compounds were released from the underlying rocks as a result of metamorphism during the tectonic evolution of the Yenisei orogen. The metal-bearing fluids then circulated in the Earth’s crust and finally reached the discharge site along zones weakened by fault structures.

5.2. The Role of Various Volatiles in Ore Formation

Currently, two main mechanisms of gold migration are considered: various Au-complexes in solution and in the form of nanoparticles [41,42,43,44,45]. Crustal fluids play a significant role in the formation of ore deposits as they can contain very large amounts of solutes. The presence of various volatile components affects a lot of the ability of a fluid to dissolve, transport, and deposit matter. Carbon dioxide provides the buffering capacity of the fluid to maintain elevated metal concentration (including gold) [46,47]. Hydrocarbons also contribute to increasing the solubility of gold in solution. It has been experimentally established that various natural crude oils can be powerful agents of metal mobilization and may provide a means for concentrating metals to the levels required for the formation of ore deposits [48]. Paraffins, olefins, naphthenes, and aromatic hydrocarbons that are the main constituents of crude oil were found in the mineralizing fluids of the Koduyak gold deposit (1.58–69.01 rel. %). Thermodynamic modeling [49] has shown that the organic compounds have strong stability in the lower crustal conditions and are able to form Au-organic complexes such as Au(CH3COO) and Au(CH3COO)2 in the ore-forming fluids. It has also been shown that Au-organic compounds are stable over a wide temperature and pressure range and are also sensitive to changes in these parameters [50,51]. As for the sulfur compounds, their composition and concentration in solution also influence the process of the formation of orogenic gold deposits of the quartz-vein type [52]. Sulfur species can form Au-compounds such as AuHS(aq), Au(HS)2, Au(SCN), and Au(S2O3)−3, which react strongly to changes in redox conditions and then precipitate minerals [50,51,52]. The gold mineralization of the Yenisey ridge is characterized by wide temperature and pressure ranges, as well as changing redox conditions during formation [7,14,24,25,53]. When the conditions change, Au-complexes disintegrate and the crystallization of minerals occurs. All this gives us reason to assume that organic and S-N-compounds found in the fluids of the Konduyak deposit have favorably affected ore formation.
The involvement of organic compounds in gold deposit formation was also found in other regions. The presence of ethane and methane has been established in the ore- forming fluids of the following hydrothermal orogenic gold deposits: the Perron and Detour deposits in the Abitibi belt, the Mana district in Burkina Faso, and the Nubian Shield in northern Sudan [18,19,54]. The fluids of the gold deposits in southern Tibet also contain organic compounds such as alkanes and PAHs [55,56].

5.3. Potential Fluid Origin

The evolution of such a large-scale orogen as the Yenisei ridge led to the physical and chemical transformations of the original rocks, during which the processes of the devolatilization of the rocks occurred. The most studied processes are dehydration and decarbonation, which enrich the fluid with H2O and CO2 [57,58,59]. The release of sulfur compounds during the metamorphism of pyrite-bearing sedimentary rocks is also possible [60,61]. Speaking about diverse organic compounds in the ore-forming fluids of orogenic gold deposits, their origin remains highly debatable. In general, there are two ways of their formation—biogenic and abiogenic. The decomposition of organic matter and microbial processes are biogenic processes that can form hydrocarbons [62,63]. The abiogenic origin implies a Fischer–Tropsch-type process in which CH4 and other organic compounds (C1–C70+) can be synthesized [64]. Recent experimental studies have confirmed that various abiotic hydrocarbons can be produced rather extensively in the Earth’s interior even without living organisms [65]. It is known that terpenoids can be used as biomarkers to determine the biogenic origin [66]. No such biomarkers were found in the fluids of the Konduyak deposit. However, this fact does not exclude the possibility that organic compounds could have been formed by several mechanisms, both abiogenic and biogenic (e.g., by the thermogenic degradation of older organic matter). Therefore, we can assume that the organic compounds in the mineralizing fluid of the Konduyak gold deposit were formed during prolonged rock alteration and further metamorphic fluid evolution. The source of the volatiles could have been the deeply buried crustal rocks of the Yenisei ridge.

6. Concluding Remarks

In this study, we have analyzed in detail the volatile composition of the mineralizing fluids of the Konduyak gold deposit. Based on the data obtained by high-precision GC-MS analysis, we infer that the ore-forming fluid is a complex C-H-O-S-N multi-component mixture. Between 232 and 302 different compounds were found in the gas mixture extracted from quartz and pyrite samples. The predominant components are water and carbon dioxide. Variations in their content reflect changes in the redox conditions of the environment of mineral formation.
A wide range of hydrocarbons and sulfur and nitrogenated compounds were also found in the fluids. Their total content ranges from 1.91 to 75.93 rel. %. Such a diverse composition of volatiles could have contributed to the saturation of fluids with ore components. Gold could have been transported in the form of organometallic, nitrogen-, and sulfur-containing complexes. These complexes could have been destroyed due to changes in the redox conditions leading to the crystallization of minerals.
The fluids of the Konduyak deposit are similar in composition to the fluids of other deposits of the Yenisei ridge, which allows us to consider the formation of the gold deposits as the evolution of a large-scale ore-bearing system. Presumably, various volatile compounds were released from the deeply buried rocks as a result of metamorphism during the extensive tectonic evolution of the Yenisei orogenic belt.

Supplementary Materials

The following supporting information can be downloaded at https://www.mdpi.com/article/10.3390/min15030278/s1, Table S1: Results of GC–MS analysis of volatiles extracted by mechanical shock destruction from quartz of the Konduyak deposit; Table S2: Results of GC–MS analysis of volatiles extracted by mechanical shock destruction from quartz of the Konduyak deposit; Table S3: Results of GC–MS analysis of volatiles extracted by mechanical shock destruction from pyrite of the Konduyak deposit; Table S4: Results of GC–MS analysis of volatiles extracted by mechanical shock destruction from quartz of the Konduyak deposit; Table S5: Results of GC–MS analysis of volatiles extracted by mechanical shock destruction from pyrite of the Konduyak deposit; Table S6: Results of GC–MS analysis of volatiles extracted by mechanical shock destruction from quartz of the Konduyak deposit; Table S7: Results of GC–MS analysis of volatiles extracted by mechanical shock destruction from pyrite of the Konduyak deposit.

Author Contributions

Conceptualization, E.S.; Investigation, T.B., E.S. and M.K.; Resources, A.S. and S.S.; Visualization, T.B., E.S. and M.P.; Writing—original draft, E.S.; Writing—review and editing, T.B., N.G., A.T. and A.S.; Supervision, A.T. All authors have read and agreed to the published version of the manuscript.

Funding

The reported study was funded by Russian Science Foundation (№ 23-77-01063, https://rscf.ru/project/23-77-01063/) (accessed on 11 February 2025).

Data Availability Statement

Data are contained within the article and Supplementary Materials.

Acknowledgments

We sincerely thank two anonymous reviewers whose valuable comments helped improve the article.

Conflicts of Interest

The authors declare no conflicts of interest.

References

  1. Ermakov, N.P.; Dolgov, Y.A. Thermobarogeochemistry; Nedra: Moscow, Russia, 1979; 271p. (In Russian) [Google Scholar]
  2. Roedder, E.; Bodnar, R.J. Fluid inclusion studies of hydrothermal deposits. In Geochemistry of Hydrothermal Ore Deposits, 3rd ed.; Barnes, H.L., Ed.; John Wiley & Sons: New York, NY, USA, 1997; pp. 657–698. [Google Scholar]
  3. Wilkinson, J.J. Fluid inclusions in hydrothermal ore deposits. Lithos 2001, 55, 229–272. [Google Scholar] [CrossRef]
  4. Goldfarb, R.J.; Groves, D.I. Orogenic gold: Common vs. evolving fluid and metal sources through time. Lithos 2015, 223, 2–26. [Google Scholar] [CrossRef]
  5. Chi, G.; Diamond, L.W.; Lu, H.; Lai, J.; Chu, H. Common problems and pitfalls in fluid inclusion study: A review and discussion. Minerals 2020, 11, 7. [Google Scholar] [CrossRef]
  6. Groves, D.I.; Goldfarb, R.J.; Santosh, M. The conjunction of factors that lead to formation of giant gold provinces and deposits in non-arc settings. Geosci. Front. 2016, 7, 303–314. [Google Scholar] [CrossRef]
  7. Shaparenko, E.; Gibsher, N.; Tomilenko, A.; Sazonov, A.; Bul’bak, T.; Ryabukha, M.; Khomenko, M.; Silyanov, S.; Nekrasova, N.; Petrova, M. Ore-Bearing Fluids of the Blagodatnoye Gold Deposit (Yenisei Ridge, Russia): Results of Fluid Inclusion and Isotopic Analyses. Minerals 2021, 11, 1090. [Google Scholar] [CrossRef]
  8. Kryazhev, S.G.; Fridovsky, V.Y. The Fluid Regime of Orogenic Gold Deposit Formation in the Yana-Kolyma Belt. Russ. J. Pac. Geol. 2023, 17, 622–634. [Google Scholar] [CrossRef]
  9. Williams-Jones, A.; Migdisov, A.; Archibald, S.; Xiao, Z. Vapor-transport of ore metals. Geochem. Soc. Spec. Publ. 2002, 7, 279–305. [Google Scholar]
  10. Heinrich, C.A.; Candela, P.A. Fluids and Ore Formation in the Earth’s Crust. In Treatise on Geochemistry, 2nd ed.; Holland, H.D., Turekian, K.K., Eds.; Elsevier: Amsterdam, The Netherlands, 2014; Volume 13, pp. 1–28. [Google Scholar] [CrossRef]
  11. Burke, E.A. Raman microspectrometry of fluid inclusions. Lithos 2001, 55, 139–158. [Google Scholar] [CrossRef]
  12. Frezzotti, M.L.; Tecce, F.; Casagli, A. Raman spectroscopy for fluid inclusion analysis. J. Geochem. Explor. 2012, 112, 1–20. [Google Scholar] [CrossRef]
  13. Pankrushina, E.A.; Krupenin, M.T.; Shchapova, Y.V.; Kobuzov, A.S.; Garaeva, A.A.; Votyakov, S.L. The Study of Fluid Inclusion Salinity in Minerals by Raman Spectroscopy Revisited. In Minerals: Structure, Properties, Methods of Investigation; Votyakov, S., Kiseleva, D., Grokhovsky, V., Shchapova, Y., Eds.; Springer: Cham, Switzerland, 2020; pp. 175–183. [Google Scholar] [CrossRef]
  14. Tomilenko, A.A.; Gibsher, N.A.; Dublaynsky, Y.V.; Dallai, L. Geochemical and isotopic properties of fluid from gold-bearing and barren quartz veins of the Sovetskoye deposit (Siberia, Russia). Econ. Geol. 2010, 105, 375–394. [Google Scholar] [CrossRef]
  15. Prokof’ev, V.Y.; Akinfiev, N.N.; Selektor, S.L. Gas mixing with aqueous solution in the ore-forming hydrothermal process: An example of gold. Geochem. Int. 2016, 54, 403–414. [Google Scholar] [CrossRef]
  16. Volkov, A.V.; Prokofiev, V.Y.; Aristov, V.V.; Sidorova, N.V. Conditions of Formation of the Pavlik Gold–Sulfide–Quartz Deposit (Northeast of Russia) According to a Study of Fluid Inclusions. Geol. Ore Depos. 2024, 66, 191–202. [Google Scholar] [CrossRef]
  17. Fridovsky, V.; Kryazhev, S.; Polufuntikova, L.; Kudrin, M.; Anisimova, G. Geology, fluid inclusions, mineral and (S-O) isotope chemistry of the Badran orogenic Au deposit, Yana-Kolyma belt, eastern Siberia: Implications for ore genesis. Front. Earth Sci. 2024, 12, 1340112. [Google Scholar] [CrossRef]
  18. Gaboury, D.; Keita, M.; Guha, J.; Lu, H.-Z. Mass spectrometric analysis of volatiles in fluid inclusions decrepitated by controlled heating under vacuum. Econ. Geol. 2008, 103, 439–443. [Google Scholar] [CrossRef]
  19. Gaboury, D. Volatile Composition of Fluid Inclusions in Gold-Bearing Quartz Veins Analyzed by Solid-Mass Spectrometry: Method and Contributions to the Orogenic Metallogenic Model and Exploration. In Ore Geology [Working Title]; IntechOpen: London, UK, 2024. [Google Scholar] [CrossRef]
  20. Bul’bak, T.A.; Tomilenko, A.A.; Gibsher, N.A.; Sazonov, A.M.; Shaparenko, E.O.; Ryabukha, M.A.; Khomenko, M.O.; Sil’yanov, S.A.; Nekrasova, N.A. Hydrocarbons in Fluid Inclusions from Native Gold, Pyrite, and Quartz of the Sovetskoe Deposit (Yenisei Ridge, Russia) According to Pyrolysis-Free Gas Chromatography-Mass Spectrometry Data. Russ. Geol. Geophys. 2020, 61, 1260–1282. [Google Scholar] [CrossRef]
  21. Han, Y.; Noah, M.; Lüders, V.; Körmös, S.; Schubert, F.; Poetz, S.; Horsfield, B.; Mangelsdorf, K. Fractionation of hydrocarbons and NSO-compounds during primary oil migration revealed by high resolution mass spectrometry: Insights from oil trapped in fluid inclusions. Int. J. Coal Geol. 2022, 254, 103974. [Google Scholar] [CrossRef]
  22. Salvi, S.; Williams-Jones, A.E. Bulk analysis of volatiles in fluid inclusions. In Fluid Inclusions: Analysis and Interpretation; Samson, I., Anderson, A., Marshall, D., Eds.; Mineralogical Association of Canada: Quebec, QC, Canada, 2003; pp. 279–305. [Google Scholar] [CrossRef]
  23. Akande, W.G. A Review of Experimental Procedures of Gas Chromatography-Mass Spectrometry (GC-MS) and Possible Sources of Analytical Errors. Earth Sci. 2012, 1, 1–9. [Google Scholar] [CrossRef]
  24. Gibsher, N.A.; Tomilenko, A.A.; Bul’bak, T.A.; Ryabukha, M.A.; Khomenko, M.O.; Shaparenko, E.O.; Sazonov, A.V.; Sil’yanov, S.A.; Nekrasova, N.A. The Olimpiadinskoe gold deposit (Yenisei ridge): Temperature, pressure, composition of ore-forming fluids, 34S in sulfides, 3He/4He of fluids, Ar-Ar age, and duration of formation. Russ. Geol. Geophys. 2019, 60, 1043–1059. [Google Scholar] [CrossRef]
  25. Shaparenko, E.; Gibsher, N.; Khomenko, M.; Tomilenko, A.; Sazonov, A.; Bul’bak, T.; Silyanov, S.; Petrova, M.; Ryabukha, M. Parameters for the Formation of the Dobroe Gold Deposit (Yenisei Ridge, Russia): Evidence from Fluid Inclusions and S–C Isotopes. Minerals 2023, 13, 11. [Google Scholar] [CrossRef]
  26. Nozhkin, A.D.; Likhanov, I.I. Gold in the Precambrian rocks of the Yenisei ridge (East Siberia) and geological and geochemical prerequisites for the formation of gold mineralization in the central metallogenic belt of the region. Geospheric Res. 2023, 2, 49–70. [Google Scholar] [CrossRef]
  27. Kuzmichev, A.B.; Sklyarov, E.V. The Precambrian of Transangaria, Yenisei Ridge (Siberia): Neoproterozoic microcontinent, Grenville-age orogen, or reworked margin of the Siberian craton? J. Asian Earth Sci. 2016, 115, 419–441. [Google Scholar] [CrossRef]
  28. Bershtein, P.S. Structural factors determining the patterns of placement and nature of gold mineralization of the Yenisei Ridge. In Proceedings of the NIGRI-Gold Institute; OBTI: Moscow, Russia, 1951. (In Russian) [Google Scholar]
  29. Bernstein, P.S.; Petrovskaya, N.V. Sovetskoe Gold-Ore Deposit (Yenisei Ridge); Geology of the Major Gold-Ore Deposits of the USSR; Nauka: Moscow, Russia, 1954; Volume 6, 162p. (In Russian) [Google Scholar]
  30. Petrovskaya, N.V. Gold Mineralization of the Yenisei Ridge and Features of the Processes of Formation of Gold-Bearing Ores. Ph.D. Thesis, NIGRIZOLOTO, Moscow, Russia, 1954; 86p. (In Russian). [Google Scholar]
  31. Li, L.V.; Datsenko, V.M. The position of granitoid formations and the place of gold mineralization in the history of the development of the Yenisei Ridge. Bull. Tomsk. Polytech. Univ. Geo Assets Eng. 1970, 239, 60–65. (In Russian) [Google Scholar]
  32. Serdyuk, S.S.; Zonov, V.A. Predictive assessment of gold content of the Ayakhtinsky ore cluster (South Yenisei gold-bearing region). In Geology and Mineral Resources of Central Siberia; KNIIGiMS: Krasnoyarsk, Russia, 2003; pp. 96–103. (In Russian) [Google Scholar]
  33. Serdyuk, S.S. Gold-Bearing Provinces of Central Siberia: Geology, Minerageny and Development Prospects; KNIIGiMS: Krasnoyarsk, Russia, 2004; 480p. (In Russian) [Google Scholar]
  34. Serdyuk, S.S.; Komorovsky, Y.E.; Zverev, A.I.; Oyaber, V.K.; Vlasov, V.S.; Babushkin, V.E.; Kirillenko, V.A.; Zemlyansky, S. Models of Gold Deposits in Yenisei Siberia; Siberian Federal University: Krasnoyarsk, Russia, 2010; 584p. (In Russian) [Google Scholar]
  35. Pitulko, V.M.; Mkrtychyan, A.K.; Yurkevich, L.G. Theory and Practice of Intensive Technology of Geochemical Works in Forecasting and Prospecting for Gold Ore Deposits; Nestor-History: St. Petersburg, Russia, 2014; 424p. (In Russian) [Google Scholar]
  36. Maltzeva, G.D.; Nikanuk, T.S. Conditions of ore formation of some hydrothermal gold deposits. Proc. Sib. Dep. Sect. Earth Sci. Russ. Acad. Nat. Sciences. Geol. Explor. Dev. Miner. Depos. 2011, 2, 25–31. (In Russian) [Google Scholar]
  37. Maltzeva, G.D.; Nikanuk, T.S. Gold morphology of certain hydrothermal deposits of Siberia and Far East. Proc. Sib. Dep. Sect. Earth Sci. Russ. Acad. Nat. Sciences. Geol. Explor. Dev. Miner. Depos. 2010, 2, 21–26. (In Russian) [Google Scholar]
  38. Tomilenko, A.A.; Bul’bak, T.A.; Timina, T.Y.; Shaparenko, E.O.; Simonov, V.A.; Laptev, Y.V. Composition of volatiles of sulfide deposits and carbonate structures in submarine hydrothermal fields of the Mid-Atlantic Ridge. Mar. Geol. 2022, 444, 106713. [Google Scholar] [CrossRef]
  39. Roedder, E. Fluid Inclusions; Reviews in Mineralogy; Mineralogical Society of America: Chantilly, VA, USA, 1984; Volume 12, 644p. [Google Scholar]
  40. Gibsher, N.A.; Tomilenko, A.A.; Sazonov, A.M.; Bul’bak, T.A.; Khomenko, M.O.; Ryabukha, M.A.; Shaparenko, E.O.; Sil’yanov, S.A.; Nekrasova, N.A. Ore–bearing fluids of the Eldorado gold deposit (Yenisei Ridge, Russia). Russ. Geol. Geophys. 2018, 59, 983–996. [Google Scholar] [CrossRef]
  41. Petrella, L.; Thébaud, N.; Fougerouse, D.; Evans, K.; Quadir, Z.; Laflamme, C. Colloidal gold transport: A key to high-grade gold mineralization. Miner. Depos. 2020, 55, 1247–1254. [Google Scholar] [CrossRef]
  42. Hastie, E.C.G.; Schindler, M.; Kontak, D.J.; Lafrance, B. Transport and coarsening of gold nanoparticles in an orogenic deposit by dissolution–reprecipitation and Ostwald ripening. Commun. Earth Environ. 2021, 2, 57. [Google Scholar] [CrossRef]
  43. Petrella, L.; Thébaud, N.; Fougerouse, D.; Tattitch, B.; Martin, L.; Turner, S.; Suvorova, A.; Gain, S. Nanoparticle suspensions from carbon-rich fluid make high-grade gold deposits. Nat. Commun. 2022, 13, 3795. [Google Scholar] [CrossRef]
  44. Goldfarb, R.J.; Pitcairn, I. Orogenic gold: Is a genetic association with magmatism realistic? Miner. Depos. 2023, 58, 5–35. [Google Scholar] [CrossRef]
  45. Prokofiev, V.Y.; Banks, D.A.; Lobanov, K.V.; Selektor, S.L.; Milichko, V.A.; Borovikov, A.A.; Chicherov, M.V. Transport of Au–Ag Nanoparticles in Dense Carbon Dioxide Fluid of the Middle Crust. Minerals 2024, 14, 1224. [Google Scholar] [CrossRef]
  46. Phillips, G.N.; Evans, K.A. Role of CO2 in the formation of gold deposits. Nature 2004, 429, 860–863. [Google Scholar] [CrossRef]
  47. Migdisov, A.A.; Guo, X.; Xu, H.; Williams-Jones, A.E.; Sun, C.J.; Vasyukova, O.; Sugiyama, I.; Fuchs, S.; Pearce, K.; Roback, R. Hydrocarbons as ore fluids. Geochem. Perspect. Lett. 2017, 5, 47–52. [Google Scholar] [CrossRef]
  48. Ding, Z.; Sun, X.; Xu, X.; Ling, S.; Xie, Z. Likely gold transportation via organic complexes in sediment-hosted orogenic gold deposits in southern Tibet: From the perspective of thermodynamic modelling. J. Asian Earth Sci. 2024, 264, 106068. [Google Scholar] [CrossRef]
  49. Greenwood, P.F.; Brocks, J.J.; Grice, K.; Schwark, L.; Jaraula, C.; Dick, J.M.; Evans, K.A. Organic geochemistry and mineralogy. I. Characterisation of organic matter associated with metal deposits. Ore Geol. Rev. 2013, 50, 1–27. [Google Scholar] [CrossRef]
  50. Li, H.; Wang, Q.; Weng, W.; Dong, C.; Yang, L.; Wang, X.; Deng, J. Co-precipitation of gold and base metal sulfides during fluid boiling triggered by fault-valve processes in orogenic gold deposits. Ore Geol. Rev. 2022, 149, 105090. [Google Scholar] [CrossRef]
  51. Lyakhov, Y.V.; Pavlun’, N.N. Some geological and geochemical features of gold concentration processes in metamorphic-hydrothermal and magmatic-hydrothermal mineral-forming systems. In Ore-Forming Processes: From Genetic Concepts to Forecasting and Discovery of New Ore Provinces and Deposits; IGEM RAS: Moscow, Russia, 2013; p. 144. (In Russian) [Google Scholar]
  52. Haghi, A.; Raissi, H.; Hashemzadeh, H.; Farzad, F. On the role of alkanethiol Au complex in the formation of gold deposits; an in-silico approach. Chem. Geol. 2022, 610, 121101. [Google Scholar] [CrossRef]
  53. Kryazhev, S.G.; Berkovsky, E.M. The Regime of the Olimpiada Gold–Sulfide Deposit Formation. Geol. Ore Depos. 2023, 65 (Suppl. 2), 221–231. [Google Scholar] [CrossRef]
  54. Gaboury, D. The Neglected Involvement of Organic Matter in Forming Large and Rich Hydrothermal Orogenic Gold Deposits. Geosciences 2021, 11, 344. [Google Scholar] [CrossRef]
  55. Zhai, W.; Sun, X.; Yi, J.; Zhang, X.; Mo, R.; Zhou, F.; Wei, H.; Zeng, Q. Geology, geochemistry, and genesis of orogenic gold-antimony mineralization in the Himalayan Orogen, South Tibet, China. Ore Geol. Rev. 2014, 58, 68–90. [Google Scholar] [CrossRef]
  56. Ding, Z.; Sun, X.; Hu, S.; Chen, H.; Li, D.; Fu, Y.; Xu, L.; Wu, Z.; Huang, F. Role of carbonaceous material in gold precipitation for orogenic gold deposits: A case study of the Bangbu gold deposit in southern Tibet, China. Ore Geol. Rev. 2022, 152, 105231. [Google Scholar] [CrossRef]
  57. Xia, Q.-X.; Zheng, Y.-F.; Zhou, L.-G. Dehydration and melting during continental collision: Constraints from element and isotope geochemistry of low-T/UHP granitic gneiss in the Dabie orogen. Chem. Geol. 2008, 247, 36–65. [Google Scholar] [CrossRef]
  58. Groppo, C.; Roflo, F.; Frezzotti, M.L. CO2 outgassing during collisional orogeny is facilitated by the generation of immiscible fluids. Commun. Earth Environ. 2022, 3, 13. [Google Scholar] [CrossRef]
  59. Stewart, E.M.; Penman, D.E. Enhanced metamorphic CO2 release on the Proterozoic Earth. Proc. Natl. Acad. Sci. USA 2024, 121, e2401961121. [Google Scholar] [CrossRef] [PubMed]
  60. Virtanen, V.J.; Heinonen, J.S.; Märki, L.; Galvez, M.E.; Molnár, F. Sedimentary and metamorphic processes priming black shale for magmatic assimilation of sulfur: An example from the Virginia Formation, Minnesota, United States. Miner. Depos. 2024, 60, 303–319. [Google Scholar] [CrossRef]
  61. Coldebella, B.; LaFlamme, C.; Malta, I.S.; Guilmette, C.; Barré, G.; Beaudoin, G.; Martin, L.; Savard, D. The chemical and isotopic characterization of the pyrite to pyrrhotite desulfidation reaction across the metamorphic gradient of a metasedimentary basin. Geochim. Cosmochim. Acta, 2025; in press. [Google Scholar] [CrossRef]
  62. Hunt, J.M.; Philp, R.P.; Kvenvolden, K.A. Early developments in petroleum geochemistry. Org. Geochem. 2002, 33, 1025–1052. [Google Scholar] [CrossRef]
  63. Katz, B.J. Microbial processes and natural gas accumulations. Open Geol. J. 2011, 5, 75–83. [Google Scholar] [CrossRef]
  64. Mazurova, K.; Miyassarova, A.; Eliseev, O.; Stytsenko, V.; Glotov, A.; Stavitskaya, A. Fischer–Tropsch Synthesis Catalysts for Selective Production of Diesel Fraction. Catalysts 2023, 13, 1215. [Google Scholar] [CrossRef]
  65. Cho, Y.S.; Oh, I.-H.; Kim, J.H.; Kim, J.I.; Lee, K.-B.; Nah, I.W. Production of abiotic or biogenic hydrocarbons on rock particles in the presence of H2O and carbon compounds. Sci. Rep. 2025, 15, 2085. [Google Scholar] [CrossRef]
  66. Konopleva, I. Possible application of bicyclic sesquiterpanes to evaluate the thermal maturity of oils. A study of Kamchatka and Chukotka oils from Cenozoic deposits, Russia. Org. Geochem. 2024, 187, 104717. [Google Scholar] [CrossRef]
Figure 1. (a) Location of the Konduyak gold deposit, (b) simplified geological scheme of the Ayakhta gold cluster, and (c) a geological cross-section (along the line (A,A1)). Modified from [35]. 1—Alkaline syenites (EγV1sv); 2—granites of the Tatar–Ayakhta complex (γ-γδR3ta); 3—sericite–chlorite schists of the Gorbilok suite (R2gr); 4—carbonaceous sericite–chlorite schists of the Korda suite (R1kd); 5—marble and mica schists of the Lower Proterozoic Penchenga suite (PR 2 1 pn); 6—contact hornfelses; 7—zones of sulfidized weakly gold-bearing metasomatites; 8—ore zones; 9—Au placers; 10—faults, both confirmed (a) and expected (b); 11—cross-section.
Minerals 15 00278 g001
Figure 2. Ore mineralization of the Konduyak gold deposit: Pyh—pyrrhotite (a); Apy—arsenopyrite (b); Py—pyrite (c); Au—native gold (d,e).
Minerals 15 00278 g002
Figure 3. Fluid inclusions in quartz from the Konduyak gold deposit: (a) single-phase vapor or liquid FIA; (b) two-phase vapor–aqueous FIA.
Minerals 15 00278 g003
Figure 4. Typical Raman spectra of CO2 (a), CH4 (b), N2 (c), and H2O (d) identified in individual fluid inclusions in quartz from the Konduyak gold deposit.
Minerals 15 00278 g004
Figure 5. Composition of the mineralizing fluid in quartz and pyrite from the Konduyak gold deposit (GC-MS data). Q—quartz; Py—pyrite; sulfur compounds—sum of sulfur compounds; nitrogenated compounds—sum of nitrogenated compounds; hydrocarbons—sum of oxygen-free, cyclic, heterocyclic, and oxygenated hydrocarbons.
Minerals 15 00278 g005
Figure 6. Results of the GC-MS analysis of volatile components extracted from fluid inclusions in quartz from a quartz vein of the Konduyak deposit (sample 510/88.5). Chromatogram (a) for total ion current (TIC) and reconstructed ion chromatograms for ion current: (b) m/z (43 + 57 + 71 + 85); (c) m/z 60; (d) m/z 149; (e) m/z 123; (f) blank (TIC). 1—carbon dioxide (CO2); 2—water (H2O); 3—acetic acid (C2H4O2); 4—acetaldehyde (C2H4O); 5—pentane (C5H12); 6—heptane (C7H16); 7—3-methyleneheptane (C8H16); 8—heptanal (C7H14O); 9—octanal (C8H16O); 10—nonanal (C9H18O); 11—decanal (C10H20O); 12—undecanal (C11H22O); 13—dodecanal (C12H24O); 14—γ-decalactone (C10H18O2); 15—tridecanal (C13H26O); 16—pentadecane (C15H32); 17—2-tetradecanone (C14H28O); 18—tetradecanal (C14H28O); 19—2-pentadecanone (C15H30O); 20—pentadecanal (C15H30O); 21—8-methylheptadecane (C18H38); 22—γ-tetradecalactone (C14H26O2); 23—butanoic acid (C4H8O2); 24—pentanoic acid (C5H10O2); 25—haxanoic acid (C6H12O2); 26—heptanoic acid (C7H14O2); 27—octanoic acid (C8H16O2); 28—nonanoic acid (C9H18O2); 29—decanoic acid (C10H20O2); 30—dodecanoic acid (C12H24O2); 31—tetradecanoic acid (C14H28O2); 32—4-formylbenzoic acid (C8H6O3); 33—monopropyl phthalate (C11H12O4); 34—2,5-furandicarbaldehyde (C6H4O3).
Minerals 15 00278 g006
Figure 7. Results of the GC-MS analysis of volatile components extracted from fluid inclusions in pyrite from a quartz vein of the Konduyak deposit (sample 510/88.5). Chromatogram (a) for total ion current (TIC) and reconstructed ion chromatograms for ion current: (b) m/z (43 + 57 + 71 + 85); (c) m/z 60; (d) m/z 149; (e) m/z 123; (f) blank (TIC). 1—carbon dioxide (CO2); 2—water (H2O); 3—sulfur dioxide (O2S); 4—acetic acid (C2H4O2); 5—2-propylthiophene (C7H10S); 6—2-propanone (C3H6O); 7—heptane (C7H16); 8—octane (C8H18); 9—octanal (C8H16O); 10—nonanal (C9H18O); 11—decanal (C10H20O); 12—undecanal (C11H22O); 13—dodecanal (C12H24O); 14—tridecanal (C13H26O); 15—hexadecane (C16H34); 16—2-pentadecanone (C15H30O); 17—2-pentadecanal (C15H30O); 18—γ-tridecalactone (C13H24O2); 19—γ-tetradecalactone (C14H26O2); 20—carbonyl sulfide (COS); 21—butanoic acid (C4H8O2); 22—pentanoic acid (C5H10O2); 23—hexanoic acid (C6H12O2); 24—heptanoic acid (C7H14O2); 25—octanoic acid (C8H16O2); 26—nonanoic acid (C9H18O2); 27—decanoic acid (C10H20O2); 28—dodecanoic acid (C12H24O2); 29—tridecanoic acid (C13H26O2); 30—3-methyltridecanoic acid (C14H28O2); 31—tetradecanoic acid (C14H28O2); 32—1-isocyanato-2-methoxybenzene (C8H7NO2); 33—diisopropyl phthalate (C14H18O4); 34—monopropyl phthalate (C11H12O4); 35—2,5-furandicarbaldehyde (C6H4O3).
Minerals 15 00278 g007
Figure 8. Fluid composition in quartz and pyrite from the Konduyak gold deposit based on GC-MS analysis: (a) in terms of major components, (b) in terms of C, H, and O atoms.
Minerals 15 00278 g008
Table 1. Content (rel. %) and quantity (in brackets) of volatile components released during a single impact distraction of fluid inclusions in minerals from the Konduyak gold deposit (GC-MS data).
ComponentsMW *504/120 Quartz510/88.7 Quartz510/88.7 Pyrite588/150 Quartz588/150 Pyrite597/145.3 Quartz597/145.3 Pyrite
Aliphatic hydrocarbons
Paraffins (alkanes) (CH4–C18H38)16–2540.07 (20)0.73 (23)0.52 (15)0.13 (20)0.15 (17)3.57 (20)0.57 (19)
Olefins (alkenes) (C2H2–C17H34)26–2380.11 (37)0.13 (37)0.45 (26)0.11 (35)0.21 (34)8.71 (42)0.60 (32)
Cyclic hydrocarbons
Cycloalkanes, cycloalkenes, arenes,
PAH (C4H6–C15H24)
54–2040.09 (47)0.13 (46)0.93 (29)0.08 (40)0.41 (29)3.39 (40)0.95 (29)
Oxygenated hydrocarbons
Alcohols (CH4O–C8H10O3)32–2140.09 (12)0.06 (10)0.61 (7)0.14 (18)3.90 (14)2.69 (13)0.69 (8)
Ethers and esters (C4H8O–C14H26O2)72–2340.58 (28)0.24 (23)4.17 (17)0.43 (32)0.44 (21)31.16 (29)6.30 (19)
Aldehydes (CH2O–C18H36O)30–2680.22 (27)0.38 (28)2.61 (26)0.36 (28)1.23 (26)8.74 (26)1.90 (28)
Ketones (C3H6O–C16H32O)58–2400.12 (23)0.23 (23)1.59 (21)0.19 (25)0.99 (22)3.75 (23)3.61 (24)
Carboxylic acids (CH2O2–C14H28O2)46–2280.30 (14)0.52 (15)2.90 (16)0.57 (27)1.33 (16)6.45 (13)2.12 (16)
Heterocyclic compounds
Dioxanes, furans (C4H4O–C13H22O)68–1940.01 (25)0.02 (27)0.19 (23)0.02 (27)0.07 (21)0.47 (28)0.17 (30)
Nitrogenated compounds
N2, ammonia, nitriles (N2–C10H21NO)17–1850.22 (20)0.51 (22)4.28 (24)0.57 (31)0.85 (21)5.62 (24)0.91 (27)
Sulfur compounds
H2S, SO2, CS2, COS, thiophenes
(H2S–C12H20S)
34–1960.11 (25)0.12 (25)45.40 (25)0.11 (25)14.80 (20)1.30 (15)22.92 (25)
Inorganic compounds
CO2442.077.548.3154.4437.319.826.62
H2O1896.0289.3828.0042.8338.3214.2552.64
Ar40<0.01<0.010.04<0.010.010.090.02
Number of components281282232302244276260
CO2/(CO2 + H2O)0.020.080.230.560.490.410.11
H/(H + O)0.670.660.570.510.530.810.64
* MW—nominal mass.
Disclaimer/Publisher’s Note: The statements, opinions and data contained in all publications are solely those of the individual author(s) and contributor(s) and not of MDPI and/or the editor(s). MDPI and/or the editor(s) disclaim responsibility for any injury to people or property resulting from any ideas, methods, instructions or products referred to in the content.