Article

Mineral Prospectivity Mapping in Xiahe-Hezuo Area Based on Wasserstein Generative Adversarial Network with Gradient Penalty

1
Zijin Mining Group Southwest Geological Exploration Co., Ltd., Chengdu 610051, China
2
Geomathematics Key Laboratory of Sichuan Province, Chengdu University of Technology, Chengdu 610059, China
3
Institute of Geophysical and Geochemical Exploration, Chinese Academy of Geological Sciences, Langfang 065000, China
4
School of Earth Sciences and Resources, China University of Geosciences (Beijing), Beijing 100083, China
*
Author to whom correspondence should be addressed.
Minerals 2025, 15(2), 184; https://doi.org/10.3390/min15020184
Submission received: 27 December 2024 / Revised: 6 February 2025 / Accepted: 10 February 2025 / Published: 16 February 2025

Abstract

:
The Xiahe-Hezuo area in Gansu Province, China, located in the West Qinling Metallogenic Belt, is characterized by complex regional geological structures and abundant mineral resources. A number of gold-polymetallic deposits have been identified in this region, demonstrating significant potential for gold-polymetallic mineral prospecting within the metallogenic belt. This study focuses on regional Mineral Prospectivity Mapping (MPM) in the Xiahe-Hezuo area. To address the common challenge of small-sample data limitations in geological prediction, we introduce a Wasserstein Generative Adversarial Network with gradient penalty (WGAN-GP) to generate high-fidelity geological feature samples, effectively expanding the training dataset. A Convolutional Neural Network (CNN) was used to train and predict on both pre- and post-augmentation data. The experimental results show that, before augmentation, the CNN model’s Receiver Operating Characteristic (ROC) value was 0.9648. After data augmentation with the WGAN-GP, the CNN model’s ROC value improved to 0.9792. Additionally, the CNN model’s classification performance was significantly enhanced, with the training set accuracy increasing by 5% and the test set accuracy improving by 2%, successfully overcoming the issue of insufficient model generalization caused by small sample sizes. The mineralization prediction results based on data augmentation delineate five prospective mineralization targets, whose spatial distribution exhibits strong correlations with known deposits and fault structural belts, confirming the reliability of the predictions. This study validates the effectiveness of data augmentation techniques in MPM and provides a transferable technical framework for MPM in data-scarce regions.

1. Introduction

The West Qinling Metallogenic Belt is an important polymetallic metallogenic belt in China, where 44 types of minerals have been discovered, and 675 mineral sites have been identified [1]. The favorable metallogenic conditions in the West Qinling region have attracted many scholars, who have conducted extensive research on Mineral Prospectivity Mapping (MPM) in this area [2,3,4,5,6]. The Xiahe-Hezuo area, located in the central part of West Qinling, has a complex geological structure and favorable metallogenic conditions [2]. Over 400 tons of gold resources have been found in this area, including iconic deposits such as the Zaozigou, Labuzaika, and Laodou gold deposits.
In recent years, due to the rapid development of artificial intelligence technology, data-driven MPM methods have gradually become a focal point of academic research. Machine learning and deep learning, with their outstanding feature extraction and pattern recognition capabilities, have made significant break-throughs in the field of mineral resource prediction. Traditional machine learning algorithms, such as decision trees, random forests, support vector machines, and extreme learning machines, have been widely used in MPM and have shown good predictive performance [7,8,9,10,11,12,13]. However, due to their limitations in representing complex geological phenomena, deep learning methods have gradually gained more attention. Convolutional neural networks (CNNs), with their powerful feature extraction ability and advantage in nonlinear modeling, have emerged as a good method for solving complex problems in mineral resource discovery. In the field of geology, CNNs have been successfully applied in lithology recognition [14], geological mapping [15], 3D geological structure inversion [16], and MPM [17,18,19,20,21,22,23,24,25].
Because mineralization is a rare geological event, MPM is often affected by insufficient training samples [26]. Traditional data augmentation methods such as Synthetic Minority Over-sampling Technique (SMOTE), Random Noise Addition, Random Rotation, and Random Translation are usually used to simply expand the dataset [27,28,29,30,31]. However, the generated samples are often highly similar to the original data, making it difficult to fully reflect the complex characteristics of geological data. Data augmentation methods based on geological background and actual metallogenic laws have been widely applied in MPM and have proven to be highly feasible [32]. For instance, the pixel-pair matching method [33] is a data augmentation technique suitable for CNNs and has been proven to be effective in expanding training samples for MPM [22]. Li et al. [19] proposed a geologically meaningful Random-Drop Data Augmentation method to generate sufficient training samples and provide reasonable geological explanations for MPM. In recent years, data augmentation technologies based on generative models have gradually become a research direction in the geoscience field. Generative Adversarial Networks (GANs) attract attention due to their excellent generative capabilities. As an unsupervised learning technology, GAN estimates the distribution of existing samples through the adversarial process of the generator and discriminator networks, generating new samples that follow the distribution pattern of the original data. However, traditional GAN models may face issues of unstable training and mode collapse when handling complex continuous data distributions, limiting their application in geological data augmentation. The Wasserstein Generative Adversarial Network with gradient penalty (WGAN-GP) method, with its improved loss function and gradient penalty mechanism, effectively enhances the training stability and the quality of generated samples [34], providing a feasible and efficient solution for expanding geological data.
This study focuses on MPM in the Xiahe-Hezuo area with geochemical data. To address the issue of data scarcity in mineral exploration, the WGAN-GP was utilized for the data augmentation of positive and negative samples. This approach enhanced the diversity of training samples and improved their representativeness in terms of features and distributions, overcoming the limitations of traditional data augmentation methods in fully capturing the complex characteristics of mineral exploration data. The predictive performance before and after data augmentation was evaluated by the CNN performance. The results demonstrate that the WGAN-GP augmentation method effectively optimized the model’s training performance and generalization ability, leading to an improved prediction accuracy and stability. The mineral resource prediction outcomes are more consistent with the established geological understanding of the study area. Ultimately, five prospective mineralization targets were delineated based on the prediction results.

2. Study Area and Dataset

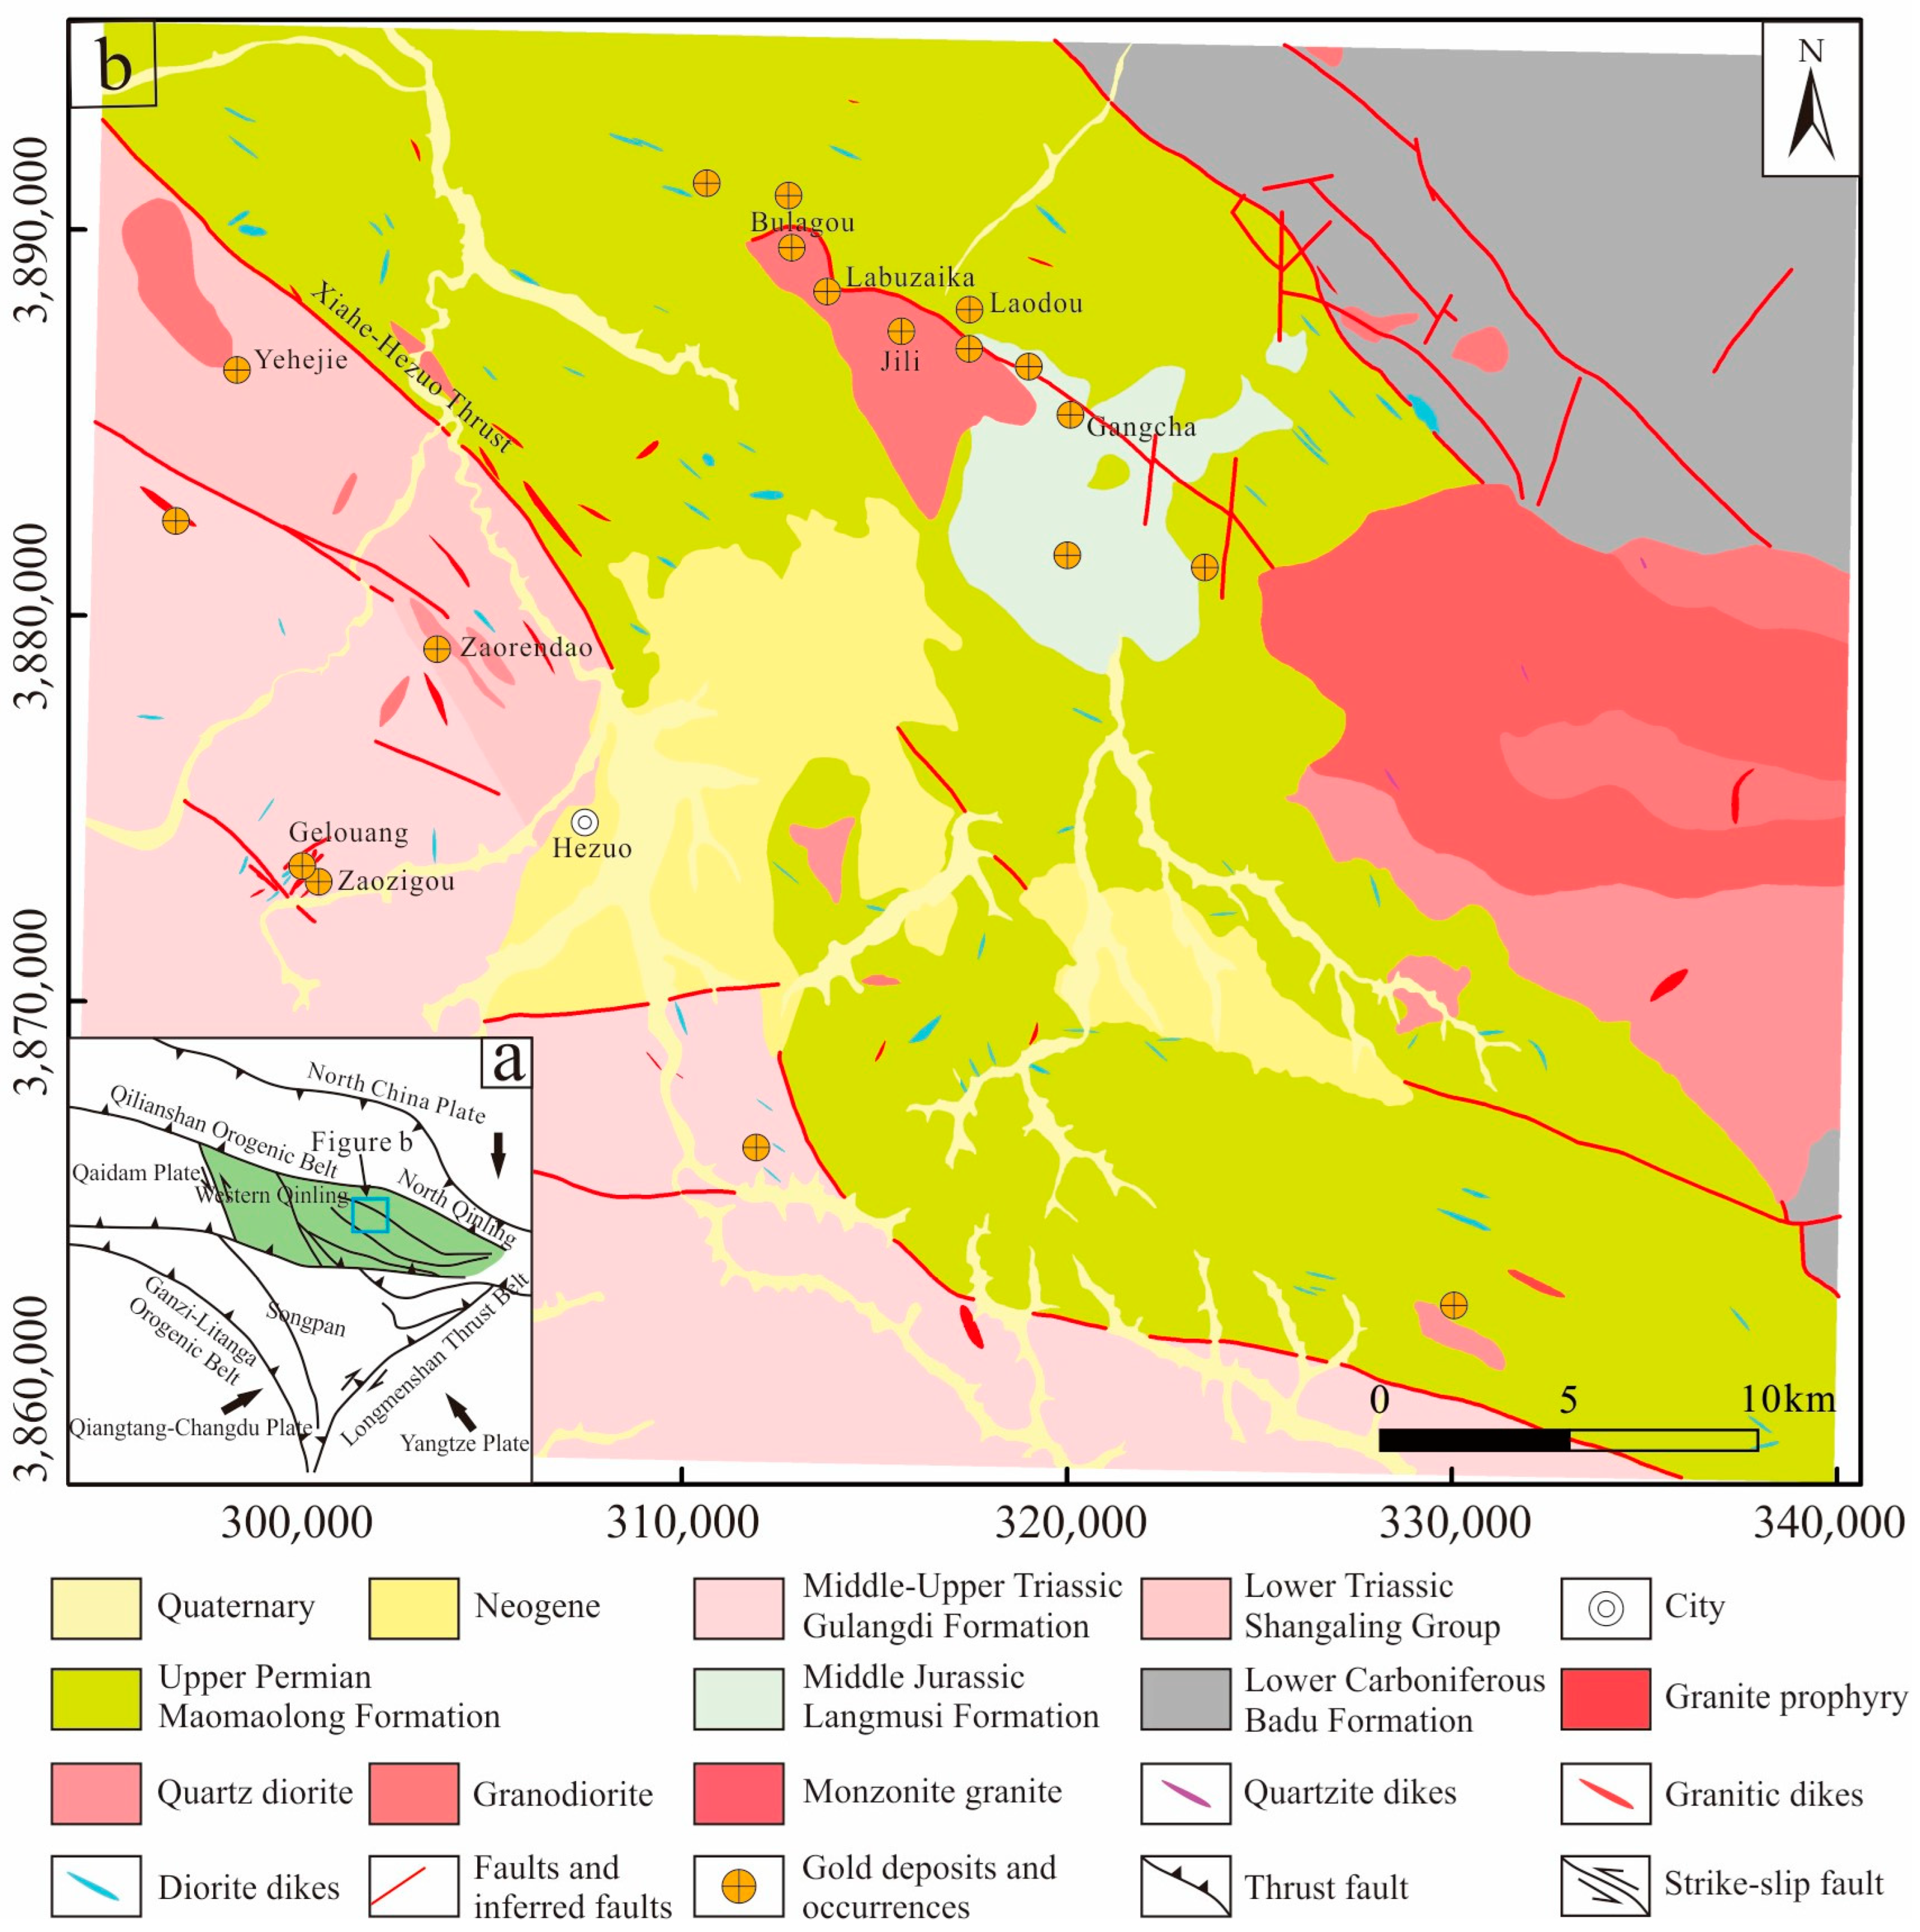
2.1. Geological Setting

The Xiahe-Hezuo area is located at the northeastern edge of the Qinghai–Tibet Plateau, belonging to the Qinling arc basin system, bordering the Central Qilian block to the north and sitting adjacent to the Ruoergai ancient land to the south. It is situated at a superimposed structural position near the Palaeo Asian tectonic domain, Tethyan tectonic domain, and Circum Pacific tectonic domain (Figure 1a, [35,36]). The Hercynian movement caused the gradual extensional rifting of the strata, while the intense compression during the Indosinian period led to strong orogeny [1]. As a result, the regional tectonic lines exhibit a northwest–southeast orientation, with a developed complex fold and fracture structures, providing favorable metallogenic conditions for the region.
The exposed strata in the region mainly consist of Carboniferous, Permian, Triassic, and Jurassic formations. The Carboniferous formation is located in the northeast part of this region. The Permian formation is distributed in the northeastern part of the region, with a northwest–southeast orientation. It forms a fault contact with the Triassic Guomugou formation. The Triassic formation in this region extends in a northwest–southeast direction, which is consistent with the regional tectonic direction (Figure 1b). The Lower Triassic Guomugou Formation and Jiangligou Formation outcrop in this area and serve as the principal strata for gold mineralization within the region.
The main fold structure in the region is the Xinbao–Lishishan antiform, where the strata are intensely deformed. Secondary sharp crest folds and overturned folds are well developed [37]. Numerous quartz veins, calcite veins, and granodiorite veins have been intruded into the core of the antiform and the two wings of the syncline. The regional fault structures are also widely developed. The regional distribution of known gold deposits and mineralization strictly follows northwest-striking fault zones and their secondary faults. The main controlling faults for mineralization are the Xiahe-Hezuo Fault Zone and the SankoNan-Gelina Fault Zone.
Figure 1. Geological background of the study area: (a) Tectonic location map, (b) Regional geological map (modified from reference [38]).
Minerals 15 00184 g001
Regional deep-seated fractures play a guiding role in mineralization, with secondary faults serving as the primary ore-controlling fractures. Among them, the Xiahe-Hezuo fracture is the most significant structure in the study area, with secondary faults trending in the northeast direction [39] (Figure 1b). Regional magmatic activity is frequent, and intrusive rocks are widespread, including large-scale intrusive bodies and various rock veins [40]. The Jurassic magmatic activity is closely related to gold mineralization [41].

2.2. Geological Data

The geochemical data used in the study area were provided by the Third Geological and Mineral Exploration Institute of Gansu Provincial Bureau of Geology and Mineral Resources, with a scale of 1:50,000 and sampling medium of stream sediments. Each sample contains 13 chemical elements: Ag, As, Au, Ba, Bi, Co, Cu, Hg, Mo, Pb, Sb, W, and Zn. There was a total of 9041 samples. The chemical analysis methods are detailed in reference [38]. Descriptive statistical analysis was conducted on the 13 geochemical elements, and the results are shown in Table 1. The average value of Au in the region is 1.13 times higher than the national average, while the average value of Sb is 1.82 times higher than the national average, and the average value of As is 1.94 times higher than the national average. Additionally, the high coefficients of variation for Au, As, and Sb reflect the strong enrichment ability of these elements, indicating that the region has significant gold exploration potential.

3. Method

3.1. Convolutional Neural Network

The Convolutional Neural Network is a type of deep feedforward neural network used for classification, and its core idea is to simplify network parameters through concepts such as local receptive fields (perceptive fields), weight sharing, and pooling layers [42]. Additionally, CNNs provide a certain degree of invariance to translation, scale, and nonlinear deformations [43,44]. A complete CNN typically consists of an input layer, convolutional layers, pooling layers, activation function layers, fully connected layers, and an output layer.
The convolutional layer is a fundamental component of CNNs that extracts local features from input data through convolution operations [45]. It employs a convolution kernel, which is a small, learnable weight matrix, to systematically scan the input data. As the kernel moves across the input in a sliding-window manner, it performs dot product computations with localized regions, capturing spatial patterns such as edges, textures, and shapes. This operation results in the creation of feature maps, which highlight important characteristics of the input while reducing the amount of raw data that need to be processed. By stacking multiple convolutional layers with different kernel sizes and depths, CNNs can learn hierarchical representations, enabling them to recognize complex structures in data [46]. The formula for convolution is given as
O ( i , j ) = m n I ( i + m , j + n ) K ( m , n ) + b
In Equation (1), O ( i , j ) is the output feature map, I is the input feature map, K is the convolutional kernel weights and b is the bias term. i and j indicate the spatial positions in the output feature map, while m and n represent the horizontal and vertical offsets of the kernel relative to the input matrix.
Typically, a nonlinear activation function is applied after each convolutional layer to introduce nonlinearity, enabling the network to learn more complex patterns and representations. Without nonlinear activation, the network would behave like a linear transformation, limiting its ability to model intricate relationships in the data. One of the most commonly used activation functions is the Rectified Linear Unit (ReLU), which helps to mitigate the vanishing gradient problem and accelerates training by allowing only positive values to pass through while setting negative values to zero. The formula for ReLU is given as
f ( x ) = max ( 0 , x )
The pooling layer serves to decrease the dimensions of feature maps, which in turn lowers the computational complexity and helps minimize noise. Typical pooling techniques include Max Pooling and Average Pooling. For instance, Max Pooling picks out the highest value within a local area. The formula for Max Pooling is given as
O ( i , j ) = max ( m , n ) R ( i , j ) x ( m , n )
In Equation (3), O ( i , j ) is the output value at position ( i , j ) , and x ( m , n ) is the input values in the pooling window.
The fully connected layer maps the high-dimensional features obtained from the convolution and pooling layers to a probability distribution of class labels, typically implemented using the Softmax activation function. The formula for Softmax is given as
O ( z j ) = exp ( z j ) k exp ( z k )
In Equation (4), z j represents the score for class j .

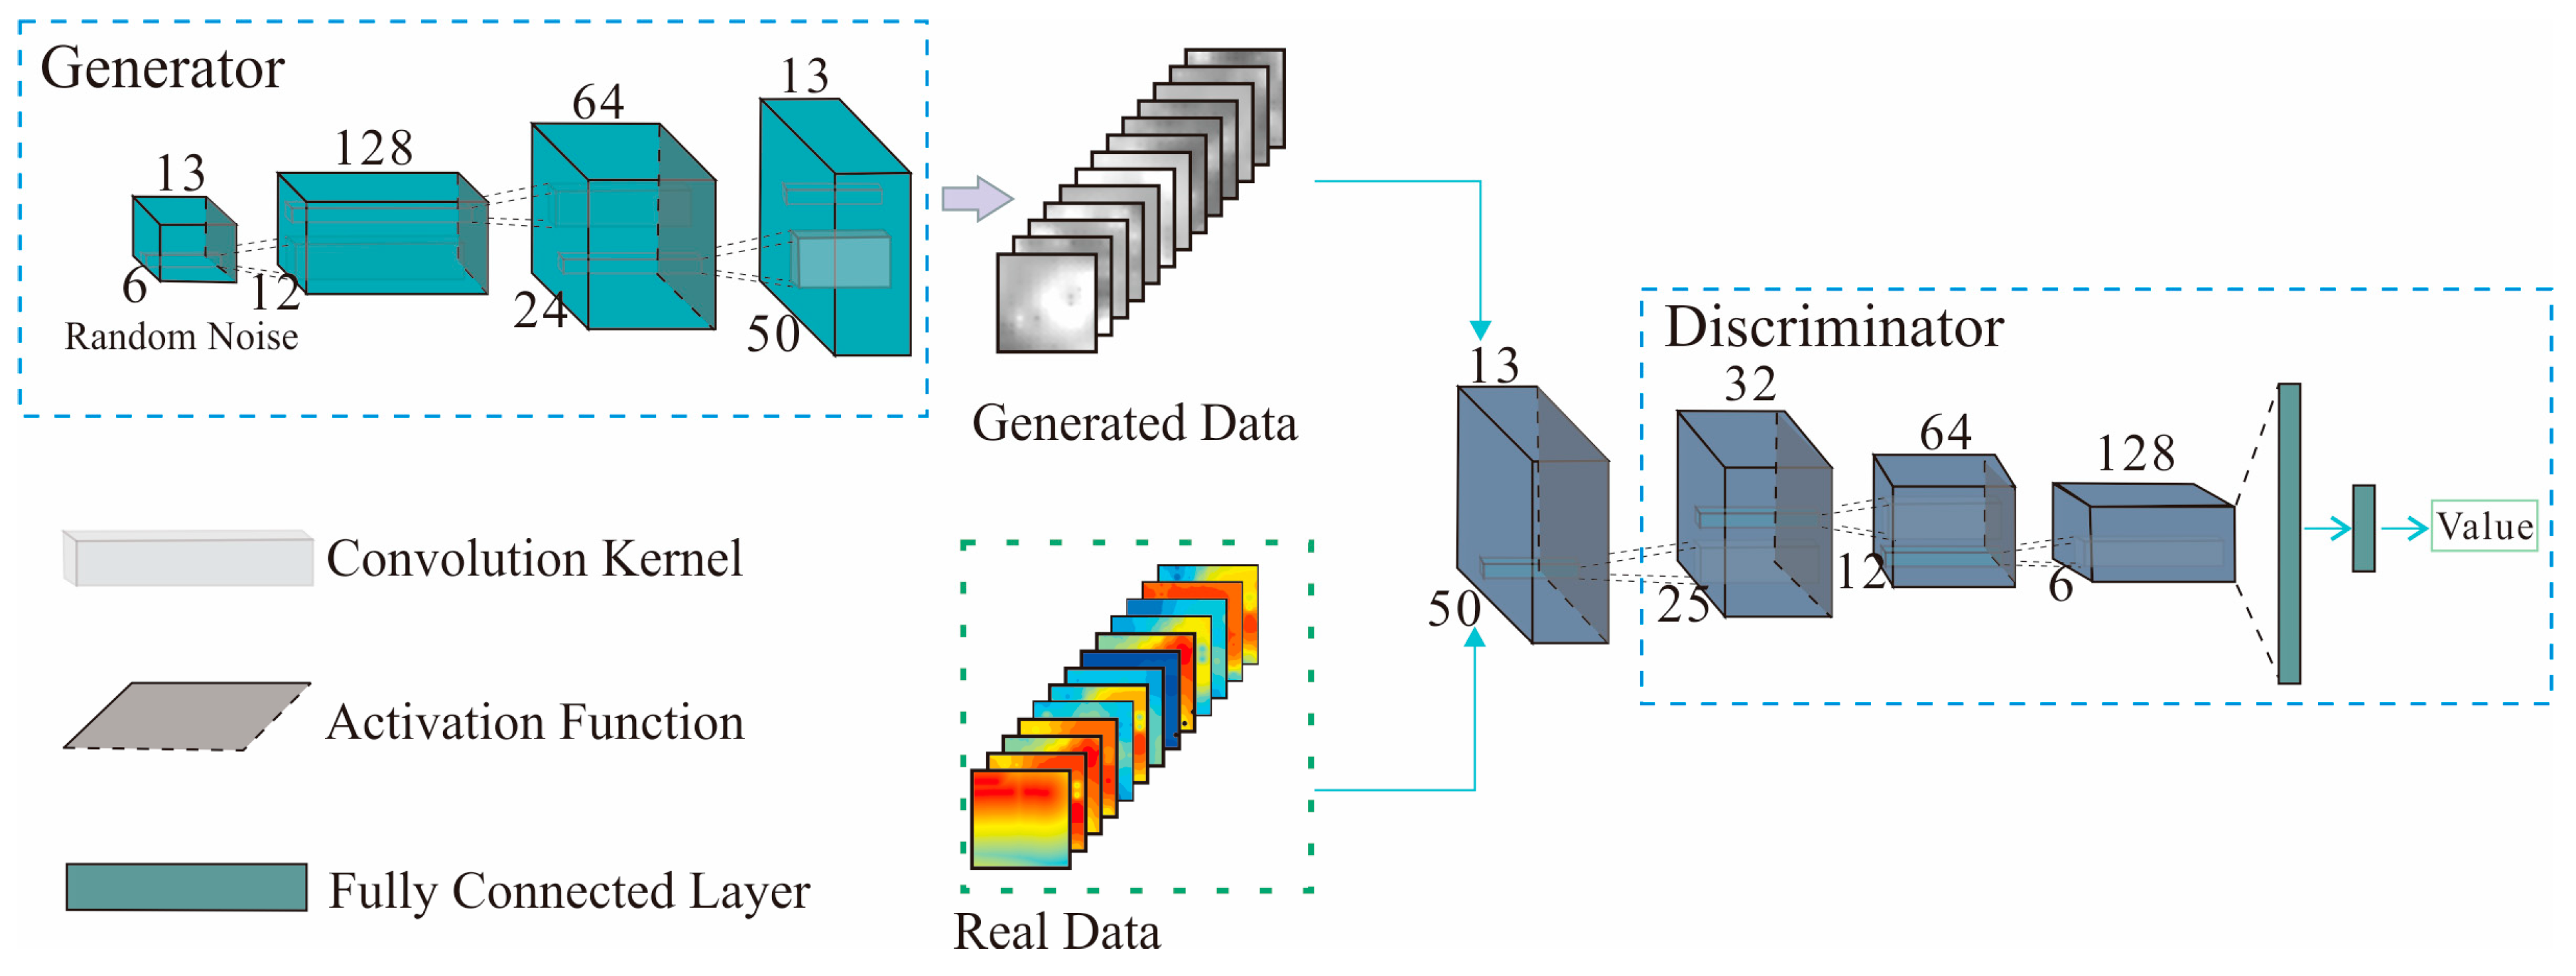
3.2. WGAN-GP-Based Data Augmentation

Generative Adversarial Networks were introduced in 2014 as a game-theoretic framework for generative modeling [47]. Since then, GANs have found broad applications in areas such as image generation, speech synthesis, and others [48,49,50,51]. A GAN comprises two main parts: the generator and the discriminator. The generator starts with a random noise vector and progressively transforms it into a generated image through multiple neural network layers. Its objective is to create fake images that closely mimic real ones to trick the discriminator. Both genuine images and the synthetic ones produced by the generator are fed into the discriminator, which employs a series of neural network layers to discern whether the input image is authentic or fake [52]. The ultimate aim of the GAN is to achieve a Nash equilibrium between these two components [53]. The loss function generally used in traditional GAN training is
min G max D V ( D , G ) = E x p data [ log D ( x ) ] + E z p z [ log ( 1 D ( G ( z ) ) ) ]
In Equation (5), p data represents the real data distribution, p z represents the noise distribution input to the generator (typically Gaussian or uniform distribution), D ( x ) represents the discriminator’s predicted probability that the input is from real data, and G ( z ) represents the sample generated by the generator from noise.
The WGAN-GP is an improved version of Generative Adversarial Networks, aiming to solve the problems of instability and gradient vanishing during the training process of traditional GANs. Traditional GANs use Jensen–Shannon (JS) divergence to measure the difference between the real data distribution and the generated data distribution [34]. When the overlap between these two distributions is small, gradient propagation becomes extremely difficult, resulting in a poor model training performance. The definition of JS divergence is as follows:
D JS ( P Q ) = 1 2 D KL ( P M ) + 1 2 D KL ( Q M )
In Equation (6), P represents the real data distribution; Q represents the generated data distribution; and M is the mixture distribution of the two. D KL is the Kullback–Leibler (KL) divergence, which is utilized to measure the relative entropy between two distributions.
WGAN-GP replaces the JS divergence with the Wasserstein distance (also known as the Earth Mover’s distance, EM distance) as the optimization objective. The definition of the Wasserstein distance is usually as follows:
W ( P , Q ) = inf γ Γ ( P , Q ) E ( x , y ) γ [ x y ]
In Equation (7), γ is a joint distribution, whose marginal distributions are P and Q , respectively. The Wasserstein distance can measure the difference between two distributions more effectively, enabling the discriminator to provide meaningful gradient information even when the distribution generated by the generator deviates significantly from the real distribution. This improvement greatly alleviates the problem of gradient vanishing, making the training process more stable.
To satisfy the 1-Lipschitz continuity condition required by the Wasserstein distance, WGAN-GP adopts gradient penalty (GP) to replace the weight clipping used in the original WGAN. The mathematical definition of the gradient penalty is as follows:
L GP = λ E x ^ p x ^ ( x ^ D ( x ^ ) 2 1 ) 2
where x ^ represents the interpolation between real samples and generated samples, and x ^ D ( x ^ ) represents the gradient of the discriminator with respect to the interpolated sample. λ is the gradient penalty coefficient. The gradient penalty ensures the smoothness and stability of the model by constraining the norm of the gradient of the discriminator’s output with respect to its input to be close to 1.
Finally, the loss functions of the discriminator and generator in WGAN-GP are, respectively, obtained as follows:
L D = E x p data [ D ( x ) ] E z p z [ D ( G ( z ) ) ] + L GP
L G = E z p z [ D ( G ( z ) ) ]

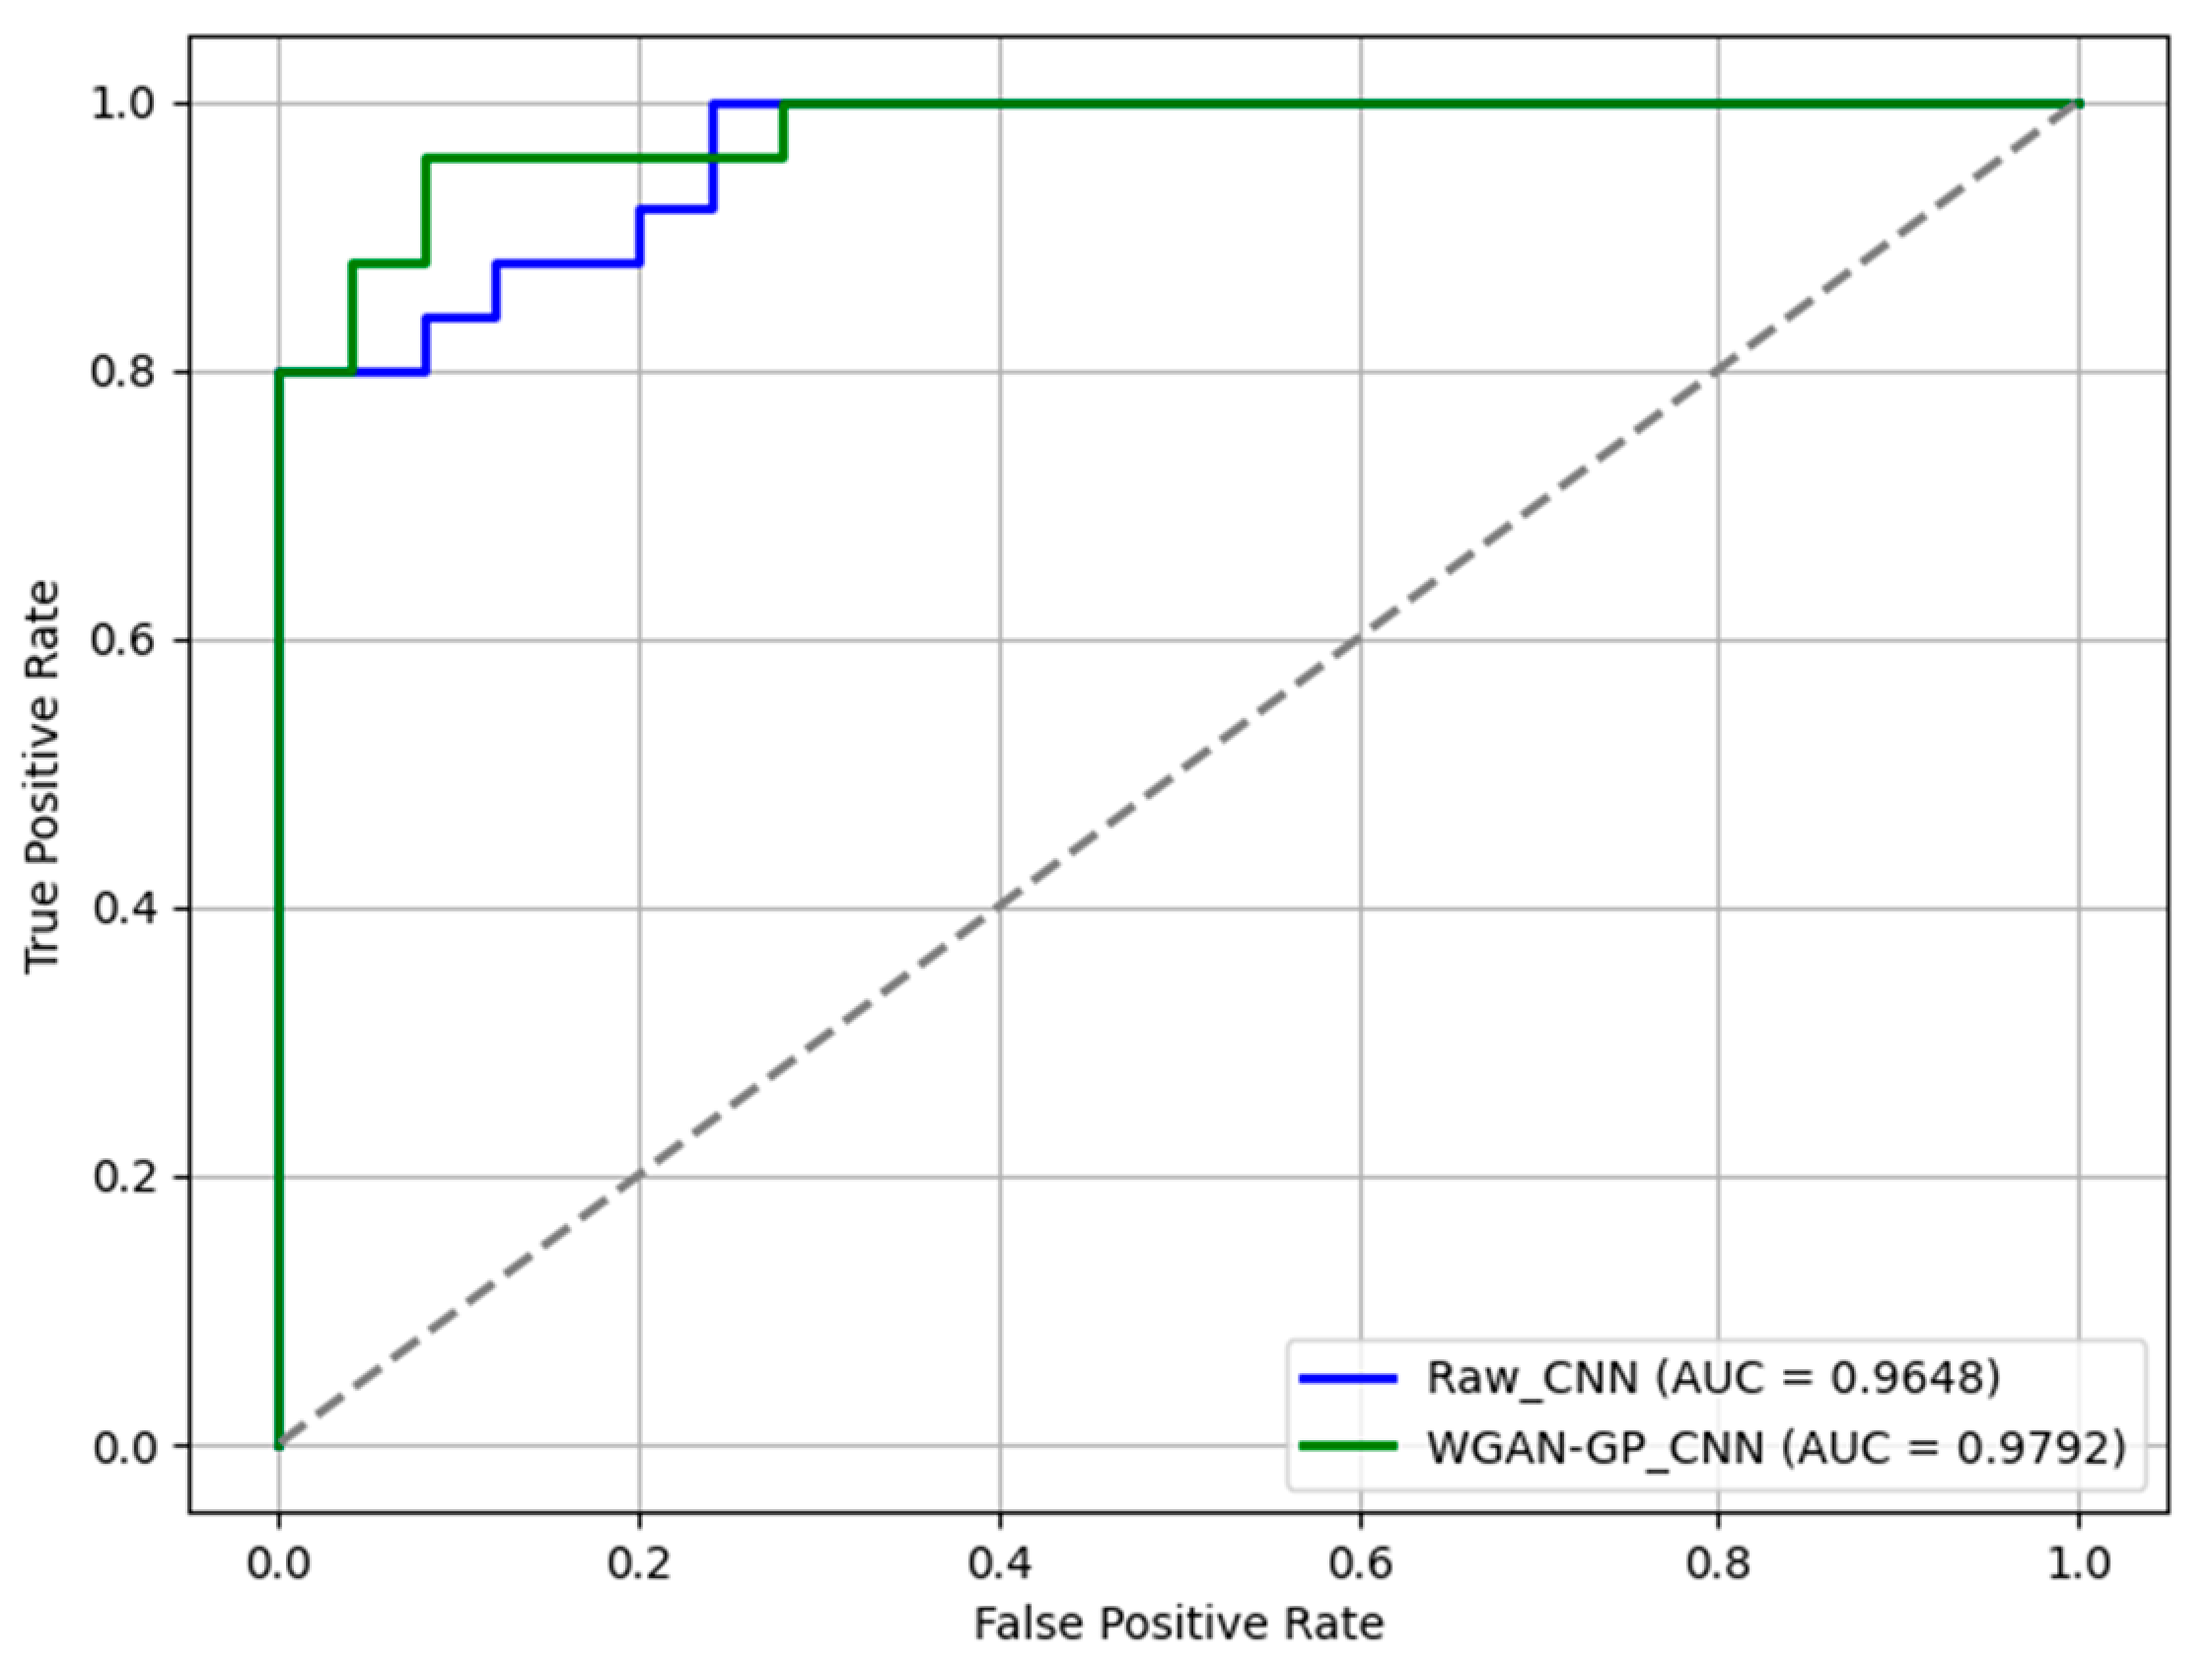
3.3. Assessment of the Quality of Data Augmentation

In the training process of Generative Adversarial Networks, directly using the loss function as an indicator to evaluate the quality of generated samples is imprecise [48]. Although the loss function provides a clear optimization objective for model training, it lacks an inherent correlation with the fidelity of the generated sample quality. There may be instances where the generator’s loss decreases, but the quality of generated samples does not improve significantly or may even deteriorate [54]. Therefore, a more intuitive evaluation mechanism is crucial for assessing the quality of generated samples. To quantitatively evaluate the quality of synthetic samples, this study adopts an indirect assessment method. This approach involves training a CNN using synthetic samples and then testing the trained classifier on real data to determine its discriminative capability.
This evaluation paradigm relies on the following premise: If synthetic samples accurately reflect the distribution and structural attributes of real data, a classifier trained on these samples should demonstrate robust generalization performance on real datasets [55]. Specifically, a high-performing classifier indicates that the synthetic samples effectively encapsulate the essential characteristics of real data. Conversely, suboptimal performance on real data may suggest significant discrepancies between synthetic and real samples [56]. Through this evaluation process, the quality of synthetic samples can be systematically determined. Furthermore, this method aligns closely with the primary objective of machine learning: achieving superior performance on real-world datasets [6].

4. Results and Discussion

4.1. Data Preprocessing

In this study, 13 geochemical elements are interpolated using the inverse distance weighting method to generate a raster dataset of size 3800 × 4650, where each raster represents a rectangular area of 0.01 km × 0.01 km. The interpolation operation was performed using ArcGIS 10.8 software, and partial results of the interpolation for some elements are shown in Figure 2. These data were then cropped into 7068 patches of size 13 × 50 × 50, using a fixed window size of 50 × 50, to form the predictive dataset for MPM.
The training of the deep learning model requires both positive and negative samples. The selection of positive samples is based on the known spatial distribution of mineralized areas. The negative samples are selected based on the following criteria: first, they should be distant from known ore deposits; second, they should avoid areas with high concentrations of mineralization elements; and finally, their geographic distribution should be reasonable [57] (Figure 3).
Based on these criteria, a dataset consisting of 82 positive samples and 82 negative samples was constructed (including both training and testing sets). The dataset was divided into a training set and a testing set in a 7:3 ratio. The training set is used to train the model to learn data characteristics and patterns, while the test set is used to evaluate the model’s learning effectiveness and generalization ability.

4.2. WGAN-GP-Based Data Augmentation

The structures of the generator and discriminator used in this study are shown in Figure 4. The generator takes a random noise input of size 13 × 6 × 6 and performs upsampling through a series of transposed convolution layers, progressively adjusting the number of channels. The final output is a high-dimensional image with the same resolution as the real samples. In each layer of the generator (except for the output layer), batch normalization and ReLU activation functions are applied. Batch normalization helps stabilize the training process, accelerates convergence, and effectively prevents mode collapse. The ReLU activation function introduces nonlinearity, allowing the generator to capture more complex image features, thereby generating more realistic and diverse samples.
The structure of the discriminator is similar to that of the generator, consisting of multiple convolutional layers and fully connected layers. In each layer (except for the output layer), the LeakyReLU activation function is used to improve the stability and learning capability of the network. Specifically, in the case of the vanishing gradient problem, LeakyReLU effectively enhances the network’s training performance. Additionally, the discriminator removes the traditional Sigmoid activation function in the last layer of the GANs, directly outputting a real-valued score, which is used to compute the Wasserstein distance. Data augmentation is performed separately on positive and negative samples based on the WGAN-GP. In view of the distinct data characteristics inherent in the positive and negative samples, discrete parameters are accordingly established for each type. Table 2 summarizes the optimized training parameters for positive and negative sample sets, derived through iterative hyperparameter tuning experiments.

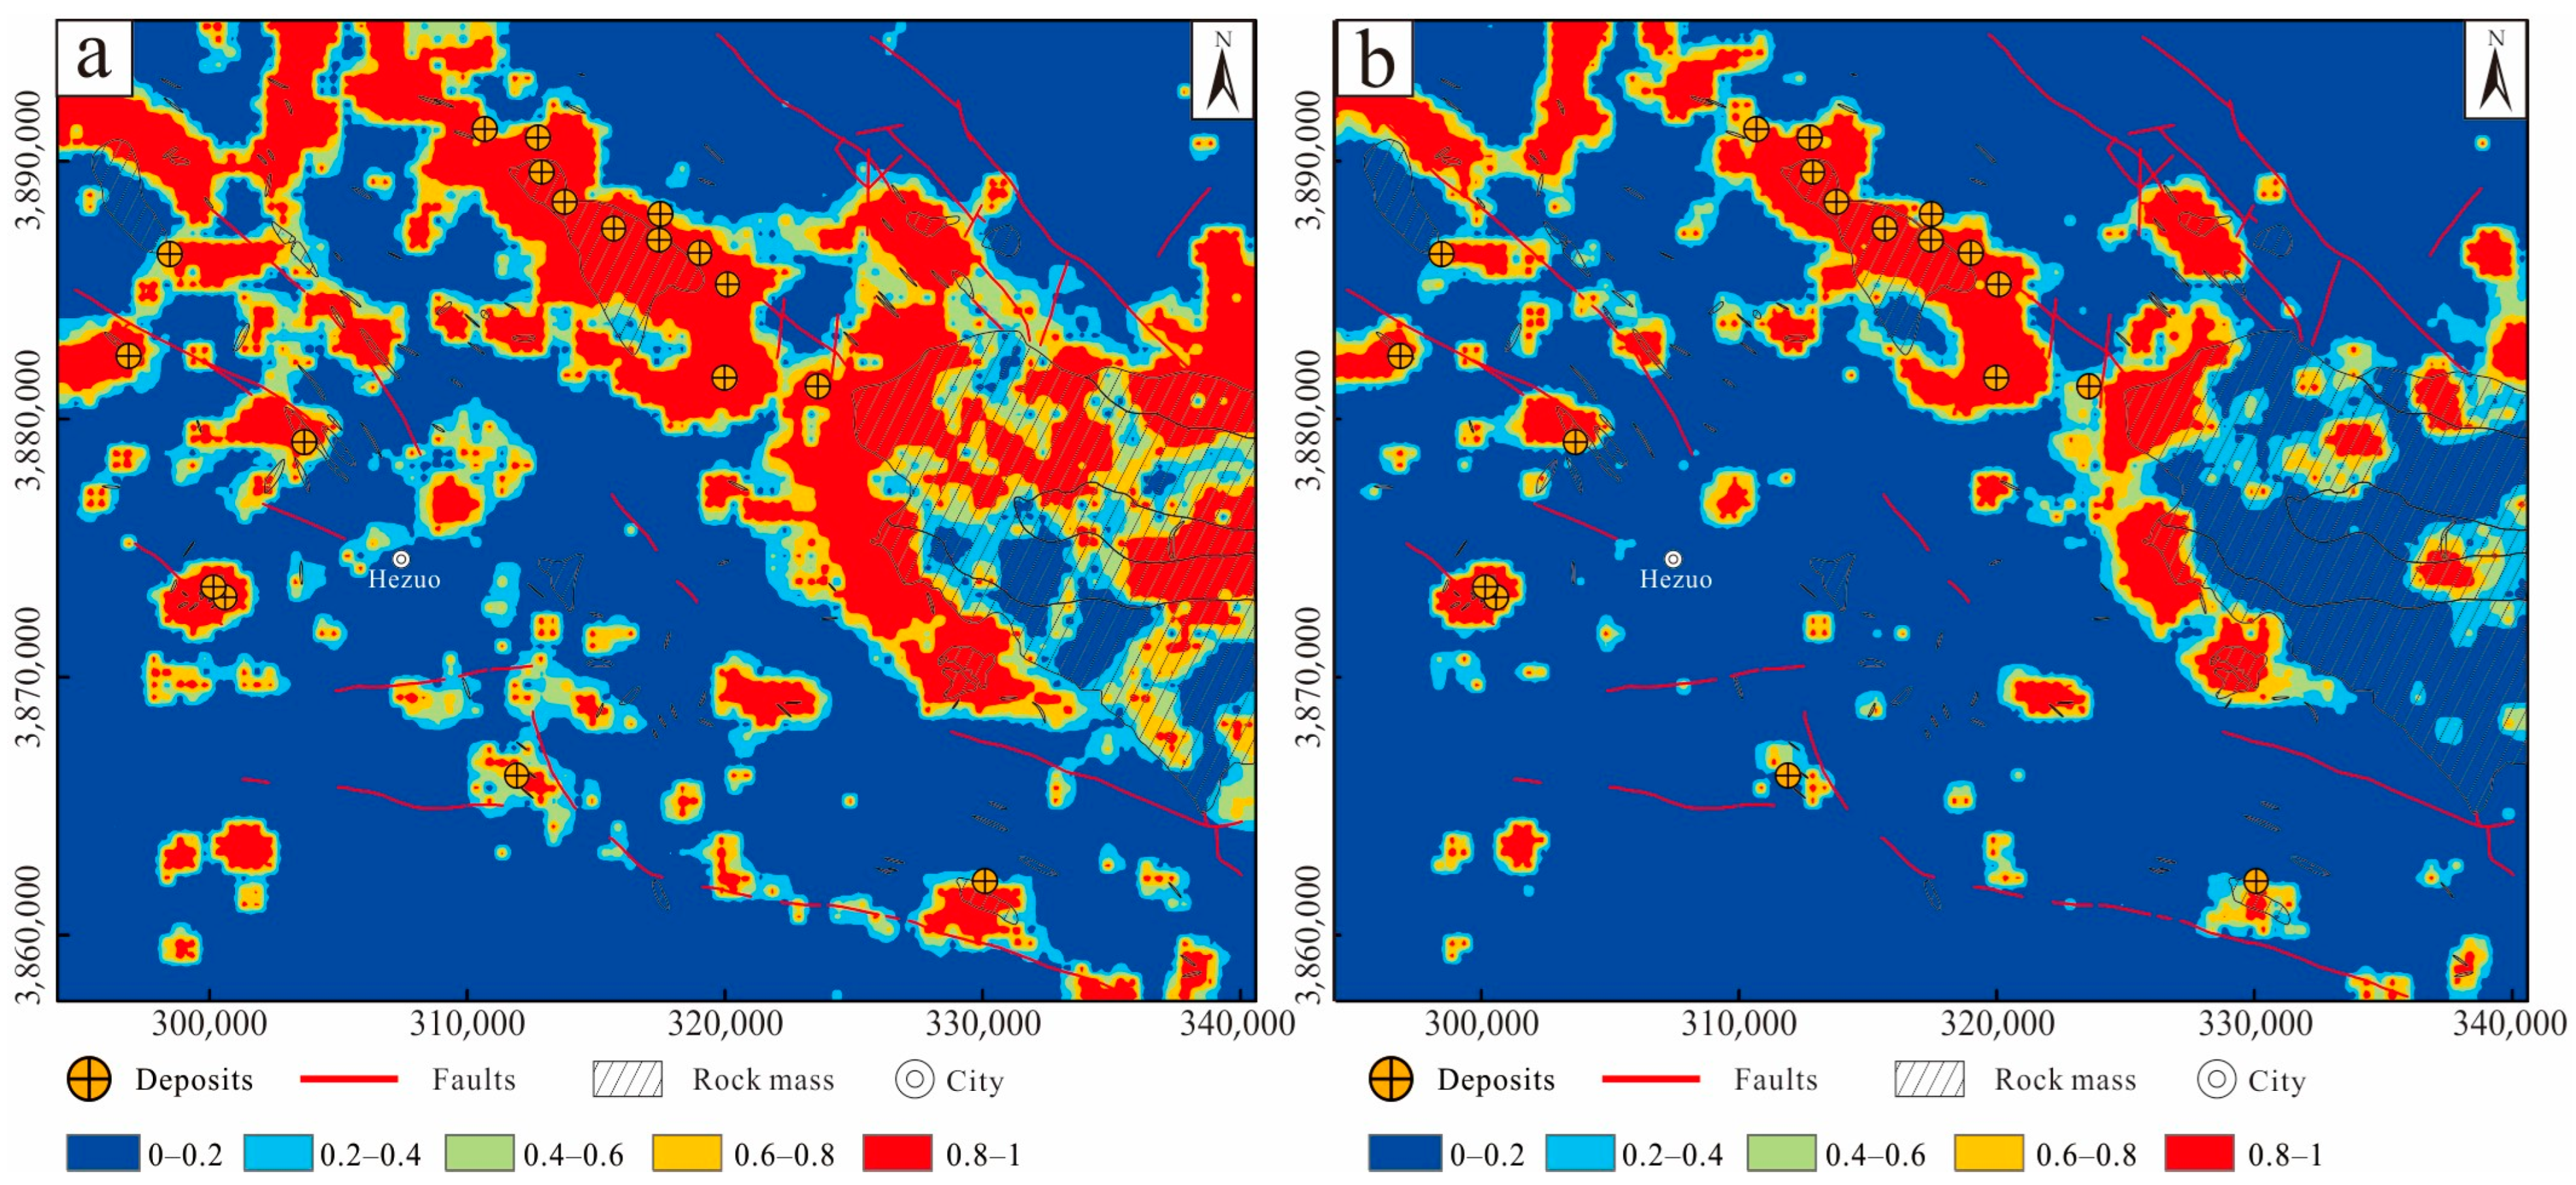
4.3. Mineral Prospectivity Mapping

The CNN structure used in this study is detailed in Table 3. The convolutional layers extract multi-level spatial features from the input data using kernels of different sizes, capturing subtle differences in the distribution of mineral resources. Subsequently, the batch normalization layers (BatchNorm2d) normalize the extracted features, accelerating the model’s convergence and enhancing its generalization ability. The introduction of the activation function (ReLU) applies nonlinear transformations, enabling the network to fit complex functional relationships. The pooling layer (MaxPool) further compresses the feature maps, retaining key information while reducing the computational complexity. Finally, the fully connected layer (Linear) maps the extracted features to the prediction results, enabling accurate mineral resource prediction.
This study compares the performance of a CNN model trained on the original dataset with one trained on a WGAN-GP augmented dataset. After 100 epochs of training, the results were systematically evaluated using the classification accuracy and ROC curves. The experimental results show that the model trained on the original data achieved an AUC (Area Under the Curve) value of 0.9648, while the model trained with the WGAN-GP augmented data achieved an AUC of 0.9792, significantly improving the classification performance (Figure 5).
Specifically, the CNN model trained on the original data achieved a training accuracy of 92% and a test accuracy of 90%. After the WGAN-GP data augmentation, the training accuracy increased to 97%, and the test accuracy reached 92% (Table 4). These results strongly demonstrate that the WGAN-GP data augmentation method can effectively improve the model’s generalization ability. By generating highly diverse and representative synthetic samples, the WGAN-GP alleviates the limitations of an insufficient sample size on the model prediction performance, while also improving the model’s ability to learn from minority class samples.
Based on the prediction results before and after data augmentation, the MPMs for the Xiahe-Hezuo area were generated (Figure 6). MPM provides an effective way to validate the model’s performance [58,59,60,61]. By comparing the results before and after data augmentation, it is discovered that the high-potential areas of the two models overlap with the majority of known ore spots, which proves that the CNN can effectively learn the mapping relationship between geochemical data and mineralization, possesses strong learning and fitting capabilities, and is able to effectively extract key features and make accurate predictions. It is worth noting that the mineralization potential high-value areas for the original data are too large, particularly in the northern and western parts of the study area. However, since mineralization is a rare geological event, the vast high-potential areas increase the difficulty of further exploration and do not align with the regional geological understanding. In contrast, the mineralization potential map after WGAN-GP data augmentation shows compressed high-potential areas, making the result more consistent with the current understanding of mineralization, and clearer for exploration target delineation. This is primarily due to the WGAN-GP data augmentation technique introducing more data variability and complexity, helping the model learn finer and more accurate feature representations, thereby making the prediction results more focused and reasonable.
Based on the MPM (Figure 7) generated through the WGAN-GP data augmentation, the CNN model’s prediction results indicate that the high-value regions largely coincide with the locations of known gold deposits, verifying the model’s effectiveness in mineral prospectivity prediction. Accordingly, five potential metallogenic target areas have been delineated in combination with metallogenic geological principles. The explanations are as follows:
Target I is located in the northern part of the study area, extending northwest from the Middle Qinling Landward Basin Metallogenic Belt, east of the Xiahe-Huozuo Fault. The main gold deposits in this metallogenic belt include Laodou, Labuzaika, and Bulagou, with the gold deposits primarily distributed within or near medium-acidic intrusions or their contact zones. This area exposes multiple veins, and is associated with large-scale high anomalies of key metallogenic elements. Combined with the high-value anomalies predicted by the CNN model, it is inferred that this area has significant prospecting potential.
Target II is located at the northwest end of the Xiahe-Huozuo Fault, closely associated with Granodiorite. The area shows large-scale high anomalies of key metallogenic elements, and the CNN model reveals abnormal patterns around the intrusion. It is inferred that this area has high prospecting potential.
Target III is located on the western side of the Meiwu Pluton in the eastern part of the study area, extending southeast along the intersection of the rock mass and fault. The area exhibits a significant concentration of geochemical anomalies, indicating a certain prospecting potential.
Target IV is located at the northeastern side of the Meiwu Pluton in the eastern part of the study area, at the junction of the fault. It features northwest-trending ore-controlling faults and northeast-trending secondary faults. High-value anomalies from the CNN predictions, fault complexes, and exposures of favorable metallogenic rocks make this area worthy of further exploration.
Target V is located in the northeastern part of the study area, with exposed Granodiorite Pluton and widespread secondary fault distribution. Geochemical anomalies and CNN prediction results both show high-value anomalies, indicating that this area has a certain prospecting potential.

5. Conclusions

In this study, we conducted MPM in the Xiahe-Hezuo area based on geochemical data. To address the issue of sample scarcity due to the sparse nature of mineralization data, we proposed the WGAN-GP technique for data augmentation. By comparing the results before and after data augmentation, the following main conclusions were drawn:
(1) The WGAN-GP data augmentation method significantly enhanced the model’s classification performance on the test set. By generating high-quality samples, the diversity and representativeness of the data were increased, effectively alleviating the limitations imposed by data scarcity on the model’s predictive ability. This demonstrated the effectiveness of the method in geoscience data augmentation. The model was able to better adapt to the data to be predicted, primarily due to the effective updating of the generator’s gradients in the WGAN-GP, enabling it to more accurately learn the overall distribution of the samples. Additionally, by optimizing the training approach for the discriminator, the generator was able to produce more diverse and realistic samples, allowing the CNN to learn more generalizable features during training, ultimately achieving a better performance on the test set.
(2) The CNN effectively explored the coupling relationship between the geochemical concentration distribution and mineralization patterns in the study area, showcasing its powerful spatial feature extraction capability. With the support of augmented data, five mineral exploration prospect areas were successfully delineated. Through a comparative analysis of the delineated areas and mineralization patterns, these prospective areas were identified as having significant potential for further exploration.
In conclusion, this study provides an effective method for gold mineral exploration in the Xiahe-Hezuo area and demonstrates the broad application potential of deep learning techniques combined with data augmentation in geoscience. In the future, with the integration of more regional data and the application of model optimization methods, there is promising potential for expanding its application value in mineral resource prediction.
Although good results have been achieved in this study, there is still room for improvement. First, the dataset is relatively limited, especially in terms of the number of positive samples (mineralized samples), which may affect the model’s generalization ability. Therefore, future research should aim to expand the dataset by collecting geological data from more regions to further improve the prediction accuracy. Second, although the WGAN-GP alleviates the data scarcity issue to some extent, there may still be distribution differences between the generated and real data. Future work could focus on optimizing the generator’s architecture and training strategies to enhance the authenticity and reliability of the generated data. In addition, the structure of the CNN model and hyperparameter settings could also introduce uncertainties that affect the model performance. To address this, future studies may explore optimizing data preprocessing, improving the model architecture, and applying uncertainty quantification techniques (such as Bayesian neural networks or Monte Carlo dropout) to reduce these uncertainties and enhance the model’s robustness and predictive reliability.

Author Contributions

Methodology, J.G., Y.L. and M.X.; software, J.G. and Y.K.; writing—original draft preparation, J.G., Y.L. and R.T.; writing—review and editing, J.G., R.T. and Z.W.; visualization, M.X., Y.W. and C.L.; super-vision, C.L.; funding acquisition, J.G. All authors have read and agreed to the published version of the manuscript.

Funding

This work was supported by the National Key R&D Program of China (Grants 2023YFC2906403; 2022YFC2905002), the Sichuan Science and Technology Program (2024NSFSC0009), China Geological Survey Program (DD20243233), and the program of Zijin Mining Group (4502-FW-2024-00055).

Data Availability Statement

All data and materials are available on request from the corresponding author. The data are not publicly available due to ongoing researches using a part of the data.

Acknowledgments

The authors thank the Third Geological and Mineral Exploration Institute of Gansu Provincial Bureau of Geology and Mineral Resources for the data support.

Conflicts of Interest

Author Jiansheng Gong was employed by the company Zijin Mining Group Southwest Geological Exploration Co, Ltd. The remaining authors declare that the research was conducted in the absence of any commercial or financial relationships that could be construed as a potential conflict of interest.

References

  1. Jiang, H.B.; Yang, H.Q.; Zhao, G.B.; Tan, W.J.; Wen, Z.L.; Li, Z.H.; Gu, P.Y.; Li, J.Q.; Guo, P.H.; Wang, Y.H. Discussion on the Metallogenic Regularity in West Qinling Metallogenic Belt, China. Northwest. Geol. 2023, 56, 187–202, (In Chinese with English Abstract). [Google Scholar]
  2. Li, K.N.; Jia, R.Y.; Li, H.R.; Tang, L.; Liu, B.C.; Yan, K.; Wei, L.L. The Au-Cu polymetallic mineralization system related to intermediate to felsic intrusive rocks and the prospecting prediction in Xiahe-Hezuo area of Gansu, West Qinling orogenic belt. Geol. Bull. China 2020, 39, 1191–1203, (In Chinese with English Abstract). [Google Scholar]
  3. He, J.Z.; Ding, Z.J.; Zhu, Y.X.; Zhen, H.X.; Zhang, W.R.; Liu, J. The metallogenic series in West Qinling, Gansu Province, and their quantitative estimation. Earth Sci. Front. 2024, 31, 218–234, (In Chinese with English Abstract). [Google Scholar]
  4. Wang, L. Metallogenic Series, Regularity and Prospecting the Direction of the West Qinling Metallogenic Belt. Acta Geosci. Sin. 2023, 44, 649–659, (In Chinese with English Abstract). [Google Scholar]
  5. Liu, B.L.; Xie, M.; Kong, Y.H.; Tang, R.; Yu, Z.B.; Luo, D.J. Quantitative Gold Resources Prediction in Xiahe-Hezuo Area Based on Convolutional Auto-Encode Network. Acta Geosci. Sin. 2023, 44, 877–886, (In Chinese with English Abstract). [Google Scholar]
  6. Wu, Y.X.; Liu, B.L.; Gao, Y.X.; Li, C.; Tang, R.; Kong, Y.H.; Xie, M.; Li, K.N.; Dan, S.Y.; Qi, K.; et al. Mineral prospecting mapping with conditional generative adversarial network augmented data. Ore Geol. Rev. 2023, 105787. [Google Scholar] [CrossRef]
  7. Chen, Y.L.; Wu, W. Mapping mineral prospectivity using an extreme learning machine regression. Ore Geol. Rev. 2017, 80, 200–213. [Google Scholar] [CrossRef]
  8. Rodriguez-Galiano, V.; Sanchez-Castillo, M.; Chica-Olmo, M.; Chica-Rivas, M. Machine learning predictive models for mineral prospectivity: An evaluation of neural networks, random forest, regression trees and support vector machines. Ore Geol. Rev. 2015, 71, 804–818. [Google Scholar] [CrossRef]
  9. Harris, D.; Zurcher, L.; Stanley, M.; Marlow, J.; Pan, G.C. A comparative analysis of favorability mappings by weights of evidence, probabilistic neural networks, discriminant analysis, and logistic regression. Nat. Resour. Res. 2003, 12, 241–255. [Google Scholar] [CrossRef]
  10. Abedi, M.; Norouzi, G.; Fathianpour, N. Fuzzy outranking approach: A knowledge-driven method for mineral prospectivity mapping. Int. J. Appl. Earth Obs. Geoinf. 2013, 21, 556–567. [Google Scholar] [CrossRef]
  11. Zuo, R.G.; Carranza, E.J.M. Support vector machine: A tool for mapping mineral prospectivity. Comput. Geosci. 2010, 37, 1967–1975. [Google Scholar] [CrossRef]
  12. Geranian, H.; Tabatabaei, S.H.; Asadi, H.H.; Carranza, E.J.M. Application of discriminant analysis and support vector machine in mapping gold potential areas for further drilling in the Sari-Gunay gold deposit, NW Iran. Nat. Resour. Res. 2016, 25, 145–159. [Google Scholar] [CrossRef]
  13. Carranza, E.J.M.; Laborte, A.G. Random forest predictive modeling of mineral prospectivity with small number of prospects and data with missing values in Abra (Philippines). Comput. Geosci. 2015, 74, 60–70. [Google Scholar] [CrossRef]
  14. Ran, X.J.; Xue, L.F.; Zhang, Y.Y.; Liu, Z.Y.; Sang, X.J.; He, J.X. Rock Classification from Field Image Patches Analyzed Using a Deep Convolutional Neural Network. Mathematics 2019, 7, 755. [Google Scholar] [CrossRef]
  15. Sang, X.J.; Xue, L.F.; Ran, X.J.; Li, X.S.; Liu, J.W.; Liu, Z.Y. Intelligent High-Resolution Geological Mapping Based on SLIC-CNN. ISPRS Int. J. Geo-Inf. 2020, 9, 99. [Google Scholar] [CrossRef]
  16. Guo, J.T.; Li, Y.Q.; Jessell, M.W.; Giraud, J.; Li, C.L.; Wu, L.X.; Li, F.D.; Liu, S.J. 3D geological structure inversion from Noddy-generated magnetic data using deep learning methods. Comput. Geosci. 2021, 149, 104701. [Google Scholar] [CrossRef]
  17. Liu, Y.P.; Zhu, L.X.; Zhou, Y.Z. Experimental Research on Big Data Mining and Intelligent Prediction of Prospecting Target Area—Application of Convolutional Neural Network Model. Geotecton. Metallog. 2020, 44, 192–202, (In Chinese with English Abstract). [Google Scholar]
  18. Cai, H.H.; Xu, Y.Y.; Li, Z.X.; Cao, H.H.; Feng, Y.X.; Chen, S.Q.; Li, Y.S. The division of metallogenic prospective areas based on convolutional neural network model: A case study of the Daqiao gold polymetallic deposit. Geol. Bull. 2019, 38, 1999–2009, (In Chinese with English Abstract). [Google Scholar]
  19. Li, T.; Zuo, R.G.; Xiong, Y.H.; Peng, Y. Random-Drop Data Augmentation of Deep Convolutional Neural Network for Mineral Prospectivity Mapping. Nat. Resour. Res. 2021, 30, 27–38. [Google Scholar] [CrossRef]
  20. Sun, T.; Li, H.; Wu, K.X.; Chen, F.; Zhu, Z.; Hu, Z.J. Data-Driven Predictive Modelling of Mineral Prospectivity Using Machine Learning and Deep Learning Methods: A Case Study from Southern Jiangxi Province, China. Minerals 2020, 10, 102. [Google Scholar] [CrossRef]
  21. Li, S.; Chen, J.P.; Liu, C.; Wang, Y. Mineral Prospectivity Prediction via Convolutional Neural Networks Based on Geological Big Data. J. Earth Sci. 2021, 32, 327–347. [Google Scholar] [CrossRef]
  22. Zhang, C.J.; Zuo, R.G.; Xiong, Y.H. Detection of the multivariate geochemical anomalies associated with mineralization using a deep convolutional neural network and a pixel-pair feature method. Appl. Geochem. 2021, 130, 104994. [Google Scholar] [CrossRef]
  23. Xie, M.; Liu, B.L.; Wang, L.; Li, C.; Kong, Y.H.; Tang, R. Auto encoder generative adversarial networks-based mineral prospectivity mapping in Lhasa area, Tibet. J. Geochem. Explor. 2023, 255, 107326. [Google Scholar] [CrossRef]
  24. Xiong, Y.H.; Zuo, R.G.; Carranza, E.J.M. Mapping mineral prospectivity through big data analytics and a deep learning algorithm. Ore Geol. Rev. 2018, 102, 811–817. [Google Scholar] [CrossRef]
  25. Zuo, R.G.; Xiong, Y.H.; Wang, J.; Carranza, E.J.M. Deep learning and its application in geochemical mapping. Earth-Sci. Rev. 2019, 192, 1–14. [Google Scholar] [CrossRef]
  26. Cheng, Q.M. Mapping singularities with stream sediment geochemical data for prediction of undiscovered mineral deposits in Gejiu, Yunnan Province, China. Ore Geol. Rev. 2007, 32, 314–324. [Google Scholar] [CrossRef]
  27. Hariharan, S.; Tirodkar, S.; Porwal, A.; Bhattacharya, A.; Joly, A. Random Forest-Based Prospectivity Modelling of Greenfield Terrains Using Sparse Deposit Data: An Example from the Tanami Region, Western Australia. Nat. Resour. Res. 2017, 26, 489–507. [Google Scholar] [CrossRef]
  28. Li, T.F.; Xia, Q.L.; Zhao, M.Y.; Gui, Z.; Leng, S. Prospectivity Mapping for Tungsten Polymetallic Mineral Resources, Nanling Metallogenic Belt, South China: Use of Random Forest Algorithm from a Perspective of Data Imbalance. Nat. Resour. Res. 2020, 29, 203–227. [Google Scholar] [CrossRef]
  29. Ma, D.; Tang, P.; Zhao, L.J. SiftingGAN: Generating and Sifting Labeled Samples to Improve the Remote Sensing Image Scene Classification Baseline In Vitro. IEEE Geosci. Remote Sens. Lett. 2019, 16, 1046–1050. [Google Scholar] [CrossRef]
  30. Moreno-barea, F.J.; Strazzera, F.; Jerez, J.M.; Urda, D.; Franco, L. Forward Noise Adjustment Scheme for Data Augmentation. In Proceedings of the 2018 IEEE Symposium Series on Computational Intelligence (SSCI), Bangalore, India, 18–21 November 2018; pp. 728–734. [Google Scholar] [CrossRef]
  31. Devries, T.; Taylor, G.W. Improved regularization of convolutional neural networks with cutout. arXiv 2017, arXiv:170804552. [Google Scholar]
  32. Zuo, R.G.; Cheng, Q.M.; Xu, Y.; Yang, F.F.; Xiong, Y.H.; Wang, Z.Y.; Kreuzer, O.P. Explainable artificial intelligence models for mineral prospectivity mapping. Sci. China Earth Sci. 2024, 54, 2917–2928, (In Chinese with English Abstract). [Google Scholar] [CrossRef]
  33. Li, W.; Wu, G.D.; Zhang, F.; Du, Q. Hyperspectral Image Classification Using Deep Pixel-Pair Features. IEEE Trans. Geosci. Electron. 2016, 55, 844–853. [Google Scholar] [CrossRef]
  34. Gulrajani, I.; Ahmed, F.; Arjovsky, M.; Dumoulin, V.; Courville, A.C. lmproved training of Wasserstein GANs. Adv. Neural Inf. Process. Syst. 2017, 30. [Google Scholar] [CrossRef]
  35. Zhang, G.W.; Guo, A.L.; Yao, A.P. Western Qinling-Songpan continental tectonic nodein China’s continental tectonics. Earth Sci. Front. 2004, 11, 23–32, (In Chinese with English Abstract). [Google Scholar]
  36. Lu, Y.C. Skarn Copper (Gold) Metallogeny and Metallogenic Regularities in the West Section of the Western Qinling Orogen. Ph.D. Thesis, China University of Geosciences (Beijing), Beijing, China, 2017. (In Chinese with English Abstract). [Google Scholar]
  37. Wei, L.X.; Chen, Z.L.; Pang, Z.S.; Han, F.B.; Xiao, C.H. An Analysis of the Tectonic Stress Field in the Zaozigou Gold Deposit, Hezuo Area, Gansu Province. Acta Geosci. Sin. 2018, 39, 79–93, (In Chinese with English Abstract). [Google Scholar]
  38. Zhang, S. Multi-Geoinformation Integration for Mineral Prospectivity Mapping in the Hezuo-Meiwu District, Gansu Province. Ph.D. Thesis, China University of Geosciences (Beijing), Beijing, China, 2021. (In Chinese with English Abstract). [Google Scholar]
  39. Zhang, S. Comprehensive Information Mineral Exploration Prediction Research in the Hezuo-Mewu Area, Gansu Province. Ph.D. Thesis, China University of Geosciences (Beijing), Beijing, China, 2021. (In Chinese with English Abstract). [Google Scholar]
  40. Liang, Z.L.; Chen, G.Z.; Ma, H.S.; Zhang, Y.N. Evolution of Ore-controlling Faults in the Zaozigou Gold Deposit, Western Qinling. Geotecton. Metallog. 2016, 40, 354–366. [Google Scholar]
  41. Liu, C.X.; Cheng, Y.Y.; Luo, X.G.; Liang, Z.L.; Jing, D.G.; Ma, H.H. Study on characteristics and exploration significance of main ore belt and orebody of Zaozigou super large gold deposit in Hezuo, Gansu. Miner. Resour. Geol. 2018, 32, 969–977, (In Chinese with English Abstract). [Google Scholar]
  42. Gu, J.X.; Wang, Z.H.; Kuen, J.; Ma, L.Y.; Shahroudy, A.; Shuai, B.; Liu, T.; Wang, X.X.; Wang, G.; Cai, J.F.; et al. Recent advances in convolutional neural networks. Pattern Recognit. 2018, 77, 354–377. [Google Scholar] [CrossRef]
  43. Uang, C.M.; Yin, S.; Andres, P.; Reeser, W.; Yu, F.T. Shift-invariant interpattern association neural network. Appl. Opt. 1994, 33, 2147–2151. [Google Scholar] [CrossRef] [PubMed]
  44. Krizhevsky, A.; Sutskever, I.; Hinton, G.E. Imagenet classification with deep convolutional neural networks. Adv. Neural Inf. Process. Syst. 2012, 25. [Google Scholar] [CrossRef]
  45. LeCun, Y.; Bottou, L.; Bengio, Y.; Haffner, P. Gradient-based learning applied to document recognition. Proc. IEEE 1998, 86, 2278–2324. [Google Scholar] [CrossRef]
  46. Simonyan, K.; Zisserman, A. Very deep convolutional networks for large-scale image recognition. arXiv 2014, arXiv:1409.1556. [Google Scholar]
  47. Goodfellow, J.; Pouget-Abadie, J.; Mirza, M.; Xu, B.; Warde-Farley, D.; Ozair, S.; Courville, A.; Bengio, Y. Generative adversarial Networks. Adv. Neural Inf. Process. Syst. 2014, 27. [Google Scholar] [CrossRef]
  48. Radford, A. Unsupervised representation learning with deep convolutional generative adversarial networks. arXiv 2015, arXiv:1511.06434. [Google Scholar]
  49. Karras, T. A Style-Based Generator Architecture for Generative Adversarial Networks. arXiv 2019, arXiv:1812.04948. [Google Scholar]
  50. Ramesh, A.; Pavlov, M.; Goh, G.; Gray, S.; Voss, C.; Radford, A.; Chen, M.; Sutskever, L. Zero-shot text-to-image generation. Int. Conf. Mach. Learn. 2021, 139, 8821–8831. [Google Scholar] [CrossRef]
  51. Kong, J.; Kim, J.; Bae, J. Hifi-gan: Generative adversarial networks for efficient and high fidelity speech synthesis. Adv. Neural Inf. Process. Syst. 2020, 33, 17022–17033. [Google Scholar]
  52. Goodfellow, I.; Yoshua, B.; Aaron, C. Deep Learning; MIT Press: Cambridge, MA, USA, 2017. [Google Scholar]
  53. Mescheder, L.; Geiger, A.; Nowozin, S. Which training methods for GANs do actually converge? Int. Conf. Mach. Learn. 2018, 80, 3481–3490. [Google Scholar] [CrossRef]
  54. Salimans, T.; Goodfellow, I.; Zaremba, W.; Cheung, V.; Radford, A.; Chen, X. Improved techniques for training gans. Adv. Neural Inf. Process. Syst. 2016, 29. [Google Scholar] [CrossRef]
  55. Lopez-Paz, D.; Oquab, M. Revisiting classifier two-sample tests. arXiv 2016, arXiv:1610.06545. [Google Scholar]
  56. Wang, T.C.; Liu, M.Y.; Zhu, J.Y.; Tao, A.; Kautz, J.; Catanzaro, B. High-resolution image synthesis and semantic manipulation with conditional gans. In Proceedings of the IEEE Conference on Computer Vision and Pattern Recognition, Salt Lake City, UT, USA, 18–23 June 2018; pp. 8798–8807. [Google Scholar] [CrossRef]
  57. Nykänen, V.; Lahti, I.; Niiranen, T.; Korhonen, K. Receiver operating characteristics (ROC) as validation tool for prospectivity models—A magmatic Ni–Cu case study from the Central Lapland Greenstone Belt, Northern Finland. Ore Geol. Rev. 2015, 71, 853–860. [Google Scholar] [CrossRef]
  58. Zuo, R.G.; Kreuzer, O.P.; Wang, J.; Xiong, Y.H.; Zhang, Z.J.; Wang, Z.Y. Uncertainties in GIS-based mineral prospectivity mapping: Key types, potential impacts and possible solutions. Nat. Resour. Res. 2021, 30, 3059–3079. [Google Scholar] [CrossRef]
  59. Sun, T.; Chen, F.; Zhong, L.X.; Liu, W.X.; Wang, Y. GIS-based mineral prospectivity mapping using machine learning methods: A case study from Tongling ore district, eastern China. Ore Geol. Rev. 2019, 109, 26–49. [Google Scholar] [CrossRef]
  60. Zuo, R.G.; Wang, J. Fractal/multifractal modeling of geochemical data: A review. J. Geochem. Explor. 2016, 164, 33–41. [Google Scholar] [CrossRef]
  61. Carranza, E.J.M. Data-driven evidential belief modeling of mineral potential using few prospects and evidence with missing values. Nat. Resour. Res. 2015, 24, 291–304. [Google Scholar] [CrossRef]
Figure 2. Element concentration maps: (a) Au, (b) Ag.
Minerals 15 00184 g002
Figure 3. Distribution map of positive and negative samples.
Minerals 15 00184 g003
Figure 4. WGAN-GP structure diagram.
Minerals 15 00184 g004
Figure 5. The ROC curve of Raw_CNN model and WGAN–GP_CNN model.
Minerals 15 00184 g005
Figure 6. Mineral Prospectivity Mapping: (a) Raw_CNN, (b) WGAN-GP_CNN.
Minerals 15 00184 g006
Figure 7. Mineral prospectivity mapping by WGAN-GP_CNN.
Minerals 15 00184 g007
Table 1. Geochemical characteristics of Xiahe-Hezuo area.
ElementMinimum Maximum MedianMean Standard DeviationCoefficient of VariationNational
Average
Skewness
Ag0.043.870.120.130.080.620.0818.59
As2.476595.0015.3025.3993.003.6613.1047.57
Au0.30773.001.102.2114.956.771.9636.02
Ba235.001025.00550.00544.6449.440.09532.00−0.08
Bi0.11138.000.360.471.643.480.4769.44
Co5.1082.8014.3014.402.640.1812.405.44
Cu6.80974.0026.6027.8614.820.5323.6037.05
Hg6.43927.0031.3037.7232.460.8652.0010.92
Mo0.0012.150.840.880.270.311.0815.73
Pb8.40341.0025.3026.4110.230.3927.6014.02
Sb0.291909.001.092.3623.529.971.3065.63
W0.1067.002.102.542.420.952.5112.14
Zn23.301380.0088.5088.5621.580.2472.0025.52
Note: The mass fraction unit for Au and Hg elements is 10−9, while for the other elements is 10−6.
Table 2. WGAN network parameter table.
HyperparameterPositive SampleNegative Sample
Initial Learning Rate0.00050.0005
Penalty Coefficient7.56.5
Generator Learning Rate Decay0.9750.975
Discriminator Learning Rate Decay0.970.97
Batch Size3232
Number of Iterations30003000
OptimizerAdamAdam
Table 3. CNN structure table.
Layer TyperInput SizeOutput SizeKernel Size
Conv2d_1[m,13,50,50][m,32,48,48]5 × 5
BatchNorm2d[m,32,48,48][m,32,48,48]
ReLU[m,32,48,48][m,32,48,48]
MaxPooL_1[m,32,48,48][m,32,24,24]2 × 2
Conv2d_2[m,32,24,24][m,64,24,24]3 × 3
BatchNorm2d[m,64,24,24][m,64,24,24]
ReLU[m,64,24,24][m,64,24,24]
MaxPooL_2[m,64,24,24][m,64,12,12]2 × 2
Conv2d_3[m,64,12,12][m,128,12,12]3 × 3
BatchNorm2d[m,128,12,12][m,128,12,12]
ReLU[m,128,12,12][m,128,12,12]
MaxPooL_3[m,128,12,12][m,128,6,6]2 × 2
Linear_1[m,4608][m,512]
Linear_2[m,512][m,2]
Table 4. Classification accuracy with and without data augmentation.
ModelTrain AccTest Acc
Raw_CNN92%90%
WGAN–GP_CNN97%92%
Disclaimer/Publisher’s Note: The statements, opinions and data contained in all publications are solely those of the individual author(s) and contributor(s) and not of MDPI and/or the editor(s). MDPI and/or the editor(s) disclaim responsibility for any injury to people or property resulting from any ideas, methods, instructions or products referred to in the content.

