Article

Deep Exploration Porphyry Molybdenum Deposit in Dasuji, Inner Mongolia: Insight from Aeromagnetism and Controlled-Source Audio-Magnetotellurics

1
Institute of Disaster Prevention, Sanhe City 065201, China
2
Langfang Key Laboratory of Earth Exploration and Information Technology, Langfang 065201, China
3
Mudanjiang Center of Natural Resources Comprehensive Survey, China Geological Survey, Mudanjiang 157021, China
4
Inner Mongolia Non-Ferrous Geological Mining Industry Huhehaote, Huhehaote 010000, China
5
Hebei Key Laboratory of Earthquake Dynamics, Sanhe City 065201, China
*
Authors to whom correspondence should be addressed.
Minerals 2025, 15(2), 166; https://doi.org/10.3390/min15020166
Submission received: 17 December 2024 / Revised: 30 January 2025 / Accepted: 3 February 2025 / Published: 11 February 2025

Abstract

:
Porphyry molybdenum deposits hold significant potential for deep exploration. However, in the Dasuji molybdenum deposit, quartz porphyry, granite porphyry, and syenogranite are sporadically exposed beneath low mountains and hilly terrain, limiting the effectiveness of traditional geological methods. Consequently, geophysical techniques have become essential in this region. This study provides new magnetism and resistivity data obtained through high-precision aeromagnetic surveys and controlled-source audio-magnetotellurics (CSAMT) profiles. These results reveal concealed deep porphyries, identify deep-seated molybdenum ore bodies, and establish a porphyry-type molybdenum metallogenic model. The porphyries exhibit the lowest magnetic values (about −200 to 370 nT), suggesting that molybdenum mineralization-related granitoids have exceeded the Curie temperature and undergone an intense magnetic weakening effect. Ferromagnetic or ferromagnetic substances have transformed into paramagnetic substances. The CSAMT results indicate that the mineralized granite porphyry generally has medium to high resistivity (300 Ω·m to 500 Ω·m) and dips southward with a 60° inclination angle. Additionally, an unclosed low-resistance anomaly in the deep region of site 0 indicates promising potential for further mineral exploration and the discovery of deeper mineralized porphyries. We interpret weak magnetic anomalies and variations in resistivity as caused by high crystallization temperatures, low oxygen fugacity, and hydrothermal alteration in the context of porphyry molybdenum deposit mineralization.

1. Introduction

Porphyry molybdenum deposits, closely associated with intermediate to acidic porphyry bodies in terms of time, space, and origin, represent the most significant source of molybdenum, accounting for 95% of the global supply [1,2]. Numerous studies on molybdenum deposits have emerged from Inner Mongolia [3,4,5]. Traditionally, the Tailong–Liangcheng fault-uplift zone was regarded as a blind spot for exploring large metal deposits due to its low mountains and hilly terrain [6]. However, with the rapid advancements in geological and geophysical exploration techniques, substantial molybdenum deposits have been successively discovered in Dasuji, Caosiyao, and Quanzigo [6]. This has elevated the region to the third-largest molybdenum ore belt in China, following the Lesser Khingan Mountains and Zhang Guangcai Ridge molybdenum ore belts. Geochronological and geochemistrical data suggest that the ore-bearing granite porphyry in Dasuji is primarily I-type granitoid [5,6]. Studies on micro-thermometry, fluid inclusions, and other mineral chemistry suggest that the Dasuji porphyry molybdenum deposit has undergone four developmental stages: (1) K-feldspar with minor molybdenum mineralization, (2) molybdenum mineralization associated with silicification, (3) lead–zinc mineralization accompanied by carbonatization and fluorination, and (4) non-mineralization. Despite these findings, questions remain about the metallogenic mechanisms and potential for deep mineral exploration [6]. For example, the physical and chemical conditions for molybdenum ore formation are not well understood, and the potential for further exploration in peripheral and deep regions remains a topic of debate.
Compared to the numerous geochemical and geochronological studies focusing on the Tailong–Liangcheng fault-uplift zone, relatively few studies have explored the geophysical aspects of the Dasuji porphyry molybdenum deposit. Traditionally, the induced polarization (IP) method is combined with controlled-source audio-magnetotellurics (CSAMT) for ore body detection [7,8,9]. The long-offset transient electromagnetic method (LOTEM) has been applied to geophysical investigations of the Earth’s crust [10,11,12,13,14,15,16]. Aeromagnetic surveys can be very useful for regional-scale generation of porphyry copper deposits and for constraining the planar distribution of magmatic rocks. Additionally, ground electromagnetic methods are effective tools for identifying supergene copper mineralization. Hypogene porphyry systems, characterized by clay- and silica-rich advanced argillic alteration, can be detected by their high resistivity [17,18,19,20,21].
This study introduces the latest large-scale, high-precision magnetic data to identify the quartz porphyry, granite porphyry, syenite granite, plagioclase granite, and diorite porphyry veins. Furthermore, CSAMT data are presented to elucidate the spatial distribution of deep-seated molybdenum ore bodies.

2. Geological Setting

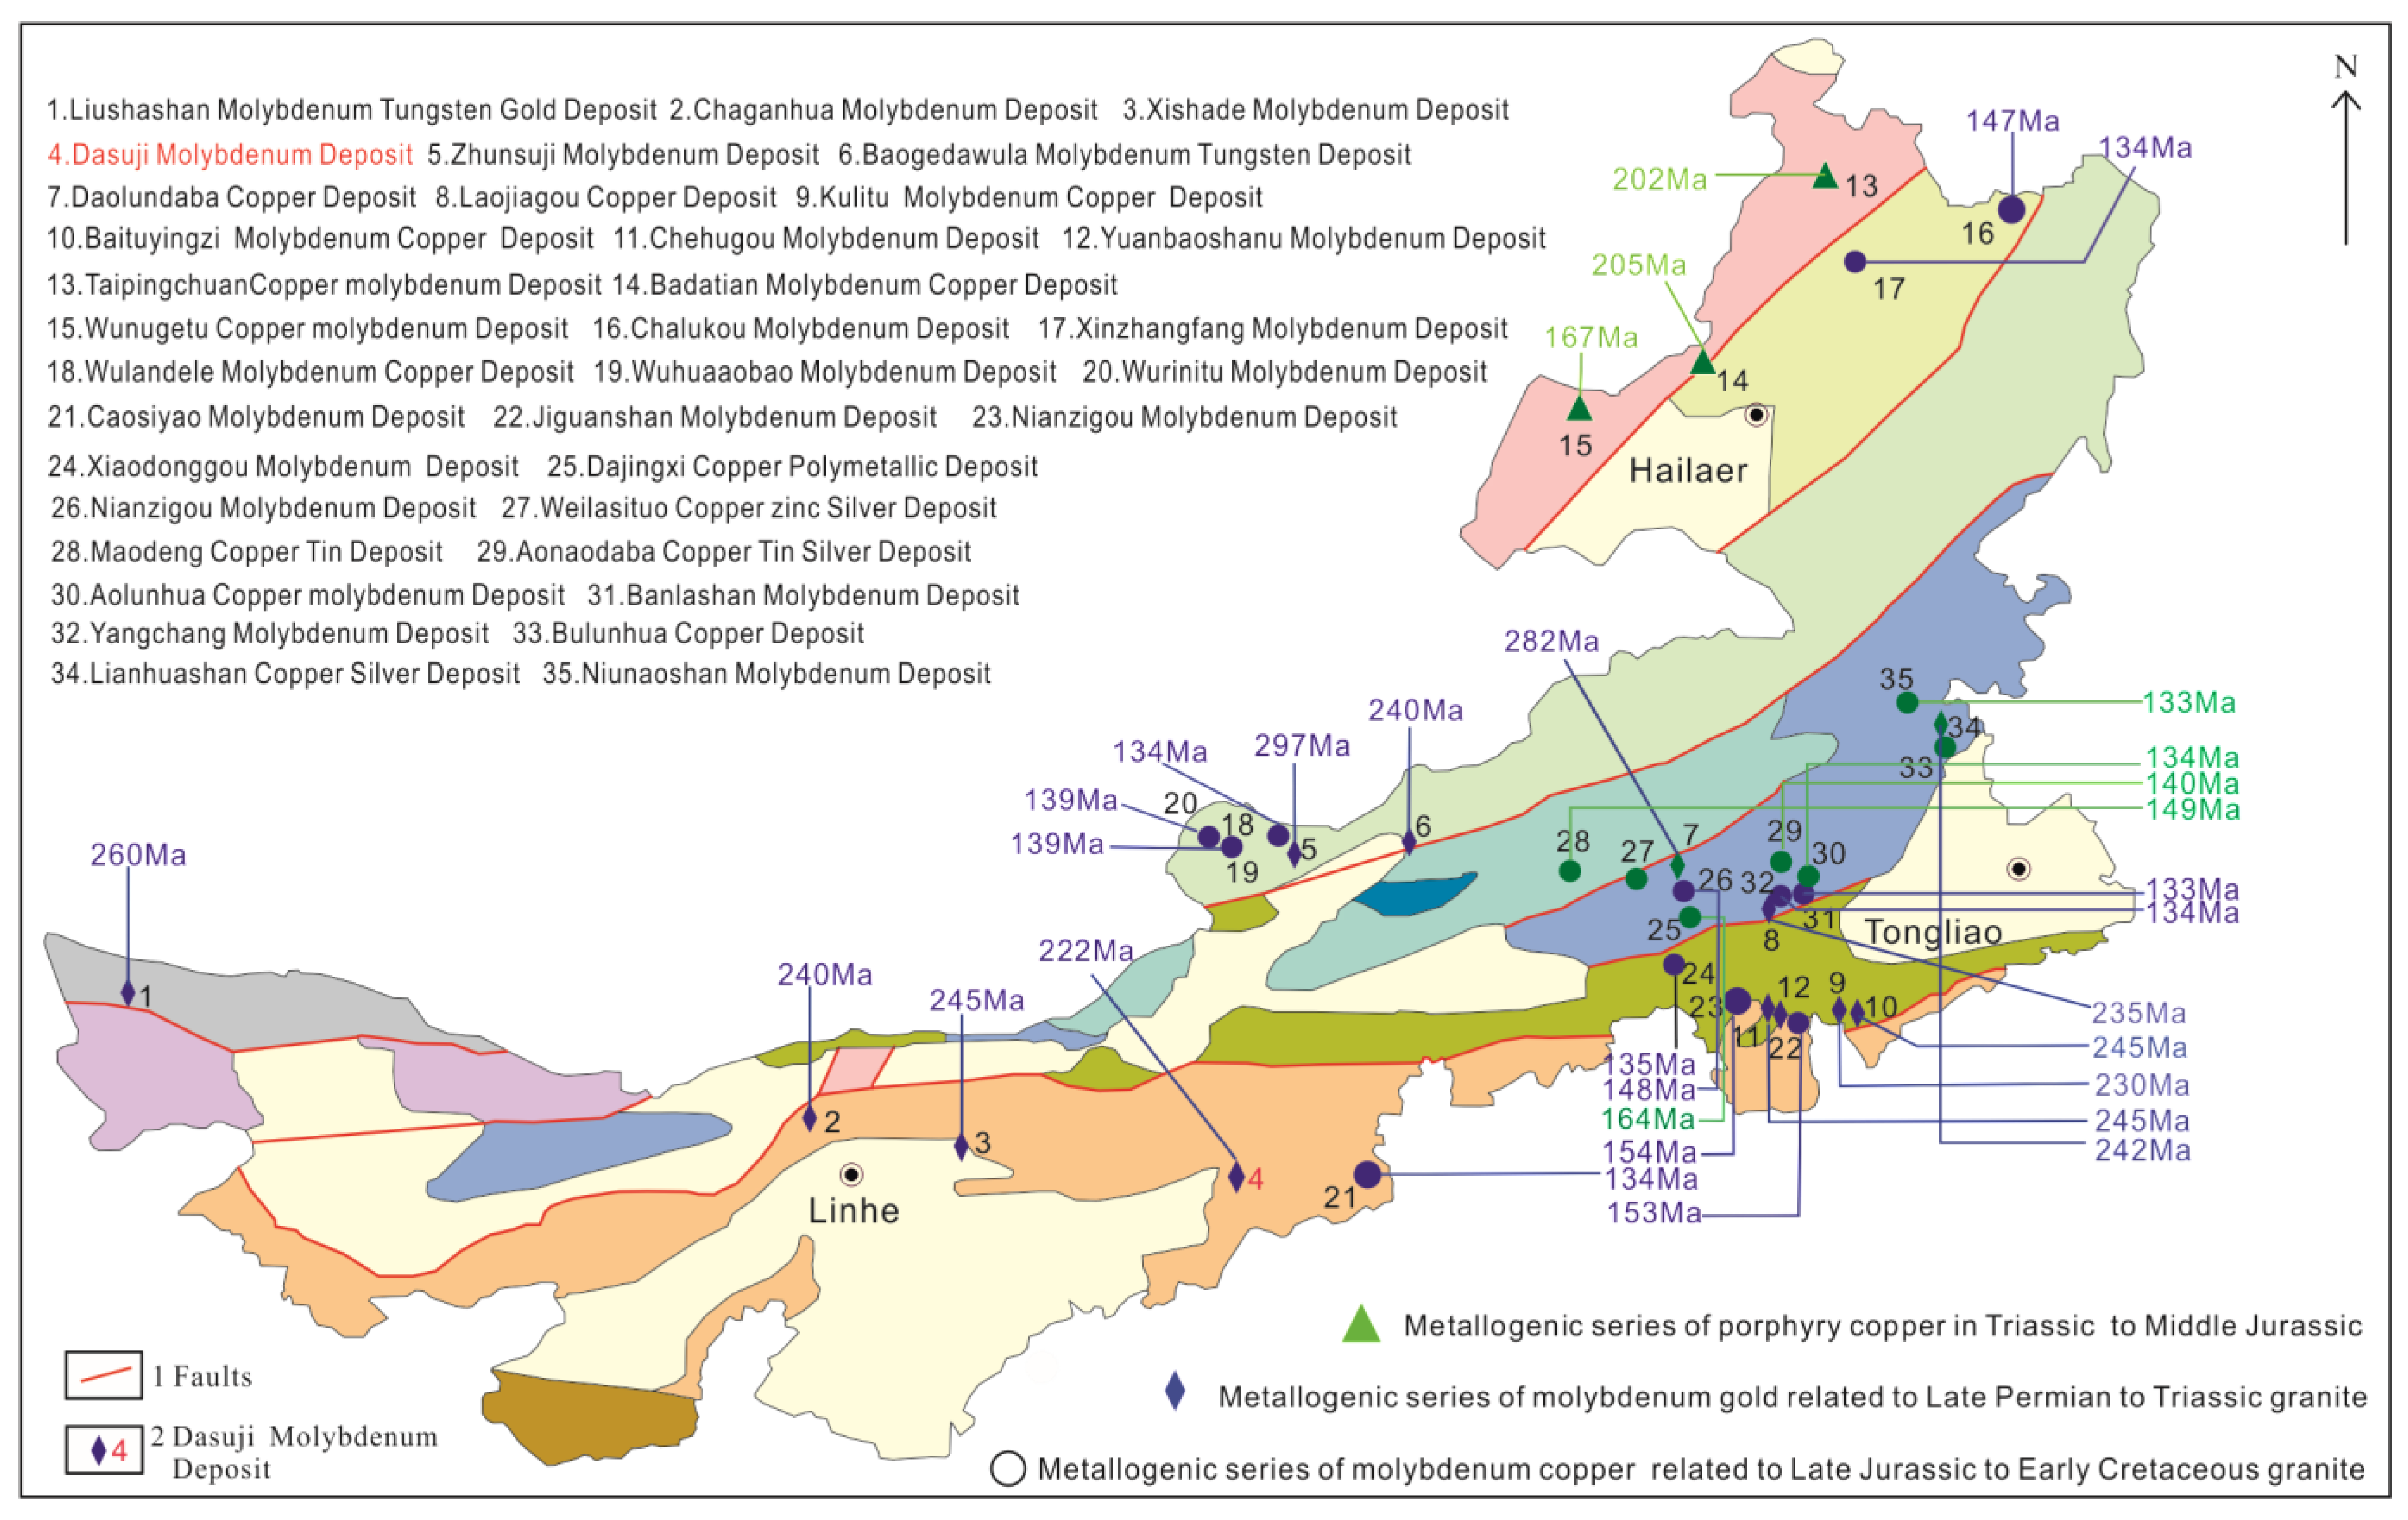
2.1. Regional Geological Setting

Inner Mongolia hosts three molybdenum mineralization periods: Triassic, Jurassic, and Early Cretaceous. The earliest ore formation is closely linked to the evolution of the Paleo-Asian Ocean; and occurred during post-collisional extension [22] (Figure 1). The Dasuji molybdenum deposit is located in the northeastern part of the Khondalite Belt, which is formed around 1.95 Ga due to the collision of the Yinshan and Ordos Blocks (Figure 2a). The region’s stratigraphy includes the Paleoarchean Xinghe Group, Middle Archean Jining Group and Ula Mountain Groups, Neoarchean Serteng Group, Paleozoic Huaigou Group, and Mesozoic and Cenozoic strata. The Xinghe Group mainly consists of banded perilla plagioclase granulite, two-pyroxene granulite, and plagioclase amphibolite. The Jining Group is widespread across Zhuozi, Liangcheng, Jining, and Xinghe with prevalent lithologies such as leptite, granulite, and gneiss. The Ula Mountain Group primarily comprises gneiss, plagioclase amphibolite, and diopside marble. The Serteng Group mainly includes quartz rock, granulite, schist, and diopside marble. The Huaigou Group is mainly dominated by conglomerate, sandstone, and shale, representing Middle Jurassic clastic formations. The upper Jurassic Manketoubo Group contains terrestrial volcanic rocks. The lower Cretaceous Lisangou and Bainvpan Groups comprise terrestrial clastic and volcanic rocks, respectively. Cenozoic strata are prevalent in the central low-lying basin [5]. The region is characterized by significant fault activity, volcanic processes, and magma events. Three major west-to-east faults dominate the area, namely the Guyang–Wuchuan–Shangyi fault (F1), Linhe–Baotou–Jining fault (F2), and Daihai–Huangqihai fault (F3). Additionally, the north–south-trending Shangdu–Xinghe–Weixian fault (F4) plays a critical role. Mesozoic volcanic and intrusive rock distributions are influenced by these fault systems. Mineralization is closely associated with faults F3 and F4, which directly control the distribution of Mesozoic volcanic and intrusive rocks [22,23] (Figure 2b).

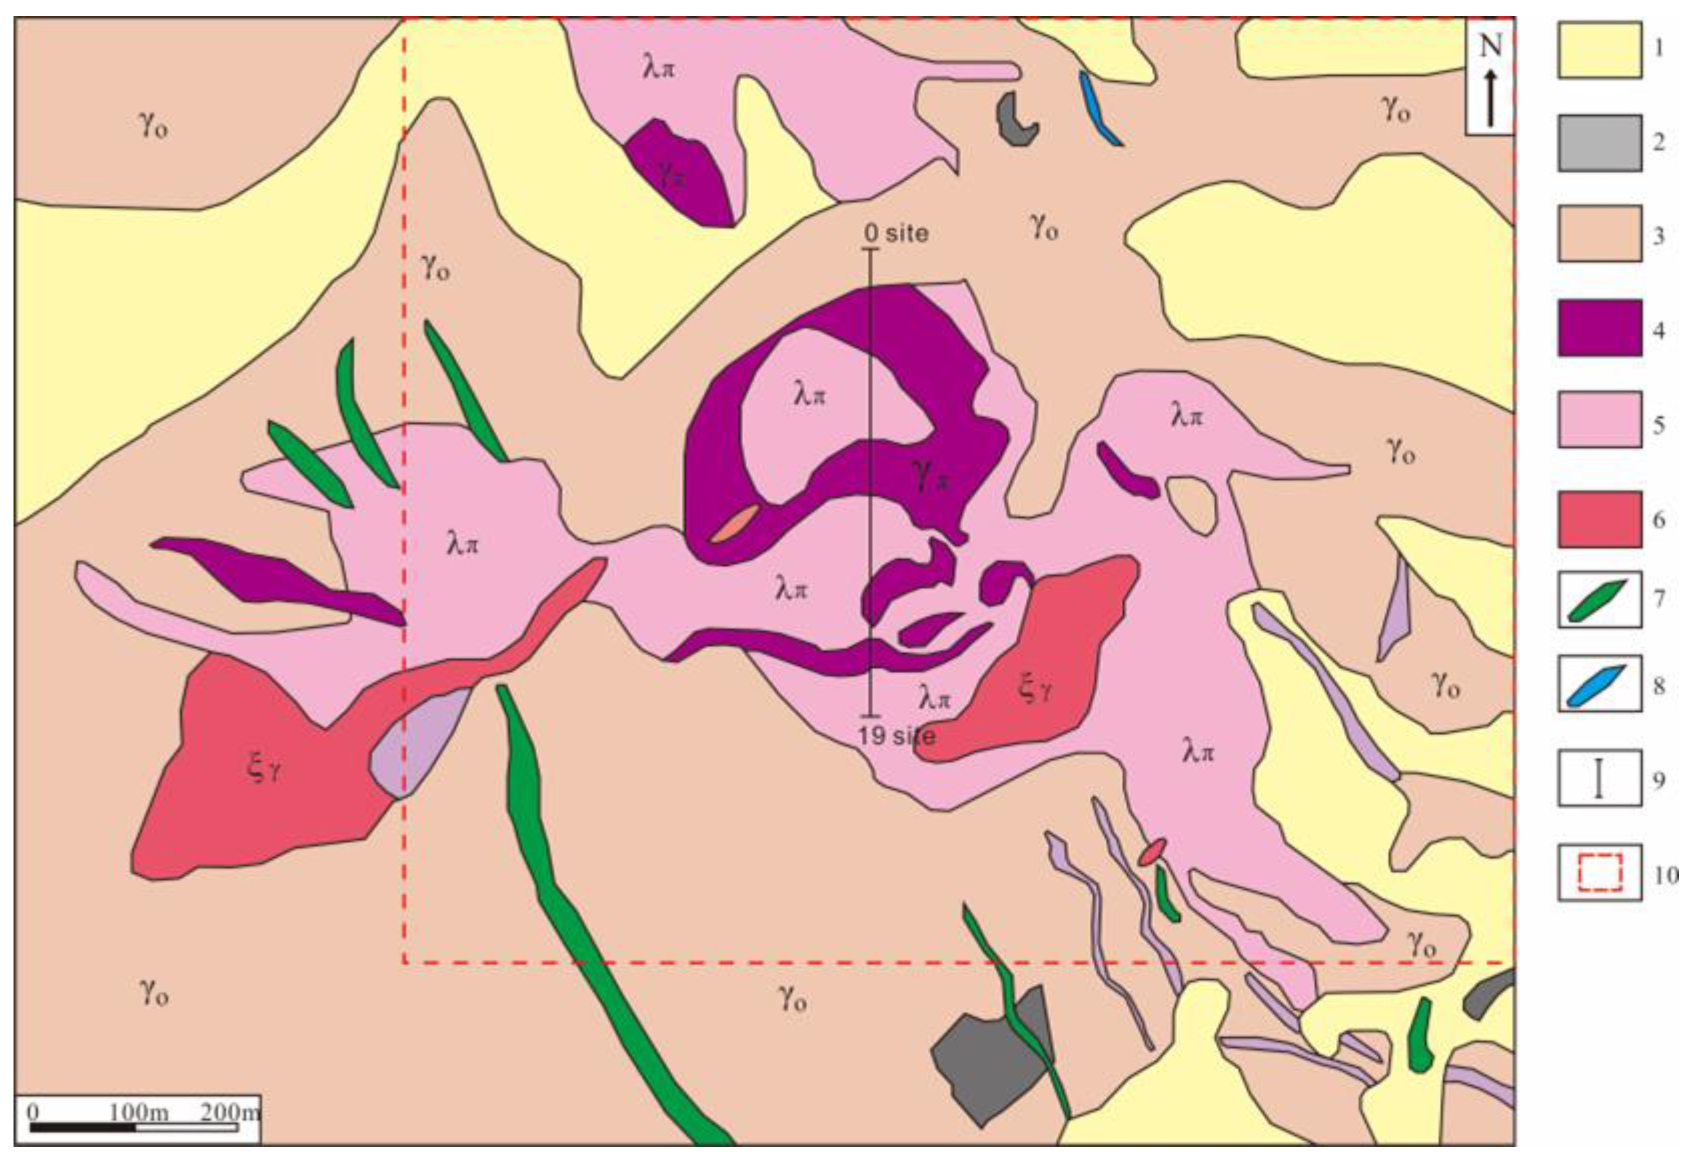
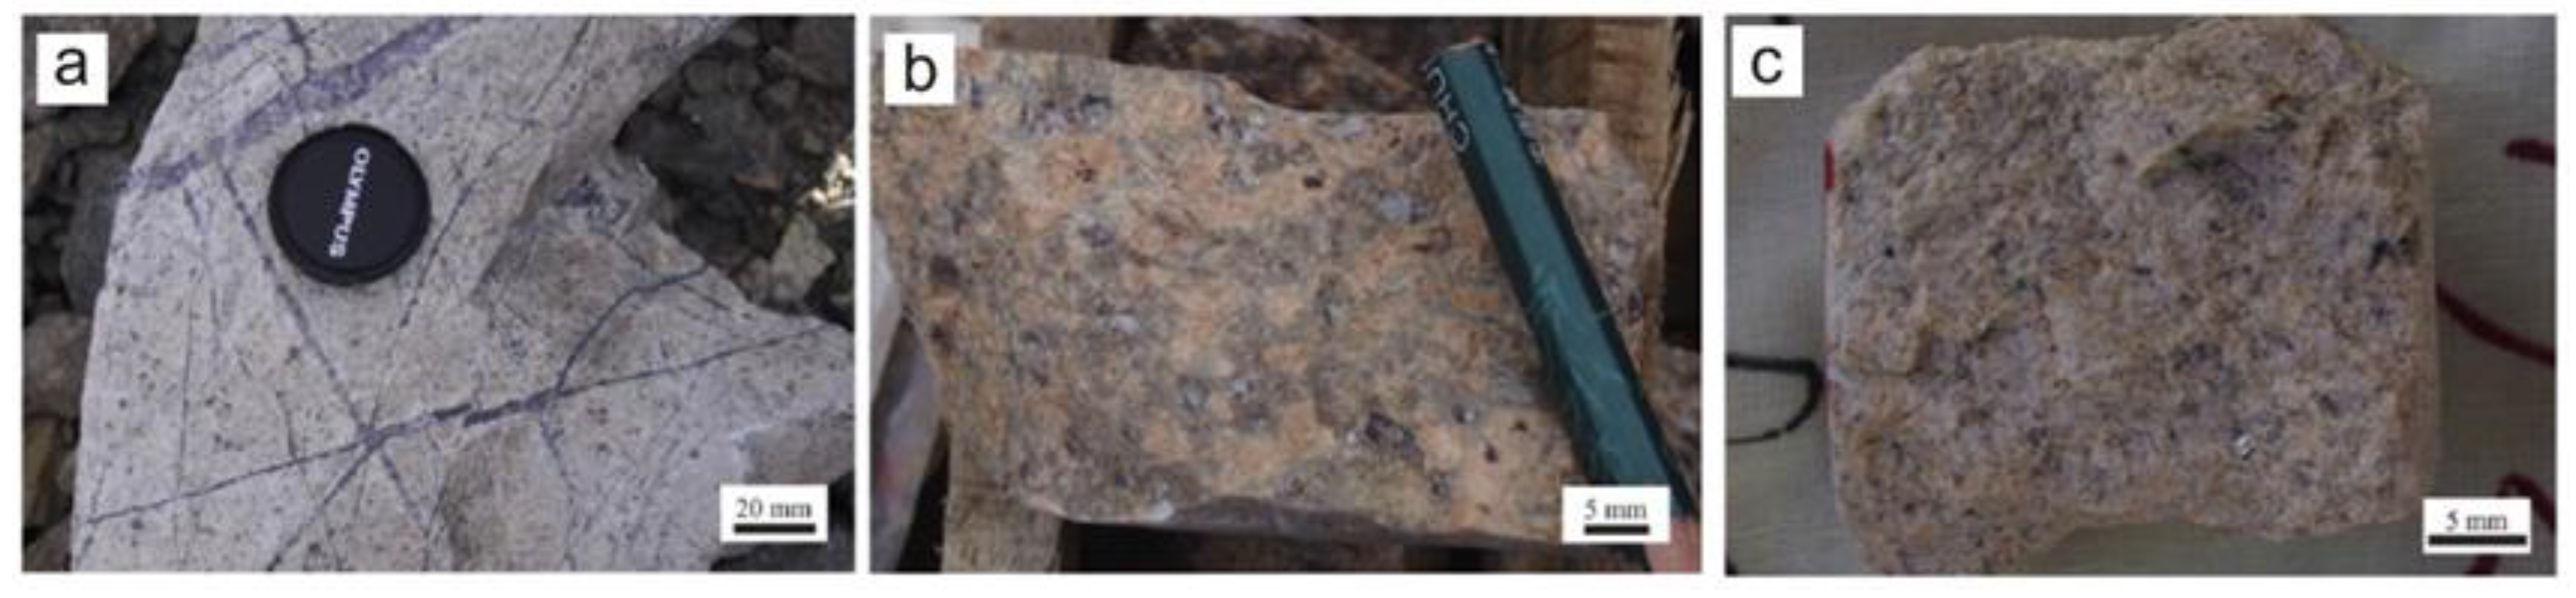
2.2. Geological Setting of Dasuji Molybdenum Deposit

The exposed strata at the Dasuji molybdenum deposit include Precambrian Jining Group gneiss, Tertiary shale, and Quaternary loess. Magmatic rocks in the area mainly consist of Late Archean fragmented plagioclase granite, Triassic quartz porphyry, granite porphyry, alkaline granite, Jurassic granite porphyry, and a minor diabase and diorite porphyry veins. Among these, the Triassic granite and quartz porphyry are closely associated with molybdenum mineralization [6] (Figure 3).
Triassic quartz porphyry is gray-white, with porphyritic and blocky structures. It comprises quartz (80%) with minor potassium feldspar (10%) and plagioclase (10%). This rock intruded Archean plagioclase granite as small stocks or veins, producing strong iron–manganese staining (resembling burned skin), and forming early molybdenum ore bodies. Granite porphyry is flesh-red, with spotted and blocky structures. Its phenocrysts consist of quartz (30%), potassium feldspar (30%), and a small amount of plagioclase (5%–10%). This rock intruded quartz porphyry, creating rupture zones and forming the main molybdenum ore bodies [6] (Figure 4).
The porphyry evolved through distinct stages: early potassium mineralization, middle sericite mineralization, and late kaolin and carbonate mineralization. Molybdenum ore bodies are mainly located at the top or within the contact zones between quartz porphyry and syenogranite (or syenogranite porphyry). These ore bodies are tightly controlled by sericite alteration and typically occur as lens-shaped formations, predominantly displaying micrograin-disseminated and veinlet-disseminated structures.

2.3. Petrophysical Parameters of Dasuji Molybdenum Deposit

Significant differences in petrophysical parameters are a prerequisite for geophysical surveying and research. Table 1 lists the petrophysical parameters, including specific resistivity and magnetic susceptibility, where I represents the supply current, U represents the supply voltage, and ρ and K denote resistivity and magnetic susceptibility, respectively.
Core samples, ranging from shallow to deep, consist of quartz porphyry, ore-bearing quartz porphyry, ore-bearing granite porphyry, alkaline granite, and plagioclase granite. Measurements were conducted using the water immersion method. Porphyry as a whole exhibited high specific resistivity (1016.62 Ω·m to 2548.82 Ω·m) and relatively low magnetic susceptibility (5.03 × 10⁻⁵ SI to 40.21 × 10⁻⁵ SI). Ore-bearing quartz porphyry and ore-bearing granite porphyry were characterized by moderately high specific resistivity (551.68 Ω·m to 755.90 Ω·m) and low magnetic susceptibility (2.51 × 10⁻⁵ SI to 32.67 × 10⁻⁵ SI). In contrast, plagioclase granite exhibited low specific resistivity (212.45 Ω·m to 782.19 Ω·m) and high magnetic susceptibility (412.16 × 10⁻⁵ SI to 782.19 × 10⁻⁵ SI).

3. Geophysical Analytical Methods

This study used aeromagnetic and CSAMT geophysical methods. Table 2 presents and compares the specific parameters of these two geophysical instruments for clarity.

3.1. Aeromagnetic Survey
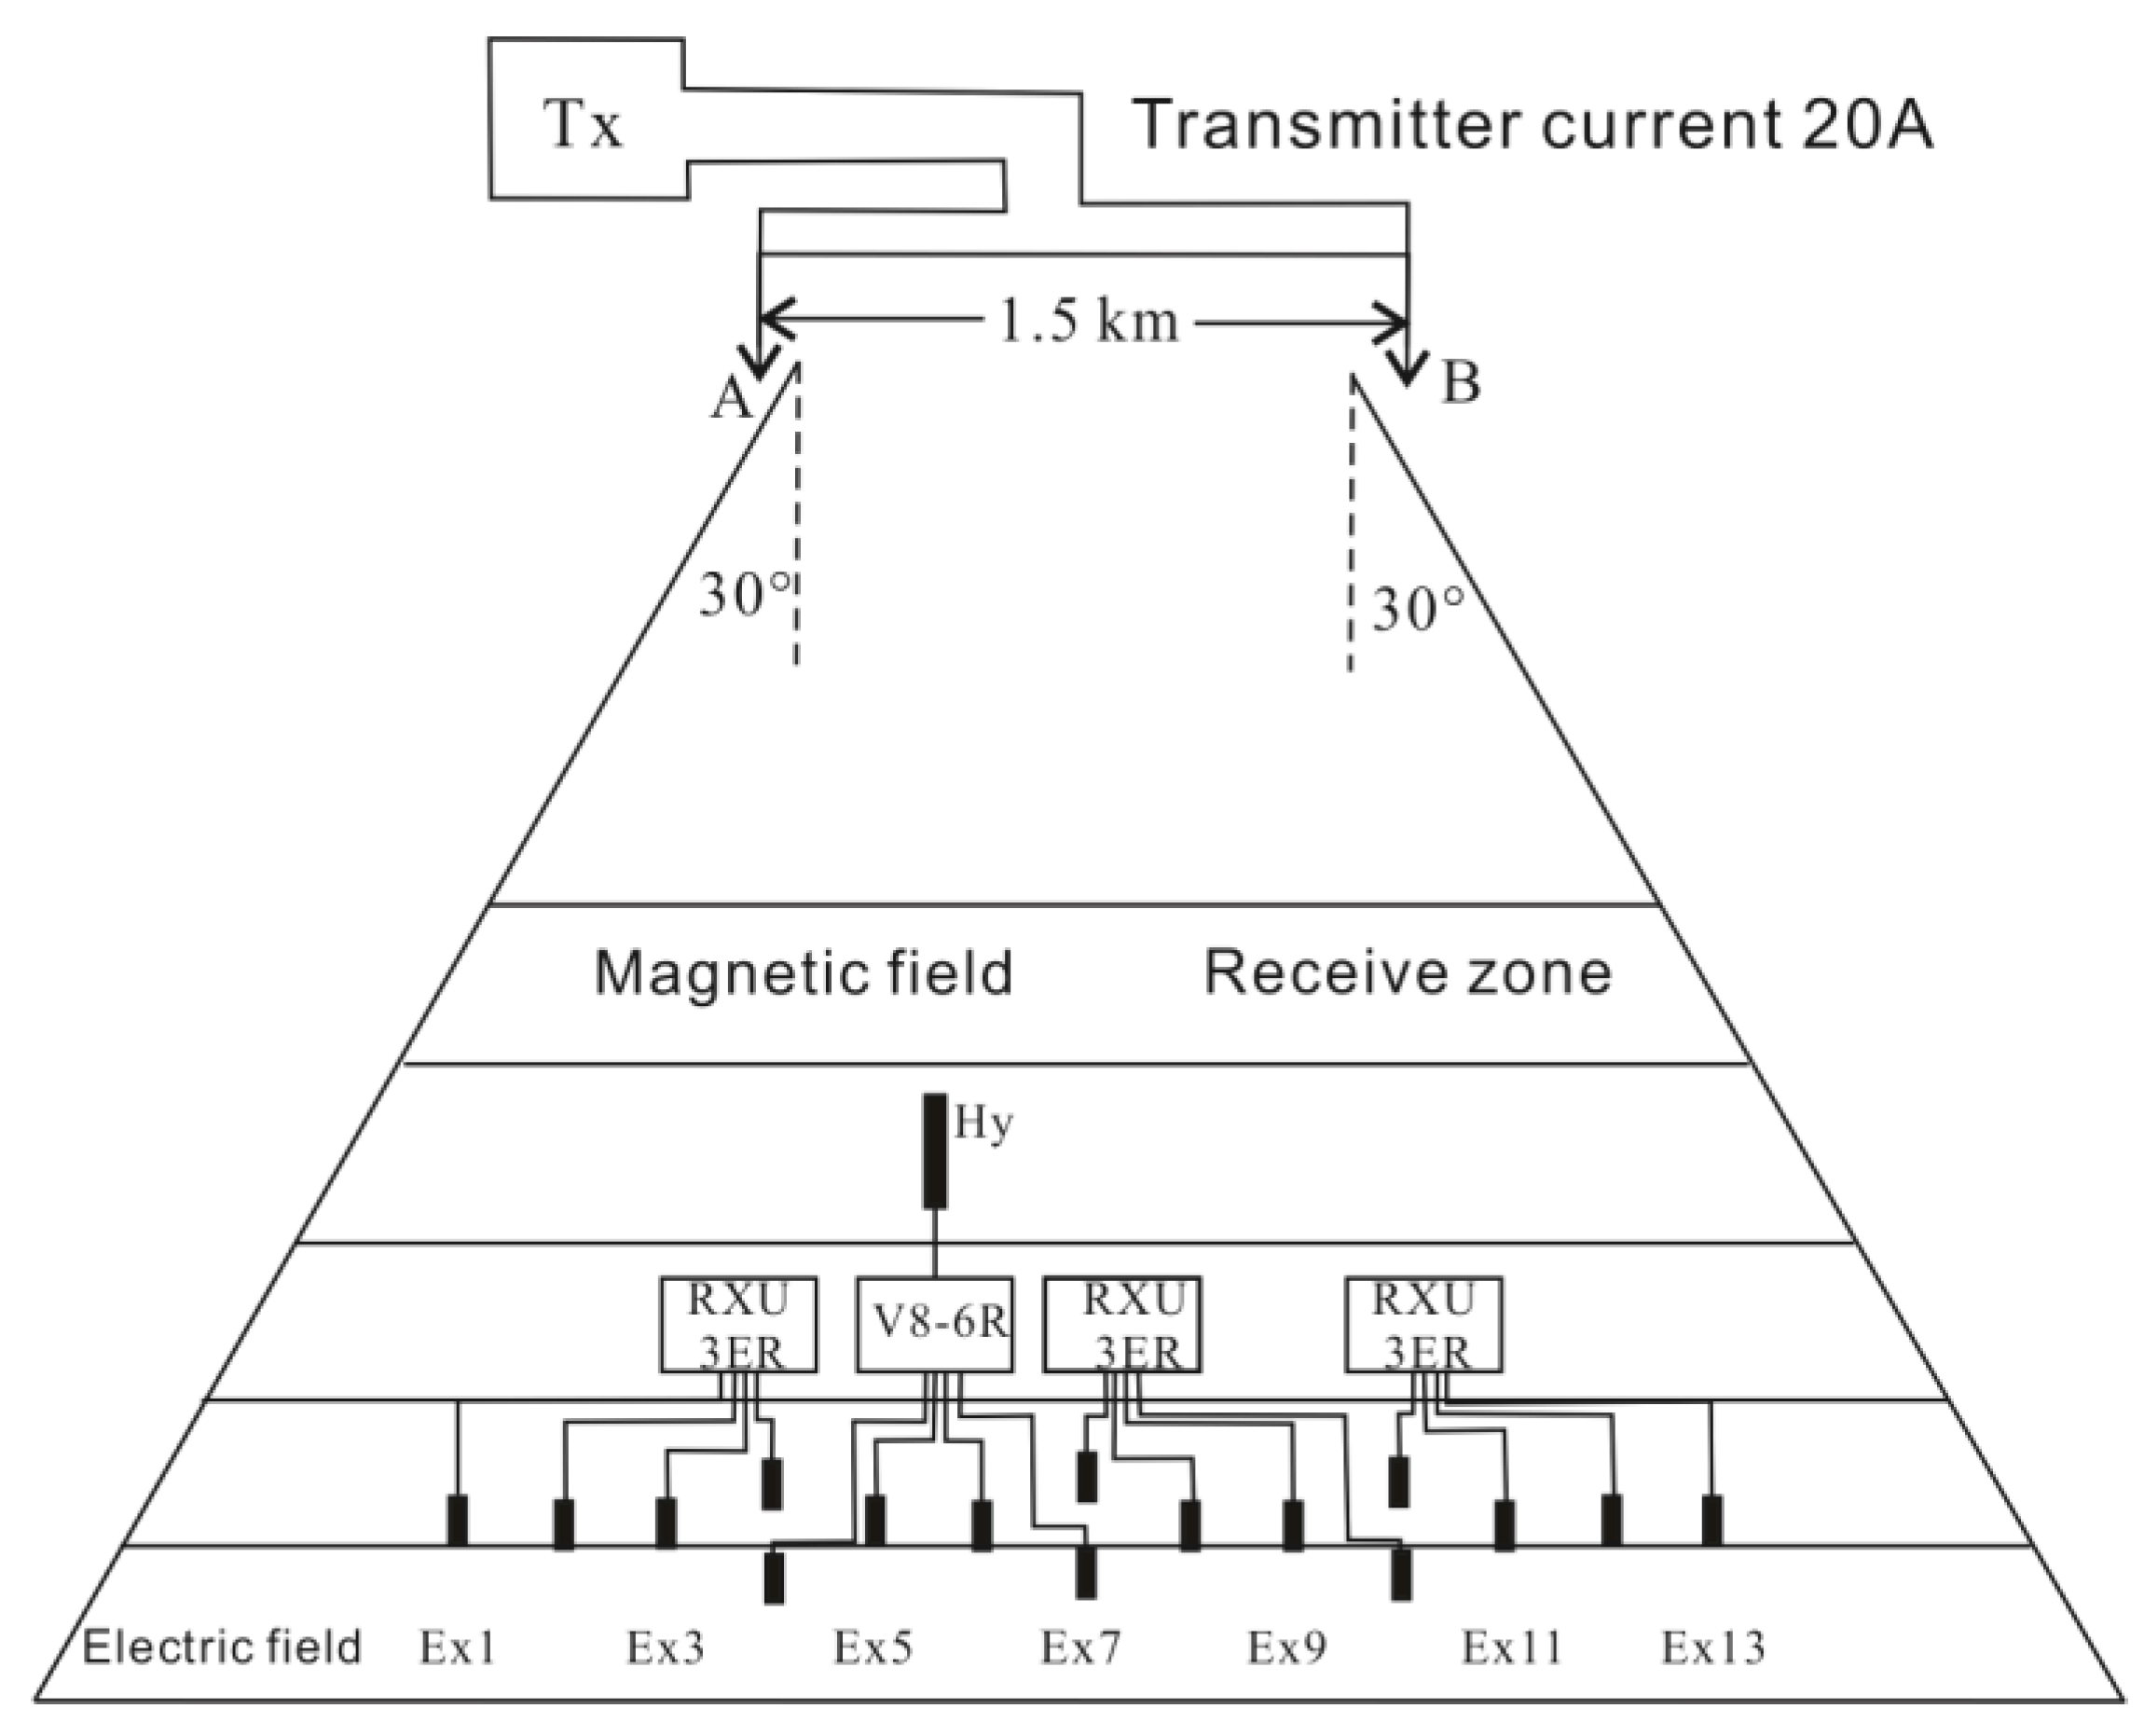
This aeromagnetic system consists of five components: a quadcopter unmanned aerial vehicle, an airborne navigation and positioning system, an airborne aeromagnetic survey system, ground station instruments, and a ground-based post-processed kinematic differential base station (Figure 5) [25]. The aeromagnetic survey included evaluations for flight altitude quality, deviation distance, static noise level, dynamic noise level, and compensation accuracy. The dynamic noise level before compensation was ±14.13 nano teslas (nT), which was reduced to ±1.17 nT after compensation. Similarly, the standard deviation before compensation was ±16.58 nT, which was improved to ±1.18 nT after compensation.
The normal field calculation was performed using the International Geomagnetic Reference Field (IGRF) formula published by the International Association for Geomagnetism and Aeronomy (IAGA). The three components of the total geomagnetic field strength are defined as follows:
X ( t ) = 1 r u θ = n = 1 n N m = 0 m n ( a r ) n + 2 g n m ( t ) cos m λ + h n m ( t ) sin m λ × d d θ P n m ( cos θ )
Y ( t ) = 1 r sin θ u λ = n = 1 n N m = 0 m n ( a r ) n + 2 m sin θ g n m ( t ) sin m λ h n m ( t ) cos m λ P n m ( cos θ )
Z ( t ) = u r = n = 1 n N m = 0 m n ( n + 1 ) ( a r ) n + 2 g n m ( t ) cos m λ + h n m ( t ) sin m λ P n m ( cos θ )
where u represents the geomagnetic potential, and r, θ, and λ denote the Earth’s spherical coordinates. The formula incorporates the n-th-order and m-th-degree Schmidt alkaline adjoint Legendre function, with N indicating the highest order, and g n m and h n m are the Gaussian spherical harmonic coefficients. The components X ( t ) , Y ( t ) , and Z ( t ) represent the northward, eastward, and vertical components of the total geomagnetic intensity in Earth coordinates, respectively. According to the 2020 IGRF model, the central geomagnetic dip in the Dasuji molybdenum deposit is 60.6958°, the magnetic declination is −6.6210°, and the normal geomagnetic field strength is 55,819.5 nT. Using these data, the geomagnetic total intensity (∆T) can be calculated.

3.2. CSAMT Survey

The transmitter generated electromagnetic signals at various frequencies (1 Hz to 8192 Hz), while the receivers measured the electrical and magnetic signals in the far field using polar and magnetic probes, respectively (Figure 6). The simplified expressions for the apparent resistivity (ρs) and exploration depth (H) are calculated using Equation (4):
ρ s = 1 5 f E x 2 H y 2
H 356 ρ f
where Ex and Hy represent alkaline horizontal electromagnetic fields, and ρ and f denote resistivity and frequency, respectively. CSAMT data were collected along a north–south-trending section (500 m), aligned with the inclination of the molybdenum ore body. The transmitter current ranged from 20 A to 3 A, with the distance between the transmitter and receiver approximating 9.8 km. The length of the electric dipole transmitter was about 1500 m.

4. Geophysical Results

4.1. Aeromagnetic Results

The interpretation of magnetic anomalies involves data preprocessing, conversion, and analysis. The data processing software used in this study was the RGIS software 2010. A critical step in preprocessing is dividing sub-regions that exhibit significant discrepancies in the magnetic field. In the polarized magnetic anomaly total field (∆T), two remarkable east–west-trending negative value zones and two positive zones appear in a parallel, staggered pattern, labeled as A, A’, B, and B’, respectively. In sub-regions A and A’, the central negative magnetic zone aligns with the Dasuji molybdenum deposit. The western section corresponds to Tertiary shale, while the northern area consists of Quaternary loess. In sub-regions B and B’, the highest positive magnetism corresponds to Mesoarchean plagioclase granite, while the higher positive magnetism is associated with Mesoarchean porphyritic alkali feldspar granite (Figure 7a). On the conversion map, ∆T is decomposed into three components: the vertical Z-direction magnetic anomaly (Za (A)), the horizontal X-direction magnetic anomaly (Hax (T)), and the horizontal Y-direction magnetic anomaly (Hay (H)). Within sub-region A’, the migration direction of the three negative magnetic components indicates that the porphyry molybdenum bodies extend east–west and dip southward (Figure 7b–d). Upward continuation in the spatial domain, performed at different altitudes (50 m, 100 m, 200 m, and 300 m), reveals a southeastward migration of sub-region A’ with decreasing negative magnetic intensity (Figure 7e–h). This supports the inferred trend and inclination of the porphyry molybdenum bodies. The first vertical derivative, combined with upward continuation, highlights details at various depths. The negative magnetism in sub-region A’ is further divided into three minor anomalies (Figure 7i). Additionally, a new negative magnetic zone is identified in the southeast, becoming more prominent at greater upward continuation depths (Figure 7j–l). These findings suggest that the porphyry was emplaced along a northwest–southeast-trending fracture system, leading to the formation of the Dasuji molybdenum deposit.

4.2. CSAMT Results

Accurately predicting complex geological bodies requires integrating information from multiple geophysical datasets [26,27,28]. A two-dimensional inversion was conducted using commercial software Scs2d 3.2.exe, developed by Zonge Company (Texas, USA). The results of the smooth Cagniard resistivity and impedance phase analyses confirmed that the field survey data were accurate and reliable (Figure 8b,c). The software collected observed data and built a new model section, incorporating line annotations, survey configurations, and inversion controls. After multiple iterations, the initial inversion resistivity was obtained. The software then automatically updated the model section to refine the resistivity through further inversion. Finally, the inversion errors were approximately 2.41%, which were below the required threshold (less than 5%).
The apparent resistivity generally ranges from 100 to 1000 Ω·m. However, shallow low-resistivity (below 50 Ω·m) and high-resistivity bodies (above 4000 Ω·m) are superimposed to form a complex geoelectric structure. Lateral variation: the CSAMT results can be divided into two segments. The first segment (sites 19–16) exhibits intermediate resistivity (100–500 Ω·m) and corresponds to Archean gneiss exposed at the surface. The second segment (sites 15–0) displays intermediate to high resistivity (1000–3000 Ω·m), representative of Triassic granite porphyry. Vertical variation: the resistivity sounding curve follows an H-type curve, indicative of a three-layer electrical structure comprising high-resistivity, low-resistivity, and high-resistivity layers. The thickness of the top high-resistivity layer decreases from south to north, varying from 150 m to 10 m. Meanwhile, the second low-resistivity layer becomes progressively thicker, corresponding to the third high-resistivity layer. To verify the geoelectric structure, three drillings were conducted at different depths. These revealed that (i) the shallow low-resistivity layer corresponds to oxidized molybdenum ore found at elevations ranging from 1470 m to 1346 m, (ii) the middle low-resistivity layer corresponds to sulfide molybdenum ore located at elevations from 1345 m to 1056 m. The ore bodies align with the low-resistivity zones, forming an inverted, gently tilted, half-bell-shaped structure (Figure 8a).

5. Discussion

5.1. Why Does the Dasuji Ore-Bearing Porphyry Exhibit Negative Magnetism?

Granitoids are widely distributed in the continental crust and serve as records of early geodynamic processes. Generally, they are classified into I-, S-, or A-types based on their formation environment and material composition [29,30,31]. S-type granitoids, due to their high SiO2 content and low ferromagnetic material content, typically exhibit lower magnetic characteristics compared to I- or A-type granitoids [32]. At the Dasuji molybdenum deposit, quartz porphyry, associated with early-stage molybdenum mineralization, is classified as an A-type granitoid, Granite porphyry, which forms the main molybdenum ore bodies, belongs to high-K calc-alkaline and peraluminous rocks, characteristic of I-type granitoids [6]. Unlike S-type granitoids, I-type granitoids generally contain more ferromagnetic substances due to their crust–mantle mixing origin. This would theoretically result in higher levels of geomagnetic total intensity values compared to A- or S-type granitoids. However, the magnetic data from the Dasuji deposit contradict this expectation. The granitoid porphyry exhibits strong negative magnetism (−100 to −300 nT), while the quartz porphyry shows weakly positive to neutral magnetic characteristics (−100 to 0 nT). This unexpected result raises an important question: why does the Dasuji ore-bearing porphyry display negative magnetism?
Several critical factors can reduce granite’s magnetism, including low oxygen fugacity, high crystallization temperatures, and hydrothermal alteration. During the magmatic mineralization stage, a low-oxygen-fugacity environment may oxidize magnetite (or pyrrhotite) into hematite or ilmenite. As is well known, the temperature at which ferromagnetic or ferrimagnetic materials transform into paramagnetic substances is called the Curie temperature. The Curie temperature of iron is approximatively 770 °C. Studies indicate that the granite porphyry under investigation is highly siliceous (up to 76.2%), with calculated zircon saturation temperatures (TZr) ranging from 762 °C to 774 °C (average 768 °C) [33,34,35]. Additionally, the quartz porphyry, classified as an A-type granitoid, also likely exceeds this critical temperature. Consequently, the granitoids associated with molybdenum mineralization have surpassed the Curie temperature and experienced a magnetic weakening effect [36]. Moreover, hydrothermal alteration can further destroy magnetic minerals. Consequently, the Dasuji ore-bearing porphyry exhibits weakly magnetic or paramagnetic properties [37,38,39].

5.2. Deep Mineral Exploration in the Dasuji Molybdenum Deposit

Most large or super-large porphyry deposits are typically identified as massive ore bodies in the second prospecting space (500–2000 m depth). Examples include the Mount Pleasant W-Mo deposit, the Qulong Cu-Mo deposit, and the Dexing Cu-W deposit [35,36,37].
Successful deep mineral predictions have been achieved at the Qulong porphyry deposit using the magnetic and CSAMT methods [40]. Upward continuation and first vertical derivative analyses of magnetic data indicate that the porphyry molybdenum bodies trend eastward and incline southward. The second low-resistivity layer detected by CSAMT correlates with oxidized molybdenum ore located at elevations between 1470 and 1346 m, while the middle layer corresponds to sulfide molybdenum ore situated from 1345 to 1056 m (Figure 9a). The southern inclination of the molybdenum ore bodies and the unclosed low-resistivity layer suggest significant potential for deep mineral exploration. Additionally, negative magnetism along the north–south-trending magnetic profile implies that the porphyry extends to a depth between sites 12 and 40. To assess the potential for deep-seated mineralization, the Inner Mongolia Nonferrous Metal Geological Exploration Bureau conducted five deep drillings in the southern region between 2015 and 2018 (Figure 9b). All drillings successfully intersected industrial-grade molybdenum ore bodies. By 2018, the estimated molybdenum resource was approximately 112 million tons, with about 149,358 tons of molybdenum metal at an average grade of 0.13% by the control block segment method (see Table 3 for details). To ensure reliability, the horizontal projection and block methods were applied and compared. The differences in ore and metal tonnages are reported in Table 4. The differences in percentage on the total ore content and Mo are 0.19% and −2.52%, respectively (see Table 3 and Table 4 for details).

6. Conclusions

(1)
New magnetic data further confirmed that the Dasuji molybdenum mineralization-related granitoids have surpassed the Curie temperature and experienced a magnetic weakening effect.
(2)
According to the CSAMT and drillings results, the molybdenum resources are estimated at about 112 million tons, with a molybdenum metal content of approximately 149,358 tons and an average grade of 0.13%.
(3)
Geophysical results identify that the porphyry molybdenum bodies tend to extend eastward and southward, respectively, playing an important role in deep molybdenum prospecting.

Author Contributions

Z.X. conceived and designed the research ideas; X.N. and B.S. investigated the research and provided geophysical data; H.H., W.F., G.G. and Z.Y. conducted data analysis; Y.W. and N.Y. edited the drafts and drew the figures. All authors have read and agreed to the published version of the manuscript.

Funding

The Open Project of Technology Innovation Center for Deep Gold Resources Exploration and Mining, Ministry of Natural Resources (No. LDKT-2023BZX-12), Central Guidance for Local Scientific and Technological Development Funds (No. 2023ZY0036), and Langfang Science and Technology Research Funded Project (No. 2023011103 and No. 2022013082).

Data Availability Statement

The geophysical data are confidential.

Acknowledgments

The authors would like to express their gratitude to The Open Project of Technology Innovation Center for Deep Gold Resources Exploration and Mining, Ministry of Natural Resources, for supporting this research. Furthermore, the authors would like to express their gratitude to the Inner Mongolia Nonferrous Metal Geological Exploration Bureau for providing the private data that were acquired and collected by them and for granting the publication of this information as an article.

Conflicts of Interest

The authors declare no conflicts of interest.

References

  1. Ju, N.; Zhang, D.; Zhang, G.B.; Zhang, S.; Ren, C.T.; Ren, Y.S.; Wang, H.; Wu, Y.; Liu, X.; Shi, L.; et al. Geology and mineralization of the Daheishan supergiant porphyry molybdenum deposit (1.65 Bt), Jilin, China: A review. China Geol. 2023, 6, 495–530. [Google Scholar] [CrossRef]
  2. Zhang, Y.Y.; Luo, T.Y.; Fan, Y.F.; Long, H.S.; Yang, Y.; Yan, Y.B.; Meng, F.Q. The initial magma–fluid evolution of the Laochang porphyry molybdenum deposit in Lancang, Yunnan, SW China: Insights from the in-situ analysis of mica and titanite. J. Asian Earth Sci. 2024, 265, 106106. [Google Scholar] [CrossRef]
  3. Wang, J.; Zhang, J.; Liu, Z.; Zhao, Y.; Zhang, F. Geochronological, Geochemical and Pb Isotope Inferences for Genesis of Wulandele Porphyry Molybdenum Deposit, Inner Mongolia, Northeast China. Minerals 2024, 14, 699. [Google Scholar] [CrossRef]
  4. Zhang, M.Y.; Wu, G.; Chen, G.Z.; Yang, Y.; Zhang, T.; Wu, X.G.; Xu, L.Q. Geochemistry and Hf–O–Pb isotopes of the Hongniangshan complex, Inner Mongolia, China: Constrains on petrogenesis and mineralization of the Quanzigou porphyry Mo deposit. Ore Geol. Rev. 2022, 148, 105001. [Google Scholar] [CrossRef]
  5. Xie, W.; Zeng, Q.D.; Huang, L.L.; Zhou, L.L.; Fan, H.R.; Wu, J.J.; Wang, R.L.; Zhu, H.P. Composition and evolution of ore-forming fluids in the Sansheng porphyry W-Mo deposit, Inner Mongolia, NE China: Evidence from LA-ICP-MS analysis of fluid inclusions. Ore Geol. Rev. 2023, 158, 105481. [Google Scholar] [CrossRef]
  6. Wu, H.Y.; Zhang, L.C.; Gao, J.; Zhang, M.; Zhu, M.T.; Xiang, P. U–Pb geochronology, isotope systematics, and geochemical characteristics of the Triassic Dasuji porphyry Mo deposit, Inner Mongolia, North China: Implications for tectonic evolution and constraints on the origin of orerelated granitoids. J. Asian Earth Sci. 2018, 165, 132–144. [Google Scholar] [CrossRef]
  7. An, Z.; Di, Q. Investigation of geological structures with a view to HLRW disposal, as revealed through 3D inversion of aeromagnetic and gravity data and the results of CSAMT 20 exploration. J. Appl. Geophys. 2016, 135, 204–211. [Google Scholar] [CrossRef]
  8. Guo, Z.W.; Xue, G.Q. Electromagnetic methods for mineral exploration in China: A review. Ore Geol. Rev. 2020, 118, 103357. [Google Scholar] [CrossRef]
  9. Wang, G.R.; Wu, G.; Xu, L.Q.; Li, X.Z.; Zhang, T.; Quan, Z.X.; Wu, H.; Li, T.G.; Liu, J.; Chen, Y.C. Molybdenite Re-Os age, H-O-C-S-Pb isotopes, and fluid inclusion study of the Caosiyao porphyry Mo deposit in Inner Mongolia, China. Ore Geol. Rev. 2017, 81, 728–744. [Google Scholar] [CrossRef]
  10. Wu, X.; Fang, G.Y.; Xue, G.Q.; Liu, L.H.; Liu, L.S.; Li, J.T. The development and applications of the helicopter-borne transient electromagnetic system CAS-HTEM. J. Environ. Eng. Geophys. 2019, 24, 653–663. [Google Scholar] [CrossRef]
  11. Wu, X.; Xue, G.Q.; He, Y.M.; Xue, J.J. Removal of the multi-source noise in airborne electromagnetic data based on deep learning. Geophysics 2020, 85, B193–B208. [Google Scholar] [CrossRef]
  12. Wu, X.; Xue, G.Q.; He, Y.M. The progress of the helicopter-borne transient electromagnetic method and technology in China. IEEE Access 2020, 8, 32757–32766. [Google Scholar] [CrossRef]
  13. Moorkamp, M.; Heincke, B.; Jegen, M.; Roberts, A.W.; Hobbs, R.W. A framework for 3D joint inversion of MT, gravity and seismic refraction data. Geophys. J. Int. 2011, 184, 477–493. [Google Scholar] [CrossRef]
  14. Wu, X.; Xue, G.Q.; Fang, G.Y. High-resolution inversion for Helicopter-borne TEM data for lead-zinc mineralised body detection. Boll. Geofis. Teor. Appl. 2019, 60, 629–644. [Google Scholar]
  15. Wu, X.; Xue, G.Q.; Fang, G.Y.; Li, X.; Ji, Y.J. The Development and Applications of the Semi-Airborne Electromagnetic System in China. IEEE Access 2019, 7, 104956–104966. [Google Scholar] [CrossRef]
  16. Wu, X.; Xue, G.Q.; Xiao, P.; Li, J.T.; Liu, L.H.; Fang, G.Y. The removal of the high-frequency motion-induced noise in helicopter-borne transient electromagnetic data based on wavelet neural network. Geophysics 2019, 84, K1–K9. [Google Scholar] [CrossRef]
  17. Ma, Z.J.; Di, Q.Y.; Liang, P.F.; Gao, Y.; Xue, G.Q. Analysis on equivalence effect of the grounded-wire transient electromagnetic method. J. Appl. Geophys. 2020, 181, 104142. [Google Scholar] [CrossRef]
  18. Xue, G.Q.; Qin, K.Z.; Li, X.; Li, G.M.; Qi, Z.P.; Zhou, N.N. Discovery of a large-scale porphyry molybdenum deposit in Tibet through a modified TEM exploration method. J. Environ. Eng. Geophys. 2012, 17, 19–25. [Google Scholar] [CrossRef]
  19. Di, Q.Y.; Lei, D.; Wang, Z.X.; Zhang, Y.M.; Wang, S.; Zhang, Q.M. Geophysical survey over molybdenum mines using the newly developed M-TEM system. J. Appl. Geophys. 2018, 158, 65–70. [Google Scholar] [CrossRef]
  20. Neawsuparp, K.; Charusiri, P.; Meyers, J. New Processing of Airborne Magnetic and Electromagnetic Data and Interpretation for Subsurface Structures in the Loei Area, Northeastern Thailand. Sci. Asia 2005, 31, 283–298. [Google Scholar] [CrossRef]
  21. Di, Q.Y.; Xue, G.Q.; Yin, C.C.; Li, X. New methods of controlled-source electromagnetic detection in China. Sci. China Earth Sci. 2020, 63, 1268–1277. [Google Scholar] [CrossRef]
  22. Wu, G.; Li, X.Z.; Xu, L.Q.; Wang, G.R.; Liu, J.; Zhang, T.; Quan, Z.X.; Wu, H.; Li, T.G.; Zeng, Q.T.; et al. Age, geochemistry, and Sr-Nd-Hf-Pb isotopes of the Caosiyao porphyry Mo deposit in Inner Mongolia, China. Ore Geol. Rev. 2017, 81, 706–727. [Google Scholar] [CrossRef]
  23. Sun, Y.; Liu, J.M.; Zeng, Q.D.; Chu, X.S.; Zhou, L.L.; Wu, G.B.; Gao, Y.Y.; Shen, W.J. Geological characteristics and molybdenite Re-Os ages of the Baituyingzi Mo-Cu field, astern Inner Mongolia and their geological implications. Acta Petrol. Sin. 2013, 29, 241–254, (In Chinese with English Abstract). [Google Scholar]
  24. Shen, P.; Sun, J.G.; Qin, K.Z.; Campos, E. Large-scale porphyry-type mineralization in the Central Asian metallogenic domain: A review. J. Asian Earth Sci. 2018, 165, 7–36. [Google Scholar]
  25. Zhang, P.; Chouteau, M. The use of magnetotellurics for mineral exploration: An experiment in the Chibougamau region of Quebec. Can. J. Earth Sci. 1992, 29, 621–635. [Google Scholar] [CrossRef]
  26. Cun, L.S.; Mei, Z.; Wen, G.C.; Wei, Y.G.; Wen, C.Z. New progresses in exploration of molybdenum deposits and analysis of mineralization prospect in inner mongolia. Geol. Explor. 2010, 46, 561–575. [Google Scholar]
  27. Maurya, V.P.; Singh, R.K.; Bhattacharya, B.B. Magnetotelluric exploration of a deposit scale prospecting over a proterozoic volcanics, Eastern India. J. Appl. Geophys. 2018, 159, 666–677. [Google Scholar] [CrossRef]
  28. Jiang, W.; Duan, J.; Doublier, M. Application of multiscale magnetotelluric data to mineral exploration: An example from the east Tennant region, Northern Australia. Geophys. J. Int. 2022, 229, 1628–1645. [Google Scholar] [CrossRef]
  29. Chappell, B.W.; White, A.J.R. Two contrasting granite types: 25 years later. Aust. J. Earth Sci. 2001, 48, 489–499. [Google Scholar] [CrossRef]
  30. Chappell, B.W.; Bryant, C.J.; Wyborn, D. Peraluminous I-type granites. Lithos 2012, 153, 142–153. [Google Scholar] [CrossRef]
  31. Regelous, A.; Scharfenberg, L.; De Wall, H. Origin of S-, A-and I-type granites: Petrogenetic evidence from whole rock Th/U ratio variations. Minerals 2021, 11, 672. [Google Scholar] [CrossRef]
  32. Chappell, B.W.; White, A.J.R. I-and S-type granites in the Lachlan Fold Belt. Earth Environ. Sci. Trans. R. Soc. Edinb. 1992, 83, 1–26. [Google Scholar]
  33. Hagemann, S.; Dalstra, H.I.; Hodkiewicz, P. Recent advances in BIF-related iron ore models and exploration strategies. Proc. Explor. 2007, 7, 811–821. [Google Scholar]
  34. Chen, Y.J.; Li, C.; Zhang, J.; Li, Z.; Wang, H.H. Sr and O isotopic characteristics of porphyries in the Qinling molybdenum deposit belt and their implication to genetic mechanism and type. Sci. China Ser. D Earth Sci. 2000, 43, 82–94, (In Chinese with English Abstract). [Google Scholar] [CrossRef]
  35. Xu, Z.H.; Xin, W.; Zhou, X.D.; Li, F.W.; Song, Z.J. Triassic granitoids in the East Kunlun Orogenic Belt, Northwestern China: Magmatic source and implications for geodynamic evolution. Int. Geol. Rev. 2023, 65, 983–999. [Google Scholar] [CrossRef]
  36. Xia, D.; Fu, R.; Wang, Y.; Li, B.S.; Ma, J.G.; Xu, H.Y.; Shen, A.D.; Liu, Y.C. Ferromagnetism with above-room-temperature Curie temperature in Fe-doped β-Ga2O3 studied by first-principles calculations. J. Magn. Magn. Mater. 2024, 598, 172033. [Google Scholar] [CrossRef]
  37. Airo, M.L.; Mertanen, S. Magnetic signatures related to orogenic gold mineralization, Central Lapland Greenstone Belt, Finland. J. Appl. Geophys. 2008, 64, 14–24. [Google Scholar] [CrossRef]
  38. Fraser, G.L.; Skirrow, R.G.; Schmidt-Mumm, A.; Holm, O. Mesoproterozoic gold in the central Gawler craton, South Australia: Geology, alteration, fluids, and timing. Econ. Geol. 2007, 102, 1511–1539. [Google Scholar] [CrossRef]
  39. Clark, D.A. Magnetic effects of hydrothermal alteration in porphyry copper and iron-oxide copper–gold systems: A review. Tectonophysics 2014, 624, 46–65. [Google Scholar] [CrossRef]
  40. Xue, Q.; Wang, R.; Liu, S.; Shi, W.; Tong, X.; Li, Y.; Sun, F. Significance of chlorite hyperspectral and geochemical characteristics in exploration: A case study of the giant Qulong porphyry Cu-Mo deposit in collisional orogen, Southern Tibet. Ore Geol. Rev. 2021, 134, 104156. [Google Scholar] [CrossRef]
Figure 1. Schematic tectonic map of Inner Mongolia and locations of the typical porphyry deposits (modified after [24]).
Minerals 15 00166 g001
Figure 2. Geological and structural map of the Dasuji porphyry molybdenum deposit. (a) Schematic diagram of the North China Craton; (b) regional geological map of the Dasuji porphyry molybdenum deposit. 1. Quaternary deposits; 2. Neogene basalt; 3. Paleogene sediments; 4. Cretaceous volcanic rocks; 5. Cretaceous clastic rocks; 6. Jurassic volcanic rocks; 7. Jurassic clastic rocks; 8. Permian clastic rocks; 9. Neoarchaean Sertengshan group metamorphic rocks; 10. Mesoarchean ural mountain group metamorphic rocks; 11.Mesoarchean Jining group metamorphic rocks; 12. Paleoarchean Xinghe group metamorphic rocks; 13. Mesozoic granite; 14. Paleozoic granite; 15. Paleozoic diorite; 16. Neoproterozoic granite; 17. Mesoarchean metamorphic intrusive rocks; 18. faults; 19. Molybdenum deposit; 20. gold deposit; 21. lead zinc silver deposit; 22. major faults.
Minerals 15 00166 g002
Figure 3. Geologic map of the Dasuji porphyry molybdenum deposit. 1. Quaternary sediments; 2. Jining Group; 3 Mesoarchean granite; 4. Triassic granite porphyry; 5. Triassic quartz porphyry; 6. Jurassic granite porphyry; 7. diabase; 8. diorite; 9. CSAMT profile; 10. aeromagnetic zone.
Minerals 15 00166 g003
Figure 4. Photographs of magmatic hand specimens closely related to Dasuji porphyry molybdenum mineralization. (a) quartz porphyry; (b) granite porphyry; (c) alkaline granite.
Minerals 15 00166 g004
Figure 5. Magnetic data measuring instrument. (a) MAG-DN20G4 unmanned aerial vehicle aeromagnetic system; (b) airborne navigation and positioning system; (c) flux gate magnetometer; (d) GSM-19T type proton magnetometer; (e) field geomagnetism observation mooring system; 1. magnetometer host; 2. serial data cable; 3. USB cable; 4. lithium battery; 5. battery charger; 6. attachment package.
Minerals 15 00166 g005
Figure 6. Work principle sketch maps of the CSAMT method; Tx = transmitter; Rx = receiver; Ex = electric field; Hy = magnetic field; A and B represent the transmitter electrodes.
Minerals 15 00166 g006
Figure 7. Comprehensive magnetic anomaly map of the Dasuji molybdenum deposit; (a) magnetic anomaly; (b) Za (A) anomaly; (c) Hax (T) anomaly; (d) Hay (H) anomaly; (e) upward extension by 50 m; (f) upward extension by 100 m; (g) upward extension by 200 m; (h) upward extension by 300 m; (i) vertical first derivative of the results with upward extension by 50 m; (j) vertical first derivative of Figure 7e; (k) vertical first derivative of Figure 7f; (l) vertical first derivative of Figure 7k; (l) observed data with magnetic flight route superposed; 1. observed data (red represents positive values and blue represents negative values); 2. aeromagnetic flight route.
Minerals 15 00166 g007
Figure 8. Comprehensive anomaly map of CSAMT. (a) Inversion resistivity model of CSAMT; (b) pseudosection map of Cagniard resistivity; (c) pseudosection map of impedance phase; 1. abnormal resistivity (the infrermolybdenum ore body); 2. drillings.
Minerals 15 00166 g008
Figure 9. Deep mineral exploration in the Dasuji molybdenum deposit; (a) CSAMT resistivity model; (b) geological interpretation; 1. Mesoarchean granite; 2. Triassic granite porphyry; 3. Triassic quartz porphyry; 4. Jurassic granite porphyry; 5. diabase; 6. current terrain; 7. Mo ore bodies; 8. drillings; 9. CSAMT observed area.
Minerals 15 00166 g009
Table 1. Petrophysical parameters of core samples in No. zk 101, Dasuji molybdenum deposit.
LithologyDrilling DepthLengthAreaIUρK
(m)(mm)(mm2)(μA)(mV)(Ω·m)(10−5 SI)
Quartz porphyry4.501223.742012,517.571238.207.54
Quartz porphyry5.001823.741612,567.671035.968.80
Quartz porphyry7.651323.741712,552.341348.385.03
Quartz porphyry7.851523.741312,615.831535.9015.08
Quartz porphyry8.451623.741812,538.541033.566.28
Quartz porphyry8.651523.74912,675.162228.9510.05
Quartz porphyry9.051523.741212,621.081664.5818.85
Quartz porphyry10.45923.741912,521.621738.3811.31
Ore-bearing quartz porphyry12.551623.742412,481.51771.642.51
Ore-bearing granite porphyry39.701423.743812,362.76551.6832.67
Alkaline granite43.551723.74712,776.352548.8316.34
Alkaline granite45.801023.741912,523.011564.7240.21
Alkaline granite121.351023.741412,586.202134.2618.85
Alkaline granite122.151423.741312,584.461641.5121.36
Alkaline granite122.301123.741612,599.471699.5030.16
Plagioclase granite230.301823.742612,445.88631.34541.59
Plagioclase granite231.102023.746812,170.51212.45625.79
Plagioclase granite231.352023.741912,520.37782.19412.16
Table 2. Key survey parameters for the aeromagnetic and CSAMT methods.
MethodKey ParameterCompanyMeasurement RangeMeasurement PointsSpatial Resolution
AeromagnetismTotal magnetic fieldDanian, China10 km2222,8110.1 m × 50 m
CSAMTApparent resistivityPhoenix, Canada1000 m2050 m
Table 3. Block method estimates of Mo resource in No.1 ore bodies.
Ore TypeElevation (m)Resource Reserve Type (code)Control Block Segment Volume (m3)Density
(t/m3)
Ore Content
(kiloton)
Mo (ton)Average
Degree (%)
Oxidized ore1470–1346−3311120,6232.57288027260.10
−332762,1102.56195116160.08
−333628,5162.56160914030.09
All2511,249 644057450.09
Sulfide ore1345–1056(122b)14,832,5582.5838,26850,6790.13
−33312,907,7512.5833,30244,2680.13
All41,186,4342.58106,261143,6130.14
Total1470–1056(122b)14,832,5582.5838,26850,6790.13
−3311120,6232.57288027260.10
−332762,1092.56195116160.08
−3331353,1402.5834,91145,6710.13
Total 43,682,5582.58112,701149,3580.13
Table 4. Mo resource estimates verified by the horizontal projection method.
Block NumberBlock MethodHorizontal Projection MethodEstimated Difference
Ore Content (Kt)Mo (ton)Ore Content (Kt)Mo (ton)Ore Content (Kt)Mo (ton)
122b-7967.201508.861022.301686.71−55.10−177.85
122b-81347.102357.551672.403093.92−325.30−736.37
121b-11694.002608.761628.902557.3965.1051.37
121b-22100.203045.321980.602911.48119.60133.84
121b-32328.903283.862295.303305.2933.60−21.43
121b-42645.103491.652720.303617.96−75.20−126.31
121b-53348.803817.733325.503890.7923.30−73.06
121b-61388.602180.171382.702212.325.90−32.15
121b-71446.202097.021495.702228.59−49.50−131.57
121b-81706.702508.881702.202570.354.50−61.47
121b-92029.302678.751889.002512.36140.30166.39
121b-101379.201668.841224.201469.00155199.84
Total22,381.3031,247.3922,339.0032,056.1642.30−808.77
Difference 0.19%−2.52%
Disclaimer/Publisher’s Note: The statements, opinions and data contained in all publications are solely those of the individual author(s) and contributor(s) and not of MDPI and/or the editor(s). MDPI and/or the editor(s) disclaim responsibility for any injury to people or property resulting from any ideas, methods, instructions or products referred to in the content.

