Abstract
Laser ablation combined with inductively coupled plasma mass spectrometry for the analysis of trace elements in specially prepared glass beads is adapted to silicate rocks of unusual compositions. The modified technique is applied to standard samples and garnet-rich combustion metamorphic rocks (paralavas) from the Hatrurim Formation, Israel. Thirty-two to thirty-five minor and trace elements, including high field strength elements, rare earth elements and Y, are determined in 5–8 mg powder aliquots of samples with large ranges of major-, minor-, and trace-element contents. As the first step of the study, the composition of the NIST SRM 612, BCR-2, and AGV-2 reference materials is analyzed to assess the accuracy and precision of analytical data. The results for standard samples agree well with the compiled estimates (3.5 to 12.4% relative standard deviation) for all elements except Cu (18.1%). The following step is to analyze, with the same procedure, the glass beads of paralava, which are remarkable due to their high trace-element loading. Good agreement (70%–100%) with the compositions determined previously by aqueous nebulizer mode ICP-MS confirms that the method is a promising tool for the rapid and precise analysis of compositionally complex materials available in small amounts.
1. Introduction
The fast and precise analysis of specially prepared glass beads by laser ablation combined with inductively coupled plasma mass spectrometry (LA-ICP-MS) has been increasingly applied in two recent decades for the determination of trace elements, including rare earth elements (REEs), in silicate igneous and/or metamorphic rocks, with important petrogenetic implications [1,2,3,4,5,6]. The LA-ICP-MS technique for solid source whole rock analysis was successfully tested by the use of glasses prepared from international whole rock standard powders (reference materials), providing a large range of compositions. The use of various glass reference materials (e.g., NIST) as external standards has been acknowledged to ensure high data quality for a wide range of unknowns [4,7].
The sampling medium of glass beads for X-ray fluorescence analysis (XRF) is advantageous over the conventional samples due to natural homogeneity and convenience in measuring and comparing the ablation quantities and effects. The technique does not involve chemical dissolution and thus avoids potential solution-instability problems known for aqueous nebulizer mode ICP-MS, especially with respect to such elements of geological interest as high field strength elements (HFSEs), namely Zr, Nb, Hf, or Ta. In addition, homogeneous glass beads can serve as monitor reference standards for unusual or unknown rocks or other materials. XRF glass beads obtained by the conventional lithium tetraborate and lithium metaborate fusion of rock powders bear a wide range of trace elements at the 1 to 1000 ppm levels, at 5 to 10 sample dilution rates, but they usually can be used for aliquots no smaller than 1 g. Meanwhile, some materials, which have unusual and (or) unknown compositions, such as planetary ground, meteorites, space dust and other atmospheric fallout, most often exist in limited amounts (much less than 200 mg). These valuable materials of limited availability may be needed for some further uses or for replica analysis, and thus it may be necessary to preserve a part of such samples as prefabricated preparations (e.g., glass beads). Therefore, analytical techniques and sample preparation procedures specially designed for such materials are required. In particular, the glass-bead technique was developed to assay precious silicic samples for geochemical and archaeological analyses [8,9]. Nakayama and coauthors [8] successfully applied X-ray fluorescence spectrometry to determine chemical composition of precious archaeological materials (ancient pottery) using very small amounts (11 mg) of powdered samples and demonstrated reliable analytical results with good precision. Some time later, a low-dilution glass-bead technique was adopted for the X-ray fluorescence determination of 34 components (Na2O, MgO, Al2O3, SiO2, P2O5, K2O, CaO, TiO2, MnO, Fe2O3, V, Cr, Co, Ni, Cu, Zn, Rb, Sr, Y, Zr, Nb, Cs, Ba, La, Pr, Nd, Sm, Gd, Dy, Er, Yb, Hf, W, and Pb) in 200 mg aliquots of silicic rock samples [9].
We describe an LA-ICP-MS technique of trace-element determination in glass beads adapted to the analysis of compositionally particular silicate rocks that are available in small amounts. It is a modified method of [4] consisting in the LA-ICP-MS analysis of trace elements in powder rock samples fused into glass beads.
The objectives of this study have been (i) adapting the existing LA-ICP-MS techniques for the analysis of REE, HFSE, chalcophile and other trace elements of geological interest, with low detection limits, available in <10–20 mg aliquots; (ii) estimating the parameters of the trace-element determination in glass beads of standard reference materials and natural rock samples; and (iii) constraining the minimum amount of material required for the appropriate precision and reproducibility of analyses. The modified LA-ICP-MS analysis is applied to glass beads of standard reference materials and then to those of natural combustion metamorphic rocks (paralavas) with high trace-element loading from the Hatrurim Formation (Negev Desert, Israel).
2. Non-Magmatic Melt Rocks: General Characteristics
The Hatrurim Basin, the largest combustion metamorphic (CM) complex of the Hatrurim Formation, hosts sporadic fine- to coarse-grained veins of garnet-rich paralava, which is non-magmatic melt rock derived from metasedimentary protoliths molten at ultra-high temperatures (up to 1200 °C) and at ambient pressure. Garnet-rich CM rocks were sampled from a locality in the south-western flank of the Gurim anticline described in a number of previous publications [10,11,12,13,14]. The Gurim paralava samples are remarkable in their Ca-rich and silica-poor compositions with unusually high trace-element loading. Their quick crystallization is supported by the homogenization temperatures of melt inclusions in rock-forming silicates within a narrow range of 1190–1050 °C [11,12,15]. Mineralogical and geochemical features and crystallization process of similar paralavas from other Hatrurim Formation localities were considered earlier [14,15,16].
The garnet-rich paralavas from the Gurim locality occur as 1–3 cm (rarely up to 5–10 cm) thick compact veins in fine- to medium-grained melilite-rich hornfels. The veins penetrate no more than 2–3 cm into the host rocks and have sharp boundaries standing out distinctly against the eroded hornfels surface (Figure 1). The paralava samples share compositional similarity and contain 39.9–41.4 wt% CaO, 33.1–36.1 wt% SiO2, 7–10 wt% Al2O3 and Fe2O3, 1.4 to 2.0 wt% TiO2, 0.4–1.3 wt% K2O, low MgO and Na2O of 0.5–0.7 and 0.3–0.4 wt%, respectively, and 1.6–1.9 wt% P2O5 (Table 1). The Gurim paralavas are only slightly affected by hydration and carbonatization and have loss on ignition (LOI) from 2.2 to 5.0 wt%. These features are favorable for fusion and provide high reproducibility of the LA-ICP-MS data. The samples differ in water and CO2 contents which vary depending on the degree of retrograde alteration (Table 1).
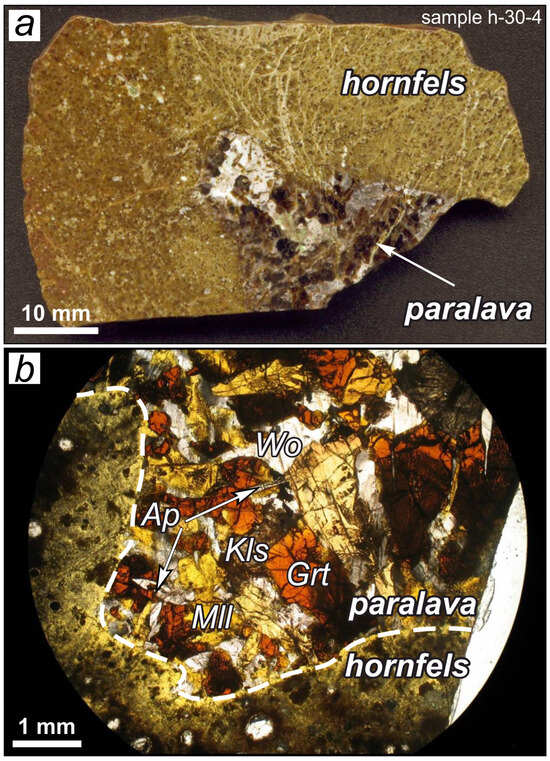
Figure 1.
Appearance and characteristic textures of Ca-rich paralava samples (Hatrurim Formation, Gurim anticline). (a) Typical sample: garnet paralava in melilite hornfels. (b) Mineral assemblages of paralava: Ti-rich garnet + melilite + wollastonite + kalsilite + apatite (optical image in polarized transmitted light). Mineral abbreviations, in text and figures, are according to [17]: Ap = apatite; Grt = garnet; Kls = kalsilite; Mll = melilite; Wo = wollastonite.

Table 1.
Major-element contents (in wt%) of Ca-rich combustion metamorphic rocks—paralavas (Hatrurim Formation, Gurim anticline).
The veins mainly consists of rock-forming (>10 vol%) rankinite, melilite solid solutions, wollastonite, and pseudowollastonite (- and -Ca3Si3O9 modifications); Ti-rich andradite (up to 14 wt% of TiO2), cuspidine, and Fe-rich kalsilite are minor minerals (3–10 vol%). The low-viscosity parent melts, with very high CaO enrichment and low contents of both SiO2 and Al2O3, behave like slag and crystallize rapidly, without quenching, upon fast cooling.
The analyzed paralava samples contain V-bearing fluorapatite (solid solution of fluorapatite–fluorellestadite series) as a common accessory phase (<3 vol%) and sporadic other accessories (Fe-Ni spinel and Fe-Cu-Ni sulfides). They also host micrometer-sized spots of high and extremely high Ba, V, and U enrichment, where these elements often form micro-grains of separate phases [14]. They are, specifically, ubiquitous minerals of zadovite–aradite series (BaCa6((SiO4)(PO4))(PO4)2F—BaCa6((SiO4)(VO4))(VO4)2F) and gurimite (Ba3(VO4)2) enclosed in fluorapatite. Unlike these, barite–hashemite solid solution (BaSO4-BaCrO4) makes a secondary phase filling thin cracks. Secondary mineralization is present in minor amounts as Ca silicate hydrates (CSHs), zeolite, and gypsum.
The host hornfels is mainly composed of melilite, rankinite, and wollastonite, with sporadic flamite and larnite (’- and -Ca2SiO4 modifications) and much lower contents of Ti-rich garnet and apatite but is free from kalsilite (Figure 2).
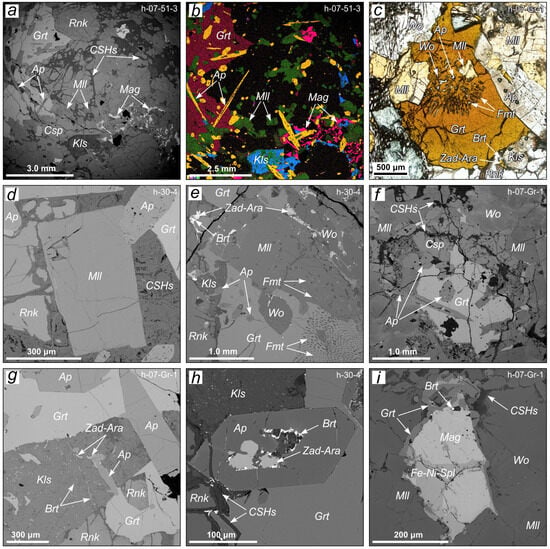
Figure 2.
Morphologic features and distribution of rock-forming and accessory minerals in Ca-rich paralava samples (Hatrurim Formation, Gurim anticline). (a,b,e) Main, minor, and accessory phases in typical coarse-grained garnet paralava. (c,f) Numerous aligned intergrowths of flamite (c) in association with wollastonite, melilite, apatite, cuspidine, and kalsilite and single inclusions of apatite (f) in large crystals of Ti-andradite. (d) Melilite in association with rankinite, partly replaced by Ca silicate hydrates, as well as with apatite containing K-Fe-Ni-Cu sulfide microinclusions. (g) Aligned kalsilite grain intergrown with baryte (exsolution structure?). (h) Hopper crystal of fluorapatite with mineral inclusions of zadovite–aradite solid solution series and later baryte. (i) Aggregate of magnetite and Fe-Ni-rich spinel. (a,d–i) BSE-images. (b) X-ray elemental map, with color coding of orange for P, pink for Fe, blue for K, and green for Al. (c) Optical image in polarized transmitted light. Mineral abbreviations, in text and figures, are according to [17]: Ara = aradite; Ap = apatite; Brt = baryte; CSHs = Ca silicate hydrates; Csp = cuspidine; Fmt = flamite; Grt = garnet; Kls = kalsilite; Mag = magnetite; Mll = melilite; Rnk = rankinite; Spl = spinel; Wo = wollastonite; Zad = zadovite.
The high-to-ultrahigh temperature CM rocks of the Hatrurim Formation appear to be derived from Late Cretaceous to Early Tertiary bioproductive shelf marine sediments with different relative percentages of carbonate, pelite, phosphate, and organic matter components. Two latter constituents are responsible for the notable enrichment in phosphorous and redox sensitive elements (Zn, Cr, Mo, Ni, U, and V) [13,15,18,19,20,21,22,23].
3. Experimental
3.1. Samples and Sample Preparation
Glass beads were fabricated from 5–8 mg aliquots of the United Standard Geological Survey BCR-2 (basalt) and AGV-2 (andesite) standard samples. The preparation procedure consisted in the fusion of powdered samples together with lithium metaborate/tetraborate flux, at a dilution rate of 5 flux to 1 rock (Table 2). The crucibles used for fusion were made as pellets of pure graphite (99.999 wt% C), with inverted cone pits on the surface. The flux and rock samples were weighed, mixed carefully, placed into the conical pits, and fused for 5–6 min in a muffle furnace preheated to 1000 °C. Thus obtained glass beads were cooled in air, recovered from the crucibles, and mounted in epoxy for LA-ICP-MS (Figure 3).
Table 2.
Composition summary of NIST SRM 612, BCR-2, AGV-2, and preparation media (in ppm).
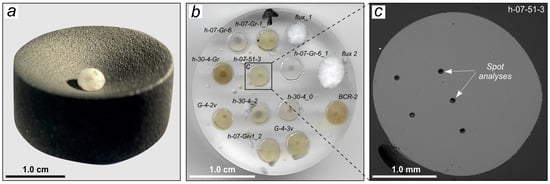
Figure 3.
Samples and sample preparation. (a) Graphite crucible (99.999 wt% C) used for sample preparation. (b) Epoxy-mounted glass beads of standard and natural paralava samples. (c) BSE-image of a representative glass bead (sample h-07-51-3) illustrating chemical homogeneity of the sample prepared for LA-ICP-MS analysis.
At the next step, glass beads of natural paralava samples (5 to 8 mg aliquots) were prepared in the same way. Before the LA-ICP-MS measurements, each bead was analyzed by SEM-EDS which revealed their chemical homogeneity and the absence of any inclusions or vesicles (Figure 3). The LA-ICP-MS data quality for paralava beads was checked against several reference materials: glasses NIST SRM 610, NIST SRM 612, as well as BCR-2 and AGV-2 prepared as reference glass beads [24,25]. The work began with an LA-ICP-MS analysis of NIST SRM 612 glass reference material as unknowns, using NIST SRM 610 as a standard for calibration and Al as an internal standard. The contents of thirty-five elements in NIST SRM 612 were determined at 10% variance relative to the recommended values, at a relative standard deviation (RSD) between 5% and 11% (Table 2).
Paralava was sampled from veins (each sample from a separate vein) in hornfels avoiding contamination with contact zone material. The weight of the samples was within 20–30 g, except for 300 g sample h-07-51-3 from a 15 × 10 × 8 cm coarse-grained vein bulge. Hand samples were wrapped in plastic bags and reduced to smaller chunks with a hammer wrapped in tape.
Fresh pieces of the rock free of weathered rims or veinlets were hand-picked and wrapped again up to 2–3 mm fraction. About half of each sample was crushed in a jaw breaker to <2 mm and homogenized. Then, 10 g aliquots of quartered samples were ground in a ceramic mill to 0.07 mm size powder. The mill cup was cleaned carefully, rinsed, and dried before processing each following sample, and a small quantity of pure quartz sand was ground for 2 min to remove any trace of rock material smeared onto the walls. At the next step, the samples were quartered again, and a part of the powder was further pulverized in agate mortar and homogenized. The mortar was also cleaned carefully from the material of each previous sample.
The compositions of paralava samples were previously determined independently by the use of aqueous nebulizer mode ICP-MS for trace elements and XRF for major elements. The beads for LA-ICP-MS analysis of trace elements in whole-rock powders were made of the same powdered samples, with their composition likewise analyzed by aqueous nebulizer mode ICP-MS and XRF analysis for major elements.
3.2. Methods
The garnet-rich paralava samples were studied by optical thin-section petrography, with scanning electron microscopy (SEM) for additional details, and/or X-ray powder diffraction for the quantification of main constituents, at the V.S. Sobolev Institute of Geology and Mineralogy (IGM, Novosibirsk, Russia). The identification of minerals and assessment of phase distribution patterns were performed on a TESCAN MIRA-3 LMU scanning electron microscope (TESCAN ORSAY Holding) equipped with an AZtec Energy Xmax-50+ microanalyses system. The images were acquired in both SE and BSE modes.
Major-element abundances of whole rock samples were determined by X-ray fluorescence analysis (XRF) by use of an ARL-9900XP spectrometer (Thermo Fisher Scientific Ltd., Waltham, MA, USA), following the method described by [26]. All samples were calcined in a muffle furnace at a temperature 960 °C for 2.5 h. Aliquots (0.5 g) were carefully mixed with 4.5 g of ultrapure flux Claisse, Canada (Table 2) in 95%Pt-5%Au crucible. The dilution factor was 9. The mixture was fused in automatic electric multi-position furnace Lifumat 2.0 Ox (Linn High Therm Gmbh, Germany) at 1100 °C for 15 min. The melt was automatically poured from the crucible to 40 mm diameter Pt mold.
Trace elements, including REE, were determined by aqueous nebulizer mode inductively coupled plasma mass spectrometry (ICP-MS) on a high-resolution Finnigan Mat ELEMENT (Germany) ICP mass spectrometer as in [27]. Trace elements in glass beads were analyzed by LA-ICP-MS (laser ablation inductively coupled plasma mass spectrometry). In situ trace-element measurements were performed on a Thermo Scientific iCAP Qc quadrupole ICP-MS analyzer coupled with an ESL New Wave Research 213 laser ablation system, with ablation in a New Wave Large Format Cell, under a He atmosphere. All measurements were carried out at the IGM Analytical Center (Novosibirsk).
Data were acquired in a peak-jumping mode with one point per peak at 10 ms dwell time. The main instrumental parameters were 1500 W RF power and flow rates of 14 L/min−1 for plasma, 0.8 L/min−1 for auxiliary gas, 0.6 L/min−1 for samples (Ar), and 0.7 L/min−1 for carrier gas (He). The mass spectrometer was tuned to produce the most stable signals at low oxide formation (CeO+/Ce+ < 1.5%). Each measurement consisted of 30 s background followed by 60 s of signal collection. The washout time between spots was 30 s. Spot analyses were performed by use of a 50 µm crater diameter (crater depths similar to spot size) at 10 Hz and energy densities of about 5–9 J/cm−2 (determined at the sample surface); laser energy was uniform within a run. Certified glass reference material NIST SRM 612 was used as an external standard. During the analytical sessions, instrumental drift correction was monitored by replica measurements of BCR-2 and AGV-2 glass beads. The accuracy for BCR-2 was better than 10% over the course of the study, for all elements except Cu.
The high quality of LA-ICP-MS data for solid samples can be achieved by the use of calibration standards with an identical matrix and by normalizing each measurement to element concentrations in an internal standard, determined independently for each sample. This procedure is indispensable to correct data for possible discrepancy between the analyzed and calibration samples associated with the generation and transport of aerosol, atomization and ionization of material in the plasma, depending on the properties of the analyzed samples and laser excitation parameters [2,28,29,30]. The results of this study were corrected using the response and known concentration of Al as an internal standard for all elements of interest in each natural rock sample (Table 1), as well as the published Al values of the standard samples [24,25]. Al was chosen as an internal standard because it exhibits more uniform ablation efficiency for all types of glasses compared with other elements, in a large range of silicate rocks [7].
4. Results and Discussion
The obtained analytical results for the trace-element composition of glass beads made from reference materials and natural paralava samples are presented in Table 2, Table 3 and Table 4 as average concentration, standard deviation (SD), and relative standard deviation (RSD, %) values. The glass beads of rock reference materials BCR-2 and AGV-2, as well as NIST SRM 612 glass reference material, were sampled as unknowns at six widely spaced points with intervening points on the NIST SRM 610 glass used as an external standard. In the considered cases, the detection limits of trace elements hardly could be better than the respective concentrations in flux glass beads measured by LA-ICP-MS (Table 2).
Table 3.
Average ppm abundances of trace elements in paralava samples from LA-ICP-MS and ICP-MS data, compared.
Table 4.
Average ppm abundances of trace elements in paralava sample h-07-Gr-1 determined by LA-ICP-MS for different test portion masses (glass beads).
In standard rock samples, the abundances of trace elements were mostly reproducible to <12%, except for some elements (12.35% and 18.06%, respectively, for Cr and Cu in BCR-2; 14.15% for Cu in AGV-2). In general, the reproducibility performed in this study was within 10% for REE present in concentrations from 0.20 to 10.0 ppm. The RSD values were the highest for Gd and Tm in AGV-2 standard sample (10.86% and 10.26%, respectively, at concentrations from 0.18 to 3.66 ppm) and better than 7.9% for Y and La to Nd in both standard rock samples.
Many elements of geological interest (Co, Sr, Y, Ba, REE, Zr, Nb, Hf, Ta, Th, and U) had detection limits from 0.02 to 0.38 ppm (except Sr and Ba reaching 1.05 and 2.44 ppm, respectively, in flux), mainly depending on the flux purity (Table 2). The best agreement with the compiled data for the reference samples and the lowest RSD were achieved for most of the elements in BCR-2.
At the next step of the analytical work, the glass beads of paralava samples were analyzed by LA-ICP-MS as unknowns, after preliminary nebulizer mode ICP-MS analysis. These samples are remarkable due to an unusual set of minor and trace elements which are present in high concentrations and often reside in one or two rock-forming, or, less often, accessory, minerals. It was necessary to estimate the accuracy of trace-element determinations in small aliquots of the rocks with such peculiarities.
Concentrations of thirty-two minor and trace elements and Al in the paralava samples (analyzed by the LA-ICP-MS and solution ICP-MS techniques) are compared in Table 3. Out of these, twenty-five elements provide consistent correspondence with the nebulizer mode ICP-MS data (70%–100%). The plot (Figure 4) illustrates the fit between the LA-ICP-MS and nebulizer mode ICP-MS data for all natural samples, in a large range of element concentrations, from <1.00 ppm to 2000–4000 ppm, with the Pearson correlation coefficients (R2) at least 0.98, in all cases. The REE abundances determined by different methods, compared in the form of PAAS-normalized spectra (Figure 5), are very similar, even though most MREE and HREE have low concentrations.
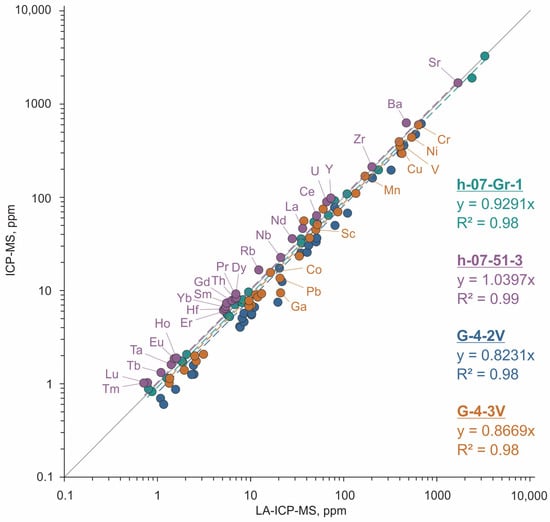
Figure 4.
ICP-MS and LA-ICP-MS data for paralava samples, compared.
The lowest average RSD values were obtained for paralava samples G-4-3V and G-4-2V, which are characterized by the smallest and randomly distributed grains of different minerals. The analytical error (RSD) among five widely spaced points for each glass bead was generally between 1.2% and 6.2% and never worse than 10%. The error was higher for Co, Cu, and Eu in G-4-2V (7.3%, 7.2% and 8.1%, respectively) and for Cu and Eu, Gd, Ho, Er in G-4-3V (9.4% and 6.5%–7.0%, respectively).
However, some minor and trace elements in coarse-grained paralava samples h-07-Gr-1 and h-07-51-3, with 2–3 mm grains of Ti-rich andradite (19 wt% and 8 wt% in the whole-rock compositions, respectively), were determined to a larger uncertainty. The estimates for Mn, Ce, Y, Hf, Ta and some REE (Tb, Er, Tm) in paralava h-07-Gr-1 were less precise: the error reached 8.3%–15.9% and was even as high as 30.8% for Cu (Table 3). Measurements of three glass beads made from different aliquots of one bulk h-07-Gr-1 sample show the same variations (Table 4). In sample h-07-51-3, the RSD value also was the highest for Cu (15.7%) and relatively high for Sm, Tb, U (7.4%–13.4%), and Rb (11.9%).
In the Gurim paralavas garnet, there is an important carrier of REE, Hf, and Ta. Namely, this mineral from sample h-07-Gr-1, with its average composition of Ca3.0(Fe3+1.2Ti0.7Cr0.04 Fe2+)2.0(Si2.8Fe3+0.5Al0.3)3.0O12.0 (n = 70), contains 330 ppm REE, 24.0 ppm Hf, and 8.60 ppm Ta on average [31]. The respective incorporation ratios (KElement = ElementGarnet/ElementRock) increase from LREE to HREE (1.2–2.7 in LREE, 2.8–3.7 in MREE, and 3.7–4.7 in HREE) and reach 3.8 and 6.8 for Hf and Ta, respectively.
The discrepancy between the nebulizer mode ICP-MS and LA-ICP-MS data has several possible explanations in this case. After gridding, multi-phase materials commonly display the heterogeneous distribution of particles, which differ in composition and size. This type of heterogeneity is recognized as a fundamental structural characteristic of complex compounds [32]. This phenomenon and the associated analytical uncertainty cannot be entirely eliminated [33]. It is reasonable to assume that the powdered rock samples under study have minor heterogeneity because soft wollastonite, with perfect cleavage, coexists with the harder and heavier garnet, which is the main depot of Mn, REE, Y, Zr, Hf, Ta, and Nb. Consequently, the powdered samples likely contain micrometer-sized garnet fragments that may be unevenly distributed across different splits. To put it differently, higher relative errors for garnet-rich coarse-grained paralava samples are not necessarily due to low analytical precision but rather are an expected consequence of the nugget effects [34].

Figure 5.
REE and Y patterns in different paralava samples (a–d) normalized to the Post-Archean Australian Shale (PAAS) composition after [35], from LA-ICP-MS and ICP-MS data, compared. Samples: (a) h-07-Gr-1, (b) h-07-51-3, (c) G-4-2V, and (d) G-4-3V.
Figure 5.
REE and Y patterns in different paralava samples (a–d) normalized to the Post-Archean Australian Shale (PAAS) composition after [35], from LA-ICP-MS and ICP-MS data, compared. Samples: (a) h-07-Gr-1, (b) h-07-51-3, (c) G-4-2V, and (d) G-4-3V.

In this respect, given that the complete digestion of the samples would be very difficult (mostly for felsic rocks), the LA-ICP-MS measurements of glass beads adapted to analysis of small aliquots have obvious advantages due to rapidity, promptness, high sensitivity, and high precision and accuracy. The method ensures precise determination for a majority of elements in a large set of rock samples. The reported LA-ICP-MS data for glass beads of standard glass and natural rock samples, as well as rocks of particular compositions, support the conclusions of Orihashi and Hirata [4].
5. Conclusions
The described procedure of fabricating glass beads from <10 mg aliquots for LA-ICP-MS analysis yields acceptably homogeneous glasses from silicate rocks of different compositions, including refractory materials, such as Ca-rich paralava, which is dry non-magmatic melt rock produced by the combustion metamorphism of sedimentary protoliths.
The direct fusion of powdered material into glass beads for LA-ICP-MS determination of trace elements is advantageous over the conventional procedure of preparing glasses for XRF analysis. The glass beads of standards and natural rock samples can be easily prepared using very small quantities of powdered material (<10 mg), have no biasing mineralogical effects, and are homogeneous. The use of originally designed graphite crucibles allows fusing powdered whole-rock samples at 1000 °C for 5–6 min, unlike the standard procedure of making glass beads which implies the fusion of at least ≈1 g aliquots in a 95%Pt-5%Au crucibles at 1200 °C for 20 min at least.
A suite of glasses prepared from international whole rock standards and natural paralava samples of known compositions provided a wide range of reference compositions on which laser ablation combined with inductively coupled plasma mass spectrometry (LA-ICP-MS) was tested as a method of solid source whole-rock analysis. Thirty-two to thirty-five minor and trace elements from this dataset provided consistent correspondence with the recommended values (to 70%–100%) when run as unknowns using NIST 610 as an external standard and known Al concentration as an internal standard for all elements in each sample. However, the detection limits of elements analyzed in thus prepared glass beads depend on the flux purity, which has to be carefully monitored to avoid contamination of samples with flux material.
The reported laser micro-sampling techniques combined with LA-ICP-MS for analysis of glass beads is also advantageous over solution ICP-MS measurements, as it does not require the chemical dissolution of samples and thus ensures the precise determination of many geologically interesting elements which may be unstable in solution, such as Co, Sr, Y, Ba, REE, Zr, Nb, Hf, Ta, Th, and U. The detection limits obtained in our research range from 0.002 to 0.38 ppm for all elements, excepting Sr and Ba, which had higher contents in flux.
The high analytical sensitivity of the LA-ICP-MS technique and the small amounts of material being sufficient for the precise analysis of trace elements, including REE, HFSE, and others, along with the straightforward procedure of fabricating glass beads make the suggested modified technique a promising tool for studying man-made and natural mineral unknowns available in limited amounts, and the sampled material can be preserved for other uses, including replica analyses.
Thus, the method allows the rapid and precise analysis of many minor and trace elements in small aliquots of compositionally unique valuable rock samples and can be recommended for diverse materials in a large range of major-element compositions.
Author Contributions
Conceptualization: E.V.S., O.A.K., A.L.R. and A.S.D.; Methodology: O.A.K., A.L.R. and I.S.K.; ICP-MS analysis: O.A.K.; LA-ICP-MS analysis: A.L.R. and I.S.K.; SEM analysis: A.S.D. and E.V.S.; Interpretation of analytical data: O.A.K., E.V.S., A.S.D. and A.G.S.; Field work: E.V.S. and A.G.S.; Mineralogy and petrography: A.S.D. and E.V.S.; Geochemistry: E.V.S. and A.S.D.; Visualization: A.S.D.; Writing: E.V.S., O.A.K., A.S.D. and A.L.R.; Supervision: A.G.S. All authors have read and agreed to the published version of the manuscript.
Funding
This research was funded by the Russian Science Foundation, grant number No. 24-77-00014, https://rscf.ru/project/24-77-00014/, (accessed on 5 August 2024).
Data Availability Statement
The dataset is presented directly in the present study. Additional data (unpublished) are available upon request from the corresponding author (A.S.D.)
Acknowledgments
We acknowledge colleagues from the Analytical Center of the IGM SB RAS (Novosibirsk) N.S. Karmanov and M.V. Khlestov for analytical support of studies. We wish to thank T.I. Perepelova for helpful advice with translating the article. Thanks to V.S. Kamenetsky (School of Physical Sciences, University of Tasmania, Hobart, Australia) for supporting the work at the initial stage. We are highly appreciative of the valuable comments and suggestions of two anonymous reviewers.
Conflicts of Interest
The authors declare no conflicts of interest.
References
- Sylvester, P.J. Trace element analysis of fused whole rock glasses by laser ablation ICPMS. In Laser Ablation ICP-MS in the Earth Sciences, Principles and Applications; Mineralogical Association of Canada: Gatineau, QC, USA, 2001; pp. 147–162. [Google Scholar]
- Yu, Z.; Norman, M.D.; Robinson, P. Major and trace element analysis of silicate rocks by XRF and laser ablation ICP-MS using lithium borate fused glasses: Matrix effects, instrument response and results for international reference materials. Geostand. Newsl. 2003, 27, 67–89. [Google Scholar] [CrossRef]
- Eggins, S.M. Laser ablation ICP-MS analysis of geological materials prepared as lithium borate glasses. Geostand. Newsl. 2003, 27, 147–162. [Google Scholar] [CrossRef]
- Orihashi, Y.; Hirata, T. Rapid quantitative analysis of Y and REE abundances in XRF glass bead for selected GSJ reference rock standards using Nd-YAG 266 nm UV laser ablation ICP-MS. Geochem. J. 2003, 37, 401–412. [Google Scholar] [CrossRef]
- Kil, Y.; Jung, H. LA-ICP-MS analysis of natural rock samples using XRF glass beads. Geosci. J. 2015, 19, 45–52. [Google Scholar] [CrossRef]
- Park, C.S.; Shin, H.S.; Oh, H.; Cho, H.; Cheong, A.C.-s. Trace element analysis of whole-rock glass beads of geological reference materials by Nd: YAG UV 213 nm LA-ICP-MS. J. Anal. Sci. Technol. 2016, 7, 1–8. [Google Scholar] [CrossRef][Green Version]
- Fedorowich, J.; Richards, J.; Jain, J.; Kerrich, R.; Fan, J. A rapid method for REE and trace-element analysis using laser sampling ICP-MS on direct fusion whole-rock glasses. Chem. Geol. 1993, 106, 229–249. [Google Scholar] [CrossRef]
- Nakayama, K.; Ichikawa, S.; Nakamura, T. Glass bead with minimized amount (11 mg) of sample for X-ray fluorescence determination of archaeological ceramics. X-Ray Spectrom. 2012, 41, 16–21. [Google Scholar] [CrossRef]
- Ichikawa, S.; Onuma, H.; Nakamura, T. Development of undersized (12.5 mm diameter) low-dilution glass beads for X-ray fluorescence determination of 34 components in 200 mg of igneous rock for applications with geochemical and archeological silicic samples. X-Ray Spectrom. 2016, 45, 34–47. [Google Scholar] [CrossRef]
- Gross, S. The Mineralogy of the Haturim Formation, Israel; Geological Survey of Israel: Jerusalem, Israel, 1977.
- Sharygin, V.; Vapnik, Y.; Sokol, E.; Kamenetsky, V.; Shagam, R. Melt inclusions in minerals of schorlomite-rich veins of the Hatrurim Basin, Israel: Composition and homogenization temperatures. In Proceedings of the ACROFI I Program with Abstracts, Nanjing, China, 26–28 May 2006; pp. 189–192. [Google Scholar]
- Sokol, E.; Novikov, I.; Zateeva, S.; Sharygin, V.; Vapnik, Y. Pyrometamorphic rocks of the spurrite-merwinite facies as indicators of hydrocarbon discharge zones (the Hatrurim Formation, Israel). Dokl. Earth Sci. 2008, 420, 608. [Google Scholar] [CrossRef]
- Sokol, E.V.; Kozmenko, O.A.; Khoury, H.N.; Kokh, S.N.; Novikova, S.A.; Nefedov, A.A.; Sokol, I.A.; Zaikin, P. Calcareous sediments of the Muwaqqar Chalk Marl Formation, Jordan: Mineralogical and geochemical evidences for Zn and Cd enrichment. Gondwana Res. 2017, 46, 204–226. [Google Scholar] [CrossRef]
- Krzątała, A.; Krüger, B.; Galuskina, I.; Vapnik, Y.; Galuskin, E. Walstromite, BaCa2(Si3O9), from rankinite paralava within gehlenite hornfels of the Hatrurim Basin, Negev Desert, Israel. Minerals 2020, 10, 407. [Google Scholar] [CrossRef]
- Sokol, E.; Novikov, I.; Zateeva, S.; Vapnik, Y.; Shagam, R.; Kozmenko, O. Combustion metamorphism in the Nabi Musa dome: New implications for a mud volcanic origin of the Mottled Zone, Dead Sea area. Basin Res. 2010, 22, 414–438. [Google Scholar] [CrossRef]
- Seryotkin, Y.V.; Sokol, E.V.; Kokh, S.N. Natural pseudowollastonite: Crystal structure, associated minerals, and geological context. Lithos 2012, 134, 75–90. [Google Scholar] [CrossRef]
- Warr, L.N. IMA–CNMNC approved mineral symbols. Mineral. Mag. 2021, 85, 291–320. [Google Scholar] [CrossRef]
- Almogi-Labin, A.; Bein, A.; Sass, E. Late Cretaceous upwelling system along the southern Tethys margin (Israel): Interrelationship between productivity, bottom water environments, and organic matter preservation. Paleoceanography 1993, 8, 671–690. [Google Scholar] [CrossRef]
- Fleurance, S.; Cuney, M.; Malartre, F.; Reyx, J. Origin of the extreme polymetallic enrichment (Cd, Cr, Mo, Ni, U, V, Zn) of the Late Cretaceous–Early Tertiary Belqa Group, central Jordan. Palaeogeogr. Palaeoclimatol. Palaeoecol. 2013, 369, 201–219. [Google Scholar] [CrossRef]
- Abed, A.M.; Sadaqah, R.M. Enrichment of uranium in the uppermost Al-Hisa Phosphorite Formation, Eshidiyya basin, southern Jordan. J. Afr. Earth Sci. 2013, 77, 31–40. [Google Scholar] [CrossRef]
- Ali Hussein, M.; Alqudah, M.; Blessenohl, M.; Podlaha, O.G.; Mutterlose, J. Depositional environment of Late Cretaceous to Eocene organic-rich marls from Jordan. GeoArabia 2015, 20, 191–210. [Google Scholar] [CrossRef]
- Goren, O. Distribution and mineralogical residence of trace elements in the Israeli carbonate oil shales. Fuel 2015, 143, 118–130. [Google Scholar] [CrossRef]
- Sokol, E.V.; Kokh, S.N.; Sharygin, V.V.; Danilovsky, V.A.; Seryotkin, Y.V.; Liferovich, R.; Deviatiiarova, A.S.; Nigmatulina, E.N.; Karmanov, N.S. Mineralogical diversity of Ca2SiO4-bearing combustion metamorphic rocks in the Hatrurim Basin: Implications for storage and partitioning of elements in oil shale clinkering. Minerals 2019, 9, 465. [Google Scholar] [CrossRef]
- Jochum, K.P.; Weis, U.; Stoll, B.; Kuzmin, D.; Yang, Q.; Raczek, I.; Jacob, D.E.; Stracke, A.; Birbaum, K.; Frick, D.A.; et al. Determination of reference values for NIST SRM 610–617 glasses following ISO guidelines. Geostand. Geoanal. Res. 2011, 35, 397–429. [Google Scholar] [CrossRef]
- Jochum, K.P.; Weis, U.; Schwager, B.; Stoll, B.; Wilson, S.A.; Haug, G.H.; Andreae, M.O.; Enzweiler, J. Reference values following ISO guidelines for frequently requested rock reference materials. Geostand. Geoanal. Res. 2015, 40, 333–350. [Google Scholar] [CrossRef]
- Amosova, A.A.; Panteeva, S.V.; Chubarov, V.M.; Finkelshtein, A.L. Determination of major elements by wavelength-dispersive X-ray fluorescence spectrometry and trace elements by inductively coupled plasma mass spectrometry in igneous rocks from the same fused sample (110 mg). Spectrochim. Acta Part B At. Spectrosc. 2016, 122, 62–68. [Google Scholar] [CrossRef]
- Nikolaeva, I.; Palesskii, S.; Kozmenko, O.; Anoshin, G. Analysis of geologic reference materials for REE and HFSE by inductively coupled plasma-mass spectrometry (ICP-MS). Geochem. Int. 2008, 46, 1016–1022. [Google Scholar] [CrossRef]
- Weis, P.; Beck, H.P.; Günther, D. Characterizing ablation and aerosol generation during elemental fractionation on absorption modified lithium tetraborate glasses using LA-ICP-MS. Anal. Bioanal. Chem. 2005, 381, 212–224. [Google Scholar] [CrossRef]
- Jenner, F.E.; Arevalo Jr, R.D. Major and trace element analysis of natural and experimental igneous systems using LA–ICP–MS. Elements 2016, 12, 311–316. [Google Scholar] [CrossRef] [PubMed]
- Lin, J.; Liu, Y.; Yang, Y.; Hu, Z. Calibration and correction of LA-ICP-MS and LA-MC-ICP-MS analyses for element contents and isotopic ratios. Solid Earth Sci. 2016, 1, 5–27. [Google Scholar] [CrossRef]
- Deviatiiarova, A.; Karputin, I.; Ragozin, A.; Sokol, E. Trace-element fractionation in minerals of high-calcium combustion metamorphic rocks: Case study of garnet-rich paralavas of the Hatrurim formation. In Proceedings of the XIII Russian Youth Scientific and Practical School, Moscow, Russia, 12–13 April 2024; pp. 67–71. [Google Scholar]
- Esbensen, K.H. Materials properties: Heterogeneity and appropriate sampling modes. J. AOAC Int. 2015, 98, 269–274. [Google Scholar] [CrossRef]
- Grant, C.; Pelton, P. Role of Homogeneity in Powder Sampling; ASTM International: West Conshohocken, PA, USA, 1973. [Google Scholar]
- Stanley, C.R. On the special application of ThompsonHowarth error analysis to geochemical variables exhibiting a nugget effect. Geochem. Explor. Environ. Anal. 2006, 6, 357–368. [Google Scholar] [CrossRef] [PubMed]
- Taylor, S.R.; McLennan, S.M. The Continental Crust: Its Composition and Evolution; Blackwell Scientific Publications: Hoboken, NJ, USA, 1985. [Google Scholar]


Disclaimer/Publisher’s Note: The statements, opinions and data contained in all publications are solely those of the individual author(s) and contributor(s) and not of MDPI and/or the editor(s). MDPI and/or the editor(s) disclaim responsibility for any injury to people or property resulting from any ideas, methods, instructions or products referred to in the content. |
© 2025 by the authors. Licensee MDPI, Basel, Switzerland. This article is an open access article distributed under the terms and conditions of the Creative Commons Attribution (CC BY) license (https://creativecommons.org/licenses/by/4.0/).