Abstract
Particles of selected materials, namely granulite quarry rock and itabirite iron ore, have been characterized regarding their shapes using reconstruction from 2D images and 3D laser scanning. Different levels of simplifications of particle geometry were initially proposed, with optimal fit-for-purpose shapes represented by polyhedral meta-particles containing 41 to 90 faces. From the distribution of aspect ratios, a total of 16 groups of shapes have been created. Preliminary validation of the shapes modeled was carried out by comparing bulk density measurements from simulations and experiments for granulite, resulting in very good agreement between the two. Further validation was then carried out by comparison of experiments for a gneiss rock and another itabirite sample to simulations, with good agreement between both. This database provides suitable representation of ore/rock shapes for DEM simulations in the software Rocky.
1. Introduction
The simulation of mineral processing circuits is crucial for understanding their operation and, in turn, their optimization, thereby minimizing energy consumption and maximizing the recovery of valuable minerals [1]. The simulation of the performance of individual equipment is increasingly being carried out using the discrete element method (DEM), which is an excellent option for systems involving granular materials such as ores [2,3]. Particles may be represented using different particle shapes, ranging from spheres and overlapping spheres (clumps), which are well-known for reducing computational effort [4,5], to a customized polyhedral, which provide a more realistic representation of the material in these simulations [1], although with a higher computational cost.
A total of four main approaches may be used to characterize particle shapes in 3D: X-ray computed tomography [6,7], 3D laser scanners [8,9], photogrammetry [10], and 3D modeling in CAD from 2D images [2,11]. X-ray CT and 3D scanners are the most technologically advanced option; however, they are more costly [12,13,14]. Photogrammetry uses software that creates a 3D model from several images captured from different angles [15]. These methods allow for accurate descriptions of the geometry of a particle since they capture details of the surface texture and shape. However, using these particle shapes in DEM simulations can make them very computationally demanding, so there is interest in representing the shape of particles as realistically as possible, but also in a way that the use of the particle in the DEM simulation is cost-effective.
The aim of this study is to create a database of coarse 3D particle shapes that are able to represent different ores and rocks in DEM simulations, based on the distribution of aspect ratios and particle shapes that represent optimally the balance between fidelity in representing particle shapes and simplicity for efficient computation. Particles from an itabirite iron ore and a granulite were used as the basis for the database. The relevance of particle shape was then demonstrated by comparing estimates from the bulk density of another rock (gneiss) and another iron ore to predictions using DEM.
2. Materials and Methods
Samples of granulite and gneiss, used in the production of aggregates for construction and building [16], and two samples of itabirite iron ore, used in the production of iron ore concentrates [17] in Brazil, were selected for the study. Information on the source and physical characteristics of the samples is provided in Table 1.

Table 1.
Description of the samples used in the present study.
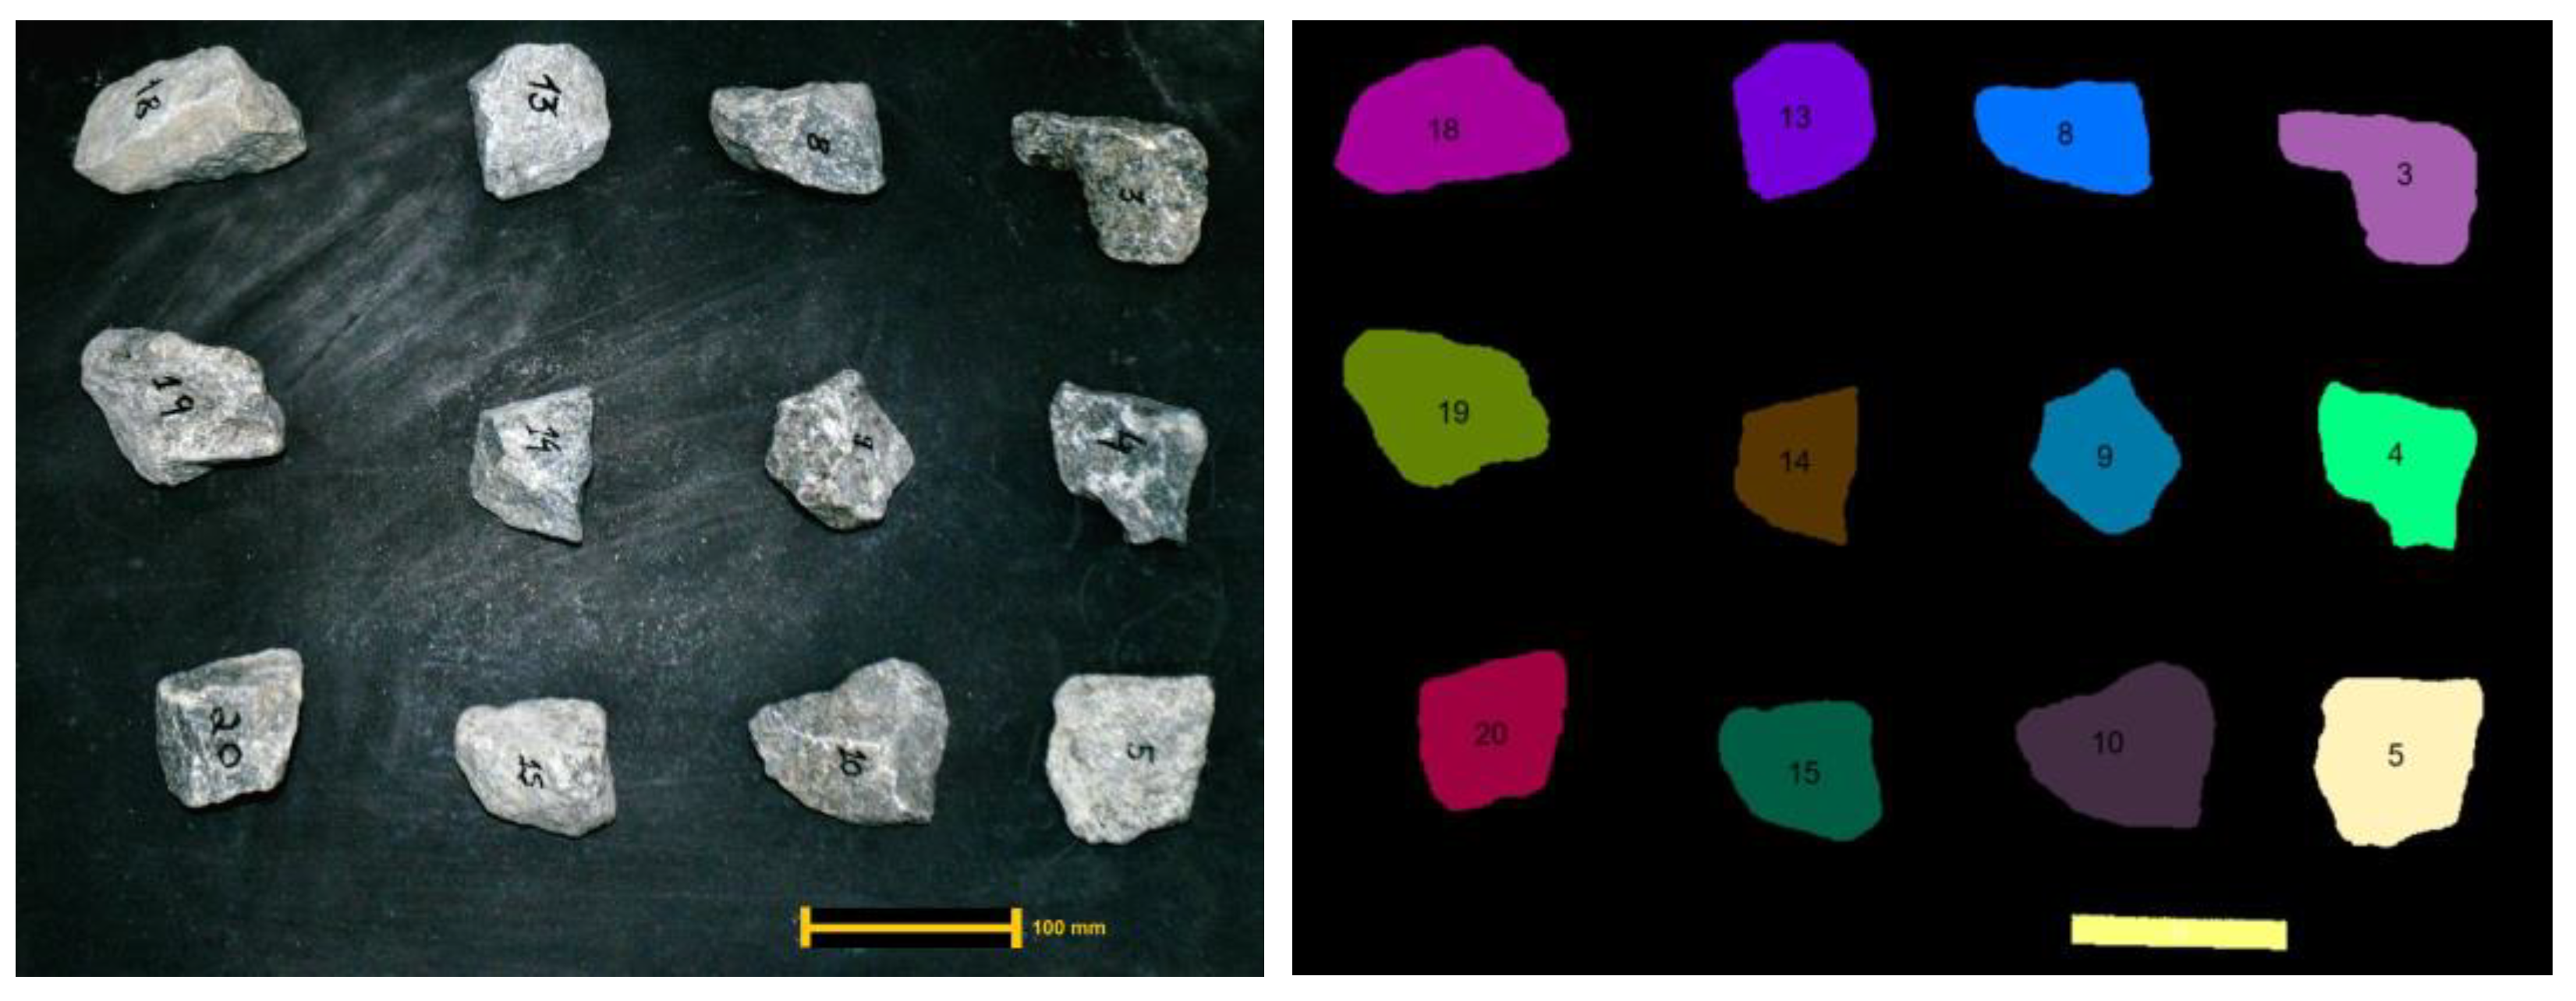
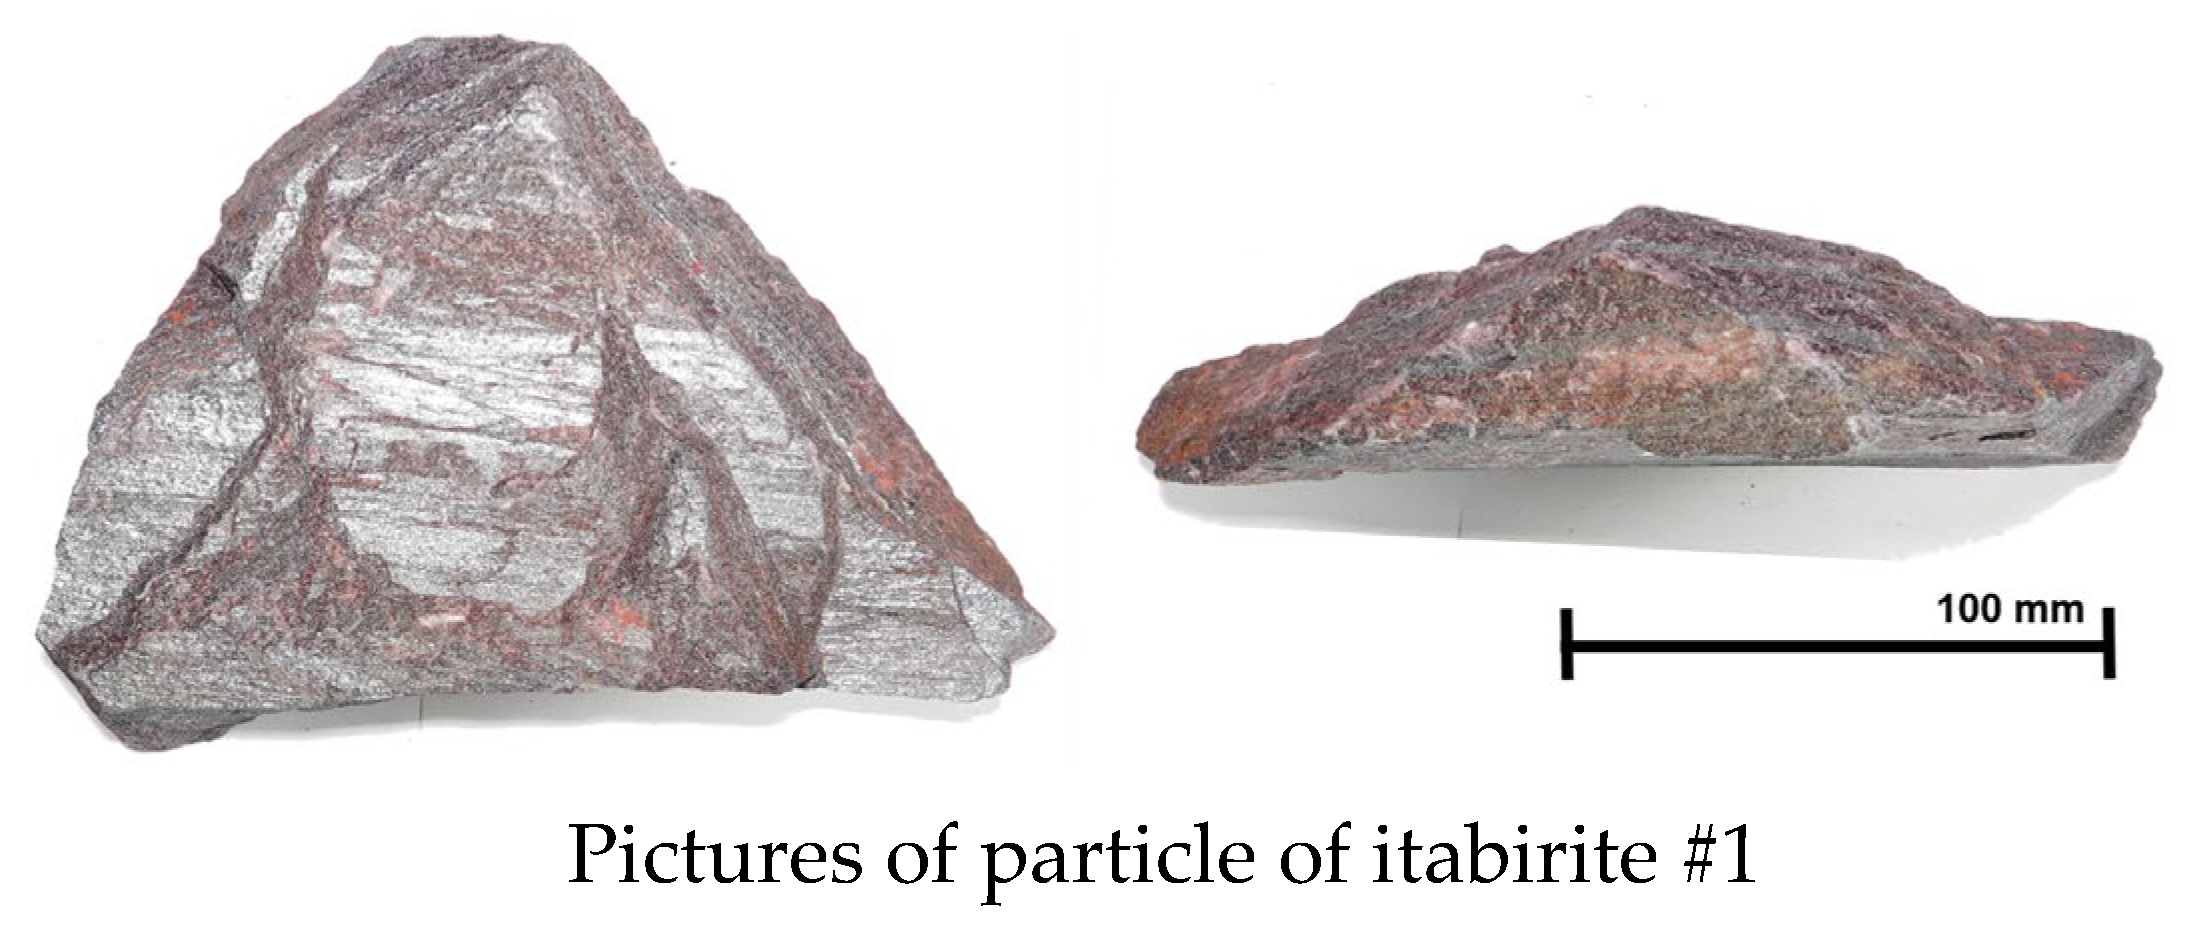
The first step consisted of measuring the particle mass and the three main orthogonal dimensions of each particle: length (L), width (W) and thickness (T). The length represents the longest dimension of the particle. The width represents the second largest dimension of the particle. The thickness represents the height of the particle when placed in its most stable position. These measurements were obtained from photographic images (Figure 1) taken from two different angles using a Nikon d3200 camera (Nikon Corporation, Tokyo, Japan), with scales in order to allow the estimation of their dimensions. Digital analysis of the images was carried out using ImageJ software, version 1.54 g. Afterwards, the two aspect ratios (Width/Length—W/L—and Thickness/Width—T/W) were calculated. Based on these measurements, the aspect ratios W/L and T/W were defined, which ranged between 0 and 1. An increase in the T/W ratio represents a decrease in the particle’s flakiness, while an increase in the W/L ratio represents a decrease in the particle’s elongation.

Figure 1.
Granulite particle dimensions characterization using digital image analysis (left): raw images; (right): segmented images.
Using order statistics, lumped cumulative distributions were constructed according to these two aspect ratios to represent the variability of particle shapes identified for granulite and iron ore. Based on these distributions, an attempt was made to create groups to represent the range of particle shapes found.
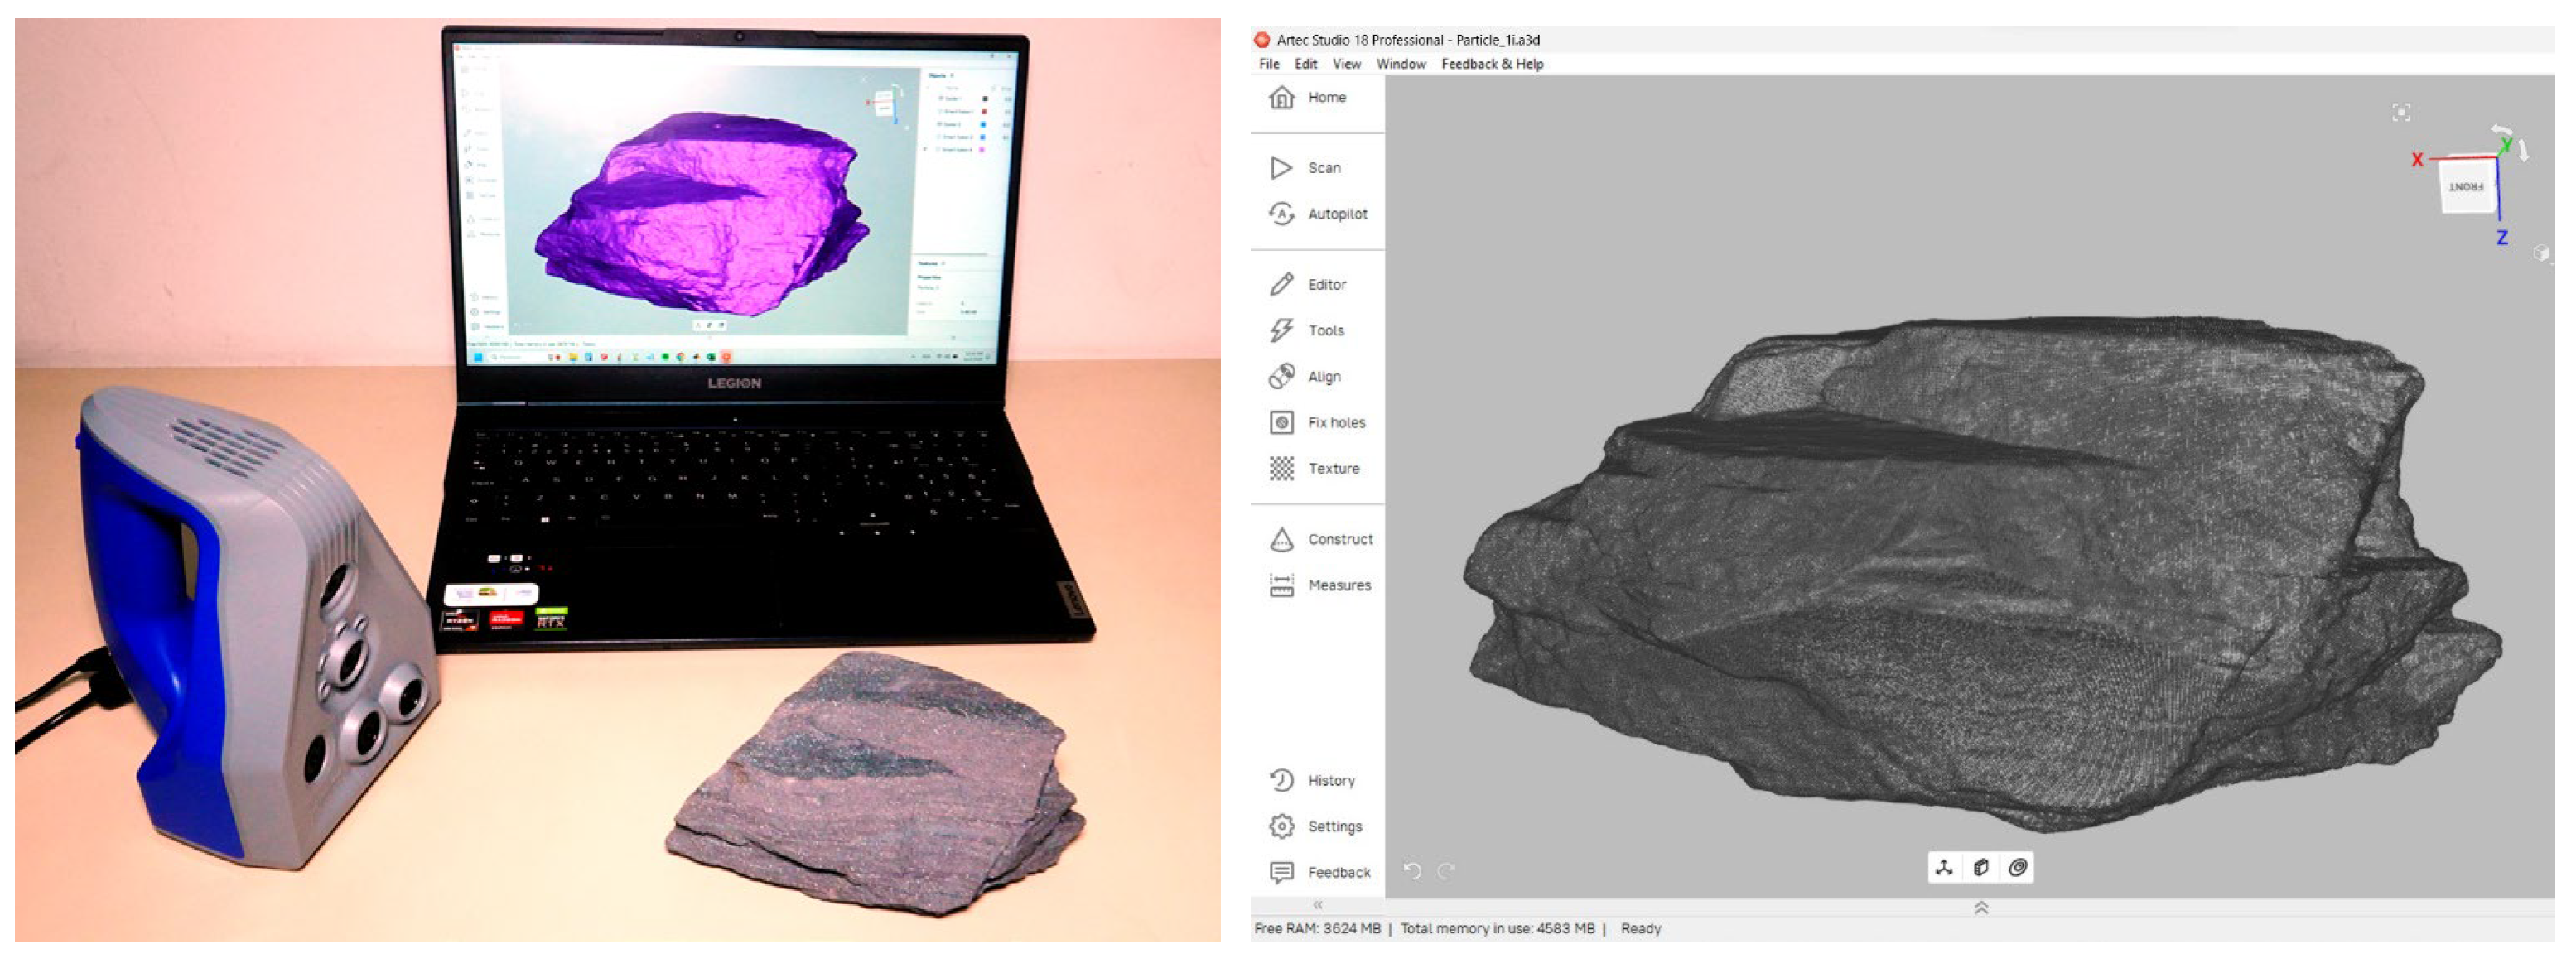
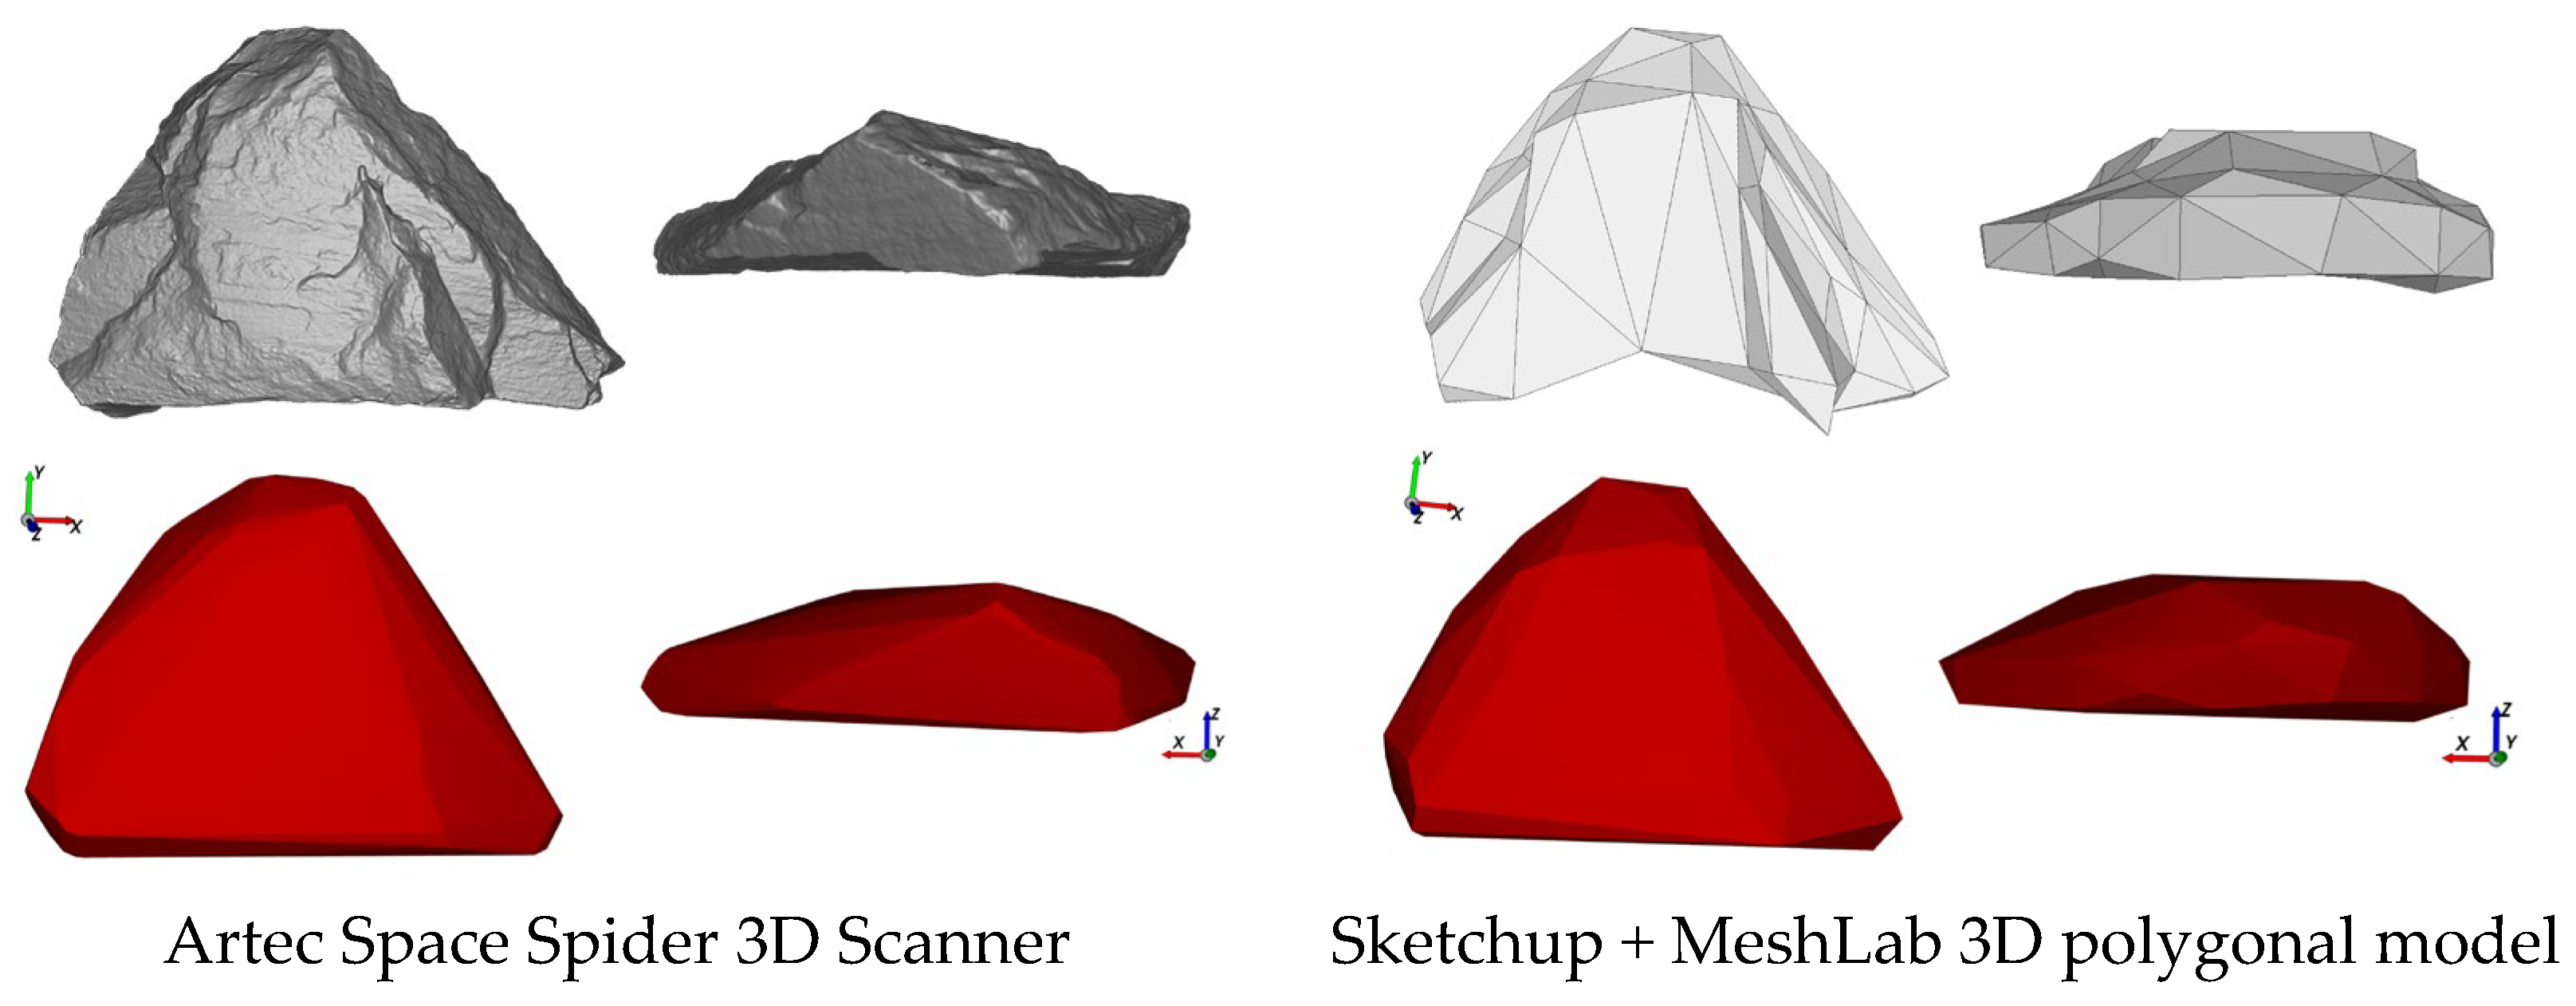
A total of two methods were used to model in 3D particles contained in each of these groups represented by the different aspect ratios. The first method was 3D laser scanning using the Artec Space Spider (Artec 3D—Senningerberg/Luxembourg) (Figure 2). It uses laser triangulation technology to accurately measure the shape, size, and features of an object, with a point accuracy of 0.05 mm and a mesh resolution of 0.3 mm. Processing and fusion of the pictures obtained by scanning were carried out using Artec Studio 18 professional software (version 18.1.3.6), which enabled obtaining the 3D particle shape model in STL format (Figure 2).

Figure 2.
Artec Space Spider 3D scanner and 3D model fusion using Artec Studio 18 professional for a particle of itabirite #1.
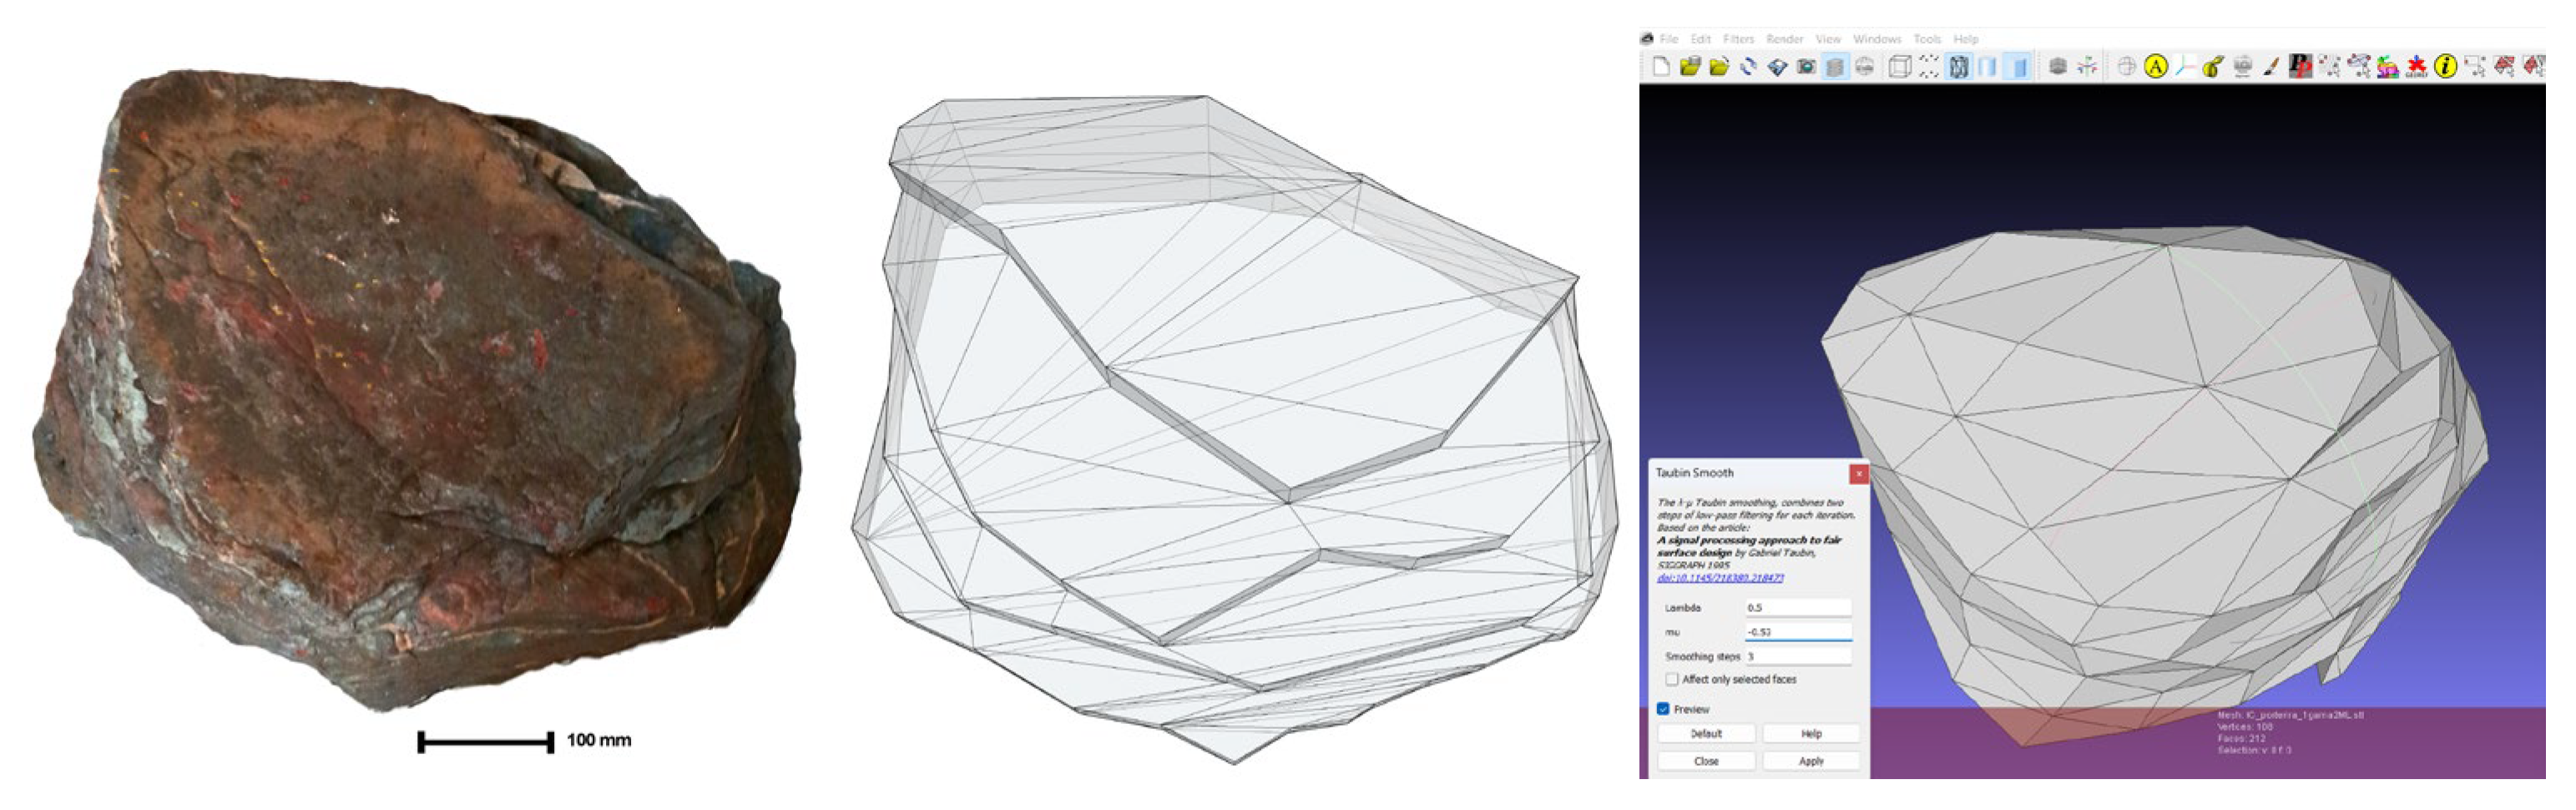
The second method consisted of using the images collected during the shape characterization (Figure 1) as a basis for CAD modeling in the SketchUp software, version 2020, representing the shape of the particles as simple polygons (Figure 3). The “rough” 3D particle shape model was filtered using the MeshLab software, version 2020.07, to generate smooth and convex geometries applying the “close holes” and, the “Taubin Smooth” filter. In addition, MeshLab was used to remove some surface imperfections of the particles without altering their aspect ratio (Figure 3).
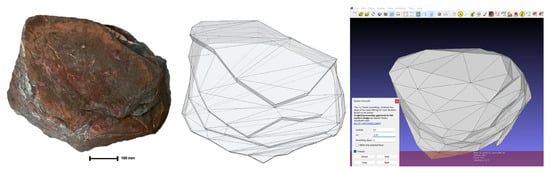
Figure 3.
Polygonal 3D particle shape model in SketchUp and 3D model filtered using MeshLab.
Finally, the 3D particle shape models for each aspect ratio group were imported into Rocky DEM software, version 2023 R2. Rocky DEM transforms the initial 3D model into a convex geometry to perform the DEM simulations.
To demonstrate the ability of the modeled particles to represent the bulk behavior of the samples, DEM simulations were conducted considering the density of the materials listed in the Table 1, a value of the Young’s Modulus of 7.7 MPa [16] for the particulate material, and the contact parameters listed in Table 2 for Particle–Particle and Particle–Surface interactions. These parameters have demonstrated to be valid to represent the response of irregularly shaped particles [1], although static bulk density simulations are not particularly sensitive to contact parameter values, but rather on fidelity in representing particle shapes [18]. The DEM simulations consisted in reproducing the simple experiment of laying particles in a box with dimensions of 420 × 280 × 600 mm with an acrylic side to visualize the particle accommodation.
Table 2.
Contact parameters used in simulations of particle bulk density experiment in Rocky DEM.
3. Results
3.1. Aspect Ratio Measurements
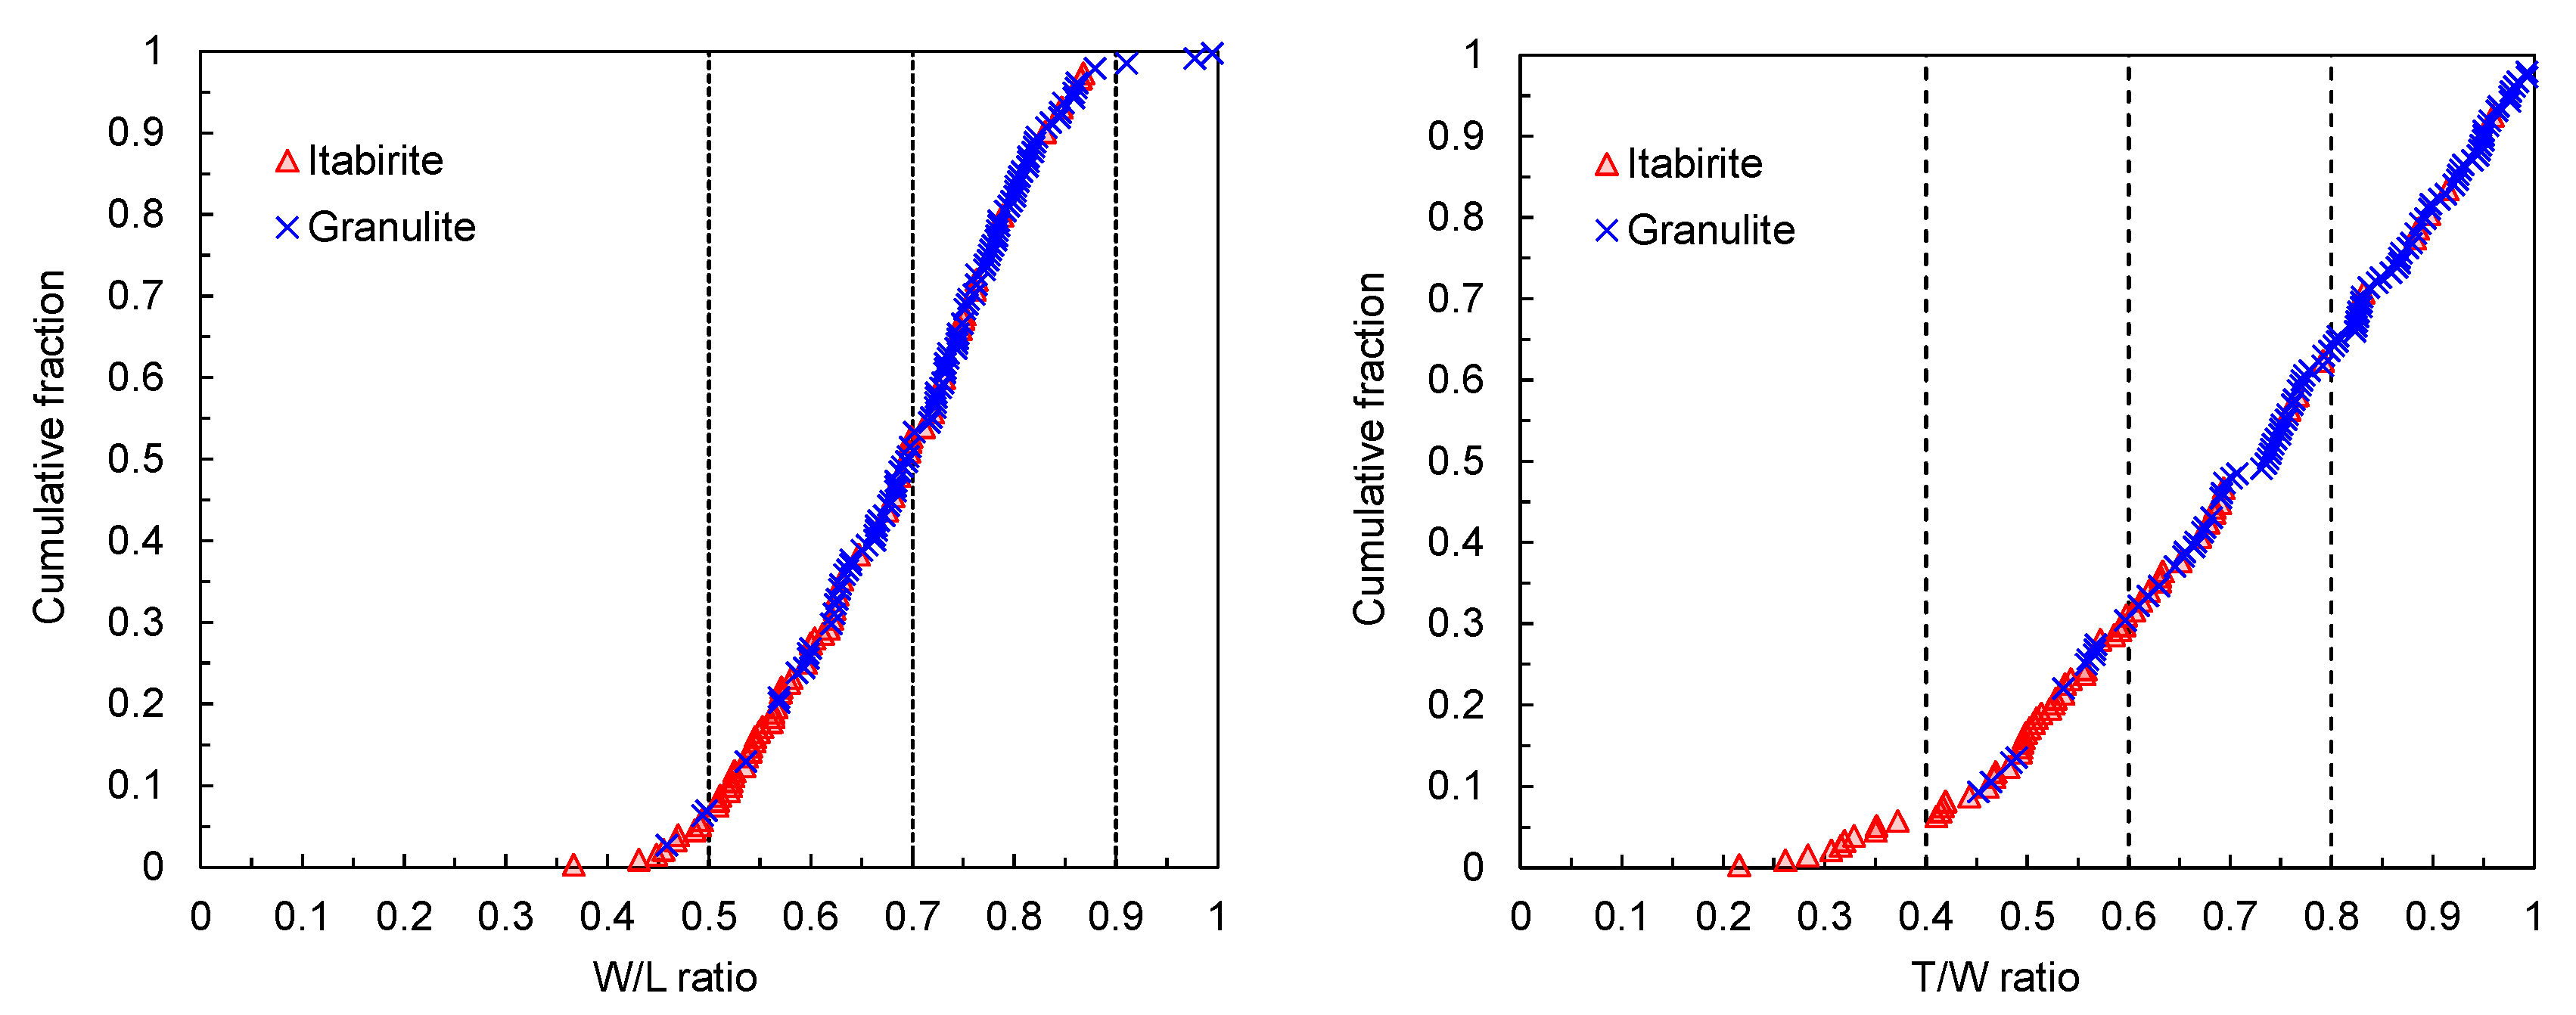
Figure 4 shows the cumulative distribution of the aspect ratios W/L and T/W obtained from the digital image analysis of the itabirite #1 and the granulite particles. A total of 103 particles for granulite and 63 particles for itabirite #1 were used for the aspect ratio characterization. The aspect ratio results show that granulite particles have a higher W/L ratio, meaning they are less elongated than those of itabirite. Differences in flakiness, represented by the T/W ratio, were less evident between the materials, but itabirite presented generally lower values and, therefore, higher flakiness than granulite. Based on the distributions of aspect ratios, four groups were proposed for each aspect ratio, resulting in a total of 16 groups (Table 3).
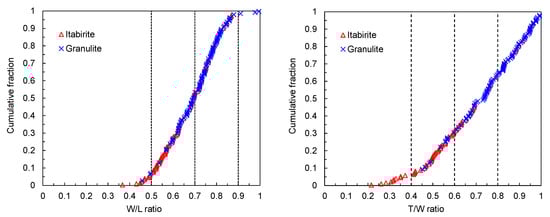
Figure 4.
Particle shape aspect ratio W/L (left) and T/W (right) for the samples of itabirite #1 and granulite. Dashed vertical lines represent the limits of the different aspect ratio groups.
Table 3.
Aspect ratio groups defined on the basis of the particle shape characterization.
The aspect ratio values show that granulite particles have a higher W/L ratio, meaning they are less elongated than those of itabirite #1. However, differences in lamellarity T/W are less evident between the materials and have a wider distribution. Based on the aspect ratios distributions, four groups were proposed for each aspect ratio range, resulting in a total of 16 groups (Table 3).
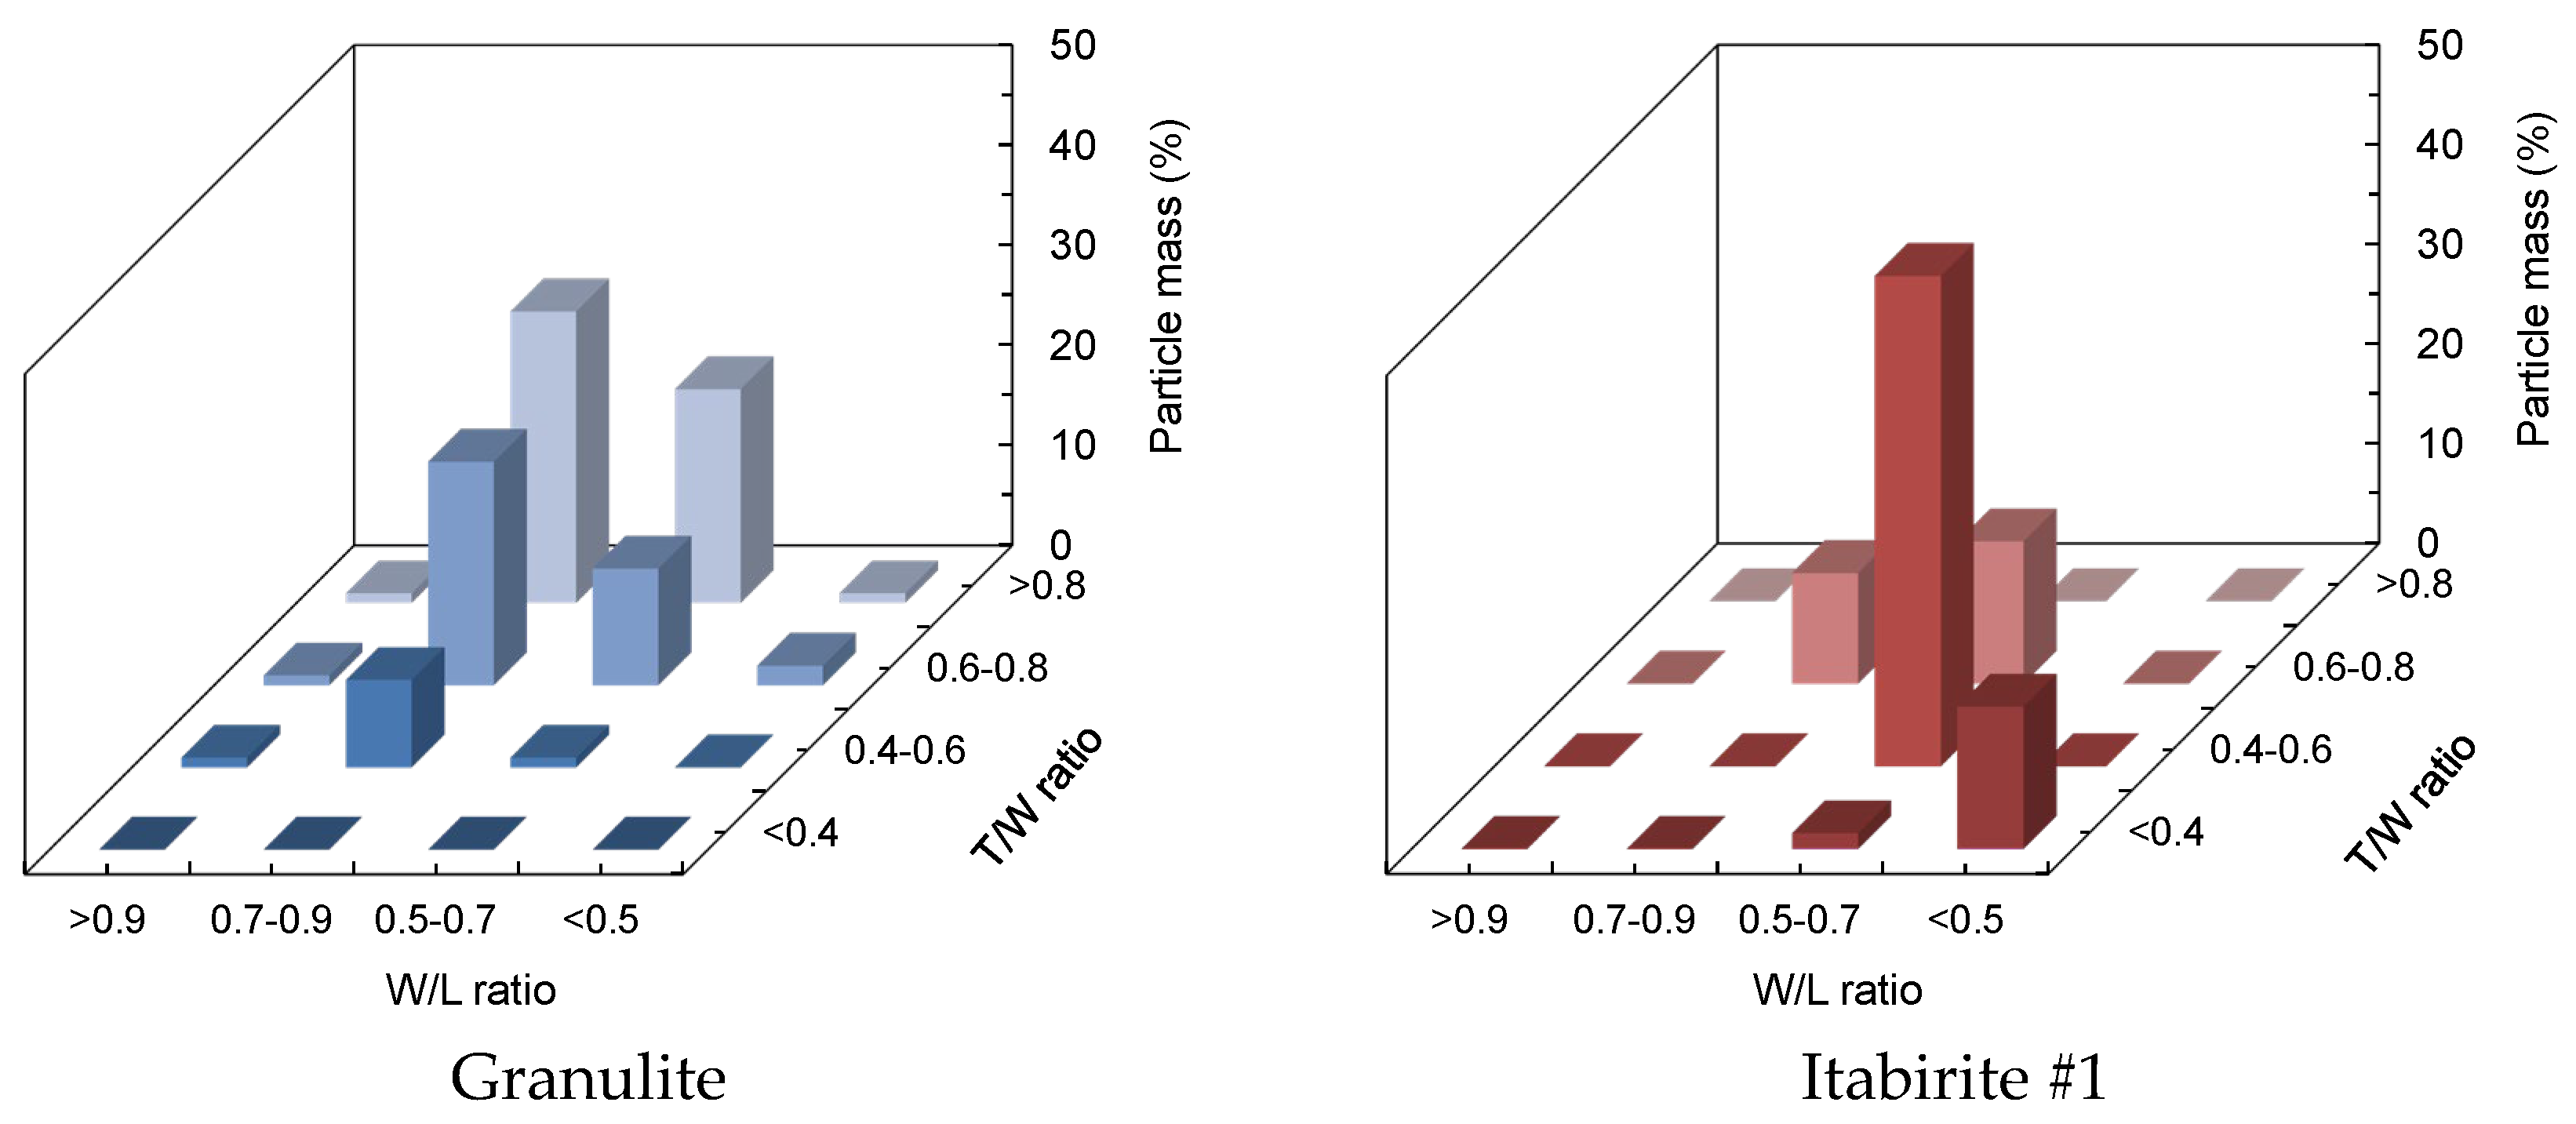
On the basis of the proposed division in groups, the distribution of particle shapes in weight for granulite and itabirite #1 was estimated, and a summary is given in Figure 5. While the granulite sample contains particles with aspect ratios in the intermediate to high values (higher cubicity), the itabirite #1 sample presents more flaky and elongated particles, associated with its lower W/L and T/W ratios, respectively.
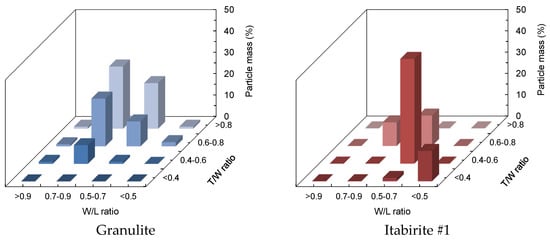
Figure 5.
Particle mass distributions for the different aspect ratio groups for the samples of granulite (left) and itabirite #1 (right).
3.2. 3D Particle Shape Modeling and Creation of Particle Shape Library for Rocky DEM
Figure 6 shows the front and side pictures of an itabirite #1 particle with aspect ratios of W/L = 0.76 and T/W = 0.31, representing group 2. In addition, it shows 3D particle shape models obtained using the Artec Space Spider 3D scanner, and the SketchUp and MeshLab filtered polygonal model. Additionally, Figure 6 shows the convex geometry 3D model imported to the Rocky DEM simulator. It is important to note that, in order to import the STL file obtained from 3D scanning, it was necessary to simplify the model of the particle by reducing the number of faces (triangles). Table 4 summarizes the main parameters of the 3D models obtained by the two methods applied in the present study. It is evident that a substantial simplification was required when the 3D scanned image served as the input to Rocky DEM. This contrasts with the case when the SketchUp/MeshLab model was used, which demanded very little modification after being incorporated into Rocky DEM.
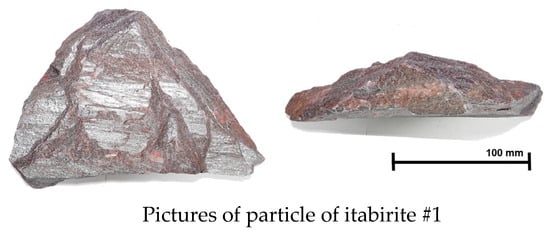

Figure 6.
Picture of an itabirite #1 particle (group 2) (top), 3D models obtained using Artec Spider 3D Scanner (middle left), and Sketchup/MeshLab filtered polygonal model (middle right), and the respective convex geometries imported to the Rocky DEM simulator (bottom).
Table 4.
3D shape particle model parameters of the STL file for an itabirite #1 particle (group 2).
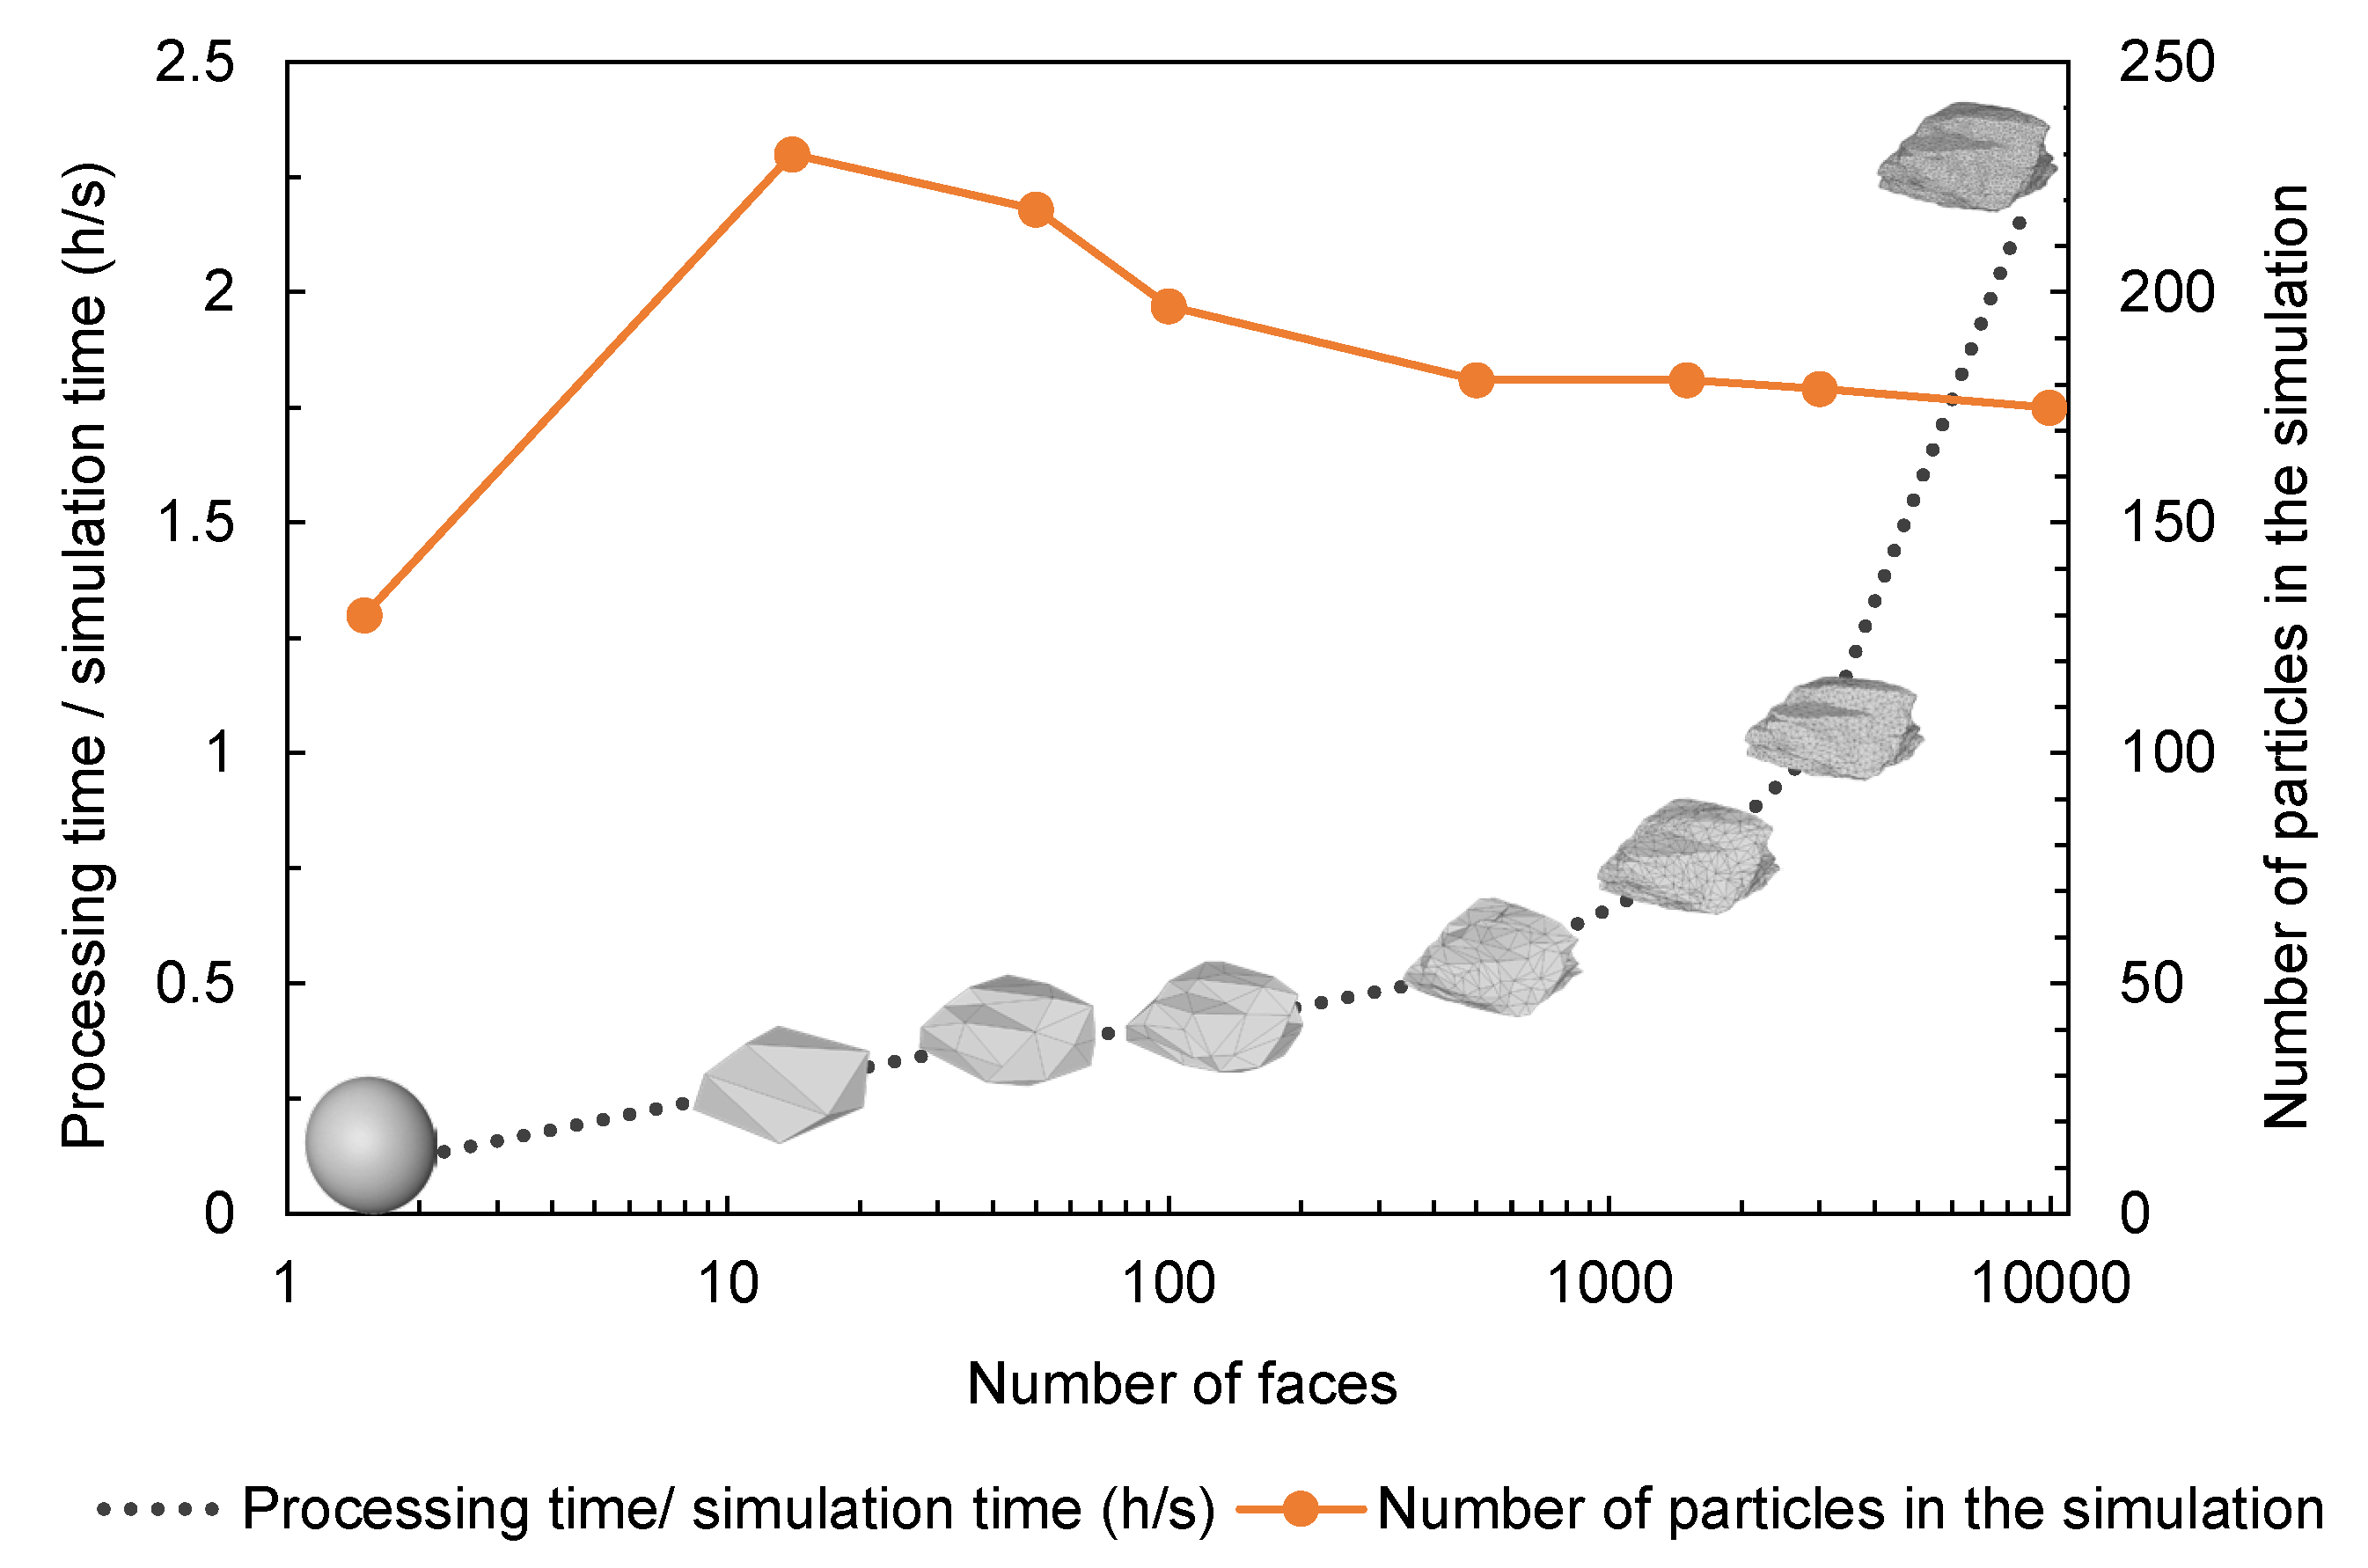
To assess the optimal resolution of the particles to be modeled, one particle with aspect ratios 0.5 < W/L < 0.7 and 0.4 < T/W < 0.6 was modeled at different resolutions in order to examine the optimal balance between fidelity in representing the DEM simulation and the computational effort. As such, the particle was modeled with a variety of shapes, ranging from a sphere to a very complex particle containing 10,000 faces, and 80 kg of particles of size 50 mm were used to fill the virtual box measuring 420 × 280 × 600 mm for a total of 4 s. Rocky DEM was used and the automatic time step was selected. Results of the simulations are presented in Table 5, whereas Figure 7 summarizes the results of the bulk density simulation experiments with the different particles. Automatic time steps used in the simulations varied within the narrow range from 2.57 × 10⁻⁶ to 3.42 × 10⁻⁶ s.
Table 5.
Results of the bulk density simulations comparing the computational effort for particles with different number of faces.

Figure 7.
Computational effort (processing hours per 1 s of simulation) and the number of particles in the simulation as a function of particle geometry complexity (number of faces).
The results show that incrementing the complexity of the particle geometry (number of faces) increases nearly exponentially the computational effort, represented by the number of processing hours per second of simulation (Figure 7). On the other hand, excessive simplification of the particle geometry is reflected in variation of the number of particles in the particle bed. As such, it was proposed to limit the number of faces below about 200 faces to create the meta-particles. As such, 3D laser scanned particles need to be highly simplified before they are imported in Rocky DEM for simulations, which shows that this technique becomes relatively equivalent to reconstruction from 2D images for the purpose of DEM simulations.
Figure 8 shows the 3D particle shape models imported into the Rocky DEM simulator to represent the 16 aspect ratio groups. Since no particles were found in samples of itabirite #1 and granulite for groups G4 and G16, the meta-particles were created solely on the basis of the mean aspect ratios of the group. Additionally, the 3D shapes imported into the Rocky DEM simulator for groups G2, G6, G7, G11, and G14, were the 3D models obtained using the Artec Space spider 3D scanner and imported into the Rocky DEM simulator using the option “Convert the shape to convex”. Figure 8 shows the variation in the particle geometry across the groups: whereas particles in group 1 are elongated and flaky, those in group 16 approximate cubic shapes. In all, meta-particles were modeled containing from 41 to 90 faces and from 78 to 173 vertices (Table 6). Files containing the particle shapes are provided in the Supplementary Materials.
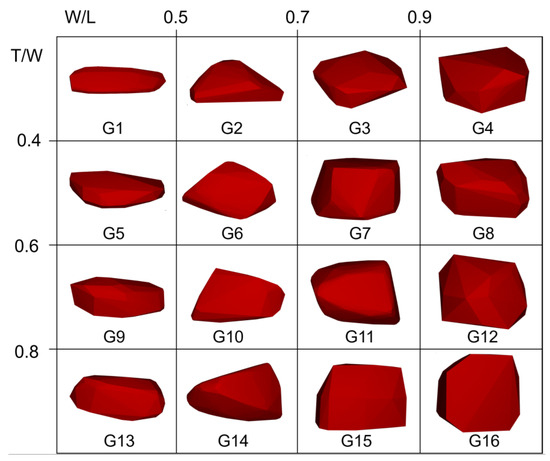
Figure 8.
3D particle shape models imported into Rocky DEM taken as representative of the 16 aspect ratio groups using the Sketchup and Mesh lab filtered polygonal models.
Table 6.
Main characteristics of the 3D particle shape models of the different aspect ratio groups.
3.3. Validation
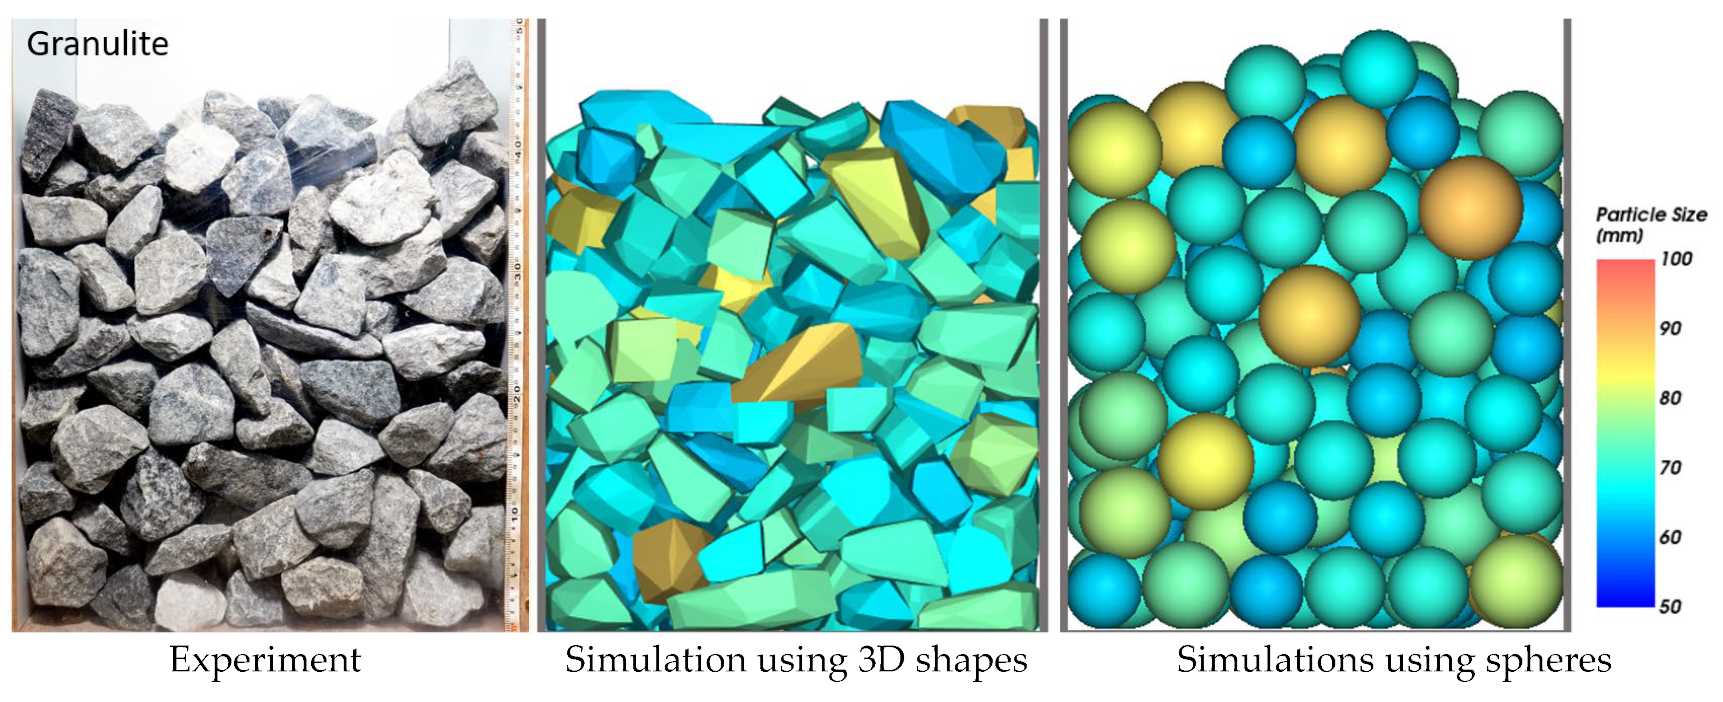
Simulations of the bulk density experiment for granulite particles were conducted using the Rocky DEM simulator, with the parameters in Table 2, the mass distribution as functions of the aspect ratio from Figure 5, and the 3D particles-shape model library illustrated in Figure 8. Figure 9 compares images of the bulk density experiment using a total mass of 80 kg of granulite particles, with the Rocky DEM simulations using the 3D particle shapes model library and also using spheres.
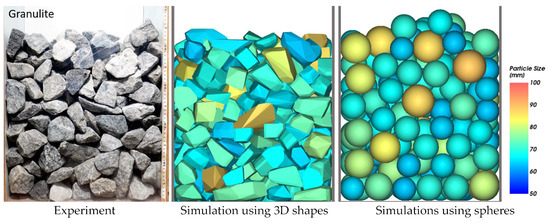
Figure 9.
Picture of the bulk density experiment using a total mass of 80 kg of granulite particles (left), and the DEM simulation using the 3D particle shapes model library (center), and the simulation using spheres (right).
Table 7 summarizes the results of the experiment and of the average value of the replicated DEM simulation. The average simulation results of the bulk density test using granulite particle shapes showed very good agreement with the experiment. The distributions of particle shapes represent, with a good level of detail, the particle bed compaction and the voidage among particles. On the other hand, the bed of particles simulated using spheres overestimated the particle bed height. This demonstrates the limitation of spheres in representing the packing of particulate materials, already demonstrated in earlier studies [19].
Table 7.
Results of the granulite bulk density experiment compared with the DEM simulations using irregular shapes and spheres (standard deviations in parentheses).
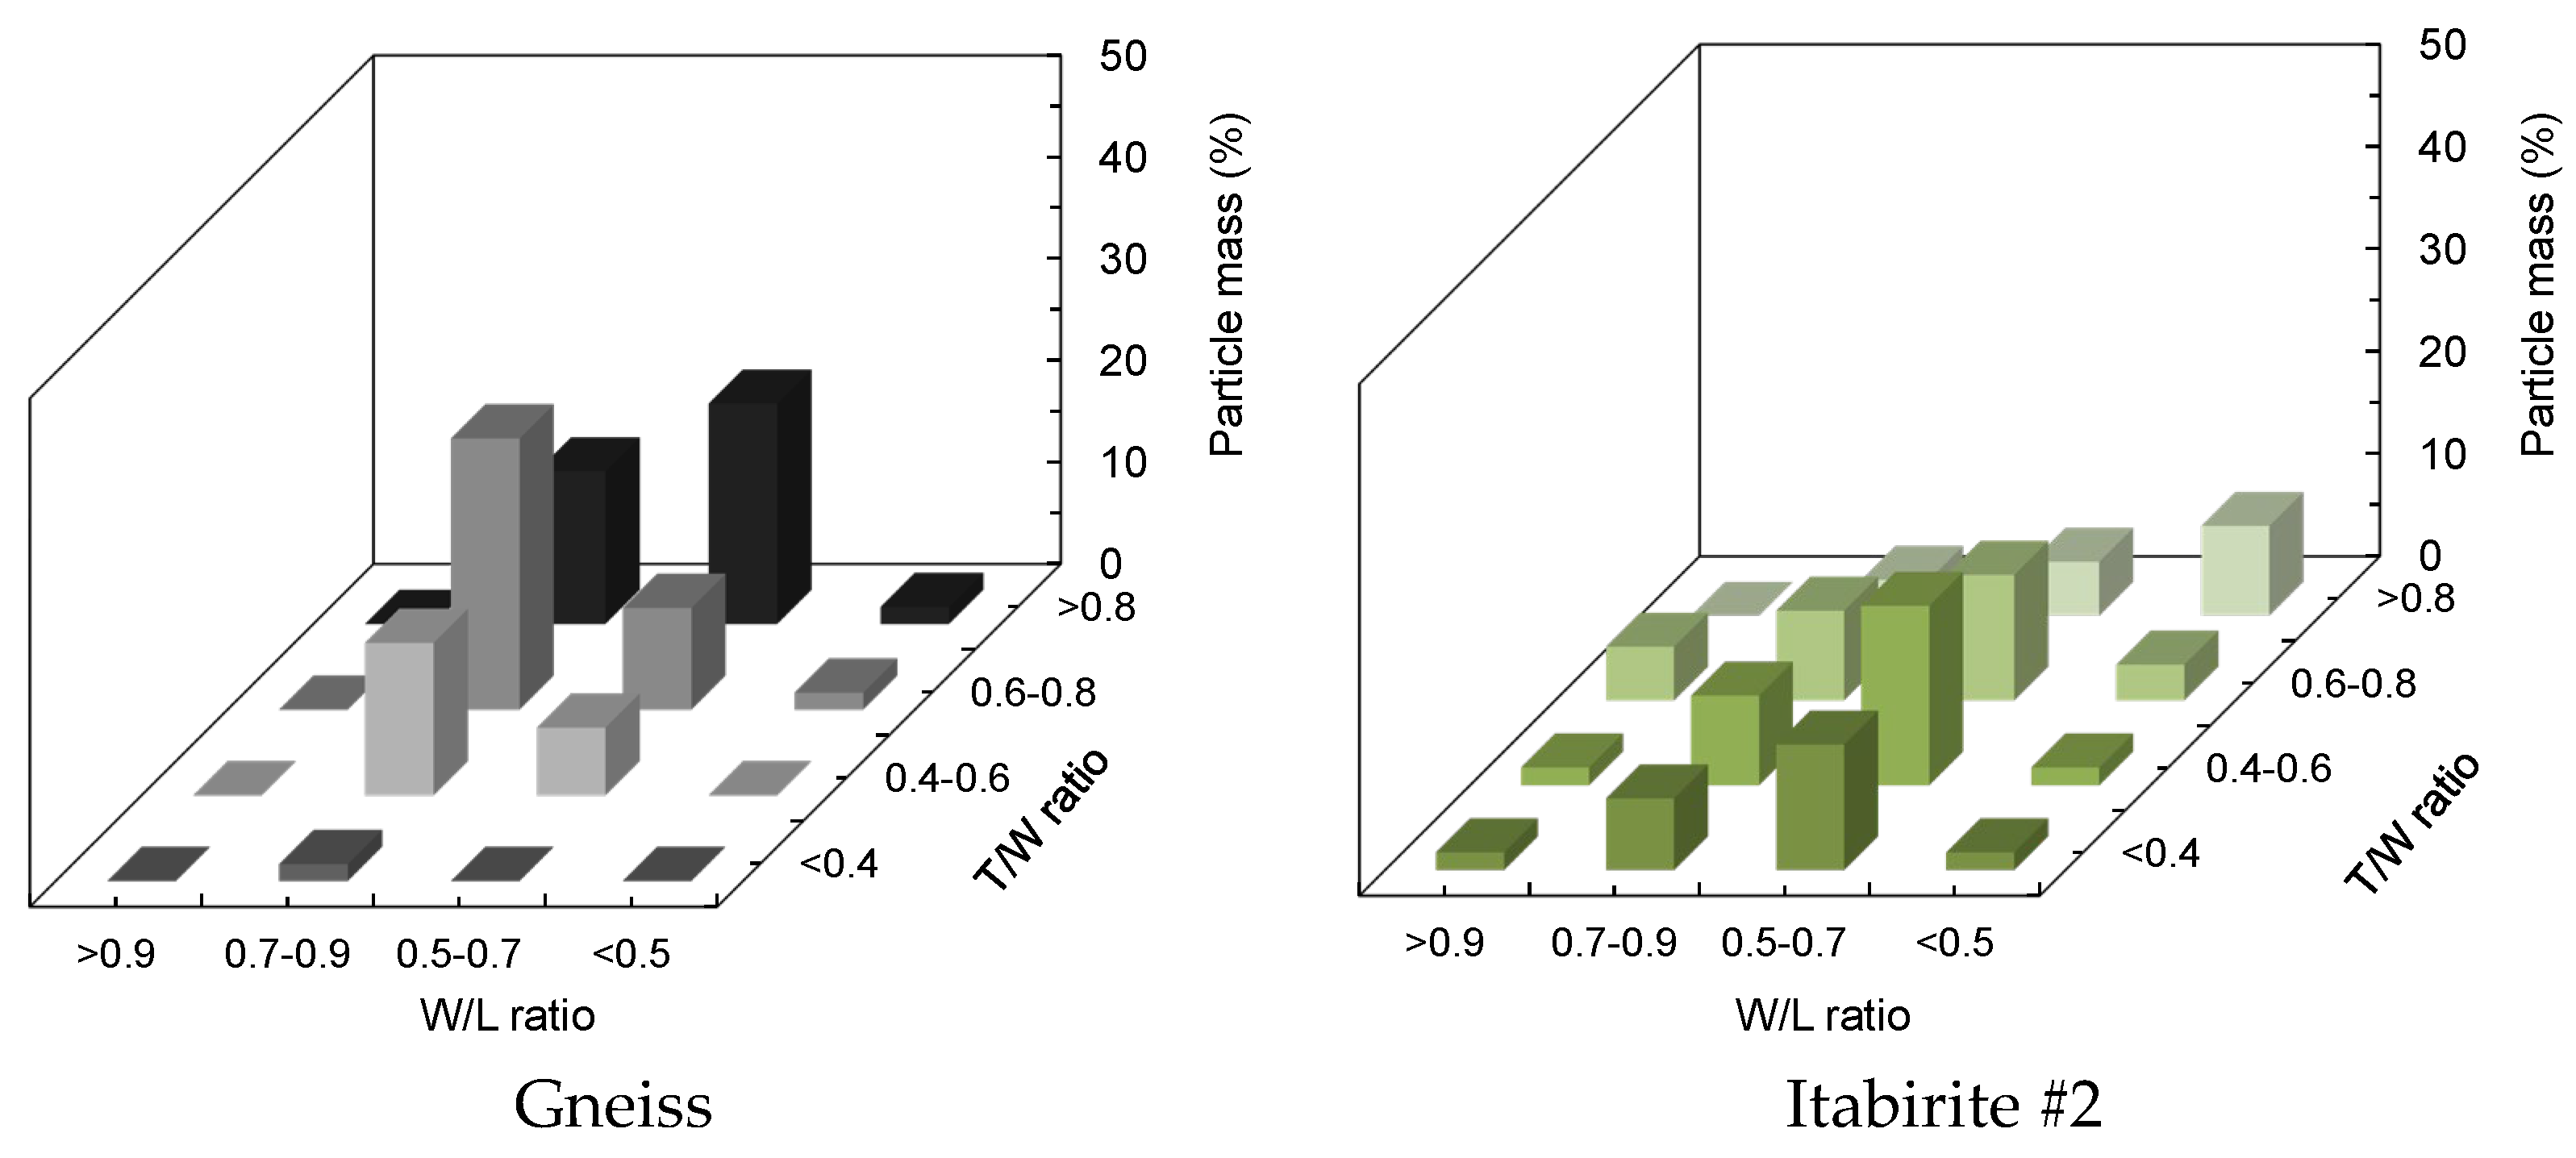
It is worth examining the ability of the database of particles in Figure 8, representing different materials. Then, samples of gneiss and of another itabirite #2 (Table 1), were characterized to estimate their aspect ratios, using 60 particles for each material, with a summary given in Figure 10. When compared to the granulite sample (Figure 5), gneiss exhibits higher flakiness, with larger proportion of material with T/W ratio below 0.6. On the other hand, itabirite #2 shows a wider particle aspect ratio distribution compared with the other rocks characterized in the present study.

Figure 10.
Particle mass distributions for gneiss (left) and itabirite #2 (right) samples.
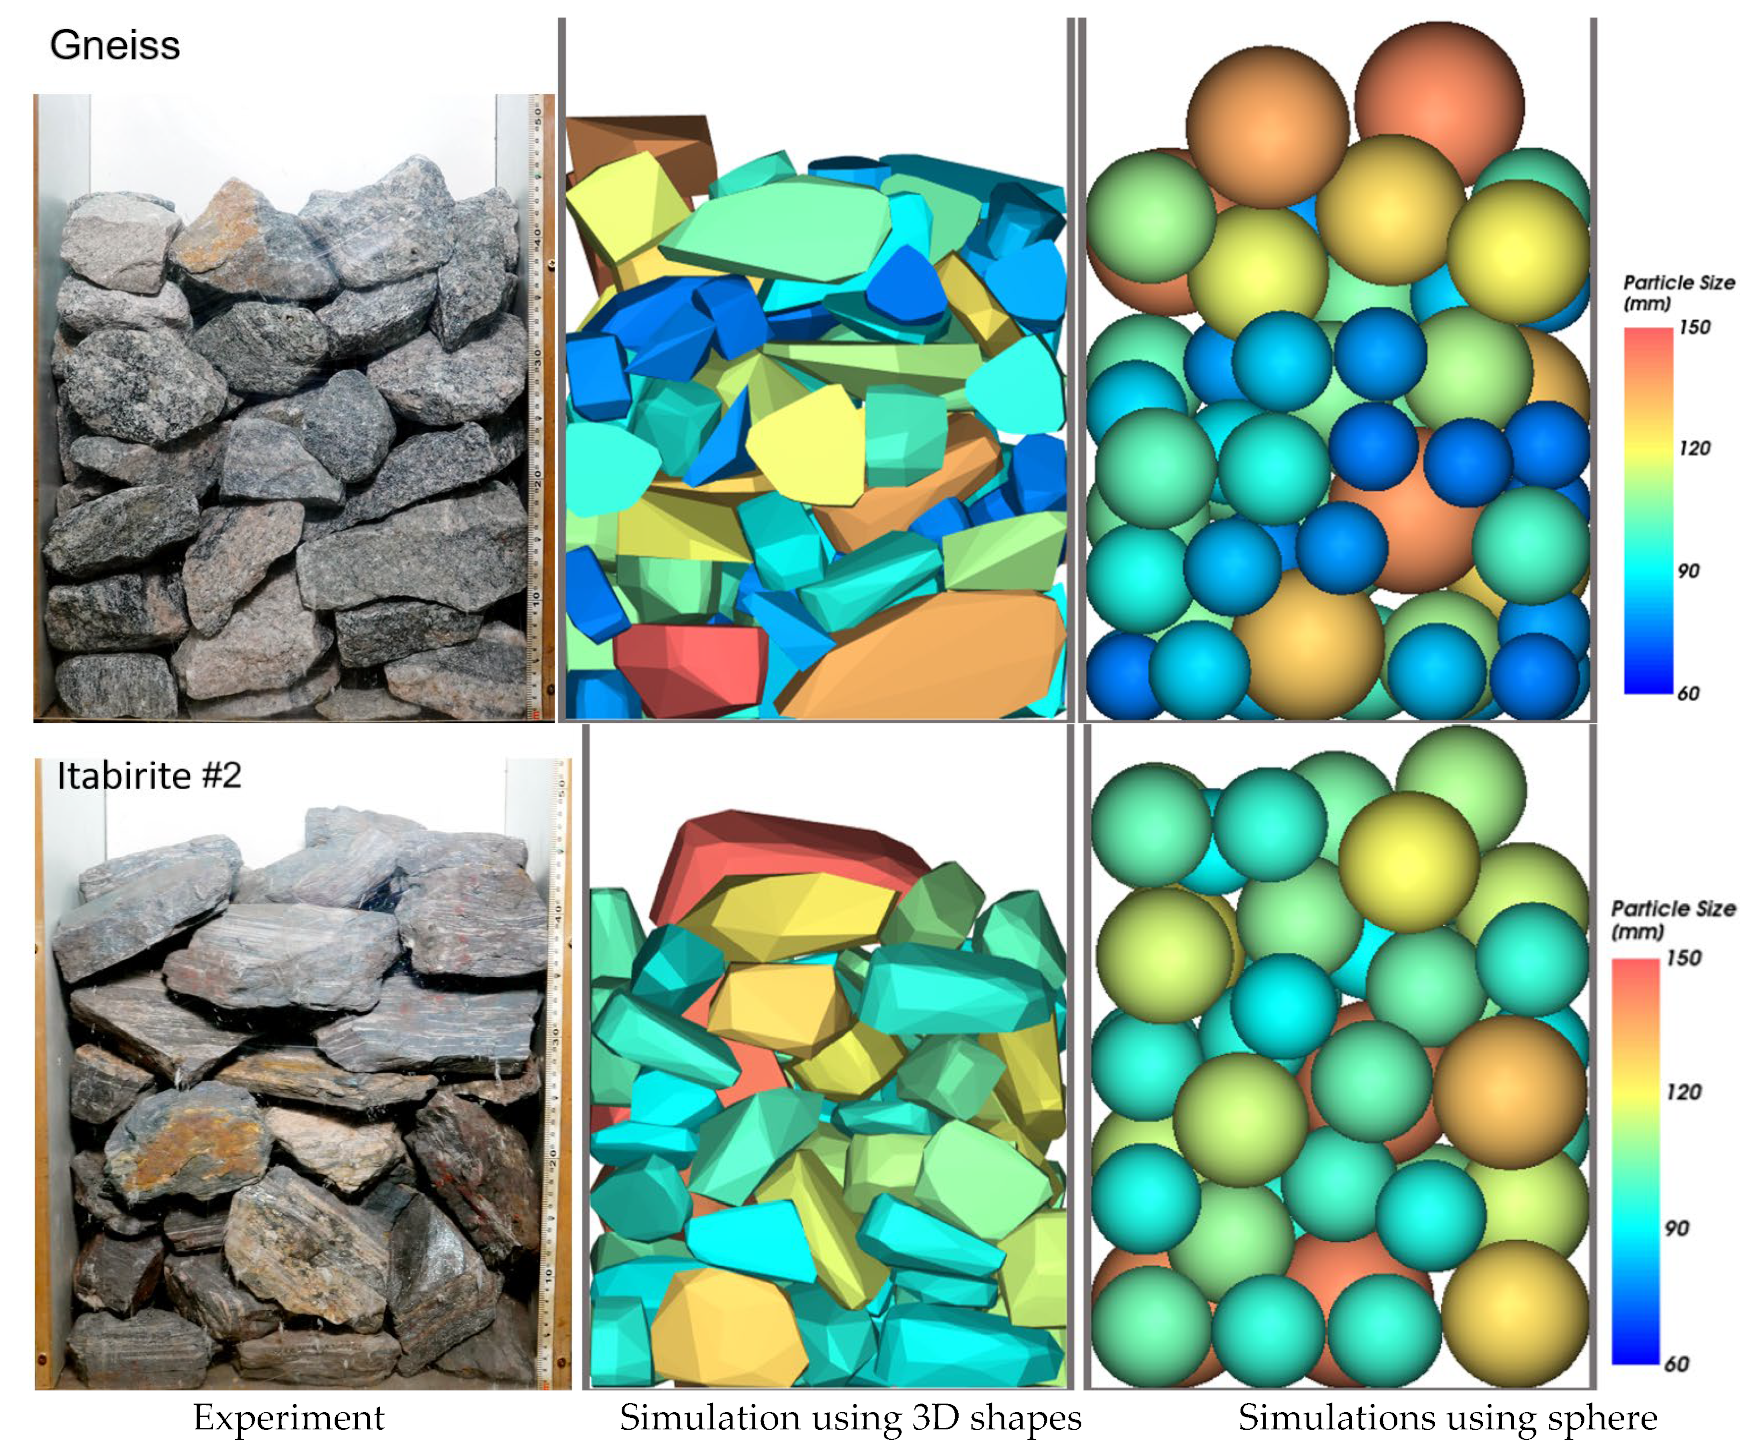
Simulations of the bulk density experiment for the gneiss and itabirite B samples were conducted with the mass distribution as a function of the aspect ratio (Figure 10), and the 3D particles-shape model library defined previously (Figure 8). Results are shown in Figure 11, whereas a summary of the results is presented in Table 8. Results from bulk density simulations for both the gneiss and itabirite #2 samples represented using the different particle shape groups were in good agreement with the experiments, although with marginally greater deviations than previously found for granulite. This demonstrates that the distributions of particle shapes represented with enough detail the particle bed compaction and the percentage of voids. On the other hand, the bed of particles simulated using spheres overestimated the particle bed height and the voidage. Simulations for the itabirite #2 sample were in good agreement with the experiment, in spite of its wider range of aspect ratios (Figure 10).
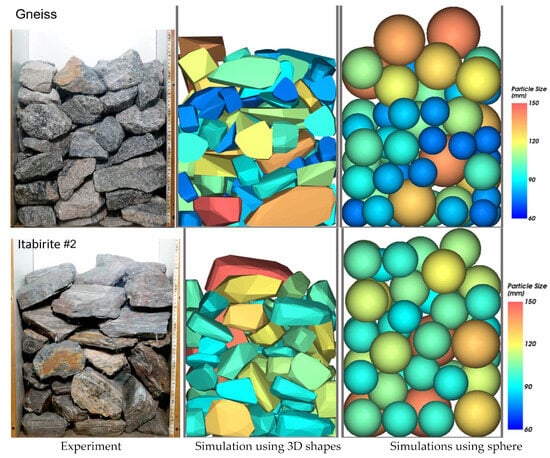
Figure 11.
Picture of the bulk density experiment (left) and Rocky DEM simulations using the 3D particle-shapes library (center), and spheres (right) for gneiss (top) and itabirite #2 (bottom).
Table 8.
Results of bulk density experiments compared with the DEM simulations using irregular shapes and spheres for gneiss and itabirite #2 samples.
4. Conclusions
Particle aspect ratio characterization is of relevance for product control in many fields, including mineral processing, material handling, and aggregates for construction and building. The work uses a combination of laser scanning and construction from 2D images to create a database of particle shapes suitable for DEM simulations using polyhedral particles in the simulator Rocky DEM. A total of sixteen shape classes were proposed with one meta-particle representing each of them.
Preliminary validation of the shapes modeled was carried out by comparing bulk density measurements from simulations and experiments for granulite, resulting in very good agreement between the two. Further validation was then carried out by the comparison of experiments for a gneiss rock and another itabirite sample to simulations, with good agreement between both.
The work shows that, in spite of the power and the level of detail provided by 3D laser scanning, the reconstruction of particles from 2D images through 3D modeling in CAD proves to be sufficiently good for generating particles for simulation DEM.
Supplementary Materials
The following supporting information can be downloaded at: https://www.mdpi.com/article/10.3390/min15020103/s1, 3d_shapes_library.zip. The file contents the STL files contain G1 to G16 3d particle shape models.
Author Contributions
Conceptualization, G.K.P.B. and L.M.T.; methodology, G.K.P.B., A.A.A.T. and A.P.F.; software, G.K.P.B. and A.A.A.T.; validation, G.K.P.B. and A.A.A.T.; formal analysis, G.K.P.B. and L.M.T.; investigation, A.P.F., F.d.A.C. and G.K.P.B.; resources, L.M.T.; data curation, A.P.F. and G.K.P.B.; writing—original draft preparation, G.K.P.B., A.A.A.T., F.d.A.C. and L.M.T.; writing—review and editing, G.K.P.B., A.A.A.T., F.d.A.C. and L.M.T.; visualization, G.K.P.B. and F.d.A.C.; supervision, L.M.T. and G.K.P.B.; project administration, L.M.T.; funding acquisition, L.M.T. All authors have read and agreed to the published version of the manuscript.
Funding
This research was funded by The Brazilian Council of Research (CNPq), grant numbers 313425/2021-3 and 406964/2022-0, and FAPERJ, grant number E-26/205.848/2022.
Data Availability Statement
A detailed file containing information on the different shape groups is provided as part of the Supplementary Materials.
Acknowledgments
The authors would like to thank Anglo American, Vale, Petra Agregados, and Mineração Santa Luzia for providing the samples for the study. The authors also thank Ansys for making available licenses of the software Rocky DEM.
Conflicts of Interest
The authors declare no conflicts of interest.
References
- Tavares, L.M.; André, F.P.; Potapov, A.; Maliska, C. Adapting a breakage model to discrete elements using polyhedral particles Adapting a breakage model to discrete elements using polyhedral particles. Powder Technol. 2019, 362, 208–220. [Google Scholar] [CrossRef]
- Barrios, G.K.P.; Carvalho, R.M.; Kwade, A.; Tavares, L.M. Contact parameter estimation for DEM simulation of iron ore pellet handling. Powder Technol. 2013, 248, 84–93. [Google Scholar] [CrossRef]
- Cleary, P.W.; Sawley, M.L. DEM modelling of industrial granular flows: 3D case studies and the effect of particle shape on hopper discharge. Appl. Math. Model. 2022, 26, 89–111. [Google Scholar] [CrossRef]
- Platzer, F. A DEM Model for Complex-Shaped Particles to Simulate Breakage in Large-Scale Simulations. Master’s Thesis, Montanuniversität Leoben, Leoben, Austria, 2022. [Google Scholar] [CrossRef]
- Tolomeo, M.; McDowell, G.R. Modelling real particle shape in DEM: A comparison of two methods with application to railway ballast. Int. J. Rock Mech. Min. Sci. 2022, 159, 105221. [Google Scholar] [CrossRef]
- Cnudde, V.; Boone, M.N. High-resolution X-ray computed tomography in geosciences: A review of the current technology and applications. Earth-Sci. Rev. 2013, 123, 1–17. [Google Scholar] [CrossRef]
- Siddique, A.; Godinho, J.R.A.; Sittner, J.; Pereira, L. Overcoming stereological Bias: A workflow for 3D mineral characterization of particles using X-ray micro-computed tomography. Miner. Eng. 2023, 201, 108200. [Google Scholar] [CrossRef]
- Latham, J.P.; Munjiza, A.; Garcia, X.; Xiang, J.; Guises, R. Three-dimensional particle shape acquisition and use of shape library for DEM and FEM/DEM simulation. Miner. Eng. 2008, 21, 797–805. [Google Scholar] [CrossRef]
- Kheradmandi, N.; Radenberg, M. Employing 3D laser scanner for automated morphological assessment of aggregates produced from diverse sources and by different crushing methods. Constr. Build. Mater. 2024, 448, 138034. [Google Scholar] [CrossRef]
- Ozturk, H.I.; Rashidzade, I. A photogrammetry based method for determination of 3D morphological indices of coarse aggregates. Constr. Build. Mater. 2020, 262, 120794. [Google Scholar] [CrossRef]
- Xu, M.; Wang, Y. A novel numerical algorithm for 2D and 3D modelling of recycled aggregate with different geometries. Mag. Concr. Res. 2022, 75, 556–579. [Google Scholar] [CrossRef]
- Afshar, T.; Disfani, M.M.; Arulrajah, A.; Narsilio, G.A.; Emam, S. Impact of particle shape on breakage of recycled construction and demolition aggregates. Powder Technol. 2017, 308, 1–12. [Google Scholar] [CrossRef]
- Lee, C.H.; Lee, S.J.; Shin, M. Characterization of variability in 2-dimensional particle geometry via 3D structured light scanning. Transp. Geotech. 2022, 34, 100760. [Google Scholar] [CrossRef]
- Ahmadi, A.; Larsson, S.; Wersäll, C. Scaling granular material with polygonal particles in discrete element modeling. Particuology 2023, 75, 151–164. [Google Scholar] [CrossRef]
- Mikhail, E.M.; Bethel, J.S.; McGlone, J.C. Introduction to Modern Photogrammetry; John Wiley & Sons: Hoboken, NJ, USA, 2001. [Google Scholar]
- Tavares, L.M.; Neves, P.B. Microstructure of quarry rocks and relationships to particle breakage and crushing. Int. J. Miner. Process. 2008, 87, 28–41. [Google Scholar] [CrossRef]
- Rocha, B.K.N.; Campos, T.M.; Silva, J.; Tavares, L.M. Fit-for-Purpose Model of HP500 Cone Crusher in Size Reduction of Itabirite Iron Ore. Minerals 2024, 14, 919. [Google Scholar] [CrossRef]
- Lu, M.; McDowell, G.R. The importance of modelling ballast particle shape in the discrete element method. Granul. Matter. 2007, 9, 69–80. [Google Scholar] [CrossRef]
- Coetzee, C.J. Review: Calibration of the Discrete Element Method. Powder Technol. 2017, 310, 104–142. [Google Scholar] [CrossRef]

Disclaimer/Publisher’s Note: The statements, opinions and data contained in all publications are solely those of the individual author(s) and contributor(s) and not of MDPI and/or the editor(s). MDPI and/or the editor(s) disclaim responsibility for any injury to people or property resulting from any ideas, methods, instructions or products referred to in the content. |
© 2025 by the authors. Licensee MDPI, Basel, Switzerland. This article is an open access article distributed under the terms and conditions of the Creative Commons Attribution (CC BY) license (https://creativecommons.org/licenses/by/4.0/).