Article

Recycling Copper (Cu) from Waste Automotive Printed Circuit Boards (WPCBs) After Characterization and Liberation Study by Mineral Processing Techniques

1
Department of Mining, Industrial and ICT Engineering, Universitat Politècnica de Catalunya Barcelona Tech (UPC), Av. Bases de Manresa 61-73, 08242 Manresa, Spain
2
Chemical Engineering Department, Escola d’Enginyeria de Barcelona Est (EEBE), Universitat Politècnica de Catalunya (UPC)-BarcelonaTECH, C/Eduard Maristany 10-14, Campus Diagonal-Besòs, 08930 Barcelona, Spain
3
Barcelona Research Center for Multiscale Science and Engineering, Campus Diagonal-Besòs, 08930 Barcelona, Spain
*
Author to whom correspondence should be addressed.
Minerals 2025, 15(12), 1259; https://doi.org/10.3390/min15121259
Submission received: 27 October 2025 / Revised: 20 November 2025 / Accepted: 24 November 2025 / Published: 27 November 2025

Abstract

Waste printed circuit boards (WPCBs) are one of the fastest-growing waste streams and pose a significant environmental challenge while also representing a valuable secondary resource due to their rich metal content, particularly copper (Cu). Since effective recovery of metals requires mechanical pre-treatment and advanced characterization, WPCB boards were subjected to size reduction and then characterized through X-ray fluorescence (XRF), inductively coupled plasma optical emission spectroscopy (ICP-OES), scanning electron microscopy (SEM-EDS), and mineral liberation analysis (MLA). Results indicated that copper is predominantly found in coarser particle sizes due to its ductility, while glass fibers and ceramics dominate finer fractions. Liberation studies revealed that Cu is essentially free in fine particles (<100 μm) but tends to remain locked in coarser fractions. Based on these results, gravity separation methods were employed to concentrate the copper: coarse particles (>300 μm) were treated on a shaking table, achieving a Cu recovery of 95%, while fine particles (<300 μm) were processed using a multi-gravity separator (MGS), with recoveries of 94% for 100 × 300 μm and 81.5% for <100 μm size fractions. This study presents a gravity-based separation strategy that combines shaking tables and MGS to optimize Cu recovery from automotive WPCBs. To the authors’ knowledge, the MGS application for WPCBs has received little attention, despite its strong potential for separating this type of waste. The proposed methodology enhances the concentration and purity of the metallic fraction (in this case, Cu), especially in fine particles, which are challenging to work with, while reducing environmental impacts through minimal chemical use, thereby contributing to sustainable e-waste recycling.

1. Introduction

Waste electrical and electronic equipment (WEEE) is among the fastest growing waste streams in the European Union, increasing at a rate of 3%–5% annually. Globally, it is also one of the most rapidly expanding waste streams in terms of volume and environmental impact [1,2]. Waste printed circuit boards (WPCBs) are crucial components of these electronic waste streams. Although they comprise only 3%–6% of global e-waste, these devices contain valuable recyclable materials, including plastics, glass, and metals such as copper, silver, gold, and palladium [3,4]. This makes e-waste a potential economic resource, often referred to as an “urban mine” [5,6,7,8]. The total e-waste stream is approximately 40 billion euros; WPCBs contribute over 40% of the total metal value. The potential revenue from recycling WPCBs is estimated at $21.200 per ton [1]. WPCBs have a high metal concentration, containing around 20% copper, 1000 ppm silver, 250 ppm gold, and 110 ppm palladium by mass. In contrast, an average mine yields only 0.6% copper (Cu), 215 ppm silver (Ag), 1 ppm gold (Au), and 2.7 ppm palladium (Pd). However, they contain various toxic substances, including heavy metals such as cadmium (Cd), lead (Pb), mercury (Hg), and Arsenic (As), as well as persistent organic pollutants (POPs) and brominated flame retardants (BFRs) [4,9,10]. This highlights the dual significance of waste WPCBs as a valuable secondary resource and a concern for environmental regulations. Therefore, recovering precious metals from WPCBs is economically and environmentally beneficial, as the e-waste problem remains unresolved, especially in developing countries [11,12,13].
Recycling WPCBs is not an easy process due to the varying mechanical properties of the WPCB compositions [14,15,16]. Pre-treatment methods, such as mechanical processing and dismantling, not only help to address this challenge by reducing impurities but also reduce the reagent consumption during recycling [3,9,17,18]. Processes such as impact, compression, shearing, stretching, tearing, and bending apply energy to modify materials, resulting in reduced particle sizes, morphological changes, exfoliation, or phase transformations. These changes enhance the effectiveness of hydrometallurgical and bio-metallurgical treatments [19,20]. So, optimizing WPCB communication strategies is essential and aligns with the United Nations’ Sustainable Development Goals (SDGs), particularly SDG 12—Responsible Production and Consumption. Enhancing physical separation methods for WPCB recycling promotes sustainability by conserving resources, improving infrastructure, and benefiting human health and environmental quality [6,21,22,23].
Another main challenge in WPCB recycling is proper characterization of their composition, distribution, and composition liberation, as WPCBs are heterogeneous [5]. They can contain up to 60 different elements, consisting of approximately 40% metals—including copper (Cu), lead (Pb), nickel (Ni), silver (Ag), platinum (Pt), and gold (Au)—along with 30% plastics and 30% ceramics [9,24]. Various characterization methods have been explored, like acid digestion [25,26]. However, X-ray fluorescence (XRF) is also widely used due to its non-destructive nature, speed, and ease of particle manipulation [25,27,28]. Additionally, imaging techniques such as microscopy and scanning electron microscopy (SEM) aid in analyzing particle distribution and liberation [26,29,30].
In the mineral industry, image analysis has shifted towards automated procedures lately, using automated analyzers coupled with electron microscopes, such as MLA and QEMSCAN, to study composition liberation. MLA stands out as an invaluable tool for qualitative and quantitative characterization, including composition associations, particle size, and composition liberation. This system was developed to analyze the liberation of compositions and has attracted significant attention from both industry and academia. However, it is used for determining the degree of liberation of mechanically processed PCB particles and for compositional characterization of complex electronic waste, such as batteries [5,29,31,32].
Other techniques, such as Quantitative Evaluation of Materials by Scanning Electron Microscopy (QEMSCAN), Automated Material Identification and Classification System (AMICS), Tescan Integrated Mineralogical Analyzer (TIMA), and X-ray microtomography (µCT), also provide valuable insights to analyze the degree of liberation of a composition [31,33]. These non-destructive characterization methods, and their use to understand the association of metals/non-metals across different size fractions, demonstrate their importance for characterizing electronic waste. Therefore, accurate characterization is crucial for quantifying metals and non-metals in extraction processes, assessing losses, determining extraction yield, optimizing recovery efficiency, and evaluating the feasibility of large-scale implementation [34,35].
Although various mineral processing techniques, including magnetic and electrostatic separation, column air classification, flotation, and gravity-based methods such as jigging, tabling, falcon concentrator, sink–float separation, etc., have been employed to extract metals from the crushed WPCBs due to the effective minimization of the air pollution while enhancing metal recovery, none of them mentioned the capacity of the multi-gravity separator (MGS) technique usage to recover Cu from automotive WPCBs, with a focus on fine particles [3,11,21,26,30,36,37,38,39,40,41,42,43,44,45]. Gravity concentration methods, renowned for their environmental friendliness (no chemical reagents required and no further heating needed), low capital, and operating costs, are widely used as a pre-treatment step in WPCB recycling. It should be noted that it is one of the oldest methods for separating compositions based on differences in specific gravity. Thus, since metals and non-metals (NMF) existing in the crushed WPCBs exhibit significant differences in specific gravity, this makes the low-cost gravity separation methods, such as tabling [9,36,46] or MGS, a viable option for separating heavy metal particles from relatively lighter plastic and ceramic particles [36,47].
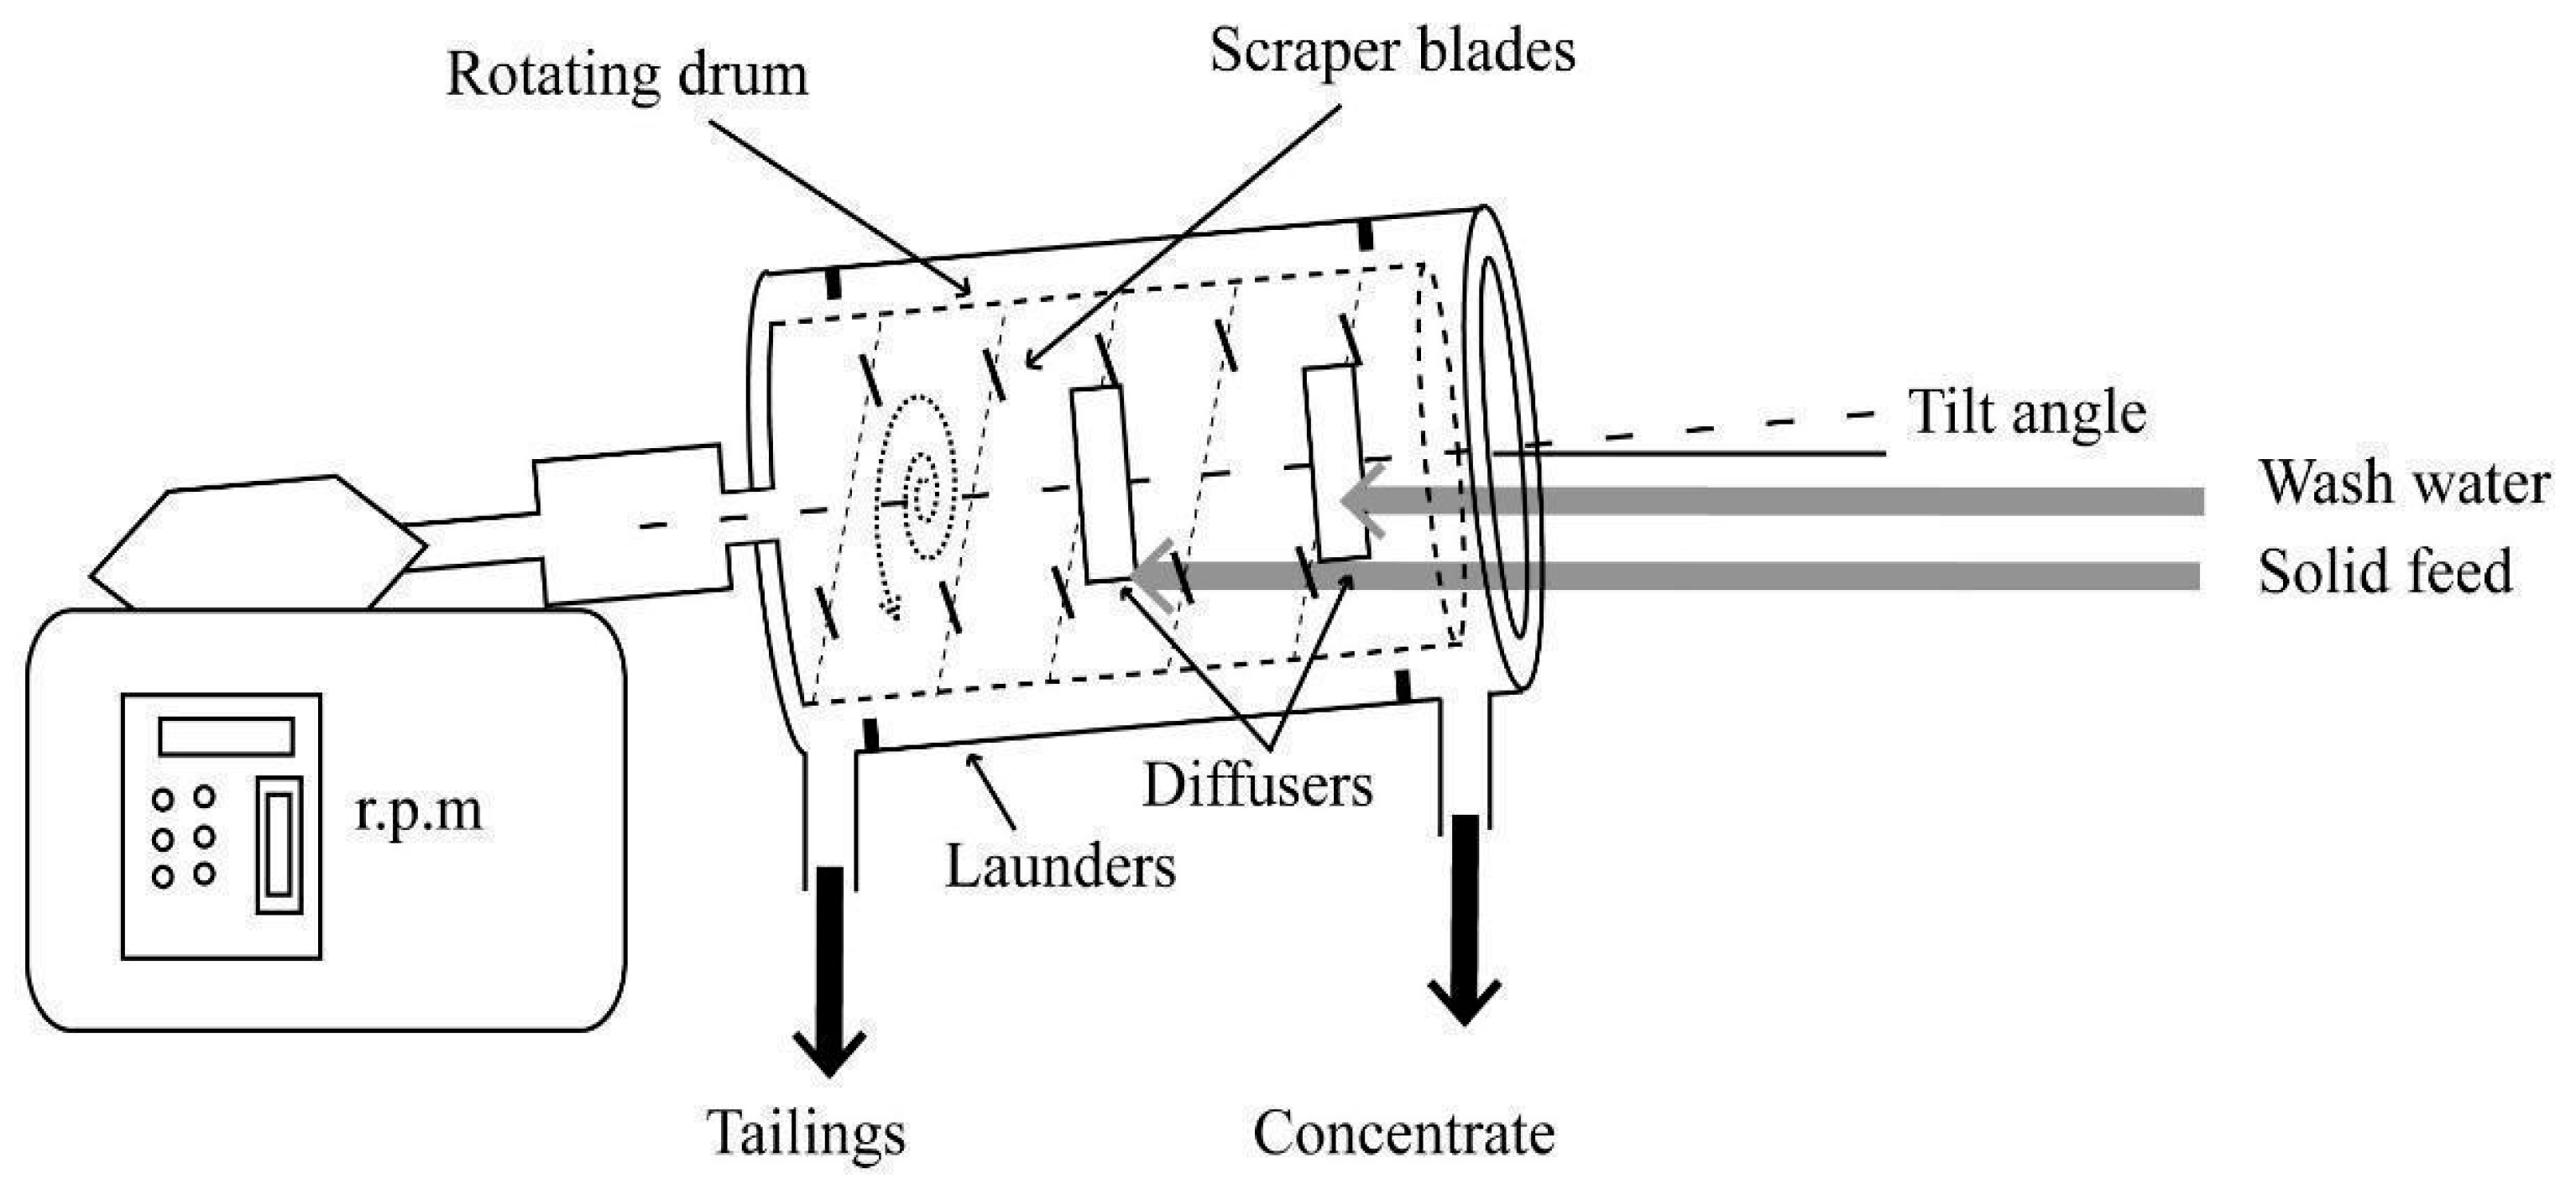
The MGS operates on principles similar to a shaking table but utilizes rotational motion to generate centrifugal forces stronger than gravity. This enhanced force enables more efficient separation, especially at finer particle sizes [48]. MGS is an advanced gravity concentration technique that combines centrifugal acceleration with the forces acting on a conventional shaking table to concentrate materials. The separation chamber of the MGS consists of a cylindrical drum with a to-and-fro shaking mechanism. With the front end elevated, the inclined drum allows the material to flow towards the opposite end, rotated at a specific speed, generating centrifugal forces on the particles. Due to their higher settling rates, heavier particles form initial layers on the drum surface, while lighter particles overlay them. At this point, the material bed inside the drum contains successive layers, with heavier particles in the innermost positions and lighter ones on top. Fresh water is continuously sprayed onto the settled bed at the front of the drum, facilitating the flowing film concentration. The outer layers of the lighter materials are selectively washed and collected in the tailings launder at the back end of the drum. The heavier material bed, along with any entrapped coarser and lighter particles, is scraped toward the front end by a rotating spiral scraper mechanism. During this scrapping process, wash water helps further separate the heavy material bed, ensuring that the coarser and lighter materials are washed into the tailings before the heavy materials are discharged into the front-end launder. The combined forces acting on the MGS drum allow for repeated concentrations of materials based on their differential specific gravity before the products are discharged. This study aimed to exploit the specific gravity differences between copper-bearing materials and gangue for efficient separation in the MGS process [49].
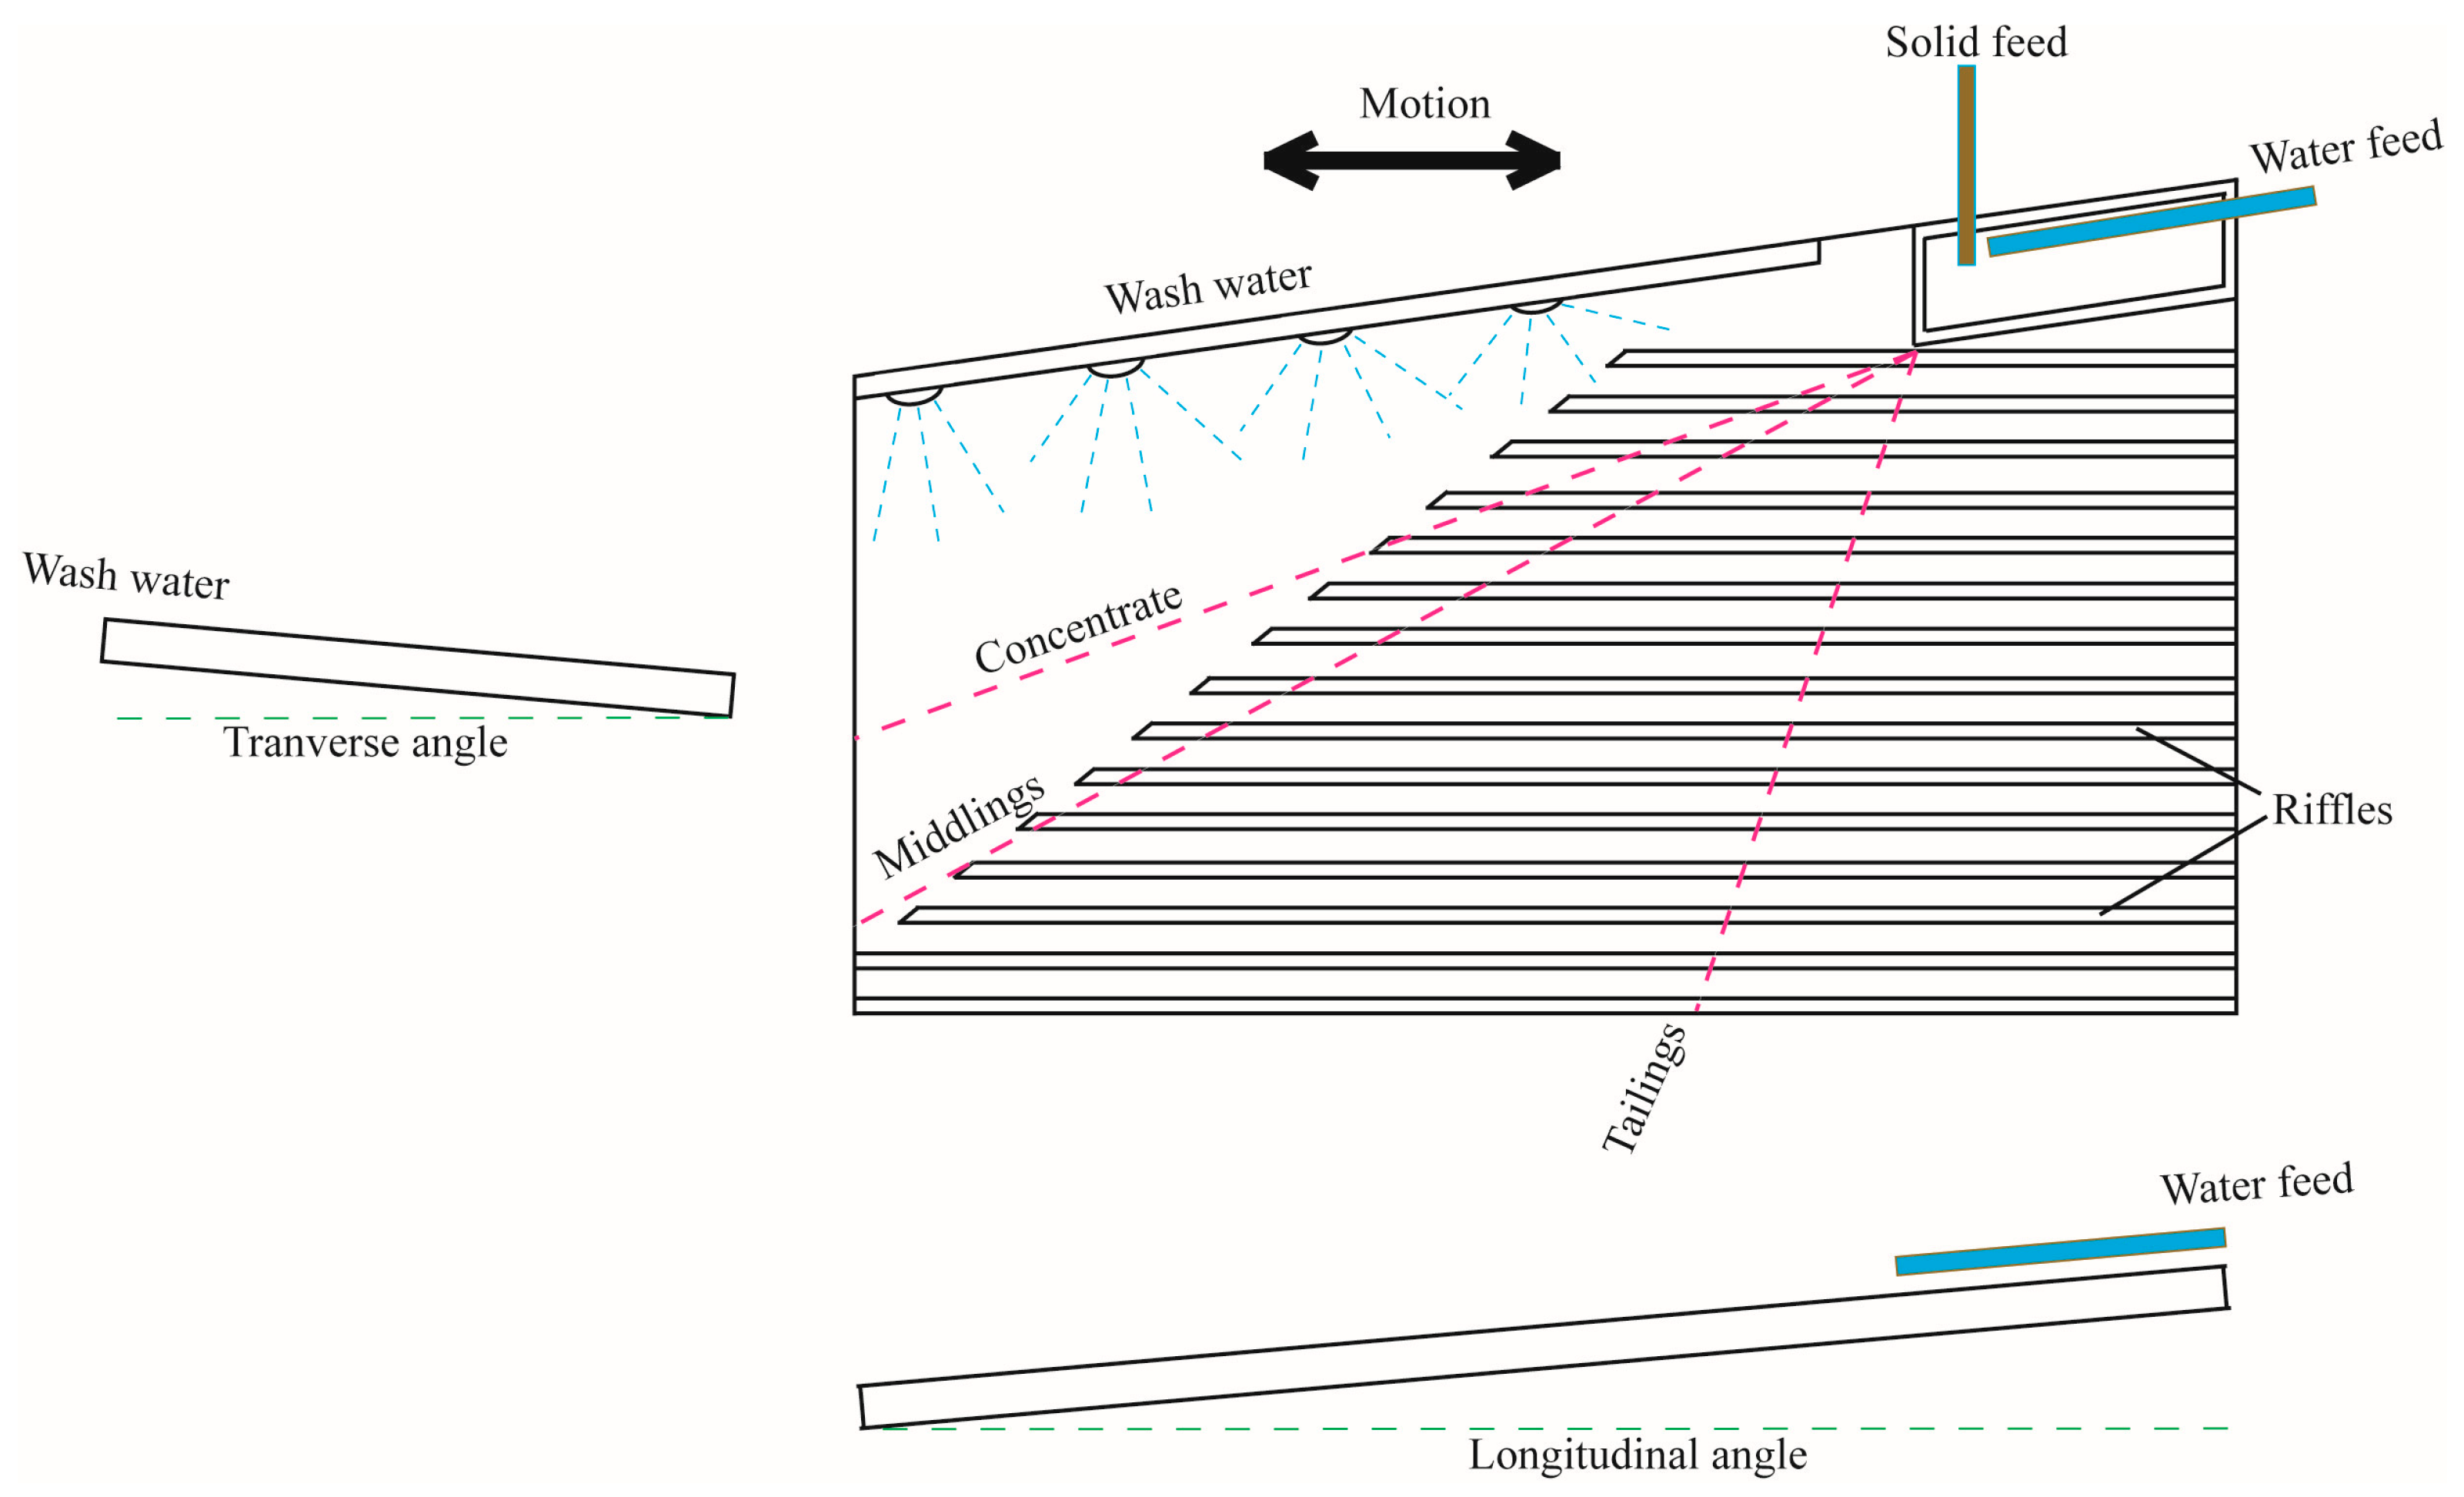
The shaking tables consist of a sloping deck with a riffled surface. A motor powers a small arm that shakes the table along its length, parallel to the riffle and rifle pattern. This longitudinal shaking motion includes a slow forward stroke and a rapid return strike. The riffles are arranged in such a manner that heavy material is trapped and conveyed parallel to the direction of the oscillation. Water is added to the top of the table perpendicular to the table’s motion. The heaviest and coarsest particles are collected at the end of the table, while the lightest and finest particles wash over the riffles and to the bottom edge. Between these two extremes, particles of medium size and density—known as middlings—are also separated. The process sorts materials into concentrate, middlings, and waste based on the difference in the specific density of the grains. Shaking tables are widely used in mineral processing to concentrate different metal ores and coal preparation. It is also used for the cost-effective recovery of metals from crushed WPCBs. These devices are often used downstream of other gravity concentration equipment, such as Reichert spirals, jigs, and centrifugal gravity concentrators, for final cleaning before refining or the sale of the product [50,51,52,53].
This study aims to propose a process combining two gravity concentration methods —shaking table and MGS—with high cut efficiency in terms of mass recovery and metal content in the final products. According to the literature review, the MGS, as a gravity separation method, has received no attention, to the authors’ knowledge, despite its strong separation potential and compatibility for recovering fine Cu particles from automotive WPCBs, which is often a limit for the other separation methods. MGS, with the combined effects of rotation and pulsation, produces cleaner separation boundaries, higher-purity metal concentrates, and non-metal tails with fewer contaminants. So, this means less need for downstream hydrometallurgical refining. In addition, water use is efficient as thin-film flow requires relatively little water. Moreover, most of the work focused on coarse particles (>300 μm). In contrast, this study focused on MGS to physically recover Cu from fine particles (<300 μm), which can substitute for the concentration in subsequent steps, such as hydrometallurgical, pyrometallurgical, and bio-metallurgical treatments, which mainly concentrate the metals. Those are not environmentally friendly and slower, respectively. Moreover, by maximizing the Cu recovery physically as a preconcentration, the subsequent efficiency of the further processes, like pyrometallurgical and hydrometallurgical processes, will be improved. Finally, a green process flowsheet was proposed to enrich the copper content in WPCBs, utilizing a shaking table and MGS.

2. Materials and Methods

2.1. Materials

In this study, automotive WPCB boards were selected after manual disassembly of electronic components (such as resistors, capacitors, diodes, transistors, connectors, and chips) and cutting them into small pieces with simple workshop tools like a hammer, mallet, standard pliers, and bolt cutter to reduce material variability and simplify the crushing process.

2.2. Methodology

2.2.1. Comminution

Simple workshop tools were used to disassemble the components from the boards. Then, a knife crusher with adjustable knife spacing (0.15–0.2 cm) was used to control the size reduction of the samples. In addition, a Kenwood Easy Chop Chopper (0.5 L container, two speeds, four blades, 500 W) was used to crush the samples to finer particle sizes. Samples with particles smaller than 1.18 mm were characterized and subjected to liberation analysis, while larger particles were reprocessed through additional crushing until all materials were reduced to below 1.18 mm, and then they proceeded to the separation steps (Figure 1). The quartering technique was applied to ensure representative sampling in subsequent analyses.

2.2.2. Characterization and Liberation Study

Various characterization techniques were employed to analyze the resulting WPCB powder. The process began with size distribution analysis using 1180, 500, 250, and 100 μm sieves. Then, to characterize the chemical composition, semiquantitative X-ray fluorescence (XRF) analysis was performed using the Epsilon 1 model from Malvern Panalytical (Malvern, The Netherlands) to determine the metal content in the WPCB powder. For XRF analysis, powder samples were analyzed, and the compositions were defined as elements and oxides in the program created for WPCBs. The study was carried out with three repetitions to ensure the accuracy of the results. For the quantitative identification of precious metals, samples were digested in a microwave using an aqua regia solution (3:1 volume ratio of hydrochloric acid (37% pure) to nitric acid (67% pure)). The digested solution was then analyzed using inductively coupled plasma optical emission spectroscopy (ICP-OES) with the 5100 ICP-OES model from Agilent Technologies (Santa Clara, CA, USA).
At the end, the morphological and compositional distributions of the powder were analyzed using optical microscopy and scanning electron microscopy (SEM) with energy-dispersive spectroscopy (EDS). These analyses were conducted using a field emission scanning electron microscope (FESEM) (JEOL JSM 7001F-JEOL LTD Chome-1-2, Tokyo, Japan) paired with an energy-dispersive spectrometer (EDS; Oxford X-Max, 20 mm2 window, Oxford Instruments Abingdon OX13 5QX, Oxford, UK) for qualitative assessment. To study the degree of liberation, mineral liberation analysis (MLA) is used at the SEM-MLA facility at Memorial University of Newfoundland (St. John’s, NL, Canada). The study used FEI MLA 650FEG equipment to assess composition associations quantitatively, composition locking, and particle shape factors, all of which are crucial for subsequent separation processes.

2.2.3. Separation

Based on the WPCB compositions’ liberation degree and density, a Holman–Wilfley Ltd. (Redruth, Cornwall, UK) shaking table was used for coarse particles > 300 μm (300 × 1180 μm). In comparison, an MGS was selected for fine particles < 300 μm to separate copper from non-metallic materials. The feed is divided into two particle size ranges for MGS tests: 100 × 300 μm and <100 μm.
The shaking table begins with a 20%–25% mass pulp fed from the feed box, moving along the table with wash water. Due to the vibrating mechanism, particles undergo diagonal movement, where size and density differences determine their separation. The process involves a slow forward stroke and a rapid return, ultimately collecting small, dense particles at the left end of the table. In contrast, larger, lighter particles are collected opposite the feed box. Figure 2 illustrates the cross-section of the shaking table. The Wilfley model shaking table can effectively separate metal and plastic materials within a 100 μm to 1000 μm particle size range [36]. In this study, the process was applied to materials within the 300 × 1180 μm particle size range. Four key factors, process water flow rate (L/m), wash water flow rate (L/m), deck angle (°), and motion frequency (Hz), influencing the copper recovery of the concentrate, middlings, and tailings were evaluated. Process water flow rate between 4 and 8 (L/m); wash water flow rate between 4 and 12 (L/m); deck angle from 2 to 5 (°); and motion frequency 50–60 (Hz) were tested. To facilitate separation, gutters were placed in the concentrate collection and tailings discharge areas with partitions to separate the collected products. After separation, the collected fractions were filtered and dried at 90 °C in an oven. The final products were classified into a heavy fraction (copper concentrate), middlings (copper and plastic), and a light fraction (plastic).
The MGS setup used in this study includes a feed tank equipped with a stirrer, a peristaltic pump for delivering feed to a pilot-scale MGS unit, and sample containers for collecting concentrate and tailings samples. Figure 3 presents a cross-sectional view of the MGS. Solids and water were combined in measured proportions to achieve a solids consistency of 20%–25% by weight in the feed tank. Three factors of water flow rate (L/m), movement frequency (strokes/min), and longitudinal slope angle (°) were studied to reach the highest Cu recovery. Water flow rates of 0.5–2 L/min, movement frequencies of 200–300 strokes/min, and longitudinal slope angles of 3°–5° were examined. During operation, the feed slurry, consisting of WPCB particles smaller than 300 μm, was continuously pumped into the drum steadily, ensuring the top-size-to-small-size ratio remained below 20%. Samples from the concentrate and tailings streams were collected under steady-state conditions and reached after 5 min of operation. These samples were filtered, dried, and analyzed for total copper content.

3. Results and Discussion

3.1. Sample Preparation

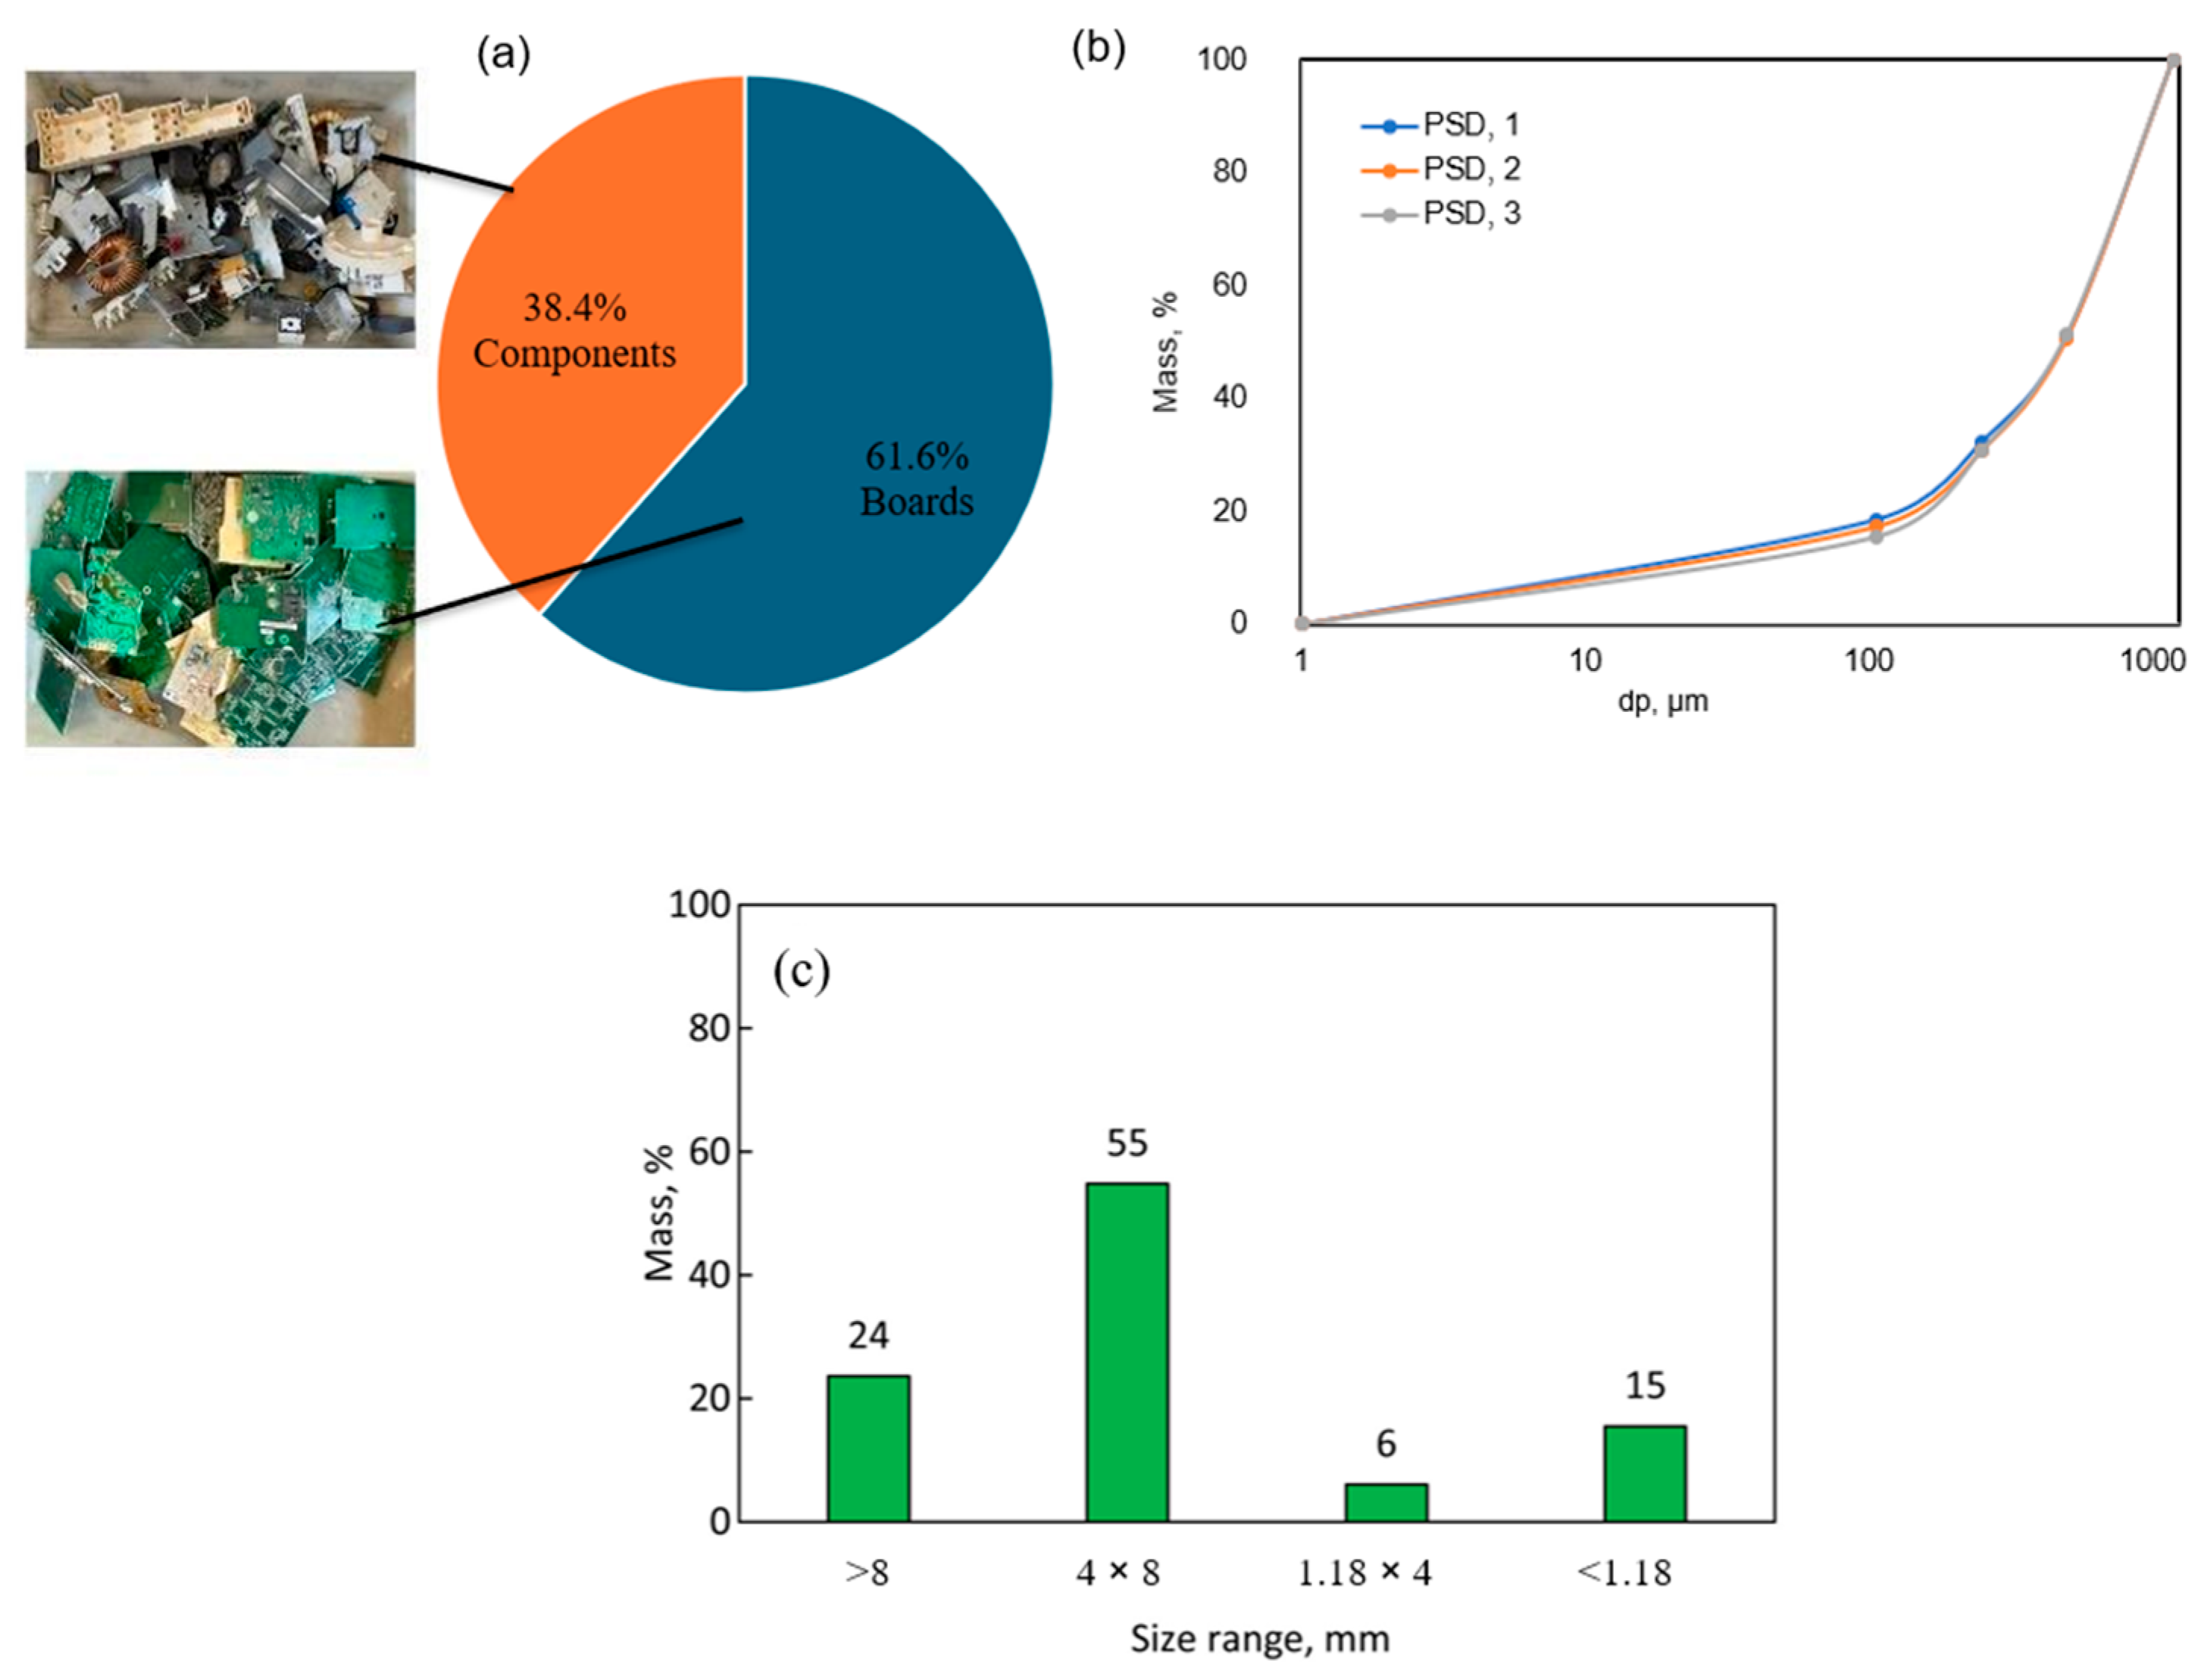
After disassembling the WPCBs, the mass balance indicated that approximately 61.6% of the WPCBs consist of boards, while the remaining 38.4% are components (Figure 4a). This breakdown is crucial for recovery and recycling, indicating that most WPCBs are boards [54].
Then, the boards resulting from this disassembling proceeded to the crushing step. Since the Easy Chop Chopper crusher was found to be ineffective for crushing WPCBs, the crushing process continued with the knife crusher until all samples were reduced to particles smaller than 1.18 mm. Figure 4c. shows the results of the Easy Chop Chopper crusher. As shown in the results, it produced coarser (˃8 mm, 24%) and medium-sized fragments (8–4 mm, 55%).
The particle size distribution (PSD) of the crushed materials was determined to analyze the crushing process using sieves of 1180, 500, 250, and 100 μm. Figure 4b shows the results of the PSD analysis of the crushing processes, with three repetitions. The steep rise in larger particle sizes suggests that most of the material mass is concentrated in the larger particle fractions, approximately 67.6% of the particles were larger than 250 μm. In comparison, 32.3% were smaller than 250 μm. As less fine material was produced, it can be concluded that the comminution process was environmentally friendly.

3.2. Characterization

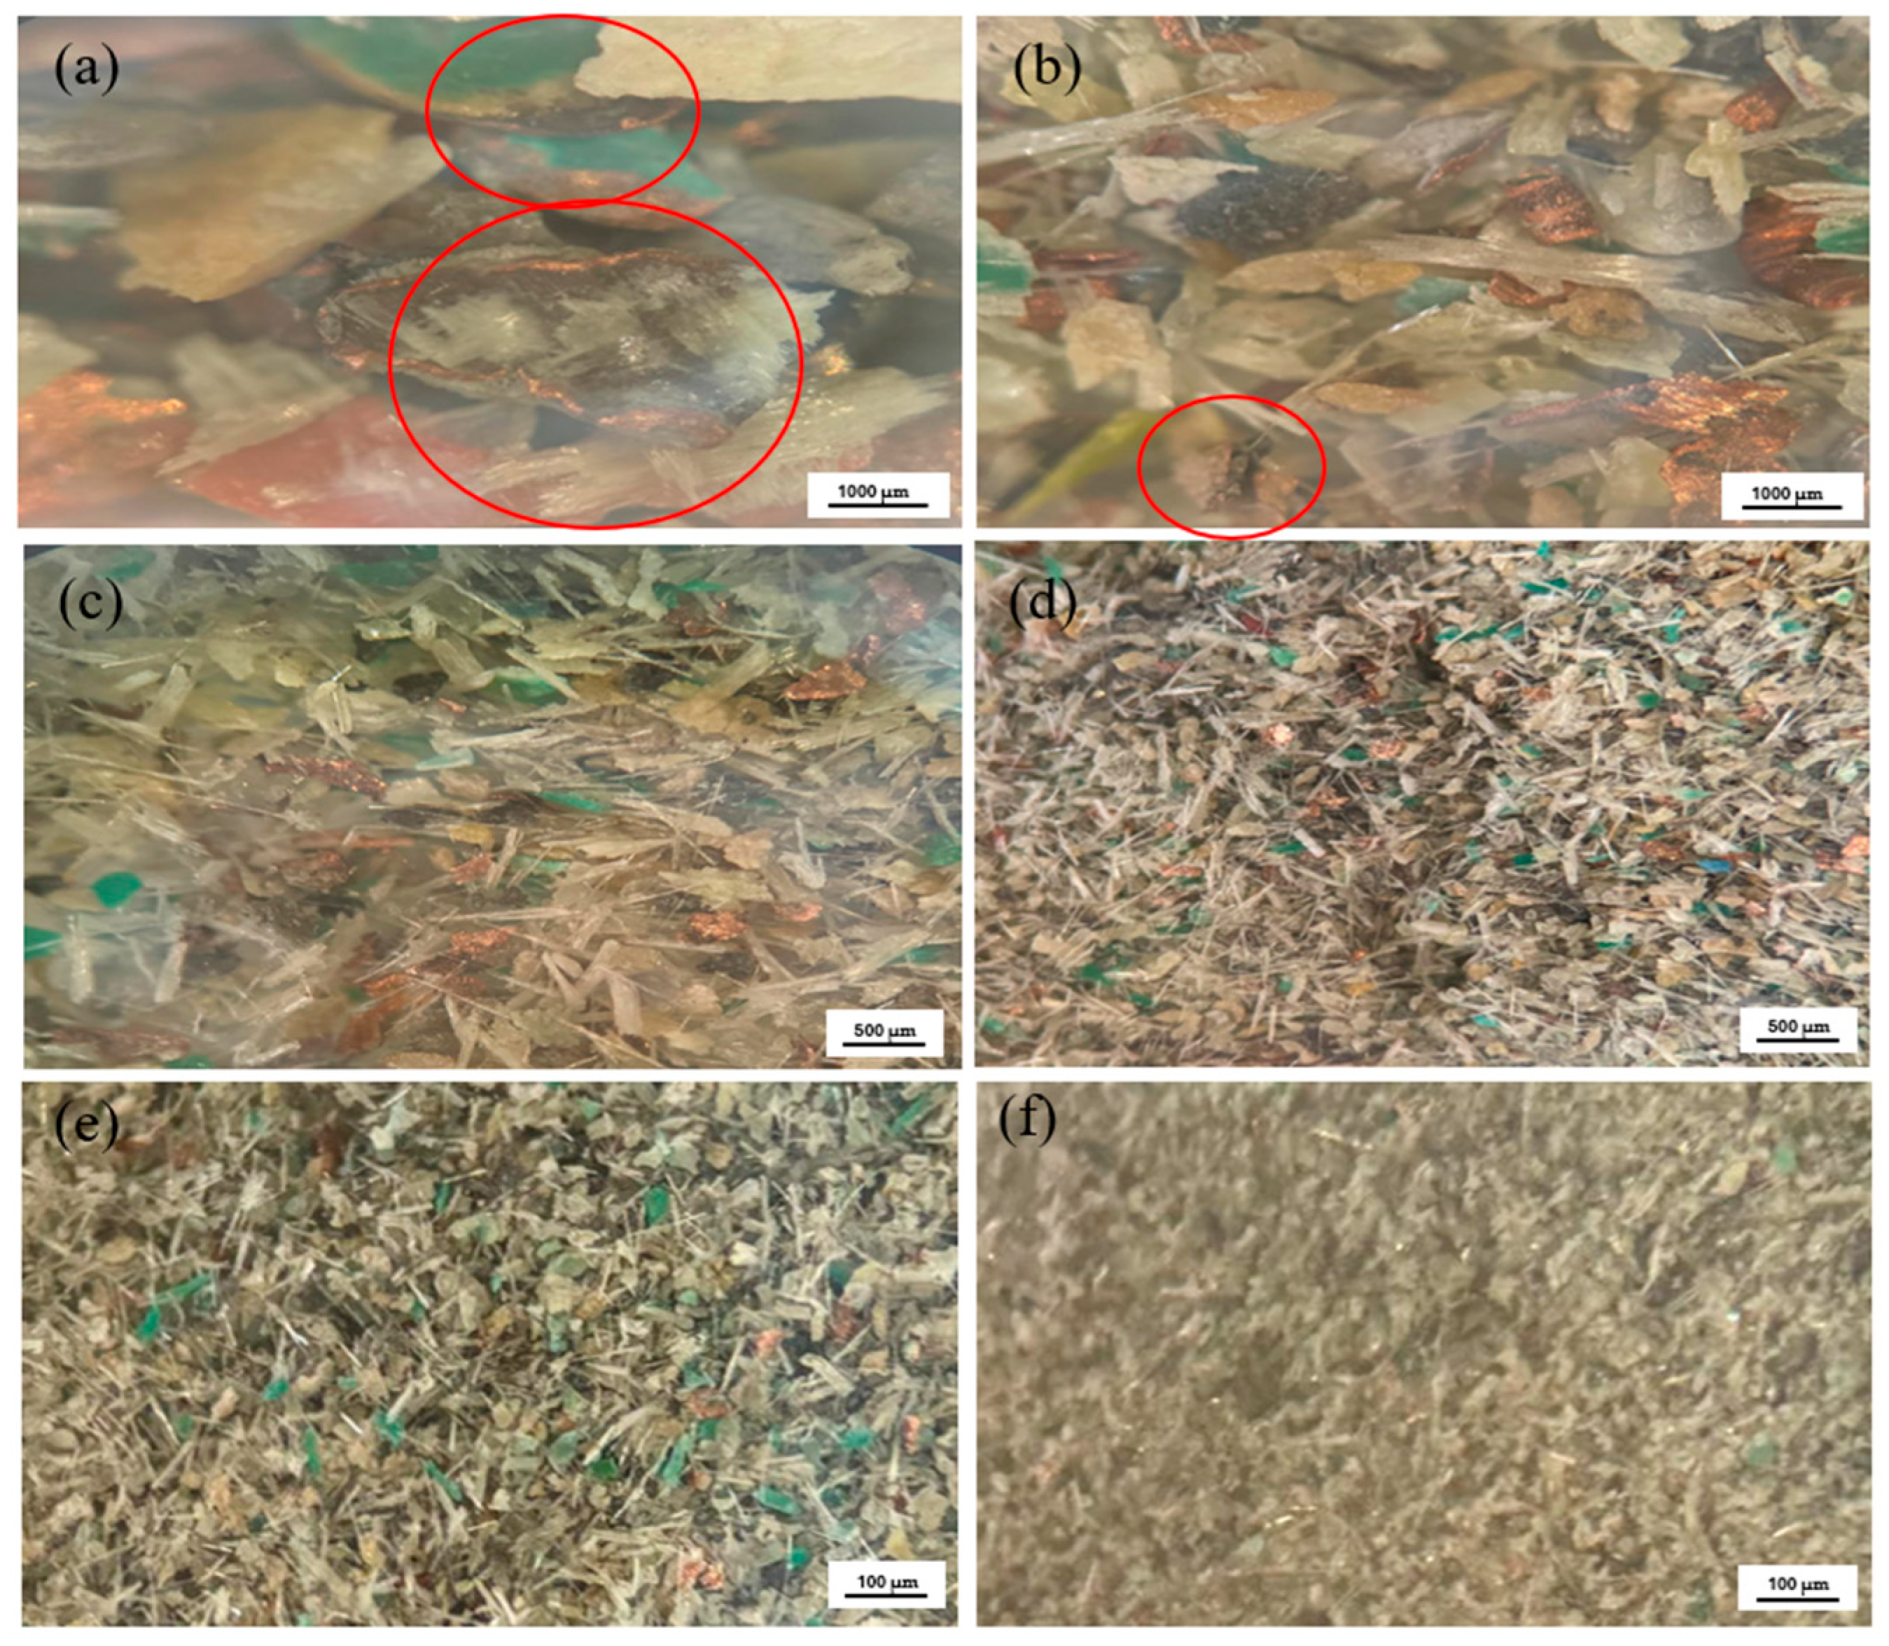
During crushing, the classified sample was examined in the laboratory under an optical microscope without reflected light to analyze each size class. The results revealed that the finest size (−63 μm) could not be observed with the optical microscope without reflected light (Figure 5f). However, as the particle size range increases, the resolution improves (Figure 5e,d). In coarser size classes (100 × 150 μm and 150 × 250 μm), no visible interlocking was detected (Figure 5c,d), although in the 250 × 500 μm and 500 × 1180 μm size fractions, numerous recognizable clusters were observed, highlighted by red circles (Figure 5a,b). These clusters consist of interconnected materials, likely due to metal pins coated with other metals or metal bundles compressed with adhesive [6].
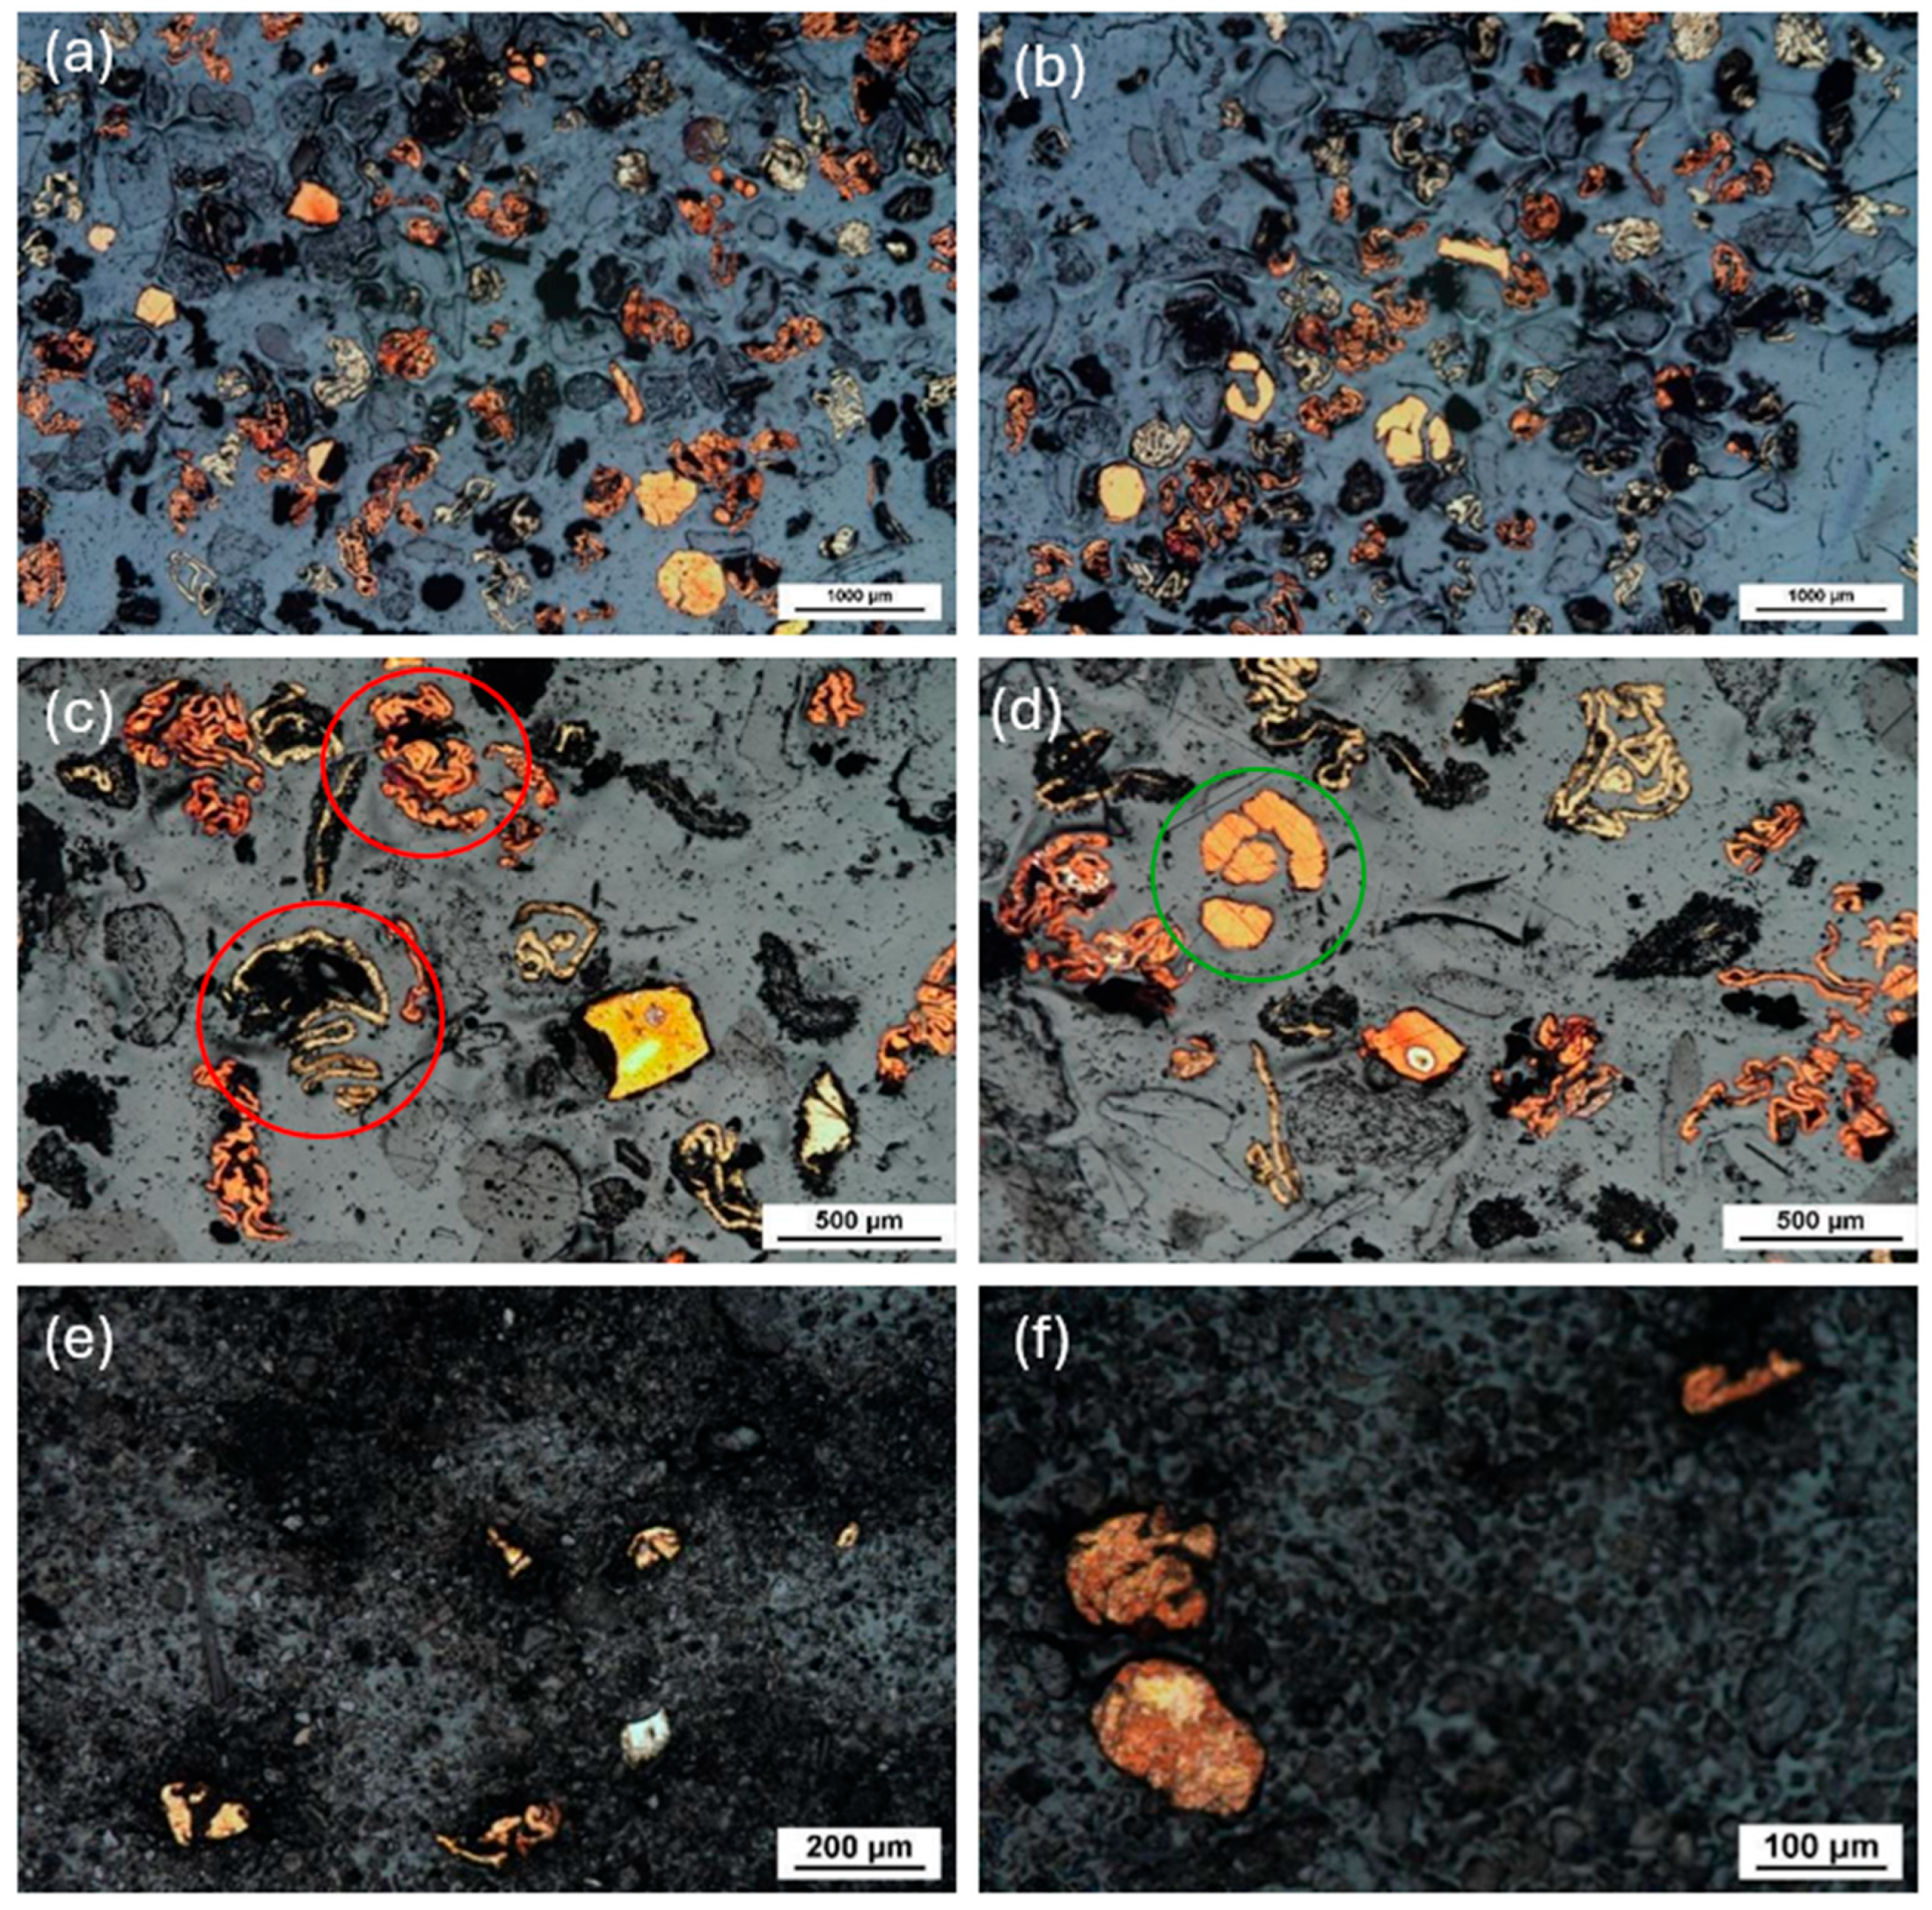
Then, WPCB powder was examined under a microscope with reflected light to compare with the results from optical microscopy without light. The results from the optical microscope with reflected light reveal remarkable images (Figure 6). Non-metallic components, such as glass fibers and ceramics, did not transmit light, so they appeared black or gray, whereas metals reflected light, making them colorful and shiny. It is evident that depending on the type of metal, the reflected color varies; for example, the orange color is associated with copper particles. Moreover, unlocked metals and locked metals containing non-metal particles are clearly visible in this Figure. In Figure 6c,d, the red circles indicate locked metal with non-metal particles, while the green circle marks a free metal particle.
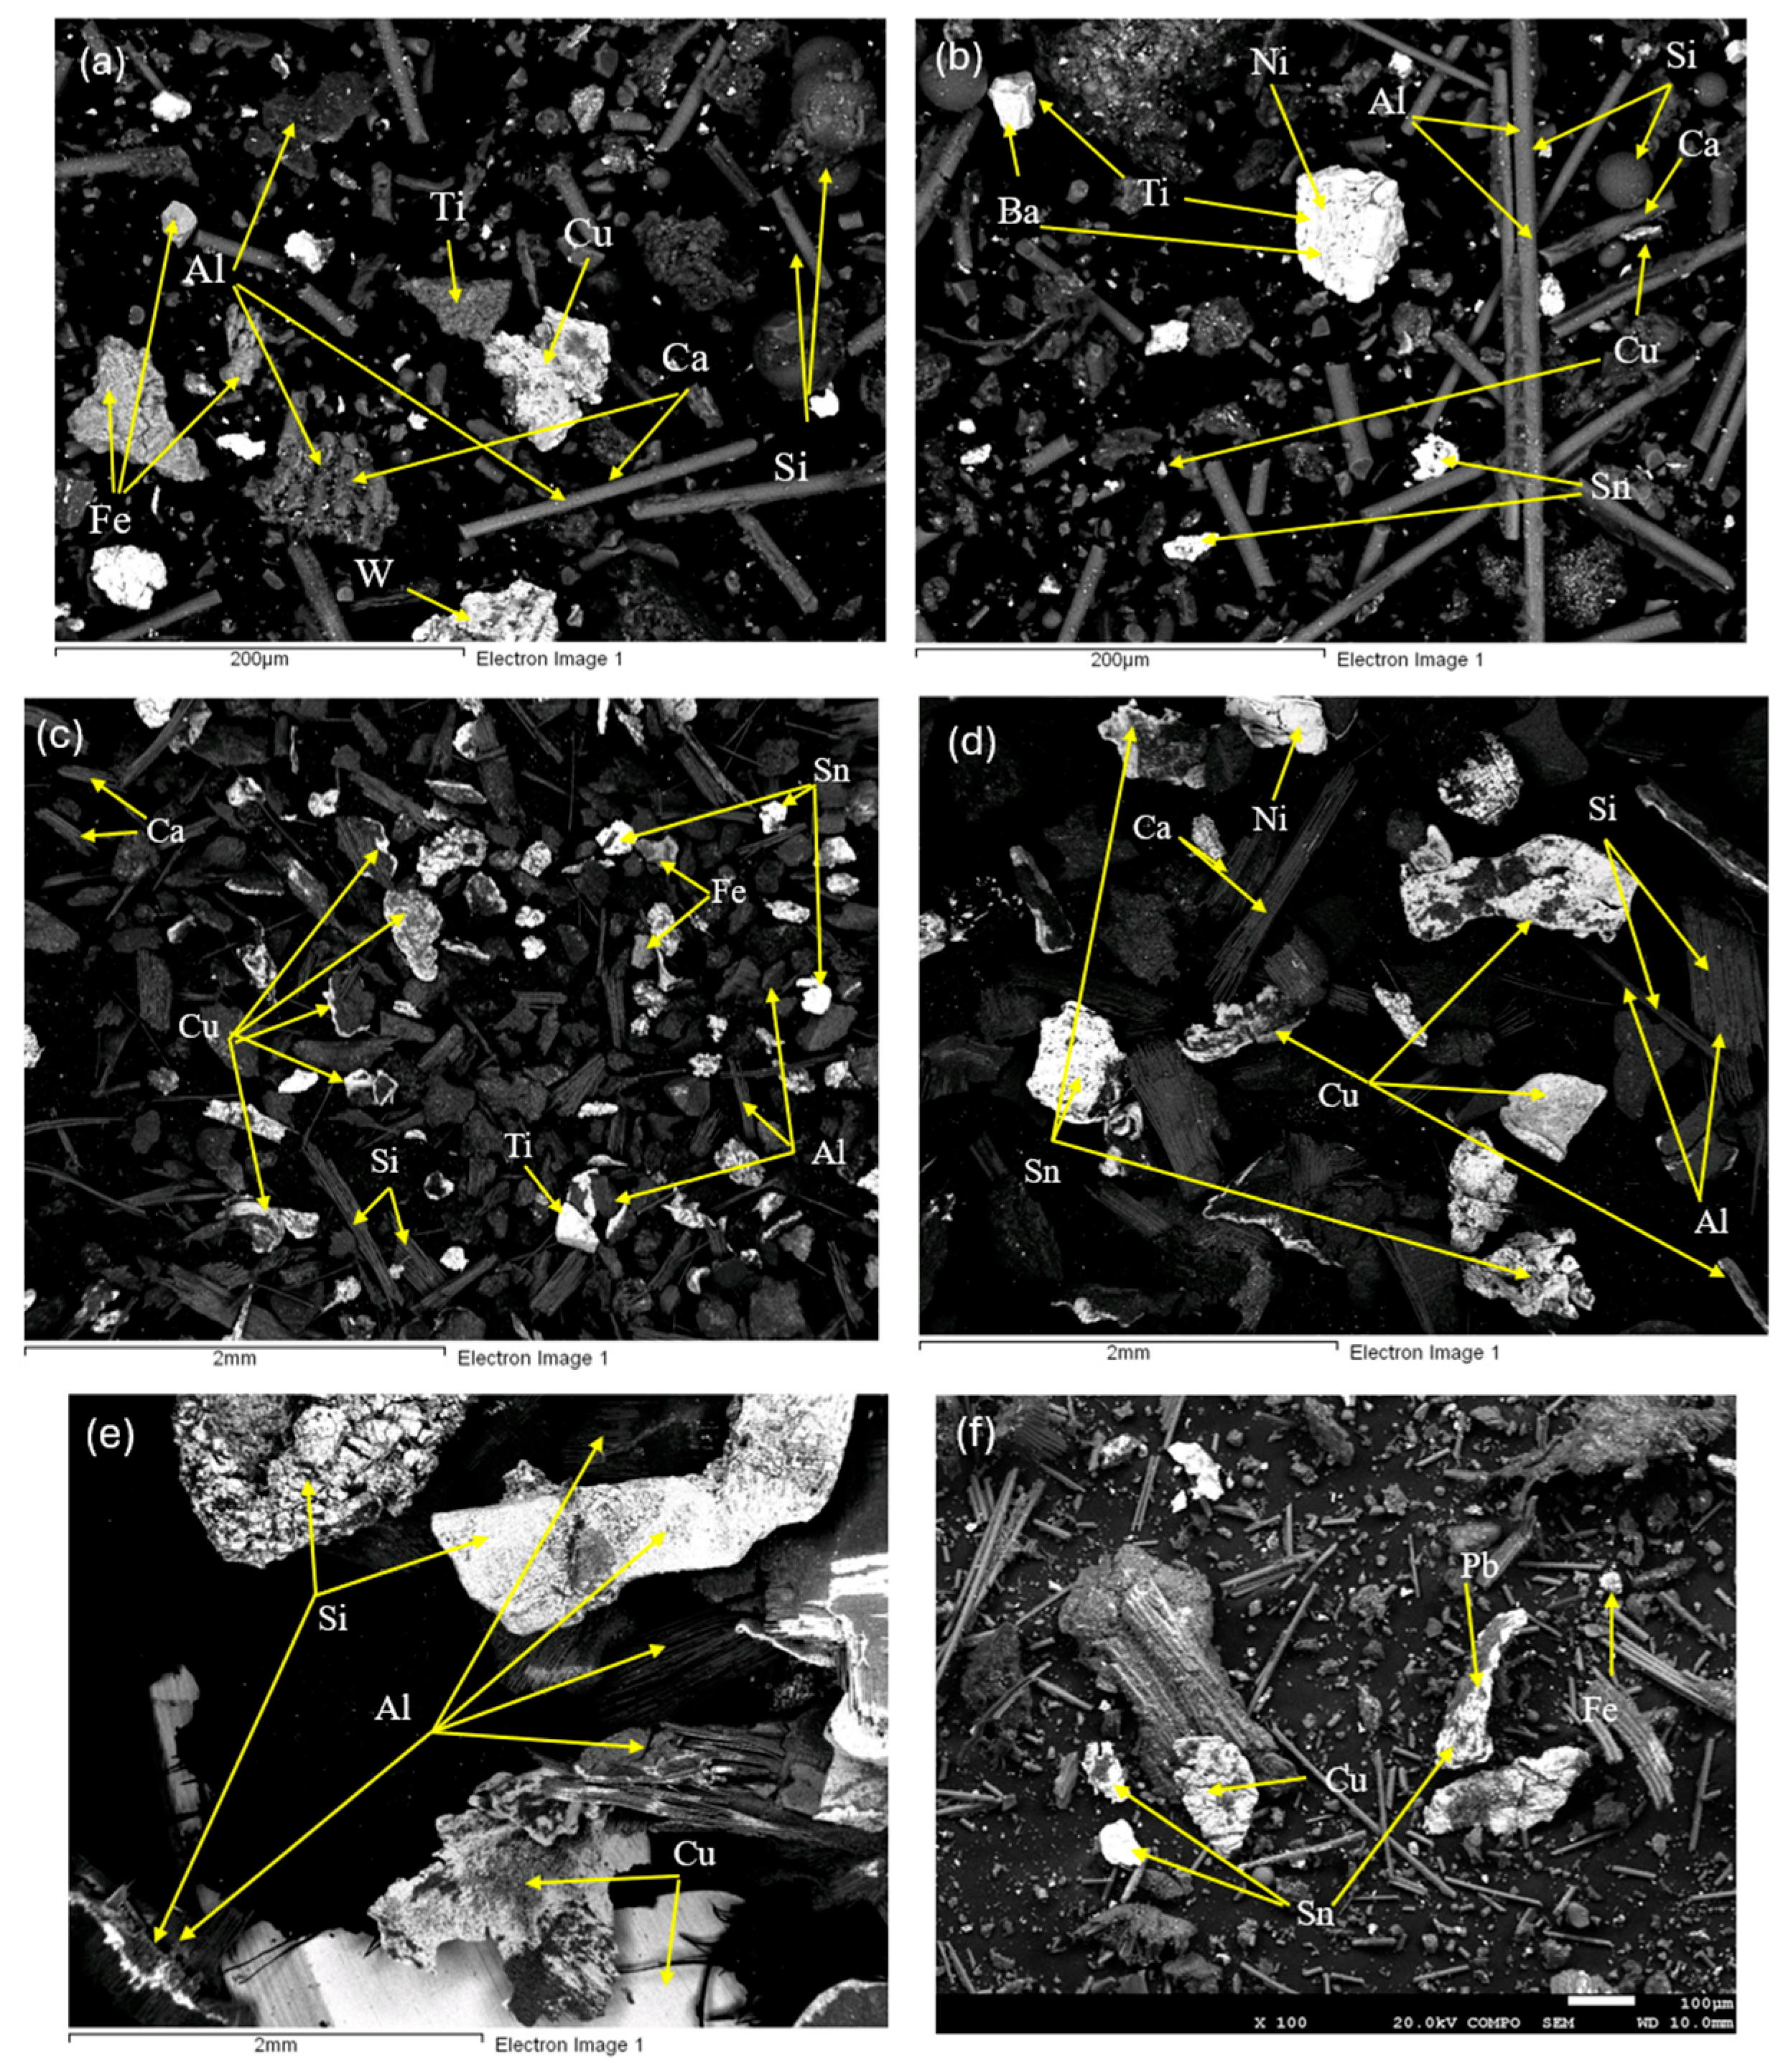
To study the distribution of the compositions and the morphology of the crushed WPCBs, SEM-EDS was conducted on the feed and various-sized fractions of WPCBs, as illustrated in Figure 7. According to SEM-EDS analysis, WPCBs mainly consist of glass fibers embedded in resins containing SiO2, Al2O3, and CaO [3,6], which appear in all classifications as bar- and spherical-shaped particles (gray color). Moreover, there are particles in white colors that correspond to metals that are more liberated at finer particle sizes (Figure 7a,b). However, Cu particles appear more agglomerated with glass fibers in the coarse particle sizes (Figure 7c,d). As particle size increases, the agglomeration of both metal and non-metal components also increases.
To analyze the major compositions of the WPCBs, XRF analysis was carried out on feed WPCBs and different size fractions of crushed WPCBs in three repetitions. Since the average standard deviation of the repeated analyses was less than 0.7%, the results were considered trustworthy. The results have been selected to be presented in both oxides and elements (Table 1). Based on the XRF results, the major elements of the feed are SiO2, CaO, Cu, Br, and Al2O3 at 35%, 13.6%, 11.1%, 9.4%, and 6.4%, respectively. Copper is the primary metal in WPCB due to its high electrical and thermal conductivity. From the results shown in Table 1, it can be inferred that the Cu percentage is higher in coarser meshes than in finer ones [11]. This phenomenon is attributed to the “ductility” and “workability,” showing how much a specific metal or alloy can elongate without rupturing. Thus, due to the higher ductility, a higher portion of the Cu is found in the coarser meshes [3].
It should be noted that industries use different types of copper foil, each with distinct advantages and drawbacks. Electrodeposited (ED) and rolled annealed (RA) copper are the most commonly used foils. The primary difference between them lies in their grain structure. ED copper has a vertical grain structure, which makes it more susceptible to cracking due to stress concentration in the valleys between sharp surface peaks. Cracks can quickly spread along these boundaries. In contrast, RA copper has a horizontal grain structure with a smoother surface, reducing stress concentrators. However, once a crack forms, it must pass through multiple grain boundaries to fracture the entire copper structure [6]. So, this variation in copper types affects crushing and separation efficiency, explaining why not all the Cu is fully liberated during processing. Moreover, Fe during the crushing step cracks and becomes finer due to the lower ductility, thereby decreasing its percentage in the coarse phase. In addition, CaO + SiO2, as glass fibers and ceramic parts, follows the same approach. The contents of SiO2 and CaO are reported to be higher in the finer fraction than in the coarse one. This indicates that a significant number of ceramics and glass fibers became very fine during the comminution due to their brittleness [3].
In the following, ICP-OES analysis was used to determine metals with small amounts, such as Au, Ag, Sn, Pb, Co, Ti, and Ni, as the XRF was not able to measure them accurately. Table 2 shows the analysis results of feed and WPCBs with different particle size ranges, with an average standard deviation of less than 0.5%. As can be seen, the amounts of precious metals such as Au and Ag are high. It can be seen that precious metals in WPCBs are many times more abundant than in their respective natural ores [55,56].
After determining the sample compositions by XRF and ICP, the samples were sent for MLA analysis to determine the accurate liberation degree of mechanically processed WPCBs. MLA images were obtained from MLA across three particle size ranges—300 × 1180 µm, 100 × 300 µm, and −100 µm—for further separation processes. Although the distribution of compositions and the morphology of the crushed WPCBs were analyzed by SEM-EDS, MLA is a technique that provides qualitative and quantitative characterization, including associations among compositions, particle size, and composition liberation. So, as a final stage of the characterization and for beginning the separation step, MLA analysis has been carried out.
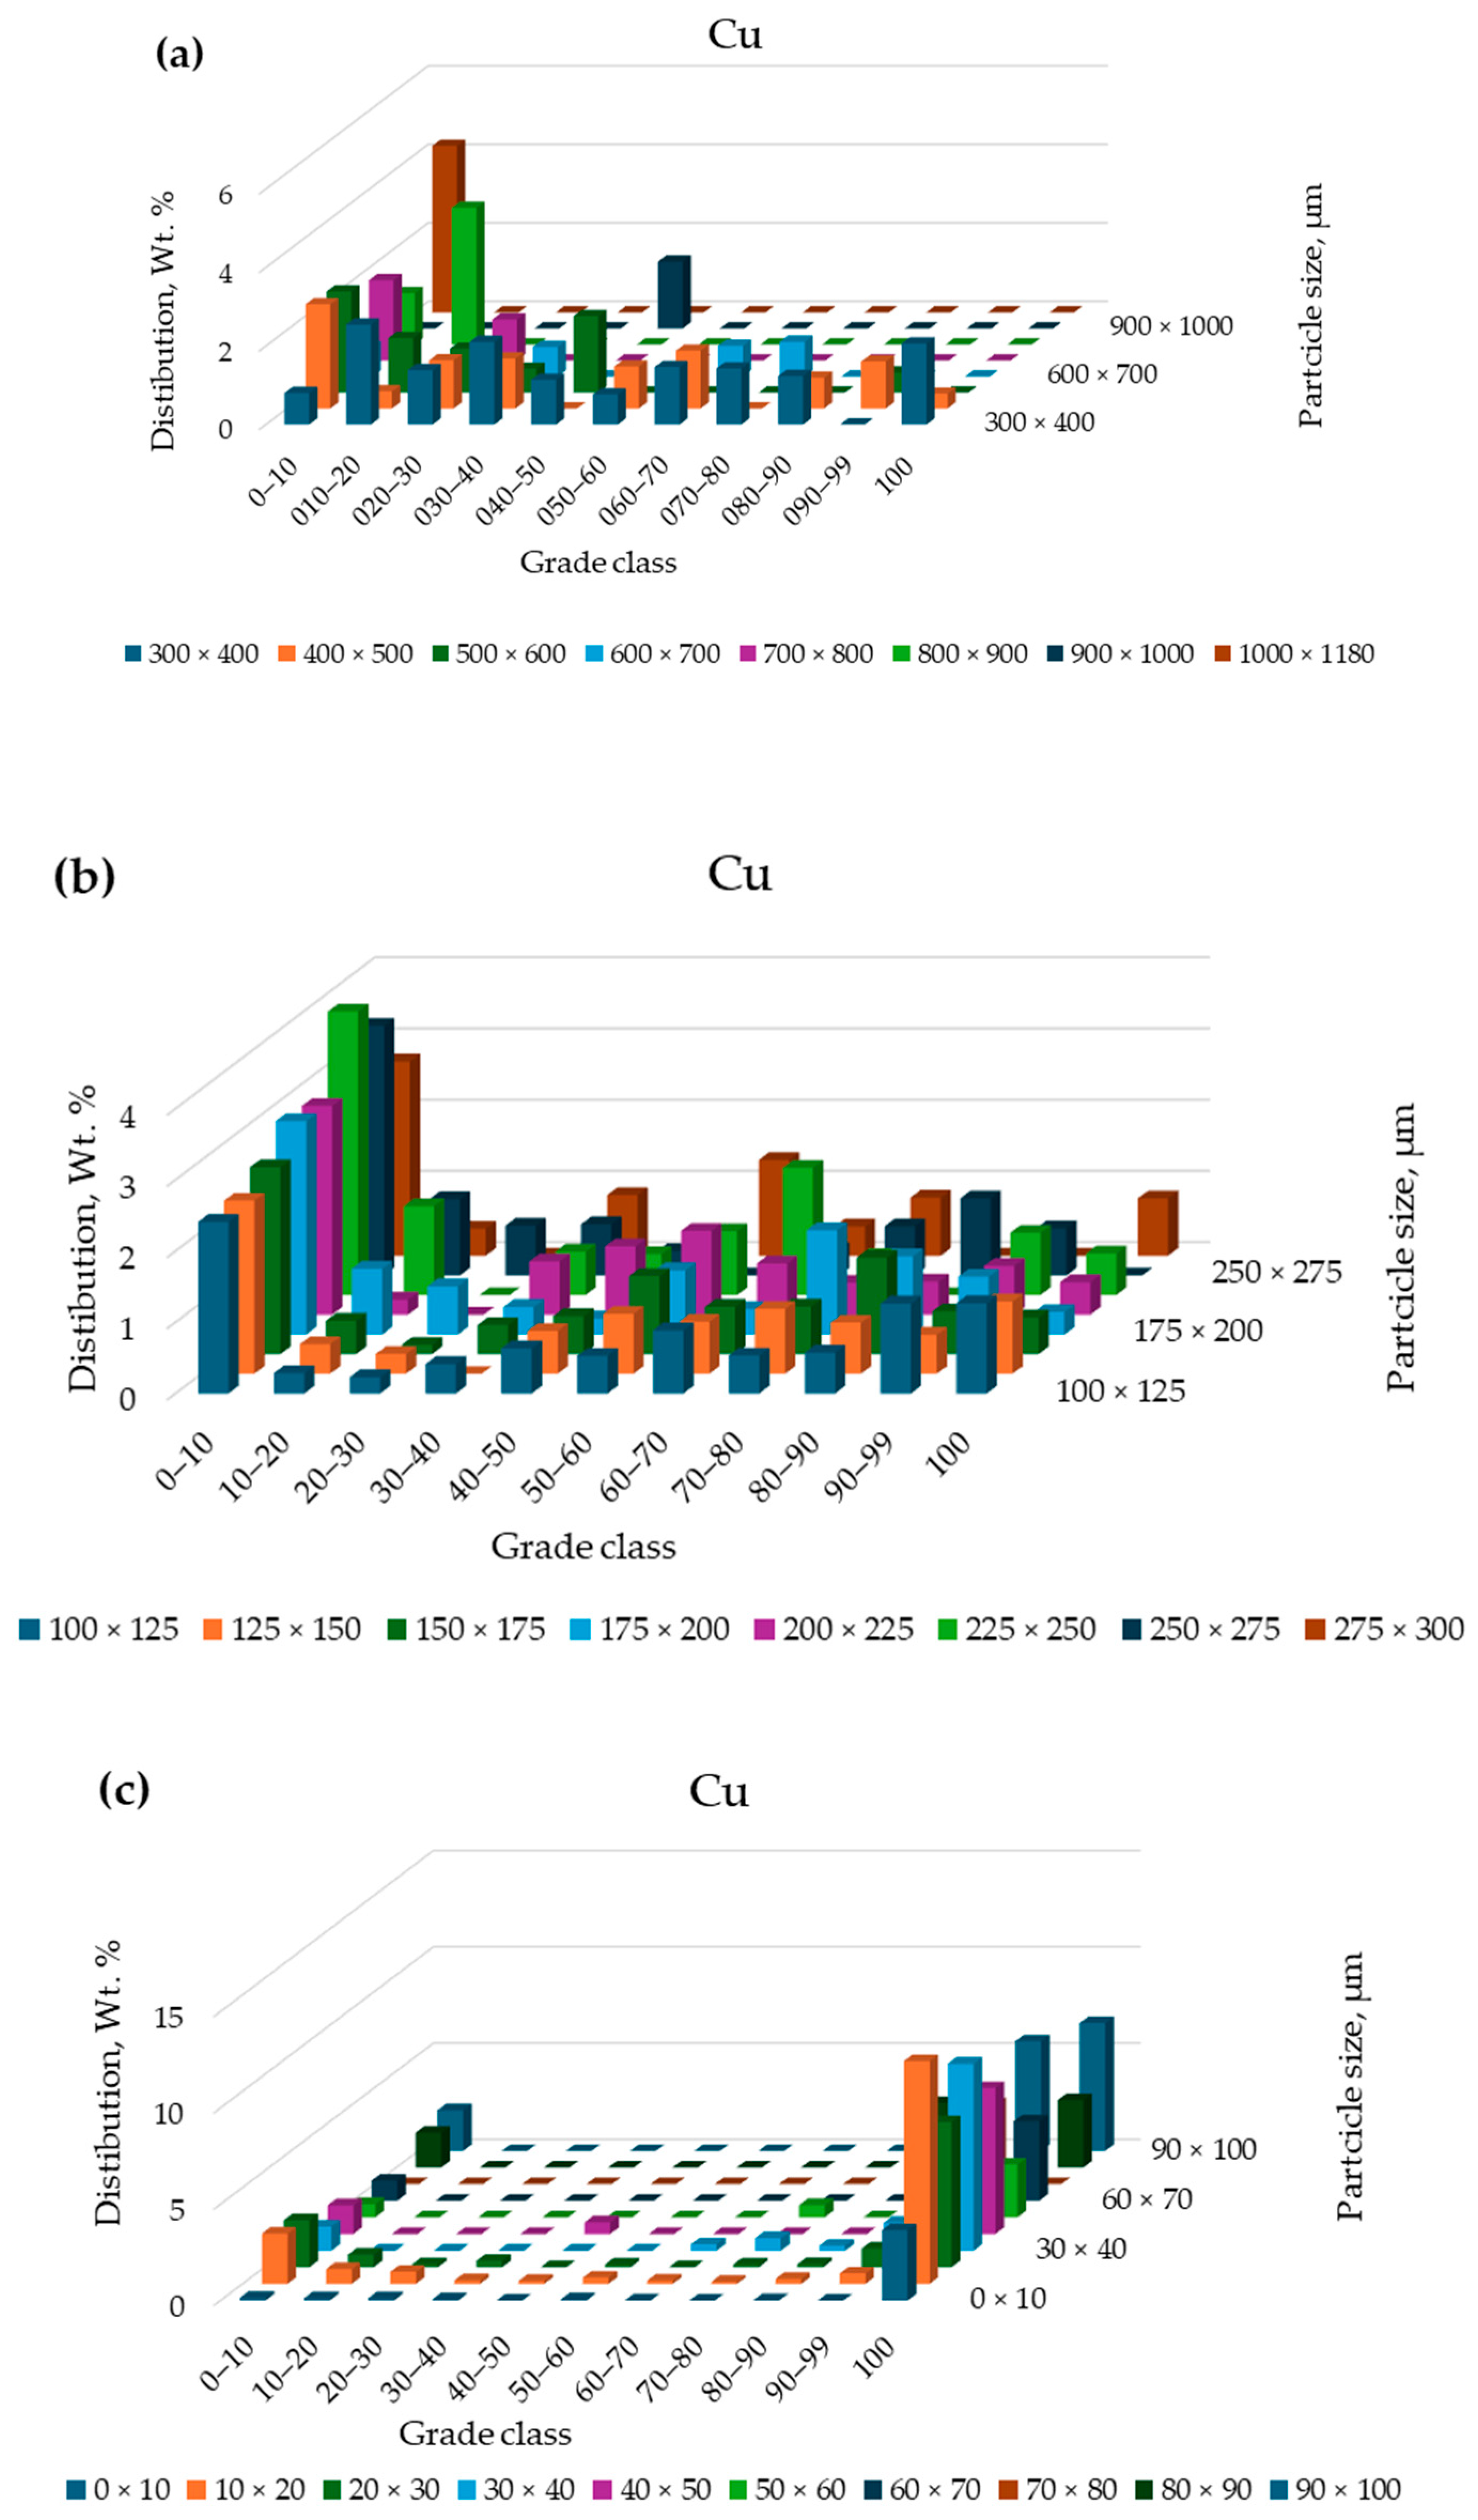
As the XRF analysis showed, the major metal in this WPCB is Cu, so the first study explicitly presents the liberation of Cu for subsequent separation steps. The Cu liberation by particle size corresponds to the distribution of particles (wt%) by the grade class of Cu within the WPCBs, as illustrated in Figure 8. The graphs show the distribution of Cu in WPCBs. The X-axis, considering eleven grades ranging from 0%–10% to 90%–99%, as well as a 100% grade class for fully liberated particles. The Y-axis shows the distribution in wt. (%), which means how much of the total material (by weight) falls into each grade in different particle size ranges. The Z-axis presents the particle size ranges (µm), in other words, the size of the particles in µm.
The analysis of the particles smaller than 100 µm (Figure 8c) shows that most of the particles are completely liberated, 57.04%. They are accumulated in the grade class 100%. This means that a large number of particles are formed only by copper (grade class 100%). The concentration of these particles in a gravity concentration process is expected to recover concentrates with high copper contents and high copper mass recovery. In contrast, 13.59% of particles with Cu have a low grade (0%–10%), indicating that 13.59% are not liberated. The liberation degree of Cu particles smaller than 100 µm was analyzed by dividing the particles into 10 µm size intervals. Each interval represents a range of particle diameters (0 × 10, 10 × 20, 20 × 30, 30 × 40, 40 × 50, 50 × 60, 60 × 70, 70 × 80, 80 × 90, 90 × 100 µm). As can be seen in Figure 8c, particles smaller than 10 µm are a dark blue color. Then particles with particle sizes of 10 × 20 µm are orange in color, etc. It makes it easier to interpret the liberation degree of each particle size range in Wt%.
On the other hand, in the other two size ranges (300 × 1180 µm and 100 × 300 µm—Figure 8a,b), a large number of particles are in the grade classes in the middle of the figure (20–30, 30–40 … 70–80) indicating a low copper liberation (these particles are called Middlings), 33.06% and 36.86% of 300 × 1180 µm and 100 × 300 µm size ranges are middlings, respectively. Only 10% of particles with Cu in 100 × 300 µm size ranges have a grade class of 100%, indicating total liberation. In both cases, it is expected to concentrate low copper contents and low copper mass recovery, especially in the size range 100 × 300 µm (Figure 8b), which presents a large amount of middlings. The liberation degree of Cu particles with 100 × 300 µm size ranges was analyzed by dividing the particles into 25 µm size intervals. Each interval represents a range of particle diameters (100 × 125, 125 × 150, 150 × 175, 175 × 200, 200 × 225, 225 × 250, 250 × 275, 275 × 300 µm). It should be explained that the groups were determined by evaluating the data, and the best group was selected based on each particle size. As shown in Figure 8b, particle sizes of 100 × 125 µm are shown in a dark blue color. Then, particle sizes of 125 × 150 µm are the orange color, etc.
On the other hand, Figure 8b presents a large number of particles in the grade class 0%–10%, 33.75%. This means that almost half of the waste particles are not liberated. They present a maximum of 10% of copper. If they are removed in a gravity concentration process (waste material), the copper content will increase in the concentrate. Moreover, 54.86% of particles with Cu in the 300 × 1180 µm size range have a grade of 0–20. It means that half of the coarse particles are mostly locked. The liberation degree of Cu particles with 300 × 1180 µm size ranges was analyzed by dividing the particles into 100 µm size intervals. Each interval represents a range of particle diameters (300 × 400, 400 × 500, 500 × 600, 600 × 700, 700 × 800, 800 × 900, 900 × 1000, 1000 × 1180 µm). As shown in Figure 8a, particle sizes of 300 × 400 µm are the dark blue color. Then the particle sizes of 400 × 500 µm are shown in orange color, etc.
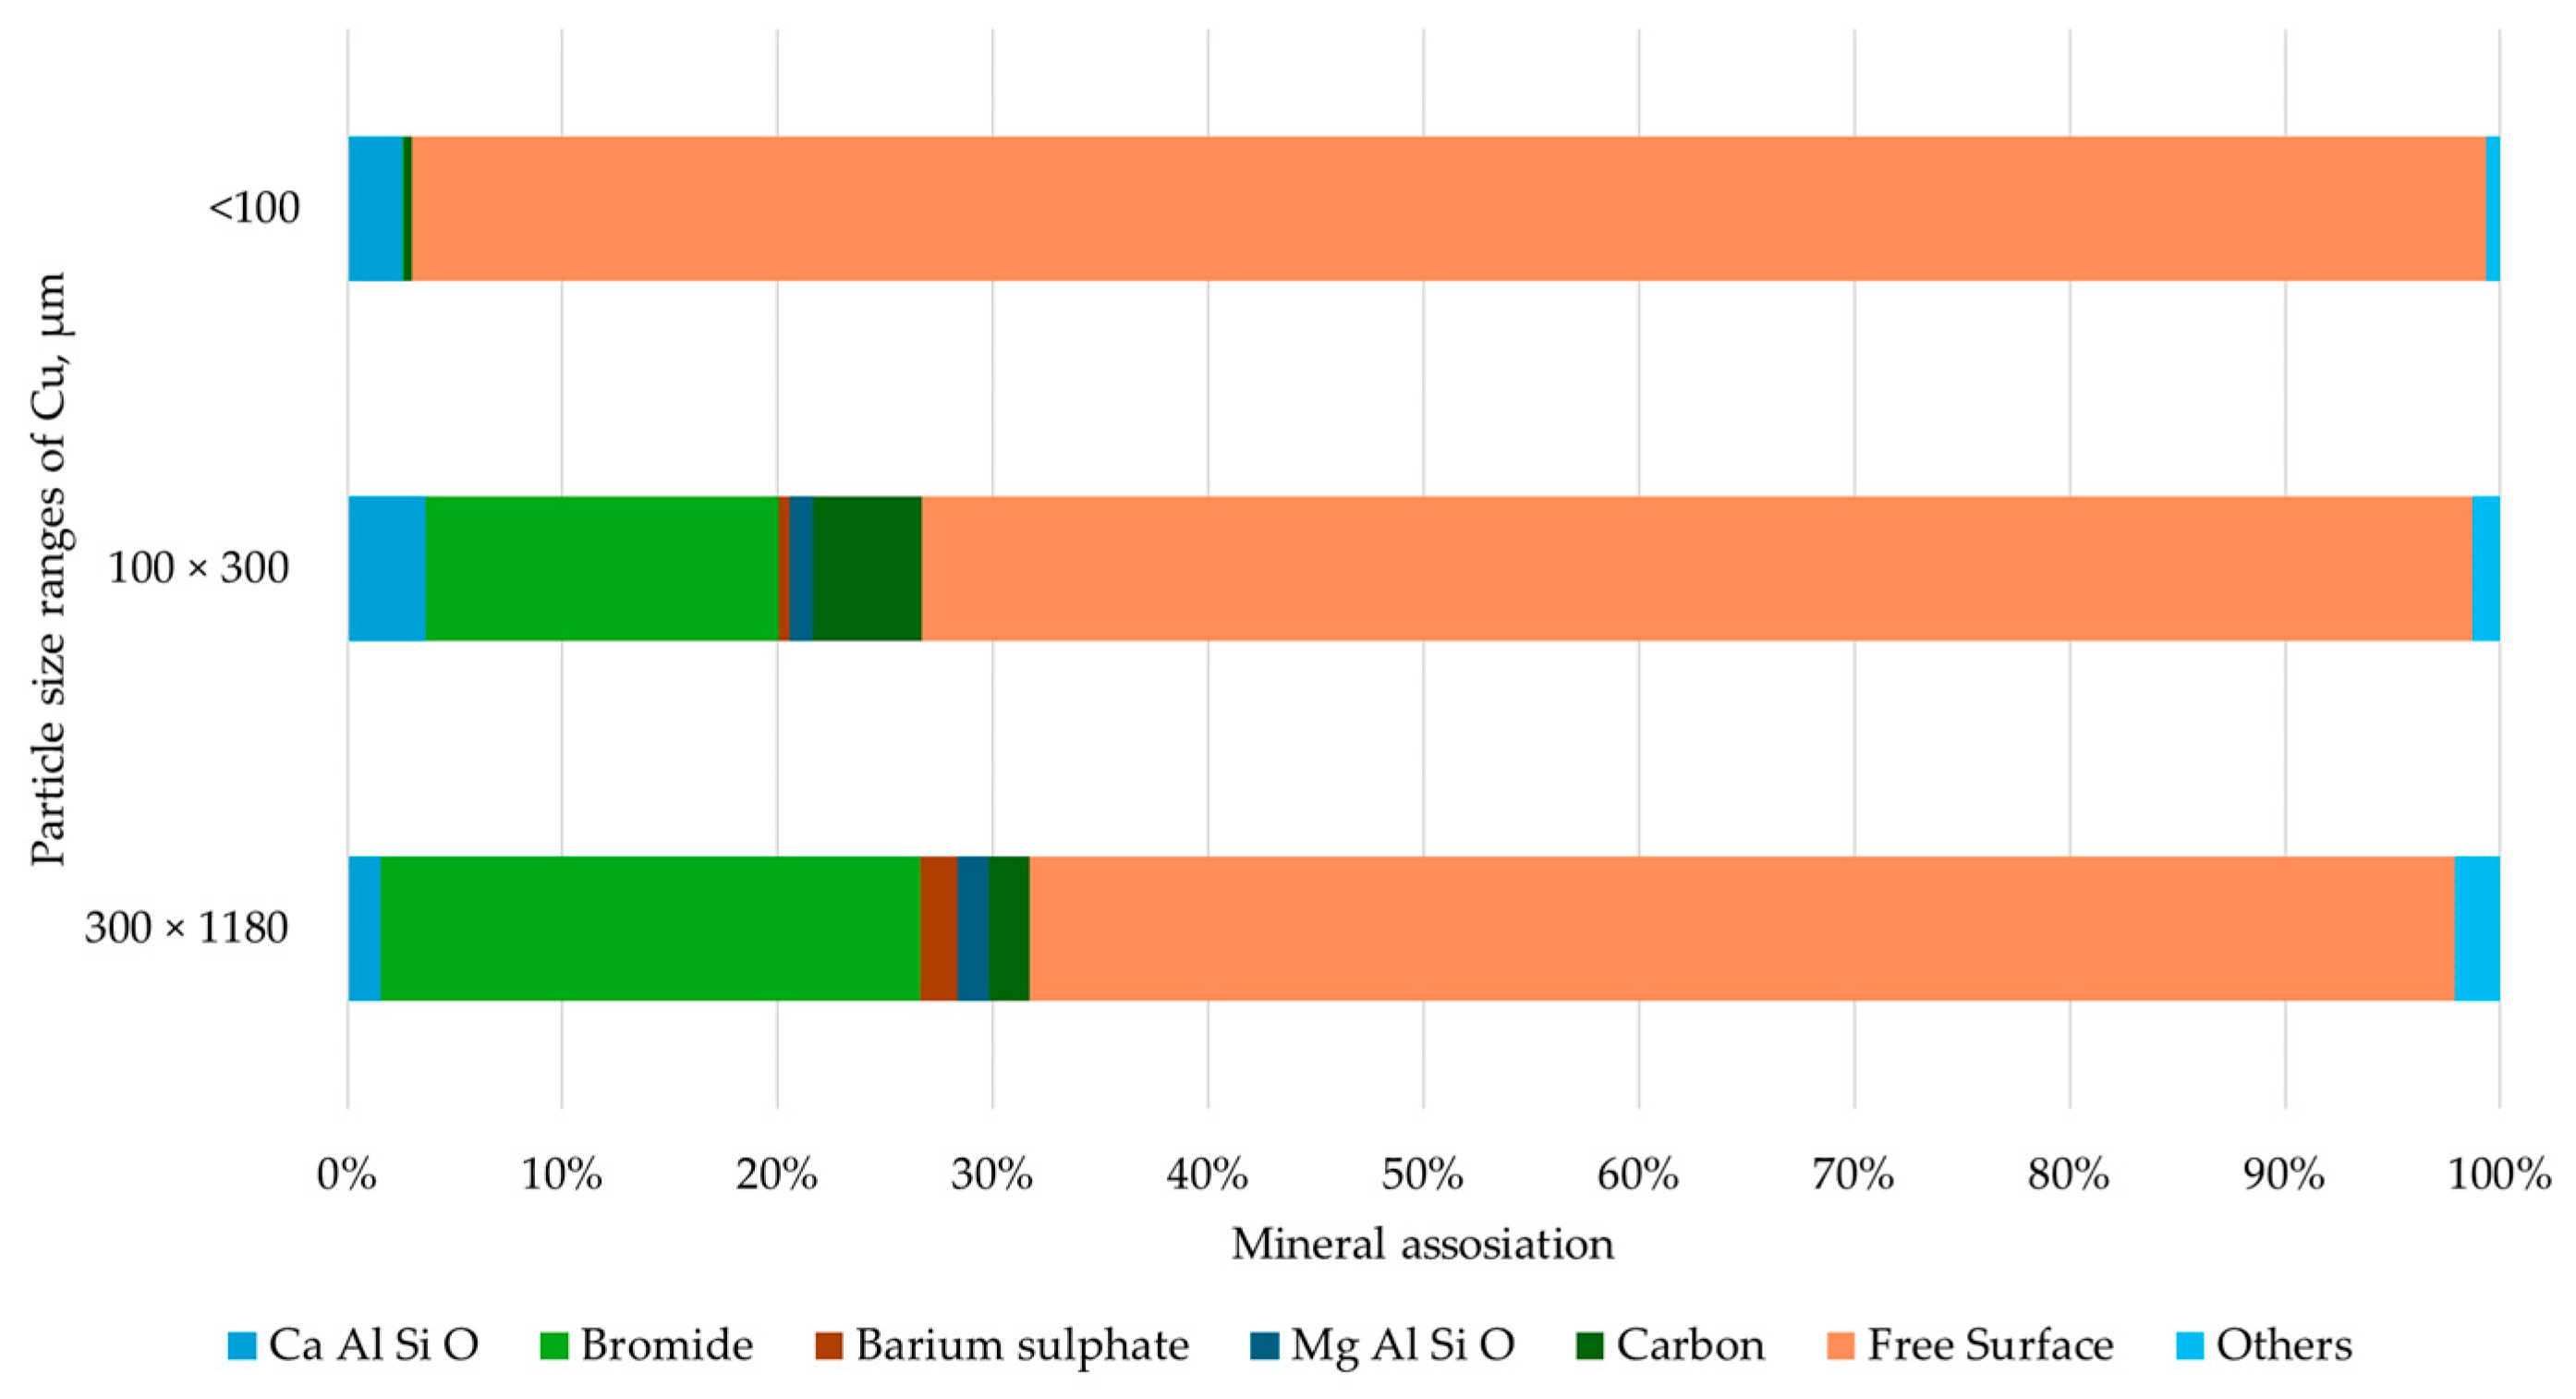
Secondly, the Cu association with other components in three particle size ranges is analyzed in Figure 9. Associations refer to the percentage of the extent of the boundaries of composition in contact with free surfaces or other compositions [57].
The figure shows that 96.32% of Cu in particles smaller than 100 µm have a free surface, while the remaining 3.68% are associated with other compositions, primarily Ca + Al + SiO. This is the flotation size range, and good results could be achieved with flotation due to the free surface. In the 100 × 300 µm size fraction, 72.03% of Cu have a free surface, with 27.97% associated mainly with bromide. For particles in the 300 × 1180 µm size range, 66.18% of Cu have a free surface, while 33.82% are predominantly associated with bromide. The results indicate that the free surface (orange color) dominates in all particle sizes, meaning most of the Cu has a free surface. However, as particle size increases, the proportion of Cu with a free surface decreases, confirming the liberation study findings that the degree of liberation of Cu decreases with increasing particle size.
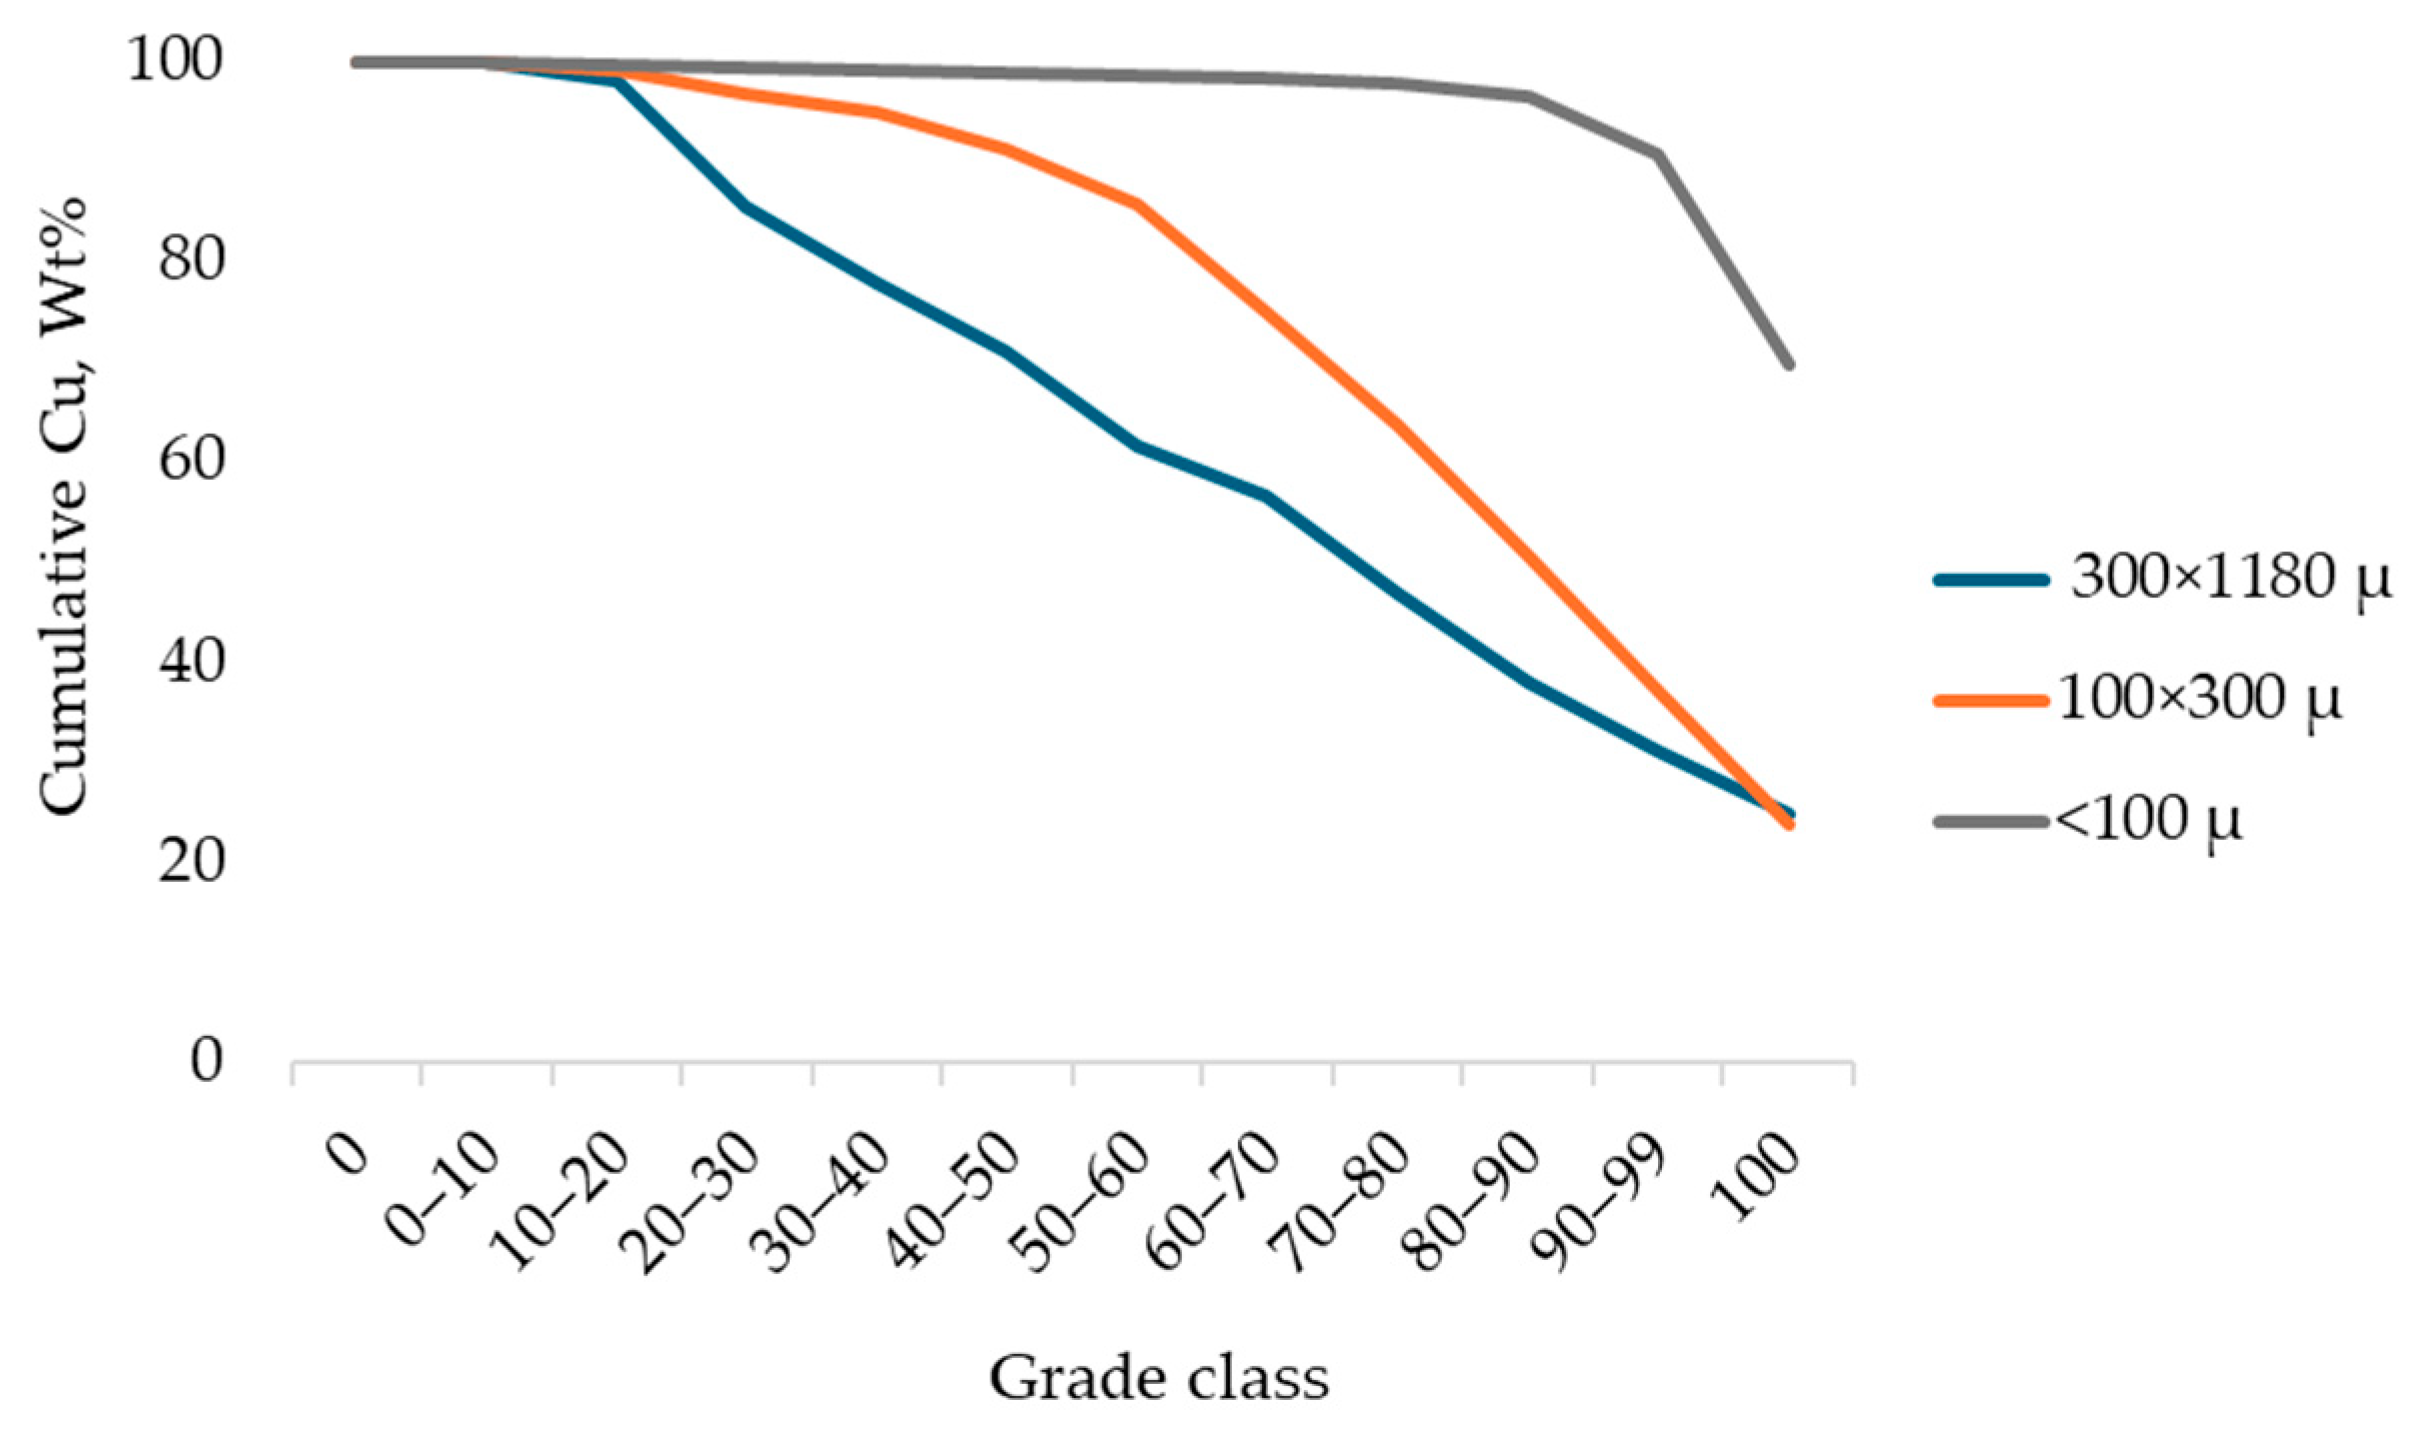
Lastly, the cumulative mass of Cu in different particle size ranges was measured (Figure 10). The cumulative theoretical recovery obtained through MLA estimates the amount of valuable compositions that could be recovered in a separation process, based on its degree of liberation from the waste [58]. This recovery can be calculated from the grade and/or the free surface, as both factors influence the efficiency of the concentration process. A higher degree of liberation or greater free surface area of the compositions imply potentially higher recovery. Both methods help predict the efficiency of composition recovery by considering the composition’s quantity and physical liberation.
The Cu cumulative graph shows that as the Cu grade decreases (100 to 0), the cumulative mass of copper increases across all three particle size ranges (almost 20 to 100 wt%). The finer particle size (gray line) retains a higher cumulative mass of Cu across most Cu grade ranges, while the coarser particles (blue line) show the lowest cumulative Cu mass. This suggests that Cu is more liberated in the fine fractions than in the coarse fractions. Although the finest particle size has the most liberated Cu, the other particle size ranges have approximately the same number of liberated particles in the 100% grade class.
To conclude, coarse samples with particle sizes ranging from 300 to 1180 µm present a Cu content of 9.65% (Table 3). Of this Cu mass, 24.68% is in the 100% grade class, indicating that these Cu particles are completely liberated. Additionally, 22.18% falls within the 70%–99% grade classes (grade classes 70–80, 80–90, and 90–99 in Figure 10), meaning they are partially liberated. This work assumes that particles in grade classes above 70% exhibit sufficient liberation to be concentrated using gravimetric processes. A significant portion of this particle size range—38.50%—falls within the 20%–70% grade classes, while a small fraction, around 14.64%, has a grade of less than 20%. Cu particles in grade classes below 20% are thoroughly mixed, showing low Cu liberation and making their separation by gravity concentration difficult. Table 3 presents the Cu content of WPCBs determined by MLA techniques across three particle size ranges. It determines the quantitative volume or weight percentages of composition phases in a sample. It describes the actual composition, rather than the normative (theoretical) composition calculated from chemical data.
Samples with particle sizes ranging from 100 to 300 µm contain 4.58% Cu (Table 3), of which 23.71% is completely liberated, falling within the 100% grade class (Figure 10—orange curve). Additionally, 40% have a grade between 70% and 99%, indicating that the particles are partially liberated. Meanwhile, 31.10% of the particles fall within the 30–70% grade classes, while less than 5.19% have a grade below 30%.
For finer samples with particle sizes less than 100 µm containing 4.25% Cu (Table 3), 69.69% of this material is entirely liberated (Figure 10—gray curve), grade class of 100%. Furthermore, 28.12% falls within the 70%–99% grade classes, indicating partial liberation of the particles. Only a small fraction, 2.19%, is in the grade class below 70%, indicating limited particle liberation.

3.3. Separation

After accurate characterization of the classified feeds, particles in the size range 300 × 1180 µm were beneficiated on a shaking table, and particles in the size range smaller than 300 µm were beneficiated in an MGS.
The shaking table concentration with the coarse particles (300 × 1180 µm) shows that Cu can be recovered by 14.78% (Cu content) and 95.01% (Cu recovery) in the concentrate, the middlings present 0.70% (Cu content) and 4.53% (Cu recovery), and the waste 0.07% (Cu content) and 0.46% (Cu recovery). The test’s average standard deviation indicates that the data are reliable. The average standard deviations of the concentrate, middlings, and tailings were 2.2%, 1.5%, and 0.65%, respectively. It is possible to say that most of the particles with grade classes over 70% are in the concentrate, with grade classes between 30 and 70% in the middlings, and with grade classes under 30% in the waste.
Optimal recovery is achieved with a higher water flow rate and a lower deck angle [35], since the process targets a high-recovery clean product. Increasing the deck angle and decreasing the water flow rate negatively impact the efficiency. On the other hand, as the deck angle increases, efficiency decreases in the concentrate while rising in the middlings, as shown in Table 4.
The MGS has been carried out on two particle size ranges: 100 × 300 µm and smaller than 100 µm. Table 5 presents the concentration results of the MGS tests. The MGS concentration with the coarse particles (100 × 300 µm) shows that Cu can be recovered by 6.89% (Cu content) and 94% (Cu recovery) in the concentrate and 0.44% (Cu content) and 6% (Cu recovery) in the waste. The MGS concentration with the fine particles (−100 µm) shows that Cu can be recovered by 3.81% (Cu content) and 81.5% (Cu recovery) in the concentrate and 0.87% (Cu content) and 18.5% (Cu recovery) in the waste. According to the average standard deviation of the tests, the data are reliable. An average standard deviation of the concentrate and tailings was 1.2% and 0.4%, respectively. Optimal recovery is achieved with a lower wash water flow rate and a lower deck angle, since the process aims for a high-recovery clean product with a low-grade rejectable tailings stream.
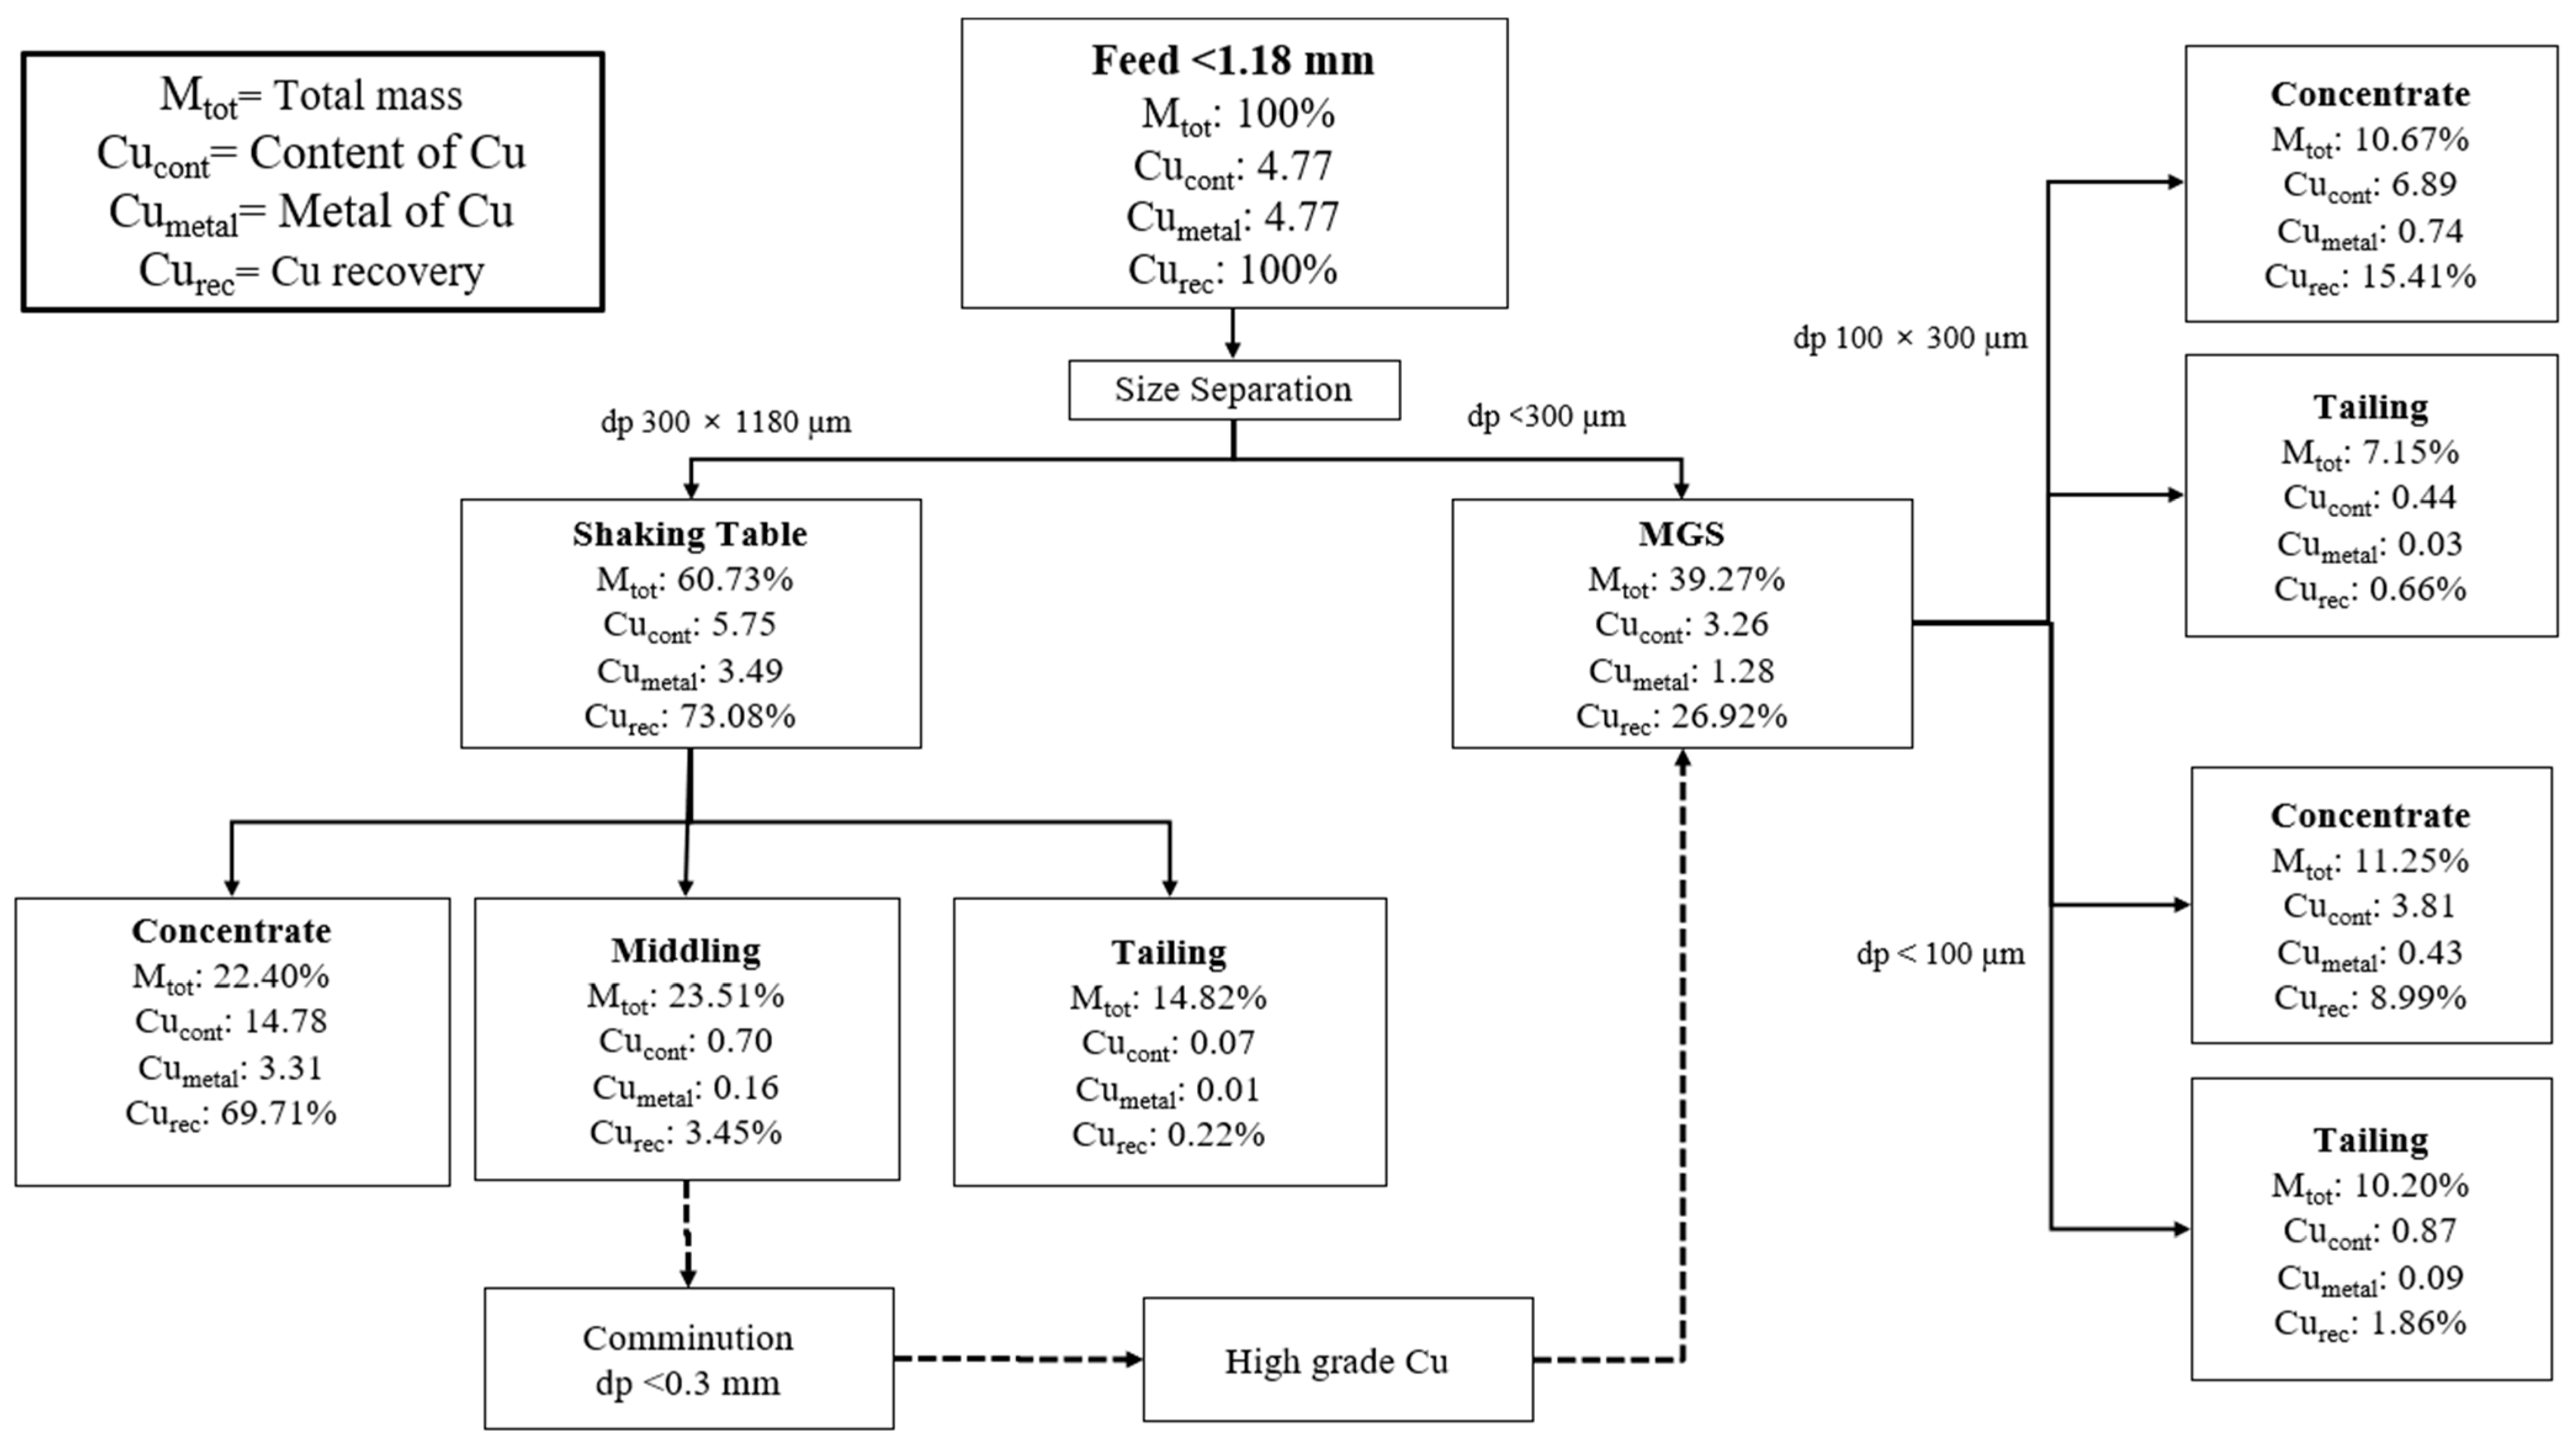
The proposed flowsheet for Cu beneficiation using a shaking table and MGS is shown in Figure 11. The following data are presented in the figure: Mtot is the total mass in the fraction; Cucont is the copper content in the fraction; Cumetal is the mass of copper presented in the fraction; and Curec is the metallurgical mass balance of the copper in relation to the feed (total is 100%).
It is possible to observe in Figure 11 that 44.32% of the total mass of the feed goes to the concentrates: 10.67% of the concentrate of the MGS in the fraction 100 to 300 µm, 11.25% in the fraction −100 µm, and 22.40% of the concentrate of the shaking table. These concentrates (44.32% of the total mass) present a mean copper content of 10.10%, with 93.81% of the copper mass from the feed (15.41% of the MGS 100 × 300 µm; 8.99% of the MGS −100 µm, and 69.41% of the shaking table). This means it is possible to recover 93.81% of the copper using a flowsheet like that.
The tailings of the tests (MGS, fraction 100 × 300 µm and fraction −100 µm; and the shaking table) present a mass of 32.17% of the feed (7.15%, MGS, fraction 100 × 300; 10.20%, MGS, fraction −100; and 14.82% of the shaking table). The mean copper content of these tailings is 0.29%, with only 2.74% of the copper in the feed. The amount of copper discarded in the tailings is relatively small, demonstrating good liberation of waste particles and good cutting efficiency.
It is also possible to generate middlings in the shaking table (23.51% of the total mass; 0.7% of copper content; 3.45% mas of the copper in the feed) that can be added to the tailings or comminuted to a top size of 300 µm and sent to the MGS feed for more intense concentration.
As mentioned before, this flowsheet tries to propose more environmentally friendly processes. In terms of chemical usage, other methods such as flotation and leaching [59,60,61,62] use chemicals such as acids, collectors, and frothers, but this process reduces chemical use to zero, thereby reducing environmental impact and lowering costs, especially on a large scale. The large-scale industrial use of the chemical will add to the cost of recycling processes for these kinds of wastes; however, this flowsheet uses differences in the specific gravity of the waste to separate metals from non-metals, which seems more industrial.
Ogunniyi et al. (2009) used the flotation technique without collectors or frothers, but the Cu recovery did not reach 70% [63]. In another study by Chen et al. (2023), 93.8% of the Cu was recovered by reverse flotation with ultrasonic assistance, which uses ultrasonic to increase the energy consumption, and it will increase the costs at the end [64]. However, some studies prove that with proper optimization of flotation conditions, high recoveries (up to 95%) are achievable [65,66]. However, as mentioned, the environmental and economic aspects remain problems. Moreover, the particle size ranges in these studies are limited; however, our study covers a broader range.
Ismail Mohammad et al. (2025) studied the effect of solvent pre-treatment on the leaching of copper, especially for larger particle sizes [67]. The results were not satisfactory: 47.3% Cu recovery without pre-treatment and 87.65% with pre-treatment. Magoda et al. (2024) used a two-step bioleaching process to recover Cu [60]. However, the particle size was limited to the 38–150 μm fraction, and the Cu recovery was 68.2%. Other difficulties in this work include maintaining pH and temperature, as each microbial group has a strict optimal range (acidic for acidophiles, alkaline for cyanobacteria) [68]. We suppose that the combination of the Cu recovered from our work with leaching in the following steps can provide better results with less environmental impact and at a lower cost.
Bilesan et al. (2021) combined a hydrocyclone with the dilution-gravity method (DGM) for recovering precious and base metals from fine particle sizes (<75 μm) of the WPCBs [26]. However, the total copper recovery of 72% was achieved. So, compared to the MGS, it has a limited particle size, lower Cu recovery, and an additional cost due to the use of the DGM.
Xian et al. (2021) used heated printed circuit boards via an enhanced gravity concentrator falcon (SB40) and a high-gradient magnetic separator to recover Cu and iron (Fe), and they earned 74.02% Cu recovery and 78.11% Fe recovery [69]. In addition to the lower recovery gained compared to our work, the heating process is not environmentally friendly and releases toxic gases.
It is important to note that some losses occur primarily due to the generation of fines and the flat particles, with a nearly two-dimensional shape of metal particles produced during crushing. These particles exhibit poor settling behavior in the wet circuit. Additionally, ultrafine plastic particles create challenges in the wet circuit by clustering and trapping small metal particles, further affecting separation efficiency [11].
Furthermore, the selective separation of heavy metals such as zinc, brass, and gold was not the focus of this study. Instead, the primary objective was to minimize the environmental impact of electronic waste and ensure the efficient recovery of copper resources [32]. Future studies could explore the separation of precious metals like gold and silver, since considerable quantities were prevalent in the WPCBs. These noble metals in WPCBs are the primary economic driver for e-waste recycling [70,71,72,73]. Additionally, non-metallic fractions (NMFs) should not be overlooked, as they can serve as safe and effective fillers in various composites with thermoset and thermoplastic resin matrices, adding them to concrete to enhance the engineering properties of concrete such as strength, durability, shrinkage, and permeability, offering an environmentally friendly solution [74,75,76,77].
Lastly, it is suggested that the recovered copper from this flowsheet be sent for further treatment, such as pyrometallurgical processing, to eliminate impurities and meet the requirements of the industry’s smelting process [78].

4. Conclusions

This study developed and evaluated a two-stage gravity separation process for recovering copper from waste printed circuit boards (WPCBs), combining a shaking table for coarse particles (>300 µm) and a multi-gravity separator (MGS) for fine particles (<300 µm). After mechanical pre-treatment and comprehensive characterization, X-ray fluorescence (XRF), inductively coupled plasma optical emission spectroscopy (ICP-OES), scanning electron microscopy (SEM-EDS), and mineral liberation analysis (MLA) were performed, which were critical in understanding the feed material composition locking and association.
Quantitative separation results highlight the efficiency of the proposed flowsheet. The shaking table achieved 95.01% Cu recovery in the coarse fraction, while the MGS produced 94% Cu recovery for the 100–300 µm fraction and 81.5% Cu recovery for particles below 100 µm. When integrated, the two-unit flowsheet successfully recovered 93.81% of the total Cu into clean concentrates representing 44.32% of the total mass, while only 2.74% of the copper was discarded in tailings. These outcomes confirm that gravity separation, when preceded by appropriate comminution and liberation analysis, can produce high-quality Cu concentrates with minimal environmental impact.
The efficiency of the multi-gravity separator as a physical beneficiation technique for the recovery of Cu from fine particles was proven. The proposed methodology enhances the concentration and purity of the metallic fraction (in this case, Cu), especially in fine particles, which are challenging to work with, while reducing environmental impacts through minimal chemical use, thereby contributing to sustainable e-waste recycling.
Results of the characterization show that the MLA technique is an effective and accurate method for characterizing complex materials like WPCBs and offering detailed insights into compositions, particle liberation, and shapes, etc. Secondly, a high concentration of precious metals such as Au and Ag highlights its potential for future recovery and recycling.
For future work, the research can be extended in several promising directions. First, the separation of other precious metals, such as gold and silver, identified in significant quantities by ICP-OES, should be investigated, as they are a primary economic driver of e-waste recycling. Second, the valorization of the non-metallic fraction (NMF) should be explored, for instance, as a filler in construction composites or concrete to enhance material properties.

Author Contributions

Conceptualization, M.P.; Methodology, J.O. and C.H.S.; Software, M.P. and P.E.; Validation, M.P., J.O. and C.H.S.; Formal analysis, J.O., H.A. and C.H.S.; Investigation, M.P.; Resources, J.O. and C.H.S.; Data curation, M.P. and P.E.; Writing—original draft, M.P.; Writing—review & editing, J.O., H.A., C.H.S., P.A., C.V., J.L.C. and P.E.; Visualization, M.P., H.A. and P.A.; Supervision, J.O., H.A., C.H.S. and P.A.; Project administration, J.O., C.H.S., C.V. and J.L.C.; Funding acquisition, J.O., C.H.S., C.V. and J.L.C. All authors have read and agreed to the published version of the manuscript.

Funding

This research was funded by MICIU/AEI/10.13039/501100011033/FEDER, UE, grant number: PID2024-158241OB-I00.

Data Availability Statement

The original contributions presented in this study are included in the article. Further inquiries can be directed to the corresponding author.

Acknowledgments

The authors would like to thank the Agencia Estatal de Investigación del Ministerio de Ciencia e Innovación for funding the project under grant number PID2021-127028OB-I00. This work is part of Maria de Maeztu Units of Excellence Programme CEX2023-001300-M/funded by MCIN/AEI/10.13039/501100011033.The authors belong to the 2021-SGR 01041 (RiiS) and 2021-SGR 00596 (R2EM) research groups financed by the AGAUR, Generalitat de Catalunya.

Conflicts of Interest

The authors declare no conflicts of interest.

References

  1. Kumar, A.; Holuszko, M.E.; Janke, T. Characterization of the non-metal fraction of the processed waste printed circuit boards. Waste Manag. 2018, 75, 94–102. [Google Scholar] [CrossRef] [PubMed]
  2. Pourmohammad, M.; Oliva, J.; Anticoi, H.; Hoffmann Sampaio, C.; Alfonso, P.; Valderrama, C.; Cortina Pallas, J.L. The Characterization of Black Mass from Spent Lithium-Ion Scooter Batteries Using Multi-Analytical Techniques. Recycling 2025, 10, 54. [Google Scholar] [CrossRef]
  3. Nekouei, R.K.; Pahlevani, F.; Rajarao, R.; Golmohammadzadeh, R.; Sahajwalla, V. Two-step pre-processing enrichment of waste printed circuit boards: Mechanical milling and physical separation. J. Clean. Prod. 2018, 184, 1113–1124. [Google Scholar] [CrossRef]
  4. Van Yken, J.; Cheng, K.Y.; Boxall, N.J.; Sheedy, C.; Nikoloski, A.N.; Moheimani, N.R.; Kaksonen, A.H. A comparison of methods for the characterization of waste-printed circuit boards. Metals 2021, 11, 1935. [Google Scholar] [CrossRef]
  5. Otsuki, A.; Mensbruge, L.D.L.; King, A.; Serrano, S.; Fiore, L.; Bonifazi, G. Non-destructive characterization of mechanically processed waste printed circuit boards—Particle liberation analysis. Waste Manag. 2020, 102, 510–519. [Google Scholar] [CrossRef]
  6. Abbadi, A.; Rácz, A.; Bokányi, L. Exploring the comminution process of waste printed circuit boards in recycling; a review. J. Mater. Cycles Waste Manag. 2024, 26, 1326–1348. [Google Scholar] [CrossRef]
  7. Ji, X.; Yang, M.; Wan, A.; Yu, S.; Yao, Z. Bioleaching of Typical Electronic Waste—Printed Circuit Boards (PCBs): A Short Review. Int. J. Environ. Res. Public Health 2022, 19, 7508. [Google Scholar] [CrossRef]
  8. Mori de Oliveira, C.; Bellopede, R.; Tori, A.; Zanetti, G.; Marini, P. Gravity and Electrostatic Separation for Recovering Metals from Obsolete Printed Circuit Board. Materials 2022, 15, 1874. [Google Scholar] [CrossRef]
  9. Sarvar, M.; Slarirad, M.M.; Shabani, M.M. Characterisation and mechanical separation of metals from computer Printed Circuit Board (PCBs) based on mineral processing methods. Waste Manag. 2015, 45, 246–257. [Google Scholar] [CrossRef]
  10. Palmieri, R.; Bonifazi, G.; Serranti, S. Recycling-oriented characterization of plastic frames and printed circuit boards from mobile phones by electronic and chemical imaging. Waste Manag. 2014, 34, 2120–2130. [Google Scholar] [CrossRef] [PubMed]
  11. Das, A.; Vidyadhar, A.; Mehrotra, S.P. A novel flowsheet for the recovery of metal values from waste printed circuit boards. Resour. Conserv. Recycl. 2009, 53, 464–469. [Google Scholar] [CrossRef]
  12. Oke, E.A.; Potgieter, H. Discarded e-waste/printed circuit boards: A review of their recent methods of disassembly, sorting and environmental implications. J. Mater. Cycles Waste Manag. 2024, 26, 1277–1293. [Google Scholar] [CrossRef]
  13. Keleş, B.; Dinç, N.I.; Dursun, H.N.; Burat, F.; Ulusoy, U. The effect of particle geometry (size & shape) on the recovery of gold and copper metallic particles from end-of-life random access memory cards by flotation. Waste Manag. 2024, 179, 66–76. [Google Scholar] [CrossRef]
  14. Otsuki, A.; Gonçalves, P.P.; Stieghorst, C.; Révay, Z. Non-destructive characterization of mechanically processed waste printed circuit boards: X-ray fluorescence spectroscopy and prompt gamma activation analysis. J. Compos. Sci. 2019, 3, 54. [Google Scholar] [CrossRef]
  15. Touze, S.; Guignot, S.; Hubau, A.; Devau, N.; Chapron, S. Sampling waste printed circuit boards: Achieving the right combination between particle size and sample mass to measure metal content. Waste Manag. 2020, 118, 380–390. [Google Scholar] [CrossRef]
  16. Ghosh, B.; Ghosh, M.K.; Parhi, P.; Mukherjee, P.S.; Mishra, B.K. Waste Printed Circuit Boards recycling: An extensive assessment of current status. J. Clean. Prod. 2015, 94, 5–19. [Google Scholar] [CrossRef]
  17. Wang, L.; Li, Q.; Sun, X.; Wang, L. Separation and recovery of copper from waste printed circuit boards leach solution using solvent extraction with Acorga M5640 as extractant. Sep. Sci. Technol. 2018, 54, 1302–1311. [Google Scholar] [CrossRef]
  18. Yoo, J.; Jeong, J.; Yoo, K.; Lee, J.; Kim, W. Enrichment of the metallic components from waste printed circuit boards by a mechanical separation process using a stamp mill. Waste Manag. 2009, 29, 1132–1137. [Google Scholar] [CrossRef] [PubMed]
  19. Veit, H.M.; Juchnes, N.C.; Scherer, J. Use of Gravity Separation in Metals Concentration from Printed Circuit Board Scraps. Metallurgy and materials. Rem Revista Escola de Minas 2014, 67, 73–79. [Google Scholar] [CrossRef]
  20. Burat, F.; Özer, M. Physical separation route for printed circuit boards. Physicochem. Probl. Miner. Process. 2018, 54, 554–566. [Google Scholar] [CrossRef]
  21. Keglevich de Buzin, P.J.W.; Ambrós, W.M.; Schadach de Brum, I.A.; Candiota Tubino, R.M.; Hoffmann Sampaio, C.; Oliva Moncunill, J. Development of a Physical Separation Route for the Concentration of Base Metals from Old Wasted Printed Circuit Boards. Minerals 2021, 11, 1014. [Google Scholar] [CrossRef]
  22. Zhu, X.; Zhang, L.; Dong, S.; Kou, W.; Nie, C.; Lyu, X.; Qiu, J.; Li, L.; Liu, Z.; Wu, P. Mechanical activation to enhance the natural floatability of waste printed circuit boards. Waste Manag. 2020, 109, 222–230. [Google Scholar] [CrossRef]
  23. Ogunniyi, I.; Vermaak, M.; Groot, D. Chemical composition and liberation characterization of printed circuit board comminution fines for beneficiation investigations. Waste Manag. 2009, 29, 2140–2146. [Google Scholar] [CrossRef]
  24. Arshadi, M.; Yaghmaei, S.; Mousavi, S.M. Content evaluation of different waste PCBs to enhance basic metals recycling. Resour. Conserv. Recycl. 2018, 139, 298–306. [Google Scholar] [CrossRef]
  25. Hubau, A.; Chagnes, A.; Minier, M.; Touzé, S.; Chapron, S.; Guezennec, A.G. Recycling-oriented methodology to sample and characterize the metal composition of waste Printed Circuit Boards. Waste Manag. 2019, 91, 62–71. [Google Scholar] [CrossRef]
  26. Bilesan, M.R.; Makarova, I.; Wickman, B.; Repo, E. Efficient separation of precious metals from computer waste printed circuit boards by hydrocyclone and dilution-gravity methods. J. Clean. Prod. 2021, 286, 125505. [Google Scholar] [CrossRef]
  27. Ichikawa, S.; Hirokawa, Y.; Kurisaki, T.; Nakamura, T. Characterization of a printed-circuit board by X-ray fluorescence and X-ray diffraction analyses for metal recovery. Spectrochim. Acta Part B At. Spectrosc. 2023, 210, 106819. [Google Scholar] [CrossRef]
  28. Agbim, A.; Schumacher, K.A.; Sharp, N.; Paul, R.; Corzo, R. Elemental characterization of electronic waste: A review of research methodologies and applicability to the practice of e-waste recycling. Waste Manag. 2024, 187, 91–100. [Google Scholar] [CrossRef]
  29. Gonçalves, P.P.; Otsuki, A. Determination of liberation degree of mechanically processed waste printed circuit boards by using the digital microscope and SEM-EDS analysis. Electronics 2019, 8, 1202. [Google Scholar] [CrossRef]
  30. Zhang, G.; He, Y.; Feng, Y.; Zhang, T.; Wang, H.; Zhu, X. Recovery of residual metals from fine nonmetallic fractions of waste printed circuit boards using a vibrated gas-solid fluidized bed. Sep. Purif. Technol. 2018, 207, 321–328. [Google Scholar] [CrossRef]
  31. Escalante, P.; Oliva, J.; Anticoi, H.; Hoffmann Sampaio, C.; Mohanty, K. Characterization of mineralogical impurities in a carbonate-rich material using MLA. Miner. Eng. 2025, 230, 109409. [Google Scholar] [CrossRef]
  32. Vanderbruggen, A.; Gugala, E.; Blannin, R.; Bachmann, K.; Serna-Guerrero, R.; Rudolp, M. Automated mineralogy as a novel approach for the compositional and textural characterization of spent lithium-ion batteries. Miner. Eng. 2021, 169, 106924. [Google Scholar] [CrossRef]
  33. Donnelly, L.; Pirrie, D.; Power, M.; Menzies, A. Phase Characterisation for Recycling of Shredded Waste Printed Circuit Boards. Recycling 2025, 10, 157. [Google Scholar] [CrossRef]
  34. Sun, Z.H.I.; Xiao, Y.; Sietsma, J.; Agterhuis, H.; Visser, G.; Yang, Y. Characterisation of metals in the electronic waste of complex mixtures of end-of-life ICT products for development of cleaner recovery technology. Waste Manag. 2015, 35, 227–235. [Google Scholar] [CrossRef]
  35. Lancaster, S.T.; Sahlin, E.; Oelze, M.; Ostermann, M.; Vogl, J.; Laperche, V.; Touze, S.; Ghestem, J.; Dalencourt, C.; Gendre, R.; et al. Evaluation of X-ray fluorescence for analysing critical elements in three electronic waste matrices: A comprehensive comparison of analytical techniques. Waste Manag. 2024, 190, 496–505. [Google Scholar] [CrossRef]
  36. Gok, Ö.; Akar Sen, G. Recovery of copper from printed circuit boards (PCBs) using shaking table. J. Serbian Chem. Soc. 2023, 88, 1039–1053. [Google Scholar] [CrossRef]
  37. Duana, C.; Wen, X.; Shi, C.; Zhao, Y.; Wen, B.; He, Y. Recovery of metals from waste printed circuit boards by a mechanical method using a water medium. J. Hazard. Mater. 2009, 166, 478–482. [Google Scholar] [CrossRef]
  38. Estrada-Ruiz, R.H.; Flores-Campos, R.; Gámez-Altamirano, H.A.; Velarde-Sánchez, E.J. Separation of the metallic and non-metallic fraction from printed circuit boards employing green technology. J. Hazard. Mater. 2016, 311, 91–99. [Google Scholar] [CrossRef]
  39. Veit, H.M.; Diehl, T.R.; Salami, A.P.; Rodrigues, J.S.; Bernardes, A.M.; Teno’rio, J.A.S. Utilization of magnetic and electrostatic separation in the recycling of printed circuit boards scrap. Waste Manag. 2005, 25, 67–74. [Google Scholar] [CrossRef]
  40. Farajzadeh, S.; Chelgani, S.C. Gravity separation by falcon concentrator- an over review. Sep. Sci. Technol. 2022, 57, 2145–2164. [Google Scholar] [CrossRef]
  41. Guo, C.; Wang, H.; Liang, W.; Fu, J.; Yi, X. Liberation characteristic and physical separation of printed circuit board (PCB). Waste Manag. 2011, 31, 2161–2166. [Google Scholar] [CrossRef]
  42. Tanısalı, E.; Özer, M.; Burat, F. Precious Metals Recovery from Waste Printed Circuit Boards by Gravity Separation and Leaching. Miner. Process. Extr. Metall. Rev. 2020, 42, 24–37. [Google Scholar] [CrossRef]
  43. Palav, S.D.; Torres, A.; Biegler, L.T. Systematic conceptual design strategies for the recovery of metals from E-waste. Front. Chem. Eng. 2024, 6, 1388456. [Google Scholar] [CrossRef]
  44. Lopez-Paneque, A.M.; Gallardo Garcia-Orta, V.H.; Gallardo, J.M.; Sepulveda-Ferrer, R.E.; Chicardi, E. The Influence of Electrostatic Separation Parameters on the Recovery of Metals from Pre-Crushed PCBs. Metals 2025, 15, 826. [Google Scholar] [CrossRef]
  45. Abbadi, A.; Bokanyi, L. Flotation of comminuted waste printed circuit boards particles—A review. Miner. Eng. 2025, 233, 109642. [Google Scholar] [CrossRef]
  46. Kumar, A.; Holuszko, M.E.; Janke, T. Assessing the Applicability of Gravity Separation for Recycling of Non-Metal Fraction from Waste Printed Circuit Boards. Adv. Sustain. Syst. 2022, 6, 2000231. [Google Scholar] [CrossRef]
  47. Das, S.K.; Ellamparuthy, G.; Kundu, T.; Angadi, S.I.; Rath, S.S. A comprehensive review of the mechanical separation of waste printed circuit boards. Process Saf. Environ. Prot. 2024, 187, 221–239. [Google Scholar] [CrossRef]
  48. Fitzpatrick, R.; Hegarty, P.; Fergusson, K.; Rollinson, G.; Xie, W.; Mildren, T. Optimisation of a Multi-Gravity Separator with Novel Modifications for the Recovery of Ferberite. Minerals 2018, 8, 191. [Google Scholar] [CrossRef]
  49. Bhaskar, K.U.; Rao1, K.K.; Govindarajan1, B.; Barnwal1, J.P.; Rao, T.C. Studies on multi-gravity separator for rejection of acid insoluble in a copper concentrate. Eur. J. Miner. Process. Environ. Prot. 2005, 5, 35–47. [Google Scholar]
  50. Mori de Oliveira, C.; Bellopede, R.; Tori, A.; Marini, M.P. Study of Metal Recovery from Printed Circuit Boards by Physical-Mechanical Treatment Processes. Mater. Proc. 2021, 5, 121. [Google Scholar] [CrossRef]
  51. Burt, R.O. Gravity Concentration Technology; Developments in Mineral Processing; Elsevier Science Ltd.: Amsterdam, The Netherlands, 1984; Volume 5. [Google Scholar]
  52. Gupta, A.; Yan, D.S. Mineral Processing Design and Operations: An Introduction, 1st ed.; Elsevier Science: Amsterdam, The Netherlands, 2006. [Google Scholar]
  53. Franke, D.M.; Suponik, T.; Nuckowski, P.M.; Dubaj, J. Evaluation of the efficiency of metal recovery from printed circuit boards using gravity processes. Physicochem. Probl. Miner. Process. 2021, 57, 63–77. [Google Scholar] [CrossRef]
  54. Lee, J.; Kim, Y.; Lee, J. Disassembly and physical separation of electric/electronic components layered in printed circuit boards (PCB). J. Hazard. Mater. 2012, 241–242, 387–394. [Google Scholar] [CrossRef]
  55. Huang, Y.F.; Chou, S.L.; Lo, S.L. Gold recovery from waste printed circuit boards of mobile phones by using microwave pyrolysis and hydrometallurgical methods. Sustain. Environ. Res. 2022, 32, 6. [Google Scholar] [CrossRef]
  56. Wang, R.; Zhang, C.; Zhao, Y.; Zhou, Y.; Ma, E.; Bai, J.; Wang, J. Recycling gold from printed circuit boards gold-plated layer of waste mobile phones in “mild aqua regia” system. J. Clean. Prod. 2021, 278, 123597. [Google Scholar] [CrossRef]
  57. Cardenas-Vera, A.; Hesse, M.; Möckel, R.; Merker, R.G.; Heinig, T.; Phan, Q.V. Investigation of Sensor-Based sorting and selective comminution for pre-concentration of an unusual parisite-rich REE ore, South Namxe, Vietnam. Miner. Eng. 2022, 177, 107371. [Google Scholar] [CrossRef]
  58. Sandmann, D.; Gutzmer, J. Use of Mineral Liberation Analysis (MLA) in the Characterization of Lithium-Bearing Micas. J. Miner. Mater. Charact. Eng. 2013, 1, 285–292. [Google Scholar] [CrossRef]
  59. Yao, Y.; Zhou, K.; He, J.; Zhu, L.; Zhao, Y.; Bai, Q. Efficient recovery of valuable metals in the disposal of waste printed circuit boards via reverse flotation. J. Clean. Prod. 2021, 284, 124805. [Google Scholar] [CrossRef]
  60. Magoda, K.; Nomngongo, P.N.; Mekuto, L. Two-Step Bio-Dissolution of Metals from Printed Circuit Boards Using Acidophilic Iron- and Sulfur-Oxidizing Mesophiles. Recycling 2024, 9, 6. [Google Scholar] [CrossRef]
  61. Tan, Q.; Liu, L.; Yu, M.; Li, J. An innovative method of recycling metals in printed circuit board (PCB) using solutions from PCB production. J. Hazard. Mater. 2020, 390, 121892. [Google Scholar] [CrossRef]
  62. Ajiboye, A.E.; Olasehinde, F.E.; Adebayo, O.A.; Ajayi, O.J.; Ghosh, M.K.; Basu, S. Extraction of Copper and Zinc from Waste Printed Circuit Boards. Recycling 2019, 4, 36. [Google Scholar] [CrossRef]
  63. Ogunniyi, I.O.; Vermaak, M.K.G. Investigation of froth flotation for beneficiation of printed circuit board comminution fines. Miner. Eng. 2009, 22, 378–385. [Google Scholar] [CrossRef]
  64. Chen, L.; He, J.; Zhu, L.; Yao, Q.; Sun, Y.; Guo, C.; Chen, H.; Yang, B. Efficient recovery of valuable metals from waste printed circuit boards via ultrasound-enhanced flotation. Process Saf. Environ. Prot. 2023, 169, 869–878. [Google Scholar] [CrossRef]
  65. He, J.; Duan, C. Recovery of metallic concentrations from waste printed circuit boards via reverse floatation. Waste Manag. 2017, 60, 618–628. [Google Scholar] [CrossRef] [PubMed]
  66. Ogunniyi, I.O.; Vermaak, M.K.G. Froth Flotation for Beneficiation of Printed Circuit Boards Comminution Fines: An Overview. Miner. Process. Extr. Met. Rev. 2009, 30, 101–121. [Google Scholar] [CrossRef]
  67. Ismail Mohamed, A.T.; Schimperna, G.; Cantoni, G.; Demichelis, F.; Fino, D.; Perucchini, S.; Rubertelli, F.; Laviano, F. Effect of Solvent Pre-Treatment on the Leaching of Copper During Printed Circuit Board Recycling. Recycling 2025, 10, 80. [Google Scholar] [CrossRef]
  68. Magoda, K.; Mekuto, L. Biohydrometallurgical Recovery of Metals from Waste Electronic Equipment: Current Status and Proposed Process. Recycling 2022, 7, 67. [Google Scholar] [CrossRef]
  69. Xian, Y.; Tao, Y.; Ma, F.; Zhou, Y. Recovery of Metals from Heat-Treated Printed Circuit Boards via an Enhanced Gravity Concentrator and High-Gradient Magnetic Separator. Materials 2021, 14, 4566. [Google Scholar] [CrossRef]
  70. Priya, A.; Hait, S. Comprehensive characterization of printed circuit boards of various end-of-life electrical and electronic equipment for beneficiation investigation. Waste Manag. 2018, 75, 103–123. [Google Scholar] [CrossRef] [PubMed]
  71. Wang, R.; Fan, G.; Zhang, C. Process and systematic study of gold recovery from flexible printed circuit boards (FPCBs) using a choline chloride–ethylene glycol system. Waste Manag. 2024, 178, 351–361. [Google Scholar] [CrossRef] [PubMed]
  72. Ilkhani, Z.; Aiouache, F. Bioleaching of Gold from Printed Circuit Boards: Potential Sustainability of Thiosulphate. Recycling 2025, 10, 87. [Google Scholar] [CrossRef]
  73. Martinez-Ballesteros, G.; Valenzuela-García, G.L.; Gómez-Alvarez, A.; Encinas-Romero, M.A.; Mejía-Zamudio, F.A.; Rosas-Durazo, A.D.J.; Valenzuela-Frisby, R. Recovery of Ag, Au, and Pt from Printed Circuit Boards by Pressure Leaching. Recycling 2021, 6, 67. [Google Scholar] [CrossRef]
  74. Marques, A.C.; Marrero, J.M.C.; Malfatti, C.F. A review of the recycling of non-metallic fractions of printed circuit boards. SpringerPlus 2013, 2, 521. [Google Scholar] [CrossRef] [PubMed]
  75. Kaya, M. Recovery of metals and nonmetals from electronic waste by physical and chemical recycling processes. Waste Manag. 2016, 57, 64–90. [Google Scholar] [CrossRef] [PubMed]
  76. Krishnan, S.; Bhagavatula, S.G.K.; Karingamanna, J.; Madhavan, M.K. An Experimental Investigation into the Performance of Concrete and Mortar with Partial Replacement of Fine Aggregate by Printed Circuit Board (PCB) E-Waste. Recycling 2025, 10, 138. [Google Scholar] [CrossRef]
  77. Flores-Campos, R.; Deaquino-Lara, R.; Rodríguez-Reyes, M.; Martínez-Sánchez, R.; Estrada-Ruiz, R.H. The Use of Nonmetallic Fraction Particles with the Double Purpose of Increasing the Mechanical Properties of Low-Density Polyethylene Composite and Reducing the Pollution Associated with the Recycling of Metals from E-Waste. Recycling 2024, 9, 56. [Google Scholar] [CrossRef]
  78. Primary Copper Smelting: National Emissions Standards for Hazardous Air Pollutants (NESHAP), EPA Unitaed States Environmental Protection Agency. Available online: https://www.epa.gov/stationary-sources-air-pollution/primary-copper-smelting-national-emissions-standards-hazardous-air#:~:text=Rule%20Summary,-Alert&text=Primary%20copper%20smelting%20is%20the,50%20percent%20from%20these%20sources (accessed on 14 November 2025).
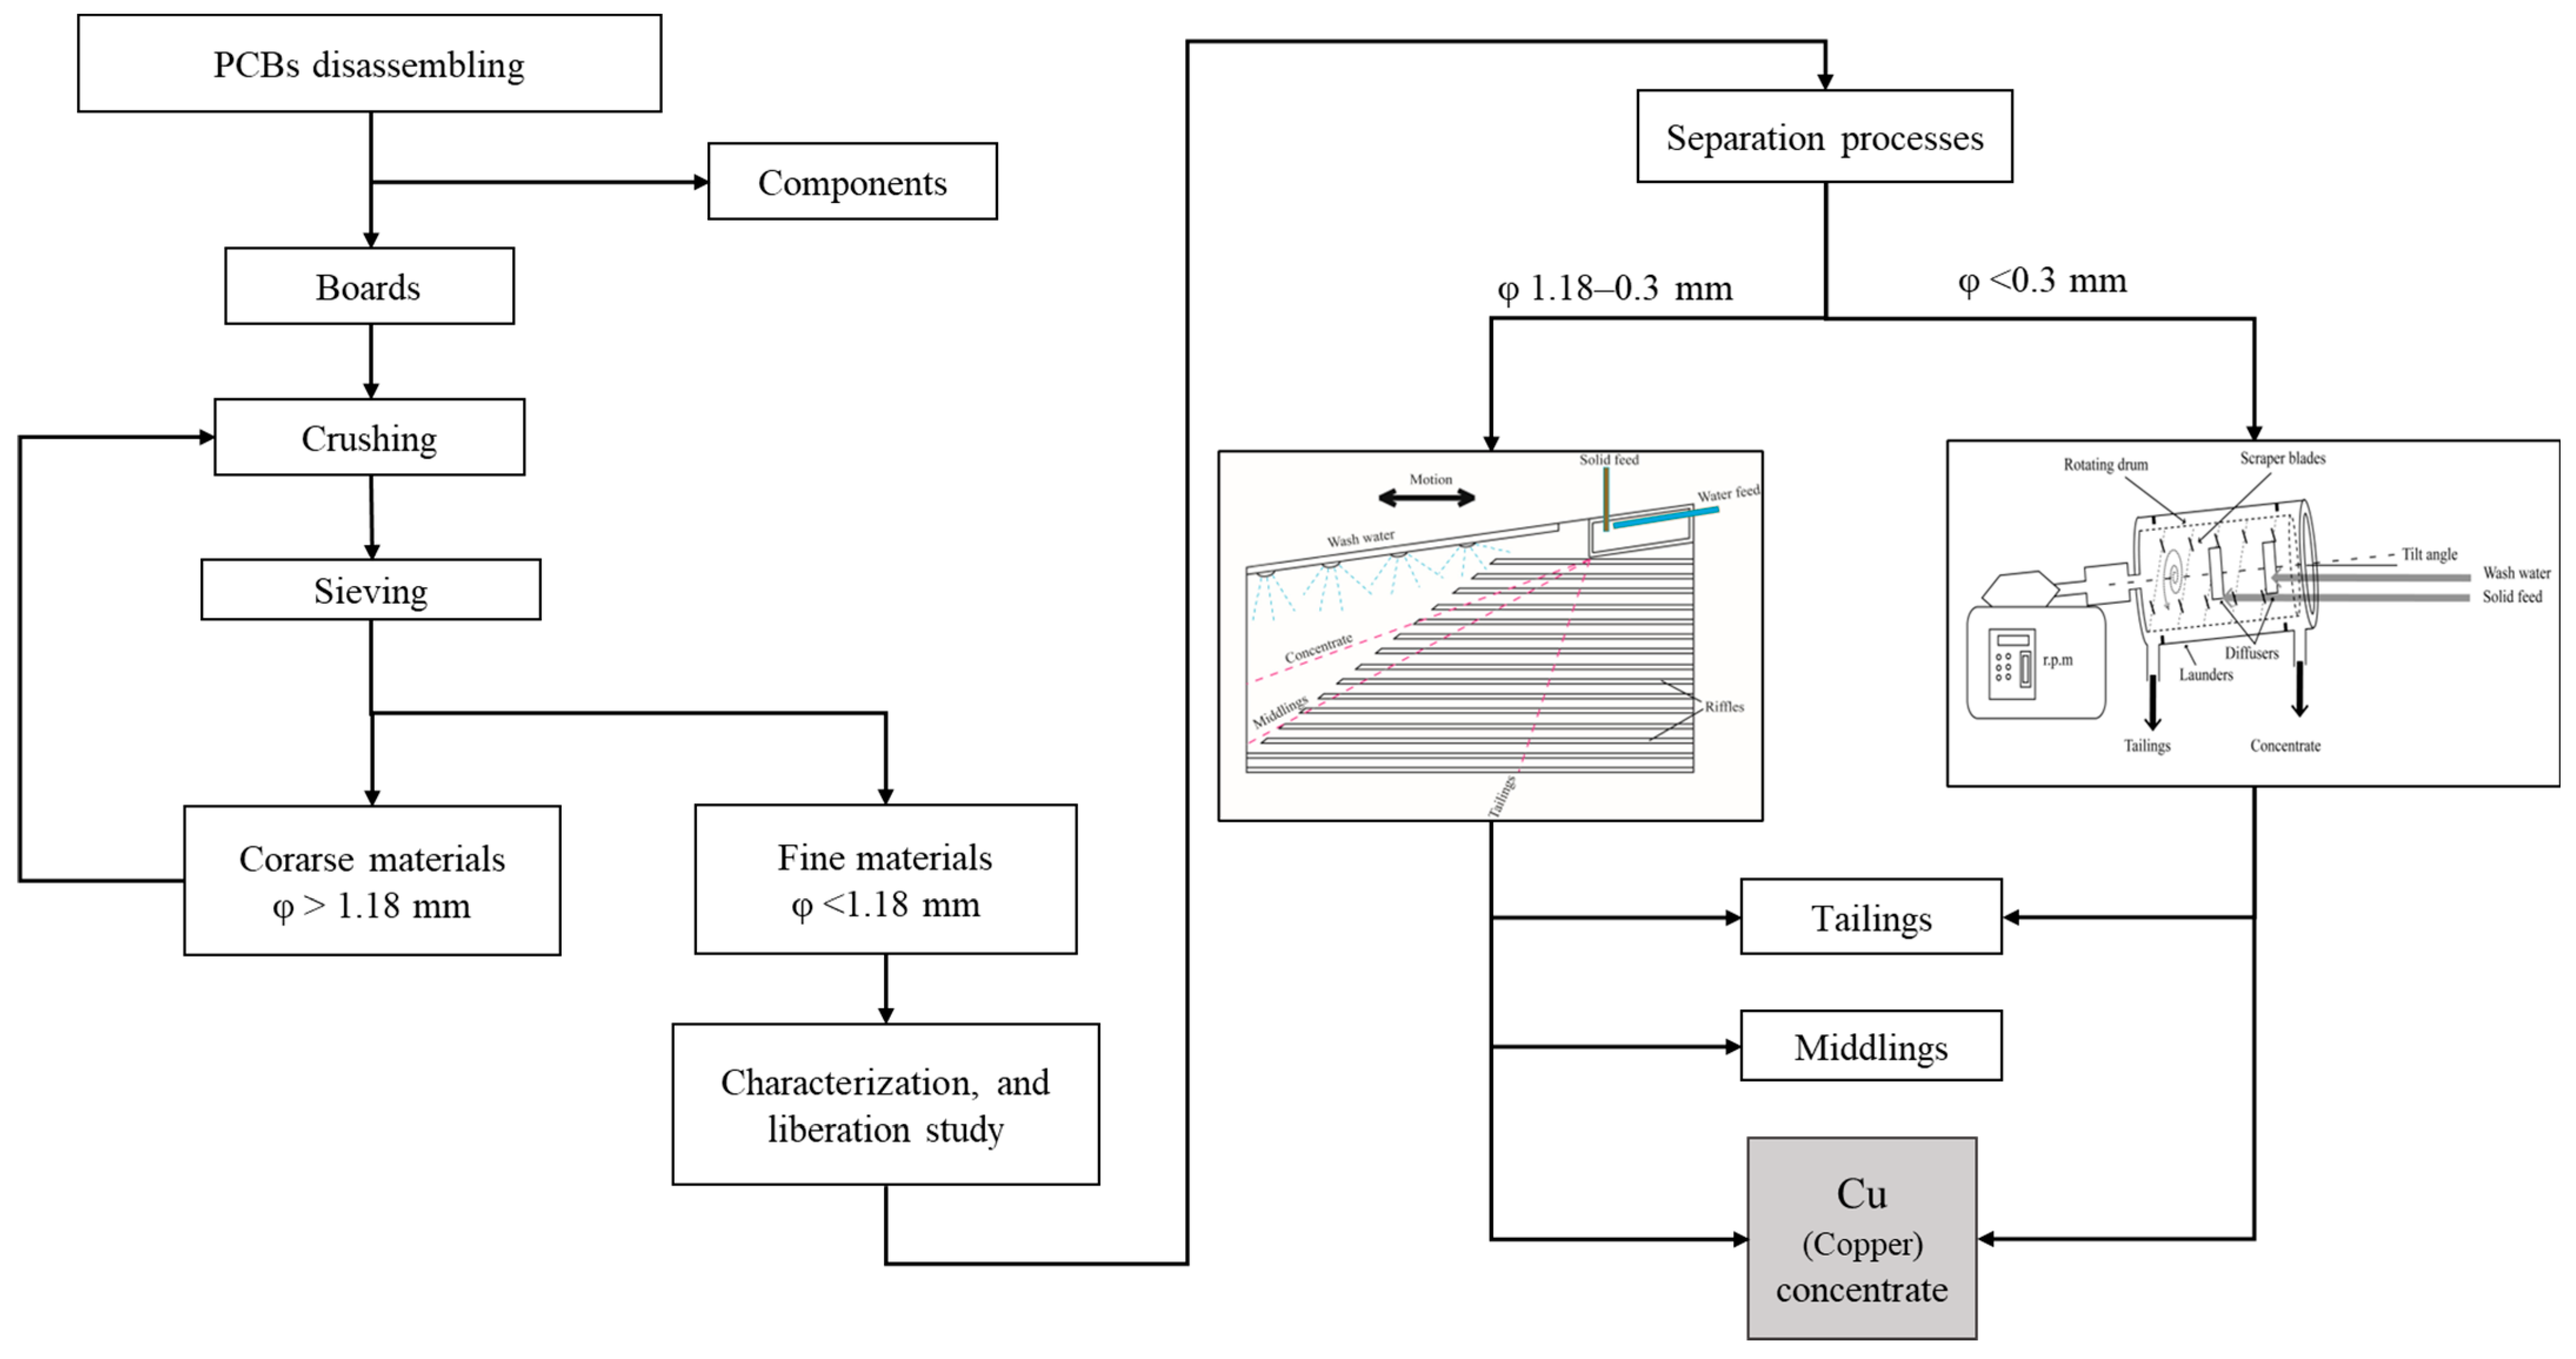
Figure 1. Preparation plan for the recovery of copper from WPCBs.
Minerals 15 01259 g001
Figure 2. The cross-section figure of the shaking table.
Minerals 15 01259 g002
Figure 3. The cross-section figure of the MGS.
Minerals 15 01259 g003
Figure 4. (a) disassembling the WPCBs, (b) PSD of the crushed WPCBs, (c) results of the crushing with the Easy Chop Chopper.
Minerals 15 01259 g004
Figure 5. Different-sized fractions of the crushed WPCBs under optical microscopy. (a) 500 × 1180 µm, (b) 250 × 500 µm, (c) 150 × 250 µm, (d) 100 × 150 µm, (e) 63 × 100 µm, (f) −63 µm.
Minerals 15 01259 g005
Figure 6. WPCB powder under an optical microscope with reflected light at different magnifications. (a,b) WPCB powder with ×5 magnification, (c,d) WPCB powder with × 10 magnification, (e,f) WPCB powder with ×20 magnification.
Minerals 15 01259 g006
Figure 7. SEM-EDS analysis of the feed and different particle size ranges of WPCBs. (a,b) −100 µm, (c) 100 × 250 µm, (d) 250 × 500 µm, (e) 500 × 1180 µm, (f) feed.
Minerals 15 01259 g007
Figure 8. The liberation degree of Cu in 3 different particle sizes. (a) 300 × 1180 µm, (b) 100 × 300 µm, (c) −100 µm.
Minerals 15 01259 g008
Figure 9. Cu association analysis in three different particle size ranges in wt%.
Minerals 15 01259 g009
Figure 10. Cumulative mass of the Cu in different particle size ranges.
Minerals 15 01259 g010
Figure 11. Proposed flowsheet for Cu beneficiation.
Minerals 15 01259 g011
Table 1. XRF determination of the crushed WPCBs in wt%.
<100,
µm
100 × 250,
µm
250 × 500,
µm
500 × 1180,
µm
Feed,
µm
Al2O36.87.47.98.96.4
CaO15.011.610.68.713.6
SiO236.125.723.219.935.0
Fe2O32.91.40.70.51.6
Cu4.813.213.018.911.0
Br5.712.913.010.99.4
Sb0.160.210.230.250.22
Ba1.40.90.30.20.5
W5.94.53.52.13.8
Table 2. Chemical composition of the crushed WPCBs using ICP-OES in wt%.
<100,
µm
100 × 250,
µm
250 × 500,
µm
500 × 1180,
µm
Feed,
µm
ppm
Au846.79149.38176.3269.45400.64
Ag116.68236.79185.84397.74236.84
Pb455.14640.74889.85714.07747.33
Co23.2313.6025.1327.0138.99
%
Sn1.602.333.364.233.24
Ni0.420.400.581.120.65
Ti0.190.140.070.080.12
Table 3. Cu content in three different particle sizes by MLA techniques.
Particle Size Ranges, µmwt%
300 × 11809.65
100 × 3004.58
<1004.25
Table 4. Shaking table results.
ConcentrationMiddlingsWaste
Mass, gDeck Angle,
Ɵ
Frequency, HzWash Water, L/minProcess Water, L/minMass, %Cu,
%
Cu R, %Mass, %Cu,
%
Cu R, %Mass, %Cu, %Cu R, %
296.416012837.930.794.653.40.94.18.71.91.4
298.226012836.940.19538.71.84.524.40.30.5
312.536012843.647.773.239.918.42616.51.50.8
322.94402445.2428346.57.815.98.431.1
300.95502444.747.882.123.517.315.731.81.82.3
319.25604429.456.760.940.324.536.130.32.73
Table 5. MGS results.
ConcentrationWaste
Mass, gWash Water, L/minDrum Revolutions, rpmDeck Angle, ƟMass, %Cu, %Cu R, %Mass, %Cu, %Cu R, %
<100 µm
106.20.53002.452.47.381.547.61.818.5
203.30.5295317.818.465.382.22.134.7
195.80.92902.948.519.240.991.52.659.1
100 × 300 µm
86.70.53002.459.811.59440.11.16
153.40.53003.421.440.180.478.62.719.6
202.70.5305317.237.956.982.8643.1
Disclaimer/Publisher’s Note: The statements, opinions and data contained in all publications are solely those of the individual author(s) and contributor(s) and not of MDPI and/or the editor(s). MDPI and/or the editor(s) disclaim responsibility for any injury to people or property resulting from any ideas, methods, instructions or products referred to in the content.