Article

Quantitative Characterization of Deep Shale Gas Reservoir Pressure-Solution and Its Influence on Pore Development in Cases of Luzhou Area in Sichuan Basin

1
School of Geoscience and Technology, Southwest Petroleum University, Chengdu 610500, China
2
Shale Gas Research Institute of PetroChina Southwest Oil and Gas Field Company, Chengdu 610051, China
3
Sicuan Shale Gas Exploration and Development Company Limited, Chengdu 610051, China
4
Changning Shale Gas Exploration and Development Company Limited, Chengdu 610051, China
5
National Key Laboratory for Deep Oil and Gas, China University of Petroleum (East China), Qingdao 266580, China
*
Author to whom correspondence should be addressed.
Minerals 2025, 15(12), 1241; https://doi.org/10.3390/min15121241
Submission received: 19 October 2025 / Revised: 16 November 2025 / Accepted: 18 November 2025 / Published: 24 November 2025
(This article belongs to the Section Mineral Exploration Methods and Applications)

Abstract

The phenomenon of pressure-solution (PS) is widespread in deep marine shale reservoirs of the Longmaxi Formation in the Sichuan Basin, affecting pore development. However, systematic reports on the study of PS in shale reservoirs are yet to be seen. This study performed large-field scanning electron microscopy, mineral quantitative identification, low-pressure gas adsorption, and high-pressure mercury injection experiments on shale cores from the Longmaxi Formation. The pore structure characteristics and the PS process of deep shale reservoirs were clarified, a semi quantitative analysis method for PS was constructed, and the influence of PS on pore development was explored. Our results demonstrate that PS is widely present in deep gas shale reservoirs, primarily manifesting in the form of mineral transformation and fusion, particularly involving clay and quartz minerals. This process alters the mineral composition and particle size of the shale reservoirs. A semi-quantitative analysis method for PS and the action strength parameter QP has been established, based on the mineral composition and particle size of shale reservoirs. This parameter exhibits a positive correlation with burial depth, water saturation, and quartz content. The primary effect of PS on pore development is that, as mineral transformation results in an elevation of quartz content and an increase in particle size, pore dimensions undergo compression and subsequently diminish. This underscores why shale reservoirs containing over 70% quartz are unfavorable for pore development. Therefore, when the water saturation in the Longmaxi Formation shale reservoir exceeds 40% and the quartz content surpasses 70%, significant risks are present in the exploration and development of shale gas.

1. Introduction

Following over a decade of dedicated technical research, the commercial extraction of shale gas from the Upper Ordovician Wufeng Formation and the Lower Silurian Longmaxi Formation in the Sichuan Basin has been successfully realized in shallow-middle depth layers (with depths less than 3500 m) [1,2]. We have also developed the foundational technical expertise for the large-scale extraction of deep marine shale gas buried over 3500 m [3]. Notably, significant advancements have been achieved in the Luzhou-Western Chongqing area [4,5], signifying promising potential for the continued exploration and development of deep shale gas reserves. Compared with the shallow-middle shale, deep shale gas reserves exhibit complex diagenetic environments characterized by high temperature, elevated pressure, and high water content, with water saturation ranging from 10% to 80%, mainly distributed from 20% to 60% [6,7], which is bound to cause stronger compaction, dissolution and pressure-solution (PS). This results in more complex controlling factors for the development of micro-pore structures in deep shale gas reservoirs, which restricts the large-scale extraction of deep shale gas.
Currently, the methods for studying the micro-pore structure of shale reservoirs are quite advanced, primarily consisting of direct observation techniques, such as argon ion polishing and field emission scanning electron microscopy (FE-SEM), nano-CT, and focused ion beam scanning electron microscopy (FIB-SEM) [8,9] and indirect fluid injection methods, including CO2 adsorption, N2 adsorption, high-pressure mercury injection, and nuclear magnetic resonance [10,11]. To enhance the characterization of the micro-pore structure in shale reservoirs, it is essential to integrate these two approaches [12,13]. To simultaneously observe the microscopic distribution characteristics of mineral frameworks and pores, this research primarily employs large-field argon ion polishing scanning electron microscopy (Maps), along with N2 adsorption and high-pressure mercury injection, for the effective characterization of the micro-pore structure in shale reservoirs. Scholars have also conducted extensive research into the factors controlling the development of pore structure, including types and abundance of organic matter, degree of thermal evolution, mineral composition, diagenesis, structural conditions, and preservation conditions [14,15,16,17,18,19,20,21]. The Longmaxi Formation’s shale reservoirs formed within a stable marine environment, sharing similarities in mineral composition and types of organic matter with those formed contemporaneously [22,23]. Consequently, diagenesis within complex structural settings plays a pivotal role in the development of pore structures. Diagenesis in shale reservoirs encompasses organic (thermal evolution of organic matter) and inorganic processes, influencing the mineral composition and pore development of shale. The stages of organic diagenesis are clearly demarcated [14,24]. Previous research indicates that mineral composition and diagenesis are crucial for the formation and evolution of inorganic micro- and nano-pore systems [25,26,27]. The study of inorganic diagenesis primarily employs FE-SEM to analyze micro-component composition and arrangement, high-resolution scanning electron microscope cathodoluminescence (SEM-CL) and energy dispersive spectroscopy (EDS) to identify authigenic minerals, with a focus on characterizing the mineral distribution patterns and pore features of shale [28,29]. Overall, the small particle and pore sizes in shale reservoirs make observation challenging, thereby limiting diagenesis research to qualitative descriptions.
Previous researchers have had a deep understanding of the mechanical compaction effect of shale pore spaces [30,31]. The primary minerals in the Longmaxi Formation shale are quartz and clay, with diagenesis inevitably and closely linked to these minerals. Previous studies have extensively documented the sources and diagenetic evolution of quartz in the Longmaxi Formation, including the roles of biogenic silica, clay mineral transformation, and detrital input [21,26,32]. Furthermore, the interplay between quartz cementation, thermal maturity, and pore preservation has been a focus of research [15,33]. However, these studies have primarily focused on silica cementation and its preservational effect, often overlooking the specific process of pressure-solution (PS) and its quantitative impact on mineral fusion and pore destruction, particularly under the high water saturation conditions prevalent in deep reservoirs. Typically, the organic content in shale is positively correlated with quartz [29,34]. A higher quartz content ensures better protection for the development of organic pores within the organic matter due to the quartz particle framework [25,27]. Microcrystalline quartz, resulting from the transformation of clay diagenesis, may have a restricted impact on pore preservation. However, some studies have shown that an excessive increase in quartz content and quartz grain size is not conducive to the development of pores, but they do not explain the reasons for the increase in quartz content and quartz grain size [35,36]. It can be seen that people pay more attention to the mutual transformation of quartz and clay in shale reservoirs, while ignoring the PS of shale reservoirs. Concurrently, as deep shale gas exploration and development progress, numerous shale reservoirs with high water saturation have been encountered [6,7]. With the increase in water saturation and pressure, the diagenetic processes of shale become more complex, PS will become more prevalent, affecting the development of pores in the shale reservoir [33]. However, the factors influencing PS in deep shale reservoirs and their control over pore development remain poorly understood. So, unraveling the mechanisms behind high porosity development in deep shale reservoirs proves challenging.
Therefore, this study is designed to address a central scientific question: How does pressure-solution quantitatively control pore system evolution in deep shale reservoirs, and what are its key geological drivers? To answer this question, we focus on the following specific objectives: (1) to characterize the phenomena of PS and establish a quantitative parameter for its intensity; (2) to identify and quantify the key geological factors controlling PS; (3) to unravel the mechanistic links between PS intensity and the evolution of pore networks.

2. Geologic Background

The Sichuan Basin is located in the Upper Yangtze Basin and has undergone multiple tectonic evolution stages, including the Caledonian orogeny, the Hercynian-Indosinian orogeny, and the Yanshanian–Himalayan orogeny. It experienced prolonged subsidence in the early stages and rapid uplift in the later stages [37]. The basin is rhombic in shape, with distinct boundaries. It is bounded by the Dalou Mountain and Qiyao Mountain fault-fold belt in the east, the Qionglai Mountain and Longmenshan thrust belt in the west, the Micang Mountain and Daba Mountain in the north, and the Emei Mountain and Daliang Mountain in the south. The study area is situated in the low-steep structural belt of southern Sichuan (Figure 1a). The structure is relatively gentle, and the sedimentary background is stable. There is not much variation in stratum thickness, but the overall buried depth exceeds 3500 m (Figure 1b). To achieve precise exploration and development of shale gas, the Longyi 1 sub-member is divided into four sub-layers based on lithological, electrical, and paleontological characteristics, labeled as sub-layers 1 to 4. Among them, sub-layers 1 to 3 are high GR sections, while sub-layer 4 is a low GR section. From the bottom up, the lithology gradually transitions from black shale to silty grayish-black shale, with an increase in silt and clay content and a lighter color (Figure 1c). Currently, the target strata for shale gas exploration and development in southern Sichuan are sub-layers 1 to 3. Therefore, this study primarily focuses on investigating the PS and pore development characteristics of shale cores from these sub-layers in various shale gas wells within the study area. This aims to ensure consistency in their sedimentary environments and enhance the horizontal comparability among reservoirs. In this study, a total of 26 organic-rich black shale samples were selected from sub-layers 1 to 3 drilled core in southern Sichuan basin. The well location is far from the fault, which is less affected by tectonic movement [3]. To prevent moisture loss, the sample is sealed in a sealed bag for storage, and the water saturation test analysis is conducted immediately after coring.

3. Experiments

3.1. Total Organic Carbon Content Analysis

Total Organic Carbon content (TOC) is a critical parameter for assessing the gas-bearing properties of shale. In this experiment, a CS230 Carbon Sulfur Analyzer (LECO Corporation, St. Joseph, MI, USA) was utilized to determine the TOC of selected samples. First, approximately 10 g of the sample were crushed to a 100-mesh particle size and soaked in a mixture of diluted hydrochloric acid, pure hydrochloric acid, and water in a 1:7 ratio to eliminate carbonate minerals until no bubbles are produced. The sample was then washed with distilled water and subsequently dried at 60 °C. Following this, the powdered shale sample was placed into the Carbon Sulfur Analyzer, where it was pyrolyzed at 540 °C. The carbon dioxide generated from the pyrolysis of the sample was collected, and the total organic carbon content of the shale was calculated by analyzing the carbon dioxide content.

3.2. X-Ray Diffraction Analysis

In this paper, the mineral composition of selected shale samples was determined using X-ray diffraction with a Rigaku D/max-2550 PC X-ray diffractometer (Rigaku corporation, Tokyo, Japan). First, 10 g of shale samples were crushed to a 200-mesh particle size, and the clay minerals were separated using the gravity method. The relative content of the clay minerals was then determined. Both the shale samples without separated clay minerals and the separated clay minerals were dried, and the samples were analyzed using the X-ray diffraction analyzer after they had cooled. The X-ray diffraction analyzer utilized a copper X-ray tube with a voltage of 40 kV and a current of 30 mA. The scanning angle ranged from 2° to 70°, with a 0.02° interval for distributed scanning. The mineral composition content was calculated using Jade® 6.0 software.

3.3. Scanning Electron Microscope (SEM) Mpas

Maps technology offers advantages such as a wide field of view and high resolution, and it can be integrated with energy dispersive spectroscopy (EDS) to calculate the structural characteristics of minerals. The Quanta 650F field SEM (FEI Company, Hillsborough, OR, USA) was employed to continuously photograph the shale samples. The large-field, two-dimensional backscattered electron images were subsequently assembled, allowing for the identification of minerals. The specific steps are as follows: First, the sample was prepared as a 2 cm × 2 cm × 1 cm block, which was mechanically polished using sandpaper, followed by argon ion polishing. Next, the polished sample was coated with a ~10 nm thick gold-palladium (Au-Pd) conductive layer, an observation area was selected, and a series of continuous edge-coincidence 2D scanning electron microscope images were obtained through the combination of secondary electron imaging and backscatter imaging technology. Finally, the high-precision, large-field Maps 2D backscatter electron images were stitched together. Based on mineral chromatographic analysis technology, the mineral types in the selected areas of the samples were identified. The analysis results were processed using iDiscover, allowing for the assessment of mineral types and contents, including data on the area proportions of different minerals and the number of analyzed mineral particles.

3.4. Low Pressures Nitrogen Adsorption

Liquid nitrogen adsorption can clarify the specific surface area, pore volume, and pore size distribution of adsorption pores by analyzing the adsorption behavior of gas on solid surfaces. The ASAP2460 analyzer (Micromeritics Instrument Corporation, Norcross, GA, USA) was employed to conduct sample analysis and testing. The specific steps were as follows: The samples were crushed and screened to obtain approximately 3 g of 60–80 mesh material, and any moisture in the samples was removed by drying at 110 °C for 2 h. The mass of the empty sample tube was measured, and after placing the sample into the tube for vacuum treatment, the total mass of the sample tube and the sample was measured to determine the weight of the sample after degassing. Following this, parameters such as equilibrium relative pressure and experimental conditions were set, and the adsorption experiment was conducted. During the experiment, high-purity nitrogen was continuously injected, and the adsorption amount at different equilibrium relative pressures was recorded. After the experiment, the BET model was used to calculate the specific surface area, while the BJH model was employed to determine the pore size distribution and pore volume.

3.5. High Pressure Hg Injection

Based on the non-wettability of mercury on the solid surface, high-pressure mercury injection requires external force to overcome the capillary resistance to make mercury enter the solid pore throat, which can be used to measure the pore volume and pore size distribution of medium and large pores. The high pressure mercury injection instrument is AutoPoreIV9500 (Micromeritics Instrument Corporation, Norcross, GA, USA). The specific steps are as follows: the sample is made into a cube of 1 cubic centimeter and dried at 110 °C for 48 h; After the sample was loaded into the sample dilatometer and vacuumed, mercury was injected into the sample dilatant. Based on the mercury saturation relationship of mercury injection pressure gauge, capillary pressure curve was obtained to evaluate the pore throat configuration relationship of sample reservoir. In the experiment, the maximum inlet pressure of mercury is not 200 MPa, and the minimum throat radius of the probe hole is 4 nm.
To comprehensively characterize the full-aperture pore characteristics, a multi-scale integration method was adopted. The nitrogen adsorption data (DFT model) was directly used for micropores (<2 nm). For the mesopore range (2–50 nm), a unified approach was applied: data from the BJH model (derived from N2 adsorption) was given priority, as it more accurately reflects the pore-body size distribution. Mercury intrusion porosimetry (MIP) data, which characterizes pore-throat sizes, was relied upon exclusively for macropores (>50 nm). In the overlapping mesopore range, no scaling factor was applied; instead, the BJH data was preferentially used to avoid the well-known underestimation of pore volume by MIP in this range due to the “ink-bottle” effect and pore-throat access limitations. This approach ensures a more accurate representation of the pore-volume distribution across the entire spectrum.

4. Results

4.1. TOC and Mineral Composition

The TOC in the selected samples from Longmaxi 1–3 sub-layers in southern Sichuan spans from 2.69% to 7.32%, averaging at 4.51% (Table 1). Based on X-ray diffraction analysis, the quartz mineral content in the study area varies between 44.45% and 81.22%, with a mean of 66.06%. The clay mineral content ranges from 5.77% to 21.49%, averaging at 11.13%. Carbonate rock mineral content is between 2.44% and 37.59%, averaging at 16.81%. Pyrite content fluctuates between 0.49% and 2.76%, with a mean of 1.3% (Table 1). By analyzing the number of mineral particles and the area they occupy using SEM-Maps, we can approximately calculate mineral particle size. Overall, the mineral particle size ranges from 0.87 μm to 1.53 μm, averaging at 1.23 μm. Quartz particle size is between 1.11 μm and 2.94 μm, averaging at 1.85 μm.

4.2. Pore Structure

Based on the shapes of hysteresis loops observed in the nitrogen adsorption/desorption curves within the study area, it is evident that they primarily fall into the H2, H3, and H4 categories as per the IUPAC classification of hysteresis loops (Figure 2a). The high-pressure mercury injection test reveals the formation of hysteresis rings in all samples (Figure 2b), resembling those formed by nitrogen adsorption, suggesting numerous inkpot-shaped pores in the shale. The total pore volume measured by nitrogen adsorption is 0.0071~0.0189 cm3/g, and the pore volume measured by high pressure mercury injection is 0.0036~0.0125 cm3/g. In order to comprehensively characterize the full-aperture pore characteristics, a multi-scale integration method was adopted: nitrogen adsorption data of DFT model was directly used for micropores (<2 nm), the weighted average of BJH model and mercury injection method was used for medium pores (2~50 nm), and mercury injection data was completely relied on for large pores (>50 nm) [38,39]. The integrated pore volume was 0.00935~0.0243 cm3/g, averaging at 0.0159 cm3/g.
Utilizing Image J1.54r software for image processing, organic pores, inorganic pores, and micro-cracks were identified in SEM-Maps through grayscale image segmentation. Subsequently, the facial ratios of various pore types were calculated. The percentage of organic pores varied between 40.58% and 70.33%, averaging at 56.92%. The inorganic pore ratio spanned from 28.04% to 56.73%, with a mean of 39.13%. Lastly, the microfracture facial ratio ranged from 0.53% to 15.46%, averaging at 3.94% (Table 1).

5. Discussion

5.1. Phenomena and Characterization of PS

5.1.1. PS Characteristics

Under the pressure of overlying load, there is a higher effective pressure at the contact points of certain particles, which increases their solubility. This process, known as PS, significantly impacts the development and preservation of deep pores. PS can lead to the fusion of particles and the formation of dissolution pores at the edges of minerals, a phenomenon commonly observed in the diagenetic processes of clastic rocks. Due to the small size of mineral particles in shale reservoirs (typically less than 62.5 μm), it is challenging to observe and identify them after PS. Through detailed observation of Maps in this study, we conclude that PS is widespread in deep shale reservoirs, affecting the mineral composition and pore development within these reservoirs. Specific evidence includes:
(1)
Some particle contour shapes no longer exist
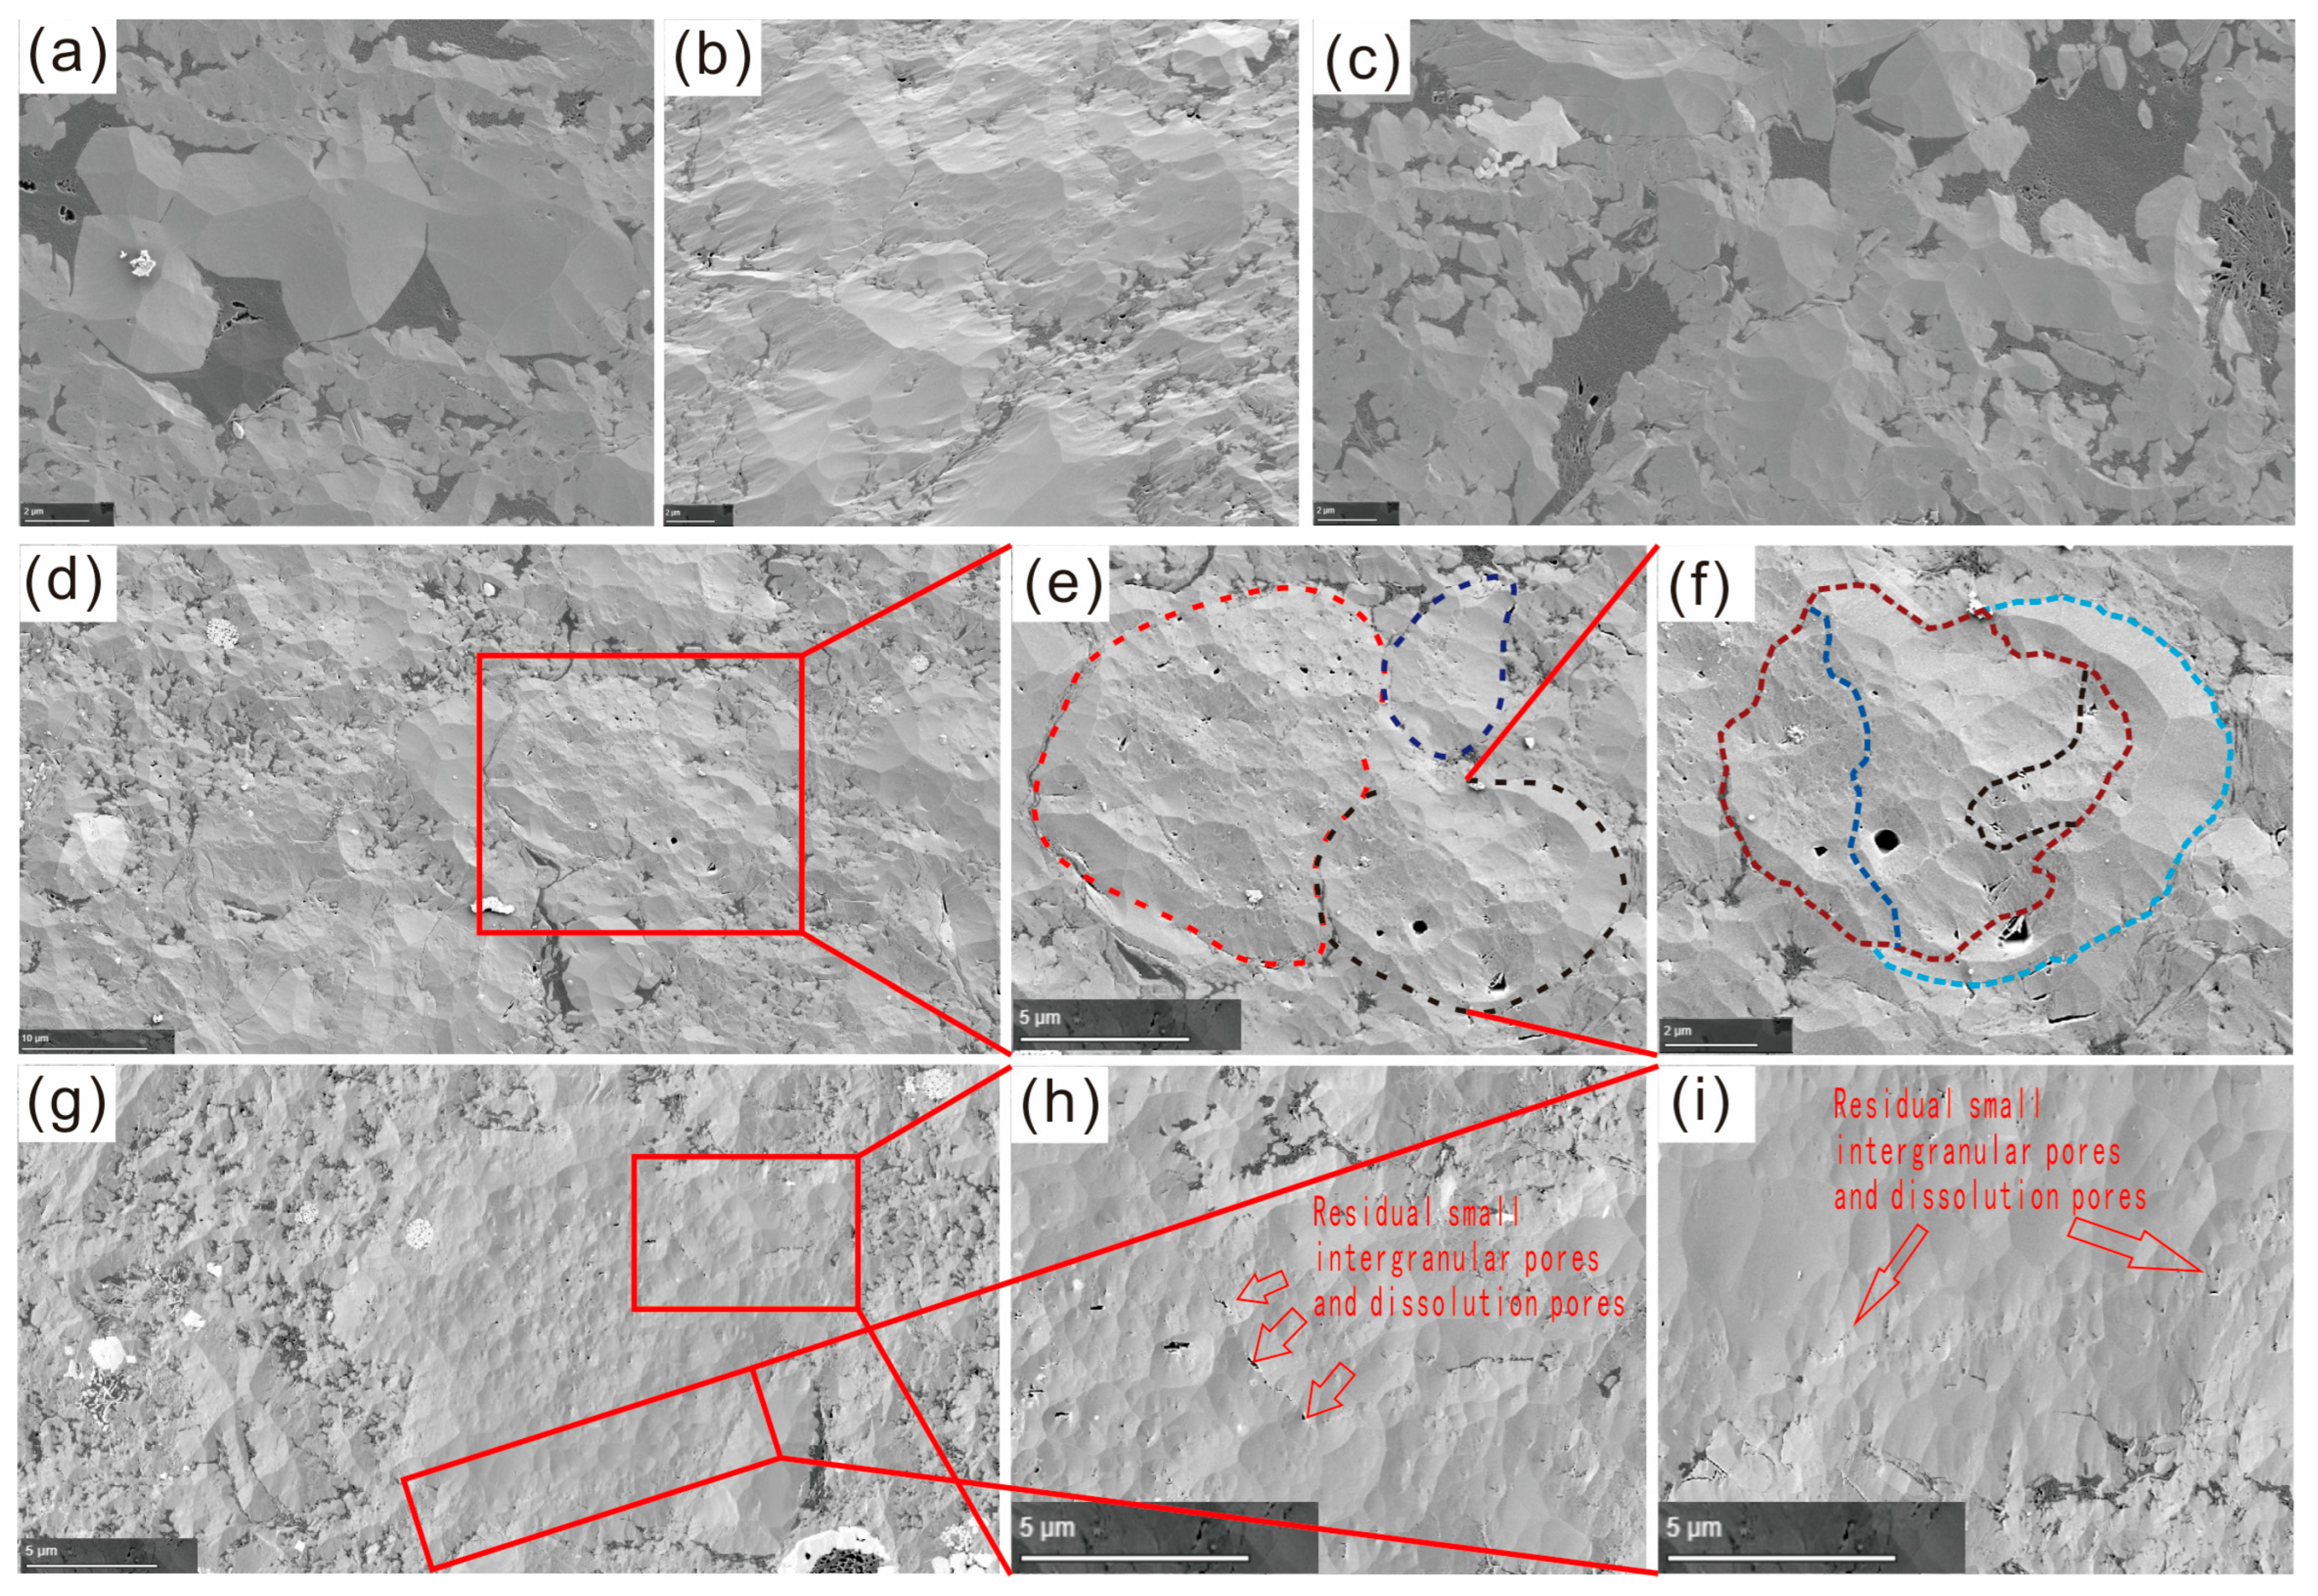
Through observing the Maps images of rock samples from Well JYT1 and Well NX202, it was discovered that the Longmaxi Formation shale reservoir cores from these two wells exhibit a significantly poor granularity when magnified 50,000 times. The particles are fused together (Figure 3a), with only some of the original particle contours remaining (Figure 3b,c). Notably, the Maps image from Well JYT1 reveals that the particles are “consolidated” with each other, indicating the presence of organic matter filling within, which varies in size. The organic matter with a limited distribution range fills the residual pores, resulting from insufficient “consolidation” between particles.
(2)
Discontinuous Sutures and Increased Particle Size
Large particles greater than 60 μm were identified in the shale reservoirs of Wells NX202 and L211 (Figure 3d). Upon magnification, it was observed that the contact sutures between the original particles were discontinuous, exhibiting clear fusion characteristics, while small dissolution pores remained. The mineral outlines from before the fusion of small particles can still be traced around the edges of these dissolution pores (Figure 3e,f).
(3)
Intergranular Dissolution and Organic Matter Filling
Residual particles displayed intergranular dissolution holes at their contacts, some of which were filled with organic matter. Inside the large particles, pyrite particles formed through recrystallization were noted, with some exhibiting a strawberry shape. Irregularly shaped intergranular pores developed within the large particles, characterized by rough edges and lacking obvious corrosion features (Figure 3g). Upon further magnification, it became evident that the fusion between particles was incomplete, revealing small intergranular dissolution pores at the contoured contacts of the remaining particles, primarily in the form of intergranular pores (Figure 3h). Additionally, the phenomenon of organic matter filling small pores at the edges of large particles was clearly visible, with such small, organically filled pores arranged in regular strip patterns (Figure 3i).
In summary, the disappearance of particle contours and mineral fusion represent the culmination of the PS process, where dissolution at contacts and precipitation in pores leads to textural homogenization. The observed discontinuous sutures and increased grain size are direct evidence of localized dissolution followed by the precipitation of the dissolved phase. Finally, the development of intergranular dissolution pores with subsequent organic matter infill captures an intermediate stage where transport and precipitation have not yet fully occluded the porosity. Collectively, these three microscopic phenomena provide direct visual evidence for the fundamental trilogy of pressure-solution: dissolution at grain contacts, mass transport along grain boundaries, and re-precipitation in adjacent pore spaces.

5.1.2. Quantitative Characterization of PS

The QEMSCAN technique enables the acquisition of both the surface area and particle count of different minerals within the mapping field of view. From this data, the average surface area of each mineral can be derived. By approximating mineral particles as circular shapes, the average particle size for all minerals, as well as for individual mineral types, can be calculated. To quantitatively assess the intensity of PS in shale reservoirs, it is imperative to develop a corresponding quantitative characterization model. A key characteristic observed after PS is the merging of particles, leading to an increase in particle size. Furthermore, an analysis of mineral composition using Mpas imaging reveals that the primary minerals undergoing particle fusion are quartz, with a minor component being carbonate minerals (Figure 3). Observations from actual Mpas mineral composition analysis images indicate significant variations in quartz content and average particle size among different shale reservoirs (Figure 4). Specifically, the quartz content in the shale reservoirs within the gas-producing interval of the study area ranges from 21.27% to 78.03%, with an average of 62.68%. Given that quartz is the dominant mineral constituent in the shale reservoirs of the Longmaxi Formation, changes in quartz particle size can serve as a reliable indicator of the reservoir’s PS intensity. Consequently, in shale reservoirs formed under similar sedimentary conditions, a larger quartz particle size in reservoirs resulting from complex structural and diagenetic processes suggests a higher intensity of PS. Based on the quartz mineral content, average quartz particle size, and overall rock particle size in shale reservoirs, a quantitative model for assessing PS parameters has been established:
Q p = C q D q D m
where Qp is the PS parameter, %; Cq is the percentage content of quartz, %; Dq is quartz particle size, μm; Dm is the average particle size of the mineral, μm. The above parameters can be obtained from Maps mineral analysis images, and the principle of particle size is equivalent circle radius. The Qp parameter physically represents the intensity of fabric modification driven by pressure-solution. It integrates the enrichment of quartz content (Cq) from silica redistribution and the relative coarsening of quartz grains (Dq/Dm), which results from the dissolution of smaller grains and reprecipitation on larger ones. The ratio Dq/Dm specifically isolates the diagenetic coarsening from the detrital background, making Qp a direct metric for the extent of textural equilibration achieved through intergranular dissolution-precipitation creep.
Following an Mpas analysis of shale samples from the Longmaxi Formation in the designated study area, the PS parameters were determined. The results indicated that the PS parameters for the 1–3 sub-layers strata ranged from 20% to 70%, with an average of 47.72%. Notably, there were substantial differences in these parameters across various strata and wells. Consequently, based on the magnitude of the PS parameter, the intensity of PS was categorized into three levels: low (<50%), moderate (50%~60%), and high (>60%).
The QP parameter provides a quantitative advancement over previous semi-empirical diagenetic indices by integrating two direct consequences of pressure-solution—the enrichment of quartz content (Cq) and the relative coarsening of quartz grains (Dq/Dm)-into a single metric. This offers an objective measure of diagenetic intensity, moving beyond qualitative descriptions of fabric maturity. In contrast to quartz cementation models that primarily predict porosity loss from authigenic pore-filling, the QP parameter specifically quantifies the fabric reorganization and concomitant porosity destruction attributable to intergranular dissolution and reprecipitation under differential stress. It thus serves as a complementary diagenetic index, uniquely quantifying the extent of textural equilibration driven by PS.

5.2. Characteristics of Shale Reservoirs with Different PS Intensities

5.2.1. Fabric Characteristics of Shale Reservoirs Under Different PS Intensities

In shale reservoirs with low PS intensity (Qp < 50%), the TOC varies between 2.69% and 7.32%, averaging at 4.22%. Porosity levels span from 3.6% to 6.44%, with a mean of 4.99%. Quartz content fluctuates between 44.45% and 69.99%, averaging at 58.69%. Additionally, the average particle size of quartz particles falls between 1.11 μm and 1.86 μm, with a mean of 1.34 μm.
For shale reservoirs experiencing moderate PS intensity (50% < Qp < 60%), the TOC ranges from 3.8% to 7.03%, averaging at 4.88%. Porosity levels are between 4.14% and 6.56%, averaging at 5.22%. Quartz content ranges from 60.96% to 78.03%, with a mean of 72.76%. The average size of quartz particles varies from 1.66 μm to 2.76 μm, averaging at 2.03 μm.
Regarding shale reservoirs with high PS intensity (Qp > 60%), the parameters are as follows: TOC spans from 3.94% to 5.25%, averaging at 4.57%. Porosity levels range from 1.87% to 3.95%, with a mean of 2.7%. Quartz content varies between 70.83% and 74.87%, averaging at 71.83%. Lastly, the average particle size of quartz particles is between 2.23 μm and 2.94 μm, averaging at 2.6 μm.

5.2.2. Micro-Pore Structure Characteristics of Shale Reservoirs Under Different PS Intensities

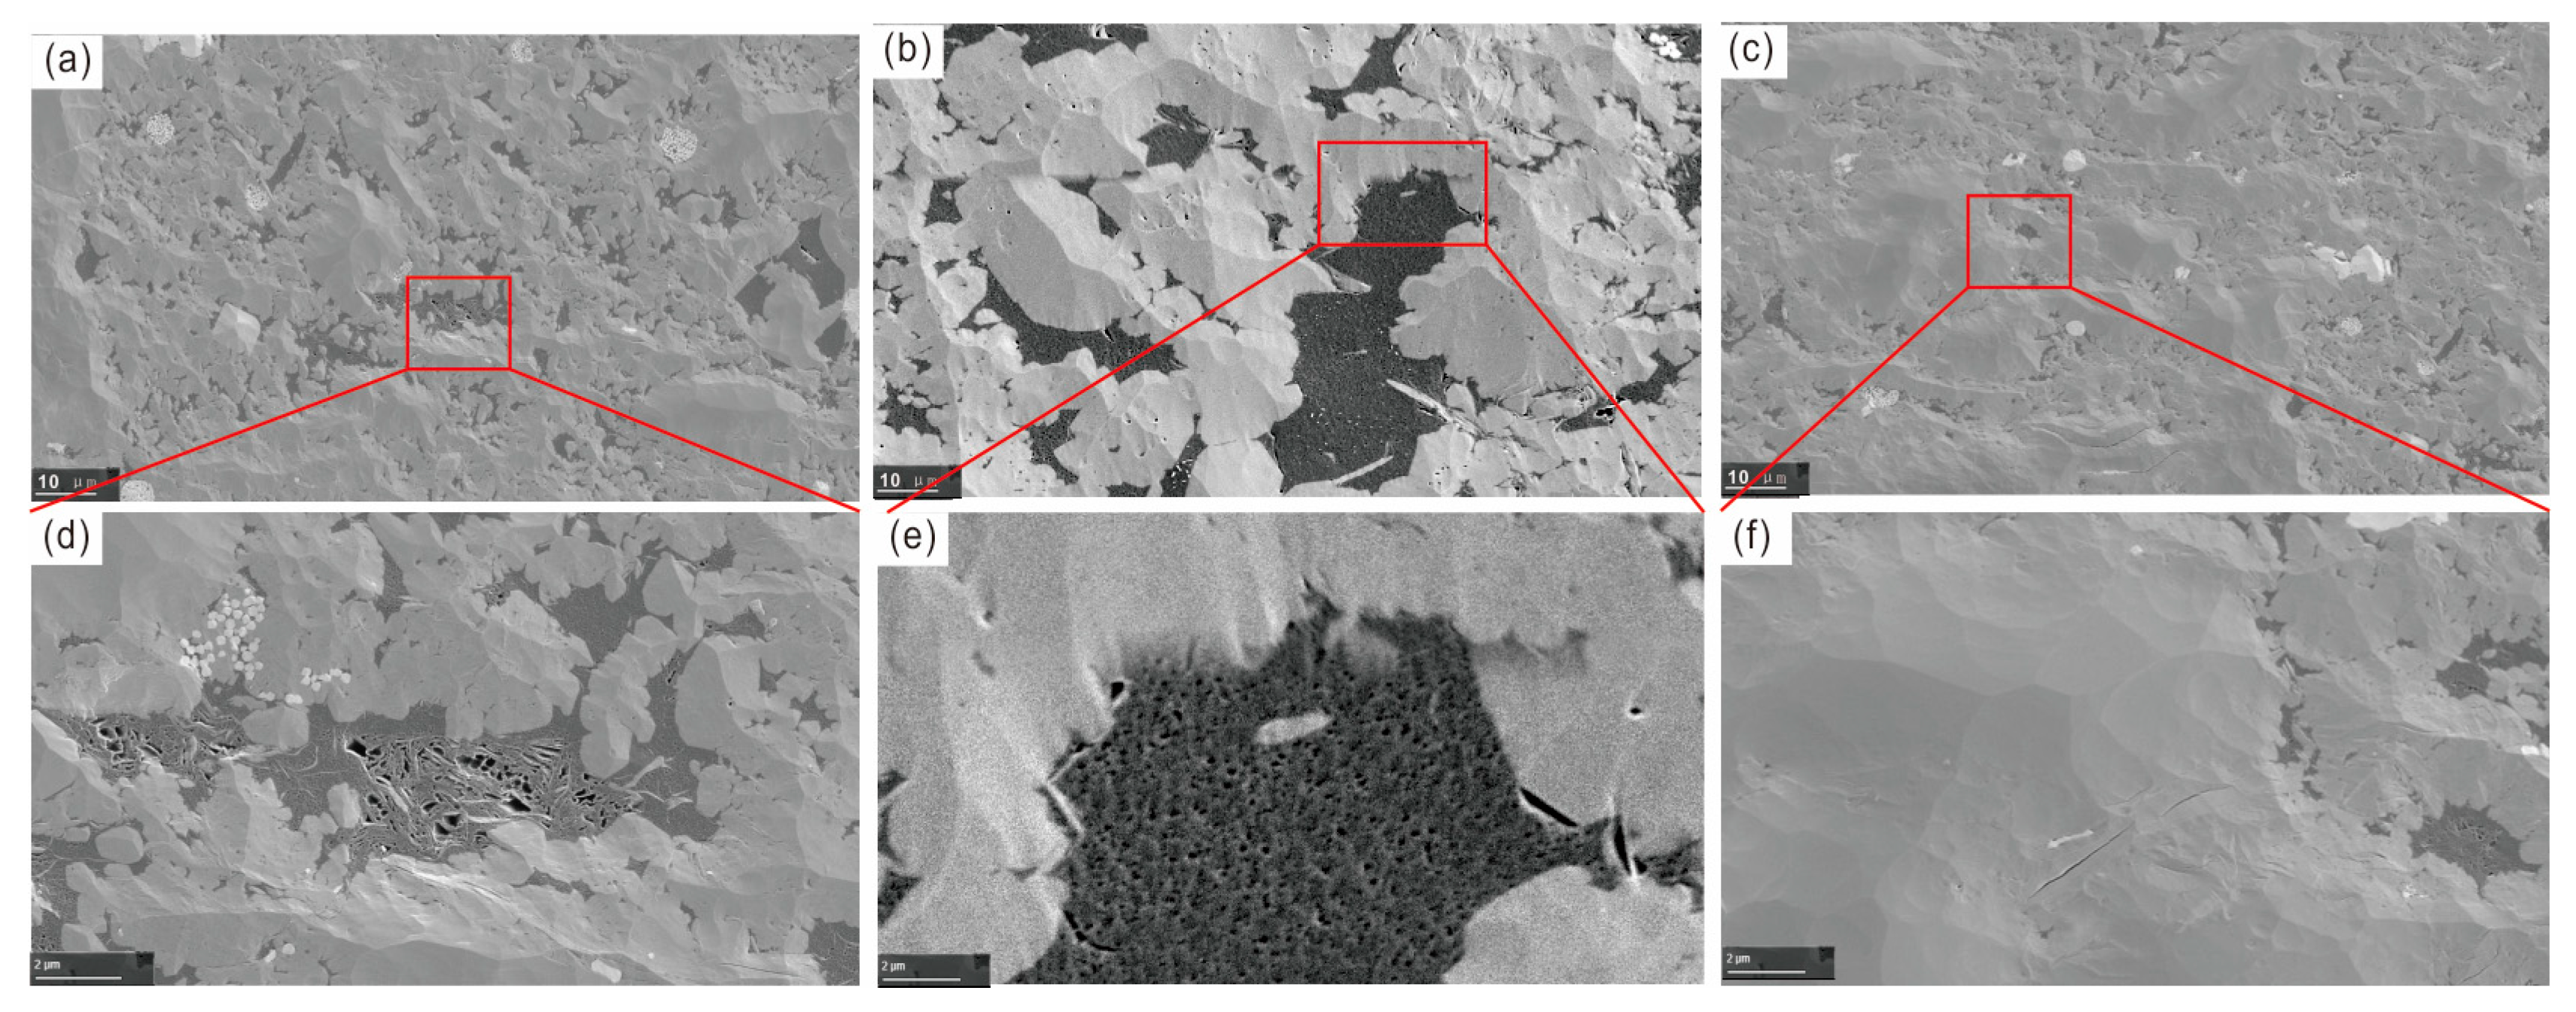
Maps of shale reservoirs with weak PS intensity reveal that the microscopic mineral particles within the shale are relatively small in size. The maximum length axis of quartz particles exceeds 20 μm, and the particles are distinct, with organic matter dispersed within the intergranular pores between them (Figure 5a). Upon closer examination of the dispersed organic matter, it is evident that the organic pores within are highly developed, primarily consisting of circular pores that are interconnected, with a pore size ranging from 100 to 200 nm. In contrast, the inorganic pores are predominantly marginal and exhibit a relatively low degree of development overall (Figure 5d).
Maps of shale reservoirs with moderate PS intensity reveal a significant increase in the number of quartz particles with a long axis exceeding 20 nm. Among these larger particles, there are scattered small quartz particles and intertwined organic matter (Figure 5b). Upon local magnification, it was observed that residual intergranular pores and irregularly shaped intra-granular pores have developed within the large quartz particles. Intergranular pores were also found in pyrite, and pores within the organic matter were evident, although they were relatively small, somewhat deformed, and primarily less than 100 nm in size (Figure 5e).
Maps of shale reservoirs with high PS intensity reveal that there is no clear outline between particles, and organic matter is embedded within minerals or interspersed among particles, resulting in a relatively dense overall structure (Figure 5c). Upon local magnification, it is evident that the development of organic pores in these reservoirs is highly limited, with only a few residual intergranular pores visible (Figure 5f).
Organic pores, inorganic pores and micro-fractures are widely developed in shale reservoirs. Due to the difference in pore size and surface material of different types of reservoir Spaces, shale gas in organic pores, inorganic pores and micro-fractures has different occurrence states [40,41]; therefore, it is of great significance to study the pore ratio of shale reservoirs to clarify the law of shale gas enrichment. In this study, based on the observation of Maps images and the method of image recognition, the pore proportion at the scale of 0.4 mm × 0.4 mm was calculated. The results show that the proportion of organic pores in shale reservoirs with high PS intensity ranges from 40.86% to 67.46%, with an average value of 48.86%. The proportion of inorganic porous faces ranged from 31.69% to 55.11%, with an average value of 45.27%. The proportion of microfracture faces ranged from 0.85% to 15.46%, with an average value of 5.88%. The proportion of organic pores in shale reservoirs with moderate PS intensity ranges from 43.57% to 67.45%, with an average value of 58.66%. The proportion of inorganic porous faces ranged from 28.3% to 44.12%, with an average value of 39.66%. The proportion of microfracture faces ranged from 0.78% to 9.08%, with an average value of 4.68%. The proportion of organic pores in shale reservoirs with low PS intensity ranges from 40.58% to 82.33%, with an average value of 68.82%. The proportion of inorganic porous faces ranged from 28.82% to 56.73%, with an average of 28.29%. The proportion of microfracture faces ranged from 0.53% to 9.63%, with an average value of 2.88%. On the whole, the face rate of shale reservoirs with low PS intensity (0.34%) > the face rate of shale reservoirs with medium PS intensity (1.09%) > the face rate of shale reservoirs with high PS intensity (2.84%) (Figure 6).
The pore size distribution curves of shale reservoirs were obtained by combining liquid nitrogen adsorption and high pressure mercury injection, and the pore size distribution data of organic and inorganic pores were obtained by combining Maps image processing. The histograms of total pore volume, organic pore volume and inorganic pore volume were made, respectively through data statistics (Figure 7). The results show that the pore volume of shale reservoirs with low PS intensity ranges from 0.0122 cm3/g to 0.04521 cm3/g, with an average value of 0.02861 cm3/g. Pores from 20 nm to 200 nm are the main contributors to total pore volume and organic pore volume. The pore volume of inorganic pores is mainly provided by the pores from 100 nm to 200 nm. The pore volume of shale reservoirs with moderate PS intensity ranges from 0.0154 cm3/g to 0.0313 cm3/g, with an average value of 0.01973 cm3/g. Pores from 20 nm to 100 nm are the main contributors to the total pore volume and organic pore volume. The pore volume of inorganic pores is mainly provided by the pores from 100 nm to 500 nm, and the pores larger than 1000 nm are relatively developed, accounting for about 17.42%. The pore volume of shale reservoirs with high PS intensity ranges from 0.0106 cm3/g to 0.0168 cm3/g, with an average value of 0.0105 cm3/g. Pores from 0 nm to 20 nm are the main contributors to total pore volume and organic pore volume. The pore volume of inorganic pores is mainly provided by pores ranging from 50 nm to 200 nm.

5.3. Influencing Factors of PS

The diagenesis of shale reservoirs is a multifaceted process influenced by various factors such as burial depth, tectonic activity, mineral composition, and the properties of diagenetic fluids [42,43,44]. Numerous studies have examined the factors that impact PS, which can be categorized into internal and external factors. Internal factors encompass mineral composition and lithofacies, while external factors include burial depth and diagenetic fluid properties [45]. In the study area, the 1–3 sub-layers of Marine shale within the Longmaxi Formation exhibits a uniform lithofacie, specifically siliceous shale, allowing the influence of relative PS to be disregarded. Furthermore, the sedimentation process of Marine shale reservoirs remains stable, resulting in minimal variation in salinity and ion composition of the sedimentary water within the Luzhou area. Consequently, the influence of diagenetic fluids on PS can be simplified to focus on water saturation. Therefore, this paper categorizes the influencing factors of PS in deep Marine shale of southern Sichuan into three main categories: burial depth, mineral composition, and water saturation.

5.3.1. Burial Depth

While the current classification of shale gas (shallow, middle, deep) is based on present-day burial depth, it is important to recognize that shallow-to-middle shale formations may have experienced deeper burial and higher paleo-temperature/pressure conditions in geological history [46,47]. Therefore, the influence of burial depth on shale reservoir properties should be evaluated in both current and historical contexts.
Analysis of the relationship between average burial depth and PS parameters across multiple wells reveals that, except for well L203, most wells exhibit a trend of increasing PS parameters with greater burial depth [48]. This suggests that elevated temperature and pressure at greater depths generally promote the PS process. However, the anomalously high PS parameters in well L203, despite its shallower current depth, may be attributed to its prior exposure to deeper burial conditions, in addition to the effects of mineral composition and water saturation.
Further examination of intra-well variations in wells Y101H2-7 and L203 (Figure 8b,c) shows no clear correlation between sample burial depth and PS parameters. This likely reflects uniform paleo-thermal maturation histories within individual wells, whereas differences between wells arise from both current depth variations and divergent geological histories (e.g., maximum burial depth, tectonic uplift).
In conclusion, while modern burial depth influences shale reservoir properties, paleo-burial conditions must also be considered to explain anomalies such as those observed in well L203. Future studies should integrate thermal history indicators to better constrain the role of geological evolution in shale diagenesis.

5.3.2. Water Saturation

Water saturation plays a pivotal role in the development of effective pores within shale [49,50,51]. To elucidate the impact of water saturation on shale reservoirs, numerous studies have been conducted, primarily focusing on the occurrence state of water in shale clay and pores [52,53]. However, little research has been done on the influence of water saturation on PS intensity in relation to the reservoir. To explore this relationship, a correlation analysis was performed between water saturation and PS parameters across various samples. The results revealed a notable positive correlation between PS parameters and water saturation (Figure 9a).
The enhancement of PS by high water saturation is governed by coupled thermodynamic and kinetic effects. Thermodynamically, water lowers the activation energy for stress-induced dissolution at grain contacts. Kinetically, thicker water films around grains, resulting from higher saturation, drastically enhance the diffusion rates of dissolved silica from dissolution sites to precipitation sites. This accelerates the entire dissolution-precipitation creep cycle, intensifying the fabric reorganization and porosity reduction characteristic of PS.
Additionally, an analysis of the microscopic characteristics and reservoir parameters of shale reservoir samples with varying water saturation was conducted. It was observed that when sample water saturation is below 40%, the mineral particle profile is distinct, pyrite content is low, particle size is small (ranging from 1.11 μm to 1.55 μm with an average of 1.26 μm), and PS parameters range from 22.57% to 59.67% (averaging 45.04%), indicating poor PS strength. Conversely, when water saturation exceeds 40%, particle consolidation is higher, and organic matter is more fragmented due to diagenesis. Particle size increases (ranging from 1.16 μm to 1.5 μm with an average of 1.3 μm), and PS parameters range from 49.99% to 70.1% (averaging 58.96%), suggesting strong PS. These findings underscore the significant influence of water saturation on PS strength in marine shale. Especially for shale reservoirs with water saturation greater than 40%, the dissolution process is strengthened.
The shale in the study area consists primarily of quartz, carbonate rocks, and clay minerals [54,55]. The processes of clay transformation and feldspar alteration lead to the generation of a significant amount of free SiO2 [56,57], and water plays a crucial role in both these processes. Specifically, high water saturation inhibits clay transformation while enhancing feldspar dissolution. Based on Formulas (2)–(4), as water saturation increases, the degree of promotion for potassium feldspar dissolution surpasses the degree of inhibition for clay transformation [58]. In summary, as water saturation rises, a substantial amount of silicones are released. The excess silicones generate clastic quartz, which then engages in a fresh cycle of PS, thereby accelerating the process. During this process, the degree of mineral consolidation intensifies. However, once water saturation attains 40%, the minerals reach a high level of consolidation, and the fusion rate diminishes as the clastic quartz content escalates.
montmorillonite + 4.5K+ + 8Al3+→ilite + Na+ + 2Ca2+ + 2.5Fe3+ + 2Mg2+ + 3Si4+
Al2Si2O5(OH)4(kaolinite) + KAlSi3O8(potash feldspar) = KAl3Si3O10(OH)2(illite) + 2SiO2 + H2O
3KAlSi3O8(potash feldspar) + 2H+ + H2O = KAl3Si3O10(OH)2(illite) + 6SiO2 + 2K+ + H2O

5.3.3. Mineral Composition

The 1–3 sub-layers of the Longmaxi Formation in the study area are predominantly characterized by siliceous shale lithofacies, with minerals primarily consisting of quartz, clay, and carbonate. Notably, the average quartz content exceeds 50%. Correlation analysis between mineral content and PS parameters across various samples reveals a distinct increasing trend in PS parameters as quartz content rises (Figure 10a). Quartz content exhibits a strong correlation with TOC, a crucial factor influencing reservoir quality. Diagenetic authigenic quartz represents the primary source of quartz in the study area, encompassing biosiliceous transformation, clay mineral transformation, hydrothermal siliceous transformation, and others [59]. This transformation process is accompanied by PS, primarily manifesting in the secondary enlargement of quartz, thereby altering quartz particle size and contact relationships.
Conversely, with an increase in clay mineral content, PS parameters exhibit a significant decreasing trend (Figure 10b). Clay minerals possess a layered structure and hydrophilicity, making them prone to expansion upon water absorption. This enhancement in pressure solubility leads to a reduction in pressure solubility parameters.
In the study area, no apparent correlation exists between PS parameters and carbonate mineral content (Figure 10c). Within carbonate rocks, the density and amplitude of sutures resulting from PS correlate significantly with the mineral content of various carbonates (such as calcite and dolomite). However, in the Longmaxi Formation, the average mineral content of carbonate rocks stands at 16.8%, considerably lower than the 50% threshold observed in typical carbonate rocks. The relatively dispersed distribution and low contact density of carbonate minerals render their content a minor factor influencing PS in shale reservoirs.

5.4. Effect of PS on Pore Development of Shale Reservoir

The PS process is intrinsically coupled with quartz recrystallization and authigenic growth through a dissolution-precipitation creep mechanism governed by chemical potential gradients [56]. Differential stress establishes a thermodynamic driving force, wherein the chemical potential of silica is elevated at grain-to-grain contacts (high-stress dissolution sites) relative to adjacent pore spaces or free grain surfaces (low-stress precipitation sites). This gradient drives the dissolution of quartz at contacts and the simultaneous diffusion and reprecipitation of silica (as H4SiO4) onto the surfaces of authigenic quartz. Consequently, the observed mineral fusion and the concomitant increase in both quartz content and grain size are direct manifestations of this stress-induced, fluid-mediated mass transfer. This model unifies the phenomena of pressure-solution and quartz cementation, explaining how they operate in concert to reconfigure the shale fabric and reduce porosity.
Influenced by diagenesis, the pore structure of shale reservoirs undergoes constant evolution [7]. However, scholars have overlooked the impact of PS on pore development in shale reservoirs rich in water content. To explore the precise effects of PS on pore development in deep marine shale reservoirs in southern Sichuan, we analyzed the relationship between PS parameters and pore parameters.
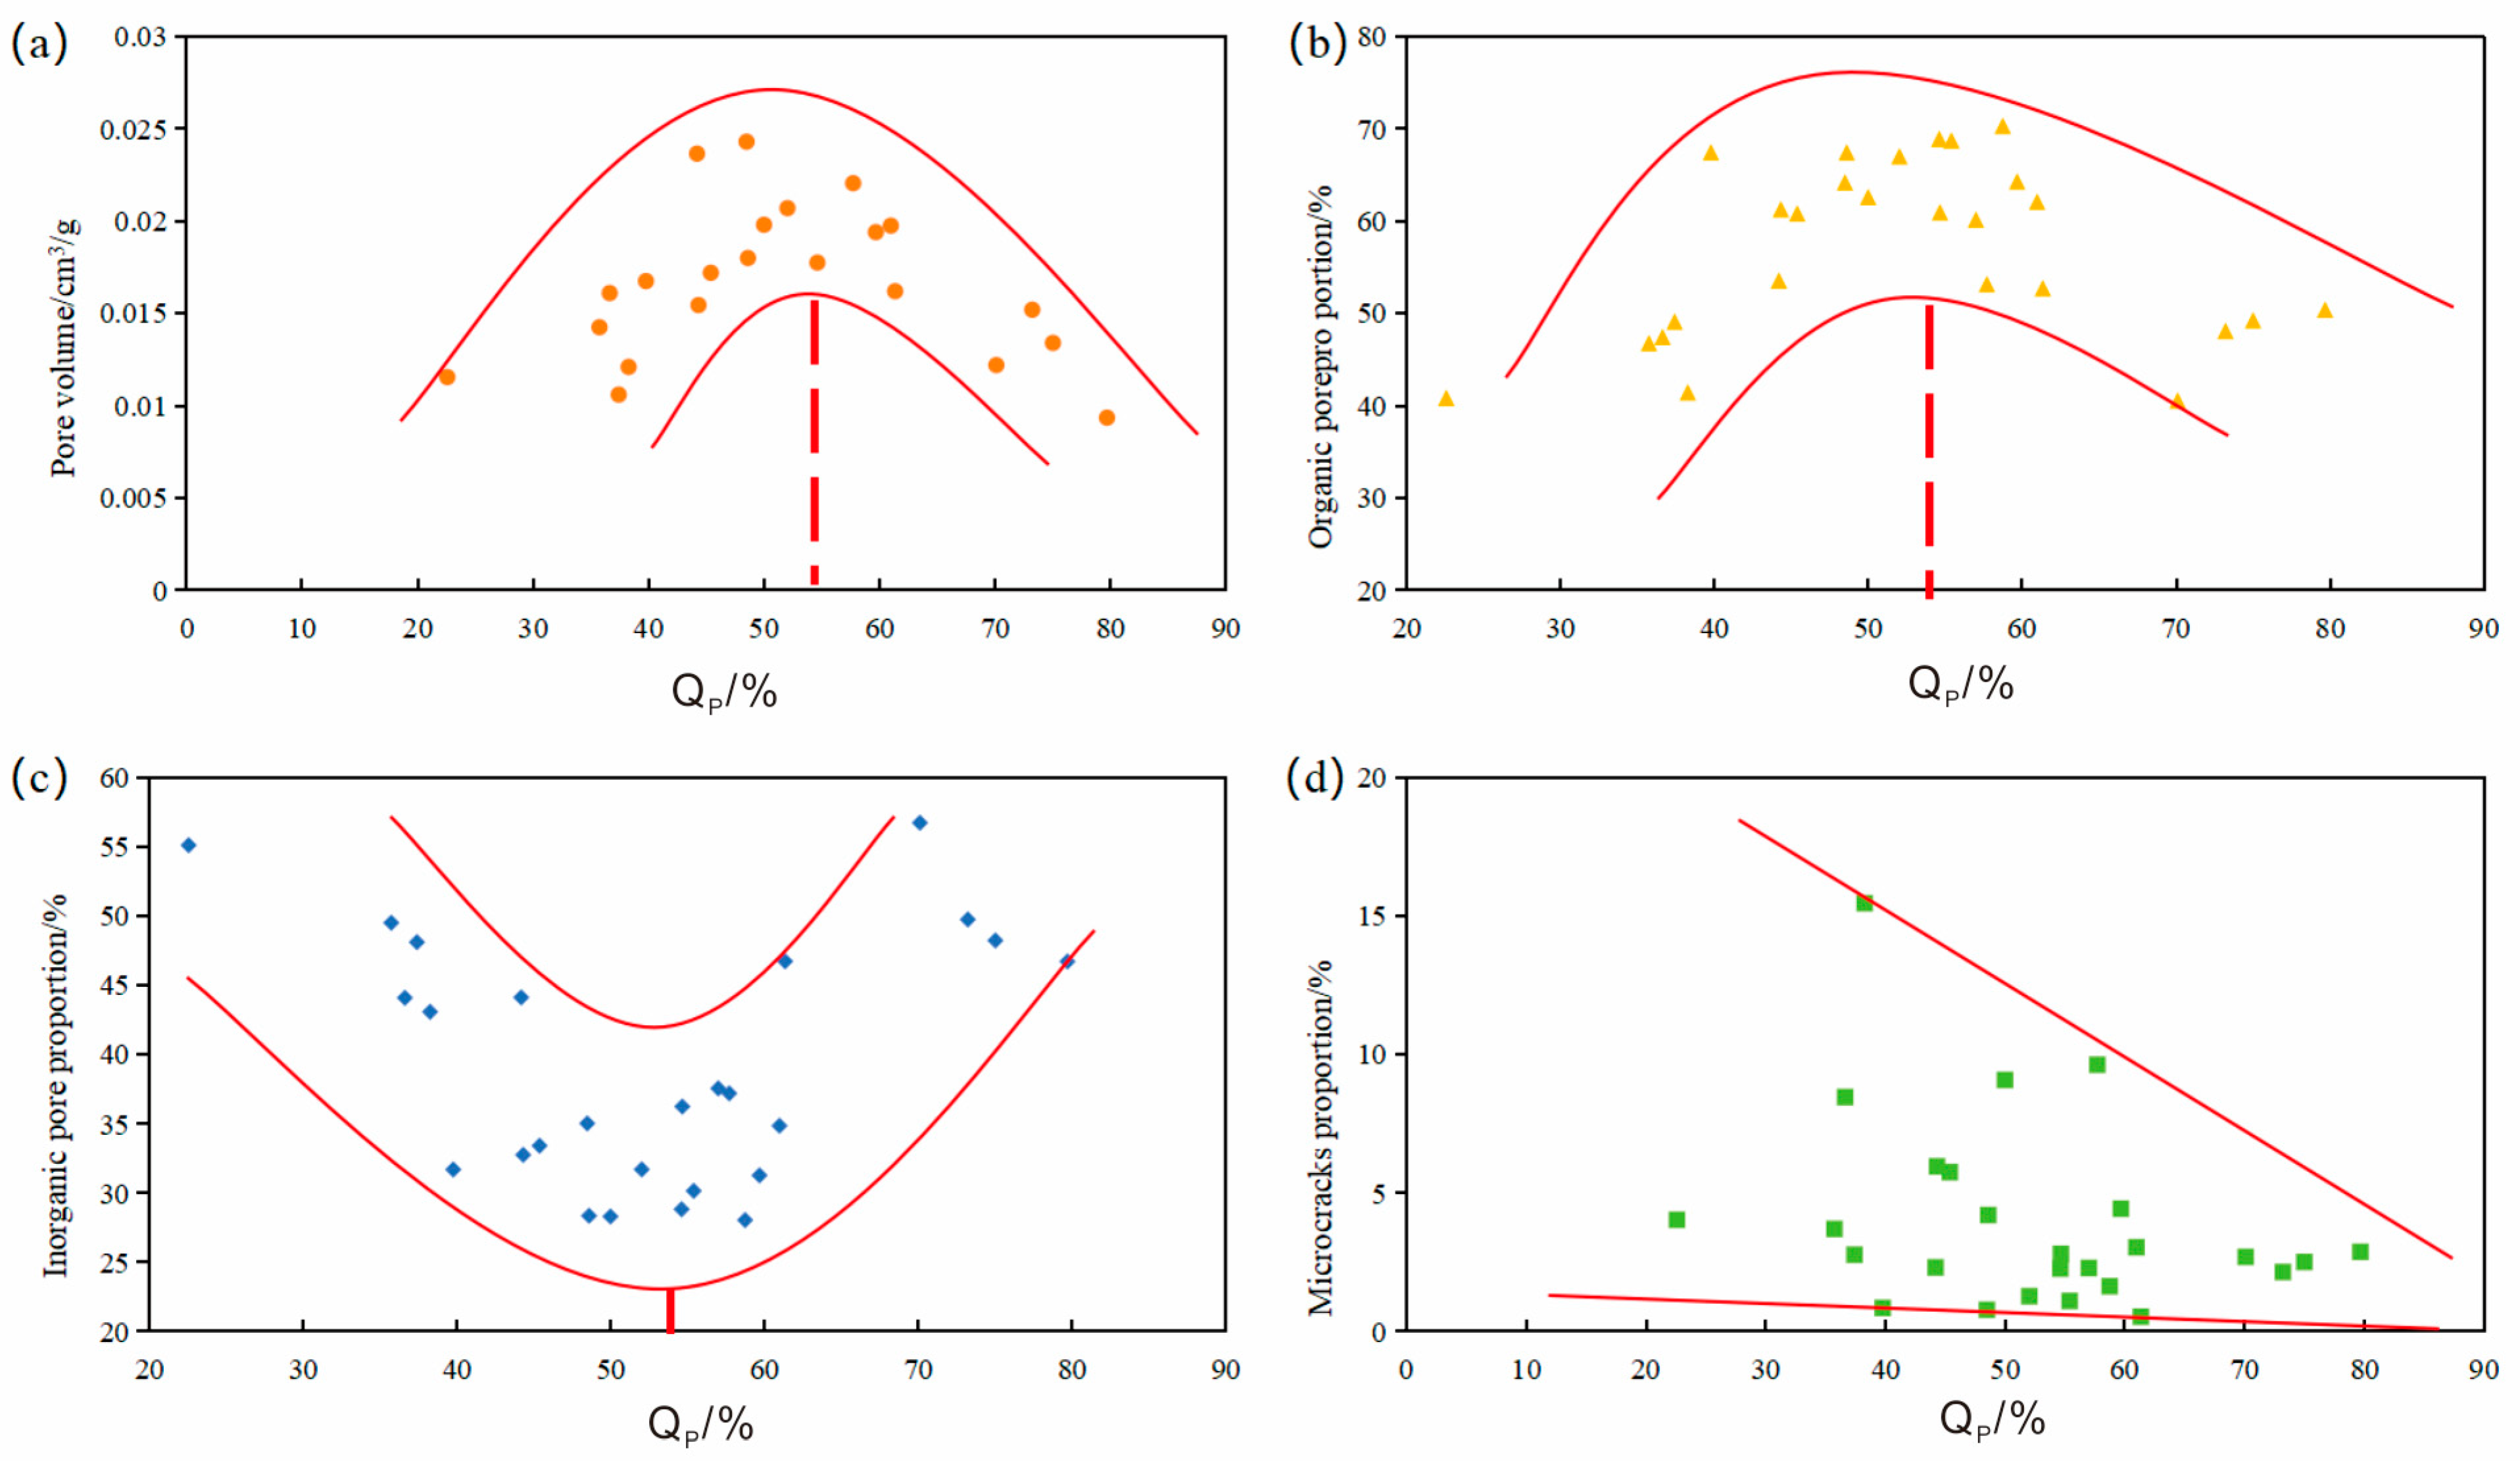
The analysis revealed that as PS parameters increase, the pore volume of shale initially rises and then falls (Figure 11a). Specifically, when PS parameters are below 55%, there is a positive correlation between the two; beyond 55%, the correlation becomes negative. Simultaneously, as PS intensifies, the proportion of organic pores first climbs and then declines. Conversely, the proportion of inorganic pores exhibits an opposite trend, while the proportion of microcracks steadily decreases. Notably, when the PS parameter is less than 55%, an increase in the PS parameter leads to a rise in the proportion of organic pores and a corresponding decrease in the proportion of inorganic pores (Figure 11b–d).
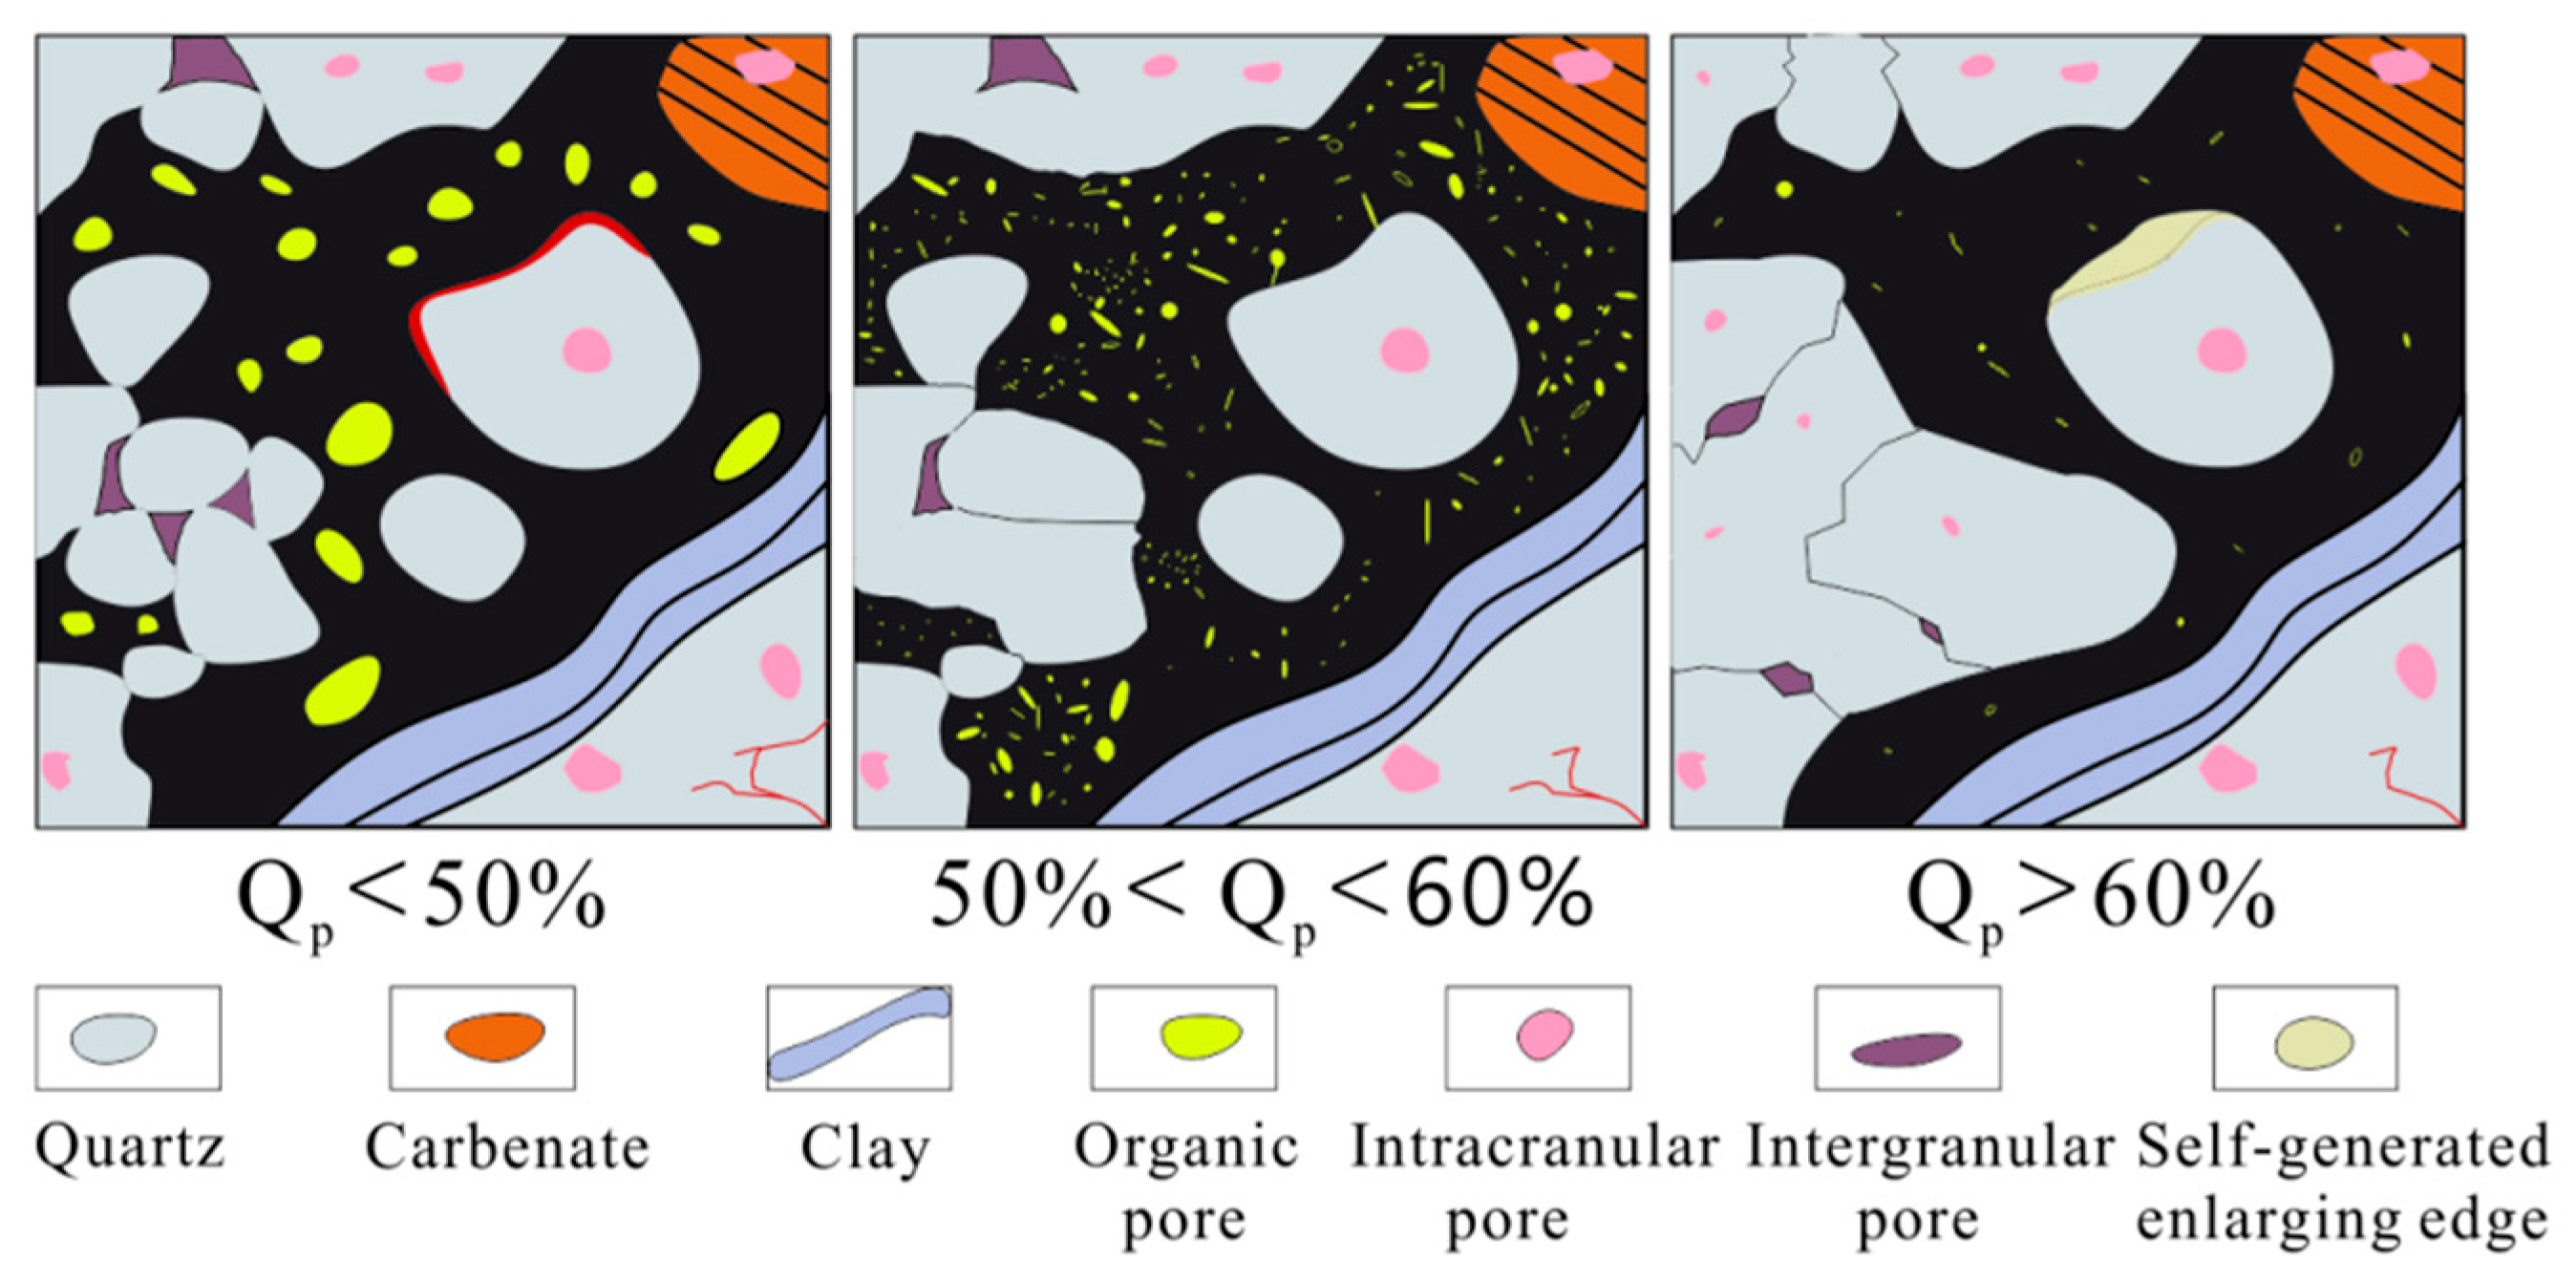
When the PS intensity is low, the minerals primarily exhibit point contact, resulting in large pore sizes and the development of hydrocarbon generation pressure fractures. Under these conditions, PS exerts minimal influence on pore development. As the burying depth and water saturation increase, the PS intensity also rises. At medium PS intensity, minerals shift to primarily surface contact, leading to a reduction in the volume of intergranular pores. Rigid minerals like quartz gradually increase in particle size, effectively counteracting the pore reduction caused by mechanical compaction and favoring pore preservation [60]. Additionally, continuous hydrocarbon generation from organic matter facilitates the formation of organic pores, which gradually increase in size, resulting in a steady rise in both the proportion of organic pores and the total pore volume. However, once the PS parameter surpasses 55%, indicating high PS strength, quartz content accounts for 70% of the total minerals (Figure 10a). In this scenario, PS leads to a continual increase in quartz particle size, causing the cutting and extrusion of organic matter. This process reduces the pore size of organic pores, hinders their development, and ultimately leads to a decrease in both the proportion of organic pores and the total pore volume (Figure 12).
Quartz, as a crucial component of shale, plays a significant role in the development of shale reservoirs. Quartz originates from three primary sources: (1) continental detrital quartz, (2) biogenic quartz, and (3) quartz released during the transformation of montmorillonite to illite [60]. As PS progresses, both the content and particle size of quartz increase. Previous research has indicated that the rigid framework created by the accumulation of authentic quartz particles provides skeletal support for shale reservoirs, enhances reservoir brittleness, and shields organic pores from the effects of mechanical compaction [21]. Consequently, up to a certain point, an increase in quartz content is beneficial for improving shale reservoir quality. However, this study revealed that once the quartz content reaches a specific threshold, the pore volume starts to decline. Investigations from the perspective of quartz genesis have highlighted that when the content of autogenous quartz surpasses 20%, it becomes detrimental to the development and preservation of organic pores. From the PS standpoint, our study conducted a semi-quantitative analysis exploring the correlation between PS parameters, quartz content, quartz particle size, pore volume, and pore proportion. We discovered that when quartz content exceeds 70%, pore development is negatively impacted.
During this process, an excessive influx of bio-sio2 can dilute organic matter, thereby hindering the development of organic pores [61]. Simultaneously, under the combined influence of water saturation and burial depth, particularly when the water saturation exceeds 40%, the cementation and filling of intergranular pores and solution pores induced by PS become more pronounced. Consequently, the pores in shale reservoirs will also experience a certain degree of reduction. Therefore, in shale gas exploration and development, a higher quartz content is not necessarily more beneficial for reservoir development.

6. Conclusions

(1)
PS is prevalent in the Longmaxi Formation, exhibiting distinct characteristics: portions of particle profiles in shale reservoir have vanished, resulting in a consolidated shale mass. Large-grained minerals display intermittent sutures while maintaining mineral particle outlines, with a noticeable increase in particle size. The boundaries between residual and adjacent particles feature intergranular dissolution cavities, some of which are occupied by organic matter.
(2)
Based on the primary mineral content of shale reservoirs and the mineral components influenced by PS, a semi-quantitative method was established, which relies on quartz mineral composition and particle size analysis for PS intensity (Qp). The PS in Longmaxi shale reservoirs exhibits significant variation, with parameters ranging from 20% to 70%. Using statistical methods and mineral micro-distribution characteristics, the intensity of PS is categorized into three types: low (Qp < 50%), medium (50% < Qp < 60%), and high (Qp > 60%).
(3)
As burial depth, temperature, and pressure increase, the PS of the Longmaxi Formation shale reservoir becomes stronger. Water saturation is positively correlated with PS parameters. Notably, when water saturation exceeds 40%, PS becomes more pronounced, potentially due to the influence of diagenetic fluids on clay transformation and feldspar alteration. Additionally, an increase in quartz content, particularly cryptocrystalline quartz, enhances PS, whereas an increase in clay mineral content diminishes it.
(4)
In deep shale reservoirs, PS is a common phenomenon, yet intense PS hinders pore development. As PS intensity increases, quartz particles in the shale reservoir fuse, compressing the original intergranular pores and organic matter. This leads to the reduction, deformation, or even elimination of organic pores, and a decrease in intergranular pores. Consequently, the proportion of total pore volume and organic pore surface ratio in the shale reservoir initially increases and then decreases. This underscores that a quartz content exceeding 70% in shale reservoirs is detrimental to pore development. Therefore, when the quartz content in Longmaxi formation shale reservoirs surpasses 70%, there is a significant risk associated with shale gas exploration and development.

Author Contributions

Conceptualization, D.L., Y.F. and Y.J.; Methodology, D.L., Y.F. and Y.J.; Resources, Y.J., C.L., X.Q., R.W. and Q.H.; Data curation, D.L. and C.L.; Project administration, D.L. All authors have read and agreed to the published version of the manuscript.

Funding

This research was funded by the National Natural Science Foundation of China (Grant No. 42302166), the Subject innovation and talent introduction program in Colleges and universities (111 project) (Grant No. D18016). Thank the reviewers for their valuable comments, which is of great help to improve the quality of the manuscript.

Data Availability Statement

The original contributions presented in this study are included in the article. Further inquiries can be directed to the corresponding author.

Conflicts of Interest

Author Chao Luo was employed by the Shale Gas Research Institute of PetroChina Southwest Oil and Gas Field Company. Author Xunxi Qiu was employed by the Sicuan Shale Gas Exploration and Development Company Limited. Author Ran Wen was employed by the Changning Shale Gas Exploration and Development Company Limited. The remaining authors declare that the research was conducted in the absence of any commercial or financial relationships that could be construed as a potential conflict of interest.

References

  1. Ma, X.H.; Wang, H.Y.; Zhou, S.W.; Shi, Z.S.; Zhang, L.F. Deep shale gas in China: Geological characteristics and development strategies. Energy Rep. 2021, 7, 1903–1914. [Google Scholar] [CrossRef]
  2. Sun, C.X.; Nie, H.K.; Dang, W.; Chen, Q.; Zhang, G.R.; Li, W.P.; Lu, Z.Y. Shale Gas Exploration and Development in China: Current Status, Geological Challenges, and Future Directions. Energy Fuels 2021, 35, 6359–6379. [Google Scholar] [CrossRef]
  3. He, X.; Chen, G.S.; Wu, J.F.; Liu, Y.; Wu, S.; Zhang, J.; Zhang, X.T. Deep shale gas exploration and development in the southern Sichuan Basin: New progress and challenges. Nat. Gas Ind. B 2023, 10, 32–43. [Google Scholar] [CrossRef]
  4. Nie, H.K.; Jin, Z.J.; Li, P.; Katz, B.J.; Dang, W.; Liu, Q.Y.; Ding, J.H.; Jiang, S.; Li, D.H. Deep shale gas in the Ordovician-Silurian Wufeng–Longmaxi formations of the Sichuan Basin, SW China: Insights from reservoir characteristics, preservation conditions and development strategies. J. Asian Earth Sci. 2023, 244, 105521. [Google Scholar] [CrossRef]
  5. Zou, C.; Wu, Y.H.; Liang, X.; Jiang, Z.X.; Wang, G.C.; Zhang, J.H.; Zhang, C.; He, Y.; Duan, X.G.; Gong, H.J. Control effect of formation water on shale gas enrichment in the background of strike-slip fault activity in western Chongqing. Pet. Geol. Oilfield Dev. Daqing 2023, 42, 11–19. [Google Scholar]
  6. Feng, Y.; Xiao, X.M.; Gao, P.; Hu, D.F.; Liu, R.B.; Li, G.; Lu, C.G.; Zhou, Q. Water distribution in pore systems and its influences on gas-bearing property of deep shale: A case study of the Longmaxi Formation in the Luzhou area, southern Sichuan Basin. Mar. Pet. Geol. 2024, 163, 106805. [Google Scholar] [CrossRef]
  7. Li, X.Y.; Chen, S.B.; Wu, J.F.; Zhang, J.; Zhao, S.X.; Xia, Z.Q.; Wang, Y.; Zhang, S.J.; Zhang, J.J. Microscopic occurrence and movability mechanism of pore water in deep shale gas reservoirs: A typical case study of the Wufeng-Longmaxi Formation, Luzhou block, Sichuan Basin. Mar. Pet. Geol. 2023, 151, 106205. [Google Scholar] [CrossRef]
  8. Garum, M.; Glover, P.W.J.; Lorinczi, P.; Micklethwaite, S.; Hassanpour, A. Integration of multiscale imaging of nanoscale pore microstructures in gas shales. Energy Fuel 2021, 35, 10721–10732. [Google Scholar] [CrossRef]
  9. Li, Q.; Liu, D.; Cai, Y.; Zhao, B.; Qiu, Y.; Zhou, Y. Scale-span pore structure heterogeneity of high volatile bituminous coal and anthracite by FIB-SEM and X-ray μ-CT. J. Nat. Gas Sci. Eng. 2020, 81, 103443. [Google Scholar] [CrossRef]
  10. Wang, Y.; Wang, Q.M.; Hu, Q.H.; Cheng, H.F.; Ilavsky, J.; Kuzmenko, I.; Shang, F.H.; Liu, L.F. Pore structure and wettability of Bossier shale, East Texas, United States: Insights from integrated porosimetry, scattering, and imbibition approaches. Energy Fuels 2023, 37, 11042–11054. [Google Scholar] [CrossRef]
  11. Zhang, N.; Wang, X.Y.; Wang, S.D.; Wang, R.C.; Wu, J.Q.; Li, Z.; Song, Y. Multifractal characteristics on pore structure of Longmaxi shale using nuclear magnetic resonance (NMR). Geoenergy Sci. Eng. 2024, 241, 213176. [Google Scholar] [CrossRef]
  12. Liu, K.; Ostadhassan, M.; Zou, J.; Gentzis, T.; Rezaee, R.; Bubach, B.; Carvajal-Ortiz, H. Multifractal analysis of gas adsorption isotherms for pore structure characterization of the Bakken Shale. Fuel 2018, 219, 296–311. [Google Scholar] [CrossRef]
  13. Dong, W.; Nie, H.; Zhang, J.; Tang, X.; Jiang, S.; Wei, X.; Liu, Y.; Wang, F.; Li, P.; Chen, Z. Pore-scale mechanisms and characterization of light oil storage in shale nanopores: New method and insights. Geosci. Front. 2022, 13, 101424. [Google Scholar] [CrossRef]
  14. Wang, P.; Nie, H.; Liu, Z.; Sun, C.; Cao, Z.; Wang, R.; Li, P. Differences in Pore Type and Pore Structure between Silurian Longmaxi Marine Shale and Jurassic Dongyuemiao Lacustrine Shale and Their Influence on Shale-Gas Enrichment. Minerals 2023, 13, 190. [Google Scholar] [CrossRef]
  15. Dong, T.; Harris, N.B. The effect of thermal maturity on porosity development in the Upper Devonian–Lower Mississippian Woodford Shale, Permian Basin, US: Insights into the role of silica nanospheres and microcrystalline quartz on porosity preservation. Int. J. Coal Geol. 2020, 217, 103346. [Google Scholar] [CrossRef]
  16. Jiao, K.; Ye, Y.H.; Liu, S.G.; Ran, B.; Deng, B.; Li, Z.; Li, J.; Yong, Z.; Sun, W. Characterization and evolution of nanoporosity in superdeeply buried shales: A case study of the Longmaxi and Qiongzhusi shales from MS well #1, North Sichuan Basin, China. Energy Fuels 2018, 32, 191–203. [Google Scholar]
  17. Zhao, J.; Jin, Z.; Hu, Q.; Liu, K.; Jin, Z.; Hu, Z.; Nie, H.; Du, W.; Yan, C.; Wang, R. Mineral composition and seal condition implicated in pore structure development of organic-rich Longmaxi shales, Sichuan Basin, China. Mar. Pet. Geol. 2018, 98, 507–522. [Google Scholar] [CrossRef]
  18. Zheng, Y.; Liao, Y.; Wang, Y.; Xiong, Y.; Peng, P. The main geological factors controlling the Wufeng-Longmaxi shale gas content. AAPG Bull. 2022, 106, 2073–2102. [Google Scholar] [CrossRef]
  19. Xu, S.; Liu, R.; Hao, F.; Engelder, T.; Yi, J.; Zhang, B.; Shu, Z. Complex rotation of maximum horizontal stress in the Wufeng-Longmaxi Shale on the eastern margin of the Sichuan Basin, China: Implications for predicting natural fractures. Mar. Pet. Geol. 2019, 109, 519–529. [Google Scholar] [CrossRef]
  20. Wei, X.F.; Liu, Z.J.; Qiang, W.A.; Wei, F.B.; Tao, Y.U. Analysis and thinking of the difference of Wufeng–Longmaxi shale gas enrichment conditions between Dingshan and Jiaoshiba areas in southeastern Sichuan Basin. Nat. Gas Geosci. 2020, 31, 1041–1051. [Google Scholar]
  21. Gao, P.; Xiao, X.M.; Hu, D.F.; Lash, G.; Liu, R.B.; Cai, Y.D.; Wang, Z.H.; Zhang, B.Y.; Yuan, T.; Liu, S.Y. Effect of silica diagenesis on porosity evolution of deep gas shale reservoir of the Lower Paleozoic Wufeng-Longmaxi formations, Sichuan Basin. Mar. Pet. Geol. 2022, 145, 105873. [Google Scholar] [CrossRef]
  22. Fan, C.H.; Nie, S.; Li, H.; Radwan, A.E.; Pan, Q.C.; Shi, X.C.; Li, J.; Liu, Y.Y.; Guo, Y. Quantitative prediction and spatial analysis of structural fractures in deep shale gas reservoirs within complex structural zones: A case study of the Longmaxi Formation in the Luzhou area, southern Sichuan Basin, China. J. Asian Earth Sci. 2024, 263, 106025. [Google Scholar] [CrossRef]
  23. Liu, Z.J.; Jiang, Z.X.; Wei, F.B.; Yuan, T.; Li, F. Shale gas accumulation mechanism of deep-buried marine shale of Upper Ordovician Wufeng Formation to Lower Silurian Longmaxi Formation in the southeast Sichuan Basin. Pet. Res. 2025, 10, 137–148. [Google Scholar] [CrossRef]
  24. Bernard, S.; Wirth, R.; Schreiber, A.; Schulz, H.; Horsfield, B. Formation of nanoporous pyrobitumen residues during maturation of the Barnett Shale (Fort Worth Basin). Int. J. Coal Geol. 2012, 103, 3–11. [Google Scholar] [CrossRef]
  25. Zhao, J.H.; Jin, Z.J.; Jin, Z.K.; Hu, Q.; Hu, Z.; Du, W.; Yan, C.; Geng, Y. Mineral types and organic matters of the Ordovician-Silurian Wufeng and Longmaxi shale in the Sichuan Basin, China: Implications for pore systems, diagenetic pathways, and reservoir quality in fine-grained sedimentary rocks. Mar. Pet. Geol. 2017, 86, 655–674. [Google Scholar] [CrossRef]
  26. Dong, T.; He, S.; Chen, M.; Hou, Y.; Guo, X.; Wei, C.; Han, Y.; Yang, R. Quartz types and origins in the paleozoic Wufeng-Longmaxi Formations, Eastern Sichuan Basin, China: Implications for porosity preservation in shale reservoirs. Mar. Pet. Geol. 2019, 106, 62–73. [Google Scholar] [CrossRef]
  27. Dong, T.; He, Q.; He, S.; Zhai, G.; Zhang, Y.; Wei, S.; Wei, C.; Hou, Y.; Guo, X. Quartz types, origins and organic matter-hosted pore systems in the lower cambrian Niutitang Formation, middle yangtze platform, China. Mar. Pet. Geol. 2021, 123, 104739. [Google Scholar] [CrossRef]
  28. Milliken, K.T.; Olson, T. Silica diagenesis, porosity evolution, and mechanical behavior in siliceous mudstones, Mowry Shale (Cretaceous), Rocky Mountains. USA. J. Sediment. Res. 2017, 87, 366–387. [Google Scholar] [CrossRef]
  29. Xi, Z.; Tang, S.; Zhang, S.; Yi, Y.; Dang, F.; Ye, Y. Characterization of quartz in the Wufeng Formation in northwest Hunan Province, south China and its implications for reservoir quality. J. Pet. Sci. Eng. 2019, 179, 979–996. [Google Scholar] [CrossRef]
  30. Bridge, J.S.; Demicco, R.V. Earth Surface Processes, Landforms and Sediment Deposits; Cambridge University Press: Cambridge, UK, 2008; p. 830. [Google Scholar]
  31. Loucks, R.G.; Reed, R.M.; Ruppel, S.C.; Hammes, U. Spectrum of pore types and networks in mudrocks and a descriptive classification for matrix-related mudrock pores. AAPG Bull. 2012, 96, 1071–1098. [Google Scholar] [CrossRef]
  32. Yang, H.; Shi, X.; Luo, C.; Wu, W.; Li, Y.; He, Y.; Zhong, K.; Wu, J. Mineral Composition of Prospective Section of Wufeng-Longmaxi Shale in Luzhou Shale Play, Sichuan Basin. Minerals 2022, 12, 20. [Google Scholar] [CrossRef]
  33. Wu, Y.; Jiang, Z.; Wu, J.; Liang, X.; Shi, X.; Bao, S.; Wu, W.; Xu, L.; Tang, X.; Han, Y. Characteristics, formation mechanism and geological implications of high water-cut shale gas reservoirs in western Chongqing area. Nat. Gas Ind. 2024, 44, 58–71. [Google Scholar]
  34. Khan, M.Z.; Feng, Q.; Zhang, K.; Guo, W. Biogenic silica and organic carbon fluxes provide evidence of enhanced marine productivity in the Upper Ordovician-Lower Silurian of South China. Palaeogeogr. Palaeoclimatol. Palaeoecol. 2019, 534, 109278. [Google Scholar] [CrossRef]
  35. Thyberg, B.; Jahren, J.; Winje, T.; Bjørlykke, K.; Faleide, J.I.; Marcussen, Ø. Quartz cementation in Late Cretaceous mudstones, northern North Sea: Changes in rock properties due to dissolution of smectite and precipitation of micro-quartz crystals. Mar. Pet. Geol. 2010, 27, 1752–1764. [Google Scholar] [CrossRef]
  36. Dowey, P.J.; Taylor, K.G. Extensive authigenic quartz overgrowths in the gasbearing Haynesville-Bossier Shale, USA. Sediment. Geol. 2017, 356, 15–25. [Google Scholar] [CrossRef]
  37. Liu, S.; Yang, Y.; Deng, B.; Zhong, Y.; Wen, L.; Sun, W.; Li, Z.; Jansa, L.; Li, J.; Song, J.; et al. Tectonic evolution of the Sichuan Basin, Southwest China. Earth Sci. Rev. 2021, 213, 103470. [Google Scholar] [CrossRef]
  38. Tian, H.; Zhang, S.C.; Liu, S.B.; Zhang, H. Determination of organic-rich shale pore features by mercury injection and gas adsorption methods. Acta Pet. Sin. 2012, 3, 419–427. [Google Scholar]
  39. Yang, F.; Ning, Z.F.; Kong, D.T.; Liu, H.Q. Pore structure of shale from high pressure mercury injection and nitrogen adsorption method. Nat. Gas Geosci. 2013, 24, 450–455. [Google Scholar]
  40. Sun, M.; Duan, X.; Liu, Q.; Blach, T.P.; Ostadhassan, M.; Liu, B.; Ji, Y.; Hu, Q.; Pan, Z. The importance of pore-fracture connectivity in overmature marine shale for methane occurrence and transportation. Mar. Pet. Geol. 2023, 157, 106495. [Google Scholar] [CrossRef]
  41. Fan, Q.; Cheng, P.; Tian, H.; Gai, H.; Xiao, X. Distribution and occurrence of pore water and retained oil in nanopores of marine-terrestrial transitional shales during oil generation and expulsion: Implications from a thermal simulation experiment on shale plug samples. Mar. Pet. Geol. 2023, 150, 106125. [Google Scholar] [CrossRef]
  42. Liu, C.; Rong, H.; Chen, S.J.; Tang, Y.G.; Deng, Y. Diagenesis and reservoir property variations of tight sandstone with burial depths ranging from shallow to ultra-deep in the Kuqa Depression, Tarim Basin, China. Nat. Gas Ind. B 2024, 11, 121–139. [Google Scholar] [CrossRef]
  43. Du, J.Z.; Cai, J.G.; Long, S.X.; Gao, B.; Feng, D.J.; Peng, Z.Y.; Zeng, X. The Control of Diagenesis and Mineral Assemblages on Brittleness of Mudstones. Front. Earth Sci. 2021, 9, 758046. [Google Scholar] [CrossRef]
  44. Han, S.; Yu, B.; Ruan, Z.; Bai, C.; Shen, Z.; Löhr, S.C. Diagenesis and fluid evolution in the third member of the Eocene Shahejie Formation, Bonan Sag, Bohai Bay Basin, China. Mar. Pet. Geol. 2021, 128, 105003. [Google Scholar] [CrossRef]
  45. Toussaint, R.; Aharonov, E.; Koehn, D.; Gratier, J.-P.; Ebner, M.; Baud, P.; Rolland, A.; Renard, F. Stylolites: A review. J. Struct. Geol. 2018, 114, 163–195. [Google Scholar] [CrossRef]
  46. Midtbø, R.E.A.; Rykkje, J.M.; Ramm, M. Deep burial diagenesis and reservoir quality along the eastern flank of the Viking Graben: Evidence for illitization and quartz cementation after hydrocarbon emplacement. Clay Miner. 2000, 35, 222–237. [Google Scholar] [CrossRef]
  47. Dutton, S.P.; Loucks, R.G.; Day-Stirrat, R.J. Impact of regional variation in detrital mineral composition on reservoir quality in deep to ultra deep lower Miocene sandstones, western Gulf of Mexico. Mar. Pet. Geol. 2012, 35, 139–153. [Google Scholar] [CrossRef]
  48. Huang, H.X.; Li, R.X.; Jiang, Z.X.; Li, J.; Chen, L. Investigation of variation in shale gas adsorption capacity with burial depth: Insights from the adsorption potential theory. J. Nat. Gas Sci. Eng. 2020, 73, 103043. [Google Scholar] [CrossRef]
  49. Zhang, Y.X.; Hu, Q.H.; Barber, T.J.; Bleuel, M.L.; Anovitz, M.; Littrell, K. Quantifying fluid-wettable effective pore space in the Utica and Bakken oil shale formations. Geophys. Res. Lett. 2020, 47, e2020GL087896. [Google Scholar] [CrossRef]
  50. Cheng, P.; Xiao, X.M.; Tian, H.; Gai, H.F.; Zhou, Q.; Li, T.F.; Fan, Q.Z. Differences in the distribution and occurrence phases of pore water in various nanopores of marine-terrestrial transitional shales in the Yangquan area of the northeast Qinshui Basin, China. Mar. Pet. Geol. 2022, 137, 105510. [Google Scholar] [CrossRef]
  51. Feng, D.; Li, X.F.; Wang, X.Z.; Li, J.; Sun, F.R.; Sun, Z.; Zhang, T.; Li, P.H.; Chen, Y.; Zhang, X. Water adsorption and its impact on the pore structure characteristics of shale clay. Appl. Clay Sci. 2018, 155, 126–138. [Google Scholar] [CrossRef]
  52. Li, J.; Li, X.F.; Wang, X.Z.; Li, Y.Y.; Wu, K.L.; Shi, J.T.; Yang, L.; Feng, D.; Zhang, T.; Yu, P.L. Water distribution characteristic and effect on methane adsorption capacity in shale clay. Int. J. Coal Geol. 2016, 159, 135–154. [Google Scholar] [CrossRef]
  53. Sun, J.; Xiao, X.M.; Wei, Q.; Cheng, P.; Tian, H. Occurrence of irreducible water and its influences on gas-bearing property of gas shales from shallow Longmaxi formation in the Xishui area, Guizhou, southern China. Front. Earth Sci. 2021, 9, 654136. [Google Scholar] [CrossRef]
  54. Jiang, Y.Q.; Dong, D.Z.; Qi, L.; Shen, Y.F.; Jiang, C.; He, B.W. Basic features and evaluation of shale gas reservoirs. Nat. Gas Ind. 2010, 30, 7–12. [Google Scholar]
  55. Wang, Y.M.; Dong, D.Z.; Li, J.Z.; Wang, S.J.; Li, X.J.; Wang, L.; Cheng, K.M.; Huang, J.L. Reservoir characteristics of shale in Longmaxi Formation of the Lower Silurian, southern Sichuan. Acta Pet. Sin. 2012, 33, 551–561. [Google Scholar]
  56. Guan, Q.Z.; Dong, D.Z.; Zhang, H.L.; Sun, S.S.; Zhang, S.R.; Guo, W. Types of biogenic quartz and its coupling storage mechanism in organic-rich shales: A case study of the Upper Ordovician Wufeng Formation to Lower Silurian Longmaxi Formation in the Sichuan Basin, SW China. Pet. Explor. Dev. 2021, 48, 700–709. [Google Scholar] [CrossRef]
  57. Niu, X.; Yan, D.T.; Zhuang, X.G.; Liu, Z.X.; Li, B.Q.; Wei, X.S.; Xu, H.W.; Li, D.W. Origin of quartz in the lower Cambrian Niutitang Formation in south Hubei Province, upper Yangtze platform. Mar. Pet. Geol. 2018, 96, 271–287. [Google Scholar] [CrossRef]
  58. Luo, D.T.; Zhang, J.; Luo, J.L.; Feng, Z.H.; Deng, C.; Bai, Y.B.; Shao, H.M.; Yan, M.; Tan, Z. Effects of smectite-illitization and hydrocarbon generation on the pore structure: A case study from the continental shales in China. J. Palaeogeogr. 2026, 15, 100298. [Google Scholar] [CrossRef]
  59. Li, C.; Li, Z.; Guo, P.; Wang, J.; Liu, W.; Zhang, B.; Song, M.; Zhong, K.; Xu, J. Types and formation mechanisms of authigenic quartz in the Late Paleozoic alkaline lacustrine shales, NW China. Sediment. Geol. 2025, 482, 106880. [Google Scholar] [CrossRef]
  60. Nie, H.; Liu, Q.; Li, P.; Li, P.; Ding, J.; Sun, C.; Zhai, C.; Zhao, J.; Jin, Z.; Dang, W. Quartz types, formation mechanism, and its effect on shale oil and gas enrichment: A review. Earth Sci. Rev. 2025, 261, 105011. [Google Scholar] [CrossRef]
  61. Qiu, Z.; Liu, B.; Dong, D.; Lu, B.; Yawar, Z.; Chen, Z.; Schieber, J. Silica diagenesis in the lower paleozoic Wufeng and Longmaxi formations in the Sichuan Basin, south China: Implications for reservoir properties and paleoproductivity. Mar. Pet. Geol. 2020, 121, 104594. [Google Scholar] [CrossRef]
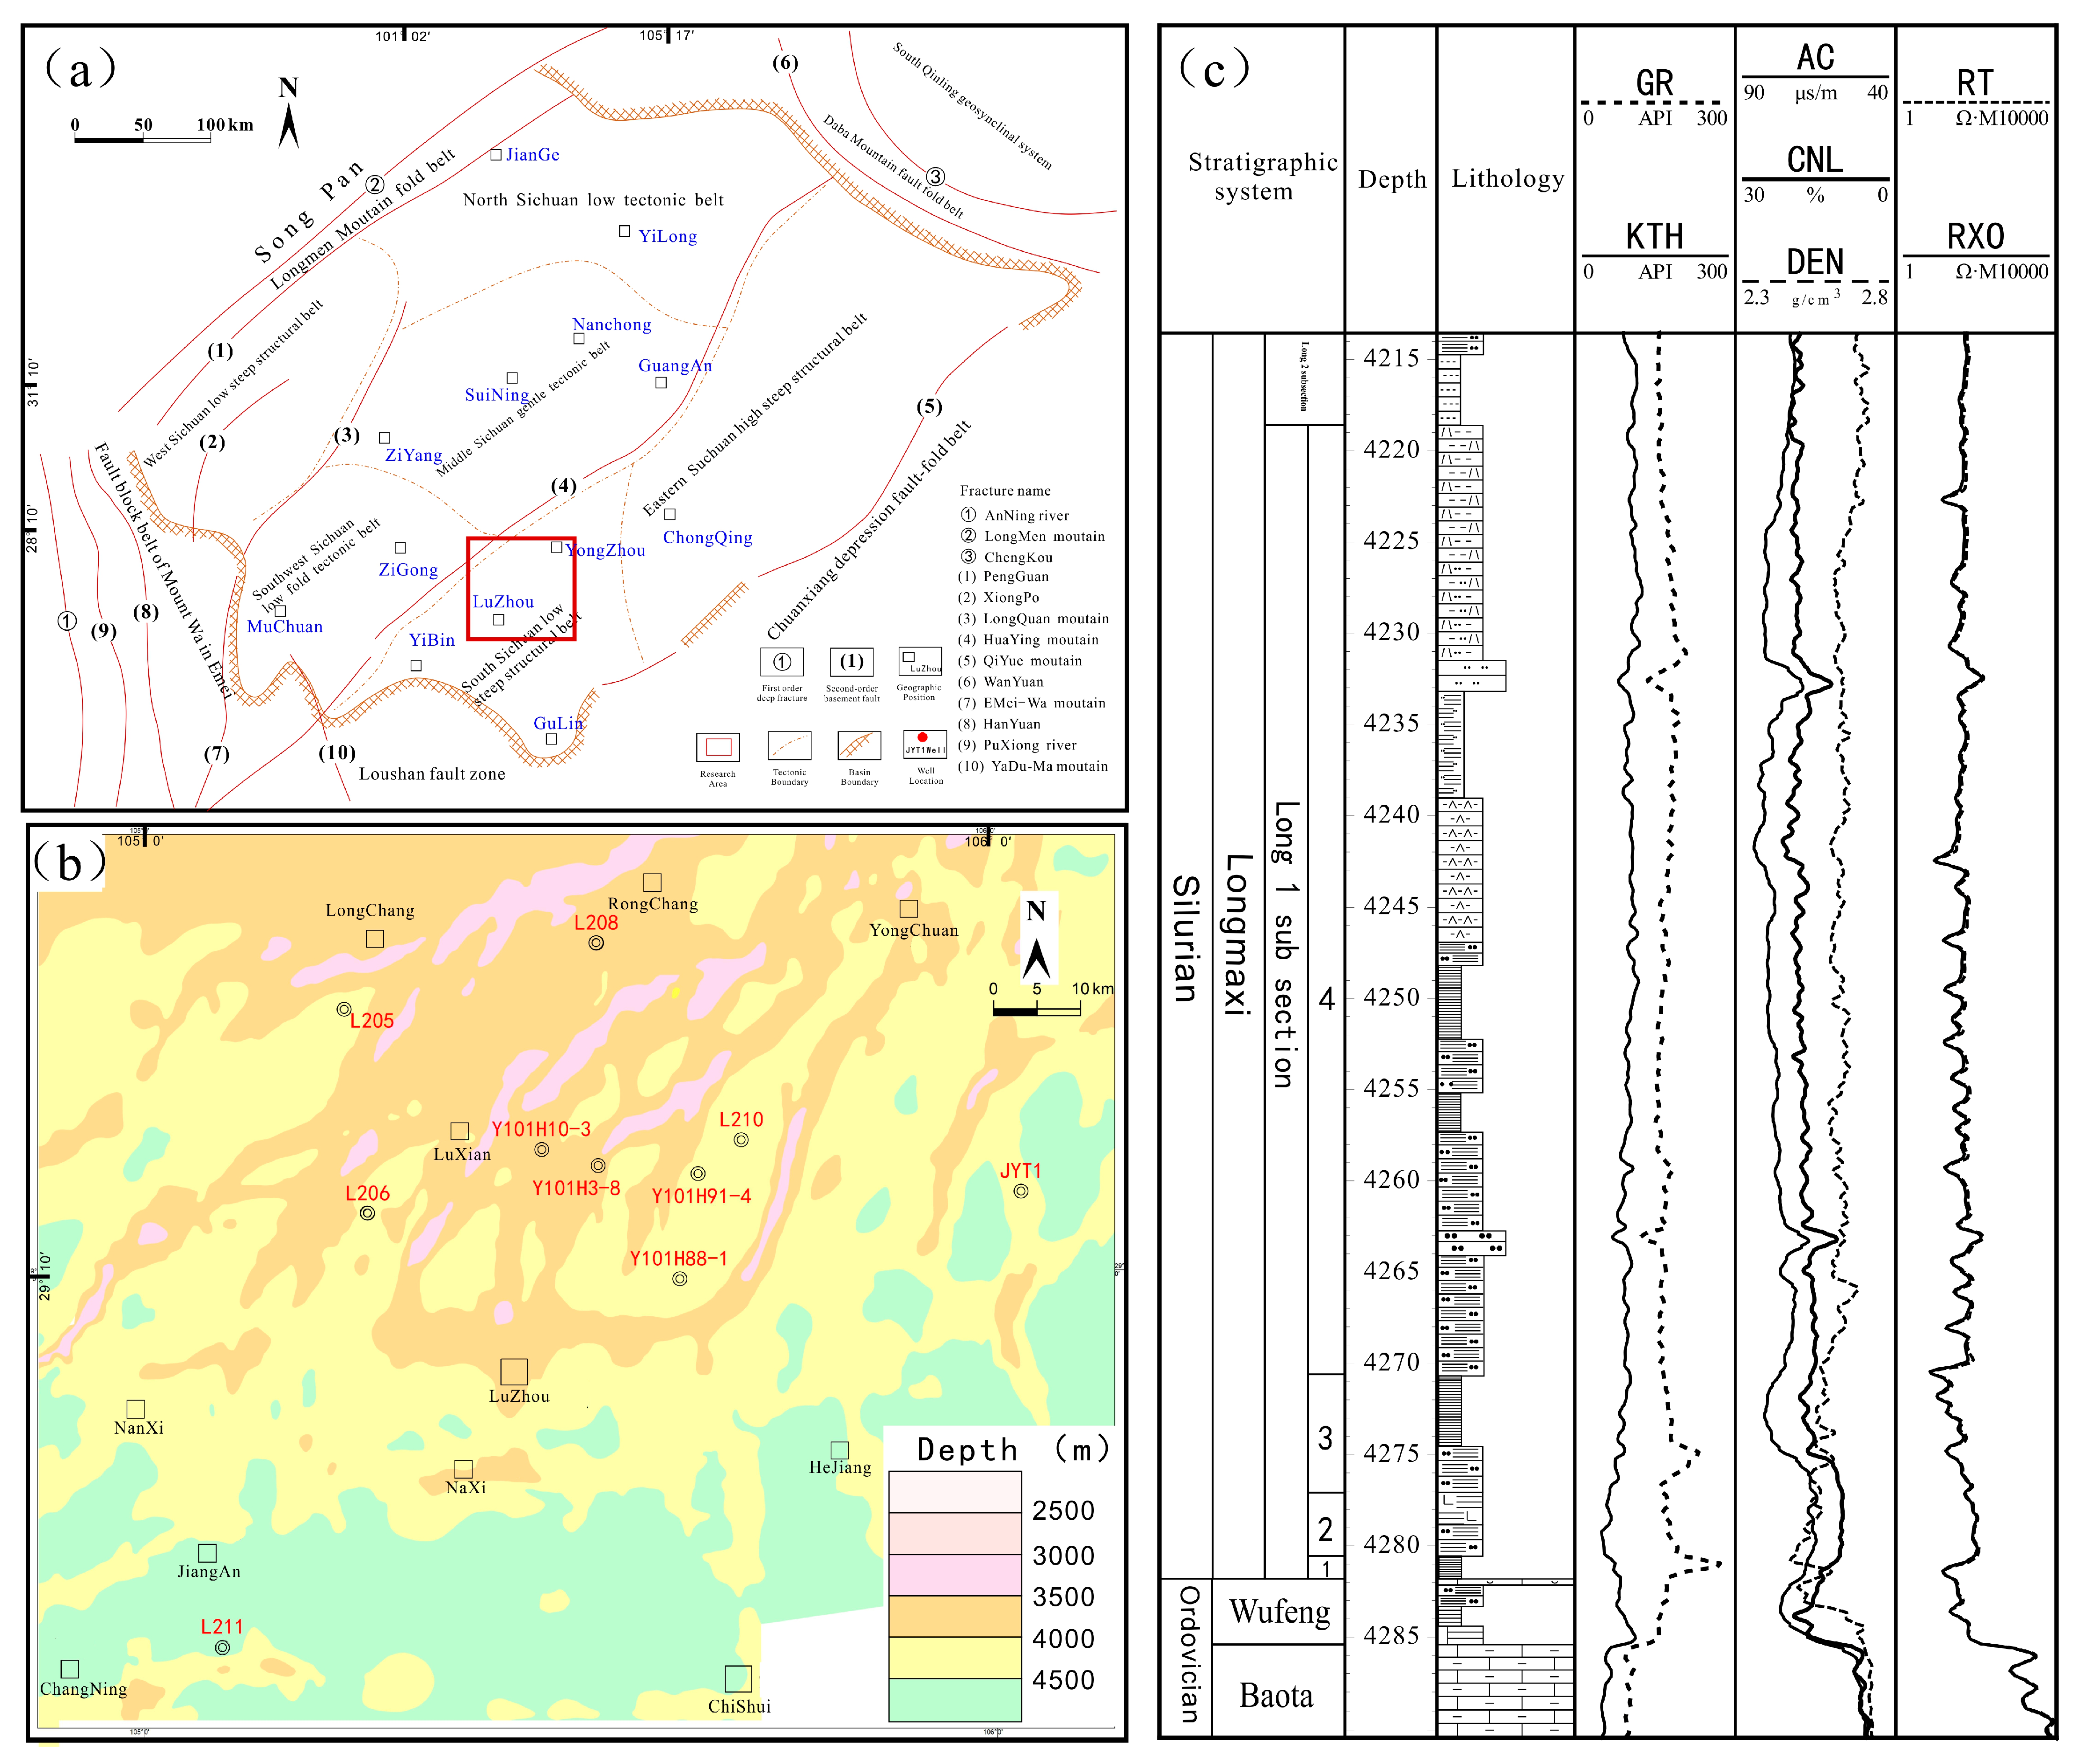
Figure 1. Structural location, research wells’ location, and comprehensive histogram of strata in the study area. (a) Structural Location Map of the Study Area; (b) Plan of the location of the research well; (c) Research stratigraphic column diagram of the stratum layer.
Minerals 15 01241 g001
Figure 2. Curves of nitrogen adsorption (a) and high pressure mercury injection (b) of samples in study area.
Minerals 15 01241 g002
Figure 3. Map image characteristics of shale reservoir in Longmaxi Formation, south Sichuan. (a) JYT1 well, 4319.91 m, shows fused particles on the Maps image; (b) NX202 well, 3938.39 m, reveals mineral outlines before fusion on Maps; (c) JYT1 well, 4317.23 m, displays fused particles on Maps, with organic matter filling and dispersing among the particles; (d) JYT1 well, 4319.55 m, features large particles exceeding 60 μm in size; (e) is a close-up of (d), exhibiting small residual solution pores; (f) further magnifies (e), outlining the mineral profile before small particle fusion around the edges of the solution pore; (g) Well Y101H2-7, 4144.35 m, contains corrosion holes among large particles; (h) is a close-up of (g), revealing small intergranular and solution pores; (i) further magnifies (g), showing incomplete particle fusion and residual intergranular pores.
Minerals 15 01241 g003
Figure 4. Shale reservoir Maps mineral analysis images of different wells.
Minerals 15 01241 g004
Figure 5. Pore development characteristics of shale reservoirs with different PS intensities. (a) Well Y101H2-7, 4144.35 m, features distinct particles visible in the Maps image, with organic matter evenly dispersed amidst these particles. (b) Well L203H57-3, 3740.18 m, reveals large particles in Maps, accompanied by patches of organic matter scattered throughout. (c) Well JYT1, 4319.91 m, exhibits no granular texture in Maps; instead, organic matter is embedded within or between mineral particles. (d) A closer examination of (a) highlights prominent particles and a significant level of organic pore development; (e) zooming into (b) reveals residual intergranular and intra-granular pores, along with well-developed organic pores. (f) A local amplification of (c) shows indistinct particle boundaries, with organic matter integrated into the particles and poorly developed organic pores; however, pores within the particles are still visible.
Minerals 15 01241 g005
Figure 6. Column diagram of pore proportion of shale reservoirs with different PS intensities. (a) The proportion of different types of pores when Qp < 50; (b) The proportion of different types of pores when 50 < Qp < 60; (c) The proportion of different types of pores when Qp > 60.
Minerals 15 01241 g006
Figure 7. Histogram of pore volume distribution of shale reservoirs with different PS intensities. (a) Histograms of the total pore volume distribution of shale reservoirs under different PS intensities; (b) Histograms of the organic pore volume distribution in shale reservoirs under different PS intensities; (c) Histograms of the inorganic pore volume distribution of shale reservoirs under different PS intensities.
Minerals 15 01241 g007
Figure 8. Influence of different well depth on PS strength. (a) The average Qp value of different wells changes with depth in a certain pattern; (b) The trend of Qp variation with depth in Well Y101H2-7; (c) The trend of Qp variation with depth in Well L203.
Minerals 15 01241 g008
Figure 9. Influence of water saturation on PS strength and microscopic characteristics of samples with different water saturation. (a) The PS parameter increases first and then flattens with the increase in water saturation; (b) Y101H2-7, 4144.35 m, Sw = 23.56%, the mineral particle profile is obvious, the average particle size of the mineral is small; (c) JYT1 well, 4317.23 m, Sw = 53.56%, the degree of consolidation between particles is high, and the particle size is large.
Minerals 15 01241 g009
Figure 10. Correlation between PS parameter and mineral composition of shale reservoir. (a) Correlation between PS parameter and quartz content of shale reservoir; (b) Correlation between PS parameter and clay content of shale reservoir; (c) Correlation between PS parameter and carbonate content of shale reservoir.
Minerals 15 01241 g010
Figure 11. Variation trend of pore parameters with PS parameters. (a) Variation trend of pore volume with PS parameters; (b) Variation trend of organic pore portion with PS parameters; (c) Variation trend of inorganic pore portion with PS parameters; (d) Variation trend of microcrack portion with PS parameters.
Minerals 15 01241 g011
Figure 12. Model of reservoir development under different PS intensities.
Minerals 15 01241 g012
Table 1. Attributes of shale reservoir parameters in the study area.
Number of SamplesDepth/mTOC/%Water Saturation/%Porosity/%Organic Pore Ratio/%Inorganic Pore Ratio/%Microcracks Ratio/%Quartz Ratio/%Carbenate
Ratio/%
Clay
Ratio/%
Average Particle Size of Quartz/μmMean Particle Size of Mineral/μmPore Volume/cm3/g
Y101H-14137.494.0528.943.5568.9128.822.2769.284.1914.231.741.190.01775
Y101H-24147.157.3225.315.0961.2932.755.9665.2420.6111.961.311.350.01545
Y101H-34145.173.9840.353.9662.6228.39.0867.1019.2411.231.861.090.01980
Y101H-44140.254.5947.382.5670.3328.041.6381.226.119.782.251.210.01280
Y101H-54142.324.7628.376.4241.4643.0815.4655.619.4918.601.471.190.01210
Y101H-64147.383.3225.324.2247.4544.098.4657.7917.6221.361.341.480.01610
Y101H-74147.544.3225.345.3567.4631.690.8566.8713.7219.501.131.330.01675
NX202-83938.392.6946.975.1249.1248.112.7752.6431.547.201.331.310.01060
NX202-93936.923.5122.754.3140.8655.114.0344.4537.5914.301.111.530.01155
NX202-103931.953.837.612.8660.9636.242.8074.987.1411.601.661.210.01430
NX202-113923.664.6552.492.9160.1637.552.2974.367.5411.352.761.370.00955
L211-124833.453.9480.251.8750.41 46.71 2.87 74.8720.24 8.74 2.87 1.41 0.00935
L211-134853.80 4.2360.352.6849.26 48.23 2.51 70.2320.81 10.002.94 1.42 0.01340
L211-144841.794.0579.853.0448.11 49.75 2.14 72.8719.38 5.77 2.91 1.44 0.01520
L203-153740.865.5730.524.1467.0331.701.2769.7918.468.691.851.080.02070
L203-163742.244.9657.253.9562.1134.853.0470.9019.058.782.390.940.01975
L203-173743.164.9865.462.4440.5856.732.6970.8316.386.292.230.870.01220
L203-183744.484.4445.004.4153.1837.199.6360.9616.545.942.190.880.02205
L203-193743.644.9834.452.4468.7530.151.1073.5214.419.151.951.440.01220
L203-203741.453.2932.595.8546.7949.513.7051.0632.2714.761.291.190.01425
L203-213739.983.7529.776.4460.8433.415.7556.1523.286.531.271.100.01720
L203-223738.15.2550.452.2452.7446.730.5371.3211.346.782.291.050.01620
L203-233736.064.2932.304.7353.5744.122.3156.052.4421.491.361.030.02365
JYT1-244319.557.0350.353.8864.3031.274.4378.035.788.501.891.190.01940
JYT1-254317.235.139.464.8664.235.020.7861.4522.235.981.421.260.0243
JYT1-264313.044.3435.763.667.4528.354.269.999.6911.541.221.230.018
Disclaimer/Publisher’s Note: The statements, opinions and data contained in all publications are solely those of the individual author(s) and contributor(s) and not of MDPI and/or the editor(s). MDPI and/or the editor(s) disclaim responsibility for any injury to people or property resulting from any ideas, methods, instructions or products referred to in the content.