Article

Investigation of the Gemological Characteristics and Types of Inclusions of Emeralds from Sumbawanga, Tanzania

1
School of Gemology, China University of Geosciences Beijing, Beijing 100083, China
2
School of National Safety and Emergency Management, Beijing Normal University, Zhuhai 519087, China
*
Author to whom correspondence should be addressed.
Minerals 2025, 15(12), 1240; https://doi.org/10.3390/min15121240 (registering DOI)
Submission received: 28 October 2025 / Revised: 11 November 2025 / Accepted: 21 November 2025 / Published: 23 November 2025

Abstract

Africa hosts numerous emerald deposits, among which Sumbawanga, located at the junction of Tanzania, Zambia, Congo, and Malawi, stands out as one of the significant localities. This study presents a comprehensive analysis of the gemological, spectroscopic, and inclusion characteristics of Sumbawanga (Tanzania) emerald samples utilizing techniques such as gem microscopy, UV-Vis-NIR spectroscopy, Raman spectroscopy, GEM-3000, and EPMA, etc. These emerald crystals look like rolled pebbles and display a bluish-green coloration. They contain fingerprint-like fluid inclusions, which occasionally encompass a circular bubble (the gas phase is CO2). Sumbawanga emeralds are characterized by abundant mineral inclusions, including quartz, apatite, anhydrite, diaspore, chrysoberyl, rutile, hematite, and magnetite. Particularly diagnostic are the mineral inclusion of chrysoberyl twins and the assemblages of quartz and diaspore.

1. Introduction

Emerald (Be3Al2Si6O18) fascinates with its unparalleled color; its distinctive vivid green hue is attributed to the internal electron transition of chromium (Cr) and/or vanadium (V). The abundant inclusions within emeralds create a miniature garden, such as healed fingerprint-like fractures, jagged or needle-shaped or rectangular fluid inclusions, flaky brown phlogopite or red hematite, black granular magnetite, colorless quartz, feldspar, calcite, etc. [1,2,3,4,5]. While these common inclusions cannot be directly used to determine the origin of emeralds, they can provide important information about the emerald-forming environment. Among the various emerald mining locations, Colombia, renowned as a traditional source of emerald, remains synonymous with high-quality specimens. Zambia, an emerging player in the emerald market, has rapidly gained prominence and secured a significant market share in recent years. Southern Africa includes several important emerald mining sites in countries such as Zambia, Tanzania, Mozambique, Zimbabwe, Ethiopia, and Madagascar, each contributing gemstones resources in the global emerald market [5,6,7,8,9,10,11,12].
In Tanzania, emerald mining research and development have followed a distinctive trajectory. In 1988, a secondary emerald deposit was discovered in Sumbawanga, which was quickly brought into production [13]. This discovery made this area the second emerald mining location in Tanzania, succeeding the previous Lake Manyara deposit.
Around the 2000s, several researchers investigated inclusions in emeralds from Lake Manyara and Sumbawanga, but these studies notably lacked clear photomicrographs of the inclusions [7,8]. Research on Tanzania emeralds, particularly those from Sumbawanga, has primarily focused on their chemical composition and comparative studies across different geographic origins [14,15,16].
In summary, there is a significant lack of studies on inclusions, particularly those of the mineral type, present in Tanzanian emeralds. As a consequence, the provenance and formation mechanisms of emeralds from Sumbawanga secondary deposit remain largely enigmatic. In this study, through a comprehensive suite of analysis techniques, including standard gemological testing, microscopic observation, fiber optic spectrometer, UV-Vis-NIR spectroscopy, Raman spectroscopy, and electron probe microanalysis (EPMA), the inclusion characteristics and gemological properties of Sumbawanga emeralds have been systematically updated and refined. A deeper understanding of the inclusions in emeralds provides solid evidence to determine the geographic origin of emeralds. Furthermore, it is expected to establish a fundamental basis for investigating the geographic origin of Sumbawanga secondary emeralds.

2. History and Geological Setting of the Sumbawanga Deposit

Since its discovery in 1988, the emerald deposit in Sumbawanga has been rapidly exploited [13]. However, Sumbawanga emeralds are typically more suitable for cutting into cabochons or for carving purposes, as the gem-quality material is exceptionally rare [13]. It was only in 2011 that gem dealer Farooq Hashmi purchased two relatively fine pieces of rough emerald from Sumbawang [17].
The Sumbawanga emerald deposit is located northwest of Lake Rukwa in southwestern Tanzania, tectonically situated within the Ubendian Orogenic Belt (Figure 1). This NW-SE trending orogenic belt extends from the Democratic Republic of Congo to Malawi, connecting the Archean Tanzania Craton with the Paleoproterozoic Bangweulu Block [18]. The inland Lake Rukwa is situated within this orogenic belt.
Several researchers have reported that the emerald deposit in Sumbawanga occurs within biotite schists, which have undergone weathering processes [8,13]. However, the precise formation mechanism remains unclear [8,15].

3. Materials and Methods

3.1. Sample Description

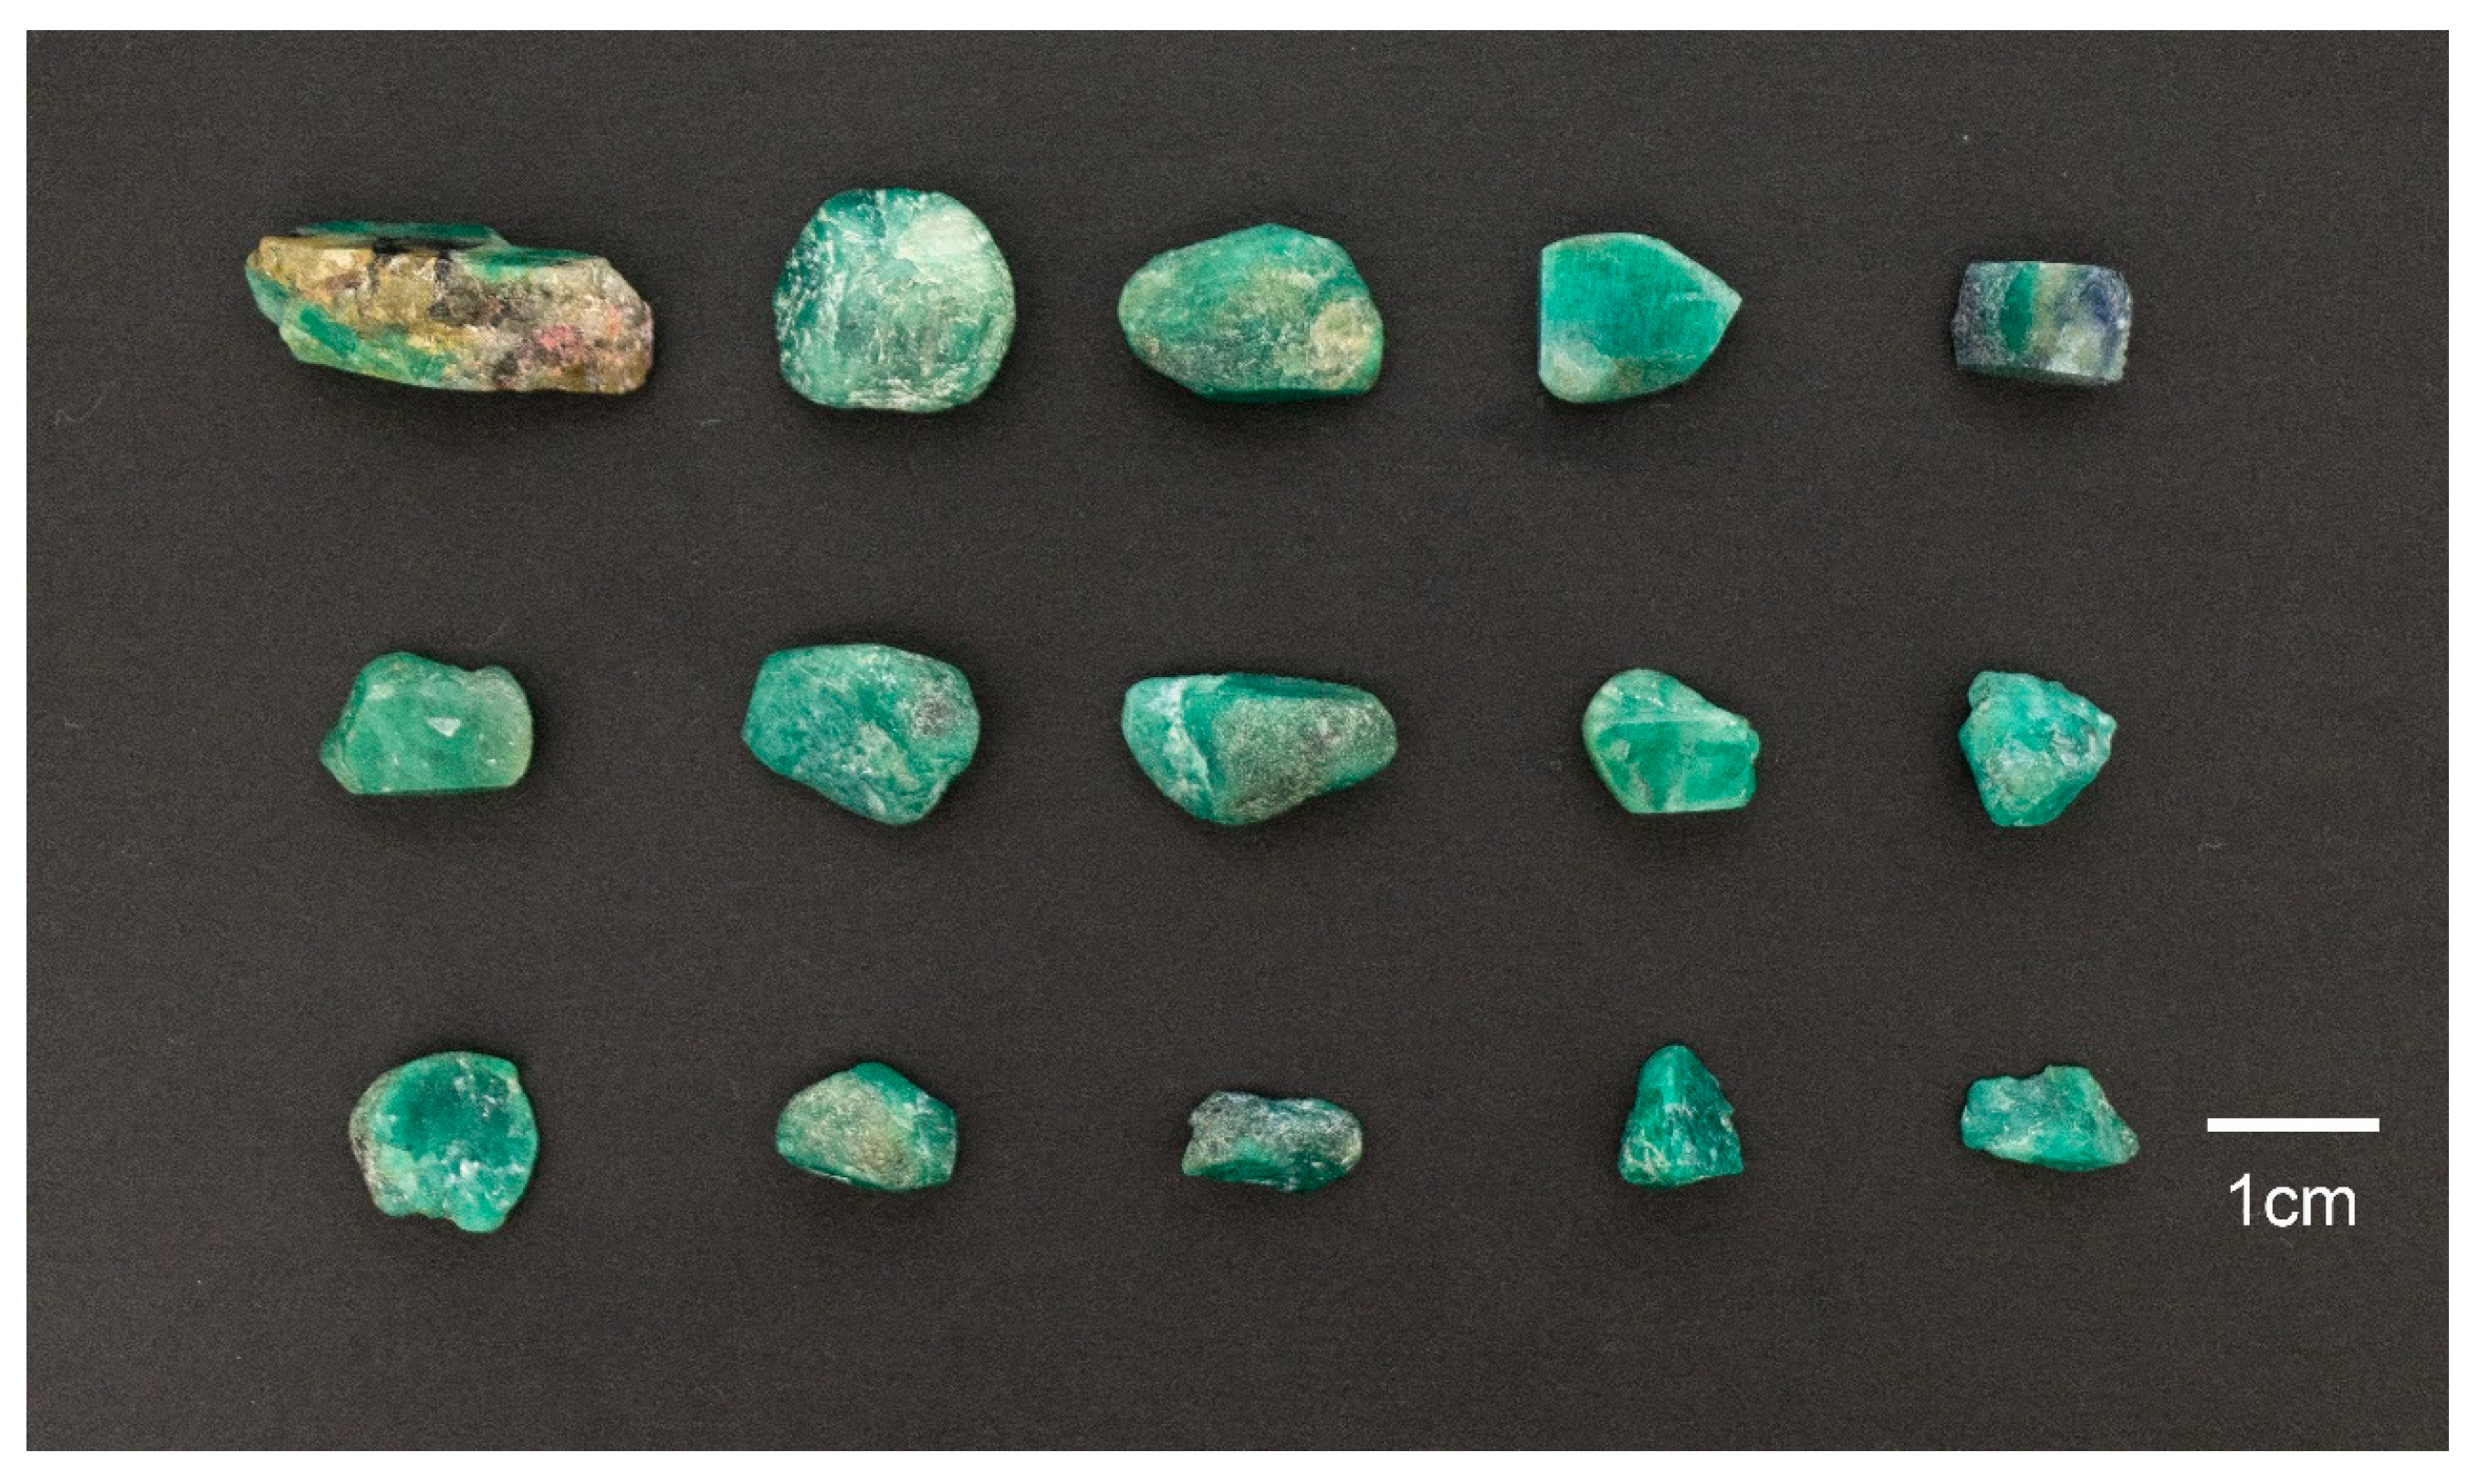
A total of eighteen emerald samples (EST-01 to EST-18) were examined from Sumbawanga, Tanzania. Fifteen emerald samples are round without the well-formed hexagonal prisms (Figure 2). They range in transparency from translucent to transparent and display colors varying from light green to intense green with a slight blue tinge. In addition, there are three thin sections (EST-16 to EST-18) with a thickness of 0.04 mm.

3.2. Gemological Analysis

Conventional gemological analyses of all samples were performed at the Gemological Research Laboratory of China University of Geosciences, Beijing. Each sample was examined using a refractometer, Chelsea filter, long-wave (365 nm) and short-wave (254 nm) UV lamps, DiamondView™ (London, UK), and an apparatus for hydrostatic-specific gravity assessment. Internal and external features were observed with a GI-MP22 gemological photographic microscope utilizing darkfield and top illumination techniques. The inclusion thin sections were examined using an BX-51 polarizing microscope (manufactured by Olympus corporation, Tokyo, Japan) under both plane-polarized and cross-polarized light conditions.
The UV-Vis-NIR spectra of thirteen samples were recorded using a UV-3600 spectrophotometer manufactured by Shimadzu (Kyoto, Japan) in diffuse reflection mode with a wavelength range from 300 to 900 nm. This instrument is equipped with an ISR-3100 integrating sphere attachment, featuring a sphere diameter of 60 mm and a slit width of 20 nm. And the sampling interval is set at 1.0 nm.
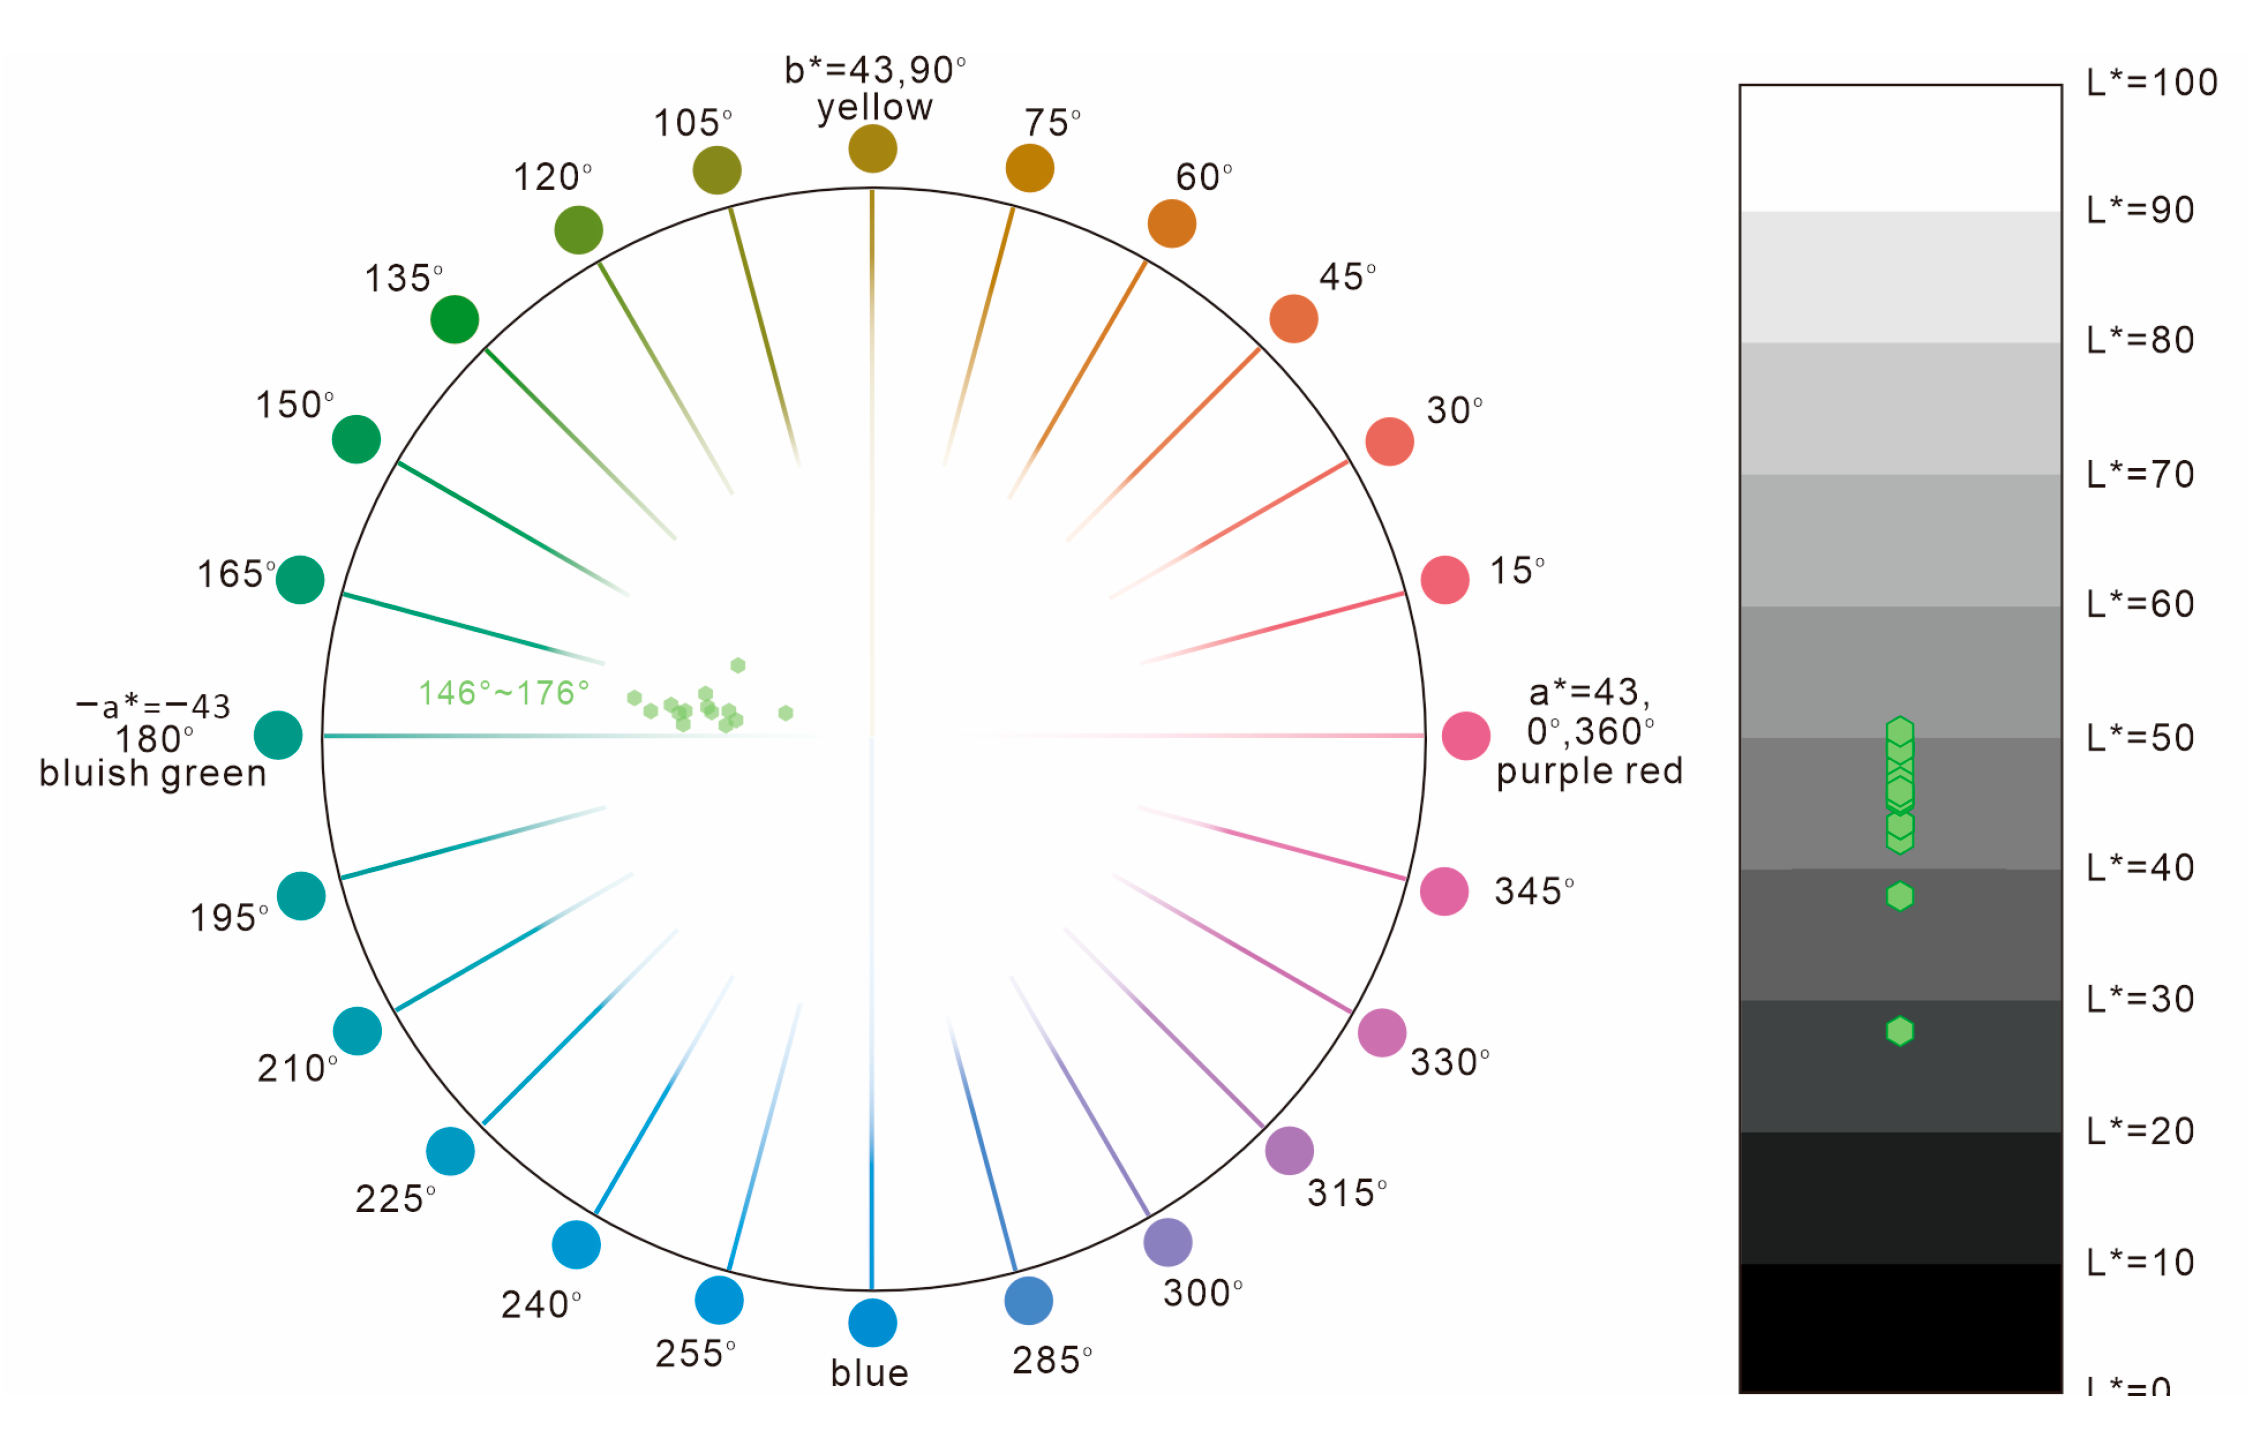
The CIE 1976 LAB uniform color space is often used to quantify and characterize the color of gemstones. The color space is a circle with three axes in a three-dimensional space: L* (lightness) is perpendicular to the plane of the paper; the variable a* and b* lie in the plane and define a two-dimensional Cartesian coordinate system that represents the different colors and color saturations [19]. The color parameters of all emerald samples were collected by the QSPEC GEM-3000 spectrophotometer by Biaoqi (Guangzhou, China) at 6700 K color temperature.
Raman spectra were acquired using a Horiba LabRam HR-Evolution Raman spectrometer (HORIBA, Longjumeau, France) at the Gemological Research Laboratory of China University of Geosciences, Beijing, China, employing an Ar-ion laser with 532 nm excitation. The spectral range covered was from 4000 to 100 cm−1, with an integration time of 3 s and 2 scans accumulated. The Raman shifts were calibrated using monocrystalline silicon prior to testing, with a tolerance of ±0.5 cm−1.
The chemical composition of unknown mineral inclusions especially in thin sections was determined by EPMA using a JXA-iHP200F instrument (JEOL Ltd., Tokyo, Japan) housed at Key Laboratory of Metallogeny and Mineral Assessment, Institute of Mineral Resources, Chinese Academy of Geological Science (Beijing, China). Accelerating voltage and current were 15 kV and 20 nA, respectively. Element peaks and background were measured with counting times of 10 s and 5.0 s, respectively.

4. Results

4.1. Gemological Properties

The Sumbawanga emerald samples utilized in this study display a light to medium saturation of green with blue hues. The color parameters of the experimental samples are as follows: L* ∈ (27.47, 50.43), a* ∈ (−18.40, −6.46), and b* ∈ (0.95, 6.79) (Figure 3).
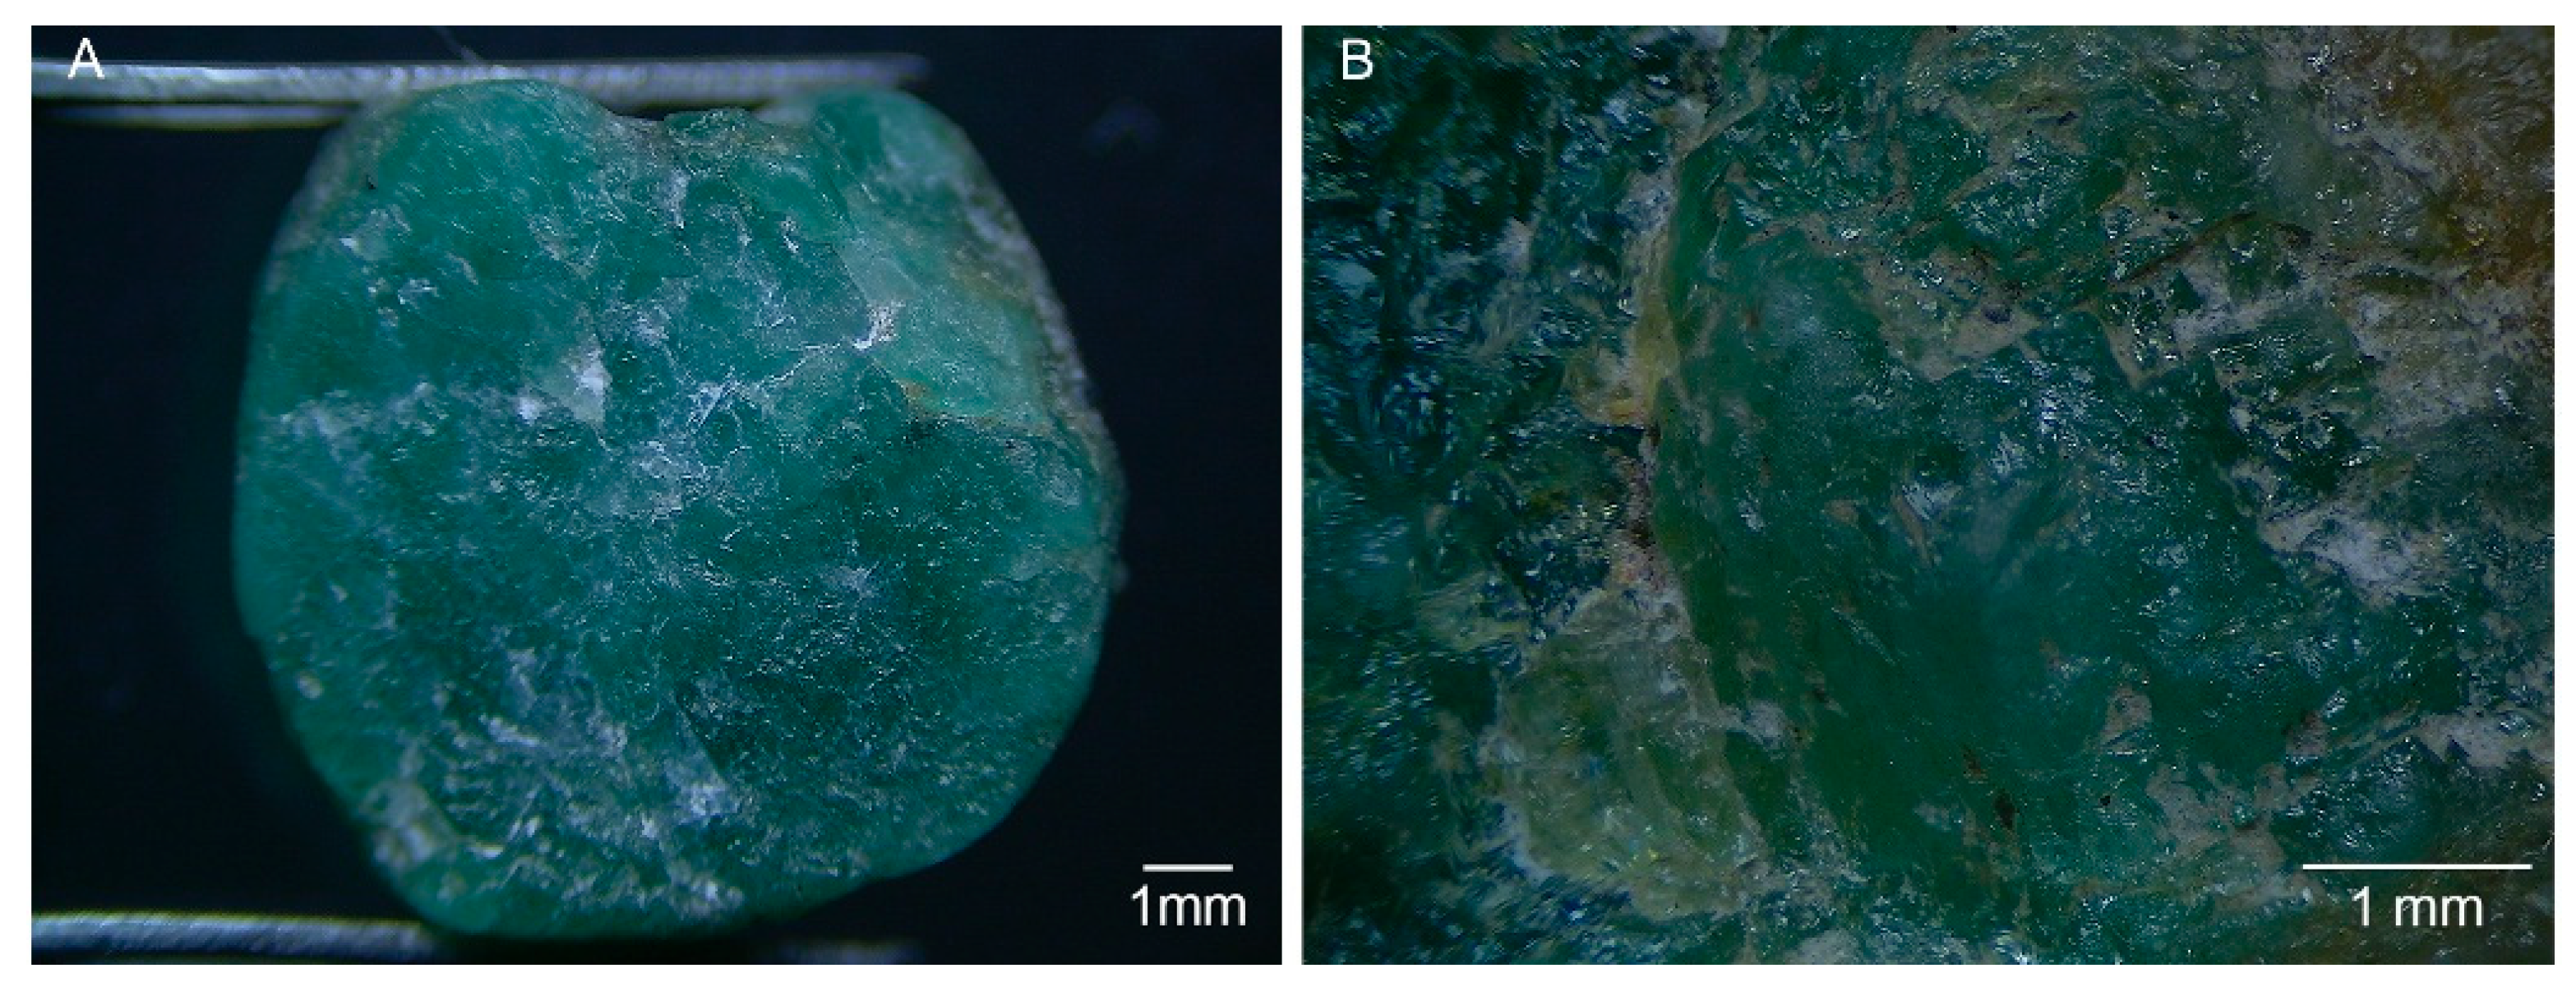
These emerald samples do not exhibit typical and well-developed hexagonal prismatic crystal forms. Instead, they generally show rounded pebble morphologies with localized surface damage, indicating that the samples have undergone transportation and abrasion processes (Figure 4). These morphological characteristics clearly indicate an origin from secondary deposits.
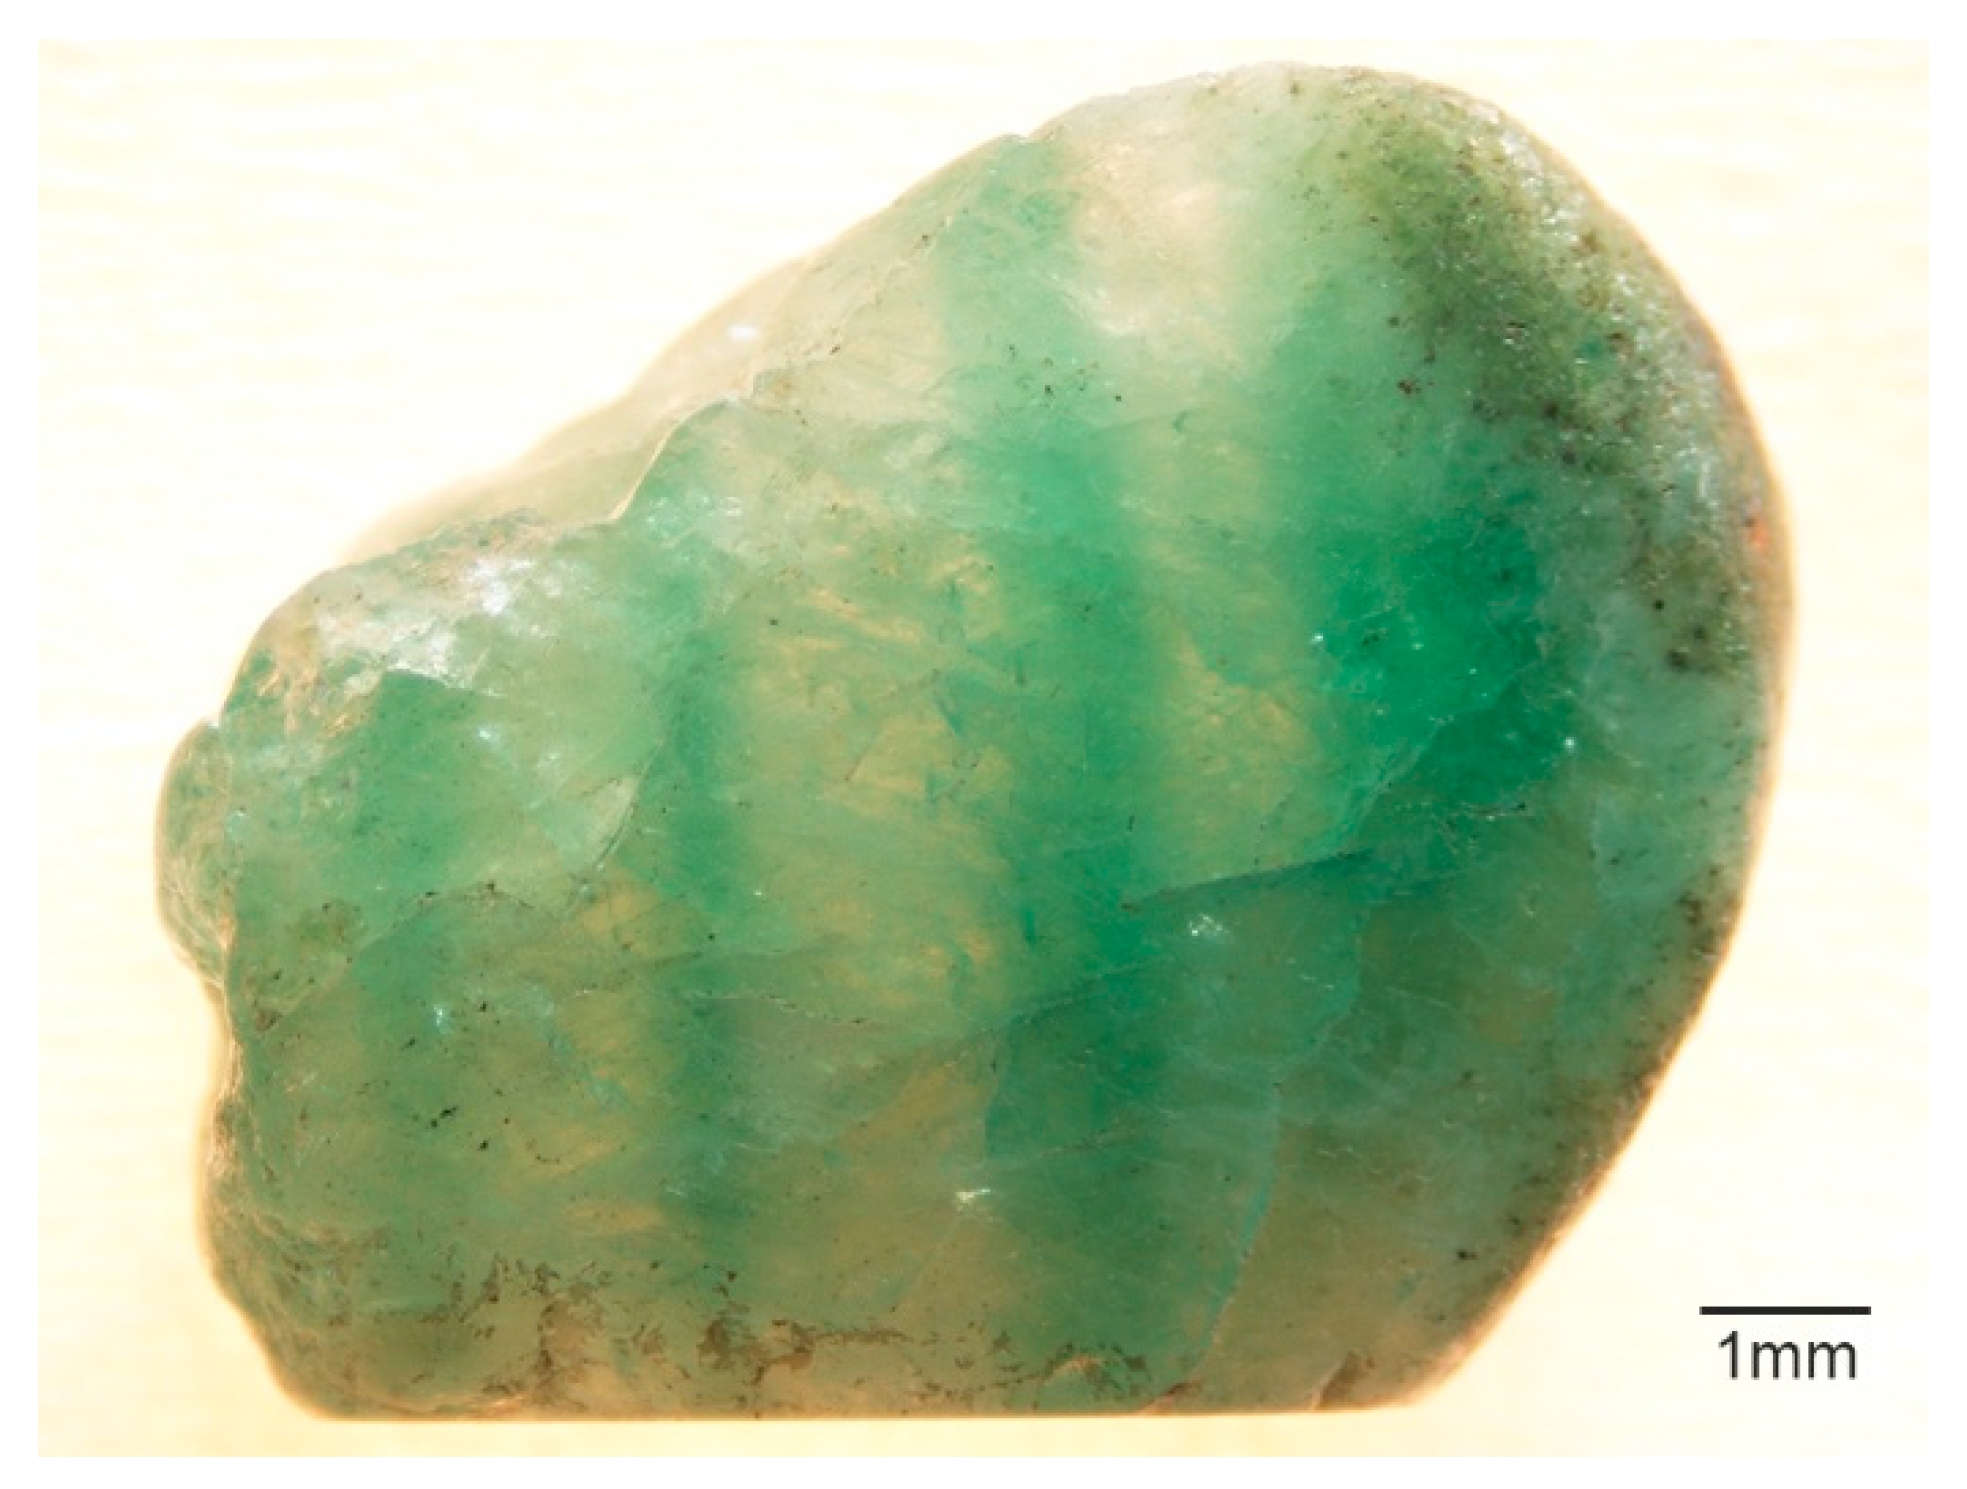
The two samples exhibit a non-uniform color distribution, with distinct, straight bands of color alternating between medium green and light green hues (Figure 5).
The gemological properties of these samples are summarized in Table 1. The refractive index ranges from 1.571 to 1.574 for the extraordinary direction (Ne) and from 1.577 to 1.581 for the ordinary direction (No), yielding a birefringence of 0.006 to 0.007. The refractive index conforms to the theoretical value of emerald, but is overall lower, while the birefringence is consistent with the report in 2012 [17]. The specific gravity varies between 2.66 and 2.72. All samples exhibit a red appearance when observed under the Chelsea color filter, with EST-14 showing particularly pronounced redness. Furthermore, they remain inert under both short and long-wave ultraviolet radiation.

4.2. Microscopic Characteristics

4.2.1. Associate Minerals

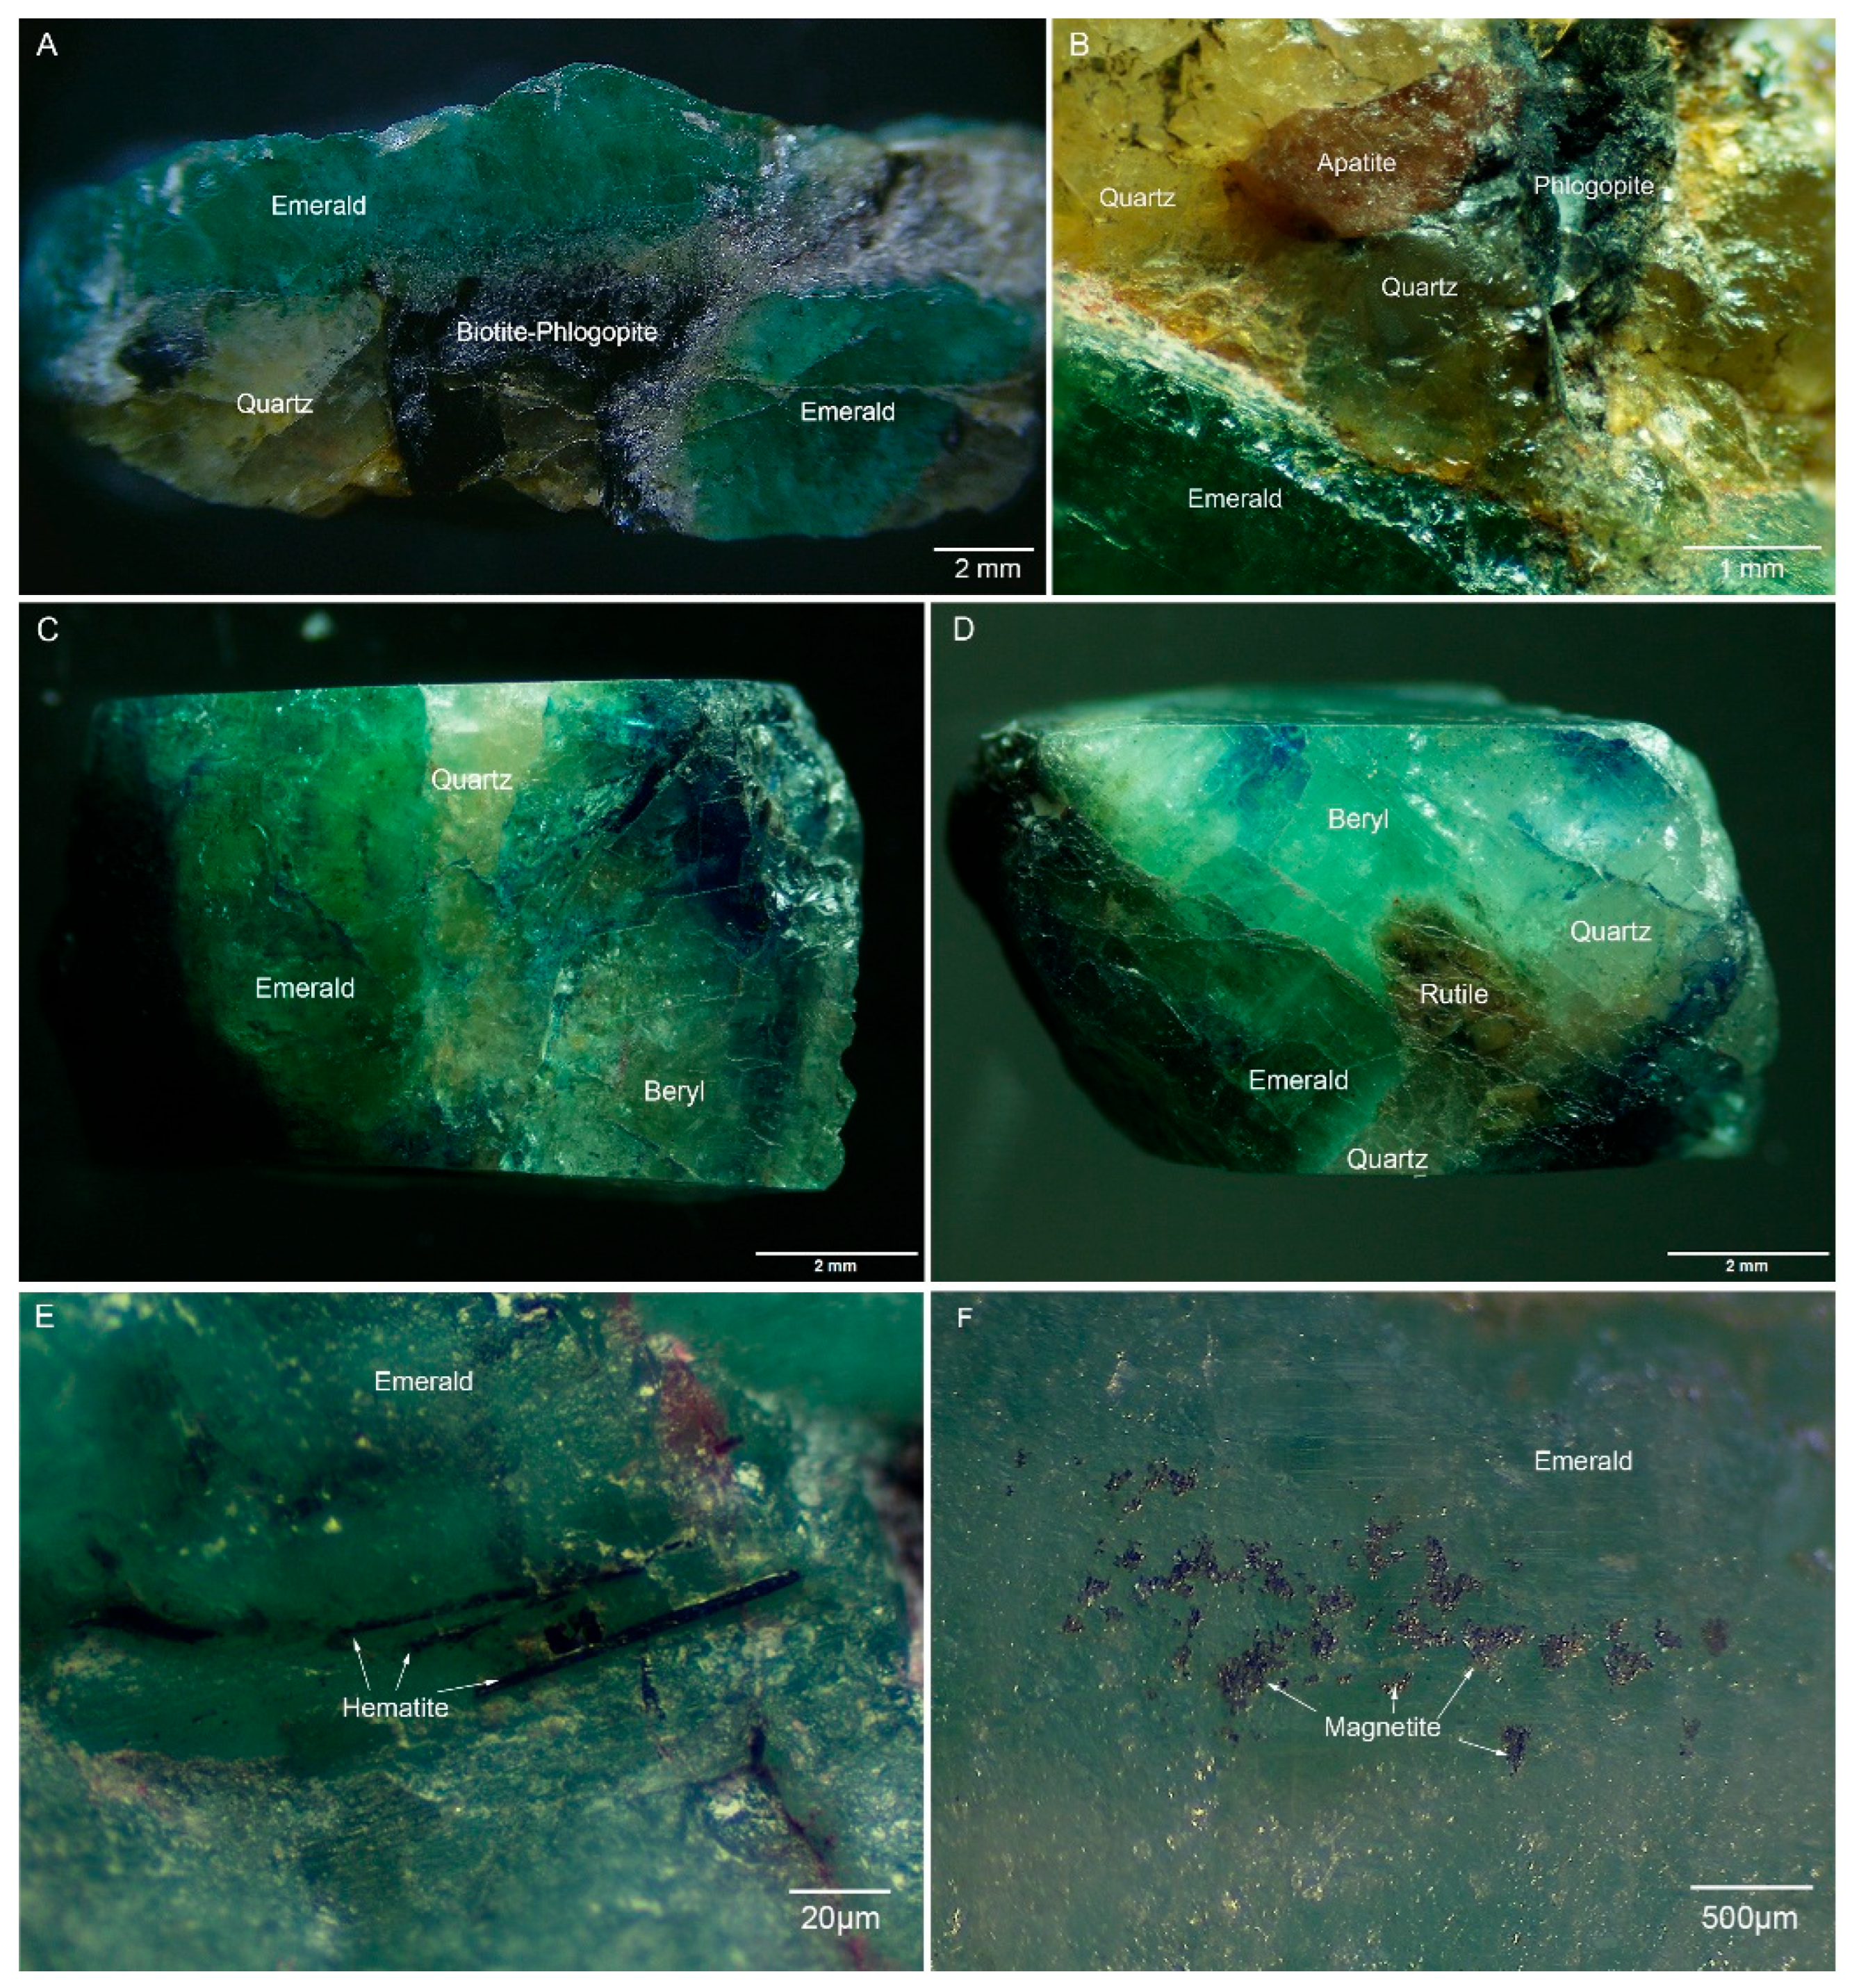
The surface of Sumbawanga emeralds exhibits various associate minerals, including colorless, gray, and yellow quartz, colorless beryl, brown phlogopite, black biotite, orange-pink apatite, yellowish-brown rutile, black hematite and black magnetite, which are formed within the same space (Figure 6).
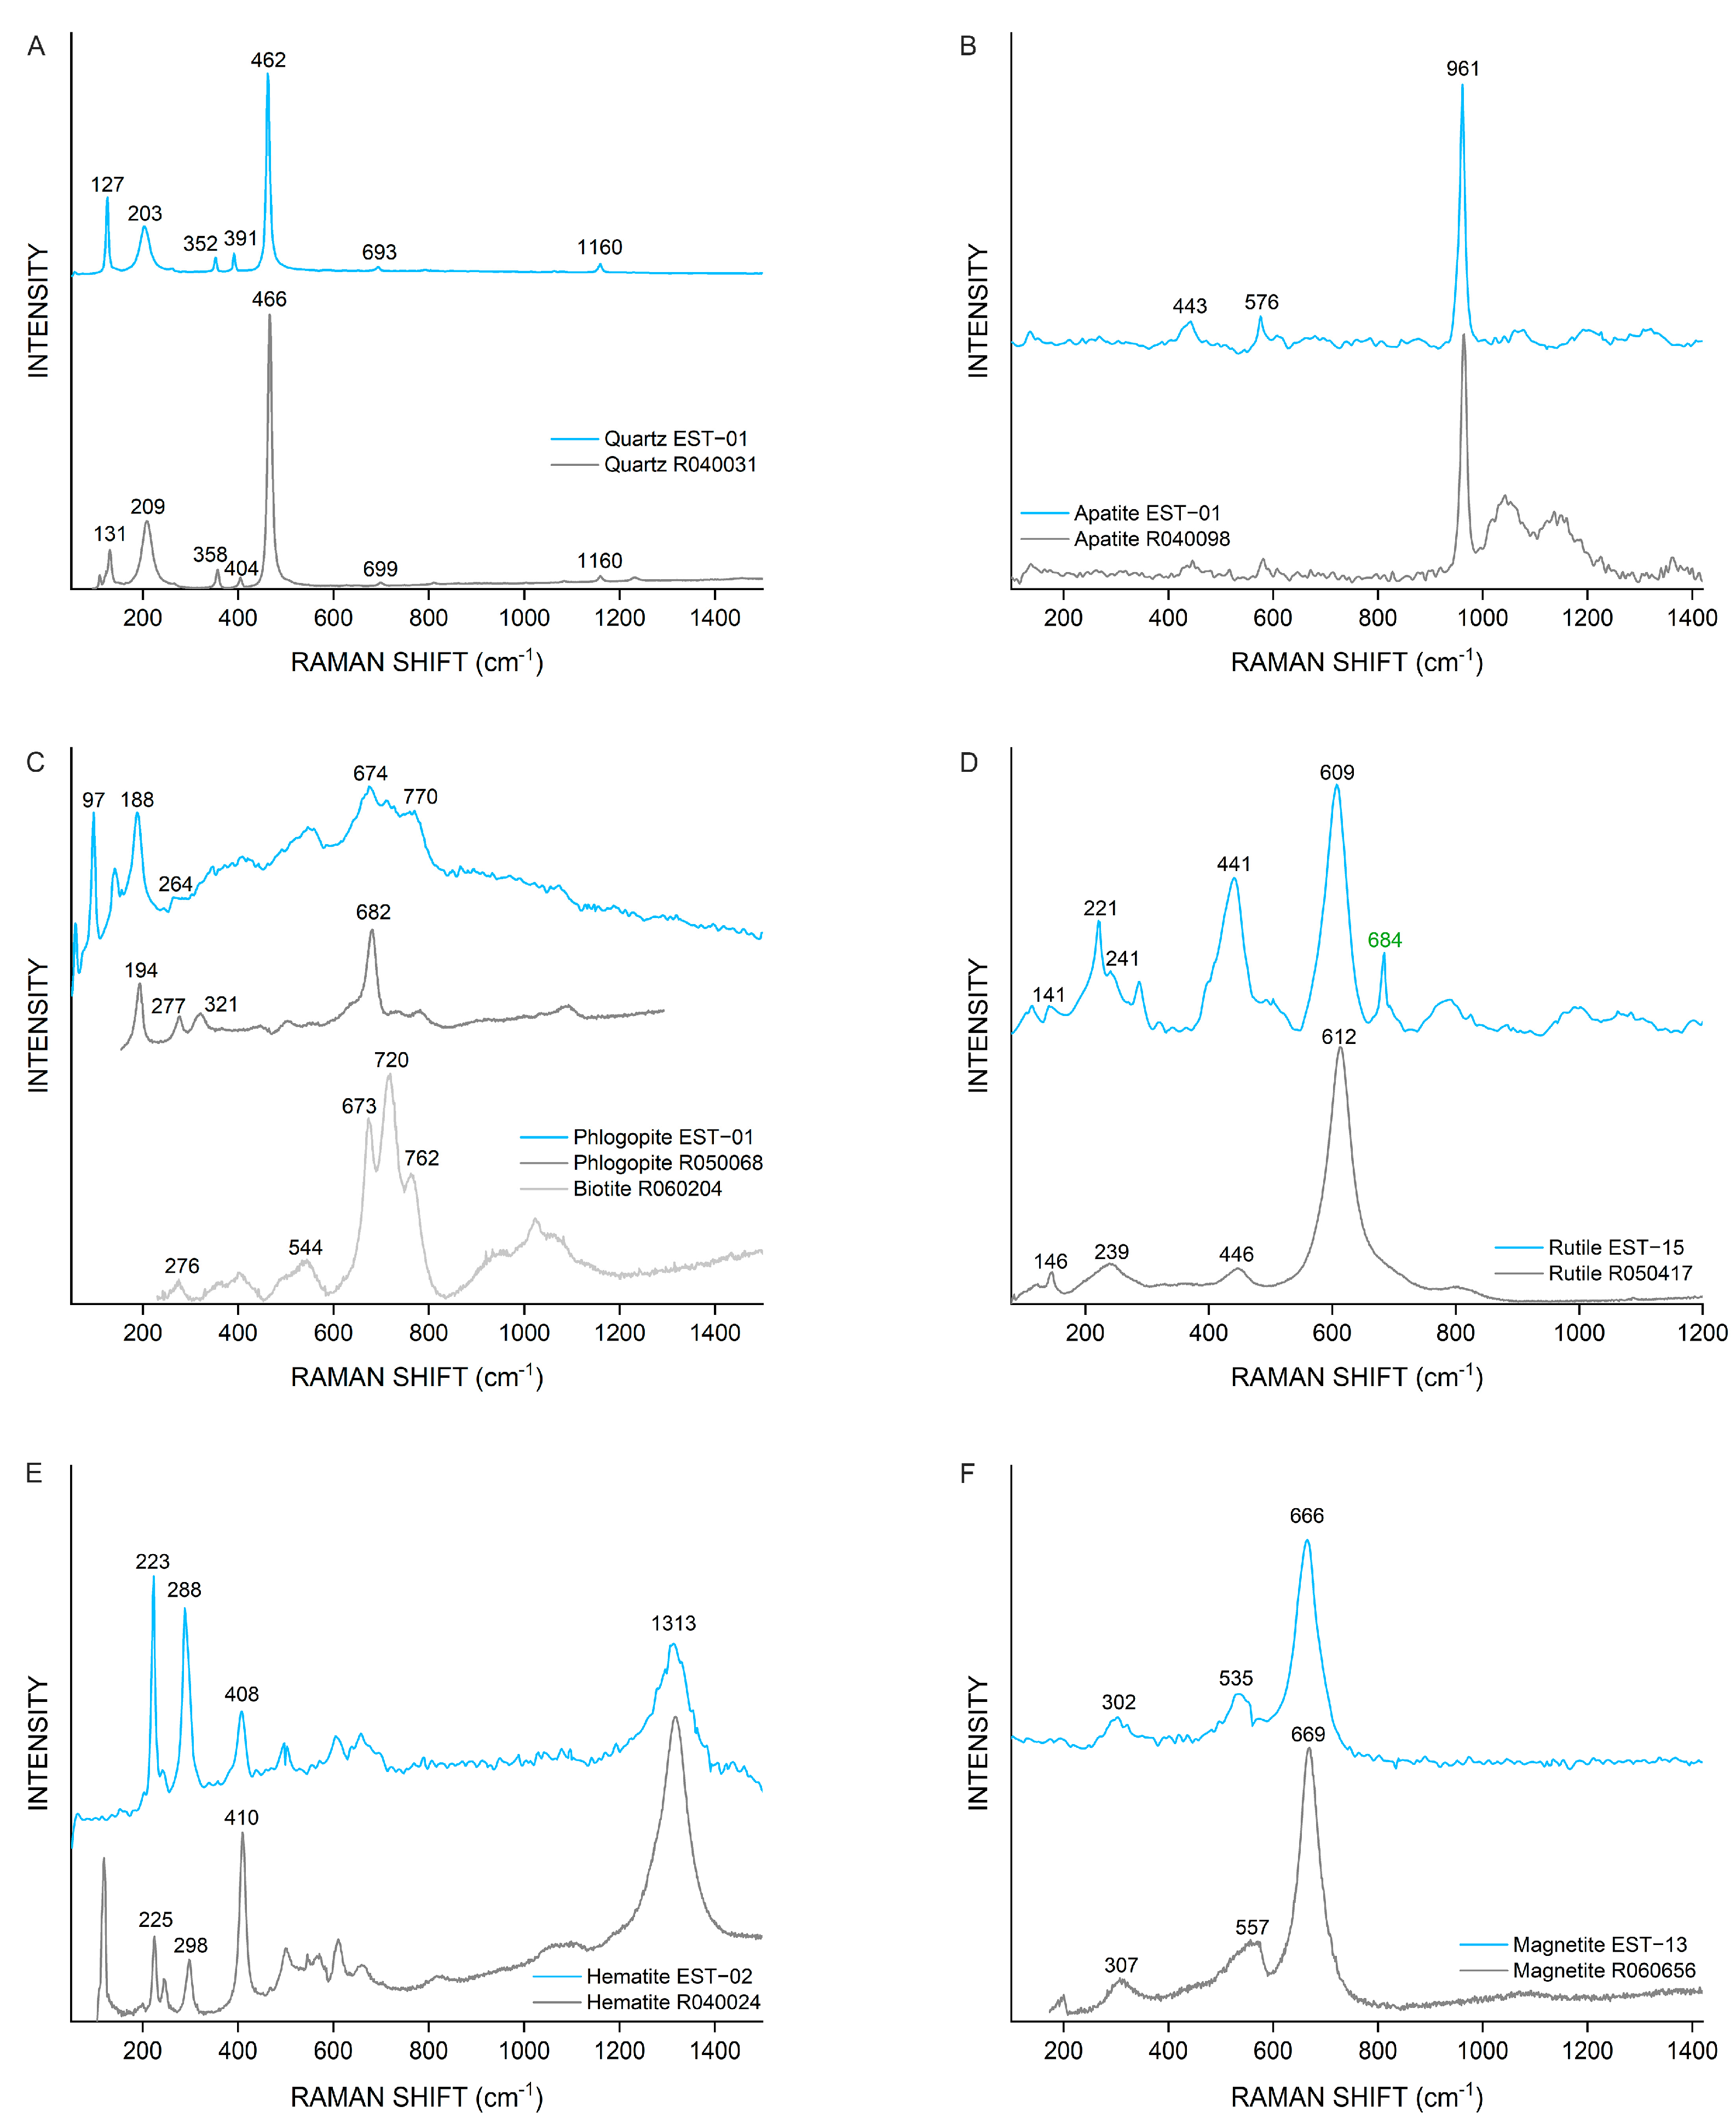
All these mineral-associated characteristics have been identified through Raman spectroscopy. Figure 7 shows their corresponding Raman spectra, along with comparative reference spectra from the RRUFF database.

4.2.2. Fluid Inclusions

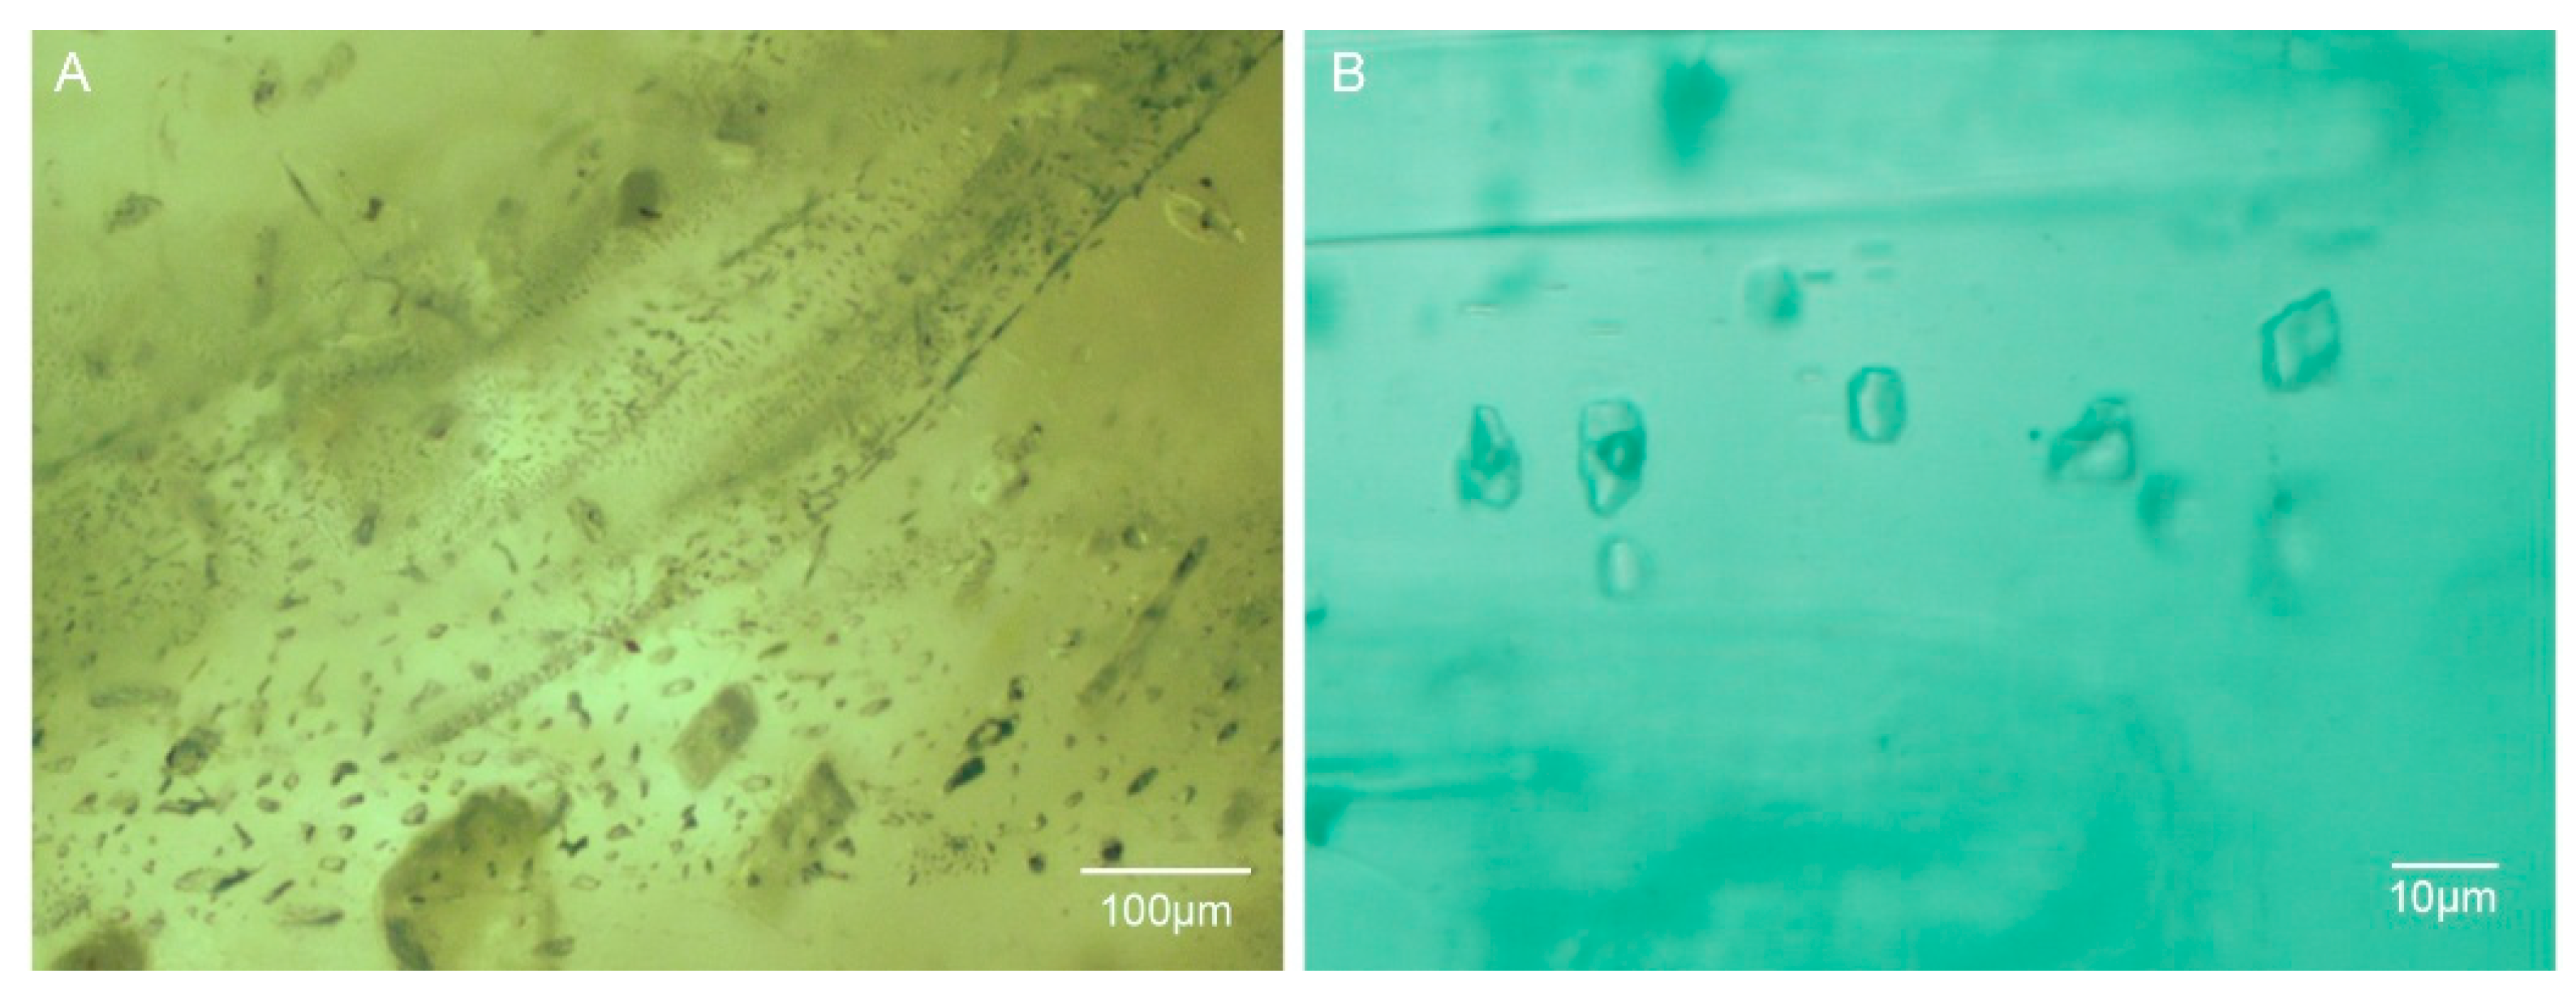
Fluid inclusions in Sumbawanga emeralds are commonly observed within healed fractures, typically exhibiting fingerprint-like patterns (Figure 8A). Individual fluid inclusions are generally small, with sub-rectangular morphologies, measuring approximately 10 μm in size and rarely exceeding 50 μm. Single-phase fluid inclusions are more prevalent, although occasional gas–liquid two-phase inclusions have been identified (Figure 8B).
Raman spectroscopic analysis reveals that the gas-phase primarily consists of CO2 (Figure 9, 1280 and 1385 cm−1). However, effective Raman spectra of the liquid phase components have not been successfully obtained, probably due to the rapid increase and subsequent saturation of emerald samples’ Raman signal intensity above 2500 cm−1.

4.2.3. Mineral Inclusions

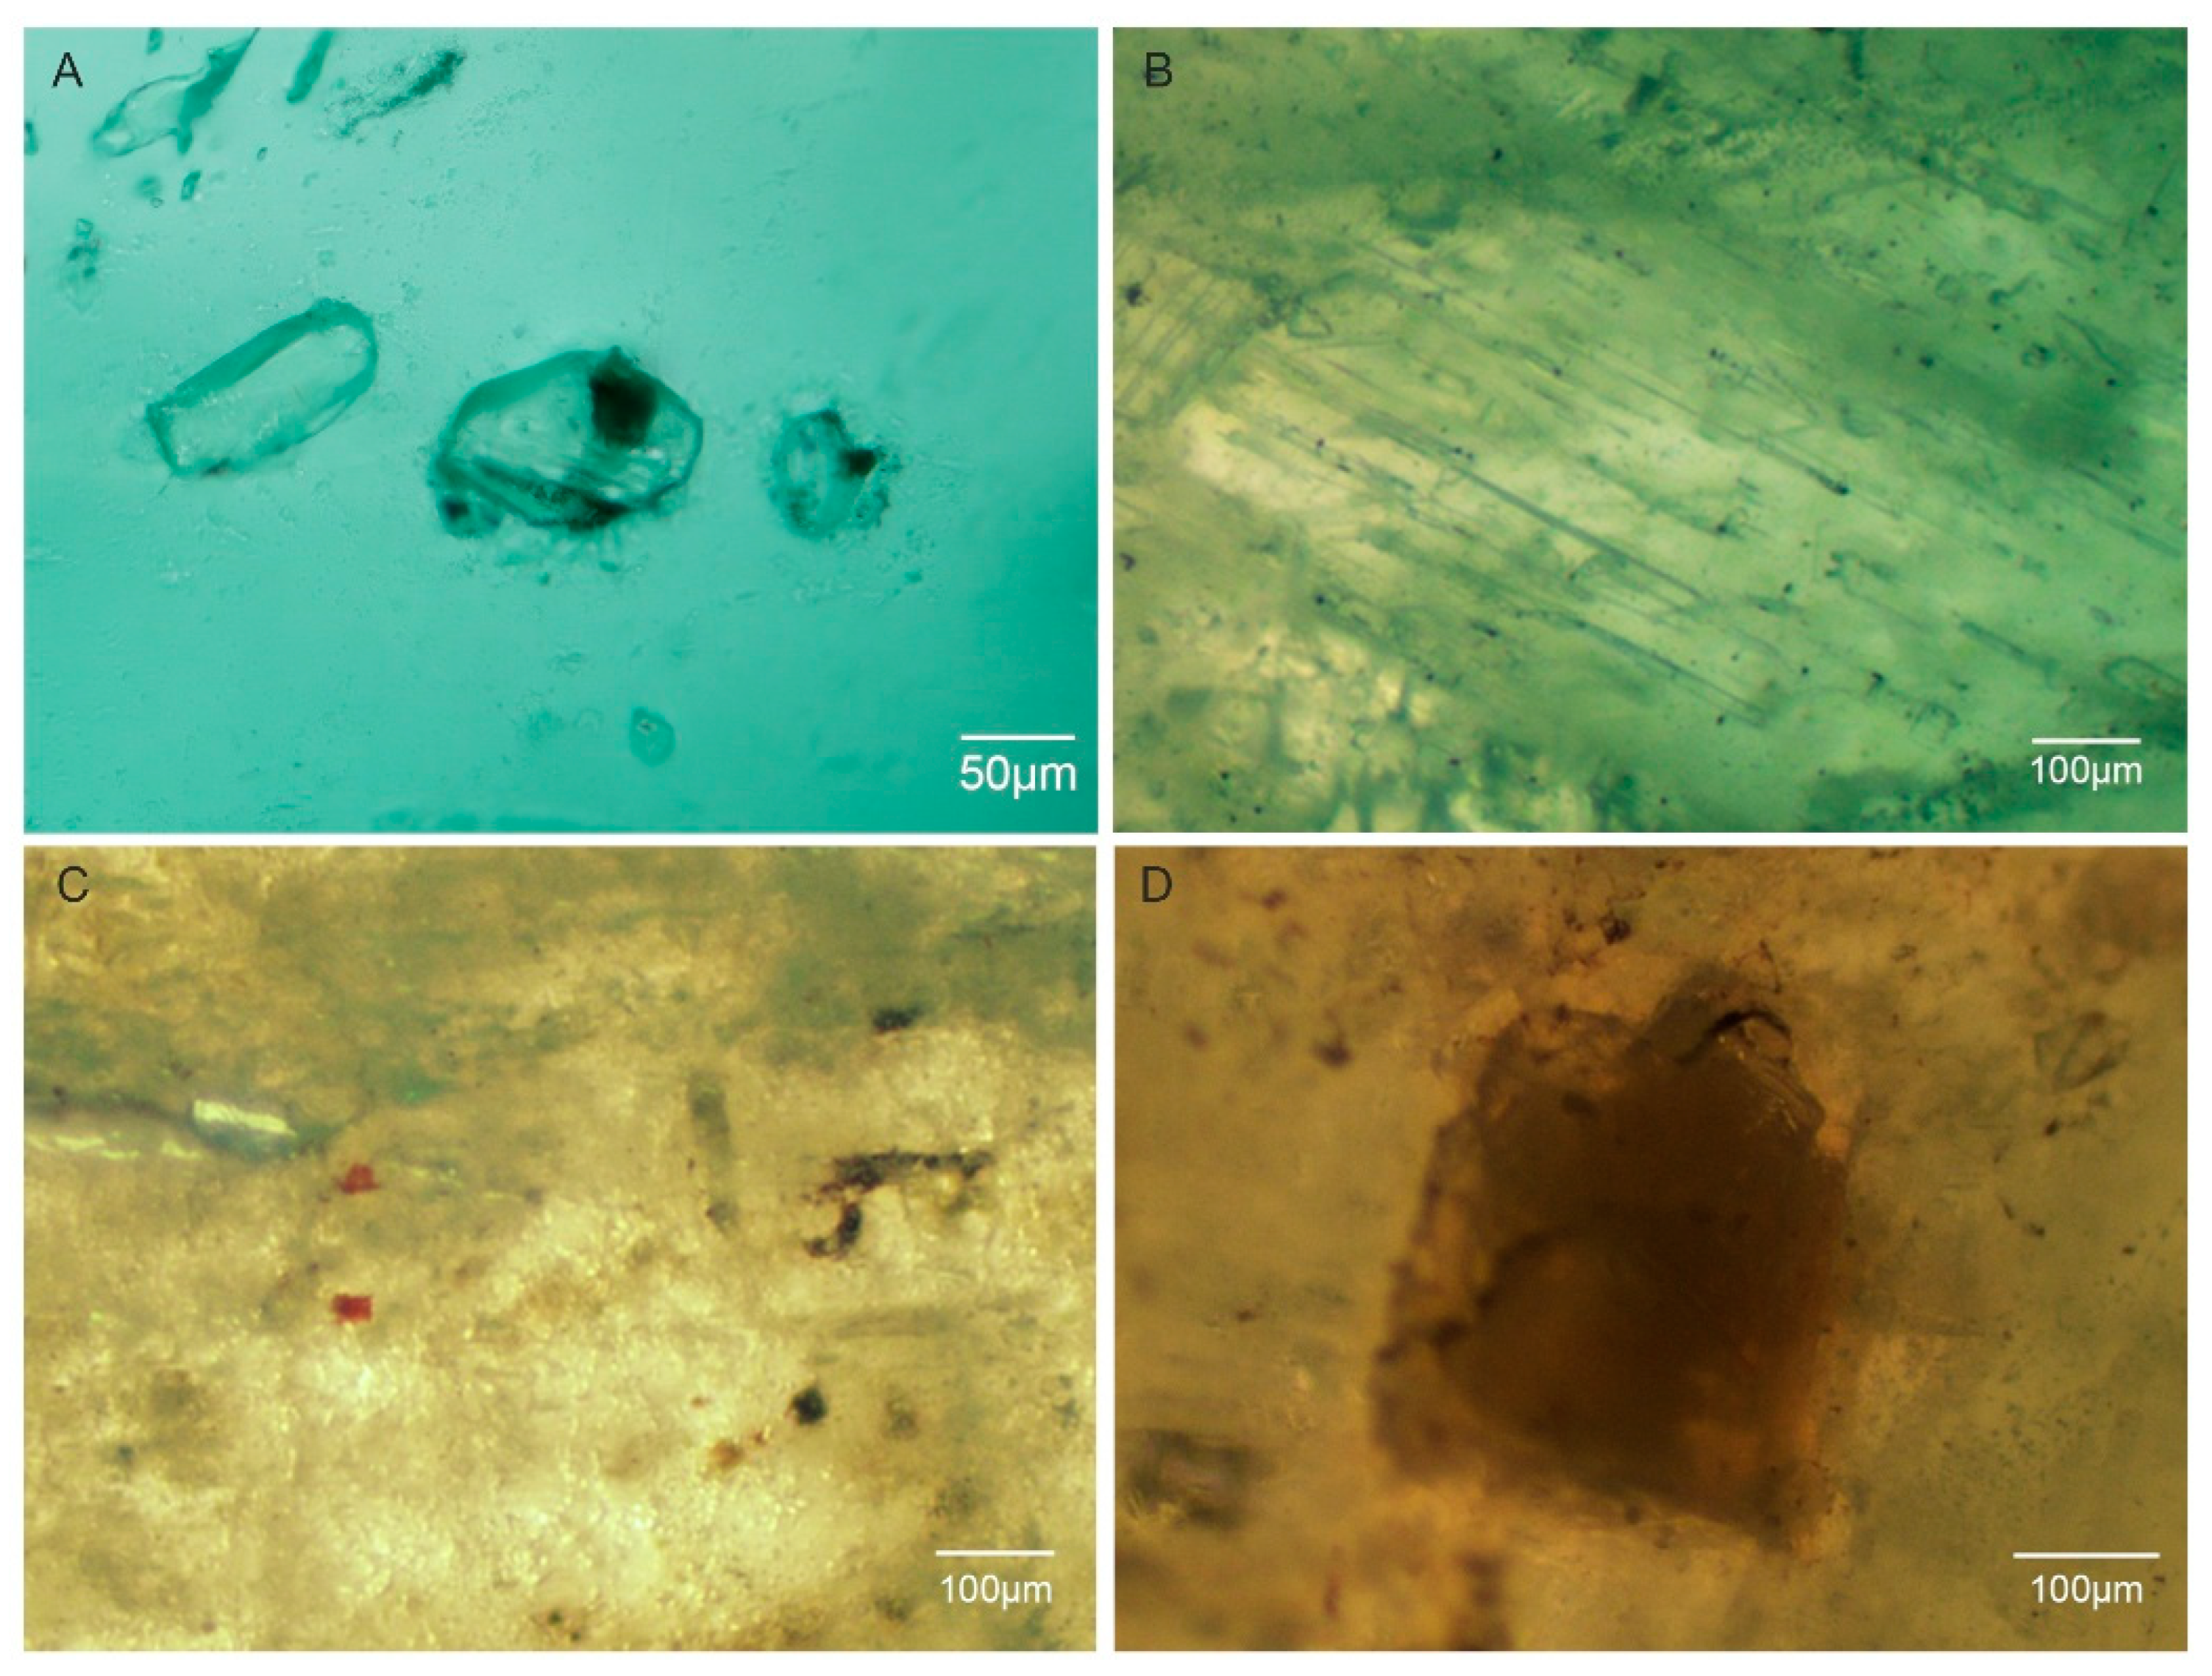
Sumbawanga emeralds contain abundant mineral inclusions, including numerous colorless, transparent minerals, yellowish-green chrysoberyl, elongated tabular transparent minerals and small black pinpoint inclusions (Figure 10). The colorless, transparent inclusions are usually made of quartz and apatite and measure about 50 μm. The elongated tabular minerals often exhibit parallel, densely packed arrangements, sometimes displaying a “bamboo-like” appearance, with widths around 10 μm. The fine black granular minerals are identified as hematite and magnetite, while brownish-red and brown platy minerals are hematite. Additionally, brown quadrangular columnar rutile inclusions measure approximately 200 μm in width.
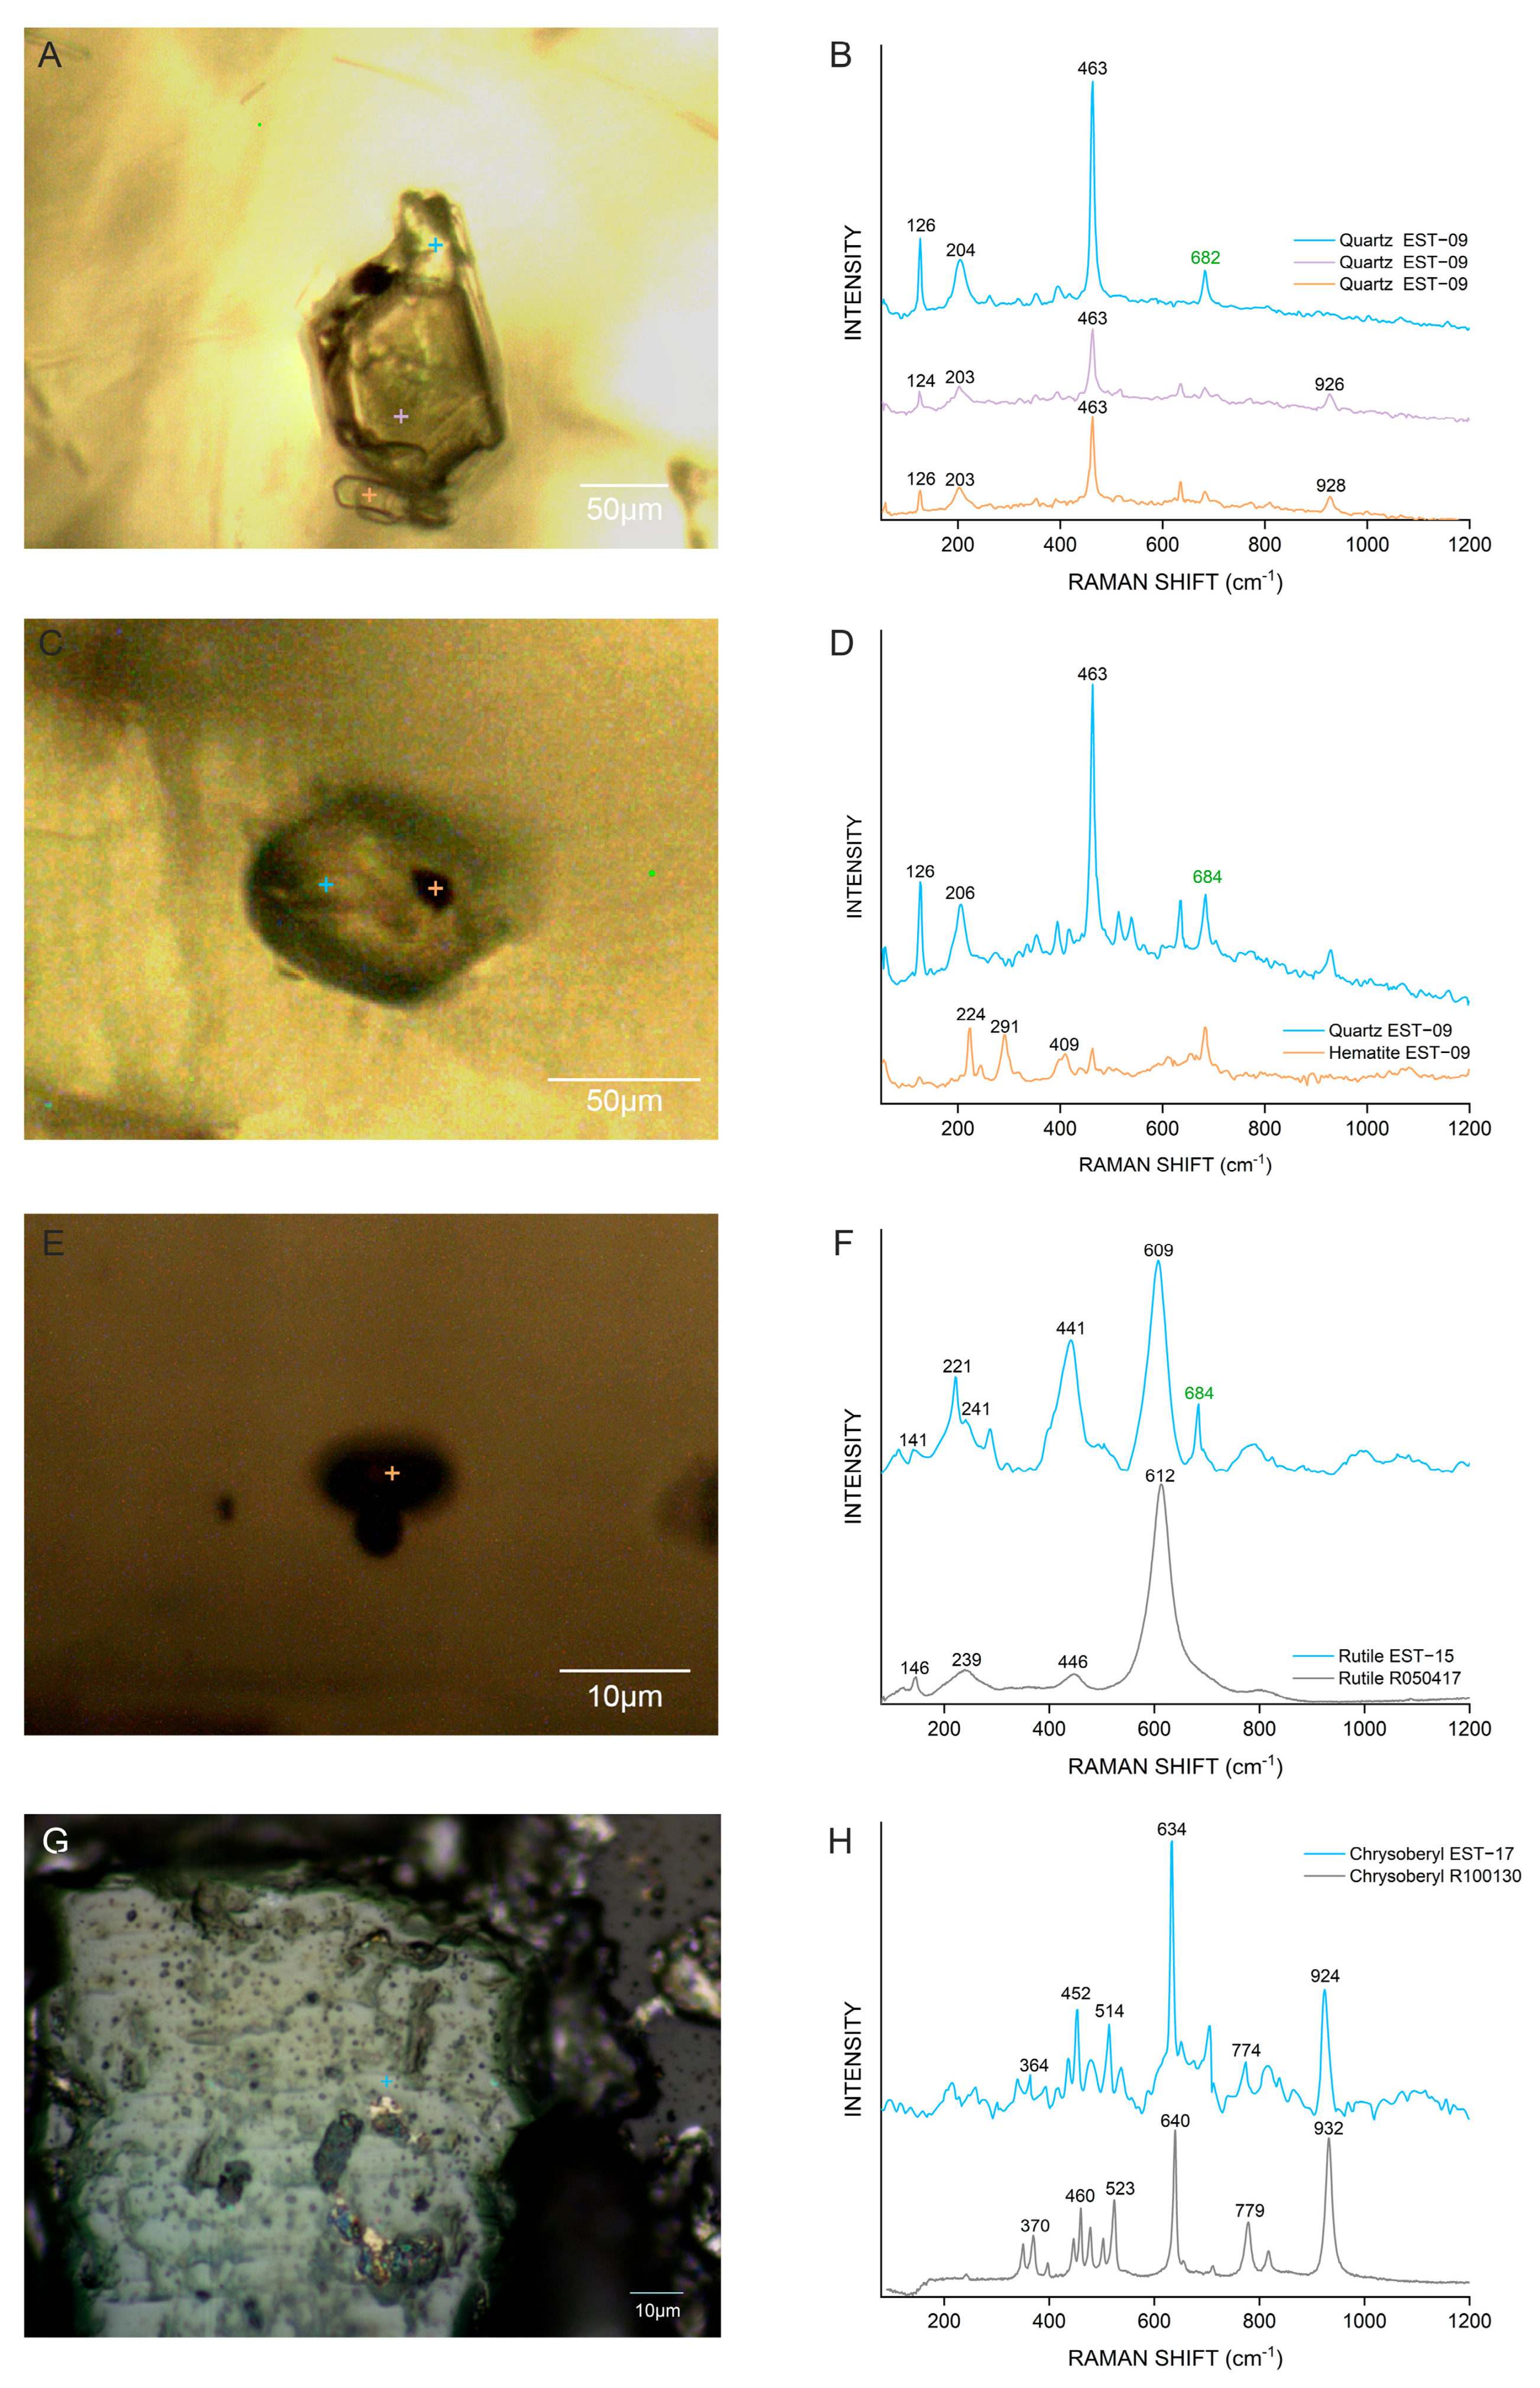
Quartz inclusions occur either individually or in clusters, exhibiting both prismatic and hexagonal platy morphologies (Figure 11A). These colorless minerals have been identified through Raman spectroscopy, displaying characteristic Raman shifts at 126, 204, and 463 cm−1 (Figure 11B). Some quartz inclusions contain brown hematite within them (Figure 11C). Hematite was identified by Raman with characteristic Raman shifts at 224, 291, and 409 cm−1 (Figure 11D). Rutile inclusions are predominantly brown and opaque, ranging in size from 5 to 200 μm, with Raman shifts at 441 and 609 cm−1 (Figure 10D and Figure 11E,F). Chrysoberyl inclusions typically exhibit a yellowish-green coloration and also have been identified through Raman spectroscopy, displaying characteristic Raman shifts at 364, 452, 514, 634, 774, and 924 cm−1 (Figure 11G,H).
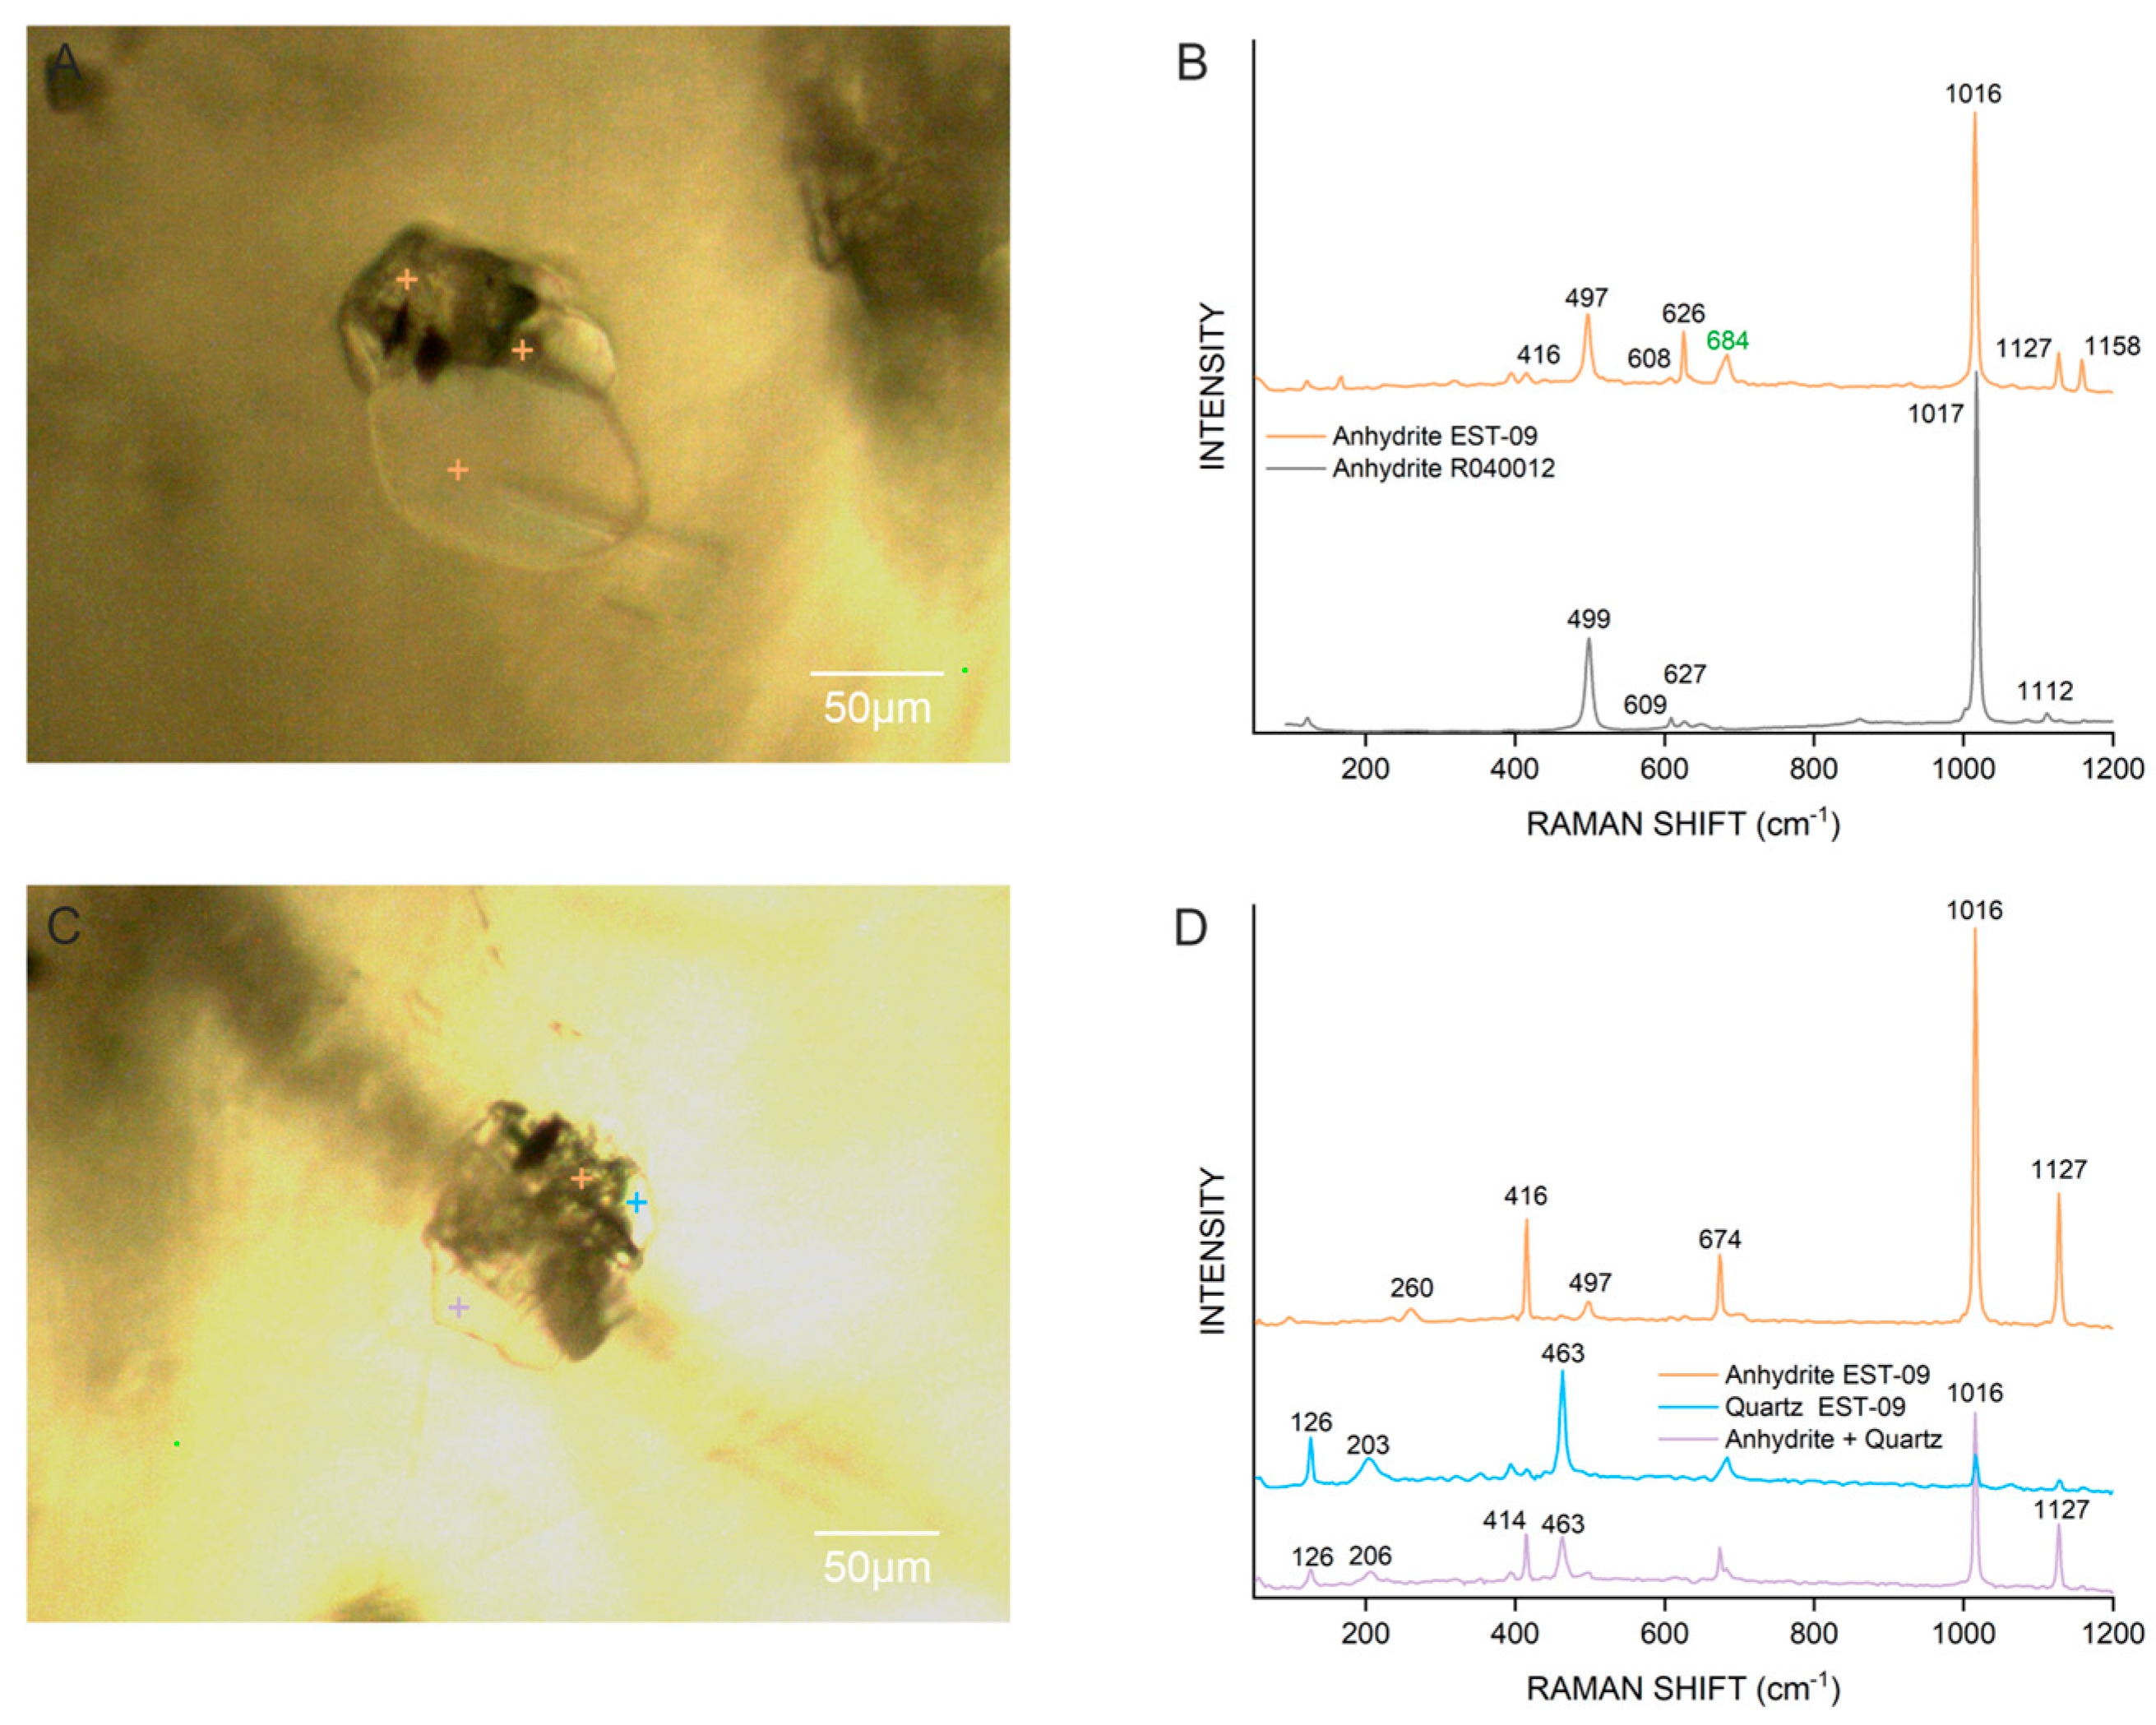
Furthermore, during Raman spectroscopic analysis, anhydrite inclusions were identified, exhibiting characteristic Raman peaks at 416, 497, 620, 1016, and 1127 cm−1 (Figure 12). These anhydrite inclusions are occasionally found coexisting with quartz (Figure 12C,D).
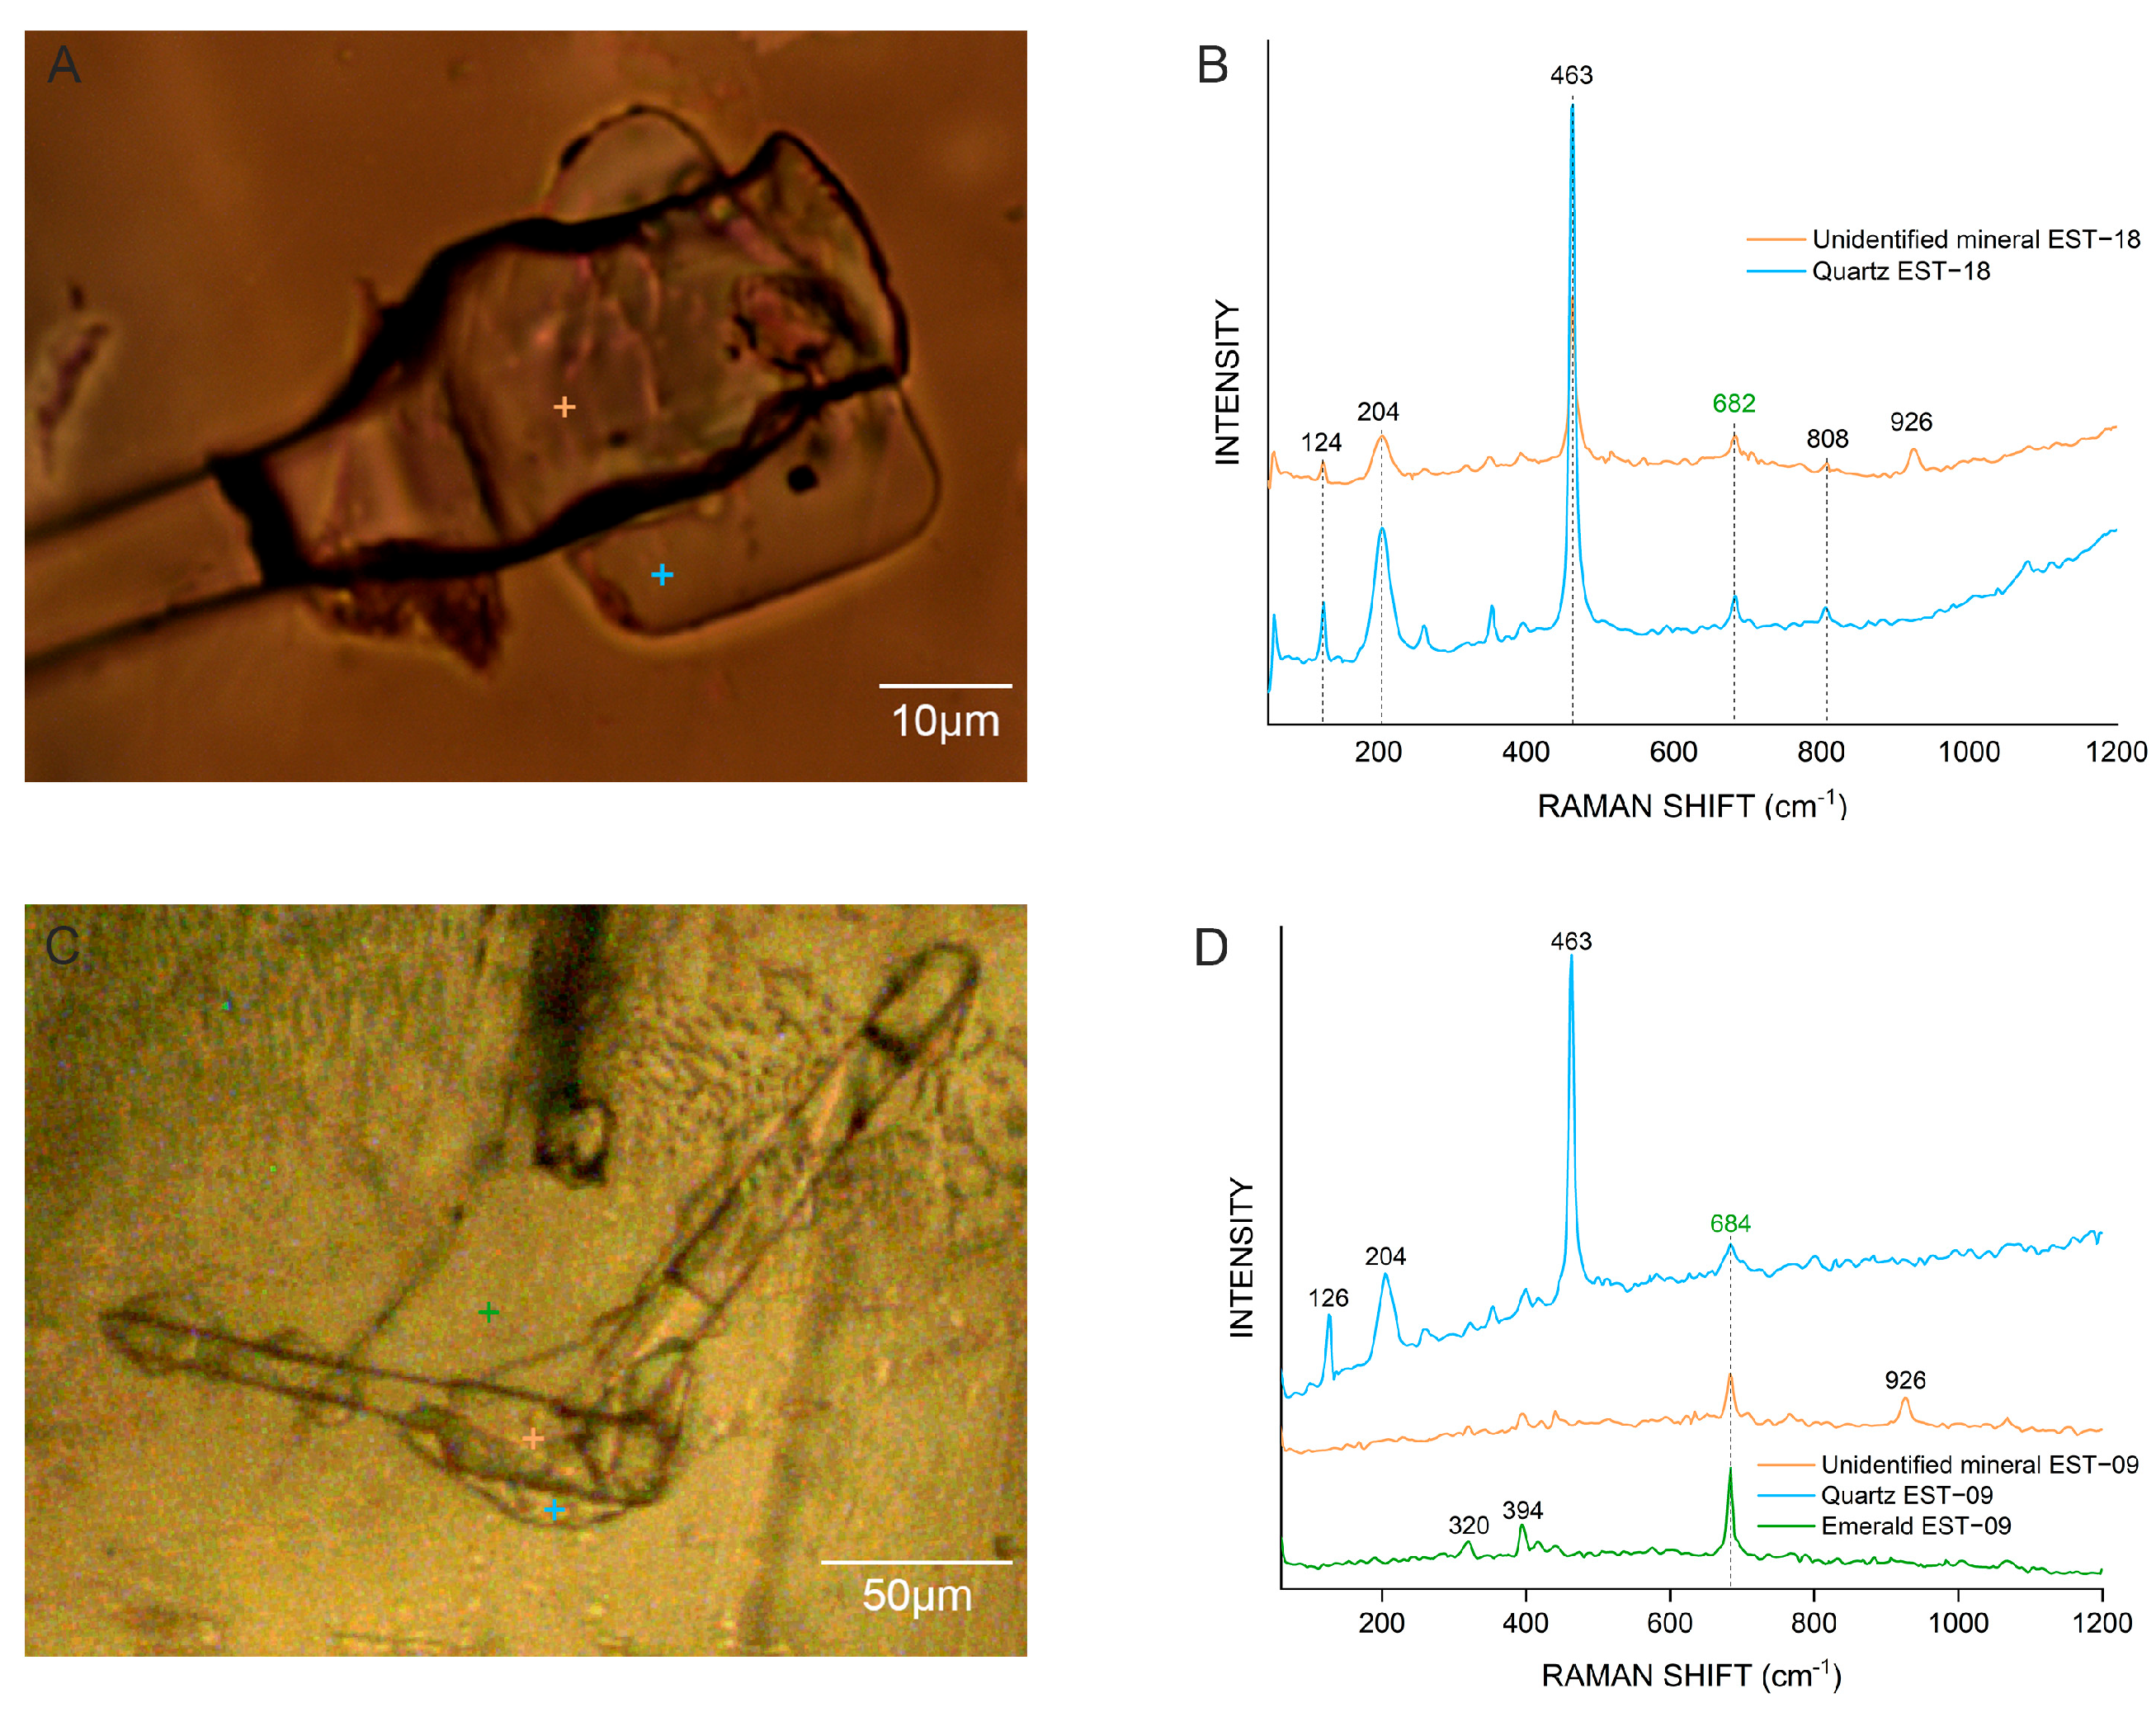
Aforementioned mineral inclusions have been identified through Raman spectroscopic analysis. Notably, the abundant elongated platy transparent mineral inclusions in Sumbawanga emeralds remain unidentified, as their Raman spectra only show consistency with either quartz or emerald (Figure 13). However, these spectra correspondence contradict the bamboo-like morphology of these inclusions. Therefore, further investigations using polarized light microscopy and EPMA are warranted.
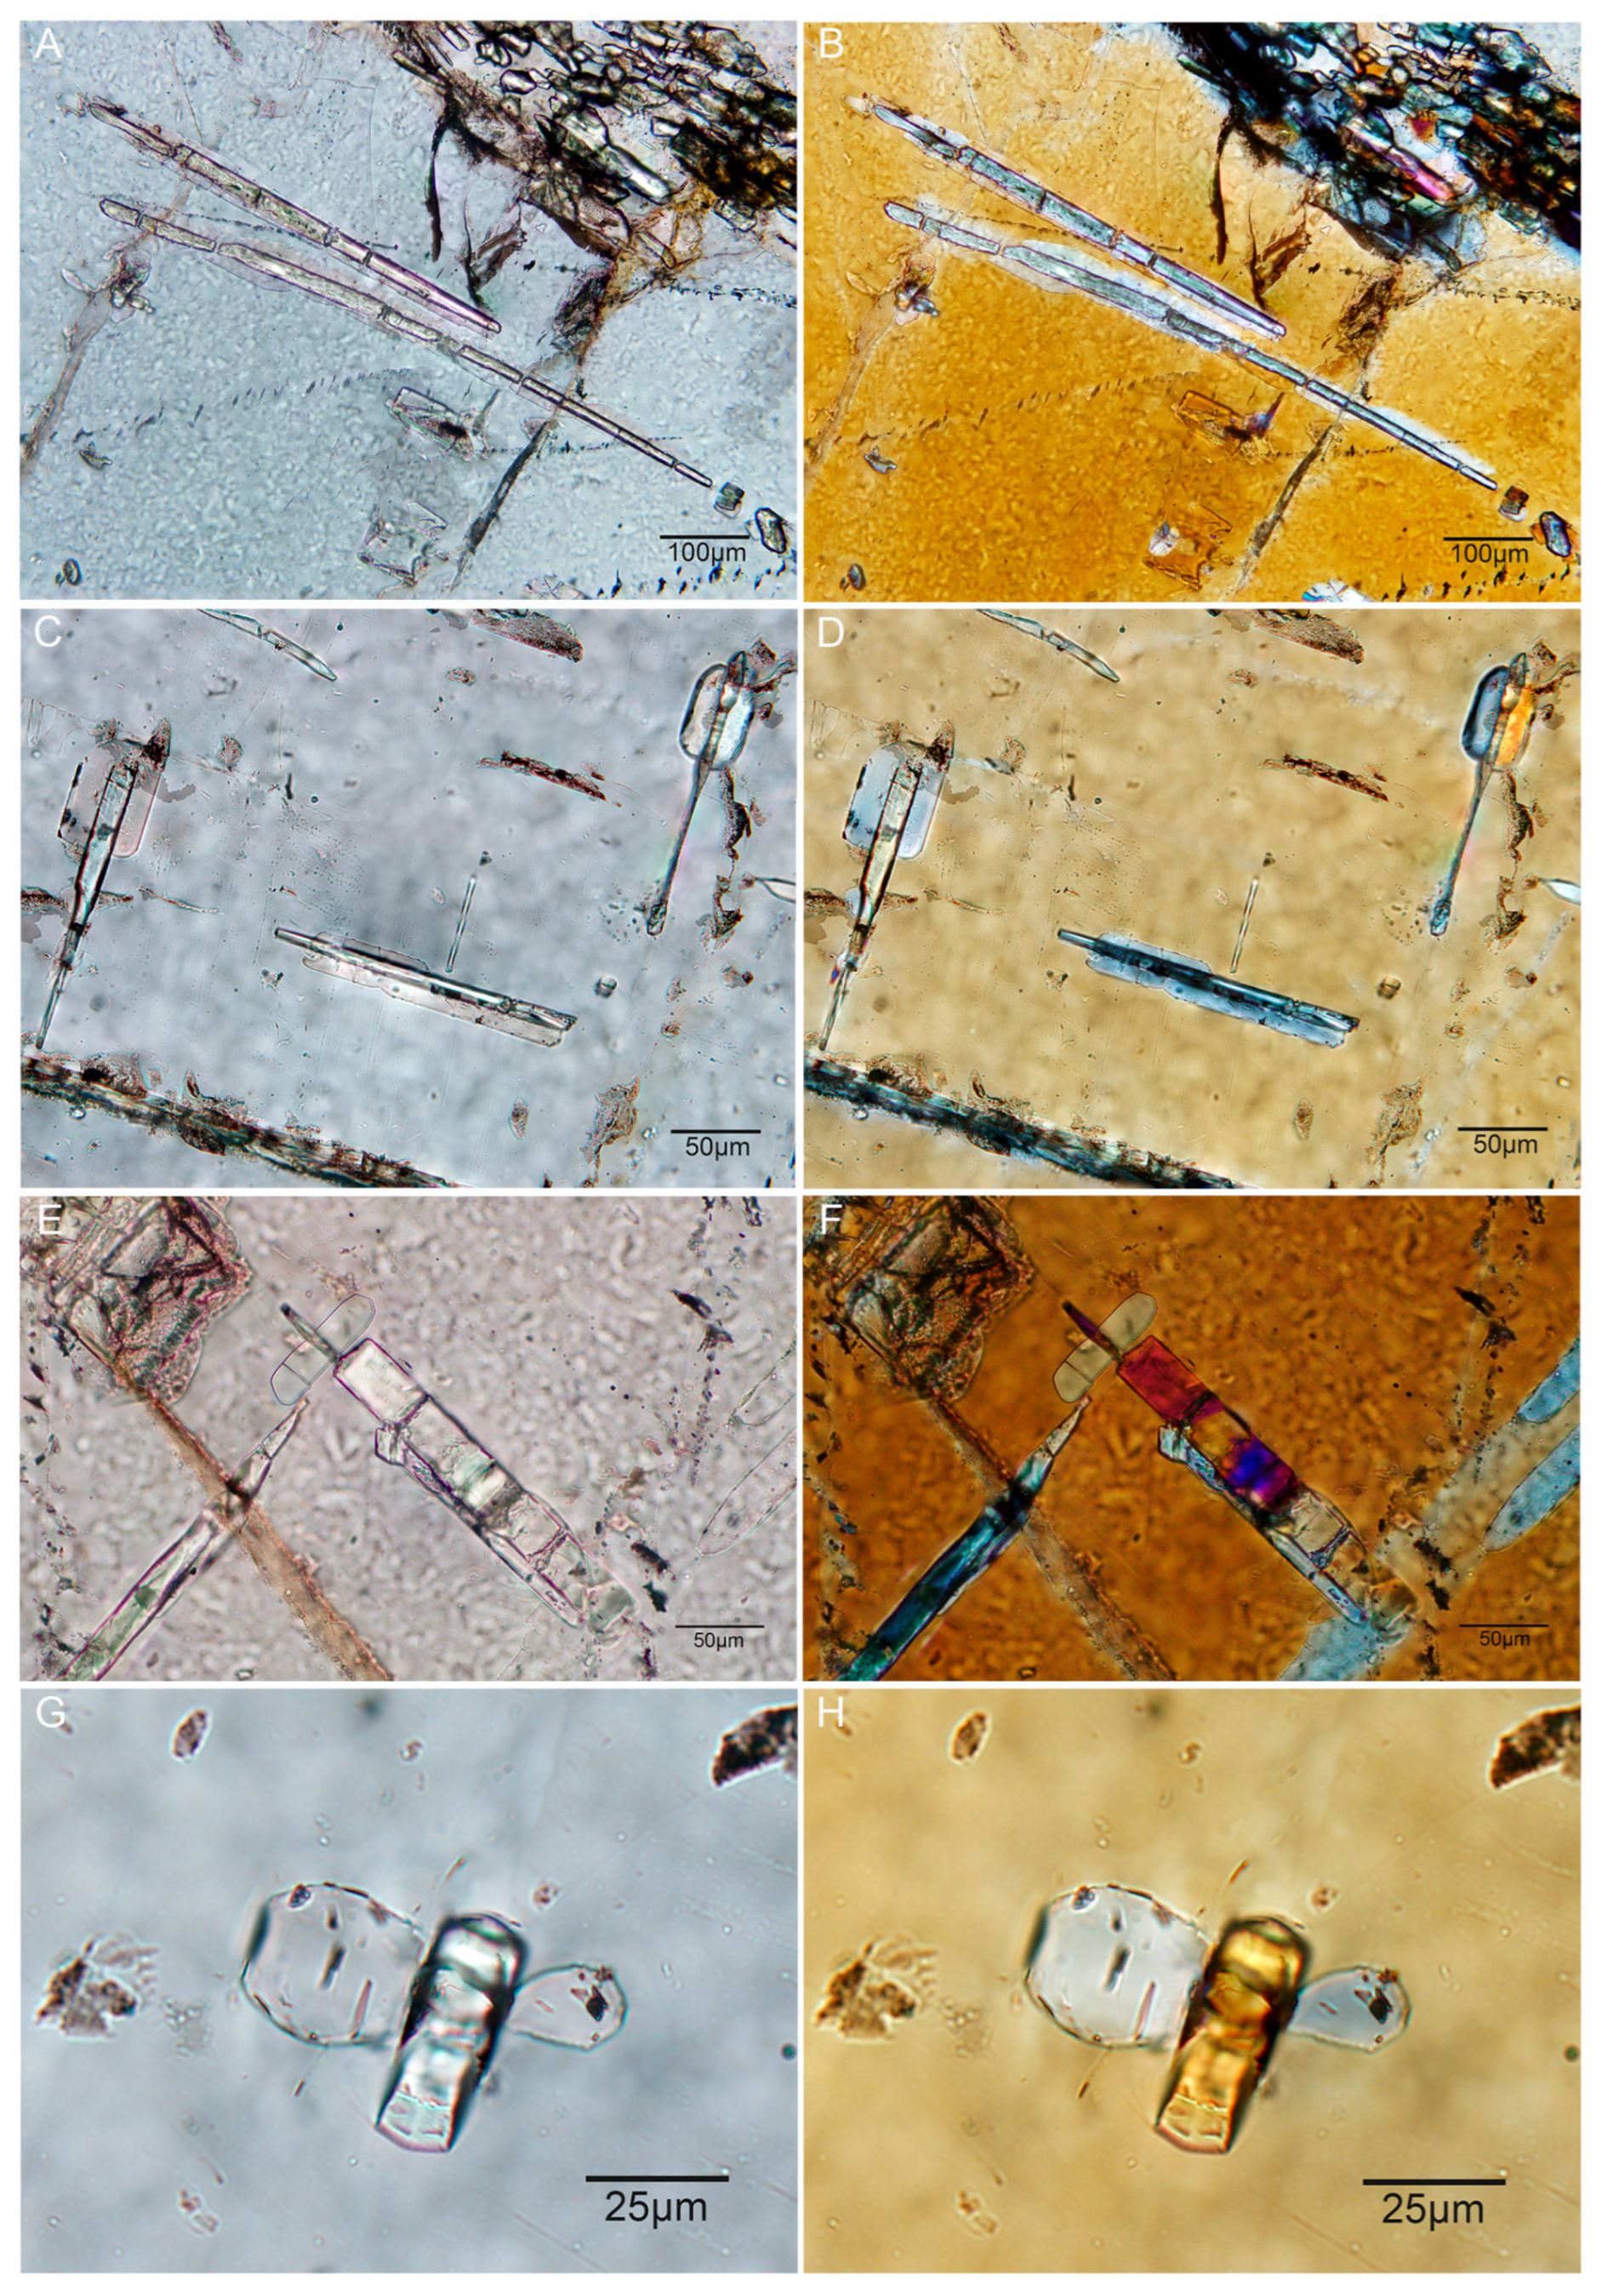
The slender platy inclusions consist of central light green columnar mineral segments and marginal colorless platy minerals (Figure 14).
The former exhibits positive high relief, distinct surface roughness, and birefringence colors reaching second-order yellow or purple, consistent with the optical characteristics of diaspore. The latter shows no cleavage and displays first-order gray-white to yellowish-white interference colors. Compositional analysis identified the former as quartz and the latter as diaspore. The analytical results for diaspore are presented in Table 2.
Additionally, well-developed chrysoberyl twin inclusions have been identified within the emeralds, including heart-shaped contact twins and radial wheel twins (Figure 15).

4.3. Spectral Characteristics

UV-Vis-NIR Spectroscopy

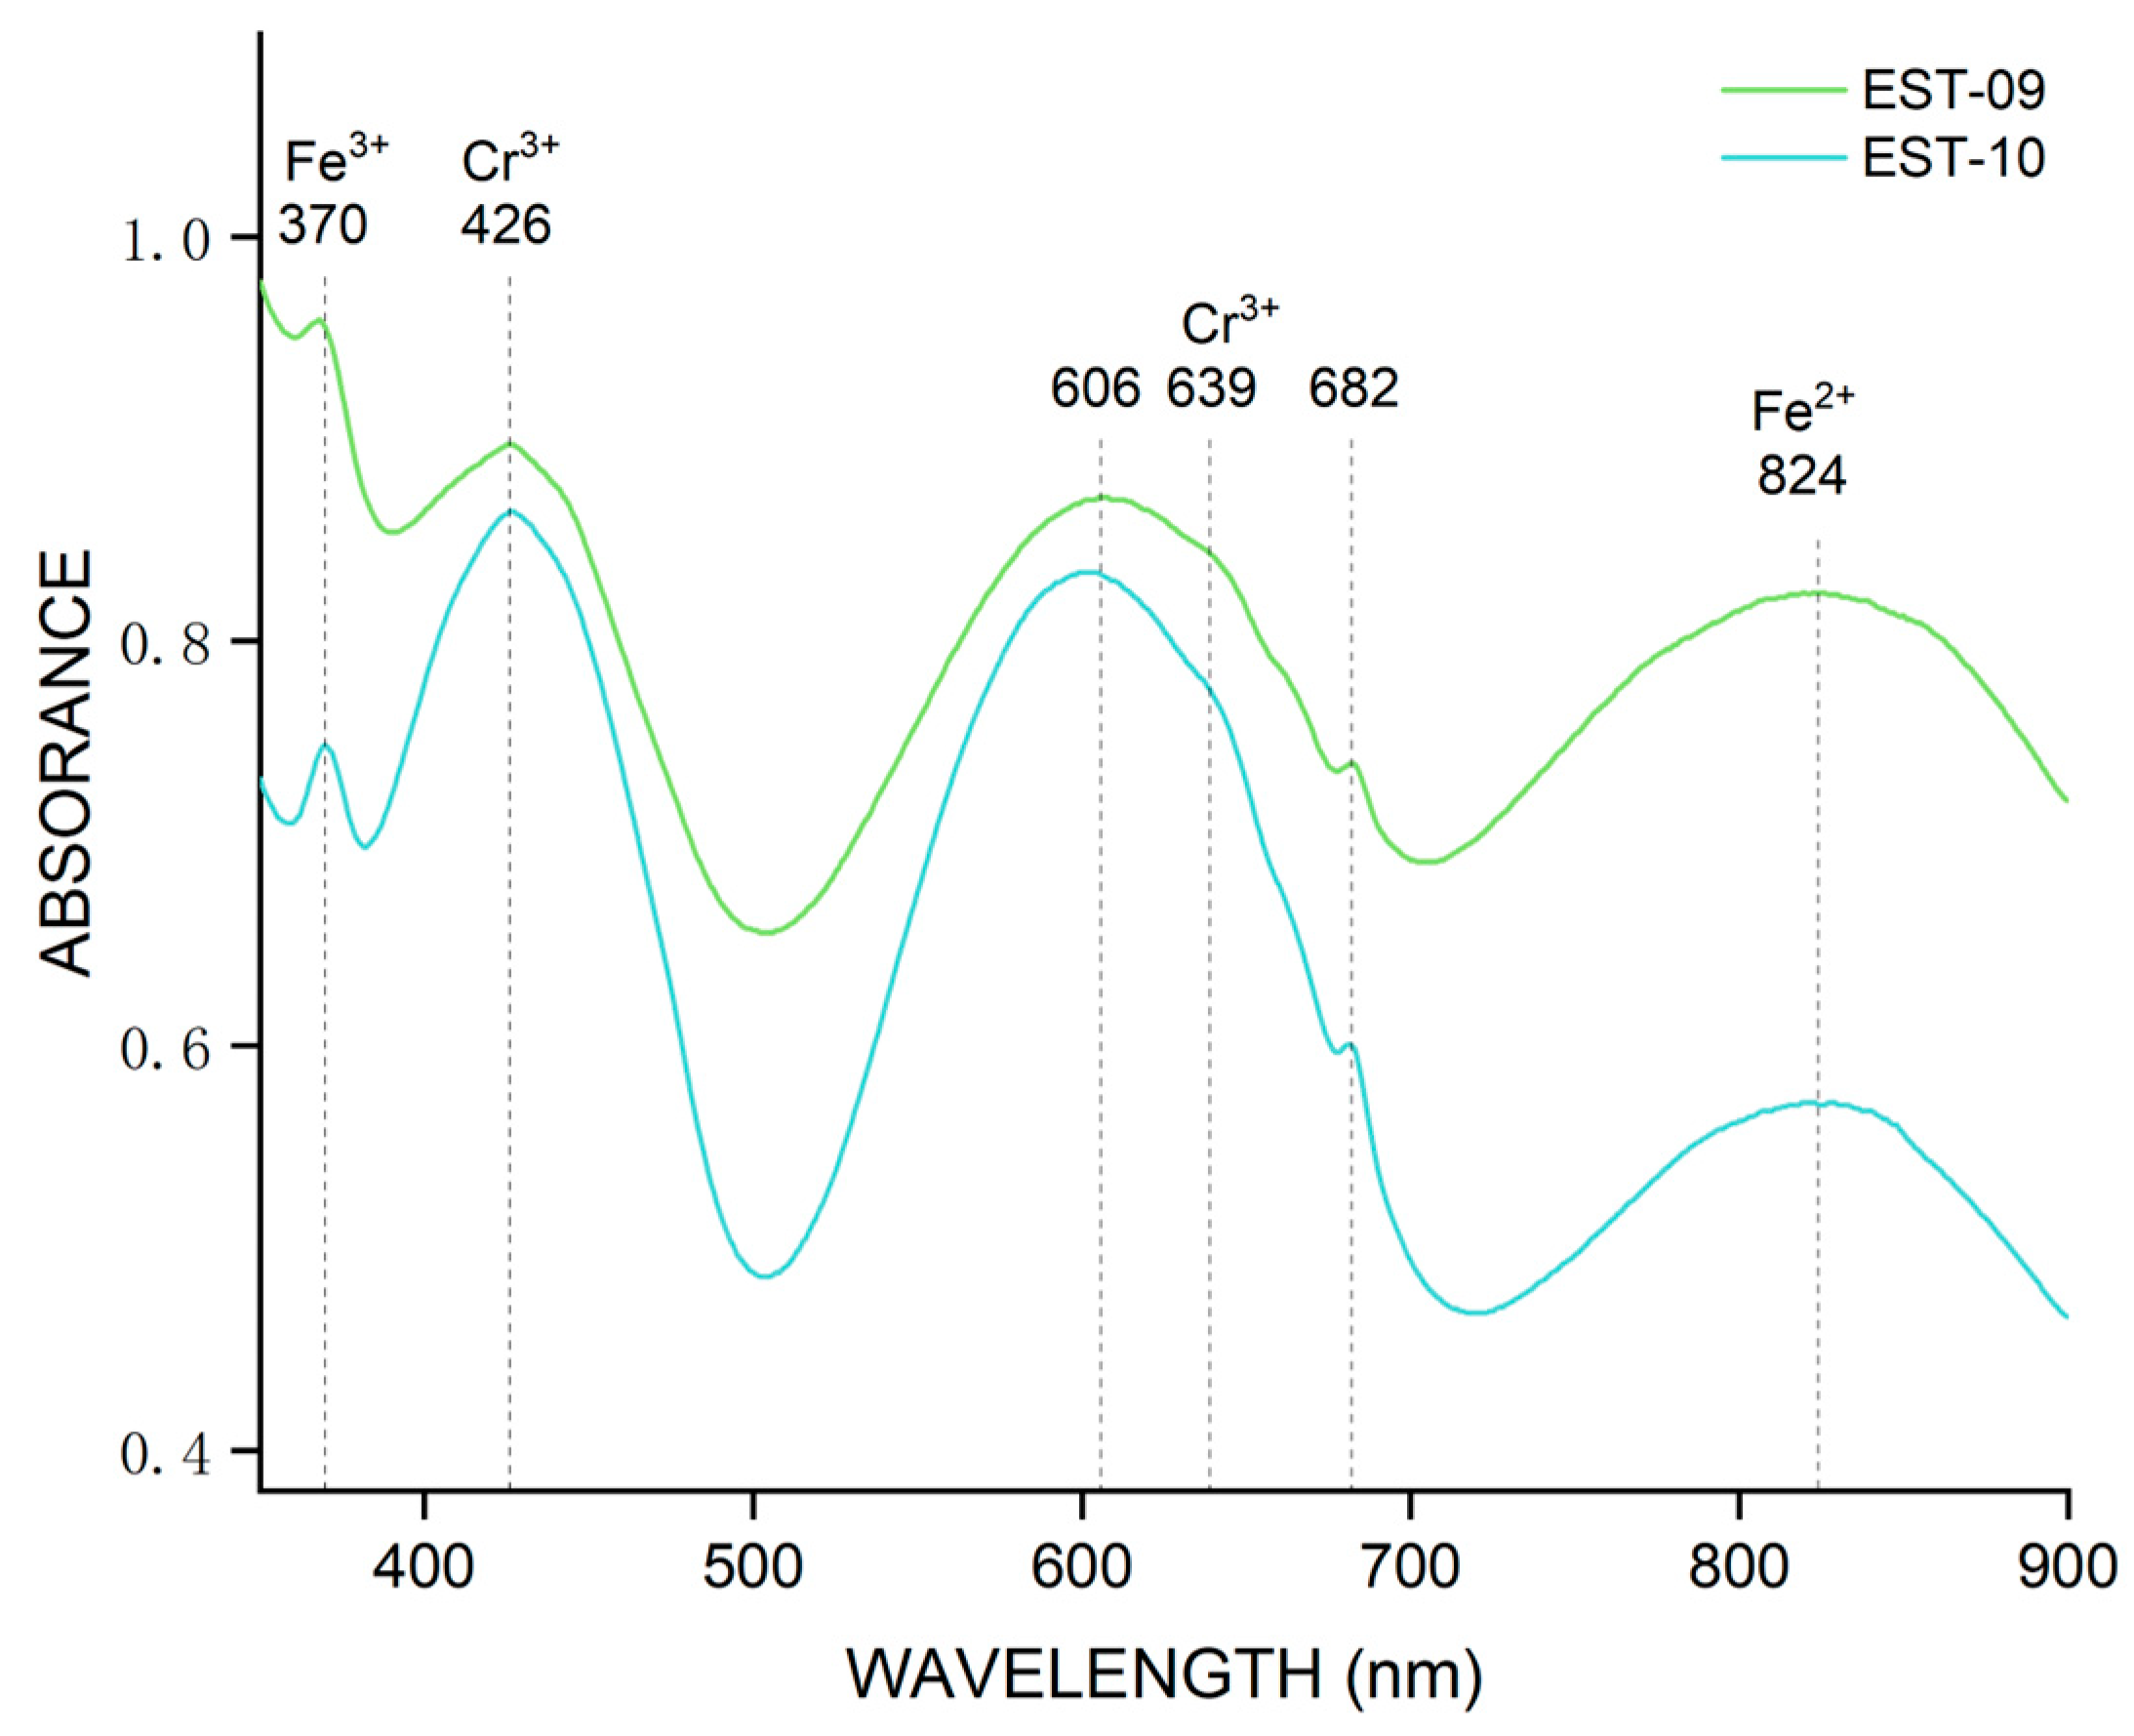
As a complement to gemological characteristics, UV-Vis-NIR spectroscopy is frequently employed to reflect the color mechanism of emeralds. After eliminating two samples with abundant associate minerals, the UV-Vis-NIR spectra of 13 emerald samples were collected, and they were quite similar to each other. The representative UV-Vis-NIR spectra of Sumbawanga emeralds (EST-09 and EST-10) are shown in Figure 16. There are four characteristic absorption bands: a sharp band at around 370 nm, a narrow band at 426 nm, and two broad bands at around 550–680 and 750–880 nm. Two absorption maxima at around 426 and 606 nm are assigned to the d-d electronic transition of Cr3+ [12,20]. The absorption maximum at around 835 nm is caused by the 5T24E electronic transition of Fe2+ at the octahedral Y-site, and the sharp peak at 370 nm is caused by the 6A14E(D) electronic transition of Fe3+ [12,21,22,23]. The bluish-green color of Tanzanian emeralds is jointly induced by Cr and Fe. Among them, Cr makes it present a green hue, while Fe gives it a bluish tone [2,6,12].

4.4. Chemical Composition Characteristics

Representative microprobe analyses of the investigated emerald are provided in Table 3, which are expressed in oxides and formula. Samples with distinct color bands (EST-5 and EST-9) were tested by selecting points in different color areas, respectively, while uniform samples were tested by randomly selecting points. The studied beryl is essentially composed of SiO2 (62.82–68.02 wt.%) and Al2O3 (16.25–18.23 wt.%). The BeO (12.1–14.76 wt%) content of the analyzed beryl was calculated based on the standard formula of beryl (Be3Al2Si6O18). The chemical formula of the samples can be obtained from the calculated atoms per formula units. Taking EST-1-1 as an example, its chemical formula is Be2.97(Al1.76Fe2+0.09Mg0.16Cr0.09)2.1Si5.86O17.71.

5. Discussion

5.1. The Unique Inclusion Assemblage in Sumbawanga Emeralds

Parallel, elongated platy mineral inclusions are commonly observed in Sumbawanga emeralds (Figure 10B). Although Raman spectroscopy only provided spectra consistent with emerald or host quartz inclusions, comprehensive analysis combining optical properties under polarized light microscopy and EPMA chemical composition testing confirms that these distinctive inclusions consist of central diaspore surrounded by marginal quartz [24]. Furthermore, gemological microscopy and Raman spectroscopic analysis also reveal that these inclusions are composed of two morphologically distinct mineral phases (Figure 13). Despite the current inability to obtain effective Raman spectra for diaspore, it is still possible to distinguish it from similar tubular fluid inclusions and fibrous amphibole inclusions through careful examination [1,9].
Overall, these diaspore inclusions are predominantly oriented parallel to the c-axis. However, a minor proportion of same mineral inclusions exhibit perpendicular orientations (Figure 14). This unique assemblage of mineral inclusions, along with their distinctive morphologies and distribution patterns, may serve as diagnostic features for the identification of Sumbawanga emeralds.

5.2. Updated Features of Sumbawanga Emeralds

Sumbawanga emeralds exhibit a green hue with a slight bluish tint, displaying the characteristic rounded pebble crystal morphologies typical of secondary deposit gemstones. The birefringence is relatively low, ranging from 0.006 to 0.007, which is consistent with the findings reported in 2012 [17]. Their surfaces often host associated minerals, including colorless, gray, and yellow quartz; pink apatite; brown to black mica; brown hematite; and black magnetite.
The fluid inclusions in Sumbawanga emeralds are mainly composed of CO2 and are often very small [7]. Mineral inclusions of quartz and mica are very common and in addition, there are also anhydrite and chrysoberyl [7,8]. These features were widely observed in the present study, in line with the findings of previous research.
Internal fluid inclusions in these emeralds are typically around 10 μm in size, exhibiting fingerprint-like patterns, with occasional gas–liquid inclusions containing circular bubbles, whose gas-phase consists primarily of CO2. Mineral inclusions within Sumbawanga emeralds are abundant and diverse, comprising colorless quartz, apatite, and anhydrite; yellowish-green chrysoberyl; red hematite; brown rutile; and black magnetite. Particularly noteworthy are the parallel-oriented diaspore inclusions surrounded by quartz. The inclusions of chrysoberyl include not only individual crystals but also distinctive twin crystals.
Furthermore, to investigate the coloration mechanism of sample EST-09, which exhibits distinct color banding, variations in the concentrations of iron, chromium, and vanadium were analyzed across regions with differing hues. As illustrated in Figure 17, the chromium content is significantly elevated in the more intensely green areas, whereas the iron content does not show a clear positive correlation with the intensity of green coloration. When interpreted in conjunction with the UV-Vis-NIR spectroscopy, these findings indicate that chromium is the primary chromophore responsible for the green color in emeralds, while iron may contribute to the bluish hue characteristic of Sumbawanga emeralds.

5.3. Identification of the Geograohic Originof Sumbawanga Emeralds

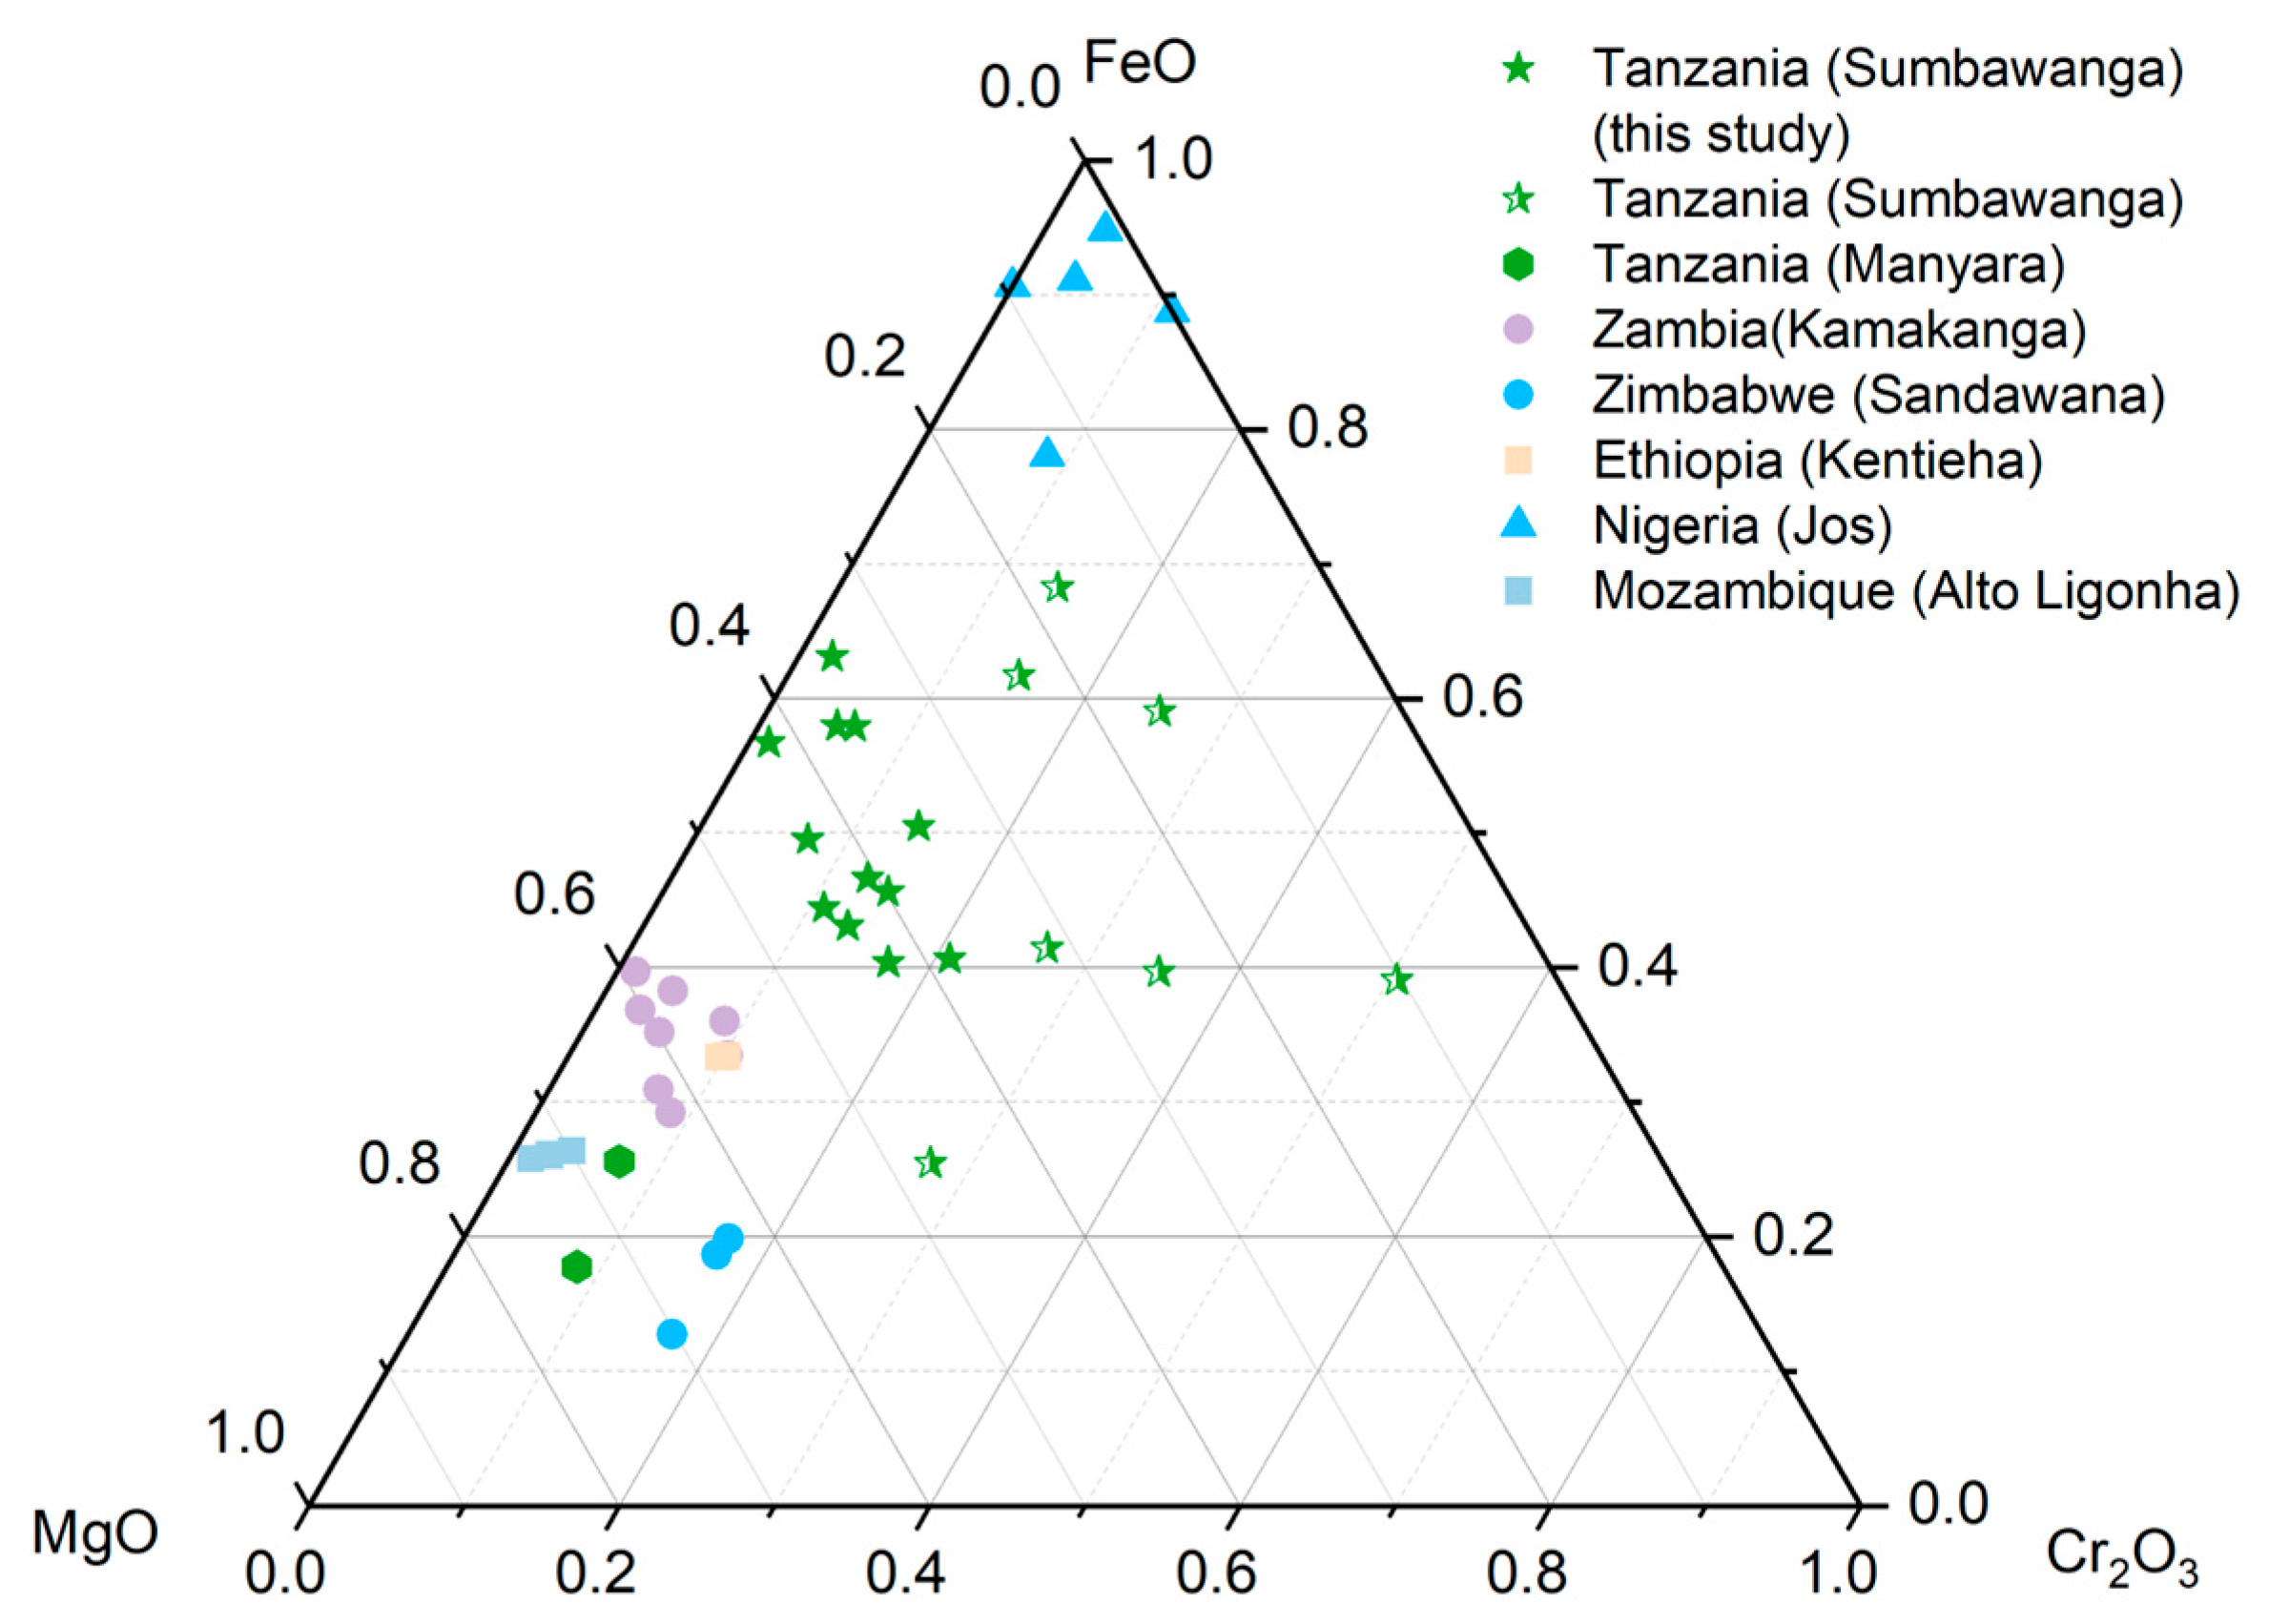
The main substituents for Al at octahedral site of emeralds are plotted as oxides in Figure 18. Mg and Fe are the main substituent in most African emeralds, as most of points is close to the FeO-MgO line. The data in this study are largely consistent with those reported in previous studies [8,14,16]. The plots of emeralds from Sumbawanga deposit in Tanzania are closer to the iron terminal than those from Manyara deposit, Kamakanga in Zambia, Sandawana in Zimbabwe, Kentieha in Ethiopia, and Alto Ligonha in Mozambique except for Jos in Nigeria, which can be used to distinguish between different African origins.
As a secondary deposit, the primary geological origin of Sumbawanga emeralds has not yet been definitively determined. The initial discovery of mineral inclusions—specifically diaspore and quartz—may provide insights into the formation environment of these emeralds. Emeralds are likely to form in the contact zone between beryllium-rich hydrothermal fluids and surrounding rocks containing bauxite minerals, such as diaspore [1,7,8,17]. Therefore, detailed investigation of local bauxite occurrences could play a crucial role in identifying primary emerald deposits.

6. Conclusions

The color parameters of Sumbawanga emeralds are as follows: L* ∈ (27.47, 50.43), a* ∈ (−18.40, −6.46), and b* ∈ (0.95, 6.79). Cr makes it green, while Fe gives it a bluish tone. The bluish-green Sumbawanga emeralds typically exhibit pebble-like morphologies and are associated with minerals such as quartz, phlogopite, biotite, hematite, magnetite, rutile, and apatite. These emeralds contain fingerprint-like fluid inclusions and an abundance of diverse mineral inclusions, including quartz, apatite, anhydrite, diaspore, hematite, magnetite, and rutile.
Chrysoberyl, quartz + anhydrite and quartz + diaspore constitute characteristic inclusion assemblages in Sumbawanga emeralds. The distinctive feature of Sumbawanga emeralds is the presence of two mutually perpendicular sets of elongated platy mineral inclusion assemblages of quartz and diaspore, which serve as characteristic diagnostic features.
Comprehensive inclusion and chemical composition analyses can be utilized for the determination of the geographic origin of African emeralds.

Author Contributions

Software, formal analysis, data curation, writing—original draft preparation, visualization, Y.G.; conceptualization, X.-Y.Y.; methodology, Y.G., C.-X.L. and X.-Y.Y.; validation, Y.G., X.-Y.Y. and C.-X.L.; investigation, Y.G. and C.-X.L.; resources, X.-Y.Y.; writing—review and editing, X.-Y.Y. and Y.G.; project administration, X.-Y.Y.; funding acquisition, X.-Y.Y. All authors have read and agreed to the published version of the manuscript.

Funding

This research was supported by the National Natural Science Foundation of China Project “Enrichment processes and mechanism of strategic key metals such as platinum group, cobalt and chromium in Jinchuan magmatic Cu-Ni (PGE) sulfide deposit in Gansu” (grant number 27812022003).

Data Availability Statement

The original contributions presented in this study are included in the article. Further inquiries can be directed to the corresponding author.

Acknowledgments

The authors would like to express their gratitude to Zhen-Yu Chen and Ye Yuan for their guidance and assistance in the experimental work. We appreciate Yu Yuan for the support and contribution in data visualization. We sincerely thank every reviewer for useful comments and suggestions.

Conflicts of Interest

The authors declare no conflicts of interest.

Abbreviations

The following abbreviations are used in this manuscript:
UV-Vis-NIRUltraviolet–Visible–Near-Infrared
EPMAElectron Probe Microanalysis
CrChromium
VVanadium
NW-SENorthwest–Southeast

References

  1. Saeseaw, S.; Pardieu, V.; Sangsawong, S. Three-Phase Inclusions in Emerald and Their Impact on Origin Determination. Gems Gemol. 2014, 50, 114–132. [Google Scholar] [CrossRef]
  2. Guo, H.; Yu, X.; Zheng, Y.; Sun, Z.; Ng, M.F.-Y. Inclusion and Trace Element Characteristics of Emeralds from Swat Valley, Pakistan. Gems Gemol. 2020, 56, 336–355. [Google Scholar] [CrossRef]
  3. Groat, L.A.; Giuliani, G.; Stone-Sundberg, J.; Sun, Z.; Renfro, N.D.; Palke, A.C. A Review of Analytical Met-Hods Used in Geographic Origin Determination of Gemstones. Gems Gemol. 2019, 55, 512–535. [Google Scholar] [CrossRef]
  4. Zheng, Y.-Y.; Yu, X.-Y.; Xu, B.; Gao, Y.-J. Characterizing Malysheva Emeralds (Urals, Russia) by Microscopy, Spectroscopy, Trace Element Chemistry, and Machine Learning. Crystals 2024, 14, 683. [Google Scholar] [CrossRef]
  5. Zhang, Y.; Yu, X.Y. Inclusions and Gemological Characteristics of Emeralds from Kamakanga, Zambia. Minerals 2023, 13, 341. [Google Scholar] [CrossRef]
  6. Zhang, Y.; Yu, X.Y. Spectroscopy and Trace-Element Characteristics of Emeralds from Kamakanga, Zambia. Crystals 2023, 13, 1605. [Google Scholar] [CrossRef]
  7. Moroz, I.; Eliezri, I. Mineral inclusions in emeralds from different sources. J. Gemmol. 1999, 26, 357–363. [Google Scholar] [CrossRef]
  8. Moroz, I.; Vapnik, Y.; Eliezri, I.; Roth, M. Mineral and fluid inclusion study of emeralds from the Lake Manyara and Sumbawanga deposits, Tanzania. J. Afr. Earth Sci. 2001, 33, 377–390. [Google Scholar] [CrossRef]
  9. Zwaan, J.C. Gemmology, geology and origin of the Sandawana emerald deposits, Zimbabwe. Scr. Geol. 2006, 131, 1–212. [Google Scholar]
  10. Huang, Z.X.; Li, G.; Weng, L.Q.; Zhang, M.L. Gemological and Mineralogical Characteristics of Emerald from Ethiopia. Crystals 2023, 13, 233. [Google Scholar] [CrossRef]
  11. Pardieu, V.; Sangsawong, S.; Cornuz, L.; Raynaud, V.; Luetrakulprawat, S. Update on Emeralds from the Mananjary-Irondro Area, Madagascar. J. Gemmol. 2020, 37, 416–425. [Google Scholar] [CrossRef]
  12. Saeseaw, S.; Renfro, N.D.; Palke, A.C.; Sun, Z.Y.; McClure, S.F. Geographic Origin Determination of Emerald. Gems Gemol. 2019, 55, 614–646. [Google Scholar] [CrossRef]
  13. Dirlam, D.M.; Misiorowski, E.B.; Tozer, R.; Stark, K.B.; Bassett, A.M. Gem Wealth of Tanzania. Gems Gemol. 1992, 28, 80–102. [Google Scholar] [CrossRef]
  14. Gavrilenko, E.V.; Pérez, B.C.; Bolibar, R.C.; del Amo, D.G. Emeralds from the Delbegetey deposit (Kazakhstan): Mineralogical characteristics and fluid-inclusion study. Miner. Mag. 2006, 70, 159–173. [Google Scholar] [CrossRef]
  15. Groat, L.A.; Giuliani, G.; Marshall, D.D.; Turner, D. Emerald deposits and occurrences: A review. Ore Geol. Rev. 2008, 34, 87–112. [Google Scholar] [CrossRef]
  16. Aurisicchio, C.; Conte, A.M.; Medeghini, L.; Ottolini, L.; De Vito, C. Major and trace element geochemistry of emer-ald from several deposits: Implications for genetic models and classification schemes. Ore Geol. Rev. 2018, 94, 351–366. [Google Scholar] [CrossRef]
  17. Cevallos, P.; Simmons, W.B.; Falster, A.U. Emerald from Sumbawanga, Tanzania. Gems Gemol. 2012, 48, 220–221. [Google Scholar]
  18. Dunn, S.C.; von der Heyden, B.P.; Steele-MacInnis, M.; Kramers, J.D.; St Pierre, B.; Erasmus, R.; Harris, C. Neoproterozoic copper-gold mineralization in the Amani area, southwestern Tanzania. Ore Geol. Rev. 2021, 132, 104070. [Google Scholar] [CrossRef]
  19. Sun, Z.Y.; Palke, A.C.; Renfro, N. Vanadium- and Chromium-Bearing Pink Pyrope Garnet: Characterization and Quantitative Colorimetric Analysis. Gems Gemol. 2015, 51, 348–369. [Google Scholar] [CrossRef]
  20. Shao, H.J.; Qi, L.J.; Zhong, Q.; Zhou, Y. Study on Characteristics of Iron-rich Hydrothermal Synthetic Emerald from Russia. J. Gems Gemmol. 2014, 16, 26–34. [Google Scholar] [CrossRef]
  21. Wood, D.; Nassau, K. The characterization of beryl and emerald by visible and infrared absorption spectroscopy. Am. Min. 1968, 53, 777–800. [Google Scholar]
  22. de Araujo Neto, J.F.; Barreto, S.d.B.; Carrino, T.A.; Muller, A.; Montefalco de Lira Santos, L.C. Mineralogical and gemological characterization of emerald crystals from Parana deposit, NE Brazil: A study of mineral chemistry, absorption and reflectance spectroscopy and thermal analysis. Braz. J. Geol. 2019, 49, e20190014. [Google Scholar] [CrossRef]
  23. Yang, Y.L.; Shen, X.T.; Fan, Y.R.; Huang, W.Z.; Pei, J.C. UV-Vis-NIR Spectroscopic Characteristics of Vanadium-Rich Hydrothermal Synthetic Emeralds from Russia. Spectrosc. Spectr. Anal. 2022, 42, 1199–1203. [Google Scholar]
  24. Liu, X.W.; Hu, Y.H.; Xu, Z.H. Effect of chemical composition on electrokinetics of diaspore. J. Colloid. Interf. Sci. 2003, 267, 211–216. [Google Scholar] [CrossRef]
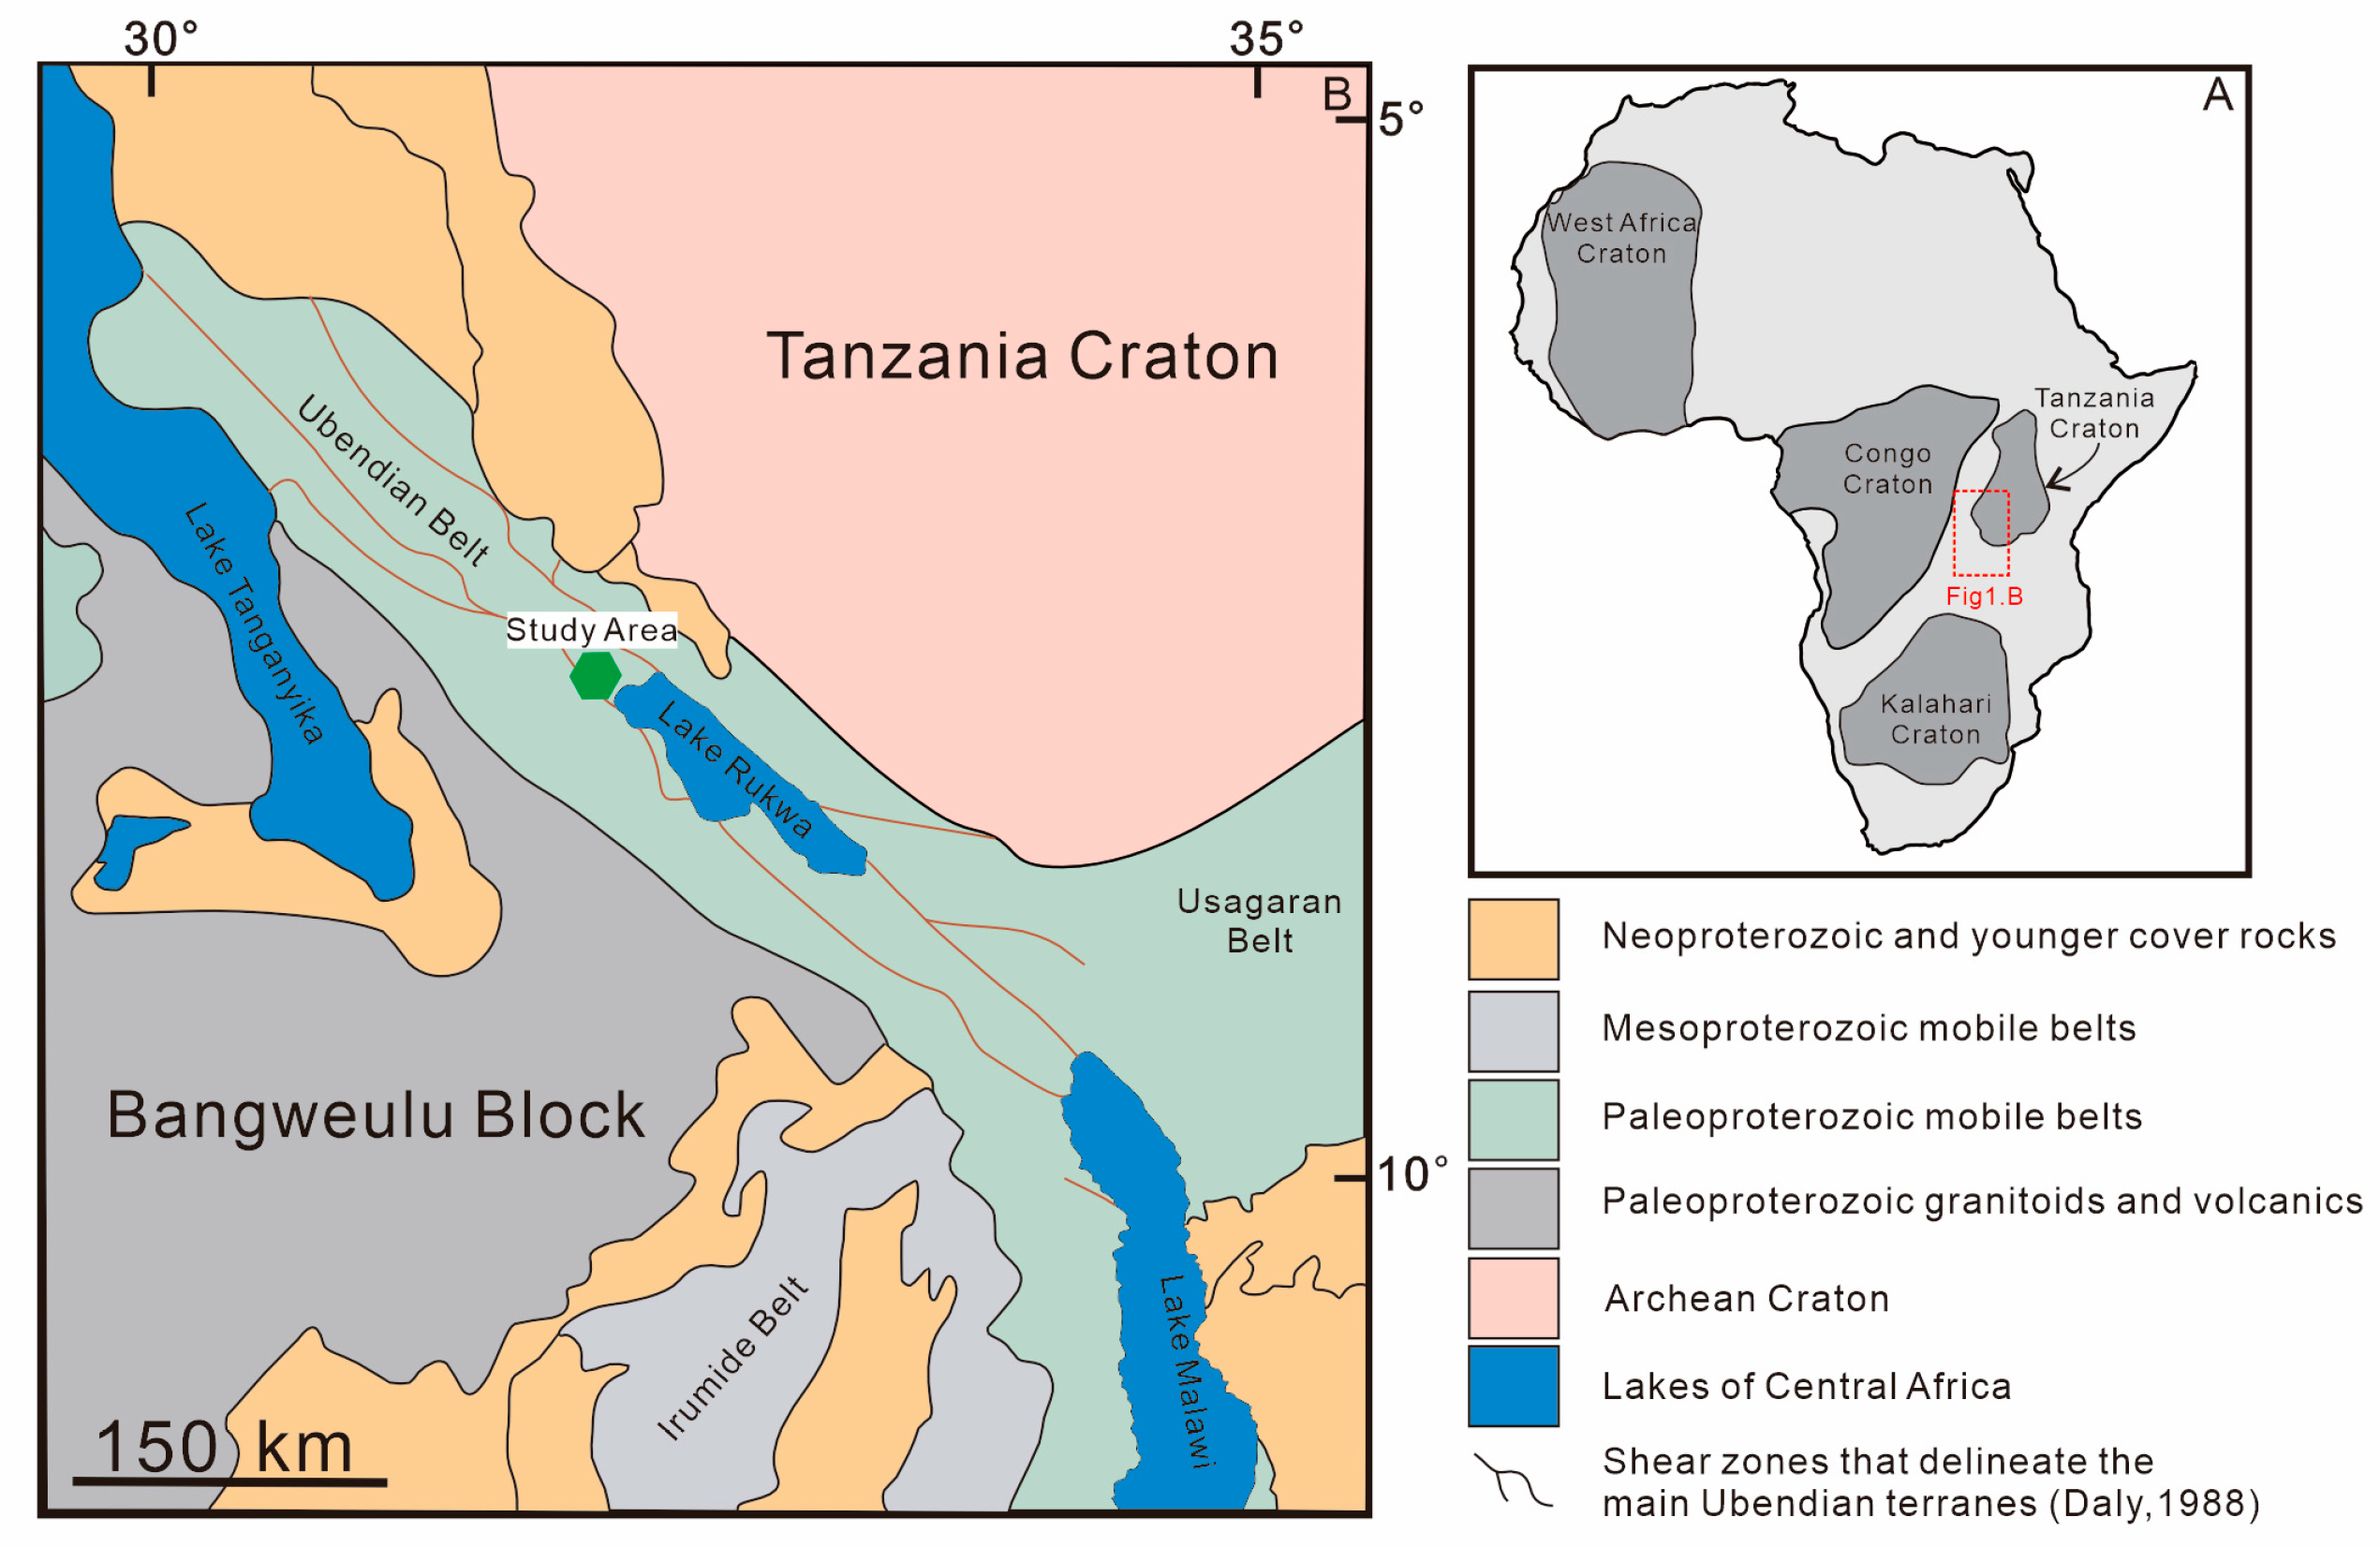
Figure 1. Outline map of the geological framework for central-east Africa and the Ubendian Belt. The Sumbawanga emeralds mining area is indicated by the green hexagon. Modified from [8,13,18]. Reproduced with permission from Stephan C. Dunn et al., Ore Geology Riviews; published by Elsevier, 2021.
Minerals 15 01240 g001
Figure 2. The fifteen emerald samples studied (EST-01 to EST-15).
Minerals 15 01240 g002
Figure 3. Color distribution of emerald samples in the CIELAB space. Modified after [5,19]. Reproduced with permission from Ziyin Sun et al., Gems & Gemology; published by Gemological Institute of America, 2015.
Minerals 15 01240 g003
Figure 4. Round emerald grain from Sumbawanga. (A) Emerald with nearly circular cross-sections (EST-11). (B) The pitted surface texture imparts a frosted appearance to the rough emerald (EST-01).
Minerals 15 01240 g004
Figure 5. Parallel green bands in Sumbawanga emerald (EST-09).
Minerals 15 01240 g005
Figure 6. Associate minerals of Sumbawanga emeralds. (A) Emeralds with black biotite, phlogopite and yellow quartz (EST-01). (B) Emerald with yellow quartz, gray quartz, orange-pink apatite and grayish-brown phlogopite (EST-01); (C) Emerald with colorless quartz and white beryl (EST-05). (D) Emerald with light green beryl, colorless beryl and dark yellow-green to yellowish-brown rutile (EST-05); (E) Emerald with black platy hematite (EST-02). (F) Emerald with numerous black magnetite grains (EST-04).
Minerals 15 01240 g006
Figure 7. Raman spectra of associate minerals of Sumbawanga emeralds. (A) Quartz; (B) Apatite; (C) Phlogopite; (D) Rutile; (E) Hematite; (F) Magnetite. The green number is the characteristic Raman shift of emerald.
Minerals 15 01240 g007
Figure 8. Fluid inclusions in Sumbawanga emeralds. (A) Fingerprint-like pattern fluid inclusions (EST-09). (B) In a fluid inclusion of almost rectangular shape a circular vapor bubble is observed (ESC-15).
Minerals 15 01240 g008
Figure 9. The two-phase (gas–liquid) fluid inclusion (A) and its corresponding Raman spectrum (B). The blue cross indicates the Raman analysis point while the green numbers mark the characteristic Raman peaks of the host emerald crystal.
Minerals 15 01240 g009
Figure 10. Mineral inclusions in Sumbawanga emeralds. (A) Colorless columnar quartz and short hexagonal prismatic apatite (EST-09). (B) Parallel-oriented elongated tabular inclusions and black pinpoint inclusions (EST-06). (C) Brown-red platy hematite (EST-15). (D) Brown quadrangular columnar rutile (EST-15).
Minerals 15 01240 g010
Figure 11. Mineral inclusions within Sumbawanga emeralds and their Raman spectra. (A,B) Hexagonal quartz with columnar quartz and their corresponding Raman spectra (EST-09). (C,D) rounded quartz containing a brown hematite inclusion and their respective Raman spectra (EST-09). (E,F) The brown rutile inclusion and its Raman spectrum (EST-15). (G,H) Yellowish-green chrysoberyl and its Raman spectrum (EST-17). The colored crosses in the left images indicate the Raman analysis points, with each color corresponding to its respective spectrum in the right panel. The green numbers mark the characteristic Raman peaks of the host emeralds.
Minerals 15 01240 g011
Figure 12. Anhydrite inclusions within Sumbawanga emeralds and their characteristics Raman spectra (EST-09). All analytical points in image (A) correspond to anhydrite, image (B) is the representative Raman spectrum, and the various analytical points in image (C) exhibit one-to-one correspondence with the Raman spectra presented in image (D). The green numbers mark the characteristic Raman peaks of the host emerald.
Minerals 15 01240 g012
Figure 13. Elongated platy mineral inclusions (A,C) in Sumbawanga emeralds and their Raman spectra (B,D). The colored crosses (analysis points) exhibit one-to-one correspondence with the Raman spectra. The green numbers mark the characteristic Raman peaks of the host emeralds.
Minerals 15 01240 g013
Figure 14. Diaspore and quartz under plane-polarized (A,C,E,G) and cross-polarized light (B,D,F,H).
Minerals 15 01240 g014
Figure 15. Chrysoberyl twinning within Sumbawanga emeralds. (A) The heart-shaped contact twin of chrysoberyl (EST-15). (B) The wheel twins of chrysoberyl (EST-15). Photomicrographs by Yi Guo.
Minerals 15 01240 g015
Figure 16. UV-Vis-NIR spectra of Sumbawanga emeralds.
Minerals 15 01240 g016
Figure 17. (A) Color zoning emerald EST-09. The white circles indicate the positions of analysis of 1 to 8. (B) EPMA data for selected element analysis from corresponding points 1 to 8 in the left figure (EST-09).
Minerals 15 01240 g017
Figure 18. Ternary FeO-MgO-Cr2O3 (wt.%) plot of African emeralds. Sources of data: [6,8,14,16].
Minerals 15 01240 g018
Table 1. Gemological properties of Sumbawanga emerald samples.
PropertiesResults
ColorMedium green to bluish green
ClarityMedium to heavy included
Refractive indicesNo = 1.577–1.581; Ne = 1.571–1.574
Birefringence0.006–0.007
Specific gravity2.66–2.72
PleochroismGreen (o-ray) and bluish green (e-ray)
FluorescenceInert
Chelsea filterRed
External featuresRounded pebble morphologies with localized surface damage, displaying an abraded, frosted texture
Parallel color bands of alternating light green and vivid green.
Internal featuresFingerprint-like fluid inclusions
Abundant mineral inclusions: quartz, diaspore, chrysoberyl, apatite, hematite, magnetite, rutile, and anhydrite
Table 2. Chemical composition of diaspore in emerald (EST-17) by EPMA (wt.%).
PointsNa2OMgOAl2O3SiO2TiO2Cr2O3MnOFeOTotalAlSiTiCrMnFe
17-10.0160.00472.5950.096- 1- 10.0034.04576.7740.9590.001000.0020.038
17-2- 1- 172.7510.0630.1750.03- 15.40478.4550.8350.0010.1020.01800.044
17-30.0140.03571.5560.2620.0540.020.0114.71876.7210.9000.0030.0350.0130.0070.042
1 The data is below the detection limit and will not be calculated.
Table 3. Chemical composition of emerald from Sumbawanga by EPMA (wt.%).
PointsEST-1-1EST-4-1EST-5-1EST-5-2EST-6-1EST-9-2EST-9-4EST-9-6EST-9-8EST-11-1EST-14-1EST-15-1
SiO264.44 67.38 66.69 65.80 68.02 65.82 65.18 65.24 66.33 66.32 62.82 66.07
Al2O316.37 17.87 18.23 16.86 17.28 17.19 17.39 17.55 17.84 16.25 16.36 16.64
FeO1.25 0.84 0.93 1.01 0.84 1.17 1.00 0.90 0.79 1.06 1.04 0.77
MnO0.01 0.01 - 1 - 1 - 1 0.04 - 1 0.05 - 1 0.01 0.03 - 1
MgO1.18 0.53 0.51 1.02 0.63 1.02 0.87 0.63 0.49 1.12 1.04 0.67
Cr2O30.64 0.07 0.03 0.31 0.02 0.17 0.27 0.25 0.09 0.45 0.26 0.24
V2O50.02 0.02 0.03 0.03 - 1 0.01 0.02 0.02 0.03 - 1 0.02 - 1
TiO2- 1 - 1 0.03 - 1 0.04 0.03 0.02 0.02 - 1 0.06 0.02 0.02
CaO- 1 0.01 - 1 - 1 - 1 0.01 - 1 0.02 - 1 0.01 0.01 - 1
Na2O0.48 0.24 0.20 0.26 0.18 0.33 0.30 0.21 0.16 0.59 0.40 0.32
K2O0.16 0.11 0.16 0.29 0.08 0.24 0.22 0.17 0.15 0.23 0.34 0.20
BeO 213.61 14.15 13.95 13.88 14.36 13.85 13.68 13.67 13.90 14.07 13.22 13.97
Total98.16 101.23 100.76 99.46 101.45 99.88 98.94 98.73 99.78 100.17 95.54 98.90
Si 35.865.955.925.915.985.895.895.915.955.905.875.96
Al1.761.861.911.781.791.811.851.871.881.701.801.77
Fe2+0.090.060.070.080.060.090.080.070.060.080.080.06
Mg0.160.070.070.140.080.140.120.190.070.150.140.09
Cr0.050.010.000.020.000.010.020.020.010.030.020.02
Na0.090.040.030.040.030.060.050.040.030.100.070.02
K0.020.010.020.030.010.030.030.020.020.030.040.02
Be2.973.002.972.993.042.982.972.982.993.012.973.03
1 The data is below the detection limit and will not be calculated. 2 The data is calculated based on the standard formula of beryl (Be3Al2Si6O18). 3 Atoms per formula units.
Disclaimer/Publisher’s Note: The statements, opinions and data contained in all publications are solely those of the individual author(s) and contributor(s) and not of MDPI and/or the editor(s). MDPI and/or the editor(s) disclaim responsibility for any injury to people or property resulting from any ideas, methods, instructions or products referred to in the content.