Article

The Enrichment of Uranium in Marine Organic-Rich Overmature Shales: Association with Algal Fragments and Implications for High-Productivity Interval

1
State Key Laboratory of Oil and Gas Reservoir Geology and Exploitation, Chengdu University of Technology, Chengdu 610059, China
2
College of Energy (College of Modern Shale Gas Industry), Chengdu University of Technology, Chengdu 610059, China
3
School of Civil Engineering & Architecture, Tongling University, Tongling 244000, China
4
Anda Qingxin Oilfield Development Co., Ltd., Suihua 152000, China
*
Author to whom correspondence should be addressed.
Minerals 2025, 15(12), 1238; https://doi.org/10.3390/min15121238 (registering DOI)
Submission received: 8 October 2025 / Revised: 18 November 2025 / Accepted: 19 November 2025 / Published: 23 November 2025

Abstract

Marine organic-rich shales frequently exhibit anomalously high uranium (U) concentrations, yet the mechanisms governing its enrichment in overmature formations like the Wufeng–Longmaxi shales remain unclear. This study examines the distribution and enrichment patterns of uranium in the Wufeng–Longmaxi shales in typical wells through integrated geochemical and geophysical analyses, supplemented by natural gamma spectral logging data. Key findings include: (1) Multiple (up to three) uranium enrichment events are identified within the Wufeng–Longmaxi sequence, consistently corresponding to shale gas sweet spots. (2) Uranium content shows a clear dependence on organic matter (OM) type, with algal fragments being the primary host of uranium, likely due to incorporation during early diagenesis. Pore-water redox conditions and pH further govern the reduction of U (U6+) and its subsequent sequestration into organic phases. (3) The equivalent vitrinite reflectance (ERo) of uranium-rich shales is 0.11%–0.17% higher than that of non-uranium-rich shales, suggesting that uranium enrichment may slightly enhance OM thermal maturity. (4) Uranium distribution is collectively controlled by reducing conditions, volcanic eruptions (e.g., tuff layers), and OM type. Additionally, uranium enrichment provides chronostratigraphic markers that may aid in timing marine black shales. These findings thus offer a mechanistic understanding of uranium enrichment in overmature shales, with direct implications for targeting productive intervals in shale gas systems.

1. Introduction

Uranium (U) is a radioactive element and is considered the primary cause of high gamma ray (GR) anomalies in black shales, with minimal contributions from potassium (K) and thorium (Th) [1,2,3]. Anomalously high GR readings at the base of the Longmaxi Formation have been used as a key marker to distinguish between the Wufeng and Longmaxi Formations [3,4,5]. Moreover, these high-GR intervals correspond to shale gas sweet spots in current exploration targets, characterized by high total organic carbon (TOC) content, substantial gas content, and high brittleness [6,7]. Typically, uranium concentrations in marine black shales range from 10 to 60 ppm [8], although some formations, such as the Cambrian Niutitang Shale in South China and the Cambrian Alum Shale in Sweden, exhibit considerably higher Uranium contents (U contents), often exceeding 50 ppm [6,9]. It is widely accepted that uranium in marine black shales is primarily derived from soluble uranium in ancient seawater [10,11], with additional contributions potentially sourced from volcanic or hydrothermal activities [3,6]. Marine shales with high GR values are commonly rich in clay content. Interestingly, in the Wufeng–Longmaxi overmature shale, high-GR intervals correlate with elevated siliceous mineral content. While multiple hypotheses have been proposed to explain these GR anomalies—including depositional conditions [5], inherent uranium enrichment, and global sea-level changes [12]—a comprehensive genetic mechanism specific to the Wufeng–Longmaxi shale remains elusive.
Uranium in marine black shales is frequently associated with organic matter (OM), so that organic-rich shales tend to contain higher uranium concentrations [6,13]. However, some marine shales with high TOC content show unexpectedly low uranium levels [14], implying that the type of OM (maceral type) may also play a critical role. To date, few studies have systematically correlated U content with specific OM types in overmature marine shales. Current research on the Wufeng–Longmaxi Formation has largely focused on depositional conditions, pore characteristics, and shale gas enrichment mechanisms [7,15], leaving the distribution and enrichment processes of uranium insufficiently explored.
This study aims to investigate the distribution and enrichment mechanisms of uranium in the Wufeng–Longmaxi shale, with a specific focus on its relationship with organic matter types, its influence on thermal maturity, and the broader geological implications for shale gas systems.

2. Geological Settings

The Wufeng–Longmaxi shale was deposited in a restricted deep shelf setting in the Sichuan Basin during the late Ordovician to early Silurian. The Sichuan Basin is situated on the northwestern margin of the Yangtze Platform, bounded by the Micangshan–Dabashan thrust–fold belts to the northeast, the Jiangnan–Xuefengshan paleo-uplift and Qianzhong paleo-uplift to the south, and the Longmenshan thrust–fold belt to the northwest (Figure 1), covering an area of approximately 18 × 104 km2. During the late Ordovician to early Silurian, the Caledonian orogeny led to the formation of the Chuanzhong, Qianzhong, and Jiangnan–Xuefeng uplifts [16]. Concurrently, rising sea levels promoted low-energy and anoxic conditions in the southeastern Sichuan Basin, facilitating the deposition of the thick, organic-rich Wufeng–Longmaxi shale [17,18].
The Wufeng–Longmaxi shale primarily refers to the lower segment of the Lower Silurian Longmaxi Formation and the uppermost part of the Upper Ordovician Wufeng Formation in this study, which were deposited in a deep-water shelf environment with thicknesses ranging from 10 m to over 70 m [19,20]. Deposited in deep-water to shallow shelf environments of the southeastern Sichuan Basin, the Wufeng–Longmaxi shale primarily consists of black carbonaceous and siliceous shale, as indicated by an abundant graptolite assemblage that includes Amplexograptus, Diceratograptus, Dicellograptus, and Tangyagraptus [17]. It is noteworthy that the Wufeng–Longmaxi shale represents a globally distributed shale unit deposited during the early Silurian. Equivalent strata in North Africa and the Middle East are referred to as “hot shales”, characterized by high TOC content, high GR values, and abundant graptolite fossils [21].

3. Samples and Methods

3.1. Samples

Drill core samples of the Wufeng–Longmaxi shale were collected from wells D#1, H#1, N#1, NX#1, W#1, and Z#1 in the Sichuan Basin (Figure 1) to investigate the abundance and distribution of uranium. In addition, geophysical log data—including GR and spectral uranium measurements—from 5 shale gas wells were incorporated into the study. All shale samples are in the overmature stage, with equivalent vitrinite reflectance (ERo) values exceeding 2.0%, indicating a consistently high and uniform level of OM thermal maturity. U contents of 28 previously analyzed shale samples from well W#1 [22] were used to evaluate the correlation between measured U contents and log-derived U content. From this dataset, 12 representative samples possessing complete measurements of uranium concentration, mineral composition, and relative abundance of OM types were selected for detailed analysis (Table 1).

3.2. Experiments

TOC content was determined using a LECO C230 elemental analyzer (LECO Corporation, St Joseph, MI, USA), while mineral composition was analyzed with a Bruker D8 Advance X-ray diffractometer (Bruker Corporation, Billerica, MA, USA). OM thermal maturity was assessed by measuring solid bitumen reflectance (BRo) with an MPV-3 microphotometer (Ernst Leitz GmbH, Wetzlar, Germany) following [23]. Due to the absence of vitrinite in the Wufeng–Longmaxi shale, BRo values were converted to ERo using the empirical Formula (1) [24]. Uranium concentrations in 28 samples from well W#1 were measured by inductively coupled plasma mass spectrometry (ICP-MS) (Thermo Fisher Scientific Inc., Waltham, MA, USA). Detailed procedures for sample preparation and ICP-MS analysis are described in [25].
ERo = 0.4 + 0.618 × BRo
For microstructural characterization, 12 representative samples were subjected to field emission scanning electron microscopy (FE-SEM). Each sample was trimmed to 8 × 8 × 3 mm and sequentially polished using ultrafine emery papers (30, 15, 9, 6, 3, and 1 μm) to minimize surface roughness prior to argon ion milling. This preparation is also used to ensure that the observed surface was parallel to the bedding plane. FE-SEM imaging was conducted using a Hitachi SU8220 field emission scanning electron microscope (Hitachi High-Tech Corporation, Tokyo, Japan) equipped with secondary electron (SE) and backscattered electron (BSE) detectors at the South China University of Technology. Sample surfaces were coated with a thin platinum layer to enhance conductivity during imaging.
OM types were identified through correlative microscopy combining polarized light microscopy (Nikon ECLIPSE 50i POL, Nikon Instruments Inc., Tokyo, Japan) and FE-SEM. This integrated approach allowed detailed characterization of OM morphology and pore structure. The relative abundances of different OM types were quantified based on area estimation from SEM images using the Pores (Particles) and Cracks Analysis System (PCAS, version 1.0.0.20). For each sample, 80–100 images were acquired at magnifications of ×10,000, ×25,000, ×50,000, and ×100,000, with ×25,000 images serving as the primary basis for quantitative analysis.

4. Results

4.1. Organic Matter (OM) Types

Based on integrated optical microscopy and FE-SEM with BSE detection, and consistent with previous studies [26,27,28,29,30], five distinct types of OMs were identified in the Wufeng–Longmaxi shales: pyrobitumen, algal fragments, graptolites, bacteria-like aggregates, and micrinite. The analyzed samples exhibit ERo values ranging from 2.16% to 3.48%, indicating that all samples are in the overmature stage. Pyrobitumen and algal fragments represent the dominant OM constituents, with subordinate amounts of graptolites, micrinite, and bacteria-like aggregates (Table 1). It should be noted, however, that the relative content of graptolites may be underestimated due to their incomplete exposure in two-dimensional SEM images.
Pyrobitumen, the most prevalent OM type in the Wufeng–Longmaxi shale, is defined as the insoluble residue formed from the cracking of retained oil into gas [31]. Under optical microscopy, it appears brownish black (Figure 2a). FE-SEM imaging, offering higher resolution, allows clearer identification of pyrobitumen, which typically infills interparticle (InterP) pores between mineral grains [32]. Two morphological types are observed: (1) pyrobitumen with distinct shapes, such as crumb-type (Figure 2b) or bulb-type (Figure 2c), which often fills mineral dissolution pores or fossil skeletal frameworks (e.g., sponge spicules), with crumb-type particles generally exceeding 20 μm in size; and (2) amorphous pyrobitumen with no fixed shape, occurring within InterP pores among granular minerals (Figure 2d), inter-clay pores (Figure 2e), and intercrystalline pores (Figure 2f), typically measuring less than 10 μm. Both crumb-shaped and amorphous pyrobitumen are common in the studied samples.
Algal fragments represent another significant OM component and display distinctive morphological features. They are generally larger than 10 μm, often reaching up to 20 μm (Figure 2g), and show little to no visible internal porosity. Graptolites are readily identifiable in hand specimens and under optical microscopy (Figure 2h), with their fragments also observable via SEM (Figure 2i). Bacteria-like aggregates appear under SEM as clusters of quasi-spherical pellets (Figure 2j); however, their original morphology is often obscured by strong compaction (Figure 2k). Micrinite, typically occurring in association with pyrobitumen (Figure 2l), presents a subrounded morphology and lacks internal pores.

4.2. Uranium Content

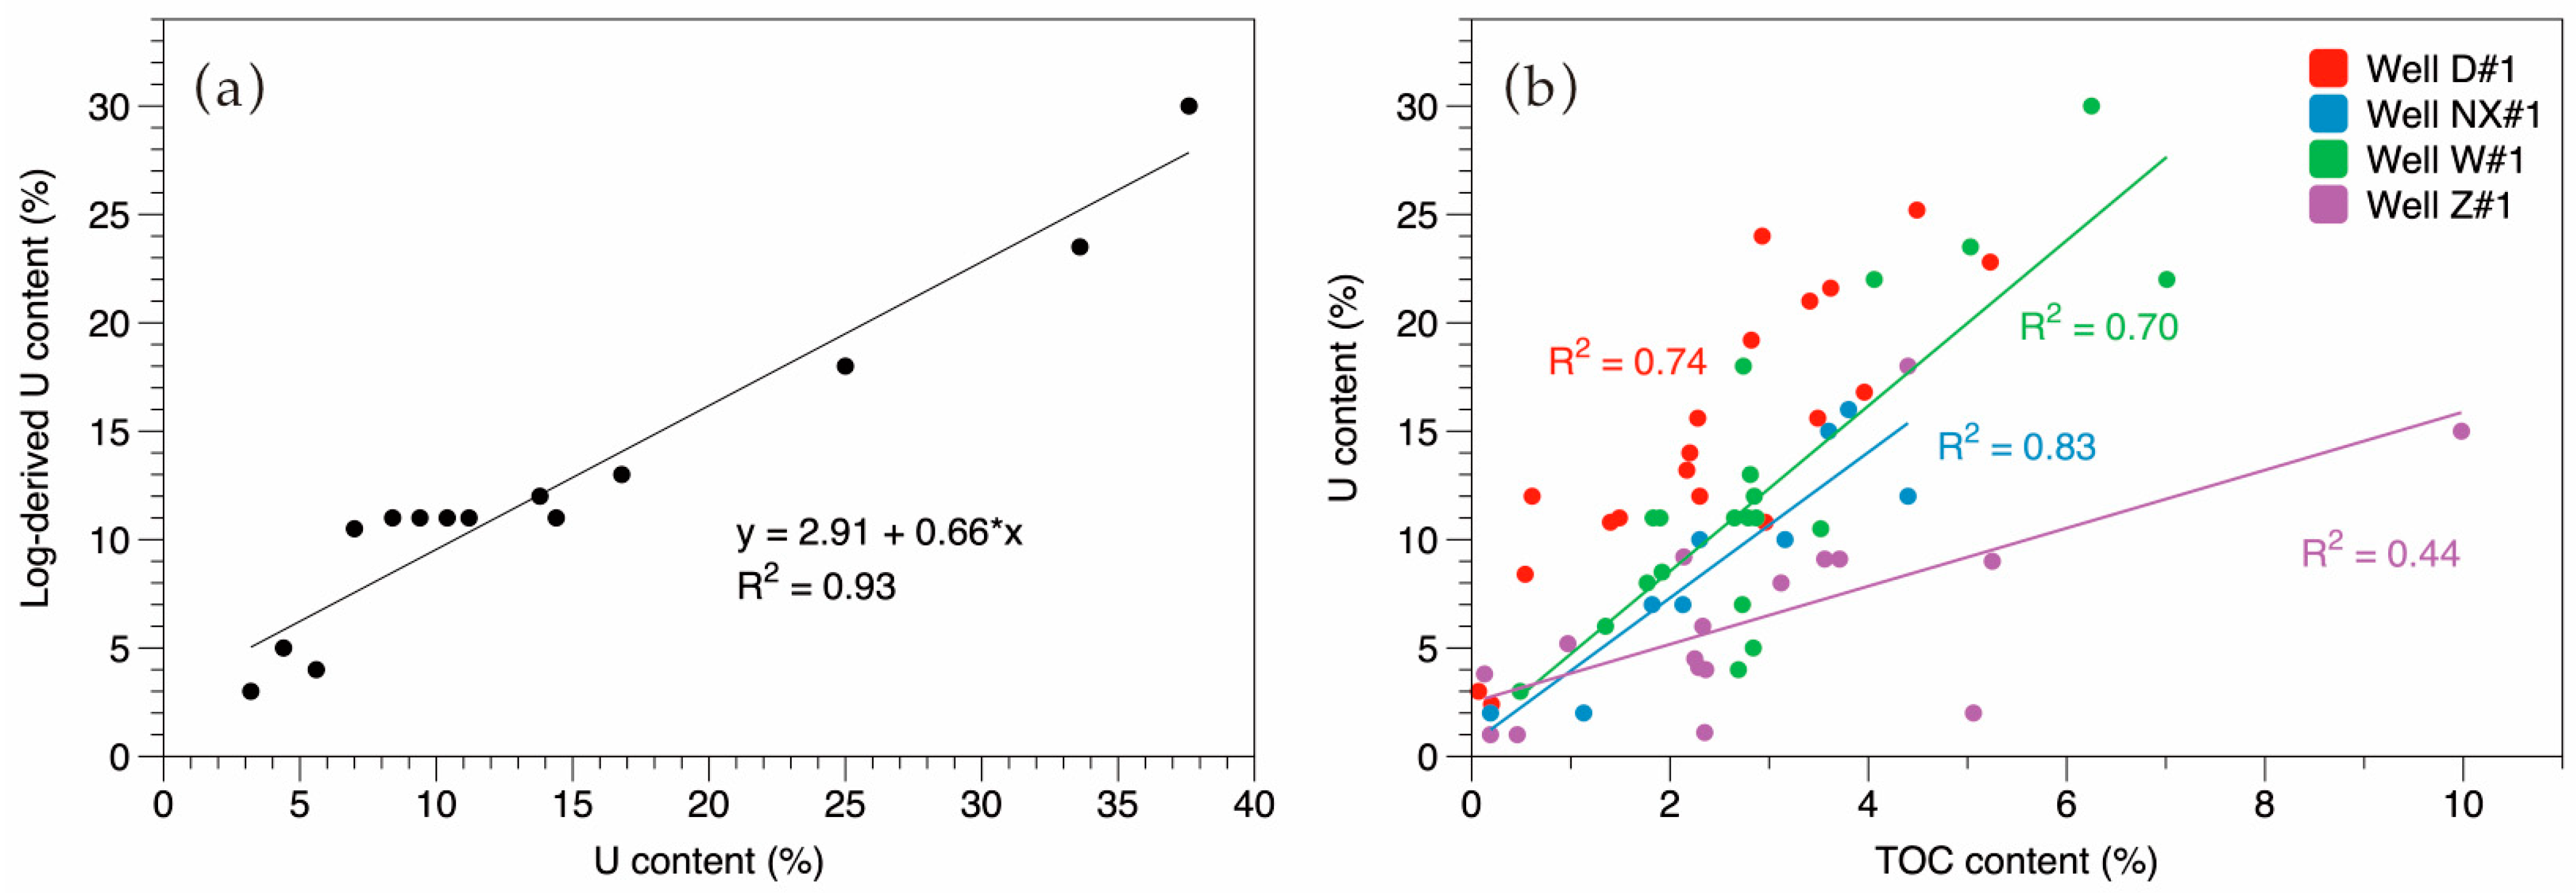
ICP-MS analysis of 28 samples from well W#1 indicates U contents ranging from 2.4 to 38.8 ppm, with an average of 14.4 ppm. A strong positive correlation is observed between measured uranium concentrations and log-derived U values (Figure 3a), demonstrating that spectral logging data provide a reasonably accurate representation of in situ U content. Log-based uranium concentrations in the studied intervals vary from 1 to 30 ppm, averaging 11 ppm, which is systematically lower than the laboratory-measured values. The relationship between TOC and U content (Figure 3b) suggests that uranium enrichment is closely associated with OM, implying that OM acts as the primary host phase for uranium accumulation. It is noteworthy, however, that the correlation coefficient between TOC and U content varies significantly among different well cores (Figure 3b).
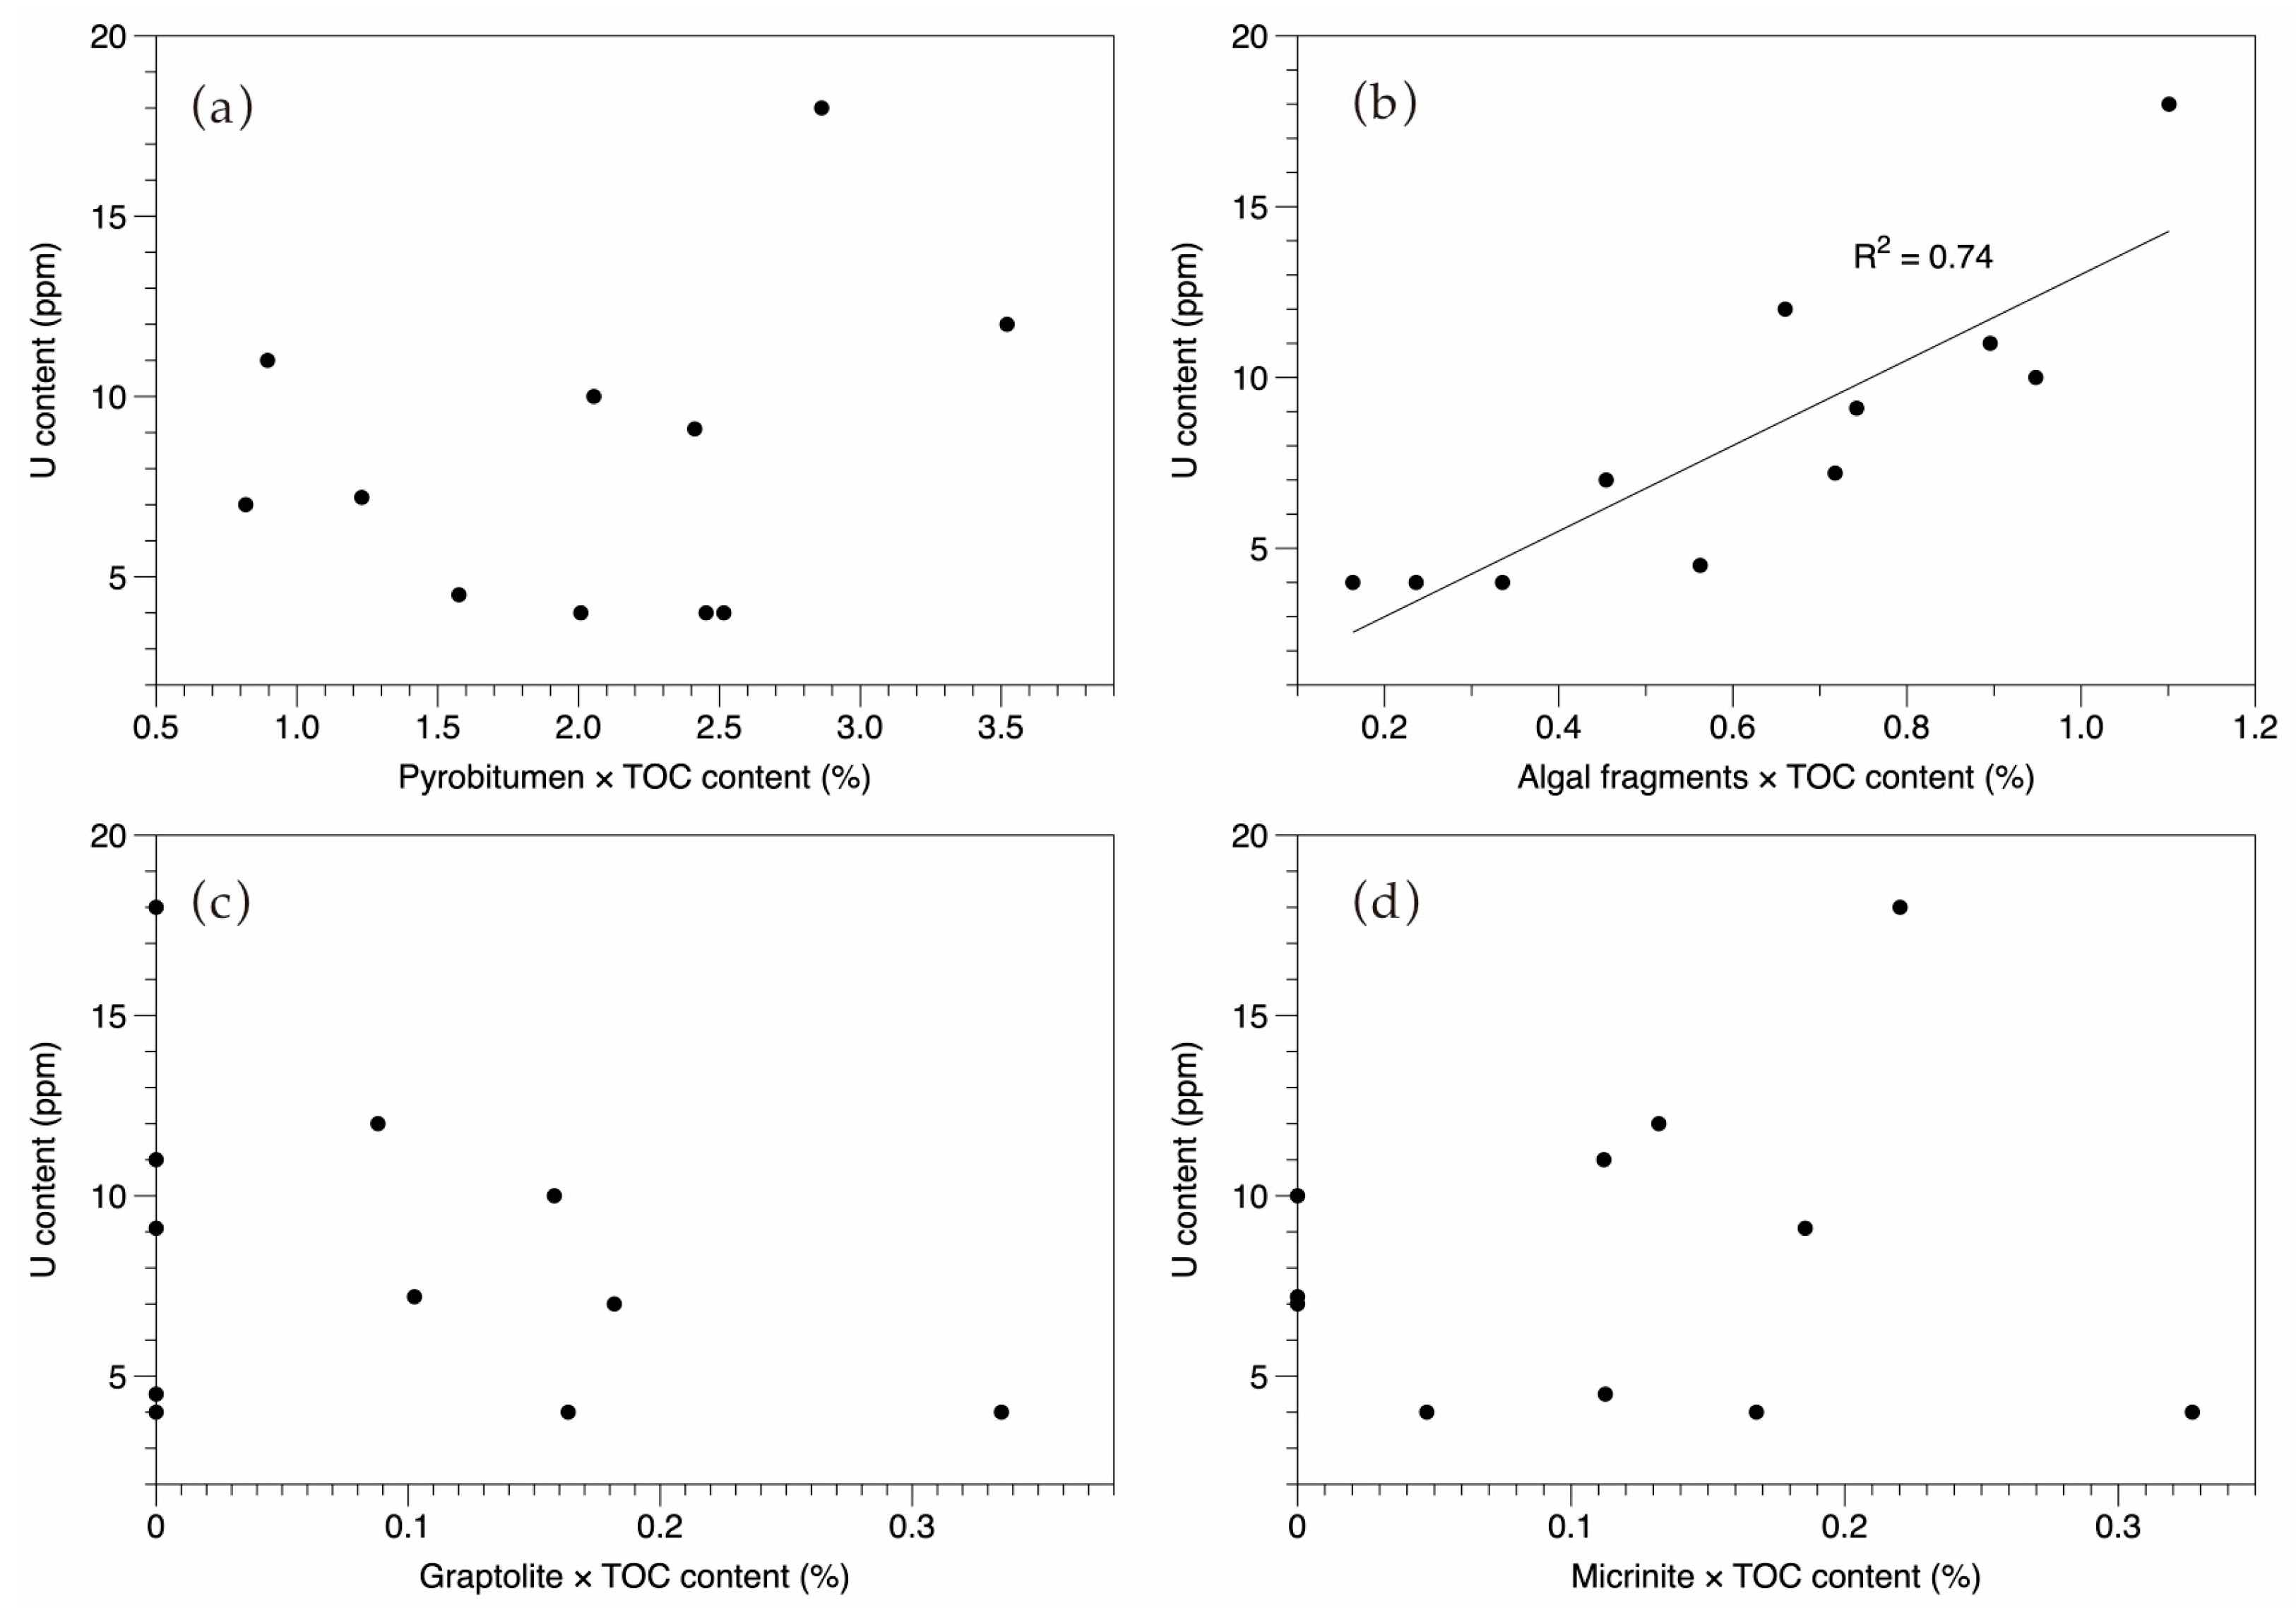
The relationship between U content and the relative abundance of OM types is illustrated in Figure 4. Uranium concentration shows no clear correlation with the relative abundance of pyrobitumen, graptolite, or micrinite (Figure 4a,c,d). In contrast, a good positive correlation (R2 = 0.74) is observed between U content and the relative abundance of algal fragments (Figure 4b), suggesting that algae may serve as the primary host for uranium enrichment. This interpretation is further supported by samples NX-2 and Z-3, which have similar TOC content but differ in algal content; the sample with a higher algal fraction (Z-3) exhibits notably greater Uranium enrichment (Table 1). Interestingly, samples NX-1 and W-2 exhibit high TOC and pyrobitumen content but low U content, indicating a disconnect between TOC content and uranium enrichment in certain intervals. The possible causes of this discrepancy will be discussed in Section 5.1.

4.3. Distribution of Uranium

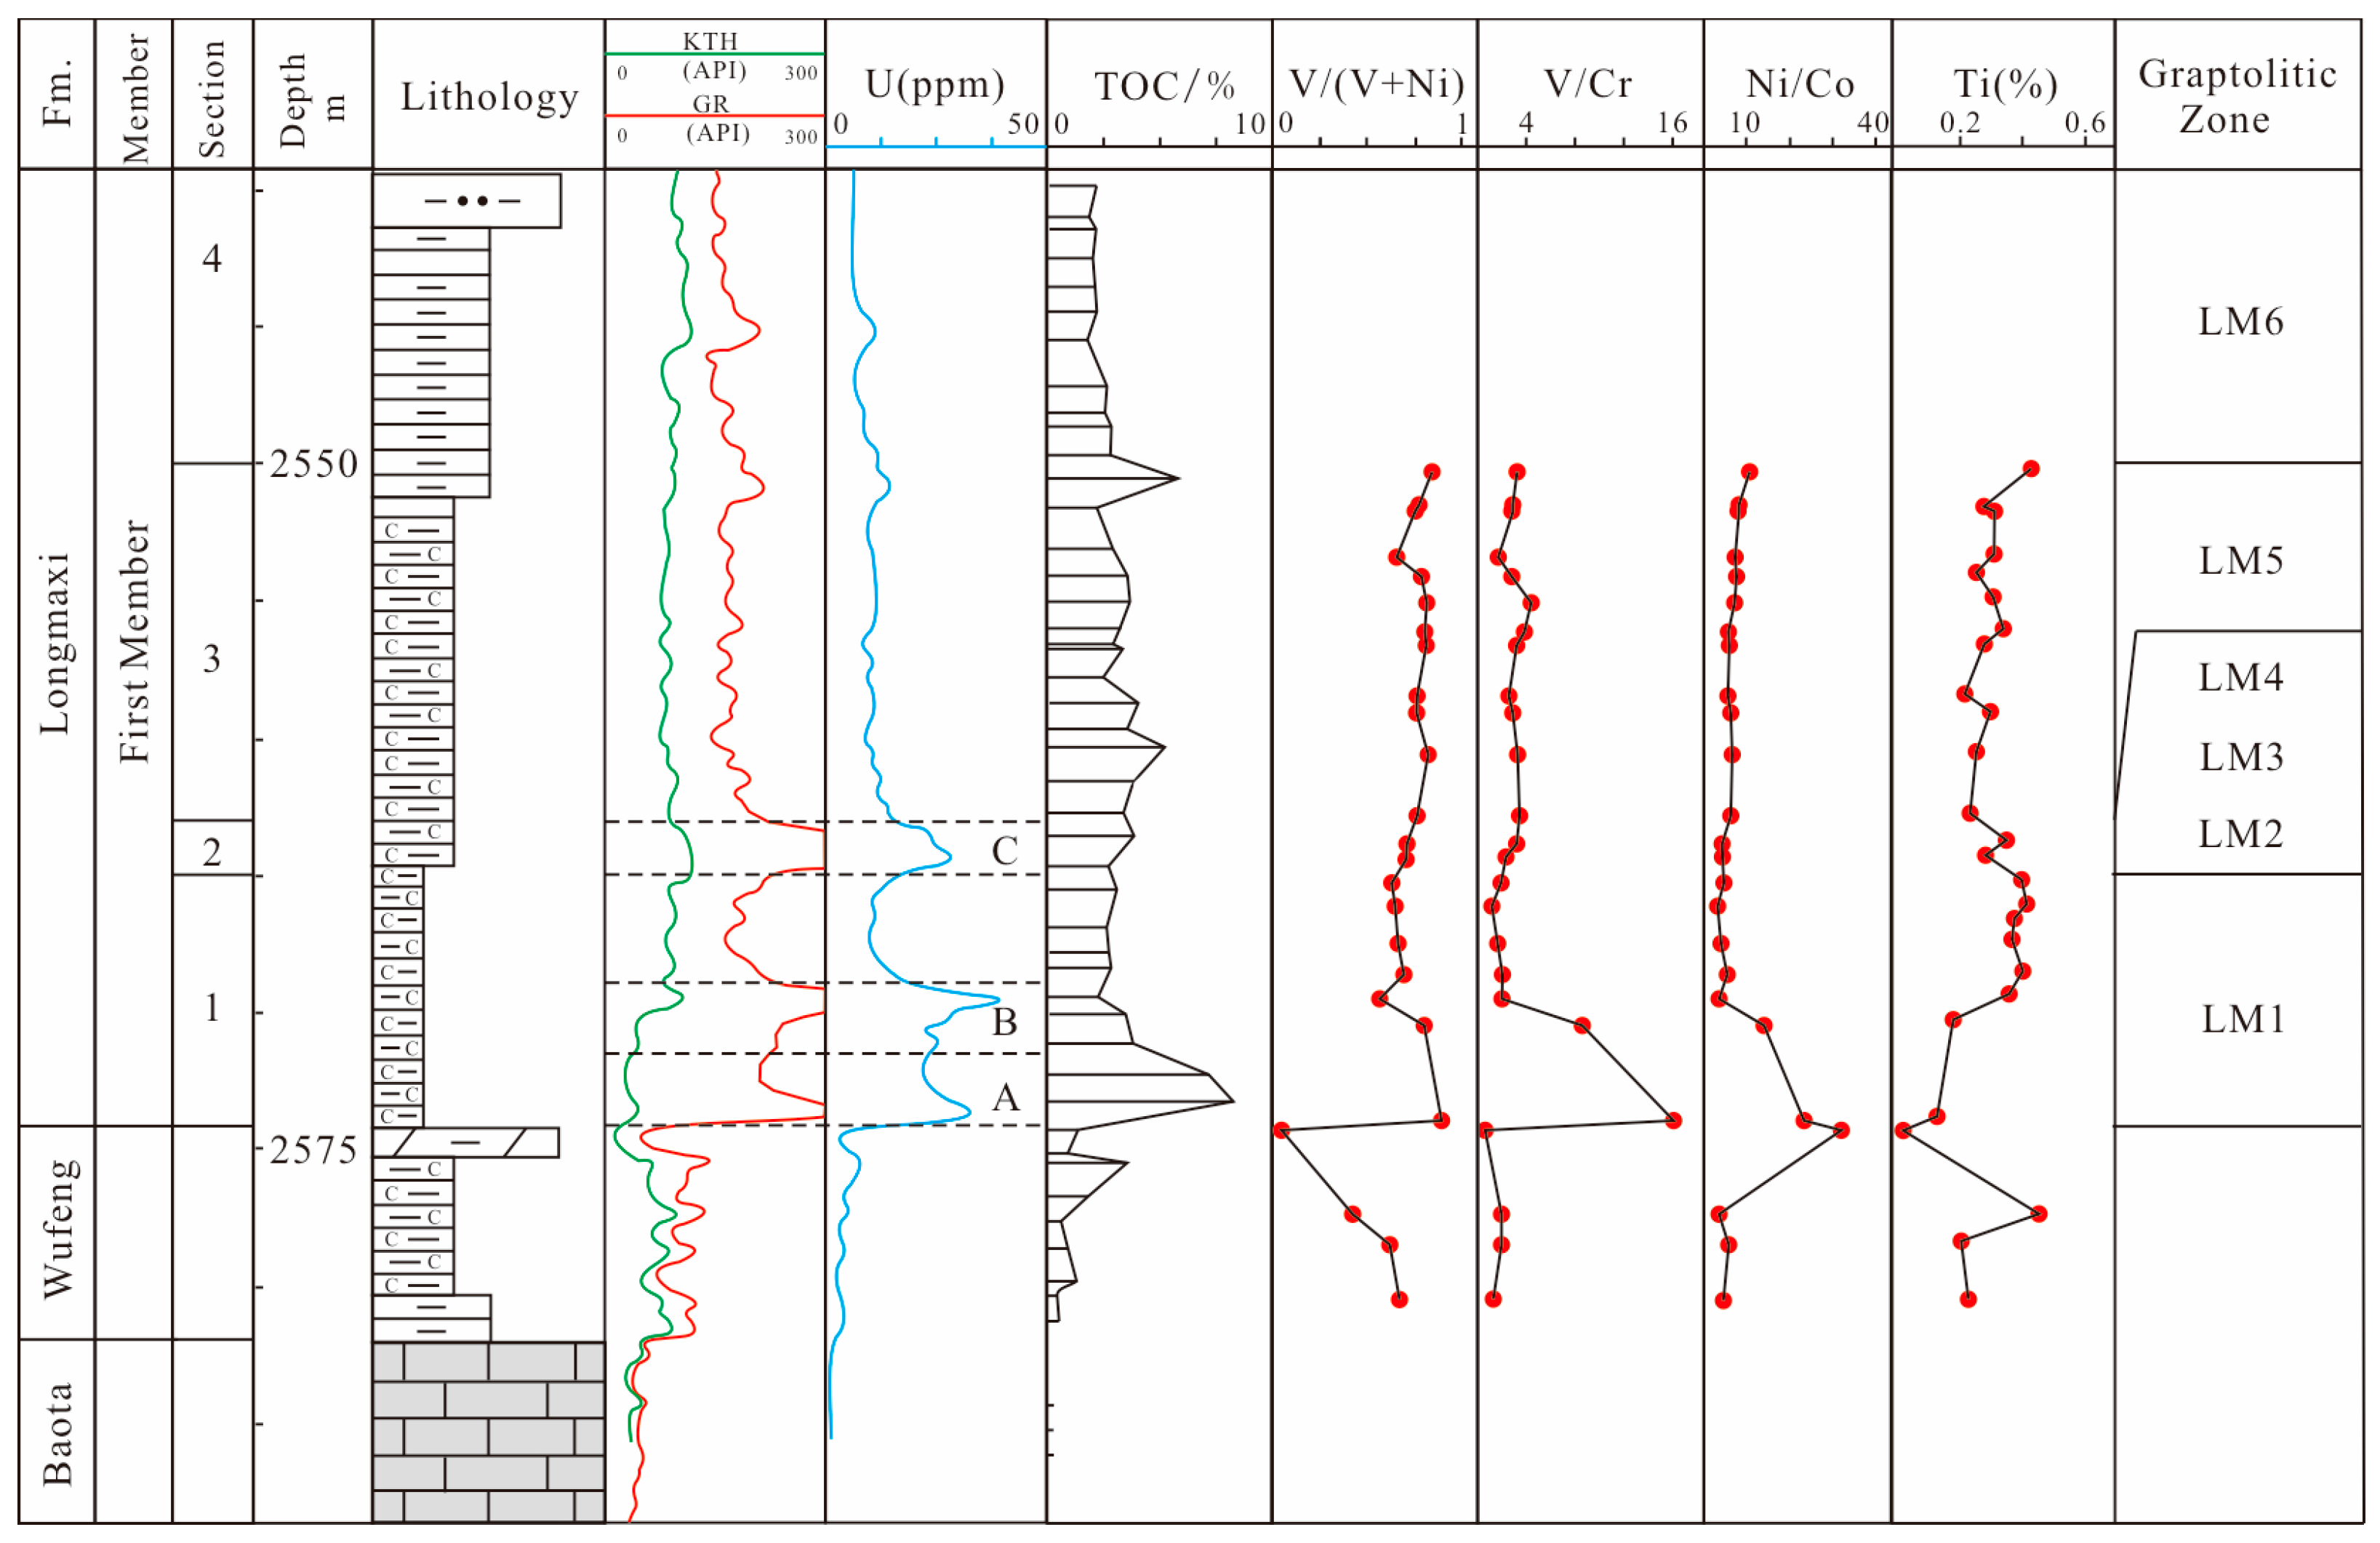
The vertical distribution of uranium enrichment is illustrated using well W#1 as a representative example. Three distinct uranium-enriched intervals, designated as Parts A, B, and C, are identified (Figure 5).
Part A comprises black, organic-rich carbonaceous shale with abundant silica. Its lower boundary corresponds to the base of the Longmaxi Formation, overlying the Guanyinqiao Member at the top of the Wufeng Formation, and aligns with the base of the biostratigraphic LM1 zone (Figure 5). The GR and U curves exhibit a concordant trend of increasing then decreasing with depth, whereas the KTH curve shows a gradual overall increase (Figure 5). The V/(V + Ni) ratio of 0.83 and V/Cr ratio of 7.4, coupled with a Mo content of 68.8 ppm, indicate deposition under strongly reducing conditions. The parallel trends of the U and GR curves suggest that uranium enrichment is the primary contributor to the high-GR anomaly in this interval.
Part B consists of black carbonaceous shale within the middle-lower portion of Section 1 of the Longmaxi Formation’s first member, corresponding to the middle of the LM1 zone (Figure 5). U content shows an initial increase followed by a decrease with depth, while the KTH content displays a marked increase (Figure 5). V/(V + Ni) ratios range from 0.53 to 0.74 (avg. 0.64), and V/Cr ratios vary from 2.1 to 9.3 (avg. 5.7), indicating deposition under reducing conditions, albeit less intense than in Part A. The notable rise in the KTH curve, supported by elevated Th and Ti contents, suggests increased terrigenous detrital input during this depositional stage [33] The covariance of U content and GR values confirms that uranium enrichment remains the dominant factor for the GR anomaly.
Part C is characterized by black carbonaceous shale with higher argillaceous content compared to Parts A and B. It is situated in Section 2 of the first member of the Longmaxi Formation and corresponds to the LM2 biostratigraphic zone (Figure 5). The GR and U curves again show similar trends, indicating that the GR anomaly is primarily uranium-derived (Figure 5). V/(V + Ni) values range from 0.65 to 0.66, and V/Cr ratios fall between 2.5 and 3.5, suggesting deposition under oxygen-poor conditions with relatively weak water-column stratification. Higher Ti content implies significantly increased terrigenous clastic input compared to the underlying intervals.
In summary, the high-GR anomalies in Parts A, B, and C are principally attributed to uranium enrichment, with all three intervals deposited under reducing conditions. The coordinated variation between U and TOC content further indicates a strong association between uranium enrichment and OM accumulation. It is noteworthy that the distribution of high-uranium intervals varies among cores; for instance, three distinct enriched zones are identified in well W#1, whereas only one is observed in well NX#1.

5. Discussion

5.1. Uranium Enrichment Mechanisms

Uranium enrichment in shales has been attributed to associations with OMs [14], biogenic or diagenetic phosphate [34], and aragonite [35]. Among these, the relationship between uranium and OMs—particularly in coals—has been extensively studied [36,37]. In contrast, uranium enrichment processes in marine black shales, especially those of the overmature Wufeng–Longmaxi shale, remain insufficiently understood [38]. Although a positive correlation between U and TOC content is commonly observed in marine black shales [14,38], some organic-rich intervals exhibit low uranium concentrations, likely due to the heterogeneity of OM types [14]. Therefore, elucidating the contribution of different OM types to uranium enrichment constitutes a key objective of this study.
Figure 4 indicates that algal fragments are the primary carrier of uranium in the Wufeng–Longmaxi overmature shale. In immature shales, amorphous organic matter (AOM) commonly occurs as intimate mixtures with clay minerals, largely resulting from microbial degradation [38,39,40]; such AOM-clay complexes have been shown to correlate positively with U content [38]. Although high thermal maturity may obscure textural evidence, the irregular surfaces of most algal fragments in our samples suggest that microbial degradation likely occurred, facilitating uranium sequestration during early diagenesis. The absence of a correlation between U and pyrobitumen further supports the early diagenetic incorporation of uranium into AOM, prior to the formation of pyrobitumen via oil-cracking. A very weak negative correlation appears to exist between U content and graptolite fraction (Figure 4c), which may reflect the limited role of terrigenous OM in uranium accumulation, as graptolites—composed mainly of aromatic compounds with aliphatic side chains—are chemically analogous to Type III OM [41,42].
Uranium speciation is redox-sensitive: hexavalent U(U6+) is soluble in seawater but reduces to insoluble tetravalent U(U4+) under reducing conditions [11,43,44]. Two principal mechanisms facilitate U–OM association: (1) precipitation and adsorption of uranium as disseminated uraninite (UO2) during early sedimentation [10], and (2) incorporation of uranium into OM as urano-organic complexes during OM decomposition [10,45]. Microbial degradation of algal fragments consumes dissolved oxygen in pore waters, thereby enhancing local reducing conditions and promoting the reduction of U6+ to U4+. We therefore propose that uranium was incorporated into algal OM during degradation near the sediment–water interface.
Reducing conditions are critical for uranium enrichment, as indicated by redox proxies (e.g., V/(V + Ni), V/Cr, Ni/Co; Figure 5). The common occurrence of pyrite in uranium-rich shales further confirms the presence of localized reducing environments during deposition. Under such conditions, uranium is readily adsorbed or complexed by algal OM.
In addition to redox conditions, porewater pH also influences uranium enrichment [38,44,46]. Samples NX-1, W-1, and W-2, which have high carbonate content (Table 2), suggest deposition under alkaline porewater conditions. The adsorption capacity of U(U6+) onto AOM, clay minerals, and U-bearing mineral phases (e.g., barite, apatite) decreases as pH increases from typical seabed values (~6–7) to alkaline conditions [10,47,48], limiting the amount of U(U6+) available for reduction. Although a general inverse correlation between uranium and carbonate content is not always evident, a significant negative correlation emerges when carbonate content exceeds 45% (Figure 6), indicating that porewater pH—along with redox conditions—exerts an important control on U enrichment. In other words, alkaline conditions inhibit uranium enrichment.
Although certain algae are capable of uranium bioaccumulation [49,50], most modern marine algae and plankton exhibit low U contents (0.04–2.35 ppm and 0.17–0.78 ppm, respectively) [51], indicating that living organisms are not inherent concentrators of uranium. Instead, uranium incorporation likely occurs during early diagenesis [11,43]. While certain telalginite (e.g., Tasmanites) does not significantly contribute to uranium enrichment [38], partially or completely degraded algal OM transformed into AOM can host variable uranium concentrations [52,53].
Spatial analysis shows that anomalously high U contents primarily occur in deep-water shelf settings near paleo-uplifts or groundwater highs (Figure 1), implying additional controlling factors beyond redox and pH conditions. Wang et al. [3] suggested that volcanic activity contributed to uranium enrichment during high-GR interval deposition. Based on the distribution of U-rich shales, we infer that both continental volcanic eruptions and submarine hydrothermal activity played a role. The widespread presence of tuff beds (Figure 7a) and banded pyrite (Figure 7b) indicates volcanic inputs, while hydrothermal pyrite textures—such as recrystallized framboids with dense internal structures (Figure 7c) and pre-bitumen recrystallization (Figure 7d)—provide evidence for hydrothermal activity. Volcanic processes can supply uranium to seawater in two ways: (1) volcanic ash ejected during eruptions transports uranium into the upper water column, and (2) hydrothermal fluids release uranium into deeper seawater layers [38,54], ultimately enhancing the marine uranium reservoir.
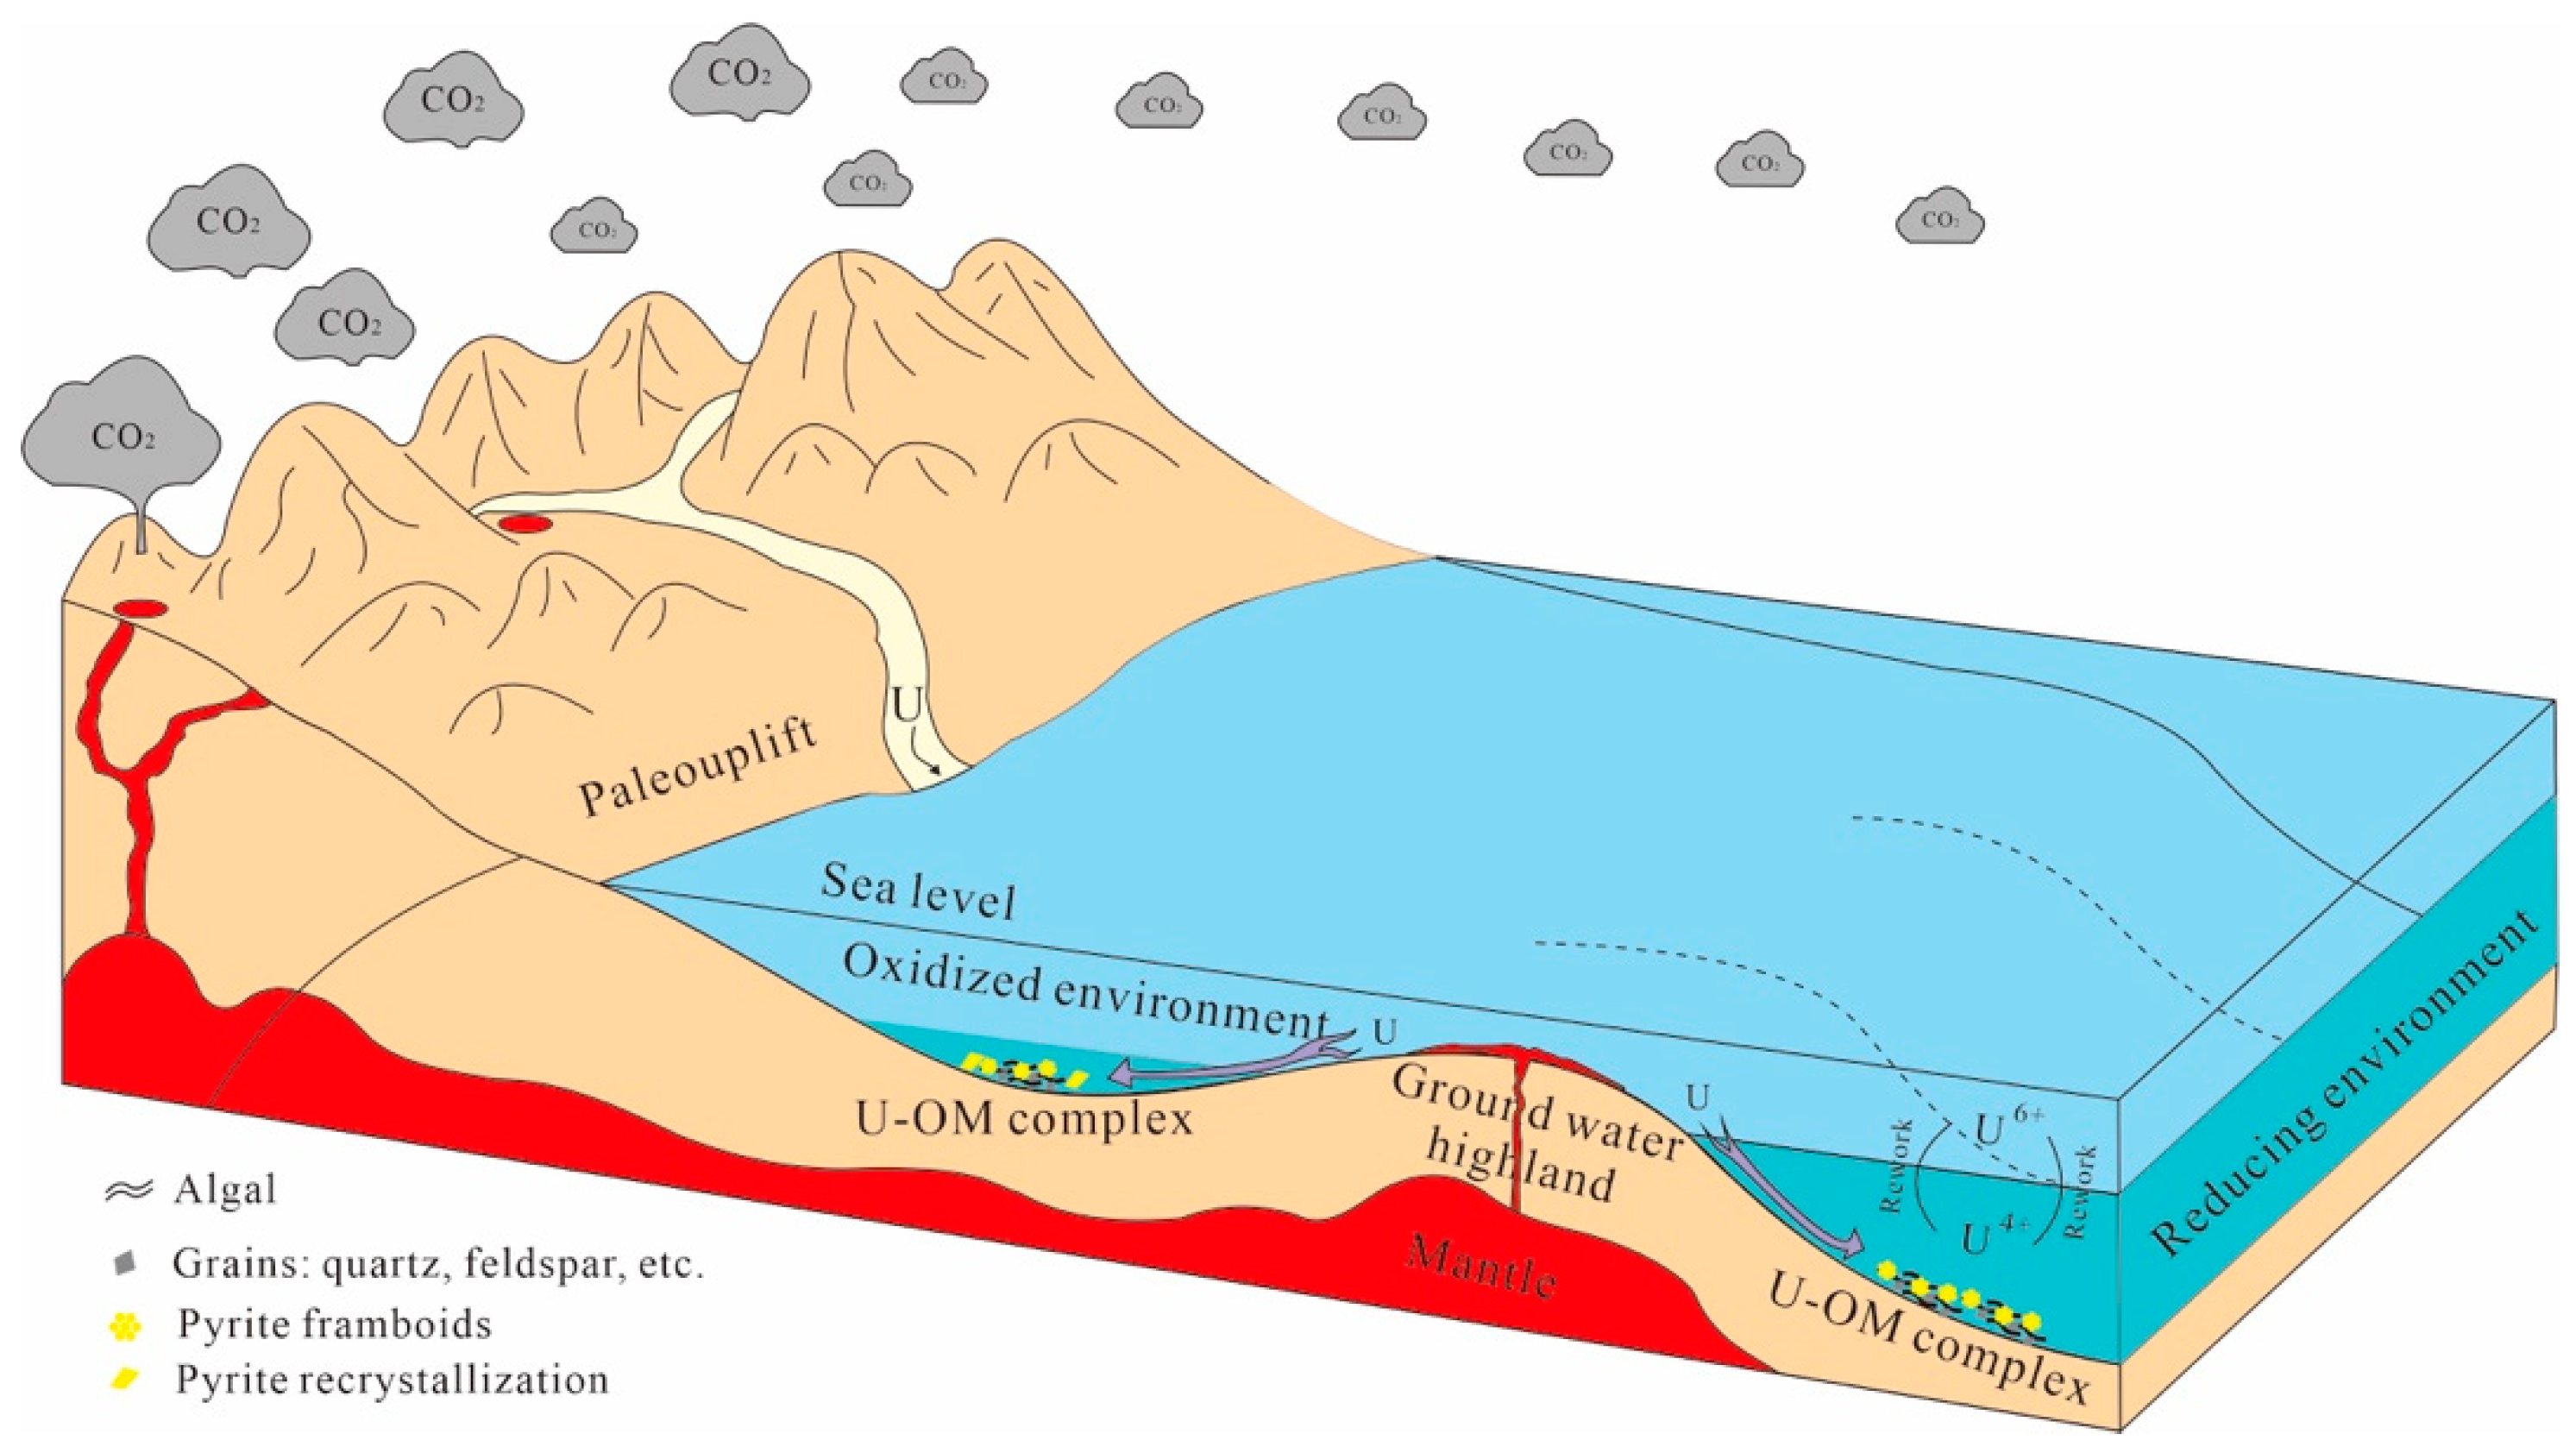
In summary, uranium is primarily derived from ancient seawater, with volcanic activity serving as an important source (Figure 8). Reducing conditions promote uranium adsorption or complexation with algal OM. The lack of correlation between uranium and pyrobitumen suggests that uranium uptake occurred during early diagenesis, when fine-grained sediments retained higher porosity and permeability, facilitating diffusion of seawater-derived uranium. During this stage, hydrocarbons had not yet been expelled from kerogen, and bitumen had not formed, explaining why pyrobitumen shows no clear relationship with U content.

5.2. Enhancement of Thermal Maturation

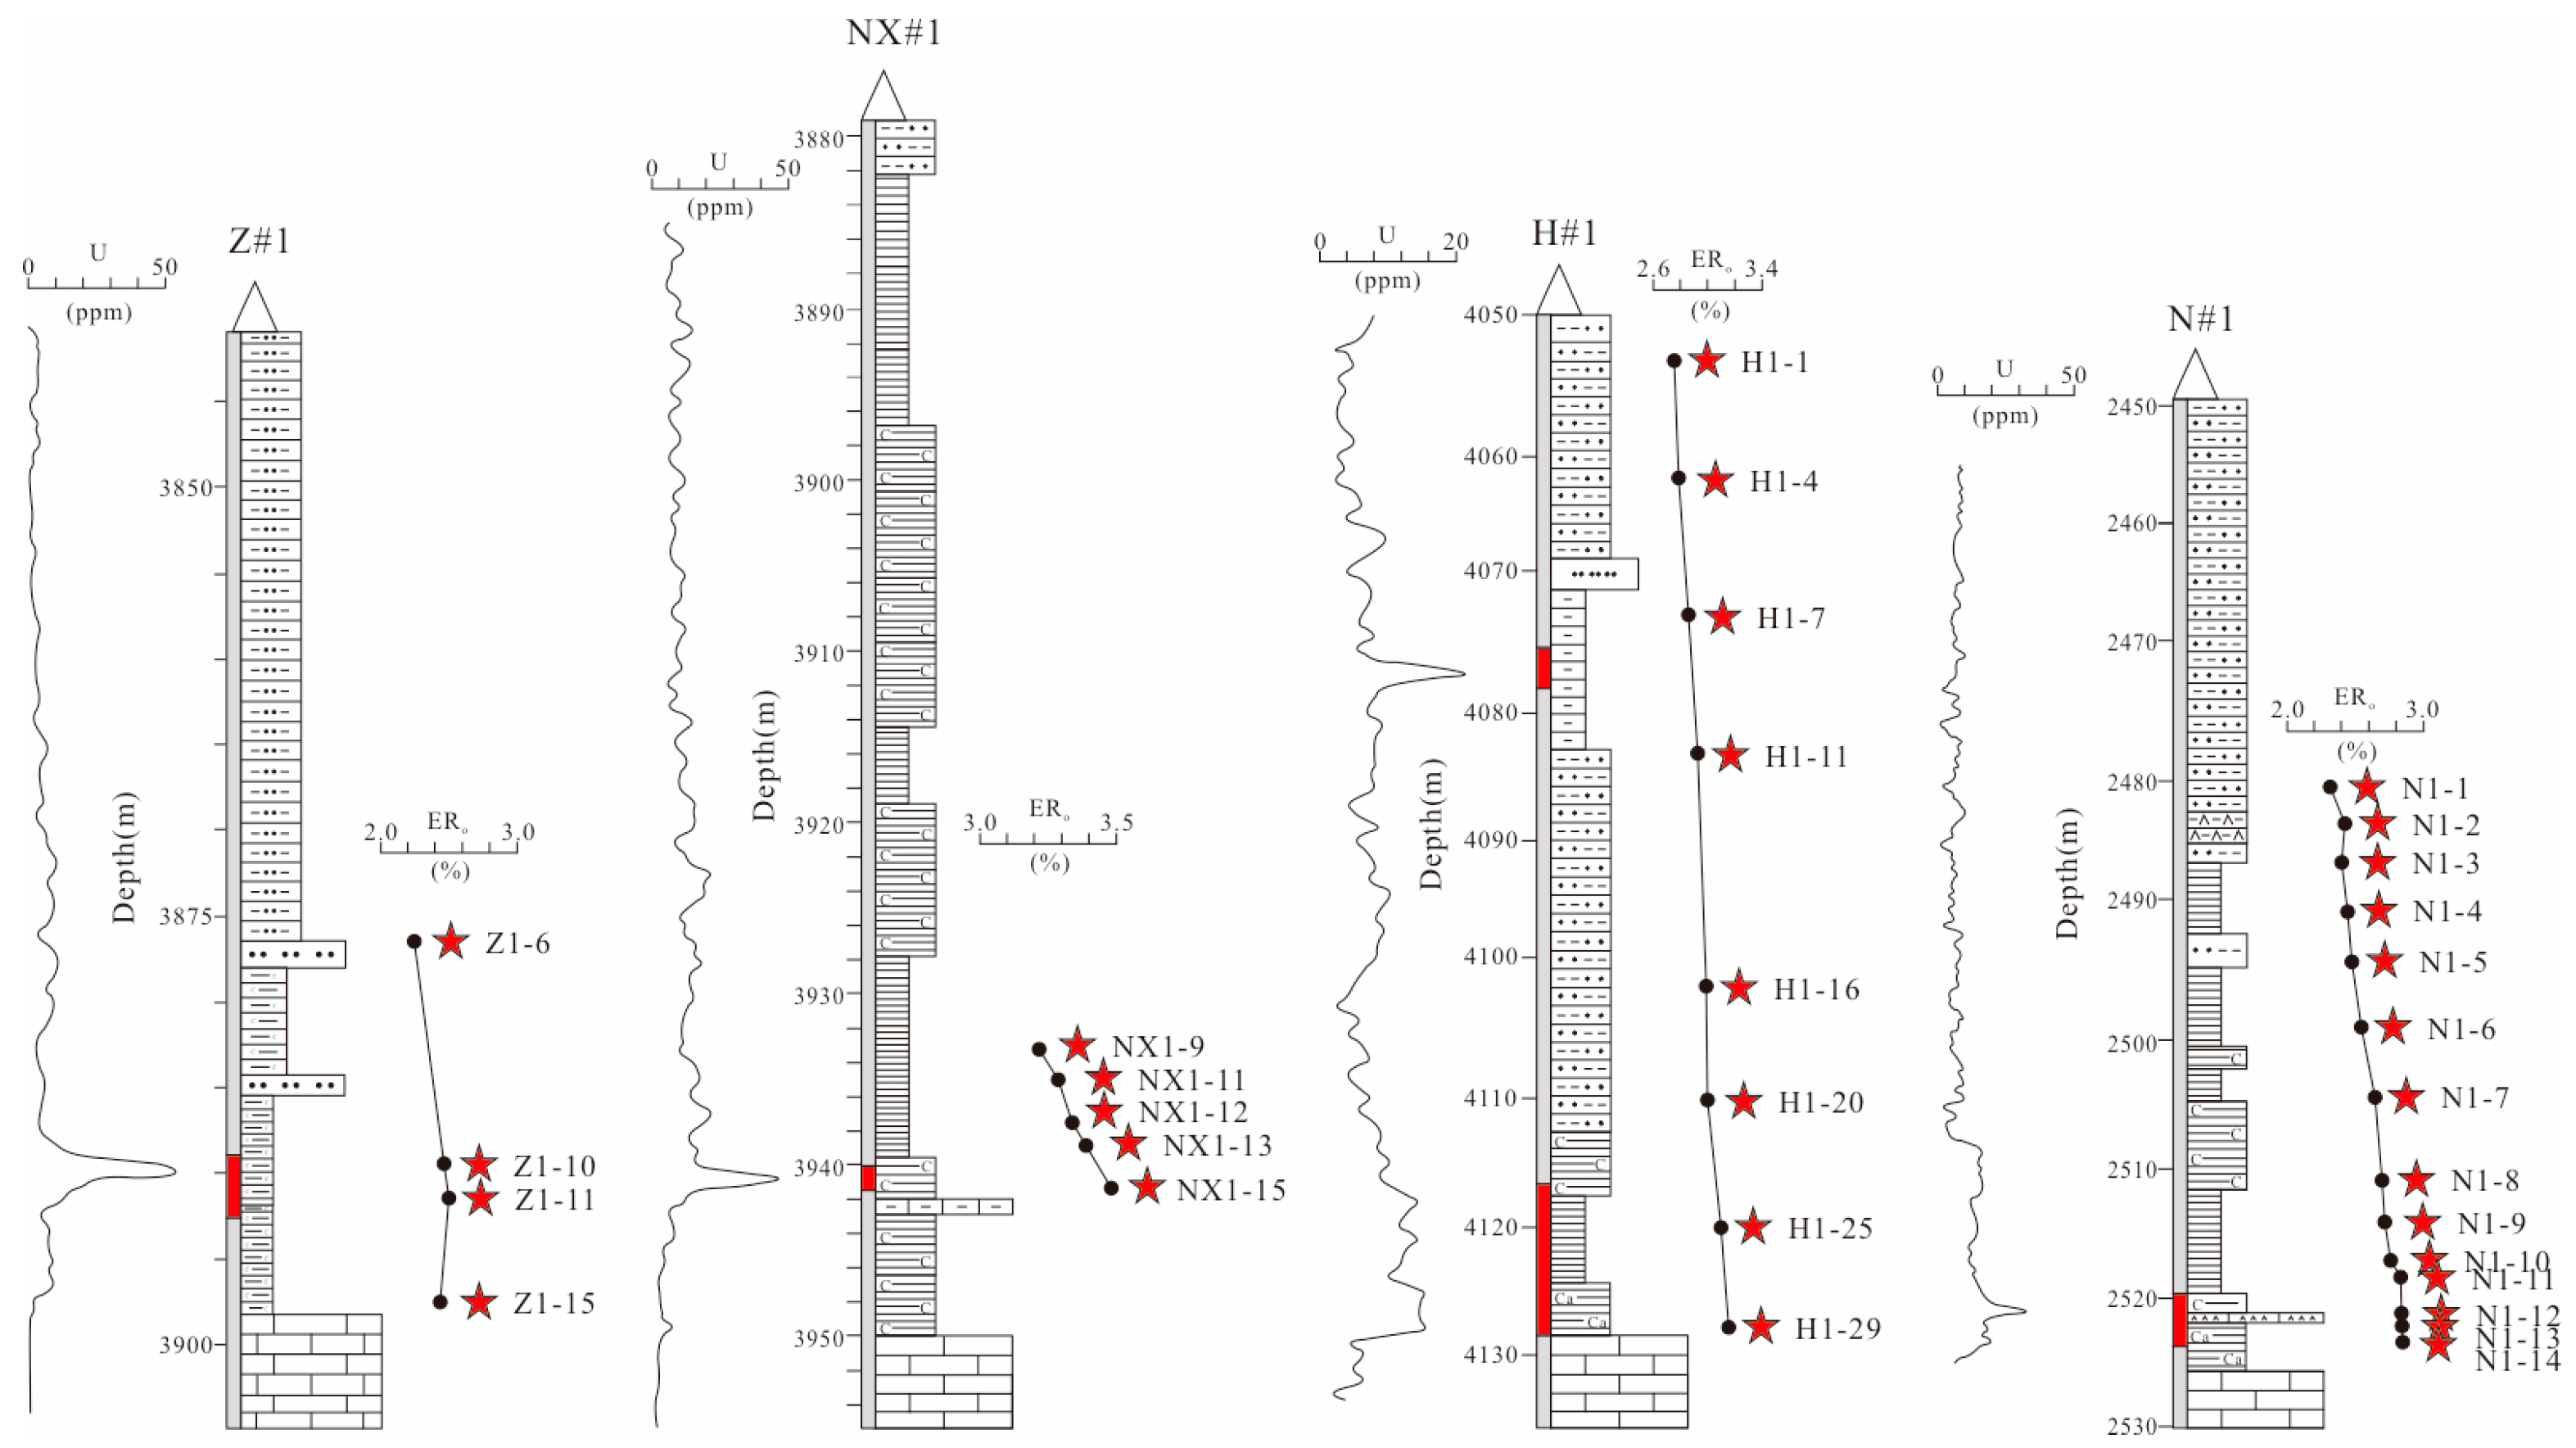
Due to the absence of terrestrial higher plants and vitrinite macerals in the Wufeng–Longmaxi shale, solid bitumen reflectance (BRo) was measured and converted to equivalent vitrinite reflectance (ERo) to assess thermal maturity. The measured ERo values range from 2.16% to 3.48%, with an average of 2.75%, confirming that all samples are in the overmature stage. As the present sampling depth does not represent the maximum burial depth in geological history, samples from individual wells were used to evaluate the relationship between ERo and burial depth. Although ERo generally increases with depth, the strength of this correlation varies among wells (Figure 9), reflecting the dominant influence of normal burial thermal evolution. Notably, ERo is significantly elevated in uranium-rich samples, suggesting that uranium enrichment may enhance OM thermal maturation (Figure 10).
To minimize the influence of burial depth, samples from the same core—including uranium-rich intervals and their adjacent non-uranium-rich roof or floor strata—were compared. Under these conditions, burial depth effects can be considered negligible. A comparison reveals that uranium-rich shales have ERo values that are 0.11%–0.17% higher than those of non-uranium-rich samples. This increase accounts for 3.64%–6.47% of the average ERo of the non-uranium-rich samples, indicating a measurable enhancing effect of uranium on thermal maturity.
Shales in uranium-rich intervals exhibit significantly higher ERo, particularly in thick strata with anomalously high uranium concentrations. For instance, in well Z#1, uranium-rich samples (e.g., Z1-10 and Z1-11) yield ERo values between 2.43% and 2.51%, whereas non-uranium-rich samples range from 2.25% to 2.39%. It also should be noted that the correlation between ERo and burial depth varies among wells (Figure 9). A very strong positive correlation (R2 = 0.99, 0.98 and 0.99, respectively) is observed in wells H#1, N#1 and NX#1, suggesting that burial depth exerts a more dominant control on ERo than uranium enrichment in these cases. In contrast, well Z#1 exhibits only a weak positive correlation between ERo and burial depth (Figure 9d), implying that uranium abundance may be a more influential factor in altering thermal maturity. Furthermore, ERo shows a positive correlation with uranium content and a negative correlation with distance to the nearest uranium-rich shale layer (Figure 10). Taken together, these results support the interpretation that uranium enrichment enhances thermal maturation.
In intervals adjacent to uranium-rich zones, anomalously high ERo values are consistently observed. Furthermore, shale samples from wells in the southwestern Sichuan Basin exhibit significantly higher ERo values compared to those from other regions (Figure 11), suggesting the involvement of additional maturity-enhancing factors. Li et al. [55] demonstrated that the Emeishan basalt significantly promotes thermal maturation in adjacent strata, with the Emeishan mantle plume exerting a strong thermal influence on shale maturity within a radius of approximately 200 km. This regional thermal effect provides a plausible explanation for the elevated ERo values observed near the Emeishan basalts. Therefore, thermal maturity of the studied samples appears to be influenced by three principal factors: the Emeishan basalt, burial depth, and uranium enrichment. In the southwestern Sichuan Basin, the Emeishan basalt likely plays a dominant role in enhancing thermal maturity. In other regions, burial depth and uranium enrichment appear to be the primary controlling factors.

5.3. Geological Significance

The findings presented above demonstrate that uranium enrichment is the principal factor controlling the occurrence of high-GR anomalies. Elevated uranium concentrations in the Wufeng–Longmaxi shale result from a combination of reducing depositional conditions, adsorption or complexation with algal OM, and volcanic inputs (Figure 8, Figure 10 and Figure 11). Large-scale volcanism may have contributed to climate warming and glacial melting, leading to sea-level rise and enhanced bottom-water reductivity.

5.3.1. Implications for Shale Gas Exploration

Analysis of uranium distribution indicates that uranium-rich intervals are predominantly concentrated at the top of the Wufeng Formation and the base of the Longmaxi Formation—corresponding to the primary sweet spots for current shale gas exploration. This spatial correspondence suggests a strong genetic link between uranium enrichment and high-quality reservoir intervals.
Sweet spots in the Wufeng–Longmaxi shale are generally defined by high TOC content (>3.0%), high brittle mineral content (quartz > 40%), and high gas content (>3 m3/t) [56]. High TOC content reflects elevated paleoproductivity, evidenced by abundant graptolites and phytoplankton. The decay of these organisms consumed dissolved oxygen in pore waters, strengthening reducing conditions and promoting organic matter preservation [57].
Extensive studies suggested that uranium’s inherent radioactivity can also promote biological productivity [58,59]. Studies in radiological biology have shown that low-level uranium radiation can stimulate organism growth in both abundance and size [60,61]. Similarly, Lin et al. [62] proposed that uranium radiation contributed to abnormal biological growth and a Cambrian biological explosion in the Niutitang shale.
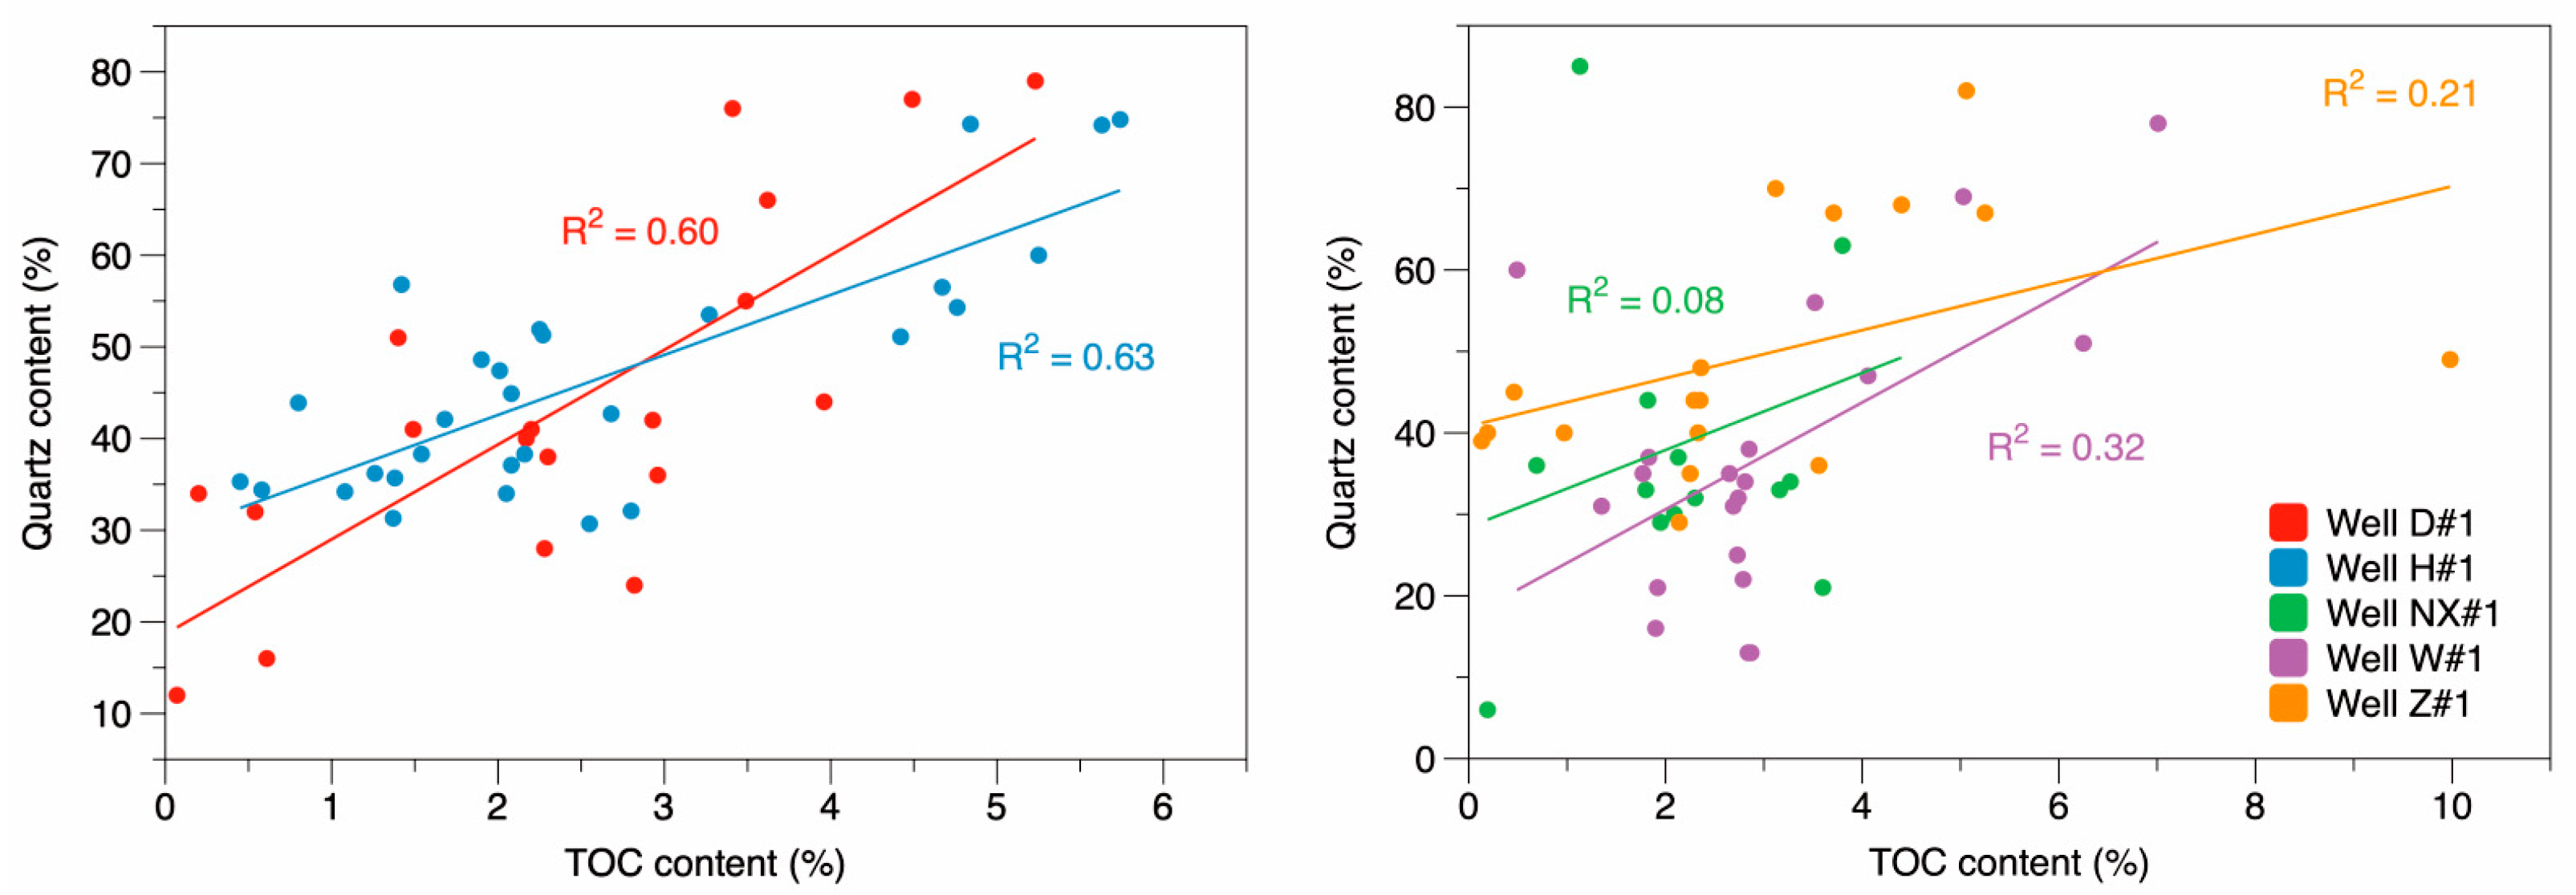
Silica in shales may originate from terrigenous, hydrothermal, or biogenic sources [63]. A positive correlation between TOC and quartz content in some wells (e.g., H#1 and D#1; Figure 12) suggests a significant biogenic silica contribution [64,65,66]. However, this correlation is weak or absent in other wells (e.g., Z#1, W#1, and NX#1; Figure 12), indicating variable silica origins.
To quantitatively assess non-detrital silica, excess silicon (Siₑₓ) was calculated using the formula:
Siex = Sis − [(Si/Al)PAAS × Als]
where Sis and Als represent sample silicon and aluminum contents, and (Si/Al)PAAS is taken as 3.32 [25]. In well H#1, uranium-rich samples yield Siₑₓ values of 6.38%–26.74% (avg. 13.91%), significantly higher than non-uranium-rich samples (0.13%–8.43%, avg. 4.42%), indicating a strong association between uranium enrichment and biogenic/hydrothermal silica precipitation.

5.3.2. Stratigraphic Division

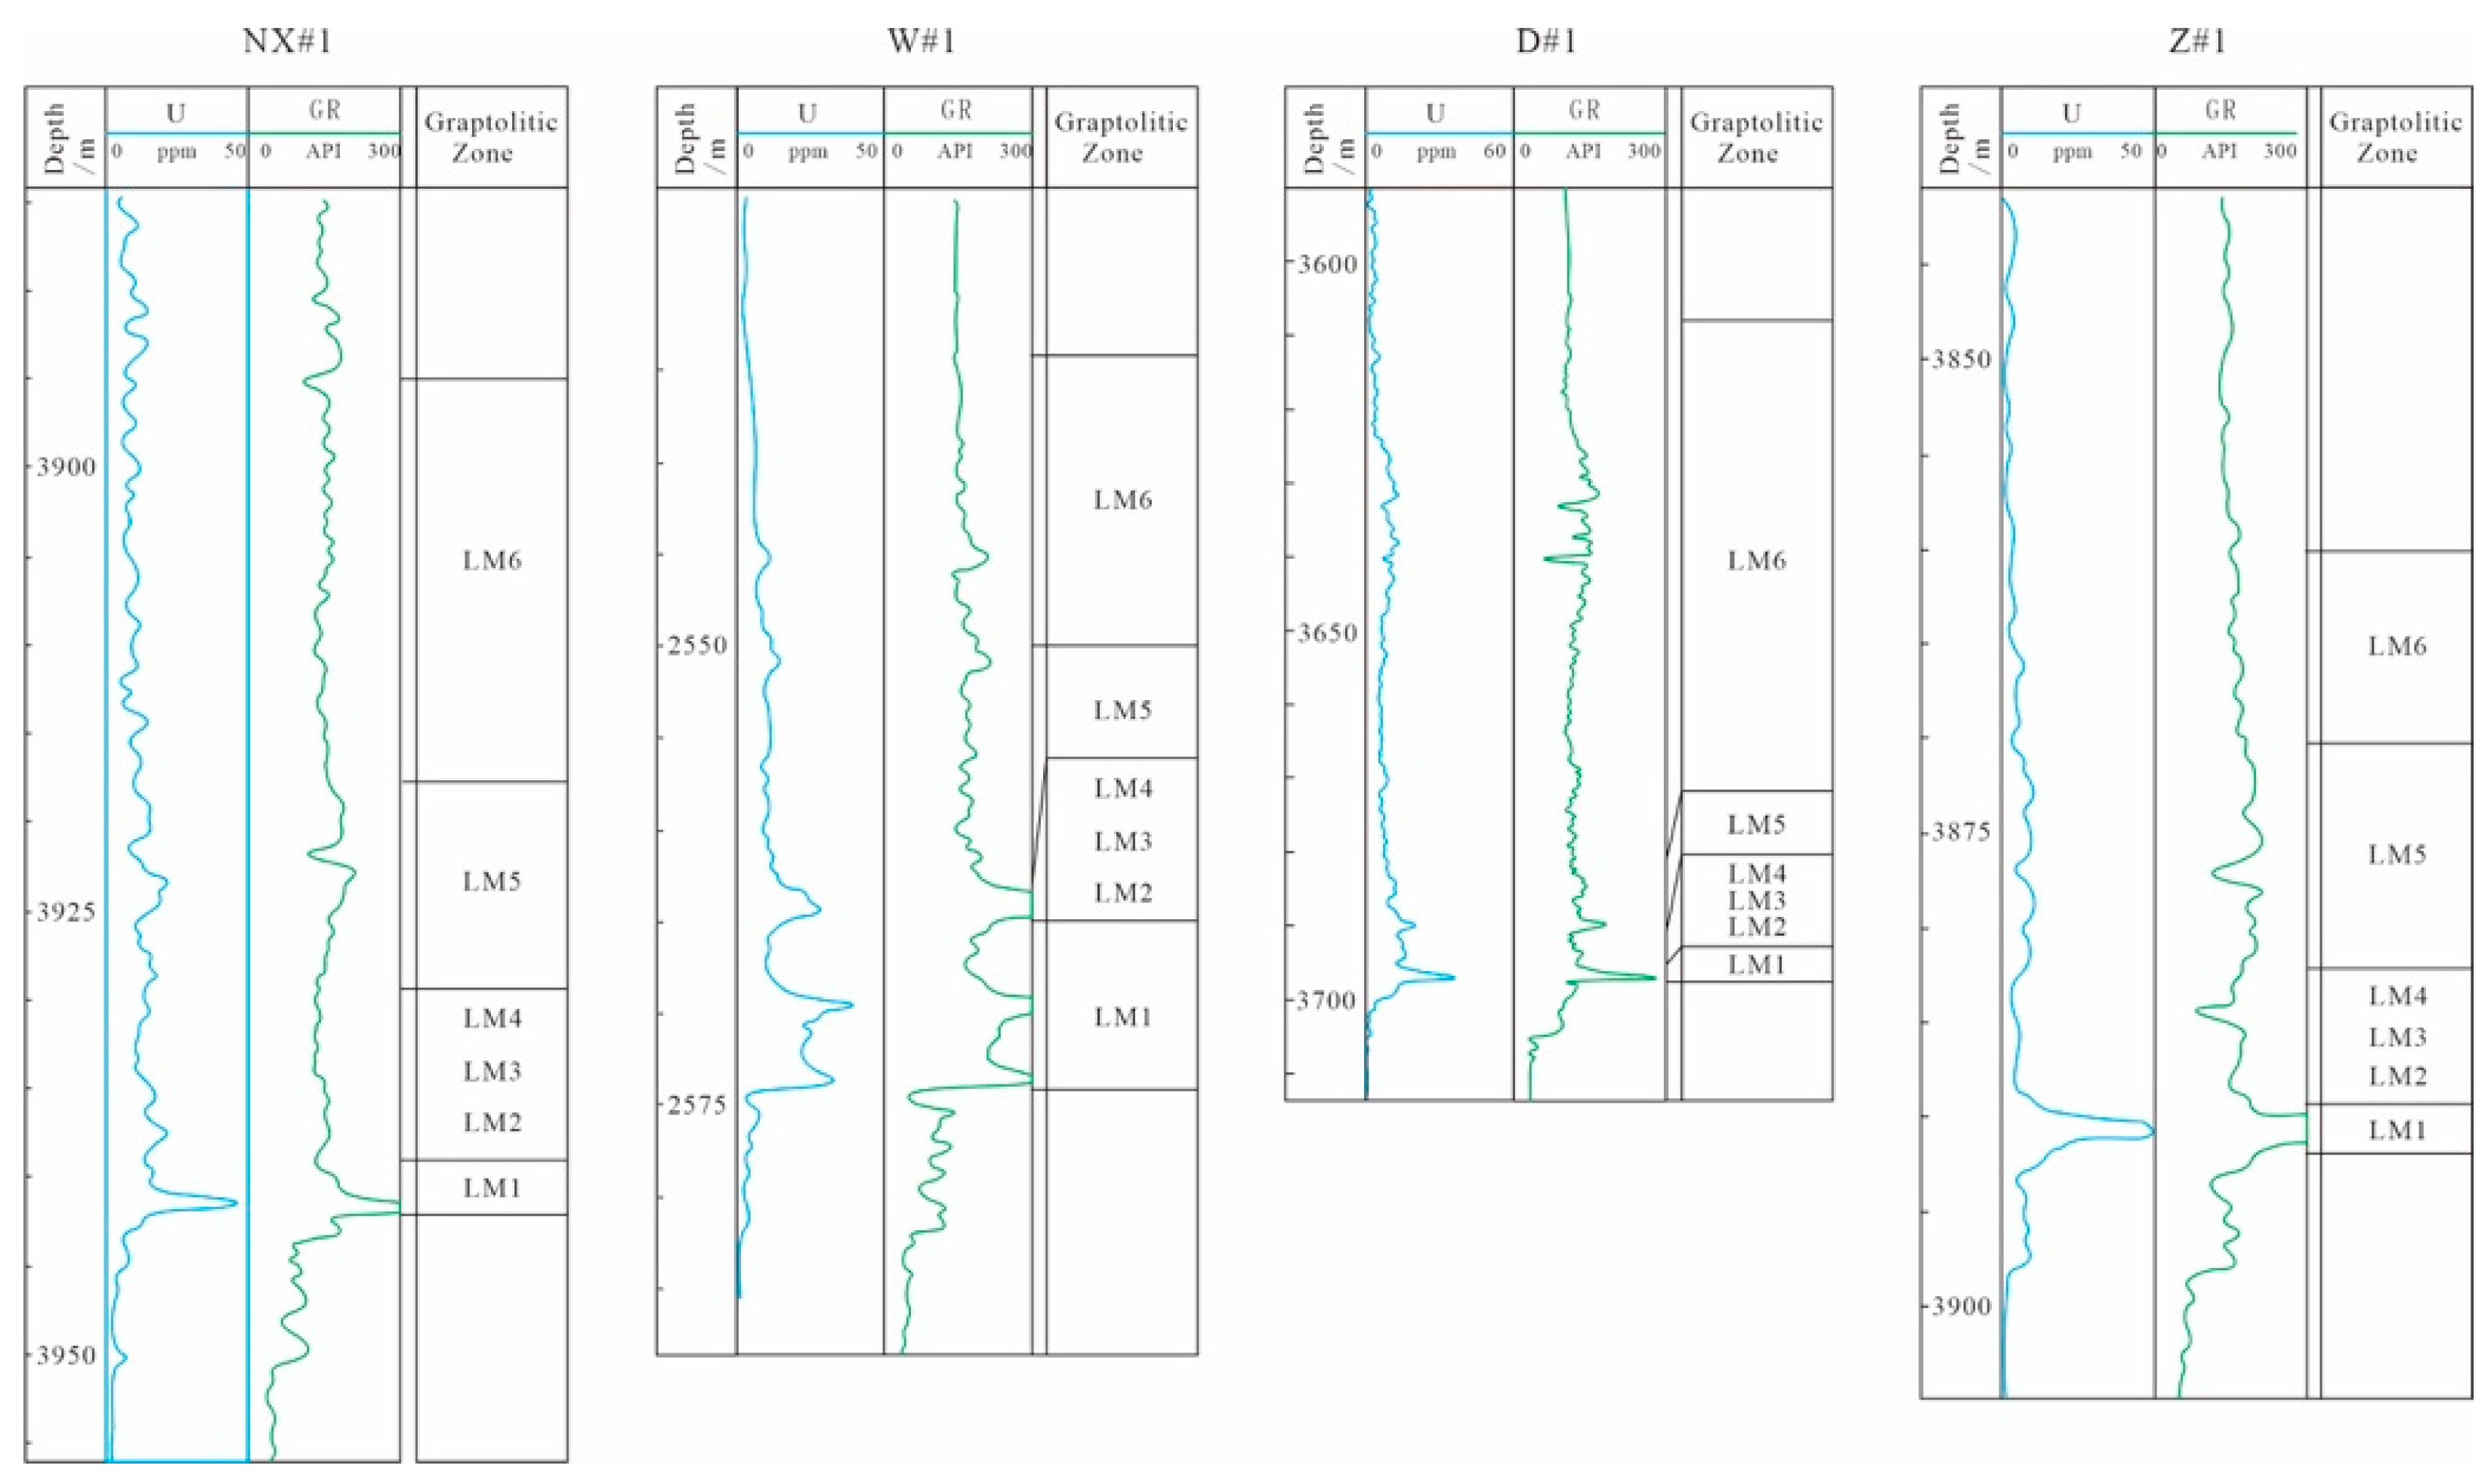
Uranium anomalies are widely distributed in the Wufeng–Longmaxi shales and correspond closely to high-GR log responses [67]. Biostratigraphic data indicate that the lowest uranium peak coincides with the LM1 graptolite zone, confirming the synchronicity of uranium enrichment and the deposition of the LM1 interval (Figure 13). Sequence stratigraphic subdivision in fine-grained shales is often challenging due to lithological homogeneity [68,69,70,71]; however, uranium enrichment offers a valuable chemostratigraphic marker for regional correlation. This uranium enrichment event shows good reproducibility across the Sichuan Basin, being identified in multiple wells from both deep-water shelf and shallow shelf settings. While local variations in U peak thickness and intensity occur due to differences in depositional rate and redox conditions, the stratigraphic position of the main U enrichment zone relative to biostratigraphic markers remains consistent. Previous studies have constrained the age of the lowest U peak to approximately 443.83 ± 1 Ma [3]. Thus, uranium enrichment provides a practical tool for stratigraphic division, serving as a useful alternative to more complex tuff-bed dating methods.

6. Conclusions

This study investigates the distribution and enrichment mechanisms of uranium in the Wufeng–Longmaxi shales through an integrated analysis of geochemical and geophysical data, including spectral logging and laboratory measurements. The main conclusions are as follows:
(1)
One to three discrete uranium enrichment events are identified within the Wufeng–Longmaxi sequence. These high-uranium intervals correlate well with shale gas sweet spots, highlighting the value of uranium enrichment as a key indicator for sweet spot prediction.
(2)
The strong correlation between spectral uranium logs and gamma-ray (GR) curves confirms that uranium enrichment is the primary cause of high-GR anomalies. Uranium distribution is jointly controlled by reducing depositional conditions, volcanic activity (e.g., tuff layers), and organic matter type.
(3)
Uranium content (U content) shows a clear dependence on organic matter type, with algal fragments exhibiting a good positive correlation (R2 = 0.74), indicating their role as the main uranium host. Given the low uranium content in modern marine algae, uranium incorporation likely occurred during early diagenesis under favorable redox and porewater pH conditions.
(4)
All studied samples are overmature, with equivalent vitrinite reflectance (ERo) generally increasing with burial depth. However, ERo values in uranium-rich shales are 0.11%–0.17% higher than in non-uranium-rich shales, suggesting that uranium enrichment may have a slight enhancing effect on thermal maturity.
(5)
Uranium enrichment provides a practical chemostratigraphic marker for regional correlation and dating of marine shales, offering a simpler alternative to complex tuff-bed dating methods.

Author Contributions

Conceptualization, K.J. and G.X.; methodology, G.X., Y.Y. and J.W. (Jiayu Wang); software, G.X.; validation, B.D. and J.W. (Juan Wu); formal analysis, G.X.; investigation, G.X. and X.F.; resources, Y.Y.; data curation, Y.Y.; writing—original draft preparation, G.X.; writing—review and editing, K.J.; visualization, G.X. and K.J.; supervision, S.L.; project administration, S.L.; funding acquisition, K.J. and G.X. All authors have read and agreed to the published version of the manuscript.

Funding

This research was jointly funded by National Natural Science Foundation of China (42372174 and 42207293), Natural Science Foundation of Sichuan Province (2023NSFSC0262 and 2025ZNSFSC0310). Anhui Province’s College Science and Engineering Teachers’ Internship Program in Enterprises (2024jsqygz103), Anhui Province University Young and Middle aged Teacher Training Project (YQYB2024072), and State Key Laboratory of Oil and Gas Reservoir Geology and Exploitation (CDUT-PLC2024011).

Data Availability Statement

Data is contained within the article. The original contributions presented in this study are included in the article. Further inquiries can be directed to the corresponding author.

Acknowledgments

The authors gratefully acknowledge Chunming Li from the South China University of Technology for his assistance with FE-SEM analysis.

Conflicts of Interest

Author Jiayu Wang was employed by the company Anda Qingxin Oilfield Development Co., Ltd. The remaining authors declare that the research was conducted in the absence of any commercial or financial relationships that could be construed as a potential conflict of interest.

References

  1. Cuney, M. Evolution of uranium fractionation processes through time: Driving the secular variation of uranium deposit types. Econ. Geol. 2010, 105, 553–569. [Google Scholar] [CrossRef]
  2. Wang, W.J.; Chen, J.W.; Feng, X.L.; Ge, X.Y.; Zhang, Y.G.; Liang, J.; Xu, L. Sedimentary environment and organic matter enrichment mechanism of the Silurian Gaojiabian black shales in the Lower Yangtze Region, South China. Minerals 2025, 15, 204. [Google Scholar] [CrossRef]
  3. Wang, G.P.; Jin, Z.J.; Liu, G.X.; Liu, Q.Y.; Liu, Z.B.; Wang, H.L.; Liang, X.P.; Jiang, T.; Wang, R.Y. Geological implications of gamma ray (GR) anomalies in marine shales: A case study of the Ordovician-Silurian Wufeng-Longmaxi succession in the Sichuan Basin and its periphery, Southwest China. J. Asian Earth Sci. 2020, 199, 104359. [Google Scholar] [CrossRef]
  4. Yang, S.C.; Hu, W.X.; Fan, J.X.; Deng, Y.Y. New geochemical identification fingerprints of volcanism during the Ordovician-Silurian transition and its implications for biological and environmental evolution. Earth Sci. Rev. 2022, 228, 104016. [Google Scholar] [CrossRef]
  5. Zhang, L.C.; Xiao, D.S.; Lu, S.F.; Jiang, S.; Lu, S.D. Effect of sedimentary environment on the formation of organic-rich marine shale: Insights from major/trace elements and shale composition. Int. J. Coal Geol. 2019, 204, 34–50. [Google Scholar] [CrossRef]
  6. Xie, G.L.; Liu, S.G.; Xia, G.D.; Hao, W.D. Mineralogy and geochemical investigation of Cambrian and Ordovician-Silurian shales in South China: Implication for potential environment pollutions. Geol. J. 2020, 55, 477–500. [Google Scholar] [CrossRef]
  7. Ma, X.H.; Xie, J.; Yong, R. Geological characteristics and high production control factors of shale gas in Silurian Longmaxi Formation, southern Sichuan Basin, SW China. Pet. Explor. Dev. 2020, 47, 901–915. [Google Scholar] [CrossRef]
  8. Fertl, W.H.; Chilingar, G.V. Total organic carbon content determined from well logs. SPE Form. Eval. 1988, 3, 407–419. [Google Scholar] [CrossRef]
  9. Lecomte, A.; Cathelineau, M.; Michels, R.; Peiffert, C.; Brouand, M. Uranium mineralization in the Alum Shale Formation (Sweden): Evolution of a U-rich marine black shale from sedimentation to metamorphism. Ore Geol. Rev. 2017, 88, 71–78. [Google Scholar] [CrossRef]
  10. Swanson, V.E. Geology and geochemistry of uranium in marine black shales: A review. In USGS Professional Paper; U.S. Government Printing Office: Washington, DC, USA, 1961; Volume 356, pp. 67–112. [Google Scholar]
  11. Klinkhammer, G.P.; Palmer, M.R. Uranium in the oceans: Where it goes and why. Geochim. Cosmochim. Acta 1991, 55, 1799–1806. [Google Scholar] [CrossRef]
  12. Vail, P.R.; Audemard, F.; Bowman, S. The stratigraphic signatures of tectonics, eustasy and sedimentology: Cycles and events in stratigraphy. AAPG Bull. 1991, 11, 617–659. [Google Scholar]
  13. Passey, Q.R.; Bohacs, K.M.; Esch, W.L.; Klimentidis, R.; Sinha, S. From oil-prone source rock to gas-producing shale reservoir-geologic and petrophysical characterization of unconventional shale-gas reservoirs. In Proceedings of the Chinese Petroleum Society/SPE International Oil and Gas Conference and Exhibition in China, Beijing, China, 8–10 June 2010. [Google Scholar] [CrossRef]
  14. Lüning, S.; Kolonic, S. Uranium spectral gamma-ray response as a proxy for organic richness in black shales: Applicability and limitations. J. Pet. Geol. 2003, 26, 153–174. [Google Scholar] [CrossRef]
  15. Jiao, K.; Ye, Y.H.; Liu, S.G.; Ran, B.; Deng, B.; Li, Z.W.; Li, J.X.; Yong, Z.Q.; Sun, W. Characterization and evolution of nanoporosity in superdeeply buried shales: A case study of the Longmaxi and Qiongzhusi Shales from MS Well #1, North Sichuan Basin, China. Energy Fuels 2018, 32, 191–203. [Google Scholar] [CrossRef]
  16. Guo, T.L.; Zhang, H.R. Formation and enrichment mode of Jiaoshiba shale gas field, Sichuan Basin. Pet. Explor. Dev. 2014, 41, 31–40. [Google Scholar] [CrossRef]
  17. Chen, X.; Rong, J.; Li, Y.; Boucot, A. Facies patterns and geography of the Yangtze region, South China, through the Ordovician and Silurian transition. Palaeogeogr. Palaeoclimatol. Palaeoecol. 2004, 204, 353–372. [Google Scholar] [CrossRef]
  18. Chen, X.; Fan, J.X.; Melchin, M.J.; Mitchell, C.E. Hirnantian (Latest Ordovician) graptolites from the upper Yangtze region, China. Palaeontology 2005, 48, 235–280. [Google Scholar] [CrossRef]
  19. Liu, S.G.; Ma, W.X.; Jansa, L.; Huang, W.M.; Zeng, X.L.; Zhang, C.J. Characteristics of the shale gas reservoir rocks in the Lower Silurian Longmaxi Formation, East Sichuan Basin, China. Energ. Explor. Exploit. 2013, 31, 187–219. [Google Scholar] [CrossRef]
  20. Ye, Y.H.; Liu, S.G.; Ran, B.; Luba, J.; Wang, S.Y.; Sun, W.; Yang, D.; Luo, C. Characteristics of black shale in the Upper Ordovician Wufeng and Lower Silurian Longmaxi Formations in the Sichuan Basin and its periphery, China. Aust. J. Earth Sci. 2017, 64, 667–687. [Google Scholar] [CrossRef]
  21. Borjigin, T.; Shen, B.J.; Yu, L.J.; Yang, Y.F.; Zhang, W.T.; Tao, C.; Xi, B.B.; Zhang, Q.Z.; Bao, F.; Qin, J.Z. Mechanisms of shale gas generation and accumulation in the Ordovician Wufeng-Longmaxi Formation, Sichuan basin, SW China. Pet. Explor. Dev. 2017, 44, 69–78. [Google Scholar] [CrossRef]
  22. Ye, Y.H. Formation Mechanism of Shale Reservoir in Wufeng-Longmaxi Formation in Sichuan Basin. Ph.D. Thesis, Chengdu University of Technology, Chengdu, China, 2018. [Google Scholar]
  23. SY/T 5124-2012; Method of Determining Microscopically the Reflectance of Vitrinite in Sedimentary. National Energy Administration: Beijing, China, 2012.
  24. Feng, G.X. Relationship between the reflectance of bitumen and vitrinite in rock. Nat. Gas Ind. 1988, 8, 20–25. [Google Scholar]
  25. Xie, G.L.; Shen, Y.L.; Liu, S.G.; Hao, W.D. Trace and rare earth element (REE) characteristics of mudstones from Eocene Pinghu Formation and Oligocene Huagang Formation in Xihu Sag, East China Sea Basin: Implications for provenance, depositional conditions and paleoclimate. Mar. Pet. Geol. 2018, 92, 20–36. [Google Scholar] [CrossRef]
  26. Mastalerz, M.; Drobniak, A.; Stankiewicz, A.B. Origin, properties, and implications of solid bitumen in source-rock reservoirs: A review. Int. J. Coal Geol. 2018, 195, 14–36. [Google Scholar] [CrossRef]
  27. Zhang, W.T.; Hu, W.X.; Borjigin, T.; Zhu, F. Pore characteristics of different organic matter in black shale: A case study of the Wufeng-Longmaxi Formation in the Southeast Sichuan Basin, China. Mar. Pet. Geol. 2020, 111, 33–43. [Google Scholar] [CrossRef]
  28. Liu, B.; Mastalerz, M.; Schiber, J. SEM petrography of dispersed organic matter in black shales: A review. Earth Sci. Rev. 2022, 224, 103874. [Google Scholar] [CrossRef]
  29. Nie, H.K.; Jin, Z.J.; Zhang, J.C. Characteristics of three organic matter pore types in the Wufeng-Longmaxi Shale of the Sichuan Basin, Southwest China. Sci. Rep. 2018, 8, 7014. [Google Scholar] [CrossRef]
  30. Loucks, R.G.; Reed, R.M. Scanning-Electron-Microscope petrographic evidence for distinguishing organic-matter pores associated with depositional organic matter versus migrated organic matter in mudrocks. In Proceedings of the Gulf Coast Association of Geological Societies and the Gulf Coast Section of SEPM 64th Annual Convention, Lafayette, LA, USA, 5–7 October 2014. [Google Scholar]
  31. Wu, L.L.; Liu, S.F.; Fang, X.Y.; Wang, P.F.; Geng, A.S. Formation of pyrobitumen from different types of crude oils and its significance: Insight from elemental composition analysis. Mar. Pet. Geol. 2023, 152, 106277. [Google Scholar] [CrossRef]
  32. Loucks, R.G.; Reed, R.M.; Rippel, S.C.; Hammes, U. Spectrum of Pore Types and Networks in Mudrocks and a Descriptive Classification for Matrix-Related Mudrock Pores. AAPG Bull. 2012, 96, 1071–1098. [Google Scholar] [CrossRef]
  33. Ganai, J.A.; Rashid, S.A.; Romshoo, S.A. Evaluation of terrigenous input, diagenetic alteration and depositional conditions of Lower Carboniferous carbonates of Tethys Himalaya, India. Solid. Earth. Sci. 2018, 3, 33–49. [Google Scholar] [CrossRef]
  34. Parnell, J. The distribution of uranium in kolm: Evidence from backscattered electron imagery. Geol. Fören. Stockh. Förh 1984, 106, 231–234. [Google Scholar] [CrossRef]
  35. Gothmann, A.M.; Higgins, J.A.; Adkins, J.F.; Broecker, W.; Farley, K.A.; McKeon, R.; Stolarski, J.; Planavsky, N.; Wang, X.; Bender, M.L. A Cenozoic record of seawater uranium in fossil corals. Geochim. Cosmochim. Acta 2019, 250, 173–190. [Google Scholar] [CrossRef]
  36. Dai, S.; Ren, D.; Zhou, Y.; Chou, C.L.; Wang, X.; Zhao, L.; Zhu, X. Mineralogy and geochemistry of a super high-organic-sulfur coal, Yanshan Coalfield, Yunnan, China: Evidence for a volcanic ash component and influence by submarine exhalation. Chem. Geol. 2008, 255, 182–194. [Google Scholar] [CrossRef]
  37. Dai, S.; Yang, J.; Ward, C.R.; Hower, J.C.; Liu, H.; Garrison, T.M.; French, D.; O’Keefe, J.M. Geochemical and mineralogical evidence for a coal-hosted uranium deposit in the Yili Basin, Xinjiang, northwestern China. Ore Geol. Rev. 2015, 70, 1–30. [Google Scholar] [CrossRef]
  38. Liu, B.; Mastalerz, M.; Schieber, J.; Teng, J. Association of uranium with macerals in marine black shales: Insights from the Upper Devonian New Albany Shale, Illinois Basin. Int. J. Coal Geol. 2020, 217, 103351. [Google Scholar] [CrossRef]
  39. Milliken, K.L.; Ko, L.T.; Pommer, M.; Marsaglia, K.M. SEM petrography of eastern Mediterranean sapropels: Analogue data for assessing organic matter in oil and gas shales. J. Sediment. Res. 2014, 84, 961–974. [Google Scholar] [CrossRef]
  40. Hackley, P.C.; Valentine, B.J.; Hatcherian, J.J. On the petrographic distinction of bituminite from solid bitumen in immature to early mature source rocks. Int. J. Coal Geol. 2018, 196, 232–245. [Google Scholar] [CrossRef]
  41. İnan, T.; Al-Hajji, A.; Koseoglu, O.R. Chemometrics-based analytical method using FTIR spectroscopic data to predict diesel and diesel/diesel blend properties. Energy Fuels 2016, 30, 5525–5536. [Google Scholar] [CrossRef]
  42. Morga, R.; Pawlyta, M. Microstructure of graptolite periderm in Silurian gas shales of Northern Poland. Int. J. Coal Geol. 2018, 189, 1–7. [Google Scholar] [CrossRef]
  43. Langmuir, D. Uranium solution-mineral equilibria at low temperatures with ap-plications to sedimentary ore deposits. Geochim. Cosmochim. Acta 1978, 42, 547–569. [Google Scholar] [CrossRef]
  44. Anderson, R.F.; Fleisher, M.Q.; LeHuray, A.P. Concentration, oxidation state, and particulate flux of uranium in the Black Sea. Geochim. Cosmochim. Acta 1989, 53, 2215–2224. [Google Scholar] [CrossRef]
  45. Cumberland, S.A.; Douglas, G.; Grice, K.; Moreau, J.W. Uranium mobility in organic matter-rich sediments: A review of geological and geochemical processes. Earth Sci. Rev. 2022, 159, 160–185. [Google Scholar] [CrossRef]
  46. Tang, Z.; Wei, F.; Song, J.; Gao, Y.; Duan, Y.; Xiang, C.; Gong, Z.; Zhu, F.; Su, Y.; Wang, J.; et al. Unraveling the influence of pH on uranium adsorption by polystyrene microplastics: An integrated experimental-density functional theory analysis. Chem. Eng. J. 2025, 506, 160233. [Google Scholar] [CrossRef]
  47. Ortaboy, S.; Atun, G. Kinetics and equilibrium modeling of uranium (VI) sorption by bituminous shale from aqueous solution. Ann. Nucl. Energy 2014, 73, 345–354. [Google Scholar] [CrossRef]
  48. Bachmaf, S.; Merkel, B.J. Sorption of uranium(VI) at the clay mineral-water interface. Environ. Earth Sci. 2011, 63, 925–934. [Google Scholar] [CrossRef]
  49. Zerbini, M.; Solari, P.L.; Orange, F.; Jeanson, A.; Leblanc, C.; Gomari, M.; Auwer, C.D.; Beccia, M.R. Exploring uranium bioaccumulation in the brown alga Ascophyllum nodosum: Insights from multi-scale spectroscopy and imaging. Sci. Rep. 2024, 14, 1021. [Google Scholar] [CrossRef] [PubMed]
  50. Cheng, Y.; Zhang, T.; Chen, S.; Li, F.; Qing, R.; Lan, T.; Yang, Y.; Liao, J.; Liu, N. Unusual uranium biomineralization induced by green algae: Behavior investigation and mechanism probe. J. Environ. Sci. 2023, 124, 915–922. [Google Scholar] [CrossRef]
  51. Miyake, Y.; Sugimura, Y.; Mayeda, M. The uranium content and the activity ratio 234U/238U in marine organisms and sea water in the western North Pacific. J. Oceanogr. Soc. Jpn. 1970, 26, 123–129. [Google Scholar] [CrossRef]
  52. Pacton, M.; Gorin, G.E.; Vasconcelos, C. Amorphous organic matter-Experimental data on formation and the role of microbes. Rev. Palaeobot. Palynol. 2011, 166, 253–267. [Google Scholar] [CrossRef]
  53. Kus, J.; Khanaqa, P.; Mohialdeen, I.M.J.; Kaufhold, S.; Babies, H.G.; Meßner, J.; Blumenberg, M. Solid bitumen, bituminite and thermal maturity of the Upper Jurassic-Lower Cretaceous Chia Gara Formation, Kirkuk Oil Field, Zagros Fold Belt, Kurdistan, Iraq. Int. J. Coal Geol. 2016, 165, 28–38. [Google Scholar] [CrossRef]
  54. Sleep, N.H. Hotspots and mantle plumes: Some phenomenology. J. Geophys. Res. Solid Earth 1990, 95, 6715–6736. [Google Scholar] [CrossRef]
  55. Li, Y.J.; Li, M.L.; Zhang, J.H.; Pang, Q.; Zou, C.; Shu, H.L.; Wang, G.X. Influence of the Emeishan basalt eruption on shale gas enrichment: A case study of shale from Wufeng-Longmaxi formations in northern Yunnan and Guizhou provinces. Fuel 2020, 282, 118835. [Google Scholar] [CrossRef]
  56. Qiu, Z.; Zou, C.N. Controlling factors on the formation and distribution of “sweet- spot areas” of marine gas shales in South China and a preliminary discussion on unconventional petroleum sedimentology. J. Asian Earth Sci. 2020, 194, 103989. [Google Scholar] [CrossRef]
  57. Halbach, M.; Koschinsky, A.; Halbach, P. Report on the discovery of gallionella ferruginea from an active hydrothermal field in the deep sea. Int. Ridge-Crest Res. 2001, 10, 18–20. [Google Scholar]
  58. Ryabokon, N.I.; Smolich, I.I.; Kudryashov, V.P.; Goncharova, R.I. Long-term development of the radionuclide exposure of murine rodent populations in Belarus after the Chernobyl accident. Radiat. Environ. Biophys. 2005, 44, 169–181. [Google Scholar] [CrossRef]
  59. Geras’kin, S.A.; Fesenko, S.V.; Alexakhin, R.M. Effects of non-human species irradiation after the Chernobyl NPP accident. Environ. Int. 2008, 34, 880–897. [Google Scholar] [CrossRef]
  60. Buesseler, K.; Aoyama, M.; Masao, F. Impacts of the Fukushima Nuclear Power Plants on Marine Radioactivity. Environ. Sci. Technol. 2011, 45, 9931–9935. [Google Scholar] [CrossRef]
  61. Cerne, M.; Smodis, B.; Strok, M.; Benedik, L. Radiation impact assessment on wildlife from an uranium mine area. Nucl. Eng. Des. 2012, 246, 203–209. [Google Scholar] [CrossRef]
  62. Lin, L.; Wang, P.; Rumble, D.; Pipke, J.L.; Boice, E.; Pratt, L.M.; Lollar, B.S.; Brodie, E.L.; Hazen, T.C.; Andersen, G.L.; et al. Long-term sustainability of a high-energy, low-diversity crustal biome. Science 2006, 314, 479–482. [Google Scholar] [CrossRef]
  63. Murray, R.W.; Jones, D.L.; Buchholtz Ten Brink, M.R.; Gerlach, D.C.; Russ, G.P. Rare earth, major, and trace elements in chert form the Franciscan complex and monterey group, California: Assessing REE sources to fine-grained marine sediments. Geochim. Cosmochim. Acta 1999, 55, 1875–1895. [Google Scholar] [CrossRef]
  64. Li, K.Q. The Origin and Significance of Quartz in Shales: A Case Study of Wufeng-Longmaxi Formations in the Sichuan Basin. Ph.D. Thesis, Lanzhou University, Lanzhou, China, 2018. [Google Scholar]
  65. Knapp, L.J.; Ardakani, O.H.; Uchida, S.; Nanjo, T.; Otomo, C.; Hattori, T. The influence of rigid matrix minerals on organic porosity and pore size in shale reservoirs: Upper Devonian Duvernay Formation, Alberta, Canada. Int. J. Coal Geol. 2020, 227, 103525. [Google Scholar] [CrossRef]
  66. Holdaway, H.K.; Clayton, C.J. Preservation of shell microstructure in silicified brachiopods from the upper cretaceous Wilmington sands of Devon. Geol. Mag. 1982, 119, 371–382. [Google Scholar] [CrossRef]
  67. Wang, Y.M.; Xu, S.; Hao, F.; Lu, Y.B.; Shu, Z.G.; Yan, D.T.; Lu, Y.C. Geochemical and petrographic characteristics of Wufeng-Longmaxi shales, Jiaoshiba area, south- west China: Implications for organic matter differential accumulation. Mar. Pet. Geol. 2019, 102, 138–154. [Google Scholar] [CrossRef]
  68. Catuneanu, O.; Zecchin, M. High-resolution sequence stratigraphy of clastic shelves II: Controls on sequence development. Mar. Pet. Geol. 2013, 39, 26–28. [Google Scholar] [CrossRef]
  69. Pszonka, J.; Götze, J. Quantitative estimate of interstitial clays in sandstones using Nomarski differential interference contrast (DIC) microscopy and image analysis. J. Pet. Sci. Eng. 2018, 161, 582–589. [Google Scholar] [CrossRef]
  70. Chen, L.; Jiang, Z.X.; Liu, Q.X.; Jiang, S.; Liu, K.Y.; Tan, J.Q.; Gao, F.L. Mechanism of shale gas occurrence: Insights from comparative study on pore structures of marine and lacustrine shales. Mar. Pet. Geol. 2019, 104, 200–216. [Google Scholar] [CrossRef]
  71. Wang, P.L.; Xiao, B.Q.; Gao, J.; Zhu, H.Z.; Liu, M.X.; Long, G.B.; Li, P.C. A novel fractal model for spontaneous imbibition in damaged tree-like branching networks. Fractals 2023, 31, 2350010. [Google Scholar] [CrossRef]
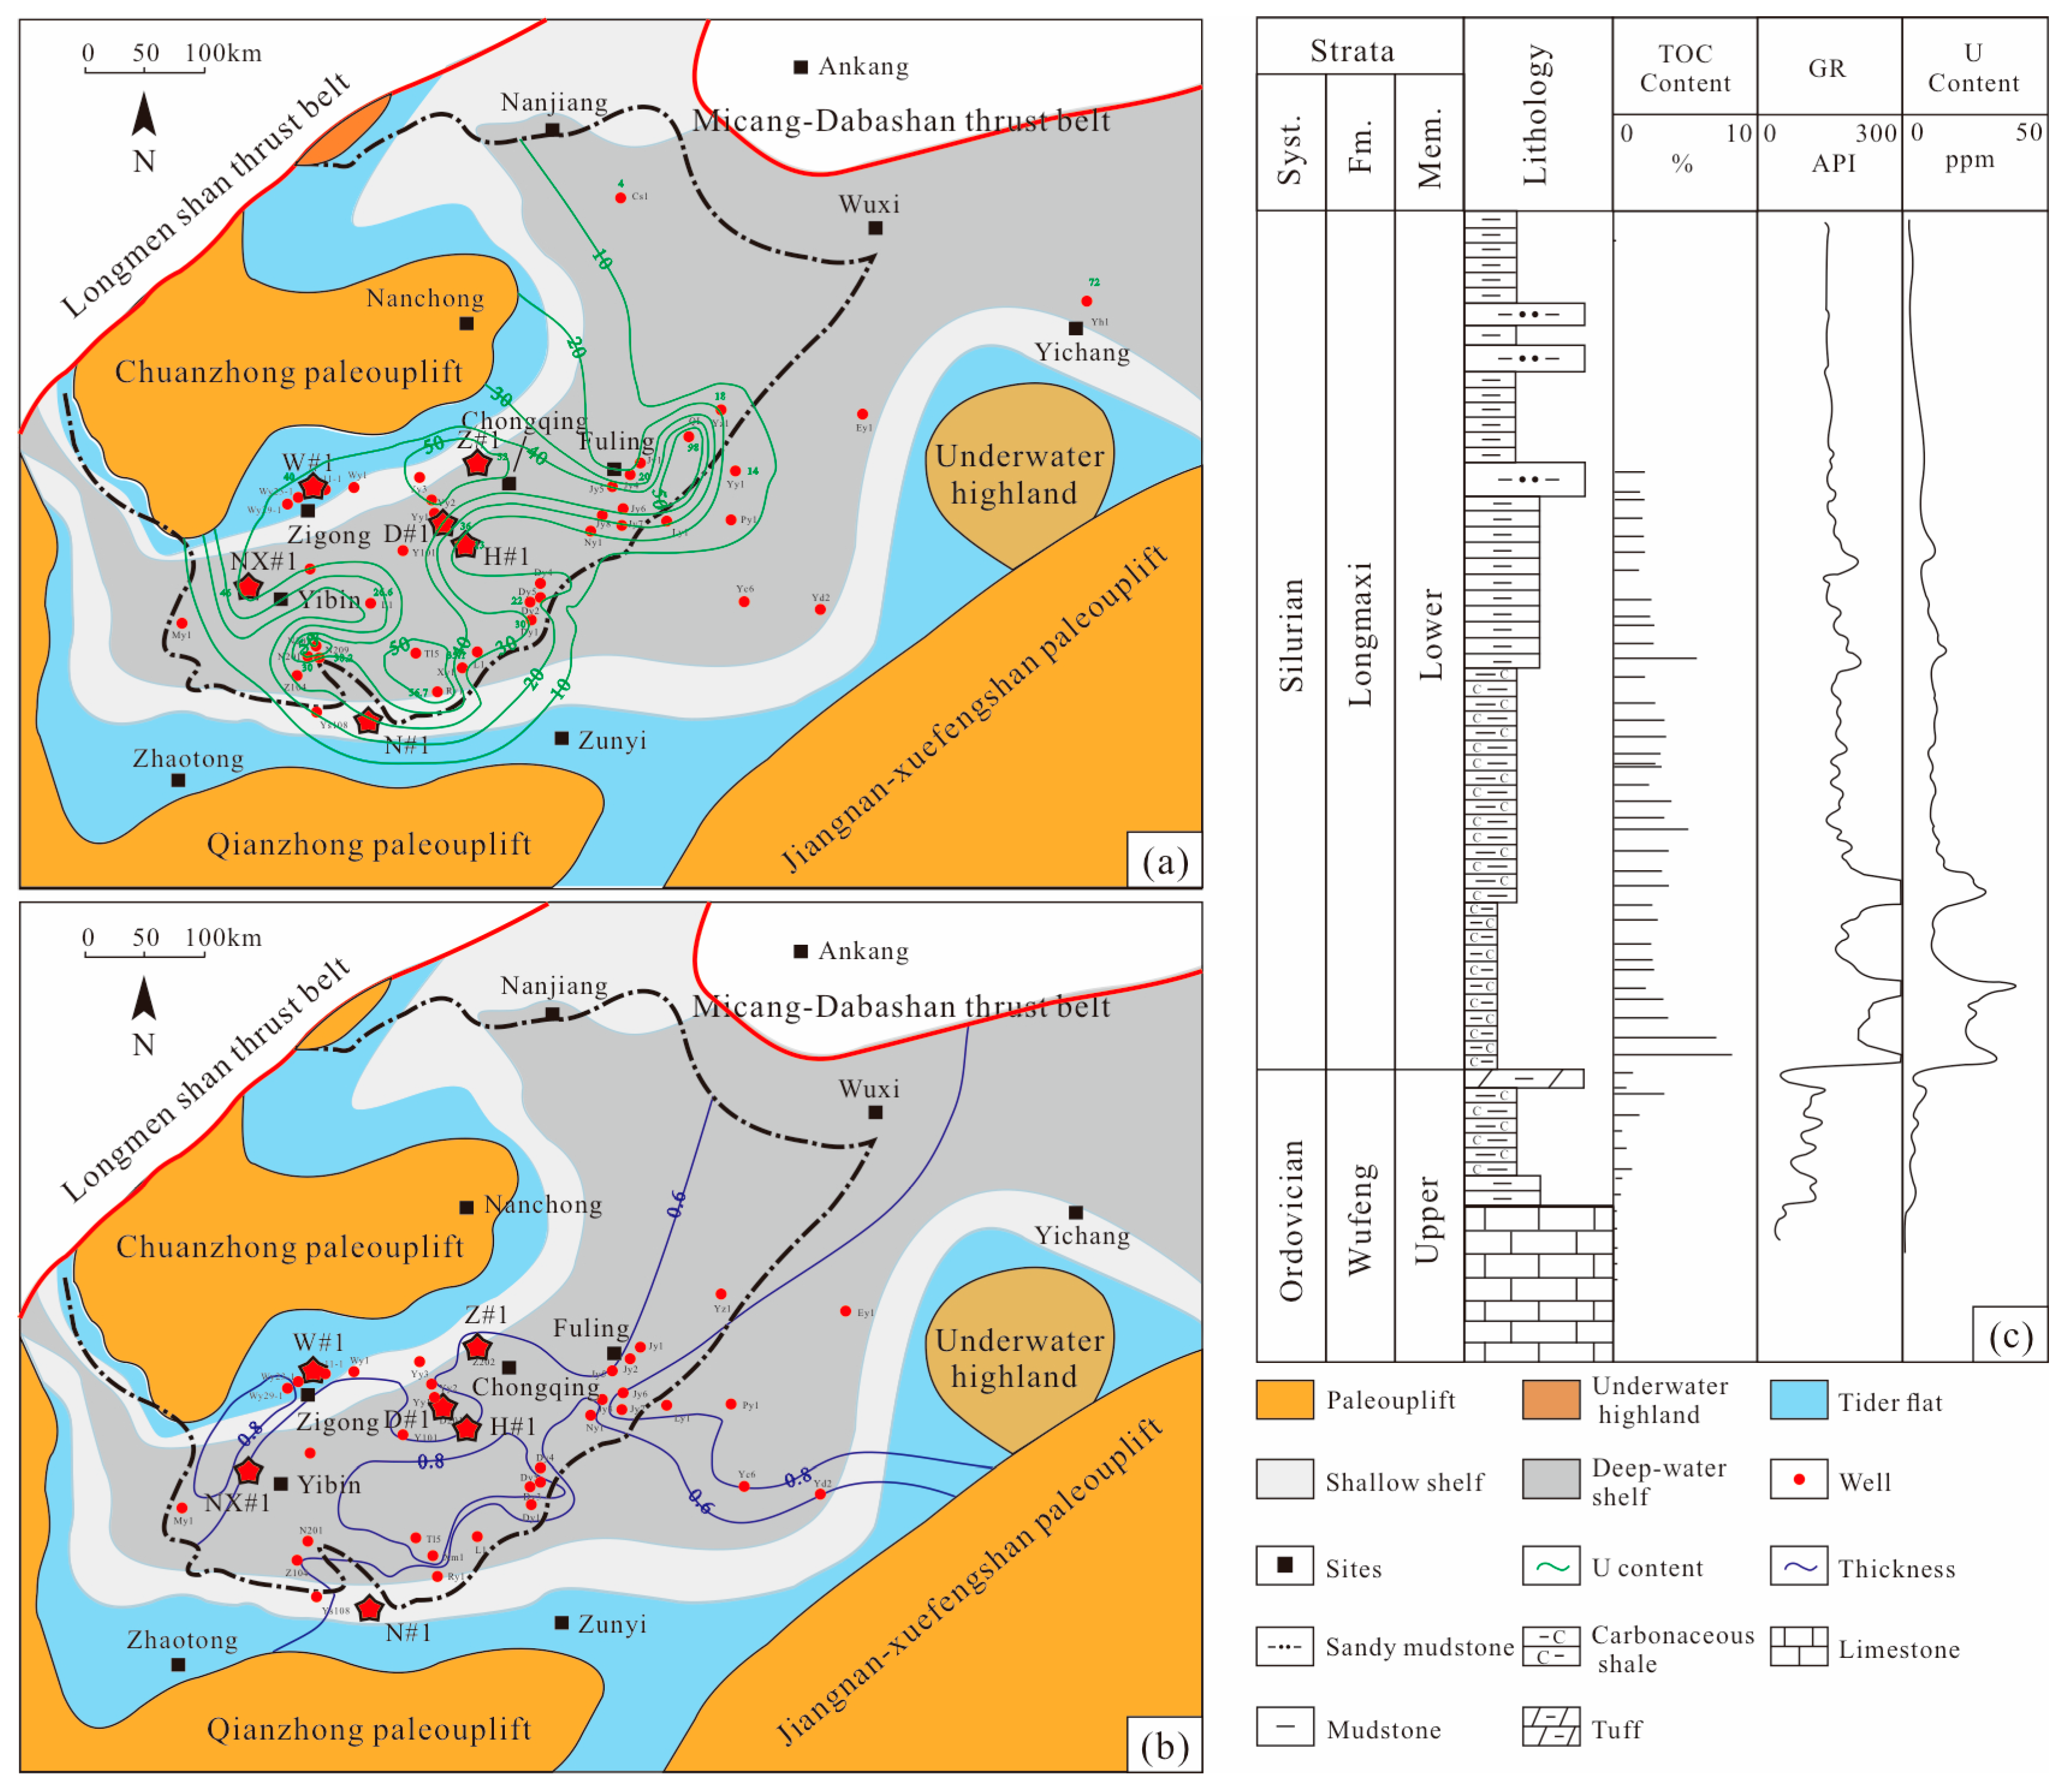
Figure 1. Lithofacies paleogeography and stratigraphic characteristics of the Sichuan Basin. (a) Paleogeographic map of the study area showing the distribution of maximum uranium content in shales; (b) Isopach map of the high-gamma-ray (GR) interval; (c) Typical lithology column of Well W#1. (Modified after [3]).
Minerals 15 01238 g001
Figure 2. Morphological characteristics of organic matter (OM) types under optical microscopy and FE-SEM. (a) Pyrobitumen under optical microscopy (brownish-black); (b) Crumb-type pyrobitumen filling dissolution pores; (c) Bulb-type pyrobitumen within a fossil skeletal framework; (d) Amorphous pyrobitumen with interparticle pores; (e) Amorphous pyrobitumen distributed in inter-clay pores; (f) Amorphous pyrobitumen infilling intercrystalline pores; (g) Algal fragment showing typical morphology and size; (h) Graptolite under optical microscopy; (i) Graptolite fragment observed via FE-SEM; (j) Bacteria-like aggregates composed of quasi-spherical pellets; (k) Bacteria-like aggregates showing compaction features; (l) Micrinite associated with pyrobitumen.
Minerals 15 01238 g002
Figure 3. Cross-plots showing correlations of (a) measured uranium (U) content versus log-derived U content, and (b) U content versus total organic carbon (TOC) content.
Minerals 15 01238 g003
Figure 4. Correlation between Uranium (U) content and relative abundance of (a) pyrobitumen; (b) algal fragments; (c) graptolite; and (d) micrinite.
Minerals 15 01238 g004
Figure 5. Vertical distribution and correlation of gamma ray (GR) and spectral uranium (U) logs across the high-GR peak intervals of the Wufeng–Longmaxi shale in the Sichuan Basin, as exemplified by well W#1. Labels A–C indicate the three uranium-enriched intervals (Parts A–C).
Minerals 15 01238 g005
Figure 6. Correlation of carbonate content and log-derived U content.
Minerals 15 01238 g006
Figure 7. Petrographic evidence for volcanic and hydrothermal activities in the high-GR intervals of the Wufeng–Longmaxi shale. (a) tuff bed, (b) banded pyrite, (c) recrystallized framboids with dense internal structures; and (d) pre-bitumen recrystallization.
Minerals 15 01238 g007
Figure 8. Genetic model for uranium enrichment, showing the coupled roles of algal-hosted accumulation and volcanically sourced uranium during early diagenesis.
Minerals 15 01238 g008
Figure 9. Variation in equivalent vitrinite reflectance (ERo) with burial depth for the studied shale samples in typical wells. (a) Well Z#1; (b) well NX#1; (c) Well H#1; (d) Well N#1.
Minerals 15 01238 g009
Figure 10. Vertical variation profiles of equivalent vitrinite reflectance (ERo) in typical wells Z#1, NX#1, H#1, and N#1.
Minerals 15 01238 g010
Figure 11. Regional distribution of the Emeishan basalt and its relationship to the vitrinite reflectance (Ro) of shales (modified from Ref. [55]).
Minerals 15 01238 g011
Figure 12. Relationship between total organic carbon (TOC) and quartz content in the Wufeng–Longmaxi shales of typical wells.
Minerals 15 01238 g012
Figure 13. The high uranium ‘Marker Zone’ and its biostratigraphic position within the LM1 graptolite zone.
Minerals 15 01238 g013
Table 1. Depth, U content, TOC content, thermal maturity and relative abundance of OM types for the representative samples analyzed.
WellSampleDepth
m
TOC
Content
%
ERo
%
U
Content
ppm
Organic Matter Types %
PyrobitumenAlgal
Fragments
GraptoliteMicriniteBacteria-Like
Aggregates
NX#1NX-13933.753.163.2210.06530500
NX-23934.174.403.2912.08015230
NX-33944.401.823.487.0452510020
W#1W-12549.502.242.1611.04040052
W-22575.003.352.224.075101050
Z#1Z-13877.092.252.254.57025050
Z-23887.762.362.434.08510023
Z-33891.724.402.5118.06525055
Z-43897.403.712.399.165200515
D#1D-13697.862.932.8724.0825580
H#1H-14114.003.273.074.07555105
H-24127.602.053.167.26035500
Table 2. Mineral composition of typical samples.
WellSampleDepth
m
Quartz
%
Feldspar
%
Calcite
%
Dolomite
%
Pyrite
%
Clays
%
NX#1NX-13933.7533160312
NX-23934.1768361535
NX-33944.40442341028
W#1W-12549.50355229128
W-22575.00310481722
Z#1Z-13877.09359314237
Z-23887.76481294225
Z-33891.7268423518
Z-43897.4067503619
D#1D-13697.8642421523512
H#1H-14114.0053852428
H-24127.60346234231
Disclaimer/Publisher’s Note: The statements, opinions and data contained in all publications are solely those of the individual author(s) and contributor(s) and not of MDPI and/or the editor(s). MDPI and/or the editor(s) disclaim responsibility for any injury to people or property resulting from any ideas, methods, instructions or products referred to in the content.