Abstract
Wettability significantly influences fluid distribution and flow behavior in hydrocarbon reservoirs, yet traditional macroscopic measurements fail to capture the micro- and nanoscale interfacial interactions that govern these processes. This study addresses a critical knowledge gap by employing molecular dynamics simulations to systematically investigate how salinity and mineral composition control wettability at the atomic scale—insights that are experimentally inaccessible yet essential for optimizing enhanced oil recovery strategies. We examined five typical reservoir minerals—kaolinite, montmorillonite, chlorite, quartz, and calcite—along with graphene as a model organic surface. Our findings reveal that while all minerals exhibit hydrophilicity (contact angles below 75°), increasing salinity weakens water wettability, with Ca2+ ions exerting the strongest effect due to their high charge density, which enhances electrostatic attraction with negatively charged mineral surfaces and promotes specific adsorption at the mineral–water interface, thereby displacing water molecules and reducing surface hydrophilicity. In oil–water–mineral systems, we discovered that graphene displays exceptional oleophilicity, with hydrocarbon interaction energies reaching −7043.61 kcal/mol for C18H38, whereas calcite and quartz maintain strong hydrophilicity. Temperature and pressure conditions modulate interfacial behavior distinctly: elevated pressure enhances molecular aggregation, while higher temperature promotes diffusion. Notably, mixed alkane simulations reveal that heavy hydrocarbons preferentially adsorb on mineral surfaces and form highly ordered structures on graphene, with diffusion rates inversely correlating with molecular size. These atomic-scale insights into wettability mechanisms provide fundamental understanding for designing salinity management and wettability alteration strategies in enhanced oil recovery operations.
1. Introduction
Wettability is a crucial parameter characterizing solid–liquid interfacial interactions, describing the extent of interaction between liquids and solid surfaces. As one of the fundamental petrophysical properties of rocks, wettability plays a key role in hydrocarbon reservoir exploration and development [1,2]. Traditional wettability measurements are conducted at macroscopic scales (millimeter to centimeter), whereas shale reservoirs exhibit complex micro- and nanoscale pore structures [3,4]. Accurately understanding the microscopic interactions at the oil–water–rock interface is essential for optimizing reservoir development strategies and enhancing oil recovery efficiency [5,6]. Therefore, investigating the microscale wettability of reservoir minerals is necessary.
In recent years, molecular dynamics (MDs) simulations have emerged as a powerful tool for studying microscopic behavior [7,8,9,10]. These simulations provide atomic-scale insights into fluid molecule adsorption, diffusion, and wettability variations on mineral surfaces [11,12]. Previous studies have demonstrated that reducing water salinity or adjusting ionic composition can significantly alter mineral surface wettability, thereby affecting fluid distribution and flow behavior in pores [13,14,15]. However, traditional macroscopic experiments face limitations in revealing the microscopic mechanisms by which salinity influences wettability [16,17]. Some researchers have used MD simulations to study water droplet wetting behavior on mineral surfaces such as dolomite and calcite, preliminarily revealing the microscopic mechanisms of wettability [18,19]. Nevertheless, research on the wetting behavior of formation water solutions with different salinities on mineral surfaces remains limited [20,21].
To further understand the interfacial interaction during low-salinity waterflooding, the MD method was applied to evaluate the interfacial interactions between fluids and rock interfaces at the molecular level. MD can directly calculate the interatomic forces under various conditions. Khamaneh and Mahani conducted microfluidic flooding experiments combined with molecular-scale analysis to investigate the nonmonotonic effect of injection water salinity on wettability and oil recovery [22]. Their results revealed that oil recovery follows a nonmonotonic trend with salinity due to the concomitant effects of wettability alteration, coalescence time, interface elasticity, and IFT, with each phenomenon having its own optimal salinity. They emphasized the critical importance of time-scale effects, showing that sufficient soaking time, from a few days to weeks, is necessary to account for low-salinity kinetics, particularly for fluid–rock interactions such as wettability alteration. Araujo and Heidari used MD simulations to elucidate wettability alteration on illite clay surfaces in contact with mixed electrolyte solutions [23]. They observed that ion composition and salt concentration do not result in significant changes in the adsorption planes of cations, and the thickness of hydration layers shows minimal variation with salinity changes. Their findings indicated that nonpolar-charged hydrocarbon molecules exhibit the lowest mobility, suggesting more intense interactions with the illite surface compared with other hydrocarbons. Chen et al. investigated fluid–fluid interfacial properties during low-salinity waterflooding using MD simulations, focusing on the orientation of carboxylic groups, interfacial structure, and species distribution [24]. Their results showed that carboxylic groups accumulated near the oil–brine interface with a perpendicular orientation regardless of salinity, and that the oil–brine interfacial area becomes wider with decreasing salinity. These recent studies collectively demonstrate that both fluid–rock and fluid–fluid interactions contribute to the low-salinity effect, with molecular-scale mechanisms varying depending on mineral type, oil composition, and brine salinity.
Despite these advances, most existing MD studies of mineral wettability have focused on a limited number of mineral types (typically one or two substrates) and employed simplified hydrocarbon representations (usually single-component alkanes such as pure n-decane). Furthermore, systematic comparisons across multiple reservoir-relevant minerals under identical conditions remain scarce, limiting our ability to understand mineral-specific wetting behaviors and their implications for reservoir heterogeneity. Additionally, the use of single-component hydrocarbons may not adequately capture the complexity of actual reservoir fluids, which consist of diverse hydrocarbon mixtures with varying chain lengths and molecular structures.
This study addresses these gaps by employing MD simulations to systematically investigate the effects of salinity on wettability across six representative reservoir minerals, and to explore how different mineral substrates influence the interfacial behavior of both single and mixed hydrocarbon systems. Using the Gulong shale oil reservoir as a case study, we examined the regulatory effects of different ion types (NaCl, CaCl2, and KCl) and concentrations on mineral–fluid interfacial behavior. The mineral substrates selected include kaolinite, montmorillonite, chlorite, quartz, calcite, and graphene, representing typical clay minerals, silicates, carbonates, and organic matter found in shale reservoirs [25,26,27,28]. We investigate the interfacial behavior of both n-decane–water–mineral systems and more realistic mixed alkane–water–mineral systems, considering the effects of temperature and pressure on wettability behavior. Through comprehensive analyses, including contact angle calculations, density profiles, radial distribution functions, and interaction energy decomposition, this work provides the first systematic, multi-mineral comparison of wettability mechanisms under low-salinity waterflooding conditions, offering molecular-scale insights for optimizing enhanced oil recovery strategies in heterogeneous shale reservoirs.
2. Materials and Methods
2.1. Simulation Software and Visualization
All molecular dynamics simulations were performed using the Large-scale Atomic/Molecular Massively Parallel Simulator (LAMMPS 2022) [29]. Visualization analysis was conducted using OVITO 3.7 software [30], while molecular modeling was accomplished through the collaborative use of PACKMOL [31] and MOLTEMPLATE [32].
2.2. Mineral Substrate Models
The selection of mineral substrates was based on systematic criteria to ensure representative coverage of reservoir mineralogy. These five minerals constitute most of the mineral composition in typical shale and tight oil reservoirs, with quartz accounting for 30%–50%, clay minerals including kaolinite (10%–20%), montmorillonite (5%–15%), and chlorite (5%–10%), and calcite representing 10%–40% of the dominant phases identified in X-ray diffraction analyses of global shale formations. Beyond their prevalence, the selected minerals represent distinct surface chemistry categories, including silicates with hydroxylated surfaces such as kaolinite and chlorite, expandable clays with cation exchange capacity like montmorillonite, non-hydroxylated silica surfaces in quartz, carbonate surfaces in calcite, and graphene as a hydrophobic reference.
Five typical mineral substrates were selected as follows: kaolinite, montmorillonite, chlorite, quartz, and calcite. Complete crystal structure information and CIF files for each mineral were obtained from the American Mineralogist Crystal Structure Database (AMCSD) [33]. Figure 1 shows the crystal cells of different minerals, where calcium ions (Ca) are displayed in light green, carbon atoms (C) in light gray, oxygen atoms (O) in light red, magnesium ions (Mg) in soft green, silicon atoms (Si) in light yellow, aluminum atoms (Al) in light pink, and hydrogen atoms (H) in white.

Figure 1.
Crystal cells of different minerals: (a) calcite (104), (b) chlorite (001), (c) kaolinite (001), (d) montmorillonite (001), and (e) quartz (101).
2.2.1. Mineral Characteristics
Calcite belongs to the trigonal crystal system and is one of the most stable and common crystalline forms of calcium carbonate, consisting of alternating calcium ions (Ca2+) and carbonate ions (CO32−) with high symmetry and stability.
Chlorite is a layered silicate mineral widely distributed in sedimentary and metamorphic rocks. Its chemical composition is complex, typically containing iron, magnesium, aluminum, and silicon. The crystal structure consists of alternating silicon–oxygen tetrahedral layers and aluminum/magnesium–oxygen octahedral layers.
Montmorillonite is a layered silicate mineral and a main component of bentonite. It consists of silicon–oxygen tetrahedral layers and aluminum/magnesium–oxygen octahedral layers, with exchangeable cations (such as Na+, Ca2+) and water molecules between the layers. This unique layered structure endows montmorillonite with large specific surface area and excellent adsorption properties.
Quartz is a mineral composed of silicon dioxide (SiO2), widely distributed in the Earth’s crust and common in oil and gas reservoirs. The crystal structure belongs to the hexagonal system with highly symmetric crystal morphology. Its surface often contains polar hydroxyl groups (-OH), which readily undergo adsorption and chemical reactions when in contact with water or other polar solutions.
Kaolinite is a layered silicate mineral consisting of alternating silicon–oxygen tetrahedral layers and aluminum–oxygen octahedral layers. The structural asymmetry results in different chemical and physical properties on the two faces, affecting their interactions with water.
2.2.2. Substrate Construction
The construction methods for the five typical mineral substrate models were as follows:
For quartz surfaces, hydroxylation treatment was applied to simulate their naturally hydrophilic surfaces. For calcite, the (1 0 4) crystal plane was selected as the substrate, which is stable and representative in nature. For kaolinite substrates, both the silicon–oxygen surface and aluminum–oxygen surface were separately constructed to study the influence of surface chemical properties on wettability. For montmorillonite substrates, a sodium-type montmorillonite model was adopted with Na+ as the interlayer cation. The chlorite model was constructed based on experimental crystallographic data, focusing on the influence of its layered structure on interfacial water molecule behavior.
All mineral substrates were constructed through crystal cell expansion, with simulation box sizes set to approximately 100 Å × 100 Å × 100 Å (specific model dimensions varied slightly based on each substrate’s unit cell length and thickness) to ensure sufficient space in the z-direction to accommodate water droplets and mineral substrates. Periodic boundary conditions were applied in the x- and y-directions, while fixed boundary conditions were applied in the z-direction to avoid periodic boundary effects on water droplet–mineral surface interactions. During simulations, mineral substrate surfaces were fixed to simulate the rigid characteristics of actual mineral surfaces.
2.3. Simulation Protocol
High-precision Ewald summation was employed for calculating electrostatic interactions. To improve computational efficiency, a cutoff radius of 12.5 Å was set. All simulations used a timestep of 1 fs. The simulation protocol consisted of the following steps: (1) energy minimization using the steepest descent method to eliminate non-physical contacts and high-energy regions, (2) NVT equilibration for 100 ps at the target temperature to allow the system to stabilize, and (3) NVT production runs for data collection. The system density was determined by the initial box dimensions, which were constructed based on the mineral substrate dimensions and a predefined fluid layer thickness. The NVT ensemble (constant particle number, volume, and temperature) was employed for both equilibration and production phases, as the fixed mineral substrate and confined fluid geometry require constant volume conditions.
For water–substrate–air systems, simulations were run for 1500 ps. For decane–water–substrate systems, total simulation time was 25 ns. For mixed alkane–water–substrate systems, simulations were extended to 38 ns to ensure system equilibration. Temperature was controlled using the Berendsen thermostat.
For interactions between different molecules, Lennard-Jones parameters were calculated using the Lorentz–Berthelot mixing rules. The cutoff distance for both the van der Waals and Coulombic forces was set at 1.2 nm. Periodic boundary conditions were applied in all three directions (X, Y, Z) to eliminate boundary effects.
Interaction energies between different molecular groups were calculated using the group/group command, which computes the total non-bonded interaction energy, including both van der Waals and Coulombic contributions between specified groups of atoms. This calculation excludes intramolecular bonded interactions and only accounts for intermolecular non-bonded potentials.
For the oil–water–substrate systems, the 50 Å dimension refers to the total height of the fluid layer (decane–water or mixed alkane–water) in the simulation box. The mineral substrate was positioned at the bottom of the simulation box with substrate atoms fixed to represent the rigid nature of mineral surfaces, while fluid molecules were free to move and equilibrate in all directions. The Berendsen thermostat employed a damping parameter of 100 fs. The temperature of 393 K and pressure of 37 MPa were selected to represent typical reservoir conditions for the Gulong shale oil field, where reservoir temperatures range from 376.85 to 413 K and formation pressures are approximately 28.6–37.5 MPa [34]. For the mixed alkane–water–substrate systems, pressure effects were investigated by conducting separate simulations at 1 MPa and 37 MPa to compare interfacial behavior under different pressure conditions.
3. Results and Discussion
3.1. Pure Water Wetting Behavior on Mineral Substrates
The wetting behavior of pure water on different mineral surfaces was first investigated. Figure 2 presents the dynamic changes in wettability of the water–air–mineral system at different time points (0 ps, 50 ps, 200 ps, 500 ps, and 1500 ps) for six mineral surfaces.
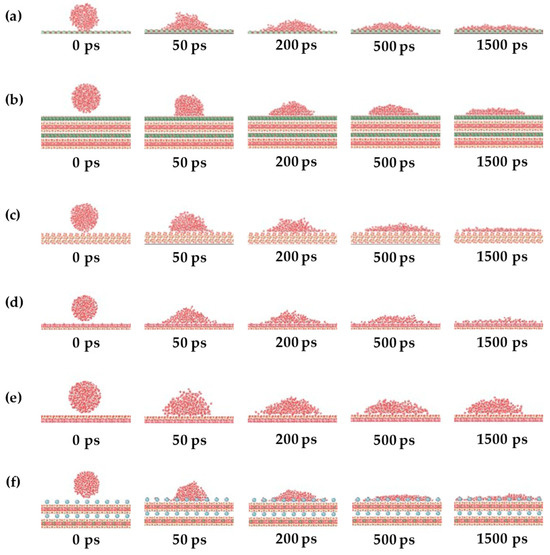
Figure 2.
Variation in wettability of water–air–mineral system at different times: (a) calcite, (b) chlorite, (c) quartz, (d) kaolinite aluminous surface, (e) kaolinite siliceous surface, and (f) sodium montmorillonite.
As shown in Figure 2, water droplets initially appeared as spheres suspended above the mineral surfaces. As simulation time increased, all water droplets eventually adsorbed onto the mineral surfaces with contact angles less than 75°, indicating that these minerals are hydrophilic.
For calcite (Figure 2a), as a carbonate mineral, it typically exhibits strong hydrophilicity. The contact angle gradually decreased over time, with water molecules rapidly spreading on the surface. Chlorite (Figure 2b), a layered silicate mineral, showed rapid water molecule spreading on its surface, with wettability influenced by interlayer cations. Quartz surfaces (Figure 2c), rich in polar hydroxyl groups, are typically highly hydrophilic, with water molecules rapidly forming stable wetting layers. For the kaolinite aluminum–oxygen surface (Figure 2d), the hydrophilic octahedral surface showed rapidly decreasing contact angles. The silicon–oxygen surface (Figure 2e) maintained consistently larger contact angles with minimal change within the simulation timeframe, indicating that water molecules struggle to spread on this surface, with wettability dominated by surface chemical properties rather than time. Sodium montmorillonite (Figure 2f), due to exchangeable interlayer Na+ ions providing high adsorption capacity, exhibited rapidly decreasing contact angles followed by stabilization.
3.2. Radial Distribution Function Analysis
At the microscopic scale, the spatial distribution characteristics of particles within a system can be quantitatively characterized through radial distribution functions (RDFs). The RDF essentially represents the probability distribution of the local density of specific atomic groups within spherical shell layers relative to the system’s average density (Figure 3).
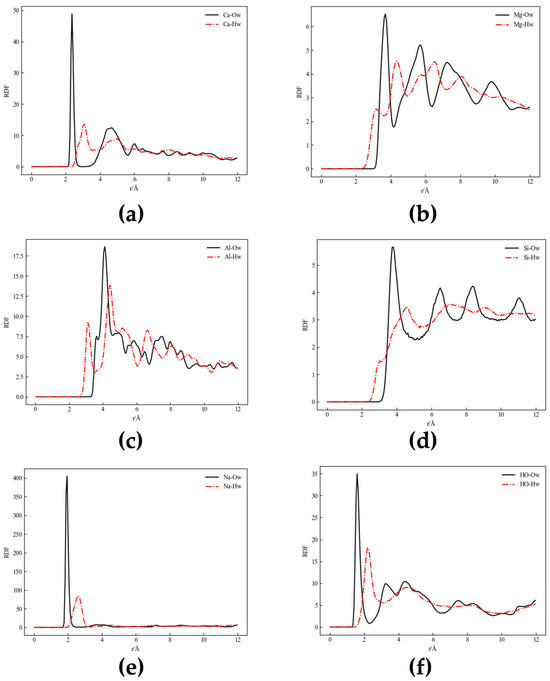
Figure 3.
Radial distribution function plot ((a–f) for different minerals): (a) calcite, (b) chlorite, (c,d) kaolinite, (e) sodium montmorillonite, and (f) quartz.
RDF curves between atoms in mineral structures and H2O molecules were calculated. The position of the first peak reflects the nearest neighbor distance between mineral surface atoms and water molecules, while its height and width reflect the strength of interaction and local ordering.
Figure 3a (Calcite): The Ca-Ow RDF shows the first peak appearing at approximately 2.4 Å with extremely high intensity, indicating strong interaction between calcium atoms and oxygen atoms in water molecules. Water molecules coordinate with calcium atoms through their oxygen atoms, forming hydrated ions. The Ca-Hw peak is lower than Ca-Ow, indicating weaker interaction between calcium atoms and hydrogen atoms in water molecules.
Figure 3b (Chlorite): The Mg-Ow first peak is located at approximately 4 Å, indicating weak direct interaction between magnesium atoms and water oxygen atoms, with relatively small van der Waals and ionic attraction forces. Multiple fluctuations after the first peak indicate loose hydration structure around magnesium atoms. The Mg-Hw first peak at approximately 2 Å suggests water hydrogen atoms may experience weak hydrogen bonding or other non-coordinative interactions with magnesium atoms.
Figure 3c,d (Kaolinite): The Al-Ow first peak is located at approximately 4 Å, suggesting water molecules may not directly coordinate with aluminum atoms but rather form loose hydration layers. The Si-Ow first peak near 4 Å indicates weak interaction between water oxygen atoms and silicon atoms, consistent with weak hydrophilicity of silicon–oxygen surfaces. Both Al-Hw and Si-Hw show relatively low first peaks, indicating limited strong hydration effects.
Figure 3e (Sodium Montmorillonite): Na-Ow shows a distinct peak at approximately 2.5 Å, indicating obvious coordination between Na+ and water oxygen atoms, primarily from electrostatic and van der Waals forces. Na-Hw shows a peak at approximately 2 Å but is nearly insignificant compared to Ow, suggesting weak direct interaction between Na+ and water hydrogen atoms, likely occurring indirectly through oxygen atoms.
Figure 3f (Quartz): HO-Ow shows the first peak appearing near 1 Å, corresponding to hydrogen bond distance. This high peak indicates strong interaction between water oxygen atoms and surface hydroxyl hydrogen atoms. The HO-Hw curve shows no significant peak in the region below 2 Å, indicating no significant close-range interaction between surface hydroxyl hydrogen and water hydrogen atoms, as hydrogen atoms typically do not form hydrogen bonds with each other.
3.3. Effects of Salinity on Mineral Wettability
Molecular dynamics simulations were employed to study droplet contact angle behavior on solid surfaces. By constructing solid–liquid–gas three-phase systems, equilibrium droplet morphology on solid surfaces was simulated. The study focused on the effects of ion concentration and ionic composition on the wetting behavior of formation water solutions on mineral surfaces.
3.3.1. Contact Angle Measurements
Contact angles were calculated using a combination of geometric and density profile methods based on two-dimensional density contour plots in the XZ plane (Figure 4). The measurement procedure consisted of the following steps:
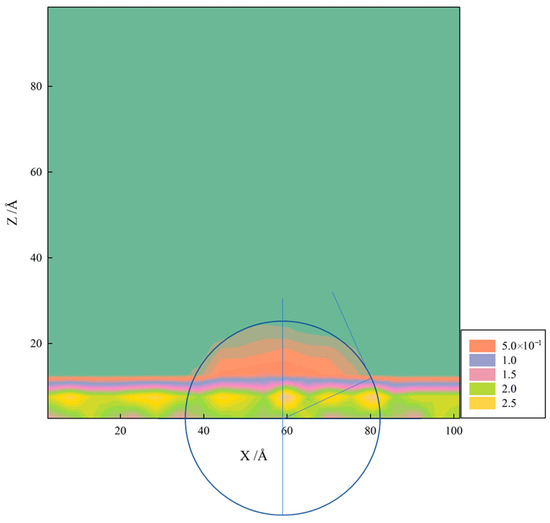
Figure 4.
Two-dimensional density contour plot of kaolinite siloxane surface in the XZ plane.
First, two-dimensional number density distributions of water molecules in the XZ plane were computed by dividing the simulation box into grid cells and calculating the local density within each cell. The density field was then smoothed using a Gaussian filter to reduce statistical noise while preserving the droplet interface structure.
Second, the liquid–vapor interface was identified by locating the contour line corresponding to half the bulk liquid density. This contour line represents the equimolar dividing surface between the liquid and vapor phases. The substrate surface position was determined from the fixed mineral atomic coordinates.
Third, contact angles were extracted using a circular arc fitting method. For each equilibrated configuration, we fitted a circle to the droplet interface profile near the three-phase contact line. The contact angle θ was then calculated from the tangent of the fitted circle at the point where it intersects the substrate surface.
Figure 5 presents the variation in contact angles on different mineral surfaces under varying salinity conditions for the following three surfaces: kaolinite aluminum–oxygen surface (Figure 5a), kaolinite silicon–oxygen surface (Figure 5b), and quartz surface (Figure 5c).
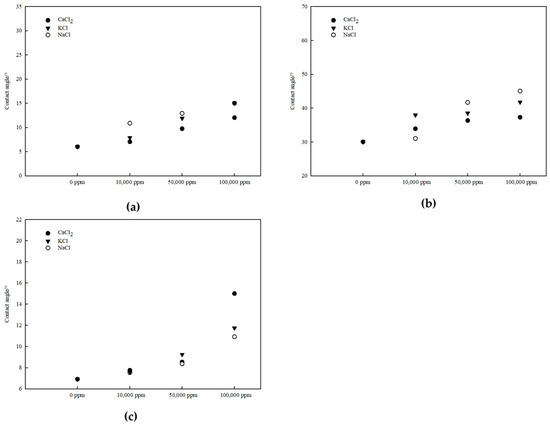
Figure 5.
Variation in contact angles on different mineral surfaces under varying salinity conditions: (a) kaolinite aluminous surface, (b) kaolinite siliceous surface, and (c) quartz surface.
Quantitative analysis reveals distinct wettability characteristics for each surface. The kaolinite aluminum–oxygen surface exhibited the strongest hydrophilicity with contact angles ranging from 6 to 15°. At 0 ppm salinity, contact angles were 6–7°, increasing to approximately 12–15° at 100,000 ppm for all three salt types. In contrast, the kaolinite silicon–oxygen surface showed significantly weaker water wettability, with contact angles ranging from 30 to 44°. Starting from approximately 30° at 0 ppm, the contact angles increased to 38–44° at 100,000 ppm, representing a 25%–45% increase. The quartz surface demonstrated strong hydrophilicity similar to the kaolinite aluminum–oxygen surface, with contact angles ranging from 7 to 15°, increasing from approximately 7° at 0 ppm to 11–15° at 100,000 ppm.
All mineral surfaces exhibited a general trend of gradually weakening water wettability with increasing salinity, although the relationships were not strictly monotonic, with some fluctuations observed at intermediate salinity levels (particularly at 50,000 ppm). The wettability of the aluminum–oxygen surface was consistently stronger than that of the silicon–oxygen surface across all salinity conditions, with contact angles differing by approximately 20–30°, indicating markedly different wettability between the two faces of kaolinite. Among the three salt types, CaCl2 produced lower and higher contact angles compared with NaCl and KCl on kaolinite and quartz surface, respectively, at elevated salinities demonstrating different wettability alteration mechanisms.
These results demonstrate that salinity significantly influences mineral wettability through ion-specific mechanisms. Under low-salinity conditions, with minimal ion concentration in solution, water molecule arrangement at the interface is primarily governed by substrate surface properties such as polarity and charge distribution, resulting in wettability approaching that of pure water. As salinity increases, enhanced ion adsorption and accumulation at the solid–liquid interface progressively reduce water wettability, with the magnitude of this effect varying depending on both the mineral surface chemistry and the ionic species present in solution.
3.3.2. One-Dimensional Density Distribution
Figure 6 shows the one-dimensional density distribution of the kaolinite aluminum–oxygen surface in CaCl2 solutions with different salinities. For clearer comparison, regions with zero density on the X-axis were removed, as shown in Figure 7.
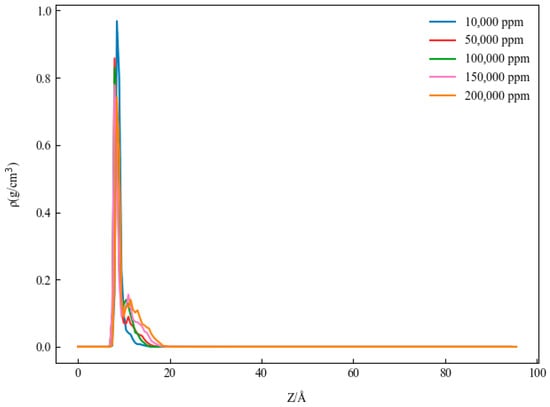
Figure 6.
One-dimensional density distribution of kaolinite alumina in solution with different salinities.

Figure 7.
One-dimensional density distribution curves of kaolinite alumina surface in solutions with different salinities: (a) CaCl2, (b) KCl, and (c) NaCl.
Figure 8, Figure 9 and Figure 10 present the one-dimensional density distribution curves for the kaolinite aluminum–oxygen surface, the kaolinite silicon–oxygen surface, and quartz at different salinities, with (a) representing CaCl2 solutions, (b) KCl solutions, and (c) NaCl solutions.

Figure 8.
One-dimensional density distribution curves of kaolinite silica surface in solutions with different salinities: (a) CaCl2, (b) KCl, and (c) NaCl.

Figure 9.
One-dimensional density distribution curves of quartz surface in solutions with different salinities: (a) CaCl2, (b) KCl, and (c) NaCl.
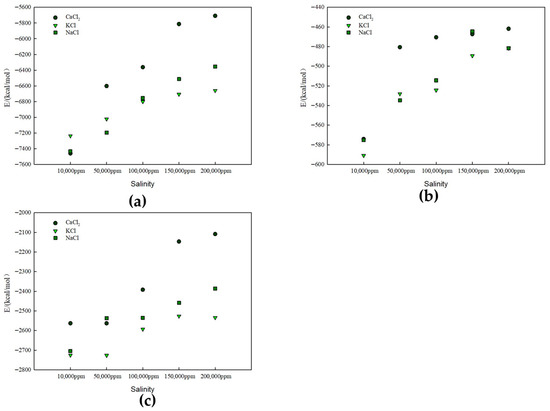
Figure 10.
Interaction energy between rock surfaces and solutions with different salinities: (a) kaolinite aluminous surface, (b) kaolinite siliceous surface, and (c) quartz surface.
As salinity increased, the positions of density peaks changed. For both kaolinite surfaces, significant density peaks appeared on the aluminum–oxygen surface at all salinities, indicating the formation of tight hydration layers, while on the silicon–oxygen surface, although density peaks were observed, their positions and shapes differed from the aluminum–oxygen surface. On quartz surfaces, the horizontal positions of density peaks differed from kaolinite, and peak magnitudes were also inconsistent. These results indicate that both salinity and surface type have important effects on water molecule distribution behavior.
The characteristic density peak of salt ions at approximately 10 Å from mineral surfaces arises from the interplay of multiple physicochemical mechanisms. The 10 Å distance corresponds to the outer Helmholtz plane in the electrical double layer. At this position, ions achieve an optimal balance between electrostatic attraction to the charged mineral surface and thermal motion that prevents direct surface binding. Both the mineral surface and salt ions possess hydration shells. The first water layer on mineral surfaces typically extends 3–4 Å, while hydrated ions (e.g., Na+ with radius ~3.6 Å, Ca2+ with radius ~4.1 Å) cannot approach closer than their hydration shell allows. The 10 Å position represents where hydrated ions can maintain their hydration structure while interacting with the surface electric field.
In addition, water molecules strongly adsorb on hydrophilic mineral surfaces, creating structured water layers. Salt ions must compete with water for surface sites, resulting in their accumulation at the boundary between structured and bulk water regions, typically around 8–12 Å. At moderate to high salinities, ion–ion correlations become significant. The 10 Å position minimizes ion–ion repulsion while maintaining favorable ion–surface interactions, as described by the Poisson–Boltzmann theory modified for concentrated solutions.
3.3.3. Effects of Different Ions
In mineral–fluid interactions, changes in interaction energy directly affect wettability. As interaction energy increases (becomes more negative), contact angles gradually decrease, showing weakening wettability trends.
Figure 10 presents the interaction energy between solutions of different salinities and rock surfaces for (a) the kaolinite aluminum–oxygen surface, (b) the kaolinite silicon–oxygen surface, and (c) the quartz surface. The interaction energies were calculated using the end values of the simulation trajectories. The reference state for energy calculations was defined as the infinitely separated state of the interacting components, where the interaction energy equals zero. Negative interaction energy values indicate attractive forces between the components, with more negative values corresponding to stronger interactions.
Figure 11 shows the interaction energy between the kaolinite aluminum–oxygen surface and different solutions: (a) CaCl2, (b) KCl, and (c) NaCl.

Figure 11.
Interaction energy between kaolinite aluminous surface and different solutions: (a) CaCl2, (b) KCl, and (c) NaCl.
Figure 10 and Figure 11 demonstrate that CaCl2 exhibited the lowest interaction energy, indicating the strongest binding force with the kaolinite surface. This is primarily because Ca2+ ions have high charge density and can form stronger electrostatic attractions with oxygen atoms on the aluminum–oxygen surface. For NaCl and KCl, interaction energy decreased with increasing salinity due to enhanced ion hydration at higher concentrations, weakening their direct interaction with kaolinite. Overall trends indicate that ion type significantly affects kaolinite surface wettability, with divalent Ca2+ ions having the most significant effect.
Figure 12 presents the center-of-mass height maps for (a) the kaolinite aluminum–oxygen surface, (b) the kaolinite silicon–oxygen surface, and (c) the quartz surface.

Figure 12.
Center-of-mass height map at 100,000 ppm salinity: (a) kaolinite aluminous surface, (b) kaolinite siliceous surface, and (c) quartz surface.
Figure 12 shows that at high salinity, different ions (CaCl2, KCl, NaCl) exhibited varying center-of-mass heights on different mineral surfaces. For the kaolinite aluminum–oxygen surface (Figure 12a), the effects of different ions on center-of-mass height were similar, with CaCl2 slightly higher than the other two salts, indicating stronger interaction between CaCl2 and the aluminum–oxygen surface leading to tighter ion adsorption. The center-of-mass height on the kaolinite silicon–oxygen surface (Figure 12b) was generally higher than on the aluminum–oxygen surface. The trend on quartz surface (Figure 12c) was similar to the silicon–oxygen surface. Comparing kaolinite and quartz surfaces, CaCl2 consistently showed higher center-of-mass heights across different rock surfaces, while KCl and NaCl typically resulted in lower center-of-mass heights, indicating stronger interaction of these ions with mineral surfaces.
3.4. Decane–Water–Substrate System Results
This section investigated the wetting behavior of decane–water systems on different mineral substrates through molecular dynamics simulations, with detailed analysis of oil–water interface dynamics. Typical mineral substrates selected included kaolinite, quartz, graphene, and calcite, constructing decane–water–mineral multiphase systems with a simulation time of 25 ns.
3.4.1. Wetting Behavior
Figure 13 shows the changes in the water–decane–substrate system over time from 0 ps to 25,000 ps on different surfaces.
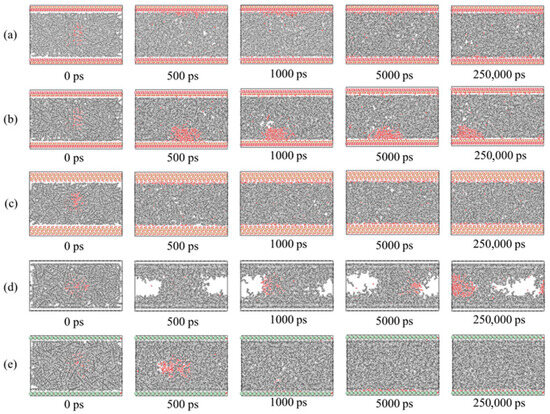
Figure 13.
Variation in water–decane–substrate system over time on different surfaces: (a) kaolinite aluminous surface, (b) kaolinite siliceous surface, (c) quartz, (d) single-layer graphene, and (e) calcite.
For the kaolinite aluminum–oxygen surface (Figure 13a), most water molecules adsorbed onto the kaolinite surface over time. For the kaolinite silicon–oxygen surface (Figure 13b), water molecules adsorbed on both upper and lower surfaces over time, mainly concentrated on the lower surface with lower adsorption degree than the aluminum–oxygen surface. For quartz (Figure 13c), water molecules completely adsorbed on both upper and lower quartz surfaces, indicating strong hydrophilicity. Graphene (Figure 13d) exhibited stronger oleophilicity, with decane molecules adsorbing on both upper and lower graphene layers while water molecules remained in the middle position. For the calcite surface, repeated simulations revealed randomness in adsorption surfaces, potentially occurring on either upper or lower layers, with water molecules completely adsorbing on calcite surfaces, demonstrating strong hydrophilicity.
3.4.2. Density Distribution Analysis
To visualize and analyze wetting results on different substrates, detailed statistical analysis of one-dimensional and two-dimensional density distributions for the entire system was conducted. Data from the last 5 ns of simulation were selected for analysis after the system reached relative stability. Results at 15 ns and 25 ns were compared and showed almost complete consistency, indicating dynamic equilibrium. Therefore, data from 20 ns were ultimately used.
Figure 14 presents the one-dimensional density distribution curves of decane–water on different mineral substrates: (a) graphene, (b) the kaolinite silicon–oxygen surface, (c) quartz, (d) graphene, and (e) calcite.
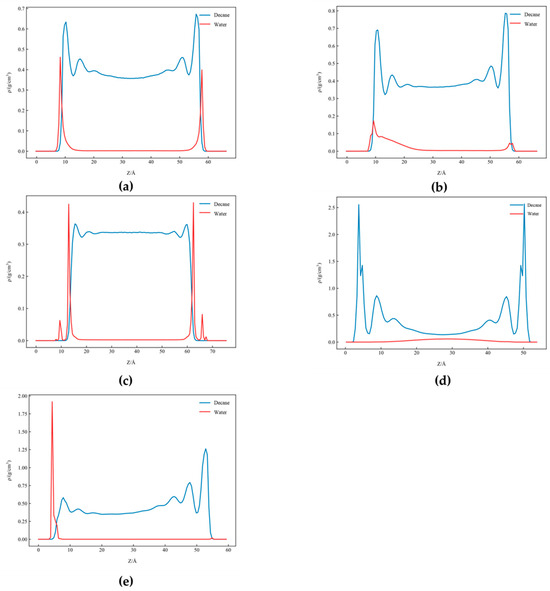
Figure 14.
One-dimensional density distribution curves of decane–water on different mineral substrates: (a) kaolinite aluminous surface, (b) kaolinite siliceous surface, (c) quartz, (d) graphene, and (e) calcite.
Figure 14 describes the one-dimensional density distribution for different mineral substrates, with substrates located on both sides of the horizontal axis. For the kaolinite aluminum–oxygen surface (Figure 14a), water molecule density peaks significantly increased near the substrate surface at ~0.45 g/cm3, showing strong adsorption characteristics, while density rapidly decreased in regions away from the substrate, indicating that water molecules occupied the kaolinite aluminum–oxygen surface. The decane molecule distribution was relatively uniform at ~0.65 g/cm3, indicating that the kaolinite aluminum–oxygen surface exhibited hydrophilicity. For the kaolinite silicon–oxygen surface (Figure 14b), water molecule density peaks (~0.1 g/cm3) were lower than the aluminum–oxygen surface but still concentrated near the lower substrate surface, showing moderate hydrophilicity. Decane molecule density was slightly higher in regions near the substrate with peak ~0.7 g/cm3.
For the quartz substrate (Figure 14c), strong hydrophilicity was evident, with water molecules forming high-density peaks ~0.45 g/cm3 at the surface and density rapidly decreasing away from the substrate. The decane molecule distribution was generally uniform at ~0.32 g/cm3. Due to strong quartz surface hydrophilicity, some water molecules could penetrate into the quartz interior, reflected in the density curves showing non-zero water density even inside quartz. In contrast, decane as a hydrophobic molecule struggled to penetrate the hydrophilic quartz interior, with its density distribution mainly concentrated in external regions.
In Figure 14d (graphene), the decane molecule density significantly increased near the substrate surface to ~2.5 g/cm3, demonstrating strong adsorption capacity of graphene for decane. In contrast, water density peaks were lower and mainly concentrated in positions away from the substrate, showing typical hydrophobic characteristics of graphene. Water density distribution showed a pattern of high in the middle and low at both ends, indicating that water molecules concentrated in the system’s central region, away from graphene surfaces at both ends.
Figure 14e (calcite) showed an extremely strong water adsorption capacity, with water molecule density peaks at ~1.85 g/cm3 located at one substrate surface, much higher than quartz and kaolinite. The decane molecule density peak of ~1.25 g/cm3 was at the other substrate surface. Differences in adsorption capacity of different mineral substrates for decane and water molecules mainly originated from their surface chemical properties and polarity differences.
Figure 15 presents two-dimensional density distribution maps for (a,b) calcite, (c,d) quartz, and (e,f) graphene, where (a,c,e) show oil density and (b,d,f) show water density.
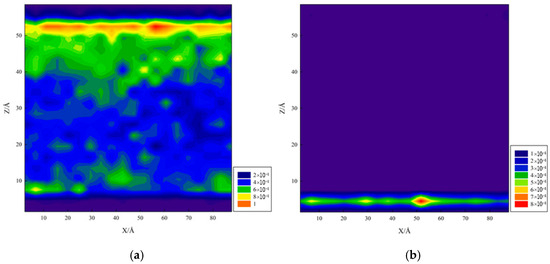

Figure 15.
Two-dimensional density distribution map: (a,b) calcite, (c,d) quartz, and (e,f) graphene.
According to oil and water two-dimensional density maps for calcite, water molecules were primarily adsorbed on the bottom calcite surface. In molecular simulations, initial system conditions and simulation time length also affect the final results. Analysis suggests that water initially contacted the lower calcite surface and reached a steady state during simulation, with water molecules tending to remain at that position without actively moving upward, especially in the presence of decane, as the upper calcite surface may lack sufficient adsorption driving force.
For the quartz surface (Figure 15c,d), which contains abundant polar groups capable of forming strong adsorption force with water molecules through hydrogen bonding, strong hydrophilicity was exhibited, with water molecules adsorbing on both substrate surfaces, unlike calcite. Graphene (Figure 15e,f), due to its non-polarity and surface hydrophobicity, showed weak water adsorption capacity but strong van der Waals forces with decane molecules, exhibiting significant hydrophobicity and strong oleophilicity. Density distribution showed water clearly concentrated in the system’s central region, away from graphene surfaces, indicating poor water wettability on graphene. Decane formed high-density adsorption layers on graphene surfaces, indicating good oil wettability.
Figure 16 presents the kaolinite system in two-dimensional density maps.
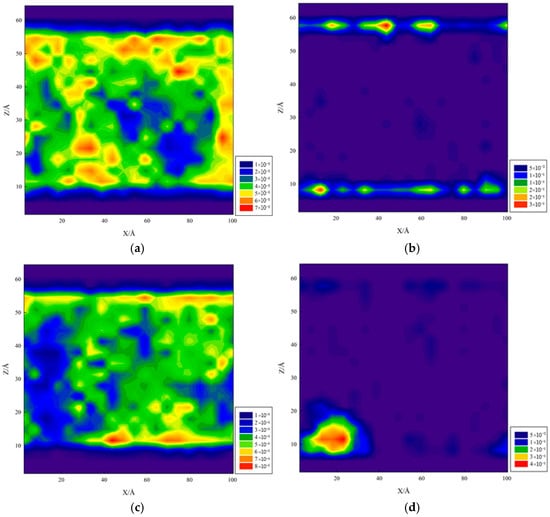
Figure 16.
Two-dimensional density distribution map of the kaolinite system: (a,b) aluminum–oxygen surface and (c,d) silicon–oxygen surface.
Figure 16a,b show the kaolinite aluminum–oxygen surface wettability, clearly showing water molecules forming uniform adsorbed water films on its surface. This water film tightly covered the kaolinite surface, displaying strong hydrophilicity, while decane molecules accumulated in the outer water film layer. The kaolinite aluminum–oxygen surface contains abundant polar groups capable of forming strong adsorption force with water molecules through hydrogen bonding, thus exhibiting strong hydrophilicity, while these polar groups have repulsive effects on non-polar decane molecules. Figure 16c,d show the kaolinite silicon–oxygen surface wettability, where water molecules showed stronger adsorption on the lower surface with less adsorption on the upper surface.
3.4.3. Interaction Energy Analysis
Interaction energies between molecular groups were calculated using non-bonded pairwise potentials (van der Waals and Coulombic terms). To ensure statistical reliability, instantaneous interaction energy values were extracted at each timestep after the system reached equilibrium, and these values were arithmetically averaged to obtain the reported interaction energies. Eo-s represents decane–substrate interaction energy, Eo-w represents decane–water interaction energy, and Ew-s represents water–substrate interaction energy.
Figure 17 shows the interaction energy of different minerals.
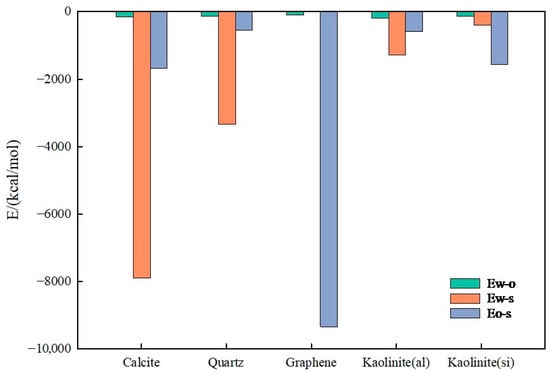
Figure 17.
Interaction energy of different minerals.
Figure 17 presents interaction energies for decane–water on different mineral surfaces (calcite, quartz, graphene, kaolinite aluminum–oxygen surface, and kaolinite silicon–oxygen surface), including water–oil interaction energy (Ew-o), water–substrate interaction energy (Ew-s), and oil–substrate interaction energy (Eo-s). By comparing Ew-s magnitudes, the hydrophilicity strength of different mineral surfaces can be ranked from high to low as follows: calcite > quartz > kaolinite aluminum–oxygen surface > kaolinite silicon–oxygen surface > graphene.
When the water molecule–mineral surface interaction energy Ew-s is large, mineral surfaces exhibit strong hydrophilicity, with water molecules tending to adsorb on mineral surfaces through hydrogen bonding or electrostatic interactions, forming water films on mineral surfaces. In this case, mineral wettability is mainly dominated by water–mineral substrate interaction energy; the larger the Ew-s value, the stronger the water molecule adsorption capacity on mineral surfaces and the higher the waterflooding efficiency. Conversely, if Ew-s is small, mineral surfaces show weak water adsorption capacity, exhibiting strong hydrophobicity or oleophilicity.
The oil–substrate interaction energy, Eo-s, reflects mineral surface affinity for the oil phase. Higher Eo-s values indicate stronger mineral surface adsorption capacity for the oil phase, thus exhibiting higher oleophilicity. The graphene surface Eo-s reached −1422.91 kcal/mol and −7043.61 kcal/mol for C8H18 and C18H38, respectively, far exceeding other minerals, indicating that graphene has the strongest oleophilicity, with oil molecules more easily spreading on its surface and poor water wettability, consistent with previous conclusions.
To study interaction energy differences, the interaction energy difference ΔE was examined, where positive ΔE values indicate that the water molecule–mineral surface interaction energy exceeds decane–clay mineral surface interaction energy: ΔE = Eo-s − Ew-s.
Figure 18 presents the interaction energy difference diagram.
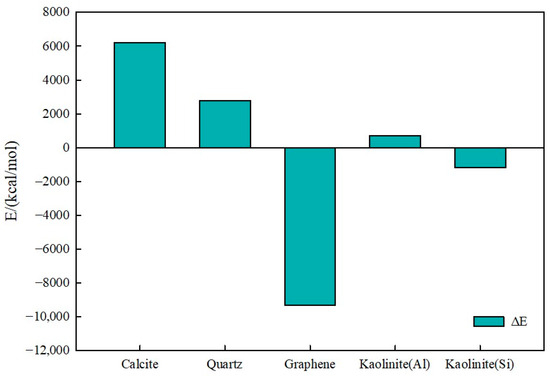
Figure 18.
Interaction energy difference (ΔE) diagram.
According to Figure 18, calcite, quartz, and the kaolinite aluminum–oxygen surface ΔE values were positive, indicating strong hydrophilicity in oil–water–mineral systems. Specifically, positive ΔE means water molecule interaction energy with these mineral surfaces exceeds oil molecule interaction energy with mineral surfaces. Therefore, water molecules more readily adsorb on these mineral surfaces, while oil molecules struggle to spread.
Analysis suggests that calcite, quartz, and kaolinite aluminum–oxygen surfaces contain abundant polar functional groups such as hydroxyl groups or oxygen atoms, which can form strong interactions with water molecules through hydrogen bonding or electrostatic interactions. Therefore, water molecules more easily form stable adsorption layers on these mineral surfaces, exhibiting strong hydrophilicity.
In oil–water–mineral systems, mineral surface hydrophilicity is crucial for waterflooding processes in petroleum extraction. Hydrophilic mineral surfaces are preferentially wetted by water, forming water films that hinder direct contact between oil molecules and mineral surfaces. This phenomenon reduces oil adhesion force, promoting oil flow, thereby improving reservoir recovery rates. Strongly hydrophilic minerals more easily form water-wet reservoirs, where water has higher permeability in reservoir pores while oil mobility is lower.
3.4.4. Effects of Temperature and Pressure
To investigate temperature and pressure effects on microscopic wetting characteristics of decane–water–substrate systems, molecular simulations were conducted for graphene, quartz, and the kaolinite silicon–oxygen surface under conditions of 300 K at 37 MPa, 300 K at 1 MPa, and 393 K at 37 MPa. One-dimensional density curves under different pressures and temperatures were compared.
Figure 19 presents the one-dimensional density distribution of decane at different temperatures for (a) graphene, (b) the kaolinite silicon–oxygen surface, and (c) quartz.
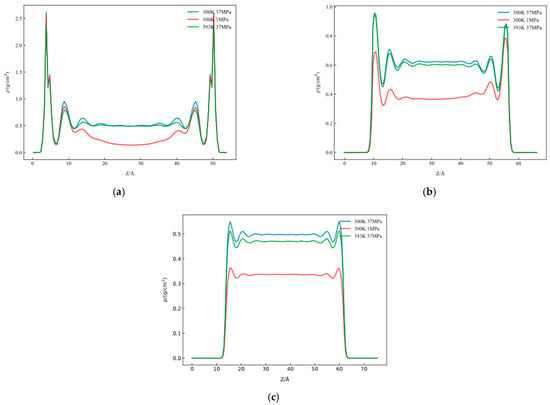
Figure 19.
One-dimensional density distribution of decane at different temperatures: (a) graphene, (b) kaolinite siliceous surface, and (c) quartz.
Comparing one-dimensional decane densities revealed that at 300 K, as pressure increased from 1 MPa to 37 MPa, overall decane density distribution increased by more than 50%, with one-dimensional density peaks near the interface all increasing. This indicates that high pressure enhanced intermolecular forces, causing decane molecules to pack more tightly near substrate surfaces. Under 37 MPa pressure conditions, when temperature increased from 300 K to 393 K, interfacial decane density peaks decreased by ~10%. This is mainly because increasing temperature enhances molecular thermal motion, thereby weakening decane molecule adsorption on substrate surfaces, making them more inclined to diffuse toward bulk phase, leading to decreased molecular aggregation at interfaces. Simultaneously, increasing temperature weakens interlayer ordering, causing interfacial layer structural weakening and density distribution curve flattening.
Comparing density distribution results for graphene, the kaolinite silicon–oxygen surface, and quartz showed that under identical conditions, decane density distributions on different substrates showed certain differences. Among them, decane density peaks on graphene surfaces were highest at ~2.5 g/cm3, indicating its strongest adsorption capacity for decane molecules, while density peaks on kaolinite silicon–oxygen and quartz surfaces were relatively lower, averaging ~0.8 g/cm3 and ~0.4 g/cm3, indicating weaker interfacial interactions. Overall, pressure and temperature significantly affect decane distribution on solid substrate surfaces, with high pressure helping enhance interfacial adsorption while high temperature weakens molecular layer aggregation effects.
3.5. Mixed Alkane–Water–Substrate System Results
In this study, methane, ethane, octane, and n-octadecane were selected as simplified shale oil component models, with 38 ns of molecular dynamics simulation conducted after sufficient relaxation to ensure system equilibrium. Substrate types included graphene, kaolinite, and quartz.
3.5.1. Wetting Behavior of Mixed Alkane System
Figure 20, Figure 21 and Figure 22 present simulation diagrams for graphene substrate, kaolinite aluminum–oxygen surface substrate, and quartz substrate with mixed alkane–water systems, respectively. In all figures, (a) represents 0 ns (initial simulation stage) and (b) represents simulation completion.

Figure 20.
Simulation diagram of graphene substrate–mixed alkane–water system: (a) 0 ns; (b) final state.
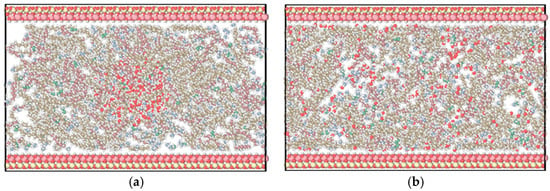
Figure 21.
Simulation diagram of the kaolinite aluminous surface substrate–mixed alkane–water system: (a) 0 ns; (b) final state.
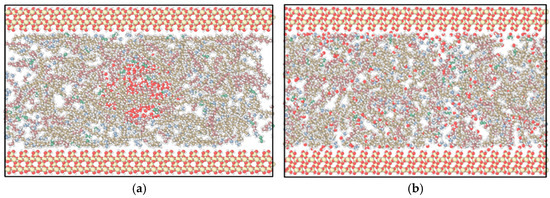
Figure 22.
Simulation diagram of the quartz substrate–mixed alkane–water system: (a) 0 ns; (b) final state.
After 38 ns molecular dynamics simulation, alkane molecules and water molecules in the system underwent significant diffusion and rearrangement. For graphene surfaces (Figure 20), long-chain alkanes occupied adsorption sites on graphene surfaces, forming layered arrangement structures, while methane, ethane, and water molecules distributed more dispersedly as shown in Figure 20b. On the kaolinite aluminum–oxygen surface (Figure 21), water molecules partially adsorbed on substrate surfaces, indicating certain hydrophilicity. On quartz surfaces (Figure 22), various alkane components exhibited relatively uniform distribution.
Simulation results showed that after system equilibrium, heavy components near graphene surfaces formed highly ordered layered arrangement structures. This heavy hydrocarbon enrichment phenomenon at interfaces promoted oil film formation.
3.5.2. Density Distribution Analysis
Detailed statistical analysis of one-dimensional density distribution for the entire system was conducted. To ensure data stability and representativeness, the last 5 ns after the simulation reached relative stability were selected for analysis, when system density curves showed small fluctuations and total system energy tended toward stability. To further verify whether the system reached dynamic equilibrium, additional comparative analysis of density distribution results at 35 ns and 38 ns was conducted. Results showed these two data sets were almost completely consistent, indicating the system entered a stable state at this stage without significant density fluctuations. Ultimately, simulation results from 35 ns were used for analysis.
Figure 23 presents one-dimensional density distributions of alkanes on different substrates, as follows: (a) graphene, (b) quartz, and (c) the kaolinite aluminum–oxygen surface.

Figure 23.
One-dimensional density distribution of alkane on different substrates: (a) graphene, (b) quartz, and (c) kaolinite aluminous surface.
Figure 23a (Graphene): As a typical non-polar substrate, graphene exhibited strong hydrophobicity. In density distribution curves, n-octadecane formed obvious adsorption peaks on graphene surfaces, indicating that long-chain alkanes more easily aggregate on graphene surfaces. Methane and ethane mainly distributed in the system’s central regions, indicating that short-chain alkanes were less affected by substrate adsorption and more inclined to disperse in fluid regions.
Figure 23b (Quartz): Being a hydrophilic substrate with surface hydroxyl groups, quartz showed weak adsorption capacity for alkanes. From a density distribution perspective, various alkane components exhibited relatively uniform distribution on quartz surfaces without forming significant adsorption layers. This indicates that quartz has relatively weak adsorption effects on alkanes, with fluids more easily dispersing throughout pore spaces.
Figure 23c (Kaolinite aluminum–oxygen surface): Density distribution curves showed n-octadecane formed relatively obvious adsorption layers on substrate surfaces, though adsorption peak intensity was far lower than on graphene. This indicates kaolinite surfaces have certain adsorption capacity for long-chain alkanes. Water molecules significantly increased on substrate surfaces, with the quartz surface water molecule density peaks higher than kaolinite aluminum–oxygen surfaces, consistent with previous conclusions. Hydroxylated quartz surfaces have stronger hydrophilicity than kaolinite aluminum–oxygen surfaces.
3.5.3. Interaction Energy Analysis
To accurately evaluate interaction energies between different components and substrates, instantaneous non-bonded interaction energies were extracted after equilibration and arithmetically averaged to ensure result stability and representativeness. As shown in Figure 24, analysis objects included CH4, C2H6, C8H18, and C18H38, with interaction energies calculated between each and graphene, the kaolinite aluminum–oxygen surface, and quartz surfaces.
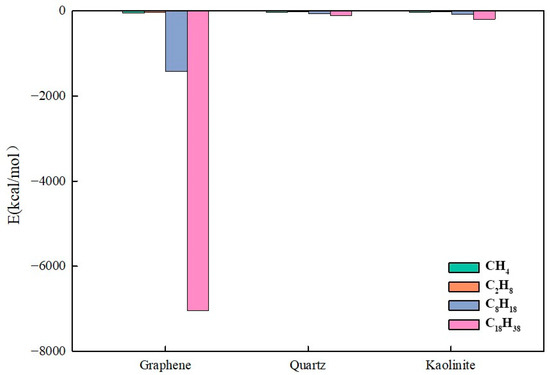
Figure 24.
Interaction energy between different components and substrates.
Figure 24 shows that heavy hydrocarbon component intermolecular forces are stronger. As carbon chain length increases, intermolecular forces in alkane molecules strengthen, leading to significantly enhanced adsorption capacity on substrate surfaces. On graphene surfaces, C8H18 and C18H38 interaction energies reached −1422.91 kcal/mol and −7043.61 kcal/mol, respectively. This indicates that long-chain alkanes have strong adsorption tendencies on graphene surfaces, mainly affected by intermolecular van der Waals forces and π-π interactions. On quartz and kaolinite surfaces, long-chain alkane interaction energies were far lower than those on graphene; on kaolinite surfaces, C18H38 interaction energy was only −193.59 kcal/mol, indicating limited adsorption capacity of hydrophilic substrates for heavy hydrocarbons.
For clearer comparison of interaction differences among light components, C8H18 and C18H38 data were removed, retaining only CH4 and C2H6 for comparative analysis.
Figure 25 shows that light alkane intermolecular forces are weaker. Methane and ethane belong to small-molecule hydrocarbons, mainly affected by van der Waals forces with relatively low interaction energies. On graphene surfaces, CH4 and C2H6 interaction energies were −46.01 kcal/mol and −29.31 kcal/mol, respectively, while on quartz and kaolinite aluminum–oxygen surfaces, these values significantly decreased. On quartz surfaces, ethane interaction energy was only −13.40 kcal/mol, indicating weak adsorption capacity on hydrophilic substrates.
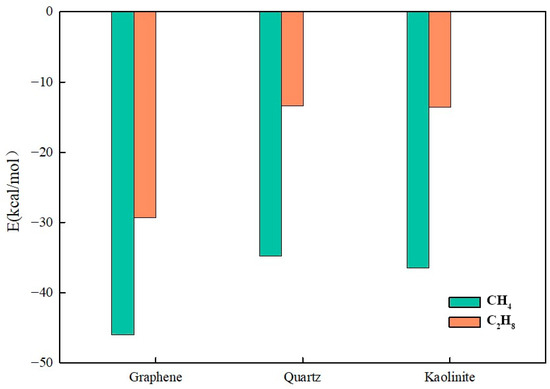
Figure 25.
Interaction energy between light components and substrate.
Graphene, due to its hydrophobicity and π-π interactions, showed strongest adsorption capacity for long-chain alkanes. This indicates that in organic matter-rich shale reservoirs or carbon mineral-rich environments, heavy hydrocarbons more readily adsorb on pore wall surfaces rather than flow freely, thereby affecting shale oil migration mechanisms. Quartz, having high hydrophilicity, showed a weak adsorption capacity for alkane molecules. On quartz surfaces, all alkane interaction energies were lower than other substrates, indicating that alkanes more easily exist in pore fluids rather than being adsorbed on matrix surfaces. The kaolinite aluminum–oxygen surface adsorption capacity was intermediate between that of graphene and quartz. Its adsorption effect on long-chain alkanes was slightly stronger than quartz but much weaker than that of graphene, indicating that in kaolinite-rich reservoirs, heavy hydrocarbons experience certain adsorption effects but not as significantly as in organic-rich shale reservoirs.
Alkane interaction energies on different substrates are affected by substrate surface chemical properties and alkane molecule size. Light alkanes, due to weaker intermolecular forces, exhibited low adsorption capacity on all substrates, while long-chain alkanes showed significant adsorption characteristics on strongly hydrophobic substrates (such as graphene).
3.5.4. Mean Square Displacement Analysis
Mean square displacement (MSD) methods were employed to quantitatively study the diffusion behavior of different components in water–mixed alkane–substrate systems. MSD reflects the average displacement of molecules over time and can be used to evaluate molecular migration capacity in different environments. MSD reflects particle diffusion velocity as a function of time; D is positively correlated with the MSD curve slope, with greater molecular freedom in systems indicating weaker adsorption effects.
To ensure MSD calculations reflect steady-state diffusion behavior, time intervals where MSD-t curves showed linear growth were selected for analysis; this section used MSD data from the first 5 ns for analysis. MSDs were calculated for the overall system, the mixed alkane portion, CH4, C2H6, C8H18, C18H38, and water molecules on graphene, kaolinite, and quartz substrates, with comparative analysis of diffusion rates for each component.
Figure 26 shows the overall system MSD plot.
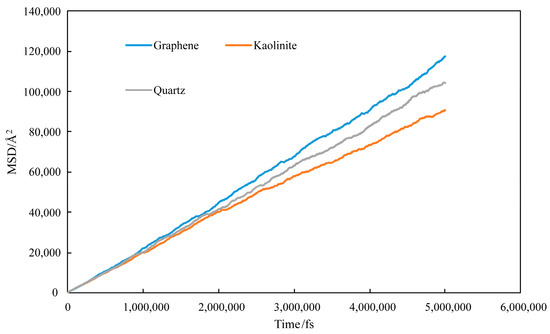
Figure 26.
MSD plot of water–mixed alkane–substrate system.
Among them, the graphene system had the highest MSD values, indicating the fastest molecular diffusion rates due to its non-polar characteristics minimizing fluid motion restrictions. Quartz surface MSD values were next, showing similar diffusion behavior; due to polar interactions with water, some water molecules were restricted at interfaces, but overall diffusion remained rapid. The kaolinite aluminum–oxygen surface has the lowest MSD values, as its strong polar interactions produced strong adsorption on water molecules, reducing overall fluidity. Therefore, MSDs of different components were analyzed to further explore distribution of different components, as shown in Figure 27.
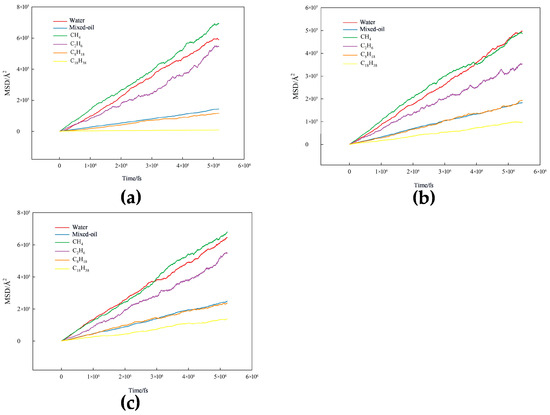
Figure 27.
Mean square displacement of each component: (a) graphene, (b) kaolinite aluminous surface, and (c) quartz.
Figure 27 presents the mean square displacements for different systems. Through MSD analysis of mixed oil–water systems in different mineral environments, diffusion characteristics were revealed. Results showed that the MSDs of various components exhibited consistency, with slopes ranking from large to small as follows: CH4 (7.0 × 10⁵ Å2) > H2O (5.9 × 10⁵ Å2) > C2H6 (5.5 × 10⁵ Å2) > mixed oil overall (1.5 × 10⁵ Å2) > C8H18 (1.2 × 10⁵ Å2) > C18H38 (0.1 × 10⁵ Å2) (Graphene), CH4 (5.0 × 10⁵ Å2) ≈ H2O > C2H6 (3.5 × 10⁵ Å2) > mixed oil overall (1.9 × 10⁵ Å2) ≈ C8H18 > C18H38(1.0 × 10⁵ Å2) (Kaolinite); and CH4 (6.8 × 10⁵ Å2) > H2O (6.5 × 10⁵ Å2) > C2H6 (5.5 × 10⁵ Å2) > mixed oil overall (2.5 × 10⁵ Å2) > C8H18 (2.4 × 10⁵ Å2) > C18H38 (1.4 × 10⁵ Å2) (Quartz).
CH4 possesses the smallest molecular size and weakest intermolecular forces, therefore diffusing fastest with the highest MSD slope. The MSD of water molecule was second only to CH4, mainly attributed to its relatively small molecular size and dynamic reorganization of strong hydrogen bond networks, maintaining certain fluidity in systems. Although C2H6 has stronger intermolecular interactions than CH4, due to its relatively small size, it still maintained high diffusion rates. In contrast, the overall MSD of mixed oil was lower than that of C2H6, indicating that the presence of heavier alkanes reduced the system’s overall fluidity. The MSDs of C8H18 and C18H38 decreased sequentially, with C18H38 having the longest carbon chains and strongest van der Waals forces, resulting in the slowest diffusion.
Due to substrates being located at the system’s upper and lower boundaries, constraining fluid motion, molecular diffusion in the z-direction experienced more significant limitations, while x- and y-direction diffusion was mainly affected by fluid properties and intermolecular interactions.
4. Conclusions
This study employed molecular dynamics simulations to investigate mineral surface wettability under different salinity conditions and oil–water–mineral interfacial behavior. The main conclusions are as follows:
(1) All studied minerals exhibited hydrophilic characteristics (contact angles < 75°), with water molecules forming hydration structures through electrostatic interactions and hydrogen bonding with surface atoms.
(2) Increasing salinity weakened water wettability on all minerals, with Ca2+ showing the strongest effect due to its high charge density and enhanced ion adsorption at interfaces.
(3) Different substrates exhibited distinct wettability: calcite, quartz, and the kaolinite aluminum–oxygen surfaces were strongly hydrophilic (positive ΔE values) and favorable for waterflooding, while graphene showed strong oleophilicity with dense oil adsorption layers.
(4) High pressure enhanced interfacial adsorption, while high temperature promoted molecular diffusion. Heavy hydrocarbons (C8H18, C18H38) preferentially adsorbed on surfaces, especially forming ordered structures on graphene, while light hydrocarbons distributed uniformly.
These molecular-scale insights provide critical foundations for reservoir wettability management and EOR optimization. Understanding how salinity, ion composition, and mineral surfaces control wettability at the molecular level enables strategic design of injection fluid chemistry to alter rock wettability favorably. The preferential adsorption patterns of different hydrocarbon components inform surfactant selection and low-salinity waterflooding strategies, allowing operators to tailor EOR approaches based on specific reservoir mineralogy and crude oil composition for maximized recovery efficiency.
Author Contributions
Conceptualization, H.X. and B.J.; methodology, H.X. and X.Z.; software, H.X.; validation, H.X., X.Z., and L.Z.; formal analysis, H.X. and L.Z.; investigation, H.X. and X.Z.; resources, B.J.; data curation, H.X. and L.Z.; writing—original draft preparation, H.X.; writing—review and editing, X.Z., L.Z., and B.J.; visualization, H.X. and L.Z.; supervision, B.J.; project administration, B.J.; funding acquisition, B.J. All authors have read and agreed to the published version of the manuscript.
Funding
This work was supported by the National Natural Science Foundation of China (Grant No. 5247040153).
Data Availability Statement
All data included in this article and the Appendix A are available upon request by contacting the corresponding author.
Conflicts of Interest
Honggang Xin and Liwen Zhu are employees of PetroChina Changqing Oilfield Company. The paper reflects the views of the scientists and not the company. The remaining authors declare that the research was conducted in the absence of any commercial or financial relationships that could be construed as a potential conflict of interest.
Appendix A
Appendix A.1
Water droplet models employed the Simple Point Charge (SPC) water model, establishing a water sphere with a radius of 12 Å. The SPC model was chosen because of its superior prediction of the water self-diffusion coefficient and compatibility with mineral–water interfaces. To study the influence of salinity, solution models with different concentrations of NaCl, CaCl2, and KCl were constructed. The solution models used the SPC water model along with Na+, Ca2+, K+, and Cl− ion models. Salinity was set at 0 ppm (pure water), 10,000 ppm, 50,000 ppm, and 100,000 ppm.
The ionic strength (ppm) was converted to molarity (mol/L) for use in simulations. For dilute aqueous solutions, ppm can be approximated as mg/L. The conversion follows the following relationship: Molarity (mol/L) = [ppm/1000]/MW, where MW is the molecular weight of the salt in g/mol (NaCl: 58.44 g/mol, CaCl2: 110.98 g/mol, KCl: 74.55 g/mol). For example, 5000 ppm NaCl equals ~5000 mg/L, which converts to 5.0 g/L, and dividing by the molecular weight gives 5.0/58.44 = 0.0856 mol/L. In a typical simulation box of 100 Å × 100 Å × 100 Å (volume of 1000 nm3 or 1.0 × 10⁻²¹ L), 5000 ppm NaCl solution would contain approximately 33,422 water molecules, 52 Na+ ions, and 52 Cl− ions. The number of ions in each simulation was calculated as follows: Number of ions = Molarity × Volume (L) × Avogadro’s number (6.022 × 10²³).
Different salinity solution models were combined with different substrates to form rock substrate–solution interface models, as shown in Figure A2. In the initial configuration, the solution model was placed above the rock substrate, ensuring an initial distance of approximately 5 Å between the solution and substrate surface to avoid configurational overlap.
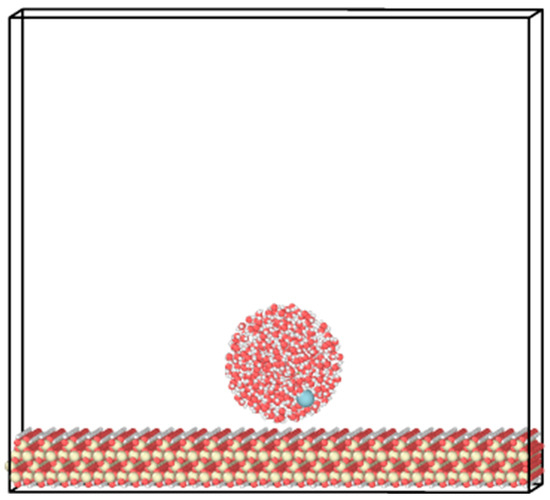
Figure A1.
Initial model diagram.
Appendix A.2
For the decane–water–substrate system, decane molecules were modeled using the OPLS-AA force field [35,36,37], water molecules used the SPC model, and substrates employed the CLAYFF force field [38,39,40]. The simulation system consisted of a decane–water layer with different substrate surfaces, specifically including the kaolinite aluminum–oxygen surface, the kaolinite silicon–oxygen surface, quartz, monolayer graphene, and calcite. The total height of the decane–water layer was set at 50 Å. The initial model configuration is shown in Figure A3.
The selection of SPC water model and L-OPLS-AA force field was based on their established validation for reservoir-relevant conditions. The SPC water model has been extensively validated across temperatures of 250–400 K and pressures of 0.1–1000 MPa, with an average absolute deviation of 4.5% for density predictions and reasonable agreement for other thermophysical properties, including heat capacity, isothermal compressibility, and speed of sound [41]. For hydrocarbon systems, the L-OPLS-AA modification corrects the original OPLS-AA limitations for long-chain alkanes, achieving excellent density predictions (typically within 0.5%–1% for alkanes ranging from hexane to pentadecane) and improved viscosity and diffusion coefficient calculations compared to the original OPLS-AA [36]. This combination of CLAYFF (minerals) + SPC/E (water) + L-OPLS-AA (hydrocarbons) represents a validated framework for mineral–water–hydrocarbon interfaces in petroleum engineering applications. Under reservoir conditions (high T, high P), these models maintain acceptable accuracy for key properties including density and transport properties, making them suitable for mechanistic studies and qualitative predictions in subsurface systems.
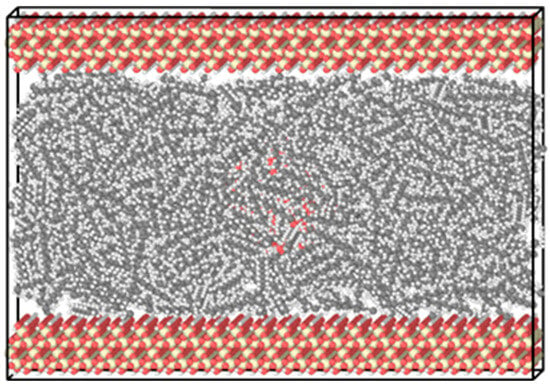
Figure A2.
Initial configuration of the decane–water–substrate molecular model.
For the mixed oil system, the composition was based on molar ratios determined from actual production data. Table A1 presents the alkane proportions, which were simplified to four key components for simulation (Table A2).

Table A1.
Proportion of alkanes in Gulong shale oil.
Table A1.
Proportion of alkanes in Gulong shale oil.
| Component | Mole Percentage % |
|---|---|
| CH4 | 48.071 |
| C2H6 | 11.381 |
| C3H8 | 5.7327 |
| C4H10 | 2.3764 |
| C5H12 | 1.7283 |
| C6H14 | 2.7466 |
| C7H16 | 3.0002 |
| C8H18 | 3.9965 |
| C9H20 | 3.5578 |
| C10H22 | 2.7442 |
| C11H24 | 2.1181 |
| C12H26 | 1.7419 |
| C13H28 | 1.6572 |
| C14H30 | 1.3018 |
| C15H32 | 1.2379 |
| C16H34 | 0.9658 |
| C17H36 | 0.8395 |
| C18H38 | 0.7965 |
| C19H40 | 0.7118 |
| C20H42~C32H66 | 3.2955 |

Table A2.
Simplified oil component proportions and number of molecules.
Table A2.
Simplified oil component proportions and number of molecules.
| Component | Mole Percentage/% | Molecule Number |
|---|---|---|
| CH4 | 48.07 | 315 |
| C2H6 | 11.38 | 75 |
| C8H18 | 19.58 | 135 |
| C18H38 | 20.97 | 135 |
The mixed alkane system included methane (CH4), ethane (C2H6), n-octane (C8H18), and n-octadecane (C18H38). The substrates selected were graphene, kaolinite, and quartz. Simulations were conducted at reservoir temperature (393 K) and pressure (37 MPa). The mixed alkane–water layer system had a total height of 50 Å, and the model size was approximately 100 × 100 × 75 Å3. The initial model configuration is illustrated in Figure A4.
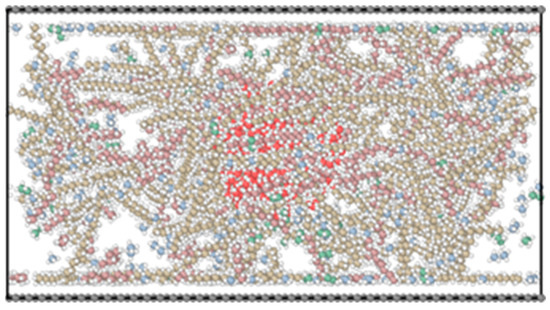
Figure A3.
Schematic diagram of the initial model of mixed oil–water–substrate system.
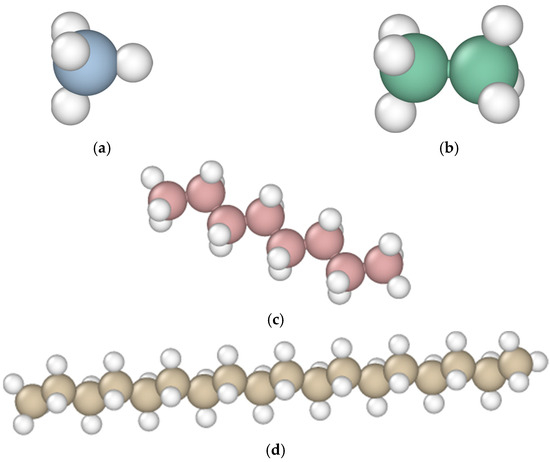
Figure A4.
Structural diagrams of (a) CH4, (b) C2H6, (c) C8H18, and (d) C18H38.
Appendix A.3
Clay minerals employed the CLAYFF force field, a universal parameterized force field designed for simulating clay minerals and related materials. It consists of Coulombic forces, van der Waals forces, bond stretching, and angle bending components.
Salt ions such as NaCl were introduced into the MD system through a systematic replacement procedure where pure water droplets equilibrated for 2 ns at 300 K on mineral surfaces served as the starting configuration. After which, the PACKMOL algorithm randomly selected water molecules for substitution with ions while enforcing spatial constraints of minimum 5.0 Å ion–ion separation and 4.0 Å ion–surface distance to avoid unphysical contacts, with the number of ions determined by converting target ppm concentrations.
Alkane molecules used the OPLS-AA force field. Parameters are shown in Table A3.

Table A3.
OPLS-AA force field parameters.
Table A3.
OPLS-AA force field parameters.
| Molecule | Atom | Connection | q (e) | ε (kcal/mol) | δ (Å) |
|---|---|---|---|---|---|
| CH4 | C | CH4 | 0.24 | 0.066 | 3.5 |
| H | H-C | 0.06 | 0.03 | 2.5 | |
| C2H6 | C | CH3- | 0.18 | 0.066 | 3.5 |
| H | H-C | 0.12 | 0.03 | 2.5 | |
| C8H18 | C | CH3- | 0.18 | 0.066 | 3.5 |
| C | -CH2- | 0.12 | 0.066 | 3.5 | |
| H | H-C | 0.06 | 0.03 | 2.5 | |
| C18H38/C10H22 | C | CH3- | 0.18 | 0.066 | 3.5 |
| C | -CH2- | 0.12 | 0.066 | 3.5 | |
| H | H-C | 0.06 | 0.03 | 2.5 |
References
- Zhang, C.; Wang, X.; Li, L.; Miller, J.D.; Jin, J. Surface Wettability Analysis from Adsorption Energy and Surface Electrical Charge. Minerals 2024, 14, 628. [Google Scholar] [CrossRef]
- Morrow, N.R. Wettability and Its Effect on Oil Recovery. J. Pet. Technol. 1990, 42, 1476–1484. [Google Scholar] [CrossRef]
- Wang, T.; Tian, F.; Deng, Z.; Hu, H. The Characteristic Development of Micropores in Deep Coal and Its Relationship with Adsorption Capacity on the Eastern Margin of the Ordos Basin, China. Minerals 2023, 13, 302. [Google Scholar] [CrossRef]
- Wang, Y.; Deng, H.; Wang, Z.; Wang, X.; Cao, Q.; Cheng, D.; Zhu, Y.; Li, A. Characteristics and Factors Influencing Pore Structure in Shale Oil Reservoirs of Different Lithologies in the Jurassic Lianggaoshan Formation of the Yingshan Gas Field in Central Sichuan Basin. Minerals 2023, 13, 958. [Google Scholar] [CrossRef]
- Alvarez, J.O.; Schechter, D.S. Wettability Alteration and Spontaneous Imbibition in Unconventional Liquid Reservoirs by Surfactant Additives. SPE Reserv. Eval. Eng. 2017, 20, 107–117. [Google Scholar] [CrossRef]
- Faramarzi-Palangar, M.; Mirzaei-Paiaman, A.; Ghoreishi, S.A.; Ghanbarian, B. Wettability of Carbonate Reservoir Rocks: A Comparative Analysis. Appl. Sci. 2021, 12, 131. [Google Scholar] [CrossRef]
- Yang, Y.; Wang, K.; Zhang, L.; Sun, H.; Zhang, K.; Ma, J. Pore-Scale Simulation of Shale Oil Flow Based on Pore Network Model. Fuel 2019, 251, 683–692. [Google Scholar] [CrossRef]
- Liu, B.; Shi, J.; Wang, M.; Zhang, J.; Sun, B.; Shen, Y.; Sun, X. Reduction in Interfacial Tension of Water–Oil Interface by Supercritical CO2 in Enhanced Oil Recovery Processes Studied with Molecular Dynamics Simulation. J. Supercrit. Fluids 2016, 111, 171–178. [Google Scholar] [CrossRef]
- Wang, S.; Feng, Q.; Javadpour, F.; Yang, Y.-B. Breakdown of Fast Mass Transport of Methane through Calcite Nanopores. J. Phys. Chem. C 2016, 120, 14260–14269. [Google Scholar] [CrossRef]
- Zhang, W.; Feng, Q.; Wang, S.; Zhang, X.; Zhang, J.; Cao, X. Molecular Simulation Study and Analytical Model for Oil–Water Two-Phase Fluid Transport in Shale Inorganic Nanopores. Energies 2022, 15, 2521. [Google Scholar] [CrossRef]
- Fang, T.; Wang, M.; Gao, Y.; Zhang, Y.; Yan, Y.; Zhang, J. Enhanced Oil Recovery with CO2/N2 Slug in Low Permeability Reservoir: Molecular Dynamics Simulation. Chem. Eng. Sci. 2019, 197, 204–211. [Google Scholar] [CrossRef]
- Zheng, M.; Chen, Y.; Tang, T.; Wu, Y.; Chen, Y.; Chen, J.; Peng, S.; Zhang, J. Multiscale Characterization of Pore Structure and Heterogeneity in Deep Marine Qiongzhusi Shales from Southern Basin, China. Minerals 2025, 15, 515. [Google Scholar] [CrossRef]
- RezaeiDoust, A.; Puntervold, T.; Strand, S.; Austad, T. Smart Water as Wettability Modifier in Carbonate and Sandstone: A Discussion of Similarities/Differences in the Chemical Mechanisms. Energy Fuels 2009, 23, 4479–4485. [Google Scholar] [CrossRef]
- Al-Bayati, A.; Karunarathne, C.I.; Al Jehani, A.S.; Al-Yaseri, A.Z.; Keshavarz, A.; Iglauer, S. Wettability Alteration during Low-Salinity Water Flooding. Energy Fuels 2022, 36, 871–879. [Google Scholar] [CrossRef]
- Mehdiyev, F.; Erzuah, S.; Omekeh, A.; Fjelde, I. Surface Complexation Modelling of Wettability Alteration during Carbonated Water Flooding. Energies 2022, 15, 3020. [Google Scholar] [CrossRef]
- Arain, A.H.; Negash, B.M.; Farooqi, A.S.; Alshareef, R.S. Improving Oil Recovery through Low Salinity Waterflooding and Nanoparticles: A Mini Review. Energy Fuels 2024, 38, 17109–17127. [Google Scholar] [CrossRef]
- Srivastava, V.R.; Sarma, H.K.; Gupta, S.K. Low-Salinity Waterflooding for EOR in Field A of Western Offshore Basin: A Pilot Study Analysis with Laboratory and Simulation Studies—Early Observations. Energies 2024, 17, 2149. [Google Scholar] [CrossRef]
- Ghafari, M.A.; Ghasemi, M.; Niasar, V.; Babaei, M. Wetting Preference of Silica Surfaces in the Context of Underground Hydrogen Storage: A Molecular Dynamics Perspective. Langmuir 2024, 40, 20559–20575. [Google Scholar] [CrossRef]
- Fentaw, J.W.; Emadi, H.; Hussain, A.; Fernandez, D.M.; Thiyagarajan, S.R. Geochemistry in Geological CO2 Sequestration: A Comprehensive Review. Energies 2024, 17, 5000. [Google Scholar] [CrossRef]
- Mohammed, I.; Isah, A.; Al Shehri, D.; Mahmoud, M.; Arif, M.; Kamal, M.S.; Alade, O.S.; Patil, S. Effect of Sulfate-Based Scales on Calcite Mineral Surface Chemistry: Insights from Zeta-Potential Experiments and Their Implications on Wettability. ACS Omega 2022, 7, 28571–28587. [Google Scholar] [CrossRef]
- Haagh, M.E.J.; Sîretanu, I.; Duits, M.H.G.; Mugele, F. Salinity-Dependent Contact Angle Alteration in Oil/Brine/Silicate Systems: The Critical Role of Divalent Cations. Langmuir 2017, 33, 3349–3357. [Google Scholar] [CrossRef] [PubMed]
- Karimpour Khamaneh, M.; Mahani, H. Pore-Scale Insights into the Nonmonotonic Effect of Injection Water Salinity on Wettability and Oil Recovery in Low-Salinity Waterflooding. Energy Fuels 2023, 37, 14764–14777. [Google Scholar] [CrossRef]
- Araujo, I.S.; Heidari, Z. Elucidating Wettability Alteration on Clay Surface Contacting Mixed Electrolyte Solution: Implications to Low-Salinity Waterflooding. SPE J. 2025, 30, 169–179. [Google Scholar] [CrossRef]
- Chen, Y.; Shokri, J.; Niasar, V.; Mehana, M.; Wood, C.D.; Elakneswaran, Y.; Zhao, J. Fluid-Fluid Interfacial Properties during Low Salinity Waterflooding. J. Mol. Liq. 2023, 390, 123142. [Google Scholar] [CrossRef]
- Zhang, L.; Lu, X.; Liu, X.; Yang, K.; Zhou, H. Surface Wettability of Basal Surfaces of Clay Minerals: Insights from Molecular Dynamics Simulation. Energy Fuels 2016, 30, 149–160. [Google Scholar] [CrossRef]
- Yuan, Q.; Zhu, X.; Lin, K.; Zhao, Y.-P. Molecular Dynamics Simulations of the Enhanced Recovery of Confined Methane with Carbon Dioxide. Phys. Chem. Chem. Phys. 2015, 17, 31887–31893. [Google Scholar] [CrossRef]
- Wang, X.; Cheng, H.; Chai, P.; Bian, J.; Wang, X.; Liu, Y.; Yin, X.; Pan, S.; Pan, Z. Pore Characterization of Different Clay Minerals and Its Impact on Methane Adsorption Capacity. Energy Fuels 2020, 34, 12204–12214. [Google Scholar] [CrossRef]
- Zhao, J.; Jin, Z.; Jin, Z.; Wen, X.; Geng, Y. Origin of Authigenic Quartz in Organic-Rich Shales of the Wufeng and Longmaxi Formations in the Sichuan Basin, South China: Implications for Pore Evolution. J. Nat. Gas Sci. Eng. 2017, 38, 21–38. [Google Scholar] [CrossRef]
- Thompson, A.P.; Aktulga, H.M.; Berger, R.; Bolintineanu, D.S.; Brown, W.M.; Crozier, P.S.; Veld, P.J.I.; Kohlmeyer, A.; Moore, S.G.; Nguyen, T.D.; et al. LAMMPS—A Flexible Simulation Tool for Particle-Based Materials Modeling at the Atomic, Meso, and Continuum Scales. Comput. Phys. Commun. 2022, 271, 108171. [Google Scholar] [CrossRef]
- Stukowski, A. Visualization and Analysis of Atomistic Simulation Data with OVITO–the Open Visualization Tool. Model. Simul. Mater. Sci. Eng. 2009, 18, 015012. [Google Scholar] [CrossRef]
- Martínez, L.; Andrade, R.; Birgin, E.G.; Martínez, J.M. PACKMOL: A Package for Building Initial Configurations for Molecular Dynamics Simulations. J. Comput. Chem. 2009, 30, 2157–2164. [Google Scholar] [CrossRef] [PubMed]
- Jewett, A.I.; Stelter, D.; Lambert, J.; Saladi, S.M.; Roscioni, O.M.; Ricci, M.; Autin, L.; Maritan, M.; Bashusqeh, S.M.; Keyes, T.; et al. Moltemplate: A Tool for Coarse-Grained Modeling of Complex Biological Matter and Soft Condensed Matter Physics. J. Mol. Biol. 2021, 433, 166841. [Google Scholar] [CrossRef]
- Downs, R.T. The American Mineralogist Crystal Structure Database. Am. Mineral. 2006, 91, 1260–1263. [Google Scholar]
- Lu, J.; Zeng, H.; Wang, Q.; Feng, Z.; Jiang, H.; Wang, R.; Li, B.; Huo, Q.; Sun, L. Phase behavior of nanoconfined continental shale oil and reservoir fluid phases in the Gulong shale of the Songliao basin. Sci. Rep. 2025, 15, 16210. [Google Scholar] [CrossRef] [PubMed]
- Jorgensen, W.L.; Maxwell, D.S.; Tirado-Rives, J. Development and Testing of the OPLS All-Atom Force Field on Conformational Energetics and Properties of Organic Liquids. J. Am. Chem. Soc. 1996, 118, 11225–11236. [Google Scholar] [CrossRef]
- Siu, S.W.I.; Pluhackova, K.; Böckmann, R.A. Optimization of the OPLS-AA Force Field for Long Hydrocarbons. J. Chem. Theory Comput. 2012, 8, 1459–1470. [Google Scholar] [CrossRef] [PubMed]
- Fang, Y.; Li, Z.; Yang, E.; Sha, M.; Song, S. Molecular Dynamics Simulation Study on the Occurrence of Shale Oil in Hybrid Nanopores. Molecules 2024, 29, 312. [Google Scholar] [CrossRef]
- Cygan, R.T.; Liang, J.-J.; Kalinichev, A.G. Molecular Models of Hydroxide, Oxyhydroxide, and Clay Phases and the Development of a General Force Field. J. Phys. Chem. B 2004, 108, 1255–1266. [Google Scholar] [CrossRef]
- Greathouse, J.A.; Cygan, R.T. Molecular Dynamics Simulation of Uranyl(VI) Adsorption Equilibria onto an External Montmorillonite Surface. Phys. Chem. Chem. Phys. 2005, 7, 3580–3586. [Google Scholar] [CrossRef]
- Ho, T.A.; Criscenti, L.J.; Greathouse, J.A. Revealing Transition States during the Hydration of Clay Minerals. J. Phys. Chem. Lett. 2019, 10, 3704–3709. [Google Scholar] [CrossRef] [PubMed]
- Jasiok, B.; Pribylov, A.A.; Postnikov, E.B.; Friant-Michel, P.; Millot, C. Thermophysical Properties of the SPC/E Model of Water between 250 and 400 K at Pressures up to 1000 MPa. Fluid Phase Equilib. 2024, 584, 114118. [Google Scholar] [CrossRef]
Disclaimer/Publisher’s Note: The statements, opinions and data contained in all publications are solely those of the individual author(s) and contributor(s) and not of MDPI and/or the editor(s). MDPI and/or the editor(s) disclaim responsibility for any injury to people or property resulting from any ideas, methods, instructions or products referred to in the content. |
© 2025 by the authors. Licensee MDPI, Basel, Switzerland. This article is an open access article distributed under the terms and conditions of the Creative Commons Attribution (CC BY) license (https://creativecommons.org/licenses/by/4.0/).