Article

Benchmarking Hierarchical and Spectral Clustering for Geochemical Baseline and Anomaly Detection in Hyper-Arid Soils of Northern Chile

by
Georginio Ananganó-Alvarado
1,
Brian Keith-Norambuena
1,
Elizabeth J. Lam
2,*,
Ítalo L. Montofré
3,
Angélica Flores
1,
Carolina Flores
1 and
Jaume Bech
4,*
1
Department of Computing & Systems Engineering, Universidad Católica del Norte, Antofagasta 1270709, Chile
2
Department of Chemical and Environmental Engineering, Universidad Católica del Norte, Antofagasta 1270709, Chile
3
Department of Mining and Metallurgical Engineering, Universidad Católica del Norte, Antofagasta 1270709, Chile
4
Soil Science Laboratory, Faculty of Biology, Universidad de Barcelona, 08023 Barcelona, Spain
*
Authors to whom correspondence should be addressed.
Minerals 2025, 15(11), 1185; https://doi.org/10.3390/min15111185
Submission received: 1 October 2025 / Revised: 30 October 2025 / Accepted: 9 November 2025 / Published: 11 November 2025
(This article belongs to the Section Environmental Mineralogy and Biogeochemistry)

Abstract

Establishing robust geochemical baselines in the hyper-arid Atacama Desert remains challenging because of extreme climatic gradients, polymetallic mineralisation, and decades of intensive mining. To disentangle natural lithogeochemical signals from anthropogenic inputs, a region-wide, multi-institutional soil dataset (1404 samples; 32 elements) was compiled. The analytical workflow integrated compositional data analysis (CoDA) with isometric log-ratio transformation (ILR), principal component analysis (PCA), robust principal component analysis (RPCA), and consensus anomaly detection via hierarchical (HC) and spectral clustering (SC), applied both with and without spatial coordinates to capture compositional structure and geographic autocorrelation. Optimal cluster solutions differed among laboratory subsets (k = 2–17), reflecting instrument-specific biases. The dual workflows flagged 76 (geochemical-only) and 83 (geo-spatial) anomalies, of which 33 were jointly identified, yielding high-confidence exclusions. Regional baselines for 13 priority elements were subsequently computed, producing thresholds such as As = 66.9 mg · kg−1, Pb = 53.6 mg · kg−1, and Zn = 166.8 mg · kg−1. Incorporating spatial variables generated more coherent, lithology-aligned clusters without sacrificing sensitivity to geochemical extremes (Jaccard index = 0.26). These findings demonstrate that a reproducible, compositional-aware machine learning workflow can separate overlapping geogenic and anthropogenic signatures in heterogeneous terrains. The resulting baselines provide an operational reference for environmental monitoring in northern Chile and a transferable template for other arid mining locations.

1. Introduction

Arid and hyperarid regions pose a distinct challenge for environmental geochemistry. In these landscapes, soils evolve slowly and retain the imprint of lithogenic processes for millennia. Under such conditions, even modest enrichments of metals can persist far longer than expected, a phenomenon documented in long-term studies of tailings and soil persistence [1]. Whether such enrichments represent ancient hydrothermal legacy or recent anthropogenic deposition depends on the existence of a reliable geochemical baseline [2,3]. Yet many baseline assessments still rely on univariate thresholds that flatten complexity, disregarding spatial structure, inter-element relationships, and lithological variability [2,3].
Few places illustrate this problem more clearly than the Atacama Desert. Extreme aridity has preserved subtle geochemical contrasts linked to lithology, geomorphology, and atmospheric input [4]. At the same time, the intensive extraction of copper, arsenic, lead and zinc has left an unmistakable footprint in tailings, leachates, and dust plumes [5]. The result is a mosaic of nearly pristine surfaces interspersed with heavily altered ones. Untangling these overlapping signals requires not only detailed sampling, but also analytical frameworks able to accommodate geological diversity while isolating the contribution of human activity.
For decades, geochemical baselines were commonly established using univariate methods such as percentile thresholds, probability plots, or Tukey boxplot fences [2,3]. These approaches gained popularity for their simplicity, but their limitations are evident: they neglect element associations, spatial autocorrelation, and compositional constraints of geochemical data. As a result, heterogeneous terrains are often reduced to generalized classifications that conceal meaningful patterns [6,7].
Multivariate methods provided a way forward. Principal Component Analysis (PCA), Factor Analysis (FA), discriminant analysis, and robust outlier detection have all been applied to extract latent structures in multi-element datasets [6,7]. Still, raw geochemical compositions violate the assumptions of these methods, making Compositional Data Analysis (CoDA) transformations—particularly the Isometric Log-Ratio (ILR)—essential for valid inference [8,9]. Even with such treatments, clustering applied to transformed scores can yield divergent results depending on preprocessing, scaling, and algorithmic settings [2,9].
In recent years, unsupervised Machine Learning (ML) has expanded the analytical toolkit. Algorithms such as Hierarchical Clustering (HC), Gaussian Mixture Models (GMMs), Self-Organizing Maps (SOMs), Density-Based Spatial Clustering of Applications with Noise (DBSCAN), and Spectral Clustering (SC) have been used to partition geochemical datasets and highlight anomalous signatures [10,11]. Hybrid workflows, where dimensionality reduction, such as principal component analysis (PCA) or low-rank principal component analysis (PCA-LR), is coupled with clustering or anomaly detection algorithms such as Isolation Forest and One-Class Support Vector Machine (SVM), have further demonstrated their ability to resolve subtle and overlapping geochemical signals [8,12].
Examples from arid environments highlight both progress and limitations. Ref. [13] applied statistical and ML methods in Chinese deserts, delineating geochemical zones despite extreme aridity. In the Atacama Desert, previous work has established background concentrations for multiple elements by combining robust statistics with clustering, capturing lithological and anthropogenic influences [14]. These cases reveal the promise of advanced methods, while underscoring the persistent difficulties in defining baselines in desert terrains.
Despite these advances, critical gaps remain. Most applications of multivariate and ML techniques are confined to relatively homogeneous geology, leaving unresolved how to define baselines in terrains where mineralized rocks, volcanic sequences, and mining footprints converge. In such contexts, lithological variability strongly governs element distributions, and simple thresholds or factor scores often miss this control [9,15]. Equally important, integrated, reproducible analytical workflows that combine ILR transformations, dimensionality reduction, clustering, and anomaly detection remain scarce. Analytical differences among laboratories further complicate matters, as batch effects and instrument variability can shift concentration ranges enough to bias baseline definitions, but such issues are rarely addressed [16,17].
This work is guided by the premise that integrated machine learning (ML) pipelines (analytical workflows) can separate natural geochemical variability from anthropogenic overprints, even in the heterogeneous and mining-intensive setting of the Atacama Desert. To do this, the study addresses three objectives: (i) to design and implement a reproducible workflow combining data transformation, component analysis, and unsupervised clustering; (ii) to identify and validate geochemical anomalies through a consensus strategy across methods; and (iii) to establish robust baselines that capture both geological heterogeneity and mining influence in the Antofagasta Region.

2. Materials and Methods

2.1. Geological and Sampling Context

The Antofagasta Region, located between 22° S and 26° S in northern Chile, is part of the hyper-arid Atacama Desert, a forearc domain shaped by the subduction of the Nazca Plate beneath South America. Its physical geography is defined by the Coastal Cordillera, a prominent range that separates the Pacific coast from interior basins, and by extensive alluvial plains formed by ephemeral drainage networks. The aridity of the climate, with precipitation generally below 2 mm per year, prevents the development of continuous soils or vegetation, thus exposing the lithological framework with exceptional clarity [18,19].
The basement geology is dominated by Mesozoic magmatic units. The Jurassic volcanic–volcaniclastic sequences of the La Negra Formation, composed mainly of basaltic andesites, andesites and pyroclastic deposits, are widely exposed in the Coastal Cordillera. These units are intruded by Jurassic to Early Cretaceous plutons of intermediate to felsic composition and overlain in places by rhyolitic to dacitic volcanic episodes. In addition, Quaternary alluvial, colluvial, and coastal sediments accumulate along valleys, piedmonts, and the shoreline, generating a heterogeneous surficial cover that blends detrital material from igneous bedrock with unconsolidated deposits. This variability produces sharp contrasts in the geochemical background over relatively short distances [20]. A brief view of the geologic landscape of the region can be seen in Figure 1.
Superimposed on this lithological framework is the northern segment of the Chilean Iron Belt (alternatively termed the Chilean IOCG Belt), a metallogenic province that hosts several economically significant stratabound and breccia-style Cu (±Ag) deposits, including Mantos Blancos, Michilla, and Lince-Estefanía [22,23]. These deposits, primarily of Jurassic age, include stratabound (manto-type) deposits such as Michilla and Lince-Estefanía, and breccia-style hydrothermal systems such as Mantos Blancos associated with volcanic sequences of the La Negra Formation and related units [24]. Hydrothermal circulation associated with subduction-related magmatism generated enrichments in Cu and Ag characteristic of manto-type deposits, while regional As enrichment reflects broader IOCG-style alteration and weathering processes, which are detectable not only in bedrock but also in soils and stream sediments [25]. Moreover, decades of intensive mining have contributed to anthropogenic inputs, particularly tailings and dust dispersion, further complicating the separation between natural and anomalous signatures [14,26].

2.2. Dataset and Subsets

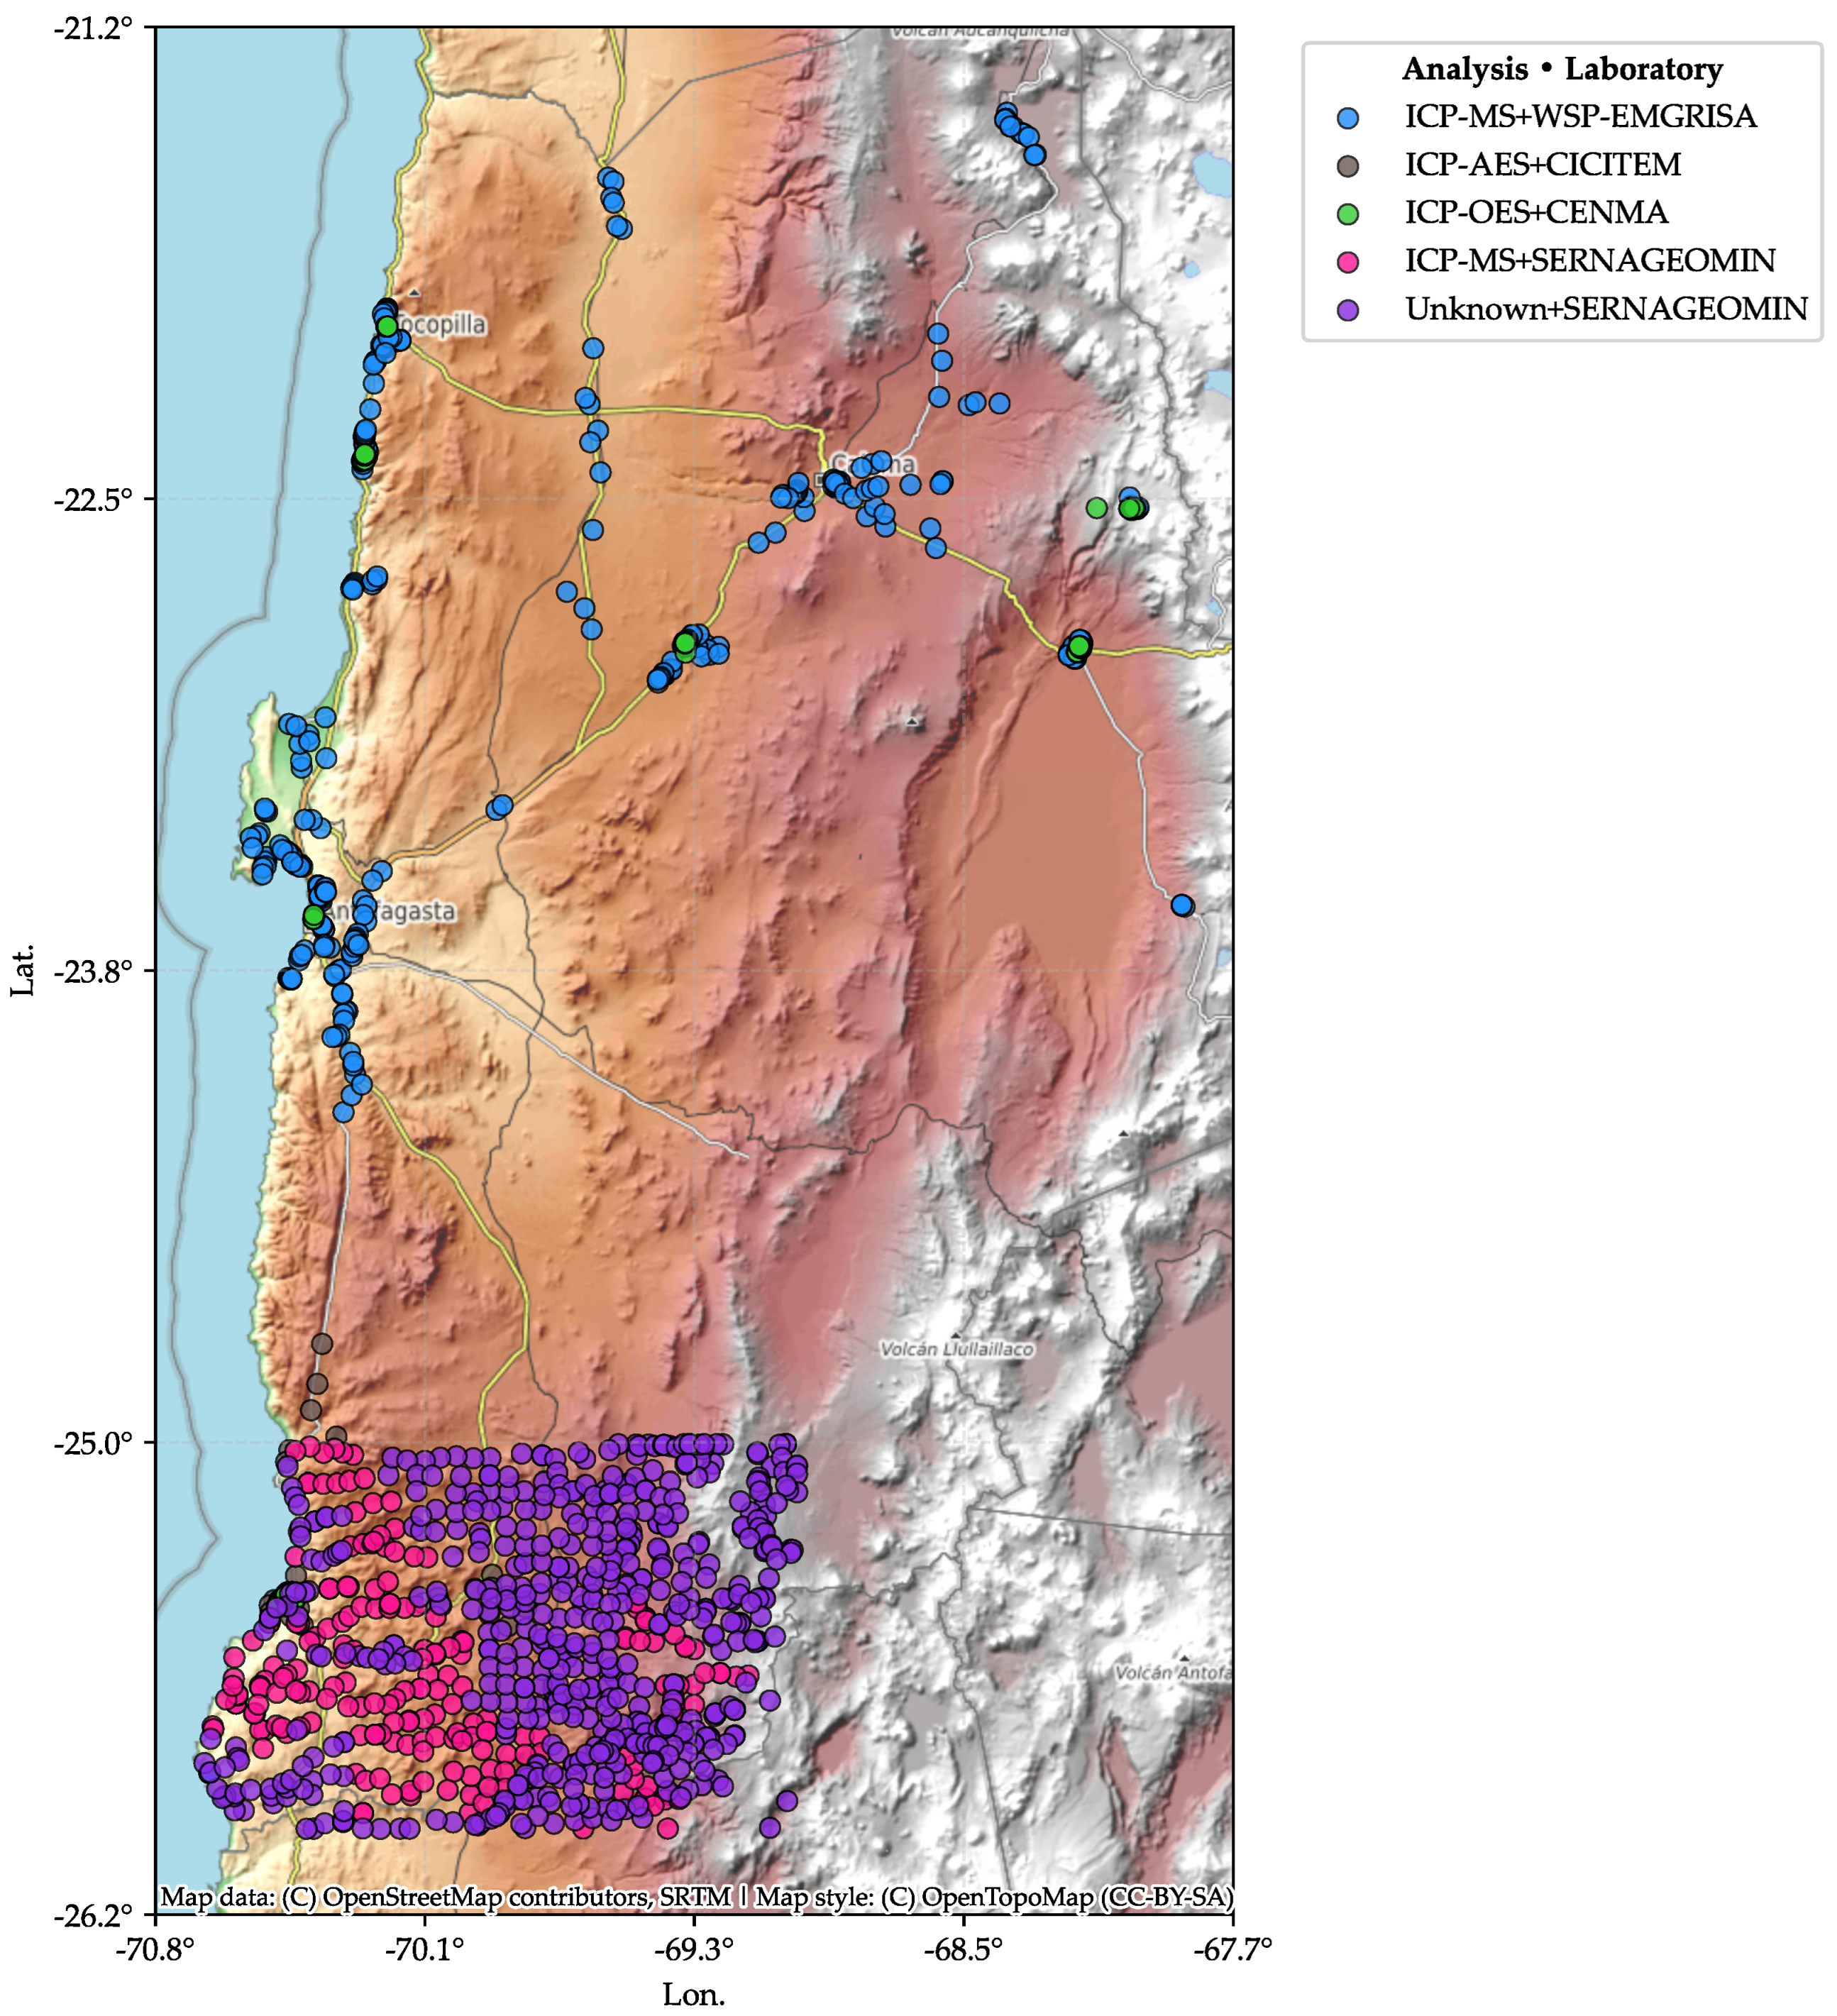
1404 surficial soil samples were collected from nine communes in the Antofagasta Region of Chile. The sampling density is highest in Taltal (974 samples) and decreases toward Antofagasta, Calama, Tocopilla, Sierra Gorda, and San Pedro. In particular, the coastal commune of Mejillones and the high-Andean commune of Ollagüe are sparsely covered. Each record contains a sample code, commune, Universal Transverse Mercator (UTM) coordinates, laboratory, and analytical technique. The samples were obtained from four different institutional campaigns. The first data set comes from the Servicio Nacional de Geología y Minería (SERNAGEOMIN) with 761 samples. Next, the Williams Sale Partnership-Empresa para la Gestión de Residuos Industriales (WSP-EMGRISA) contributed 303 samples. Then, the Centro Nacional del Medio Ambiente (CENMA) contributed 198 samples. Finally, the Centro de Investigación Científica y Tecnológica para la Minería (CICITEM) contributed 142 samples—yielding five laboratory-technique subsets (Figure 2).
All four campaigns aimed to measure the same set of 32 elements, yet each applied a different analytical programme, so several elements are absent in one or more laboratory groups. SERNAGEOMIN produced two subsets: a recent batch analyzed by inductively coupled plasma mass spectrometry (ICP-MS) and an historical batch whose technique is not documented in the archive. The ICP-MS run offers the fullest quality record—composite sampling at 0–15 cm, 43 twin samples, 34 pulp duplicates and 36 certified reference materials processed in an ISO 17025 facility, with bias and precision within acceptance limits [27]. WSP-EMGRISA (2019) collected discrete 0–0.5 m samples, inserted one field duplicate per 20 sites and used ISO 17025-accredited ICP-MS at ALS Life Sciences, but did not disclose certified standards or element-specific detection limits [28]. CENMA (2014–2019) applied aqua-regia digestion (USEPA 3052) followed by inductively coupled plasma atomic-emission spectrometry (ICP-AES) under certificate LE-174, with one laboratory duplicate every ten analyzes and published detection limits; duplicate differences stayed below 10% [29]. CICITEM used a 5 × 5 km grid, composited five surface (0–20 cm) and five sub-surface (50 cm) samples per cell, screened them by portable X-ray fluorescence and determined aqua-regia extracts by ICP-AES in an accredited laboratory, thereby defining the local background [30]. Together, these contrasting protocols highlight the need to treat each laboratory-technique subset separately before inter-laboratory harmonisation.
Prior to the statistical analysis, variables with more than 50% missing values in any subset were discarded, leaving 19–32 elements per subset and preserving representativeness [2,3]. Blank cells in raw files denote elements not analyzed, whereas any positive entry–however small–passed laboratory QA/QC; blanks were therefore left untreated to avoid speculative imputation [31,32,33]. The resulting heterogeneity in spatial coverage, analytical scope, and QA/QC completeness warranted separate compositional closure and transformation for each laboratory-technique group, followed by inter-laboratory harmonization in accordance with regional-geochemistry best practice [34,35]. Although the samples represent weathered regolith rather than fresh bedrock, their integrated signatures—after robust treatment—should provide a sound basis for regional baseline definition [36].

2.3. Software and Libraries

All computations were performed in Python 3.13.2, using the Anaconda distribution under Windows x64. Core data handling relied on NumPy 2.2.4 [37] and pandas [38], while statistical routines were supported by SciPy 1.15.2 [39]. Machine learning models, including PCA, robust principal component analysis (RPCA), HC, and SC, were implemented with scikit-learn 1.6.1 [40]. Graph construction for SC followed the nearest-neighbors routines within scikit-learn. Visualization and mapping employed Matplotlib 3.10.0 [41], Seaborn 0.13.2 [42], and geospatial libraries such as GeoPandas 1.0.1 [43].

2.4. Preprocessing

Preprocessing followed two parallel branches: a chemistry-only (NG) and a chemistry + geography (YG) branch. The raw dataset was first divided by laboratory and analytical method to prevent systematic differences in instrumentation, digestion, or calibration from propagating into the models. Thus, each subset represents a coherent analytical group with its own baseline frame, consistent with recent multi-source soil standardization practices [44]. Within each subset, variables with >50% missing values were removed, and unavailable data were excluded from the closure step to avoid inflated variance and preserve the relative nature of compositional parts [45,46].
Geochemical data were closed to a constant sum and transformed to real Euclidean space using the ILR, which provides an orthonormal basis and removes spurious correlations [47,48]. The ILR output was then z-score standardized (zero mean and unitary standard deviation) to equalize variance among variables. These are sequential, not alternative, operations: ILR addresses compositional closure, whereas z-scaling ensures comparable contributions to distance-based models [7,47]. Standardization remains the standard safeguard for multivariate analyzes [49,50].
In the chemistry + geography branch, UTM Easting and Northing (zone 19S, WGS84) were appended after ILR computation, so geography was never included in the closure step. Both coordinates were z-standardized with ILR variables to prevent geometric dominance and mitigate scale distortions in PCA, HC, and SC. Spatial coordinates capture gradients or barriers relevant to dispersion but can introduce autocorrelation; therefore, the NG branch serves as a control to assess sensitivity to geographic embedding [49,50,51].

2.5. Dimensionality Reduction

Principal Component Analysis (PCA) was applied to Z-scored ILR variables; in the geochemical-spatial workflow, standardized UTM coordinates were appended before PCA to ensure comparable scale across all variables. The number of retained components was chosen to reach the commonly adopted 95% explained-variance threshold, which provided a compact set of components representing the main geochemical structure for subsequent clustering and anomaly detection [3,47].
To mitigate the influence of local perturbations and measurement noise, we also computed a robust low-rank representation of the ILR-transformed matrices following the robust principal component analysis (RPCA) framework. This procedure separates each matrix into two parts: (i) a low-rank matrix that captures coherent background variation, and (ii) a sparse matrix that isolates localized anomalies or outliers [52]. PCA was then applied to the low-rank component only (hereafter PCA-LR), generating denoised variables for subsequent analyzes.
This step preserves the main multivariate structure of the dataset while reducing the impact of isolated high-leverage samples. The resulting PCA-LR variables served as the input for clustering process, ensuring that subsequent pattern recognition was based on stable background trends rather than artifacts from analytical noise or individual outliers.

2.6. Clustering

Two unsupervised routines were applied to every laboratory-technique subset in both the PCA and PCA-LR spaces: Ward-linkage hierarchical clustering (HC) and nearest-neighbour spectral clustering (SC). For each subset we explored k = 2 , , n + 1 clusters—a square-root rule that limits over-partitioning while preserving flexibility in medium data sets [53,54]. In SC the affinity graph used n neighbours to remain sparse yet connected, and cluster labels were obtained by ten restarts of k-means; this design follows established recommendations for manifold learning [55,56,57].
Cluster validity was evaluated with the Silhouette value, Calinski–Harabasz index and within-cluster sum of squares. Each metric was min-max rescaled to the [ 0 , 1 ] interval (Silhouette first shifted from [ 1 , 1 ] , WCSS inverted), and the optimal k selected by majority vote across the three scores. This consensus procedure balances compactness and separation, mitigates single-metric bias and yields the partitions subsequently used for 95th-percentile anomaly detection.

2.7. Anomaly Detection Process

In each clustering result (from HC and SC, for both PCA and PCA-LR branches), the anomaly detection protocol hinges on the Euclidean distance of each sample to the centroid of its assigned cluster. For each cluster, distances are computed and aggregated to define a 95th percentile ( P 95 ) threshold. Samples whose distance exceeds P 95 are flagged as candidate anomalies, under the assumption that the tail (top 5%) captures extreme deviations from the normal cluster core. This percentile threshold is widely used in outlier detection because it adapts to cluster-specific dispersion and avoids rigid absolute cutoffs [58,59].
To mitigate sensitivity to any single clustering route (PCA + HC, PCA + SC, PCA-LR + HC, PCA-LR + SC), a consensus rule is applied: a sample is deemed a final anomaly if it is flagged as anomalous in at least two out of the four analyzes. This majority criterion reduces false positives stemming from idiosyncratic clustering artifacts while retaining robustness in detecting truly extreme geochemical signatures. Regional baselines were defined as the minimum between NG and YG “Average-of-three” thresholds computed on the global dataset after multivariate anomaly exclusion.
We note that in the context of mineralized terrains, statistical outliers may represent: (i) proximity to ore bodies or zones of intense hydrothermal alteration, (ii) lithological boundaries or contact zones, (iii) anthropogenic point sources, or (iv) analytical artifacts. The term ‘anomaly’ as used here refers solely to statistical extremes and does not imply origin.

2.8. Geological Context of Identified Anomalies

To integrate the geochemical anomalies into their geological framework, each anomalous point was spatially intersected with polygons from the Geological Map of South America provided by ArcGIS Hub (October 2025 version) [21]. This dataset contains lithological and Stratigraphic attributes, including unit code, rock type, lithological description, and temporal classification (era and period). The coordinates of the anomalous samples, originally in UTM projection, were reprojected to WGS84 to match the reference system of the geological polygons. A point-in-polygon spatial join was then performed, assigning each anomaly to its corresponding geological unit. This procedure allowed the integration of compositional anomalies with their stratigraphic and lithological context, enabling subsequent interpretation of whether the identified geochemical patterns were consistent with natural mineralization processes or potentially influenced by anthropogenic activities, as suggested in recent background studies in the Antofagasta region [14].

2.9. Baseline Estimation Process

For baseline estimation, a reduced dataset was generated from the raw dataset. Before computing baselines by laboratory and analytical technique, elements containing any missing values across the global matrix were discarded. This produced a coherent set of fully measured variables, ensuring comparability among institutional subsets. After consensus anomalies were removed, the reduced dataset served as the reference for robust estimation of typical concentrations in mg · kg−1.
Baselines were calculated through four complementary statistics: (a) Median + 2 · MAD (Median Average Deviation), robust to skewness and heavy tails [2]; (b) Tukey’s upper fence ( Q 3 + 1.5 · IQR (Third quartile plus interquartile Range); (c) the 95th percentile ( P 95 ), a common upper-background criterion [60]; and (d) their arithmetic mean as a balanced composite. In the multivariate framework, these values were derived after anomaly exclusion, whereas in the univariate mode, they were computed directly on raw data for comparability with traditional single-element approaches.
Figure 3 summarizes the sequential workflow—from dataset refinement and preprocessing to PCA/PCA-LR, HC/SC clustering, consensus anomaly detection, and final baseline estimation—applied to the Antofagasta dataset.

3. Results

3.1. Data Quality and Filtering

The compiled dataset comprises 1404 samples grouped into five laboratory-technique subsets (Table 1). Each subset initially contained 32 elemental variables, but data completeness varied substantially. After applying a 50% missing-value threshold, the ICP-MS WSP-EMGRISA subset retained all 32 elements, whereas ICP-AES CICITEM preserved 28 after excluding Cu, Li, Se and Sn. The ICP-OES CENMA subset was reduced to 19 variables, while both SERNAGEOMIN subsets (ICP-MS and unclassified) retained 21 after omitting systematically absent major elements (Al, Fe, Mg, Mn, Ti). Retention rates thus range from 59% (CENMA) to 100% (WSP-EMGRISA), mirroring analytical scope and detection-limit policy in each campaign [27,28,29]. Figure 4 shows the frequency distribution of the five elements with the highest mean concentrations after this process.
QA/QC documentation is likewise uneven. SERNAGEOMIN provides full field duplicates, pulp duplicates and certified reference materials (CRMs) at an ISO 17025-accredited facility, and therefore serves as the analytical benchmark [27]. WSP-EMGRISA reports duplicate sampling (1:20) and ISO 17025 accreditation but no CRMs or element-specific limits of detection [28]. CENMA, operating under certificate LE-174, details duplicate precision (<10%) and LoDs derived from USEPA 3052/6010 protocols [29]. Although the four campaigns can provide documented QA/QC protocols, analytical diversity persists: CICITEM employed aqua-regia digestion with ICP-AES, whereas WSP-EMGRISA and SERNAGEOMIN used total-digestion ICP-MS or ICP-OES. Baselines were therefore calculated within each laboratory-technique subset to respect these methodological differences, as recommended by recent community guidelines [34].
Following variable filtering, two analytical workflows were applied. The first used only chemical variables (19–32 per subset), closed them to a constant sum and transformed them via the isometric log-ratio (ILR) approach [47]; each ILR component was then z-standardised. The second workflow incorporated spatial information by appending z-standardised UTM eastings and northings to the ILR block, giving matrices of 21–34 dimensions. These parallel geochemical and geo-spatial versions were subsequently employed in dimensionality-reduction and clustering analyzes, ensuring that instrument-specific biases and spatial autocorrelation were both captured [34,35].

3.2. Dimensionality Reduction and Robust Filtering

The outcomes of dimensionality reduction are summarized in Table 2, which compares the number of retained components in PCA and PCA-LR analytical workflows, both with and without spatial variables. PCA required 12–19 components to reach the 95% explained-variance threshold. In contrast, PCA-LR reduced this requirement to only three to six components, while still retaining 95%–97% of total variance across all subsets. Reduction rates varied from 28% to 77%, with the most pronounced gains observed in the spatially augmented analytical framework, particularly for the ICP-OES (CENMA) and ICP-AES (CICITEM) subsets. These results highlight the substantial compression achieved through robust preprocessing while preserving the intrinsic multivariate structure of the data.
The decomposition results obtained through RPCA are summarized in Table 3, which reports the effective rank of the low-rank matrices, sparsity of the sparse component, and convergence metrics for each subset under both analytical workflows. The effective rank varied between 7 and 12, indicating a compact representation of the coherent signal across subsets. Sparsity levels ranged from 10.4% to 15.7%, reflecting the proportion of localized perturbations captured in the sparse term. Reconstruction errors consistently remained below tolerance, and the Augmented Lagrangian Method (ALM) converged in fewer than 200 iterations for all cases. These outcomes confirm that the RPCA stage yielded stable low-rank structures while isolating sparse deviations across both geochemical and spatially augmented datasets.

3.3. Clustering Within the Geochemical-Only Workflow

3.3.1. Hierarchical Clustering in Principal Component Analysis

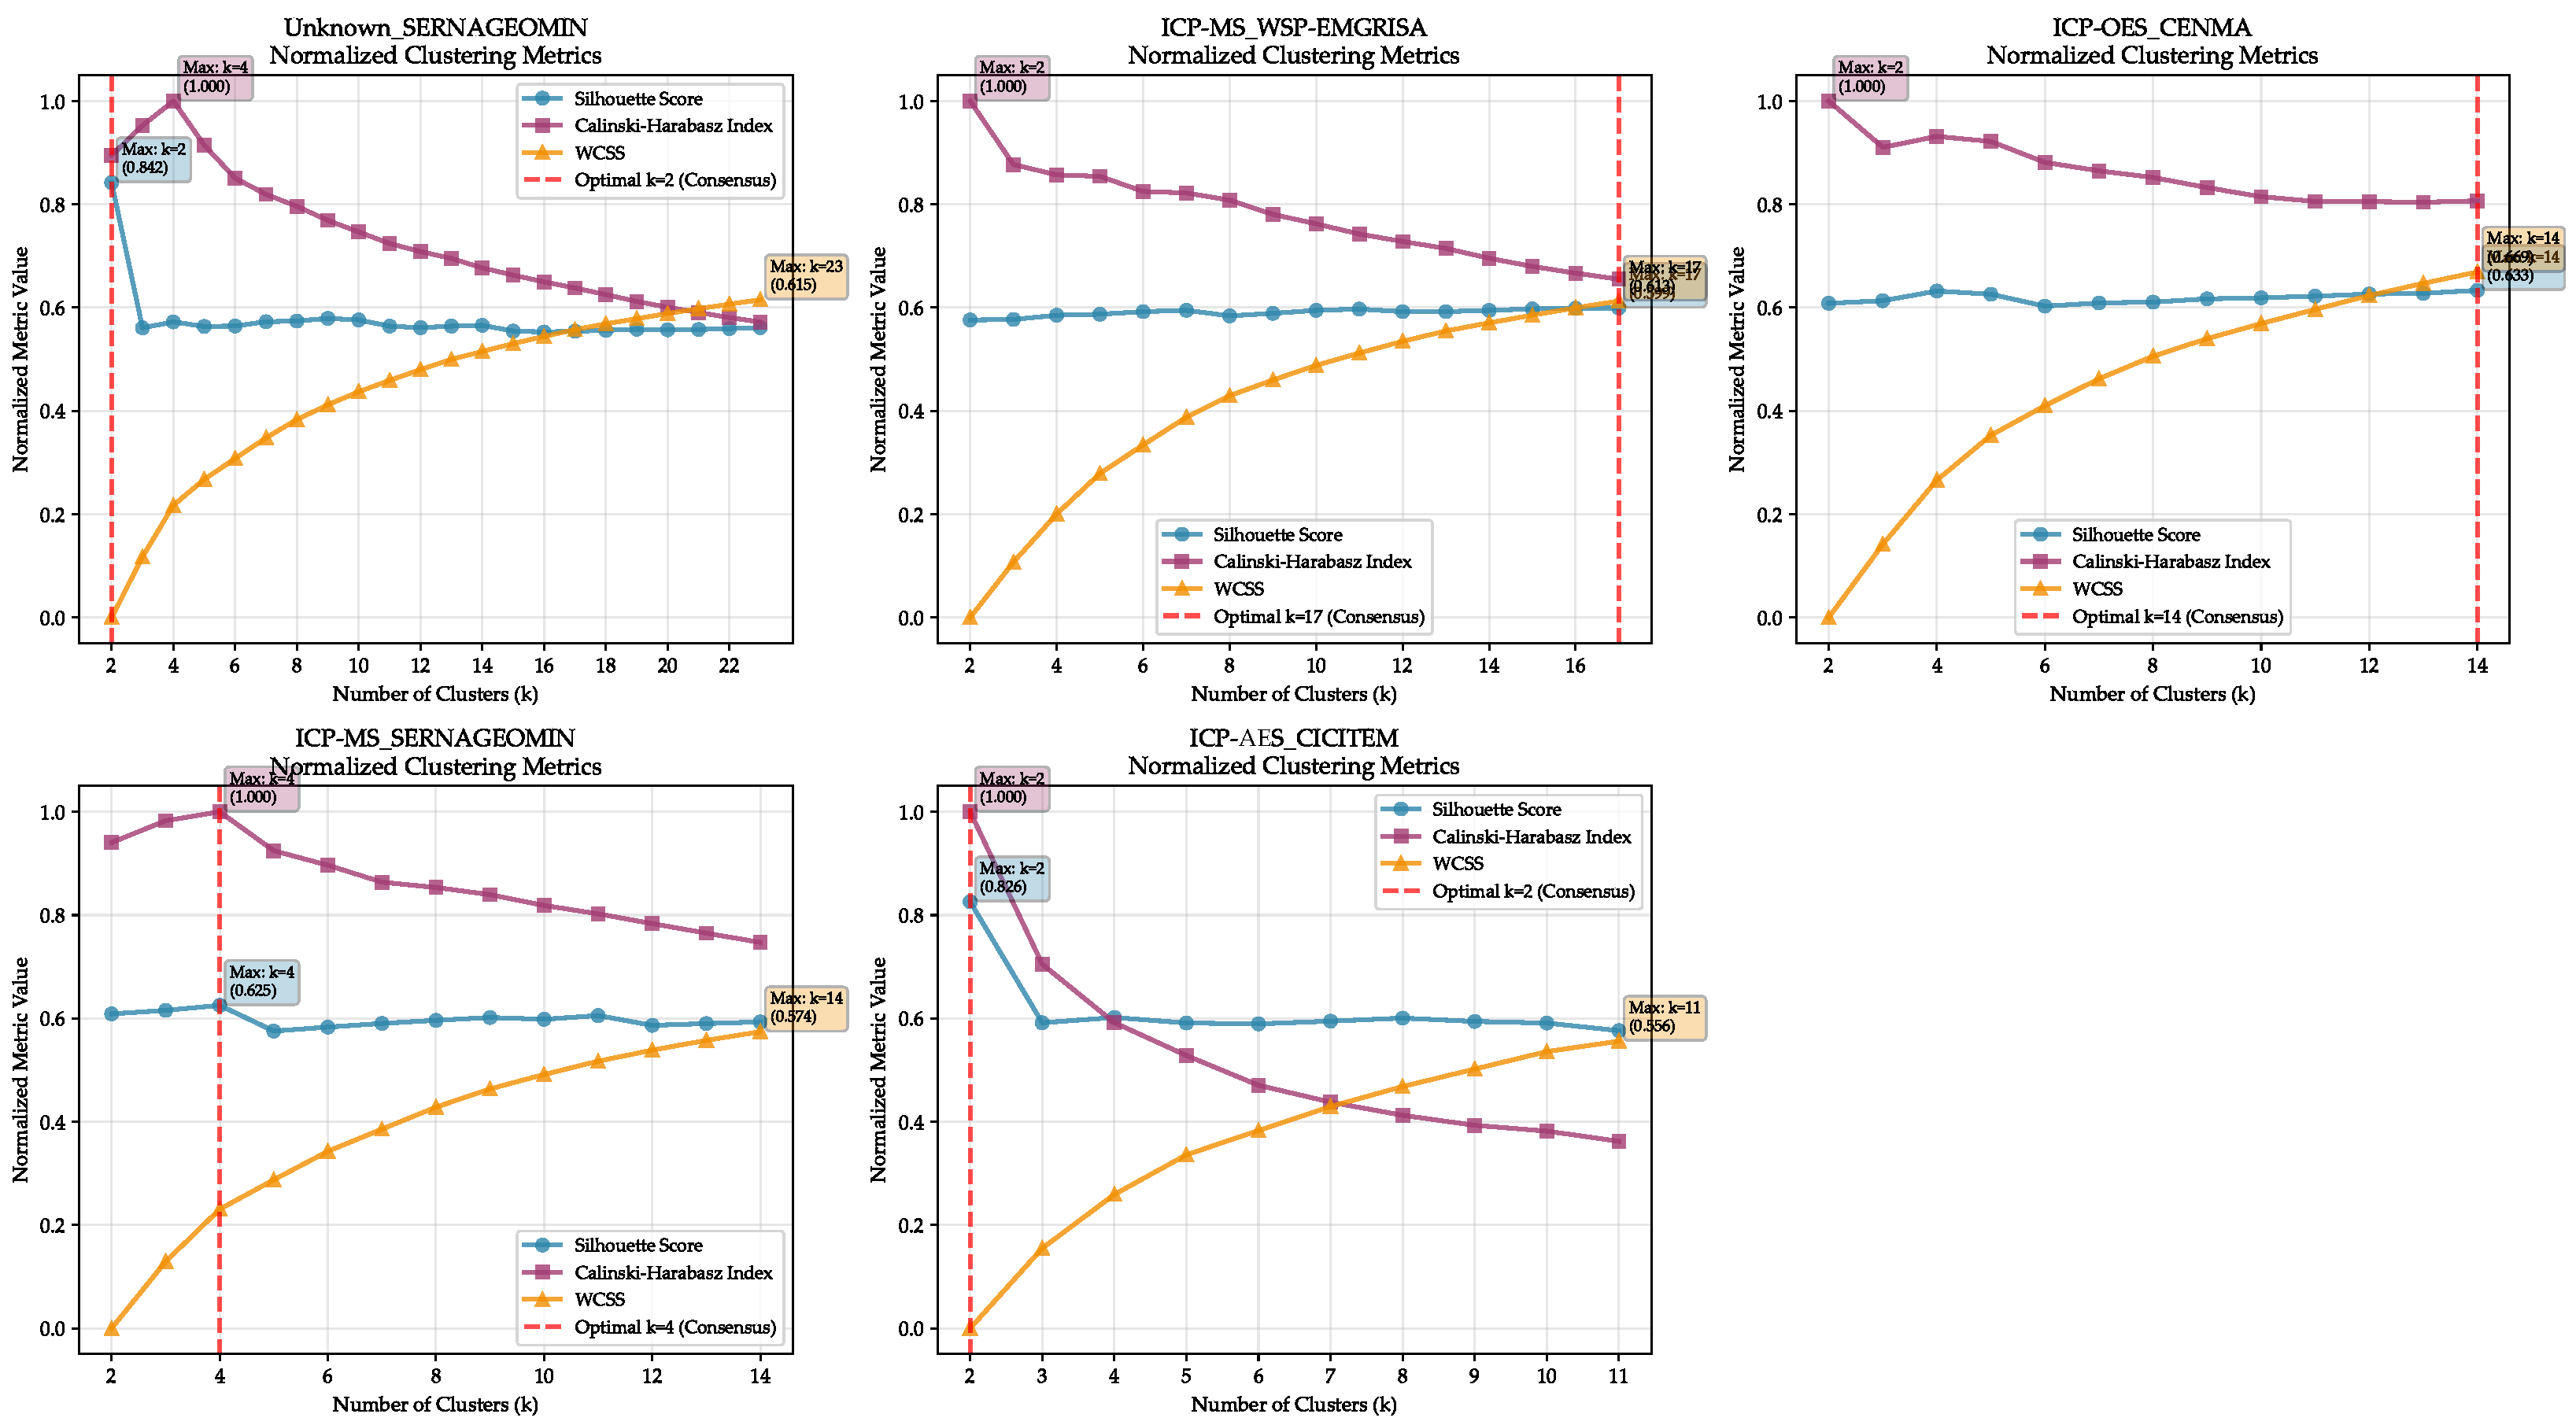
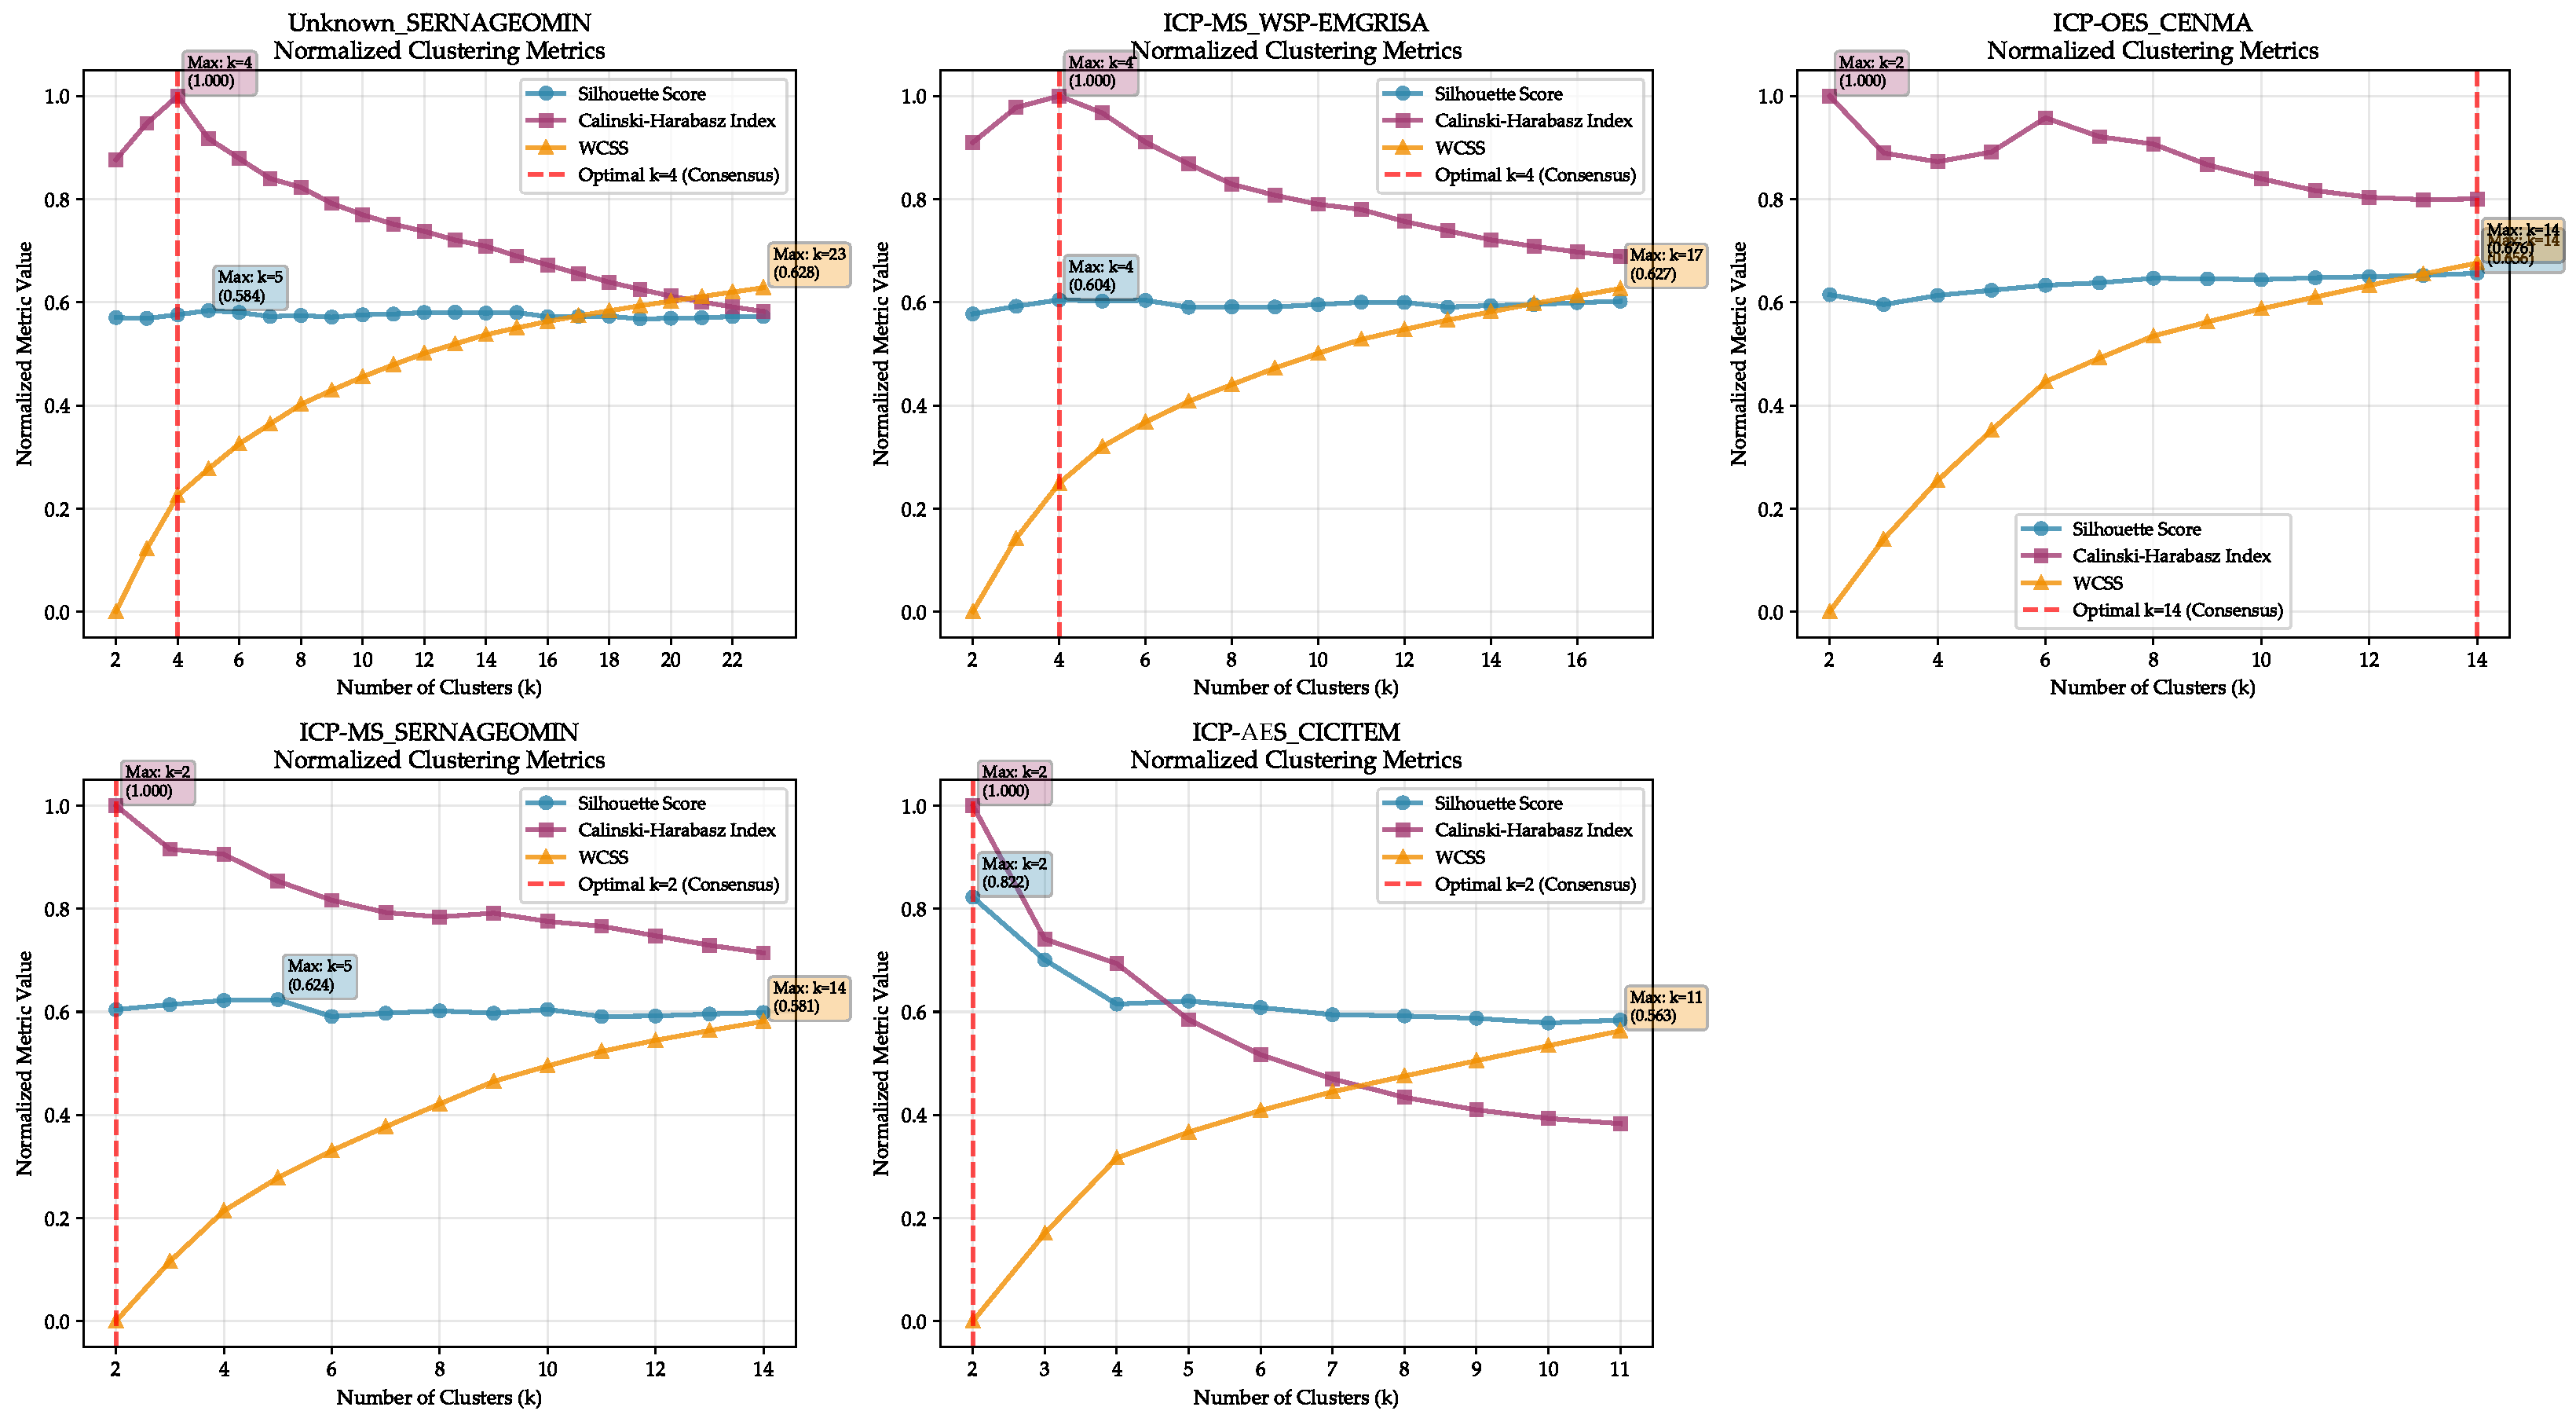
The optimal number of clusters obtained from the PCA-based analytical workflow without spatial variables is shown in Figure 5, which summarizes the normalized metrics for each subset. Consensus voting among silhouette, Calinski–Harabasz, and WCSS criteria yielded distinct outcomes depending on the laboratory-technique combination. The Unknown Method (SERNAGEOMIN) and ICP-AES (CICITEM) subsets converged toward k = 2 , while ICP-MS (SERNAGEOMIN) supported k = 4 . In contrast, larger structures were identified in ICP-MS (WSP-EMGRISA) and ICP-OES (CENMA), where consensus selected k = 17 and k = 14 , respectively.

3.3.2. Hierarchical Clustering in Principal Component Analysis (Low-Rank)

The consensus outcomes for the PCA-LR analytical workflow without spatial variables are presented in Figure 6. Compared with the standard PCA results, the optimal number of clusters shifted toward smaller and more compact structures in most subsets. The Unknown Method (SERNAGEOMIN), ICP-OES (CENMA), and ICP-AES (CICITEM) subsets all converged at k = 2 , while ICP-MS (WSP-EMGRISA) supported k = 4 . A contrasting case was observed for ICP-MS (SERNAGEOMIN), where consensus selected k = 14 , aligning with more dispersed cluster patterns.

3.3.3. Spectral Clustering in Principal Component Analysis

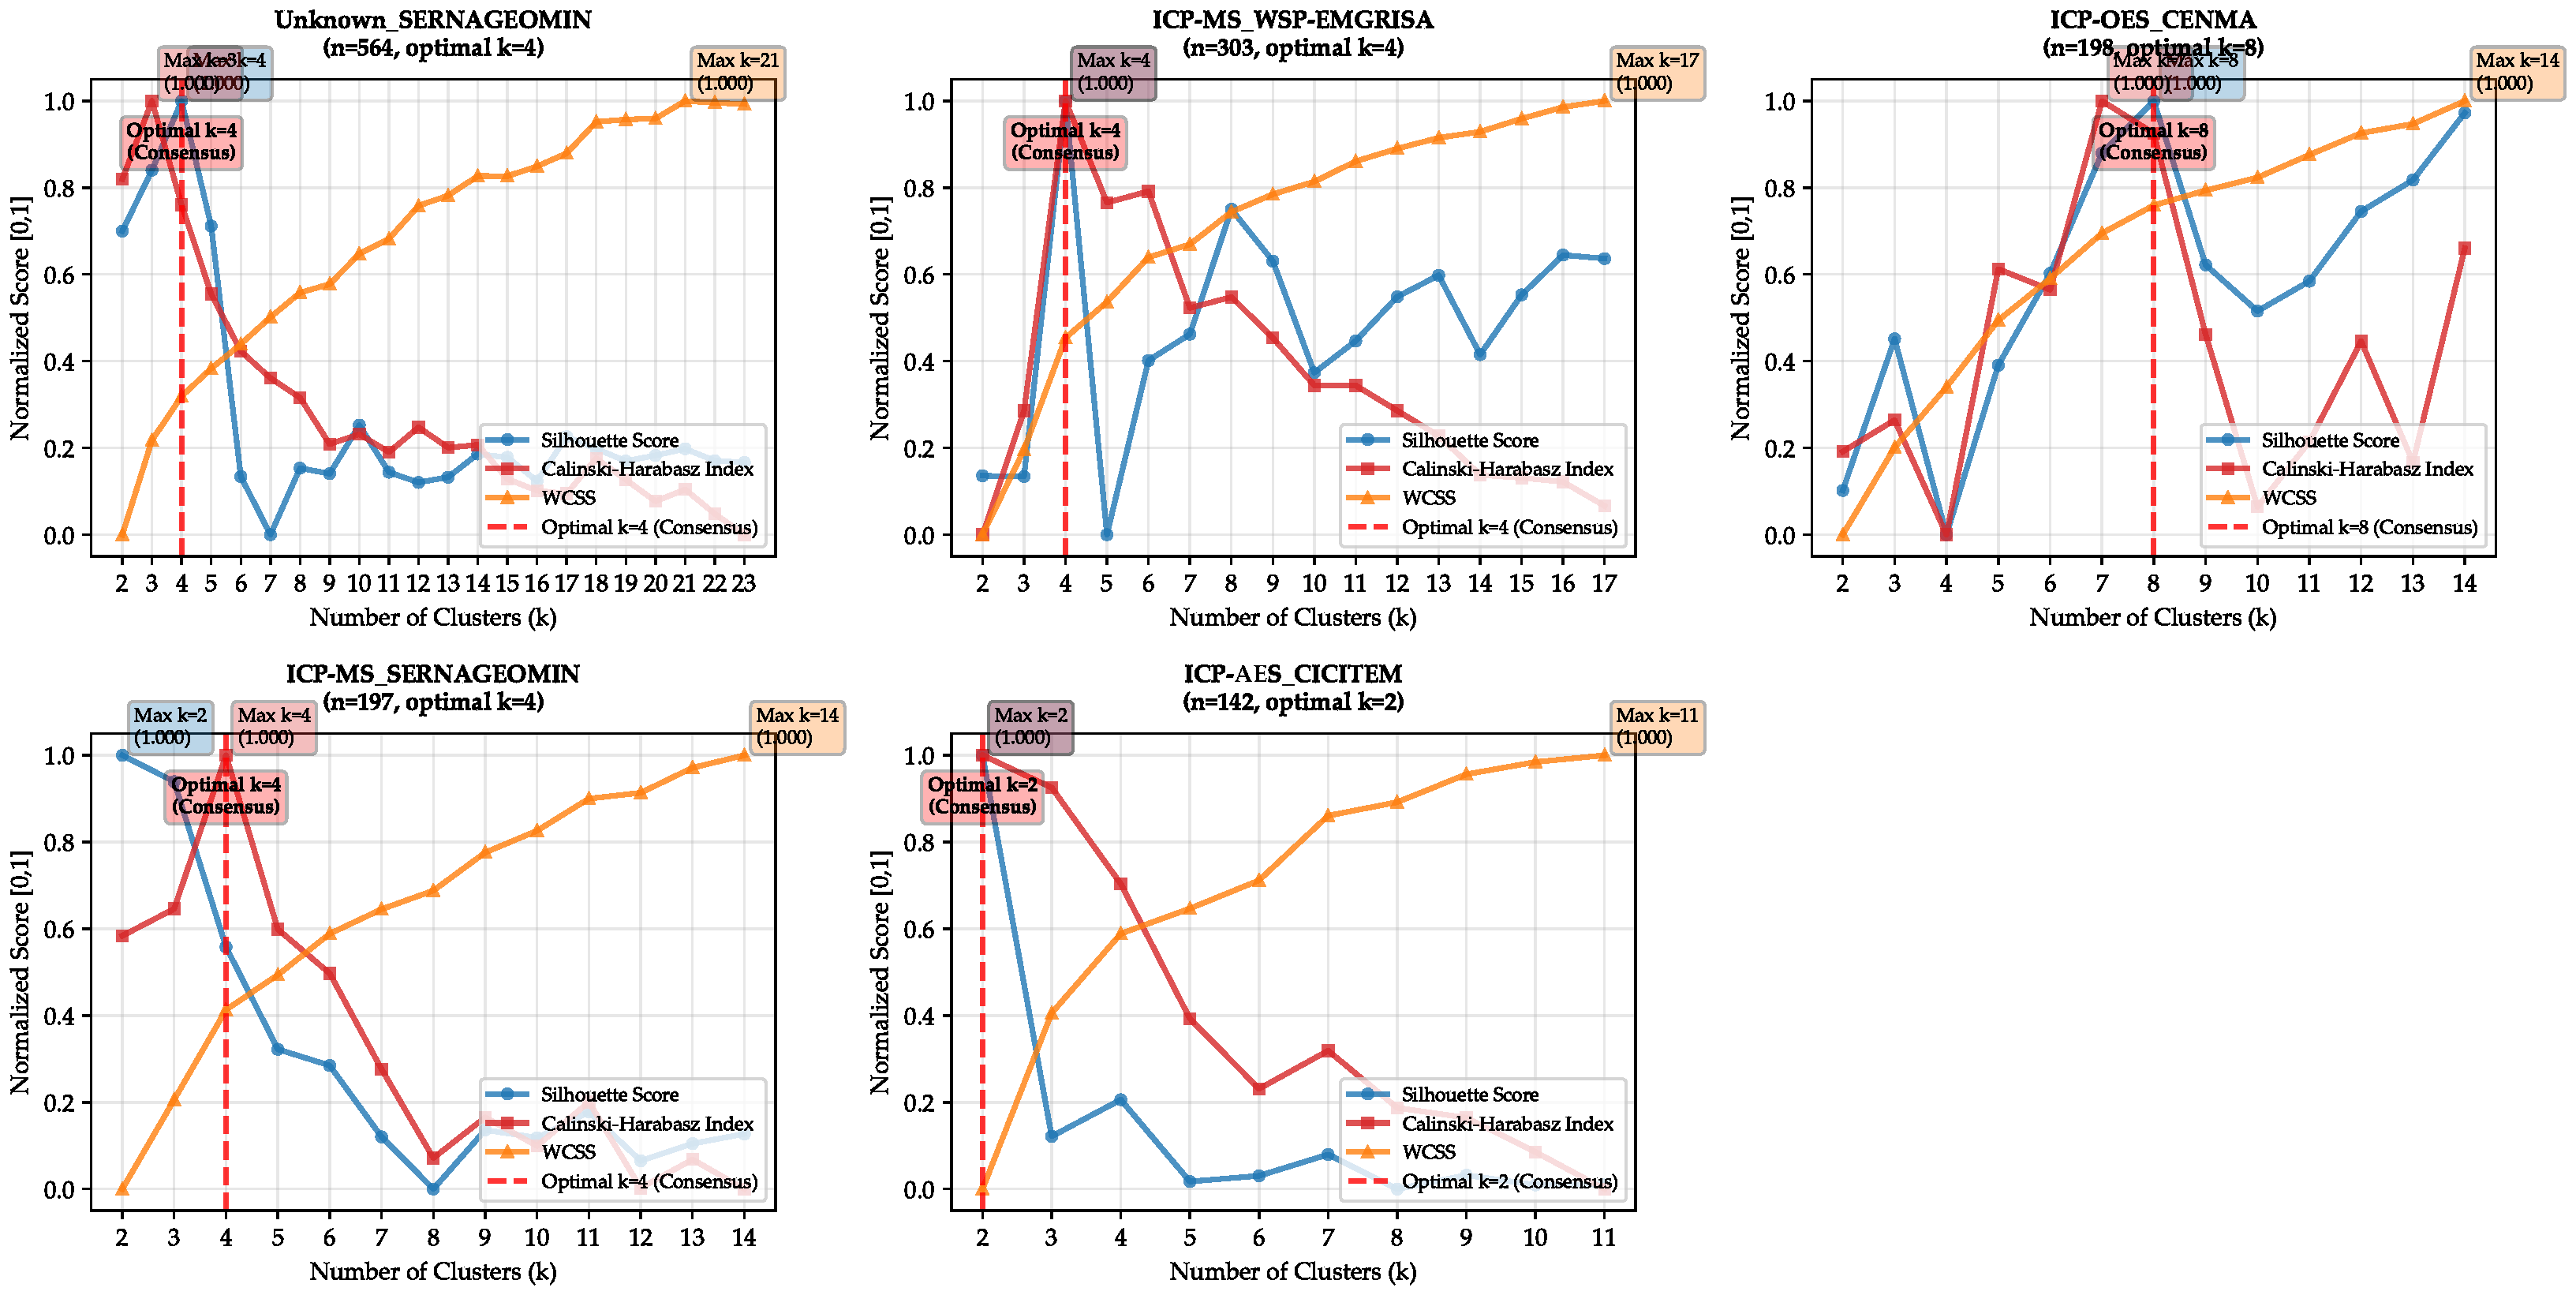
The determination of the optimal number of clusters for the spectral clustering analytical workflow based on PCA without spatial variables is displayed in Figure 7. Consensus among silhouette, Calinski–Harabasz, and WCSS metrics selected k = 4 for the Unknown Method (SERNAGEOMIN), ICP-MS (WSP-EMGRISA), and ICP-MS (SERNAGEOMIN) subsets. In the case of ICP-OES (CENMA), the consensus favored k = 8 , while the ICP-AES (CICITEM) subset converged toward a simpler partition with k = 2 .

3.3.4. Spectral Clustering in Principal Component Analysis (Low-Rank)

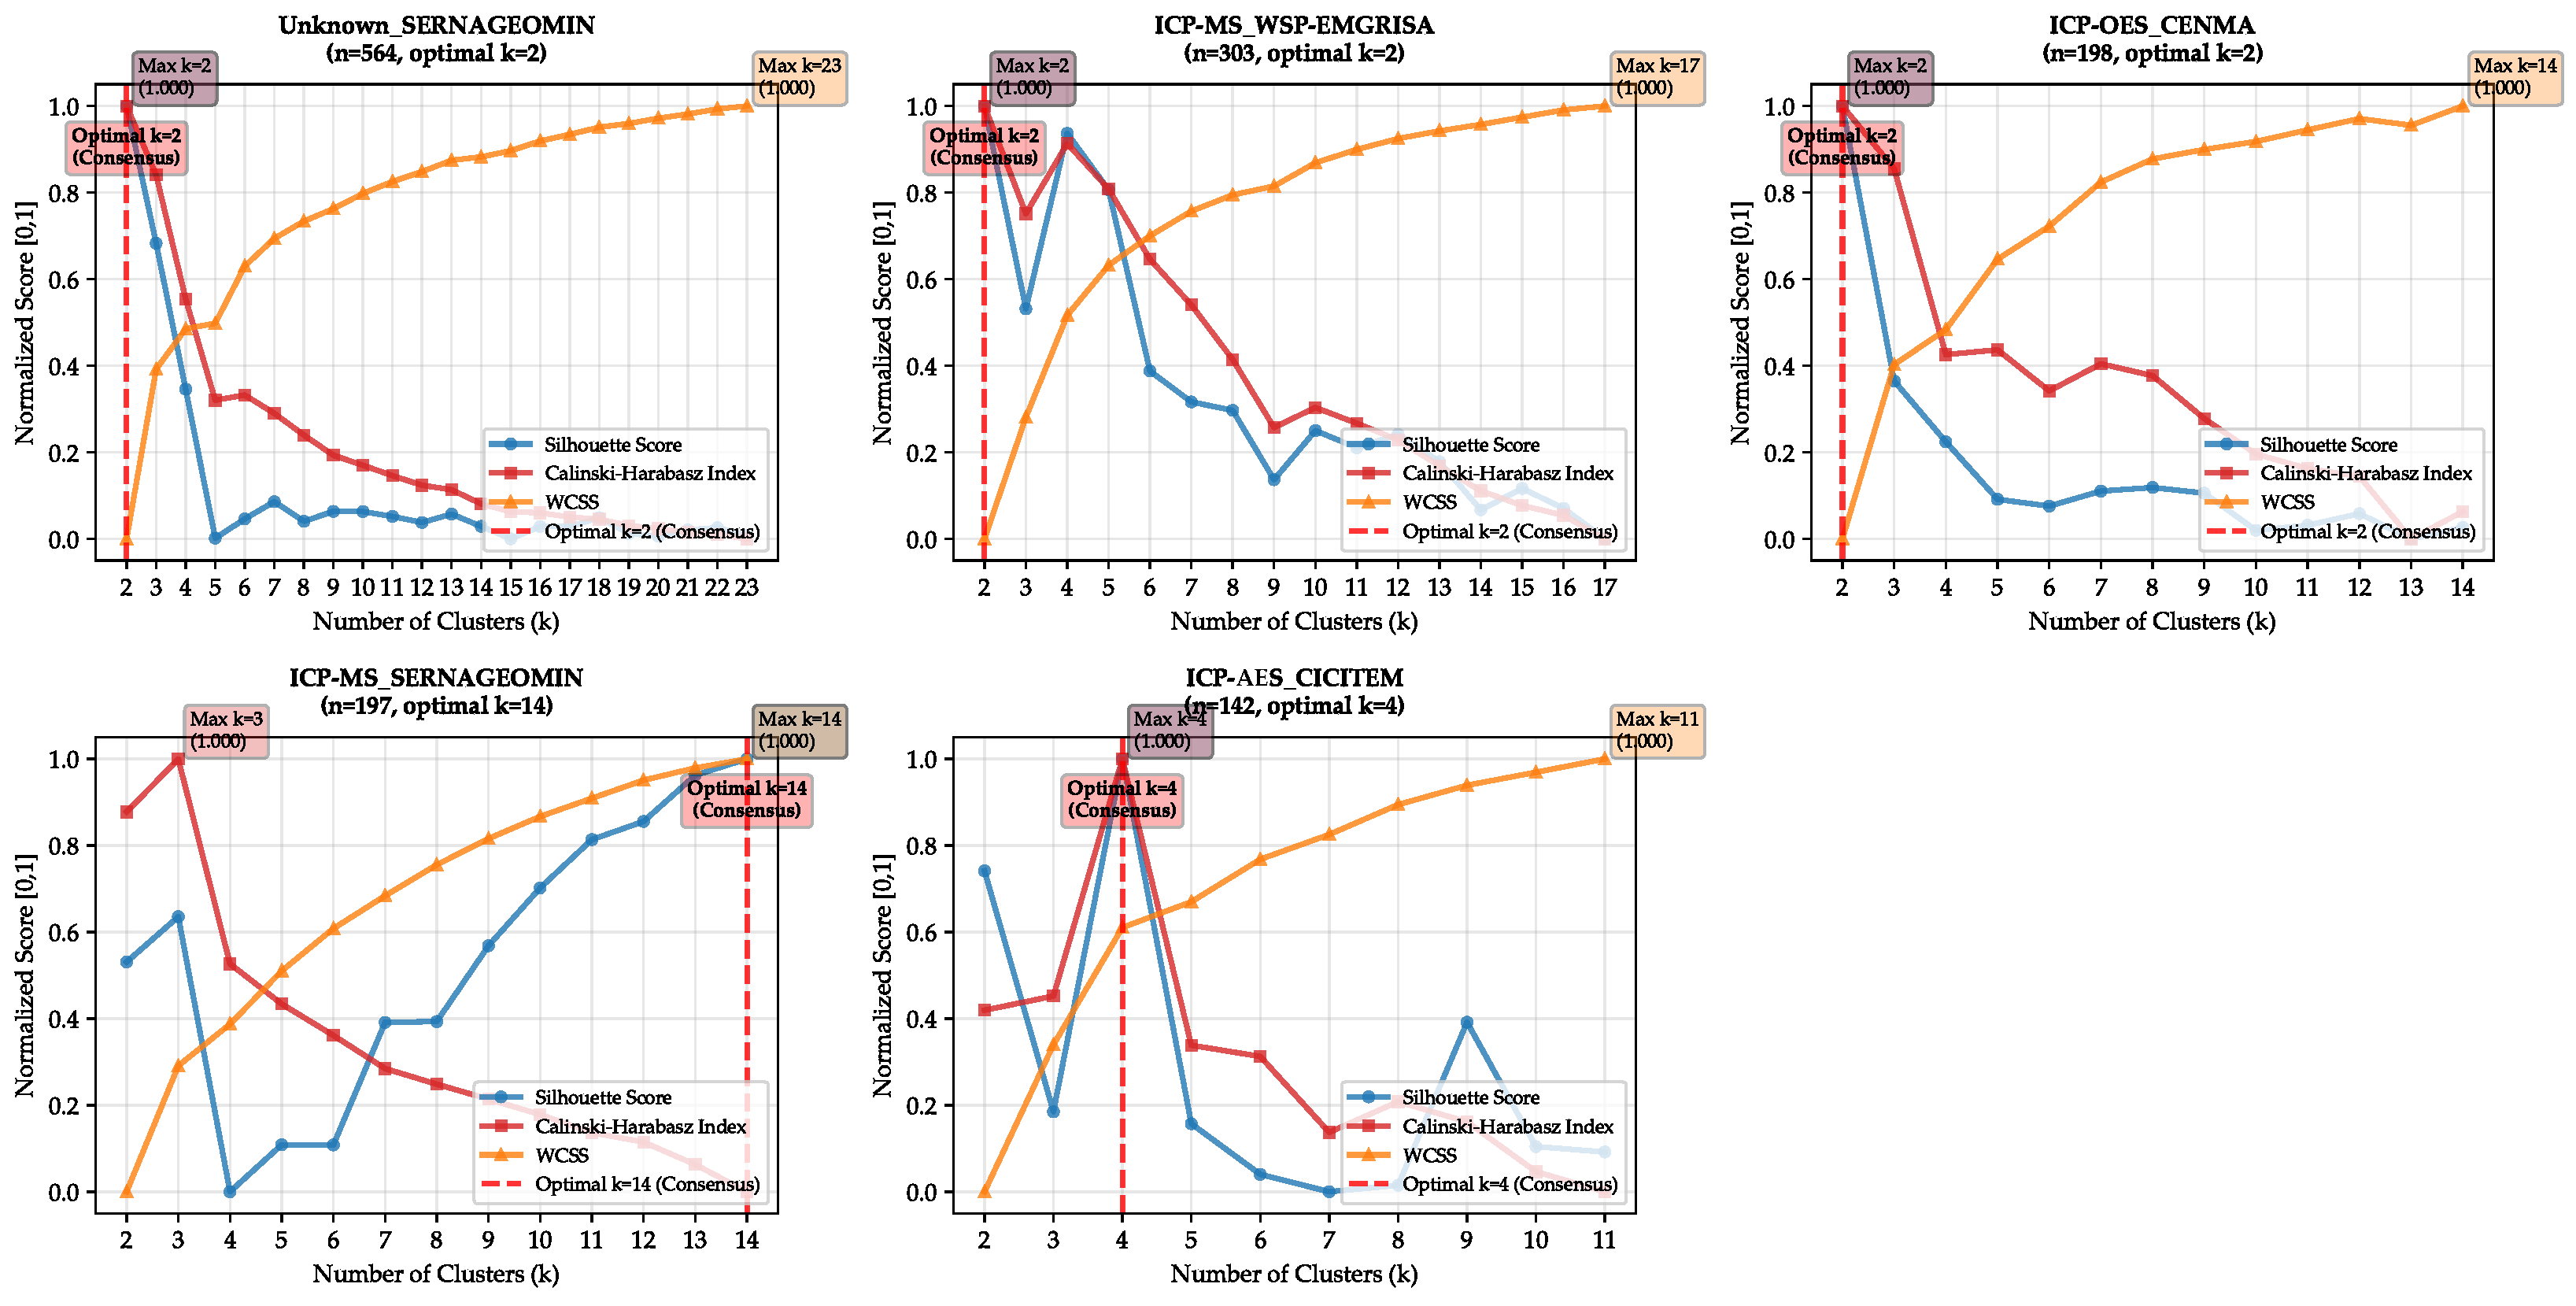
The consensus evaluation for the spectral clustering analytical workflow based on PCA-LR without spatial variables is summarized in Figure 8. Three subsets—Unknown Method (SERNAGEOMIN), ICP-MS (WSP-EMGRISA), and ICP-OES (CENMA)—converged toward compact solutions with k = 2 . By contrast, the ICP-MS (SERNAGEOMIN) subset supported a substantially higher partitioning at k = 14 , while ICP-AES (CICITEM) stabilized at k = 4 . These results illustrate that, after robust preprocessing, spectral clustering tended to favor simpler structures for most subsets, yet retained the capacity to capture more granular partitions where the data required it.

3.4. Clustering in Spatial-Geochemical Analytical Workflow

3.4.1. Hierarchical Clustering in Principal Component Analysis (Spatial Data)

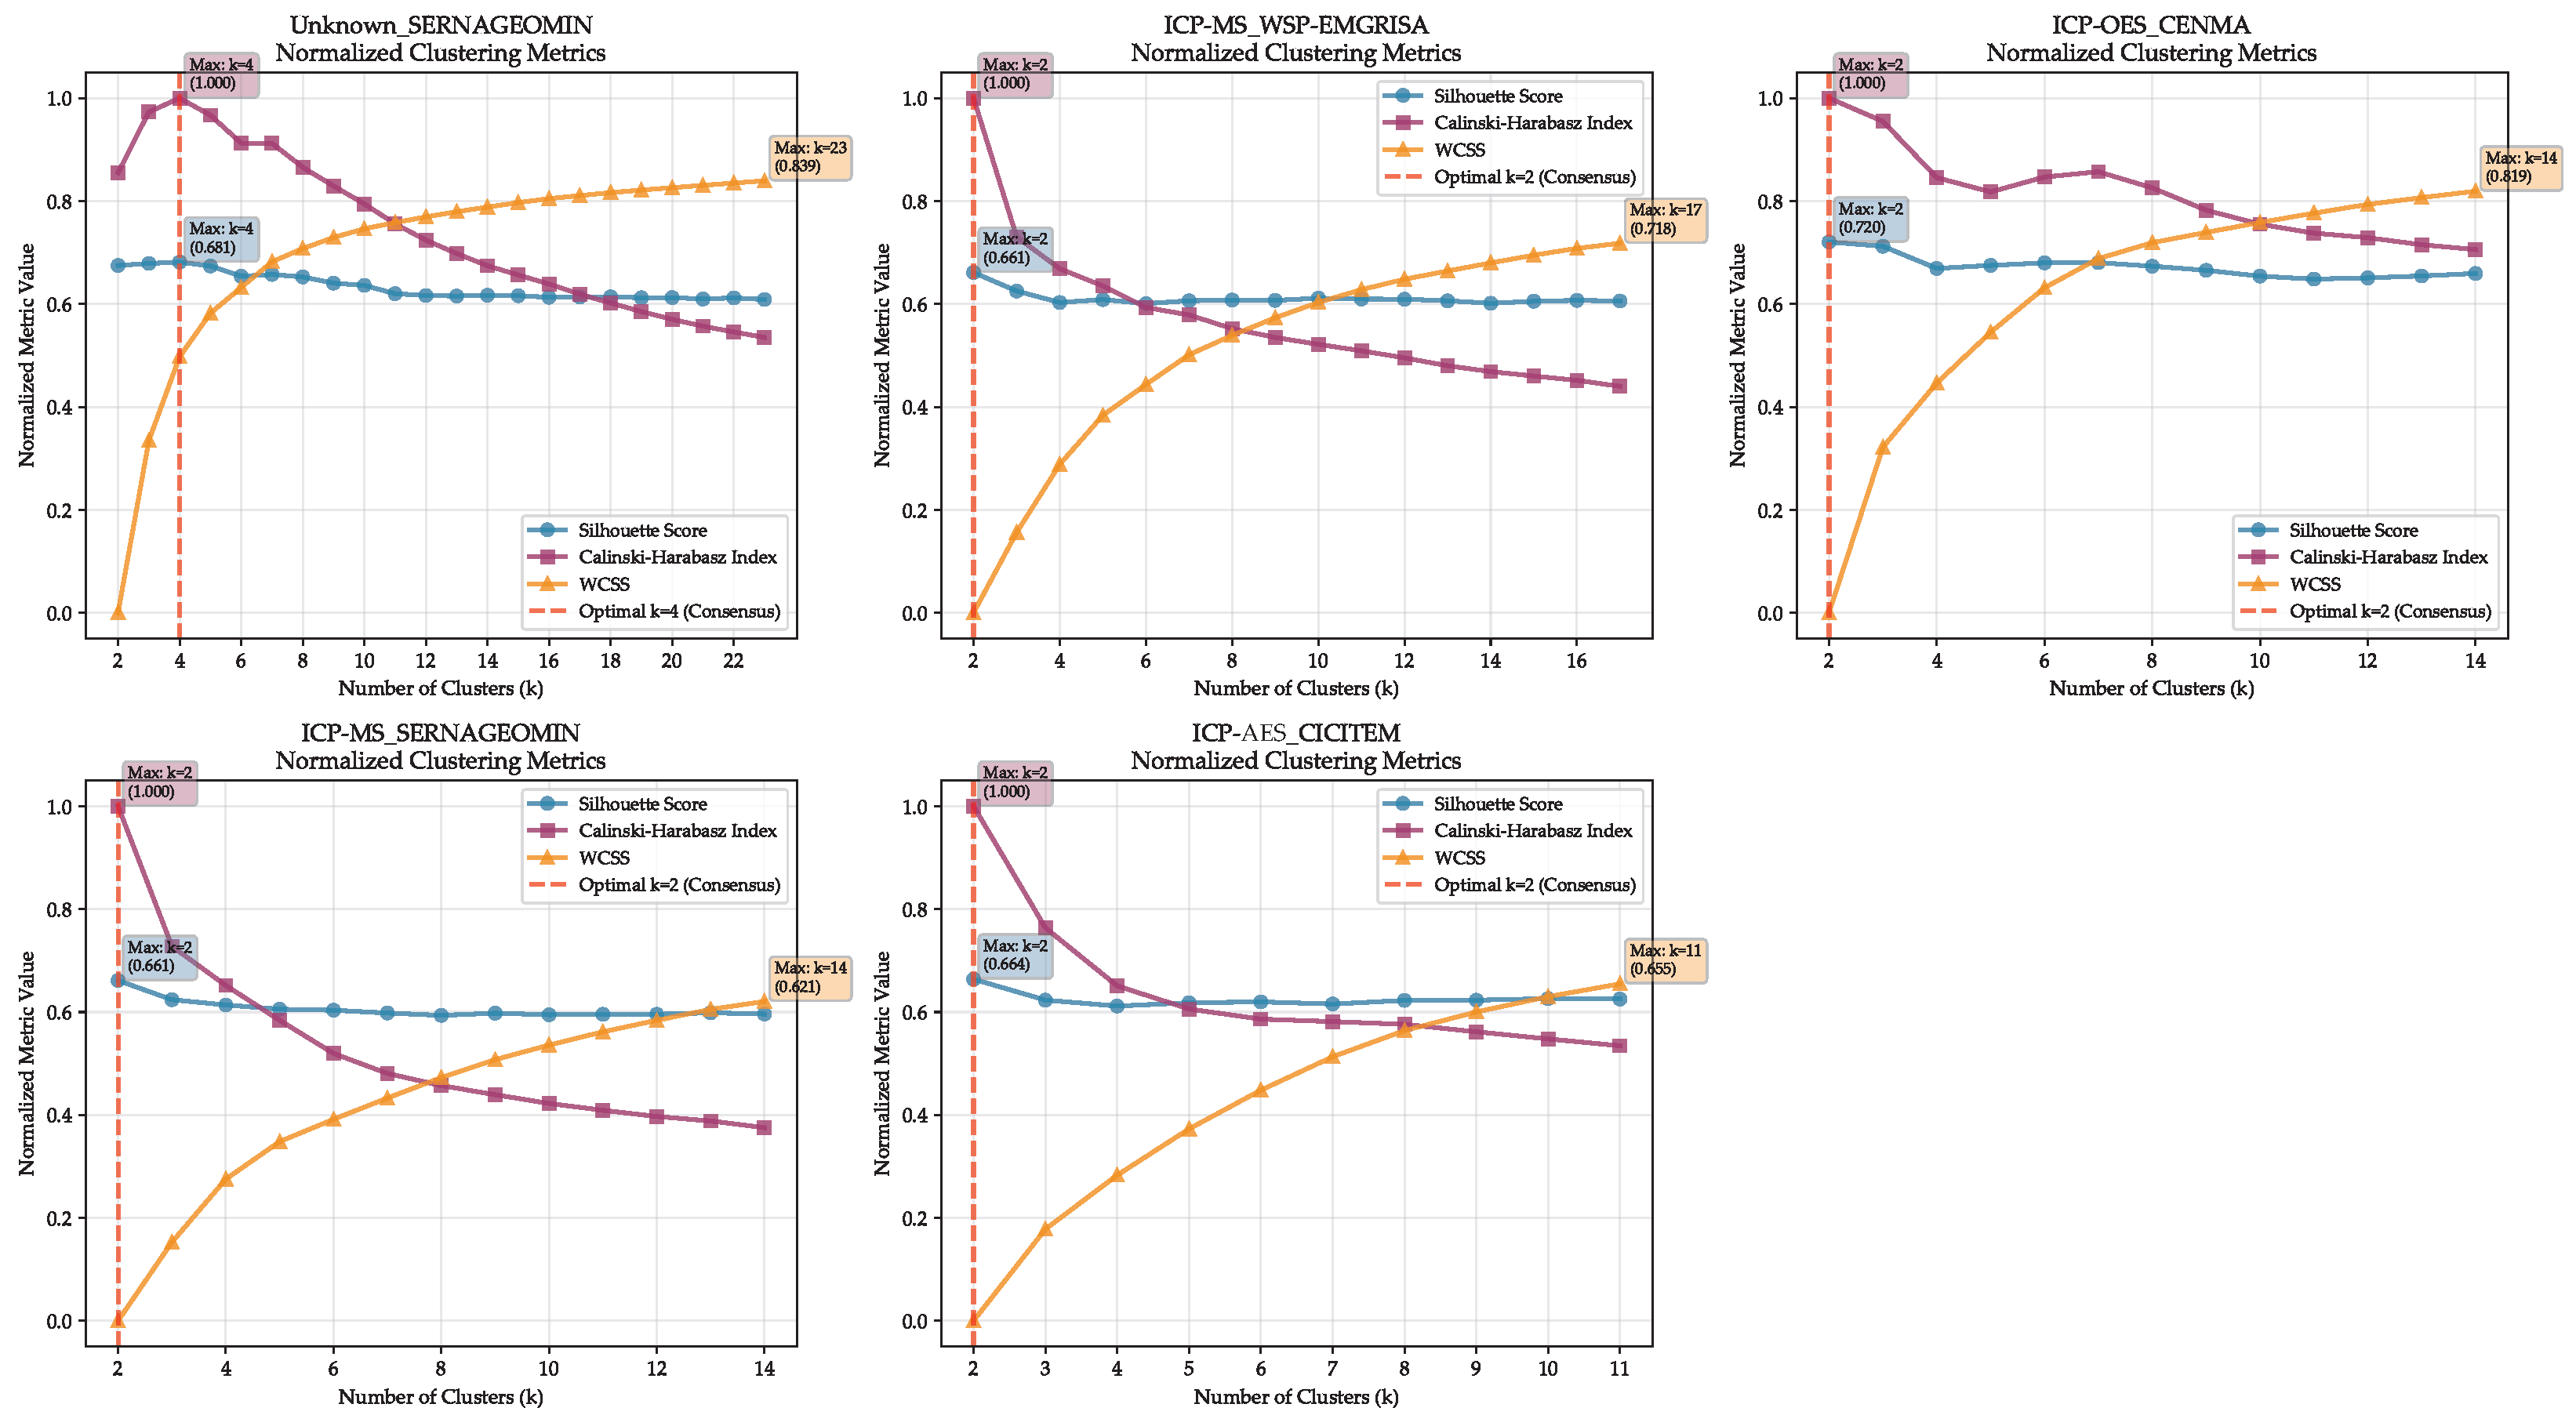
The optimal cluster numbers obtained through hierarchical clustering of the PCA-transformed datasets with spatial variables are shown in Figure 9. The consensus metrics indicated k = 4 for both the Unknown Method (SERNAGEOMIN) and ICP-MS (WSP-EMGRISA) subsets, while ICP-OES (CENMA) converged at k = 14 . The ICP-MS (SERNAGEOMIN) subset stabilized at k = 2 , and ICP-AES (CICITEM) also favored k = 2 . These results demonstrate a heterogeneous distribution of cluster sizes across the subsets, with solutions ranging from compact to more fragmented structures.

3.4.2. Hierarchical Clustering in Principal Component Analysis (Low-Rank Spatial Data)

Consensus results for the hierarchical clustering applied to PCA-LR datasets with spatial variables are summarized in Figure 10. In this case, four of the five subsets converged toward compact solutions with k = 2 , namely ICP-MS (WSP-EMGRISA), ICP-OES (CENMA), ICP-MS (SERNAGEOMIN), and ICP-AES (CICITEM). Only the Unknown Method (SERNAGEOMIN) subset supported a more fragmented structure with k = 4 . Overall, the incorporation of robust preprocessing markedly reduced the variability in the number of clusters, favoring more stable and compact outcomes.

3.4.3. Spectral Clustering in Principal Component Analysis (Spatial Data)

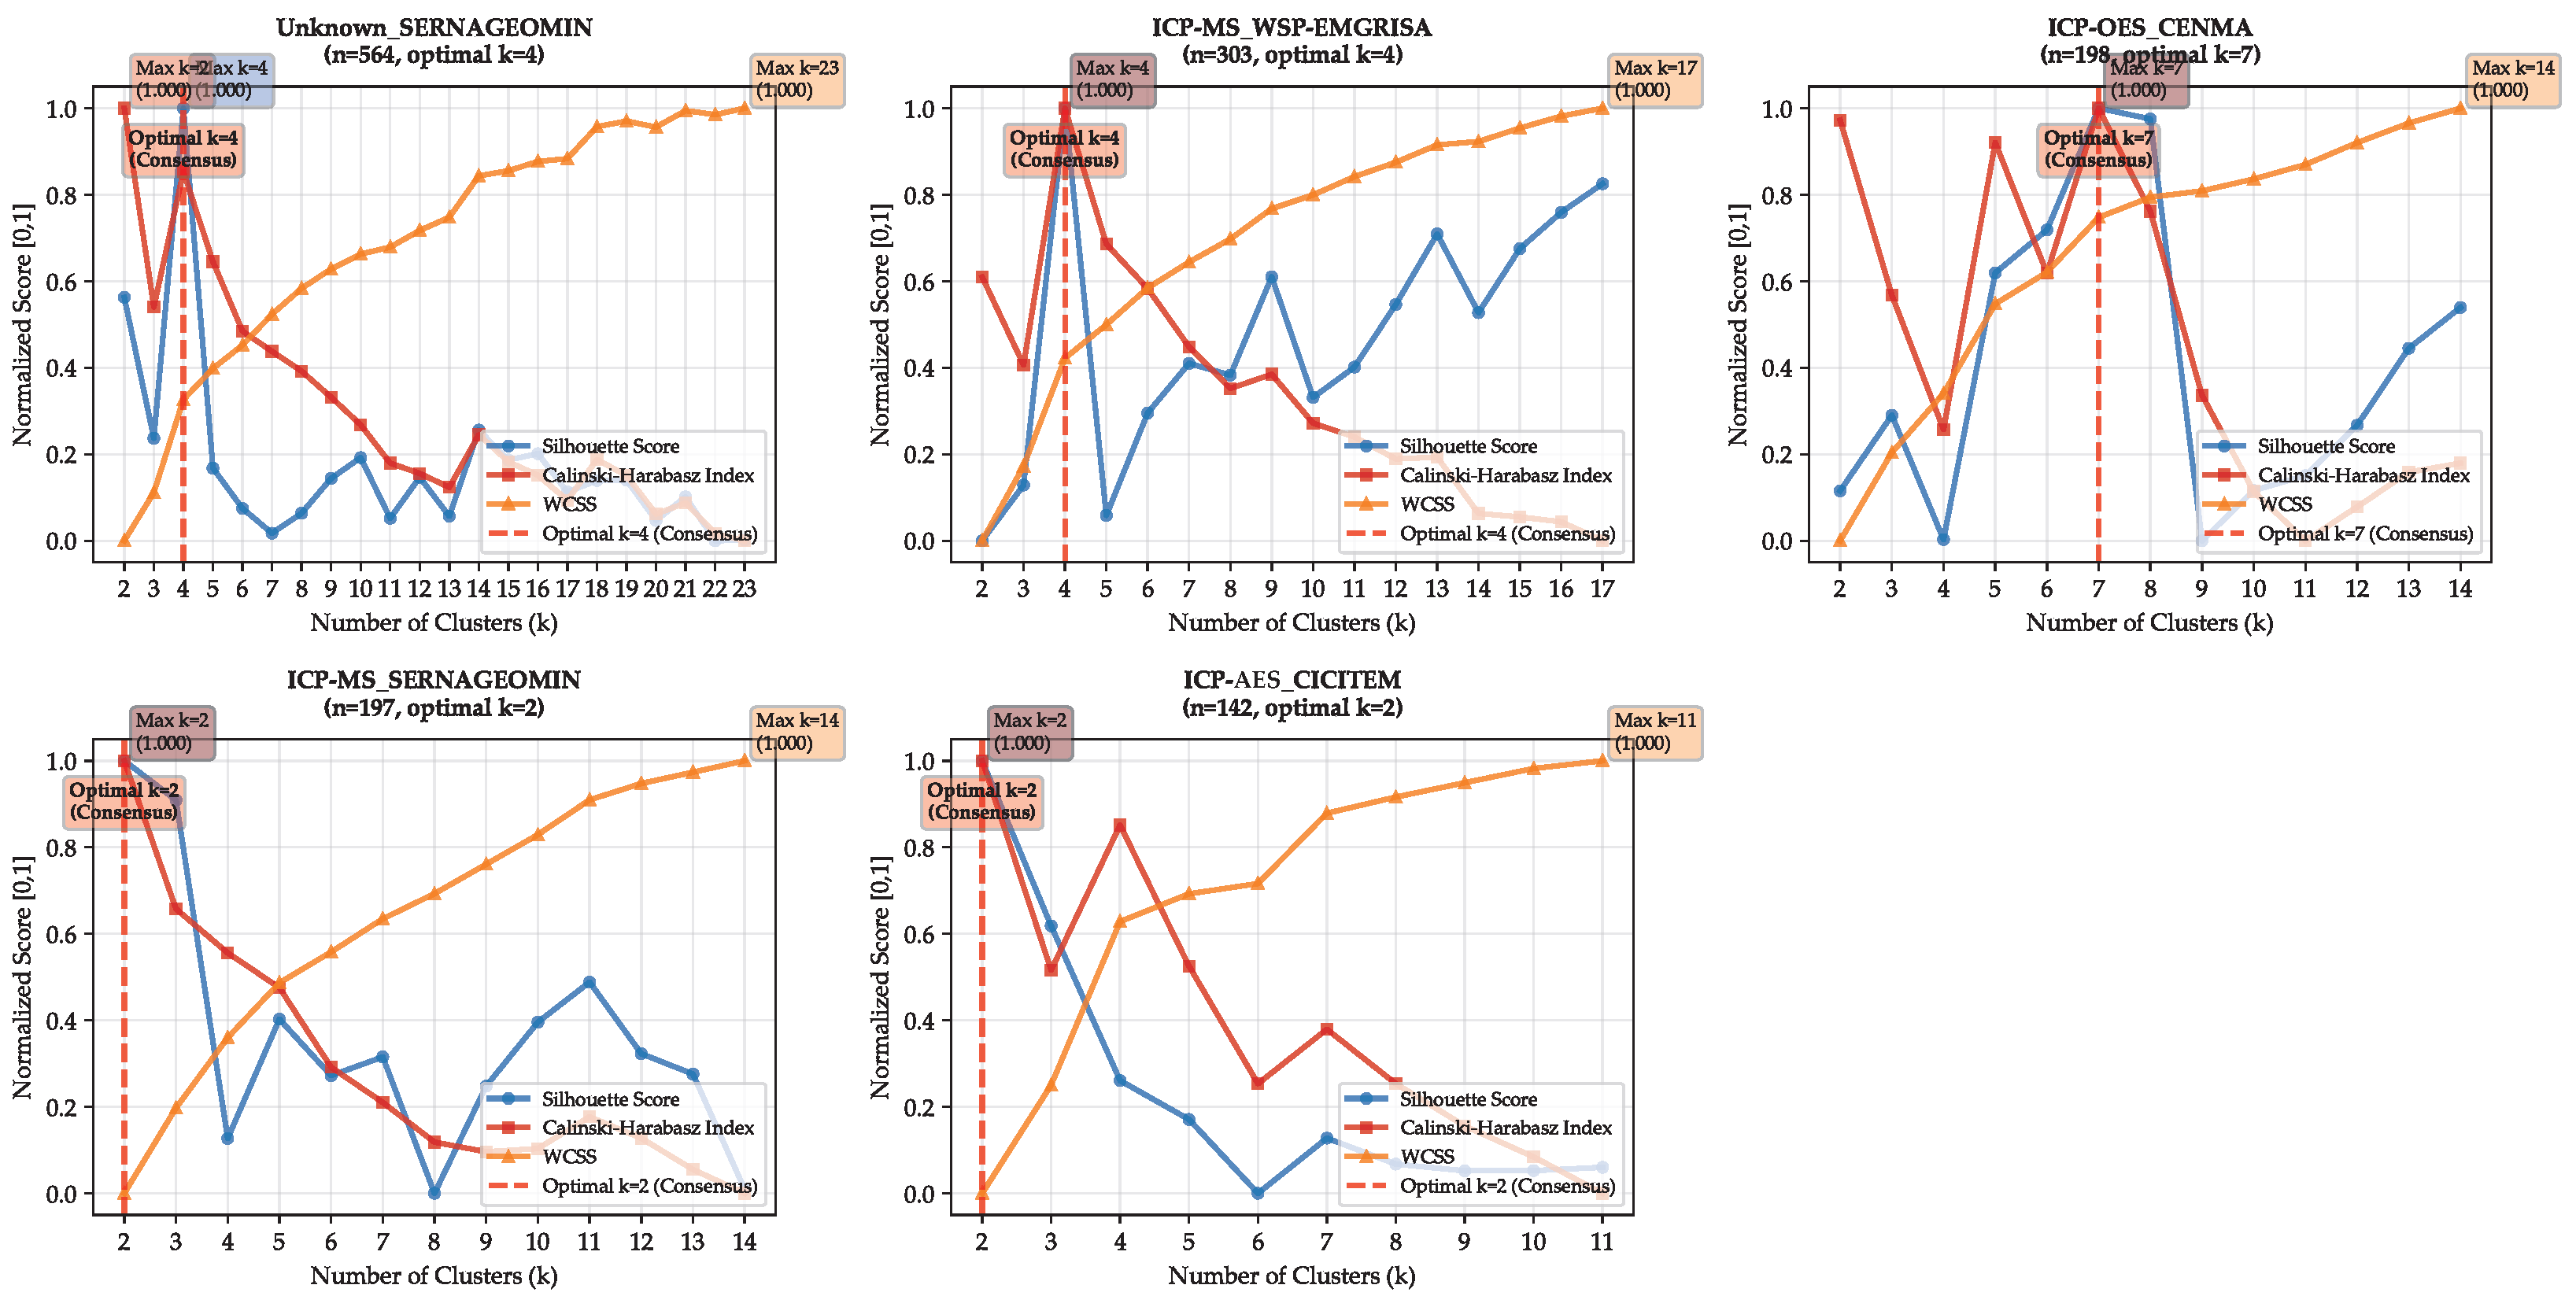
The spectral clustering analysis based on PCA with spatial variables is presented in Figure 11. The Unknown Method (SERNAGEOMIN) and ICP-MS (WSP-EMGRISA) subsets converged at k = 4 , while ICP-OES (CENMA) stabilized at k = 7 . In contrast, both ICP-MS (SERNAGEOMIN) and ICP-AES (CICITEM) selected k = 2 . This configuration reflects a balance between subsets requiring more granular partitions and others resolved through simpler divisions.

3.4.4. Spectral Clustering in Principal Component Analysis (Low Rank Spatial Data)

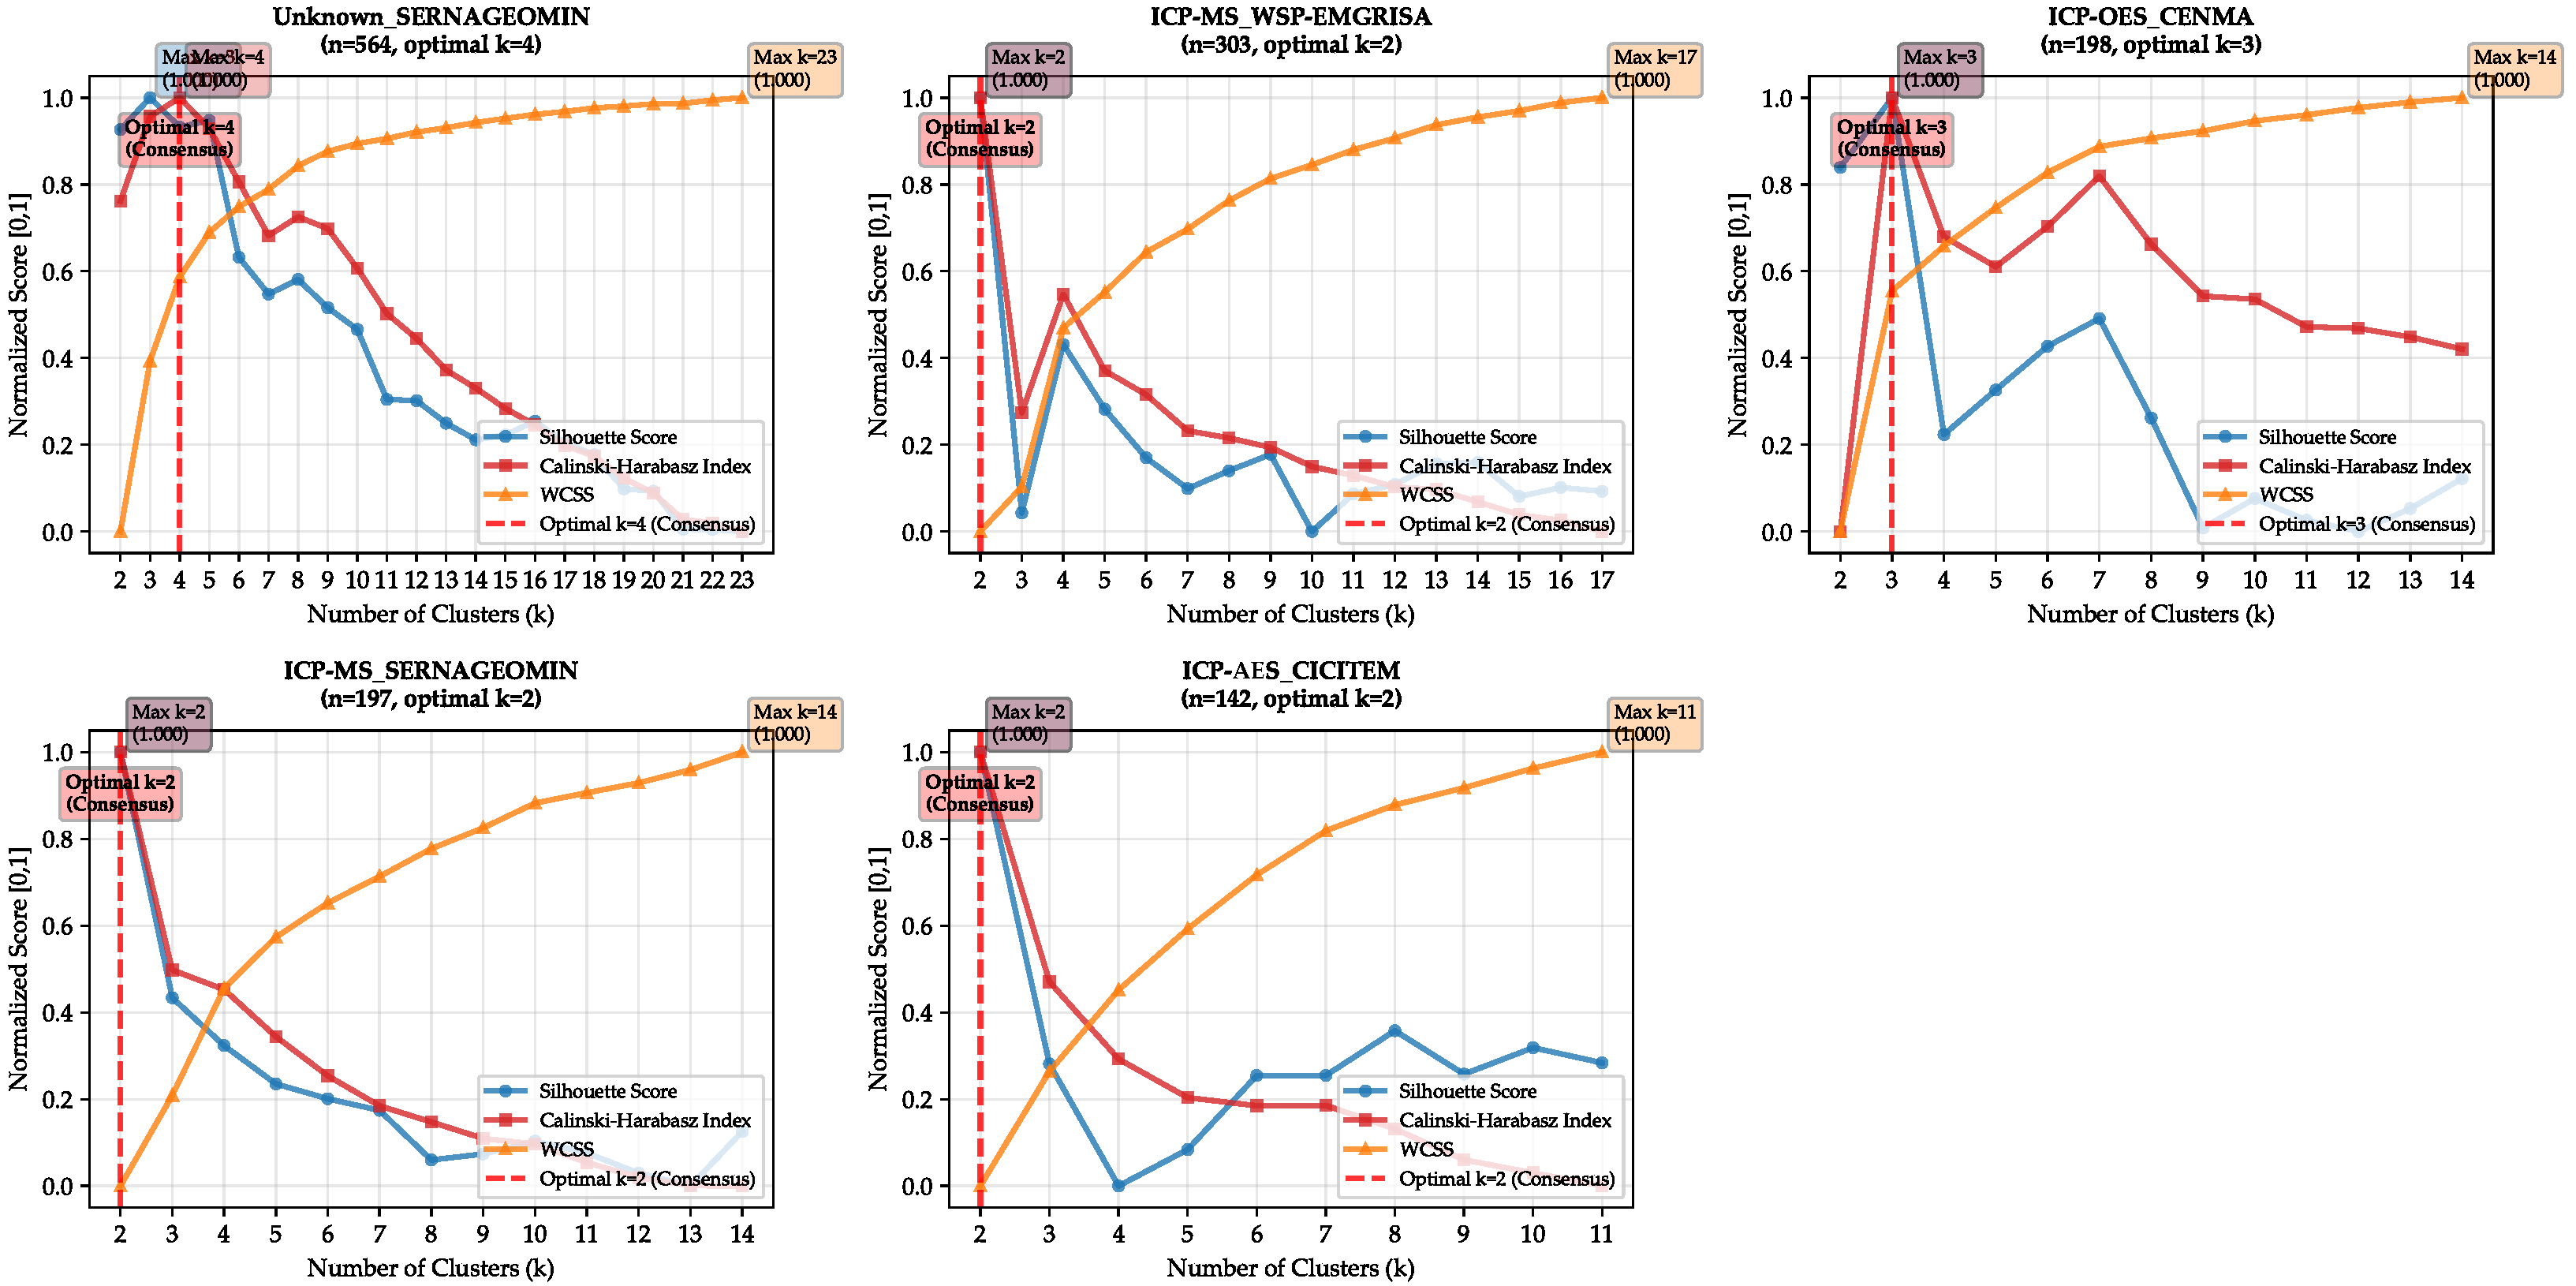
The consensus metrics for spectral clustering applied to PCA-LR datasets with spatial variables are summarized in Figure 12. Three subsets—ICP-MS (WSP-EMGRISA), ICP-MS (SERNAGEOMIN), and ICP-AES (CICITEM)—converged at k = 2 , while ICP-OES (CENMA) supported k = 3 . The Unknown Method (SERNAGEOMIN) subset diverged from this compact pattern, selecting k = 4 . These outcomes illustrate that the PCA-LR analytical workflow tends to compress the clustering structure into simpler solutions while preserving localized complexity in selected subsets.
To illustrate the effect of incorporating spatial variables into the workflow, Figure 13 presents the WSP-EMGRISA (ICP-MS) subset under the NG (chemistry-only) and YG (chemistry + geography) analytical workflows with HC-PCA-LR clustering. While the NG workflow generated a fragmented solution with numerous small clusters, the YG alternative converged into fewer, spatially coherent groups aligned with regional gradients. This example highlights how the addition of geographic coordinates constrains the partitioning process and reduces artificial fragmentation, thereby improving the interpretability of clusters in hyper-arid terrains.

3.5. Anomaly Detection

The outcomes of hierarchical and spectral clustering applied to both analytical workflows, with -and without- spatial variables, are summarized in Table 4. For each subset, the table reports the number of clusters identified and the corresponding anomalous samples. In the geochemical analytical workflow, hierarchical clustering based on PCA generated a larger number of clusters, in some cases exceeding ten, whereas the PCA-LR configuration typically reduced the solution to two or a few compact groups. A similar trend was observed for spectral clustering, where the inclusion of robust preprocessing consistently lowered the cluster count while preserving anomaly detection. When spatial variables were incorporated, the overall structure became more stable, with most methods converging to two to four clusters and anomaly counts remaining within comparable ranges. These results provide a consolidated view of the clustering behavior across subsets, highlighting the differences induced by dimensionality reduction and the inclusion of spatial information.
Figure 14 displays the spatial distribution of moderate to extreme geochemical anomalies identified in the study area. The comparison between the non-geographic dataset (left) and the geographic dataset (right) reveals that the overall pattern of anomalous points is broadly consistent across both analytical workflows, with anomalies concentrated along the coastal zone and in specific inland localities. The inclusion of spatial variables in the geographic dataset led to minor adjustments in anomaly classification, slightly reducing the number of high- and extreme-anomaly points. Most anomalies were classified as moderate, while only a few samples reached the high or extreme categories.
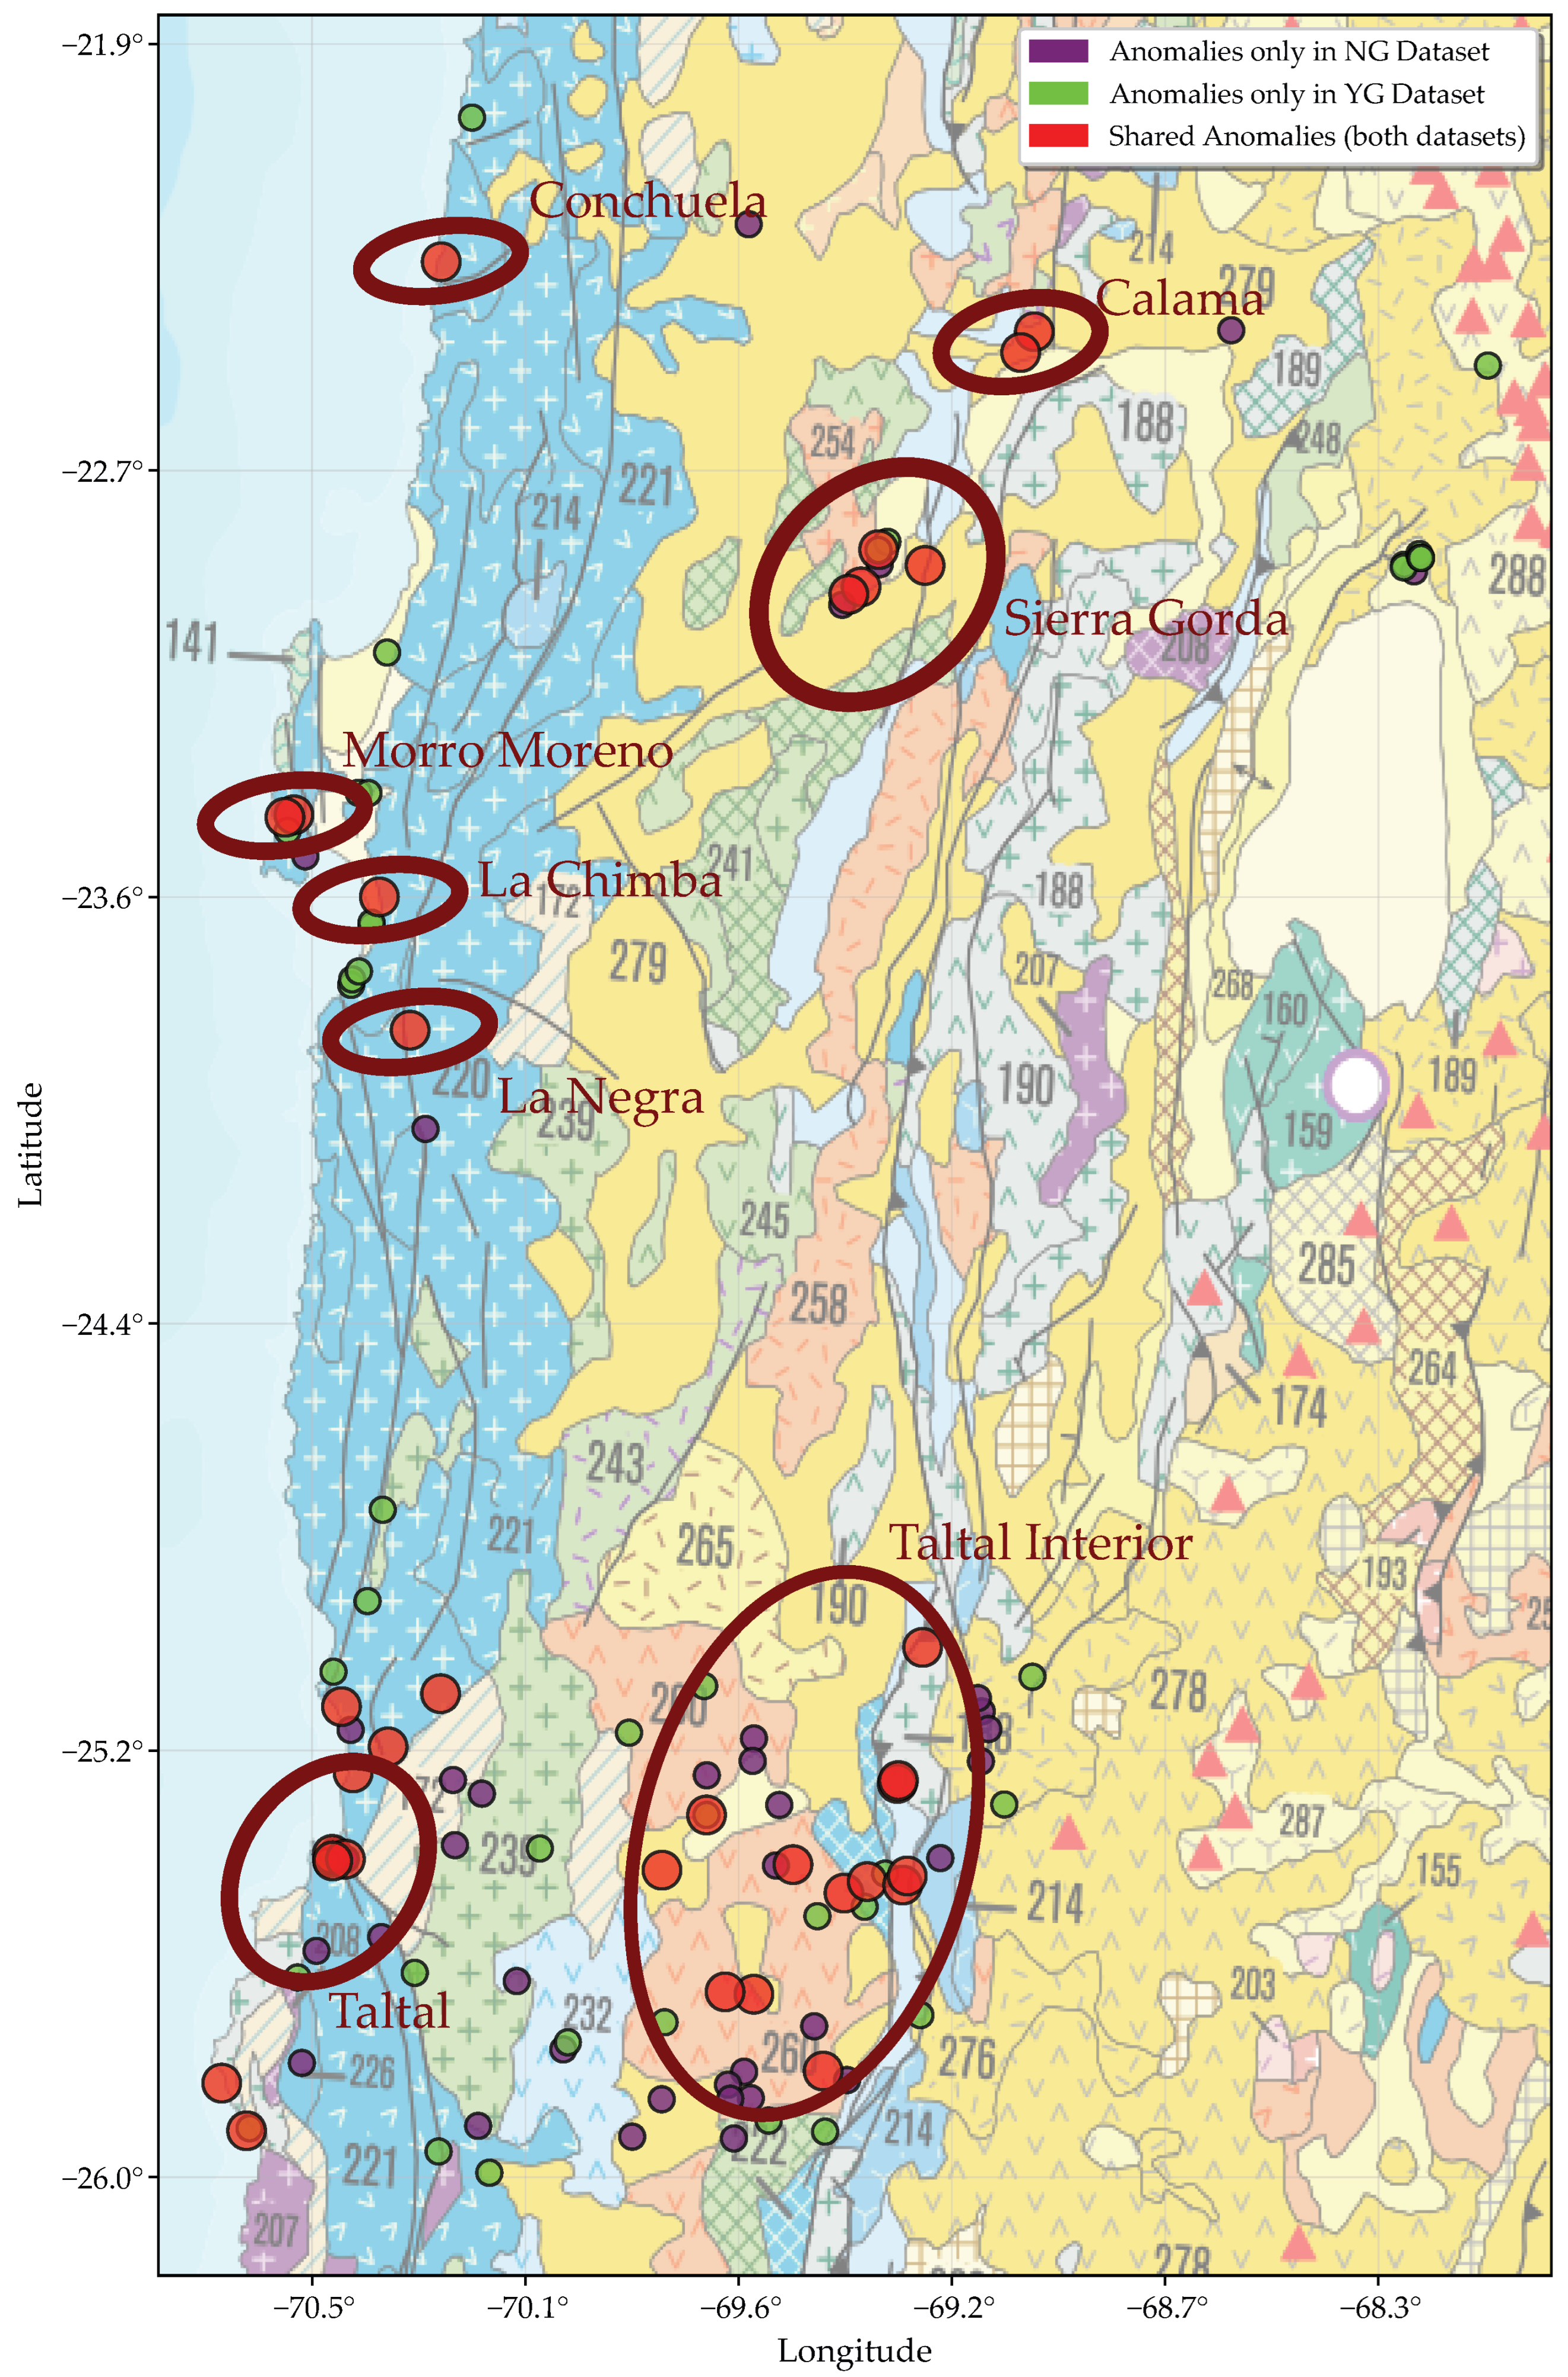
To provide a synthetic measure of agreement between both analytical workflows, the overlap of anomalous samples detected in the NG and YG datasets was quantified. The resulting Jaccard index was 0.2619, indicating that slightly more than one quarter of the anomalies were shared across the two approaches. This value summarizes the degree of consistency already observed in the tabulated results and clustering structures. Spatial distribution can be seen in Figure 15. The 1:5,000,000 geological base is employed solely to provide continental-scale lithological context. At this scale, the units are adequate for delineating regional background domains but not intended for local structural interpretation [61].

3.6. Filtered Anomaly List

Prior to focusing on the entire anomaly dataset, it is relevant to highlight those cases consistently identified by both analytical workflows: chemistry-only and chemistry-plus-geography. Table 5 presents the distribution of coincident anomalies across communes, analytical techniques, laboratories, and geological units.
The results shown in Table 5 were obtained after filtering the complete dataset to retain only those samples where the anomaly was detected simultaneously in the NG and YG analytical workflows. This restriction reduces the dataset to 33 samples, thereby eliminating cases considered anomalous by only one approach. The purpose of this filter is to reduce false positives in the analysis, ensuring that the anomalies presented here are those most consistent across methodologies and thus most reliable for subsequent geological interpretation.

3.7. Baseline Estimation

3.7.1. Global Baseline

Geochemical baseline values were first assessed at the regional level under four configurations: (i) analytical workflow without spatial variables (NG) including all samples, (ii) NG after removing anomalous samples, (iii) analytical workflow with spatial variables (YG) including all samples, and (iv) YG after removing anomalous samples. A total of 1404 soil samples were processed. Filtering anomalous records resulted in the exclusion of 76 samples in NG and 83 samples in YG. Results are presented in Table 6.
For each element, three statistical estimators were calculated: Median + 2 · MAD , Tukey ( Q 3 + 1.5 · IQR ), and 95th percentile. The baseline values reported in this section correspond to the average of these three estimators, providing a single representative value for comparison between scenarios.

3.7.2. Subset Analysis by Technique and Laboratory

In addition to the global analysis, results were stratified according to analytical technique and laboratory of origin. Five subsets were obtained: ICP-AES + CICITEM (142 samples), ICP-MS + SERNAGEOMIN (197 samples), ICP-MS + WSP-EMGRISA (303 samples), ICP-OES + CENMA (198 samples), and Unknown Method SERNAGEOMIN (564 samples). For each subset, the same three statistical estimators were computed and averaged. The reported baseline values thus represent the mean of the three methods, both with and without anomaly removal.
The subset analysis under the NG analytical workflow (Table 7) produced baseline values that were coherent across the five laboratory-technique groups, with differences reflecting the specific analytical datasets. The exclusion of anomalous samples led to a reduction of 2%–7% in the number of observations depending on the subset. Overall, the changes in average baseline values after filtering were minor, although certain elements such as As, Pb, and Hg showed more evident reductions in some laboratories. The NG configuration thus provided stable baseline estimates, with limited sensitivity to anomaly removal.
The laboratory-level analysis under the YG analytical workflow (Table 8) confirmed consistent baseline patterns across most subsets, while revealing variations in absolute concentrations among techniques. The removal of anomalous samples reduced the number of observations between 2% and 10% depending on the subset. The magnitude of changes in the average baseline values was generally modest, although more pronounced shifts were observed for As, Pb, and Zn in certain laboratories. These results indicate that the incorporation of spatial variables slightly increased the sensitivity of the anomaly filtering step while maintaining stable baseline estimates across laboratories.
The estimation of geochemical baselines revealed both regional coherence and strong laboratory-dependent heterogeneity. At the global scale, the proposed baselines (defined as the lowest NG/YG averages after anomaly removal) stabilized concentrations of key elements such as As (66.9 mg · kg−1), Pb (53.6 mg · kg−1), and Zn (166.8 mg · kg−1), thereby reducing the influence of extreme values. When disaggregated by laboratory and analytical technique, marked contrasts emerged: CENMA (ICP-OES) consistently exhibited elevated As, Pb, and Mo, whereas CICITEM (ICP-AES) and SERNAGEOMIN (ICP-MS) subsets displayed lower baselines but occasional increases after filtering, indicating that anomaly detection may also affect medium-range values. EMGRISA remained comparatively stable across all methods, while the SERNAGEOMIN (Unknown Method) subset showed coherent reductions in Pb and As following anomaly exclusion. These results highlight that although regional baselines provide operational thresholds for environmental screening, the laboratory- and method-specific baselines capture essential variability and should be retained as additional reference values for future comparative studies.

4. Discussion

4.1. Methodological Advances and Integration

The integrated ML analytical workflow developed in this study represents a significant advance over traditional univariate approaches to baseline determination in complex geochemical landscapes. By combining CoDA transformations with robust dimensionality reduction and consensus-based clustering, we addressed multiple challenges that have historically limited baseline assessments in heterogeneous terrains. The dramatic reduction in dimensionality achieved through PCA-LR (57%–77% fewer components while maintaining 95%–97% variance) demonstrates the effectiveness of robust preprocessing in isolating coherent geochemical signals from sparse anomalies.
The advantages of this approach become apparent when comparing our results with previous studies in the Atacama Desert. Ref. [14] reported similar baseline ranges for key elemets but relied primarily on robust statistics without the benefit of multivariate anomaly detection. The consensus-based approach developed in this study identified spatial patterns of enrichment that univariate methods would likely miss, particularly the subtle gradients between coastal and inland zones that reflect both marine aerosol inputs and mining-related dispersion.
The choice to implement parallel analytical workflows with and without spatial variables proved crucial for understanding the role of geographic autocorrelation in cluster formation. The moderate Jaccard index (0.26) between NG and YG analytical workflows indicates that while spatial proximity influences geochemical patterns, it does not fully determine them—lithology and anthropogenic impacts create discontinuities that pure distance-based methods cannot capture. This finding has important implications for sampling design in future surveys, suggesting that purely geometric grids may be less efficient than geology-informed strategies.

4.2. Laboratory Heterogeneity and Analytical Challenges

One of the most striking findings was the systematic variation in baseline values across laboratory-technique combinations. CENMA’s ICP-OES measurements consistently yielded higher concentrations for As (589–645 mg · kg−1), Pb (334–362 mg · kg−1), and Mo (44–47 mg · kg−1) compared to ICP-MS analyzes from other laboratories. While some variation is expected due to different extraction procedures and detection limits, the magnitude of these differences (up to 10-fold for certain elements) suggests that inter-laboratory calibration remains a critical issue for regional geochemical assessments.
This heterogeneity has important implications for regulatory compliance and risk assessment. When environmental standards rely on baselines derived from a single laboratory, systematic biases may result in unnecessary remediation (false positives) or undetected contamination (false negatives). Maintaining laboratory-specific baselines alongside regional averages offers a practical compromise, emphasizing the need for standardized analytical protocols and periodic inter-laboratory comparison programs.
RPCA decomposition effectively separated these systematic effects from true geochemical anomalies. The sparse component S captured 10%–16% of variance across subsets, consistent with the expected proportion of mining-influenced samples in the region. The low-rank component L , representing background variation, showed remarkable stability across iterations (convergence in less than 200 iterations for all subsets), validating the robustness of the ALM implementation.

4.3. Geochemical Patterns and Environmental Implications

The spatial distribution of anomalies reveals clear associations with known sources of metal enrichment. The concentration of extreme anomalies along the coastal zone likely reflects both natural enrichment from marine-derived sulfates and atmospheric deposition from coastal smelting operations. The Taltal area, with 974 of 1404 samples, showed the highest heterogeneity in cluster assignments, consistent with its complex history of small-scale and artisanal mining.
The baseline value for arsenic (66.9 mg · kg−1) represents the regional reference level for weathered soils in the Coastal Range metallogenic province. This value substantially exceeds typical soil quality guidelines but is consistent with hydrothermally altered volcanic rocks in the northern Chilean Iron Belt [14,30]. Previous geochemical surveys have documented elevated arsenic in mineralized zones associated with IOCG-style alteration [4]. This baseline reflects the composite signature of distributed mineralization and weathering processes, not pristine volcanic rocks. In metallogenic provinces, such elevated baselines are expected and do not preclude additional anthropogenic enrichment in specific locations. The distinction requires site-specific investigation using mineralogical speciation, depth profiling, and spatial analysis relative to mining infrastructure.
It is important to emphasize that this baseline represents the composite geochemical signature of weathered soils and regolith in mineralized terrain, not pristine volcanic rocks. While elevated arsenic concentrations are demonstrably natural in hydrothermally altered volcanic sequences of the Chilean Iron Belt [4,25], distinguishing natural enrichment from anthropogenic contributions requires a more careful analysis. In urban areas and zones adjacent to mining infrastructure, recent studies have documented arsenic enrichments up to 50–500× regional backgrounds that are unequivocally anthropogenic [5,62].
The clustering results revealed an unexpected pattern: simpler structures ( k = 2 4 ) emerged more frequently in the PCA-LR analytical workflow than in standard PCA, suggesting that much of the apparent complexity in raw data stems from sparse outliers rather than fundamental population differences. This has practical implications for environmental monitoring, as it suggests that a relatively small number of “indicator” sites could effectively characterize regional conditions once anomalous locations are identified and tracked separately.
The lead baseline (53.6 mg · kg−1) warrants careful interpretation, as it exceeds typical concentrations in unaltered andesitic-basaltic volcanic rocks by approximately 3–5 times. This elevated value likely reflects a combination of factors including (i) weathered soil rather than fresh bedrock, (ii) contributions from mineralized zones within the copper belt, (iii) mixing with sedimentary materials, or (iv) natural Pb-Zn polymetallic occurrences documented in the region [23].
Lead shows different geochemical behavior than arsenic in volcanic settings. The elevated baseline (53.6 mg · kg−1) likely reflects polymetallic mineralization documented in the region rather than primary volcanic geochemistry. This elevated baseline is therefore diagnostic of mineralized terrain rather than primary volcanic geochemistry. Users applying these baselines should recognize they represent composite signatures of weathered materials in the Coastal Range metallogenic province and may include contributions from both natural mineralization processes and, in some locations, diffuse anthropogenic inputs from over a century of mining activities [4,14,26]. Distinguishing these sources requires site-specific assessment including enrichment factor calculations, depth profiling, and spatial analysis relative to mining infrastructure.

4.4. Geochemical Anomalies

Statistical outliers identified through the clustering analysis represent geochemical extremes requiring individual interpretation. Their spatial association with specific geological units (Table 5) provides evidence about likely sources, but does not definitively establish origin. In the Coastal Range copper belt, natural mineralization, hydrothermal alteration, and anthropogenic inputs can produce similar geochemical signatures, necessitating site-specific evaluation using complementary evidence such as mineralogical speciation, depth profiling, or proximity to mining infrastructure.
Elevated values of As, Pb, Zn, and Co coincide with the La Negra Formation, reflecting the metallogenic significance of the Jurassic volcanic arc and its stratabound Cu-(Ag) hydrothermal systems [24,63]. The high coherence of anomalies in Jurassic granitoids and subordinate Paleozoic plutons further supports their interpretation as reliable signals of manto-type and breccia-hosted magmatic-hydrothermal mineralization characteristic of the Coastal Range copper belt [22]. These deposit types are genetically distinct from porphyry copper systems, which in Chile predominantly formed during Cretaceous and Cenozoic compressional tectonic regimes [64].
In contrast, anomalies identified in Neogene and Quaternary sediments are best explained by secondary dispersion processes, with metals remobilized from adjacent volcanic and plutonic units by fluvial, colluvial, or eolian dynamics. Their balanced but less coherent representation across analytical workflows suggests they act as environmental reservoirs rather than primary mineralization sites. Meanwhile, Paleozoic metamorphic complexes record only isolated anomalies, underscoring their structural rather than mineralizing role.
The geological correlations indicate that Jurassic volcanic units and associated granitoids host the majority of statistical outliers, consistent with their known metallogenic significance. However, geological association does not preclude anthropogenic overprinting, particularly in areas with long mining histories. The subset of outliers in Neogene-Quaternary sediments may represent either secondary dispersion from bedrock sources or accumulation of mining-derived particulates.
The subset of coincident anomalies between NG and YG analytical workflows provides an internally consistent view of the geochemical landscape, reinforcing the geological patterns described above. By restricting the analysis to samples simultaneously flagged by both analytical workflows, the dataset highlights anomalies that are methodologically robust and therefore less likely to represent statistical noise. Within this reduced group, the dominance of Jurassic volcanic units and associated granitoids remains evident, confirming their role as the main metallogenic hosts in the region. In contrast, only a minor fraction of coincident anomalies occurs in Neogene and Quaternary deposits, supporting their interpretation as products of secondary dispersion. This focused analysis thus validates the broader interpretation by demonstrating that the strongest and most reproducible anomalies are those linked to the Jurassic arc and its intrusive counterparts.

4.5. Baseline Interpretation Framework

The baselines established in this study serve as regional reference values for the Coastal Range metallogenic province rather than pristine natural backgrounds. In mineralized terrains, “background” necessarily includes distributed mineralization, alteration assemblages, and weathering products characteristic of the geological setting. Statistical outliers excluded from baseline calculations represent the upper tail of the regional concentration distribution.
These baselines have specific operational applications and limitations. Concentrations below established thresholds are typical for the province and do not warrant investigation. Values above these thresholds should trigger site-specific assessment but do not automatically indicate contamination requiring remediation. The methodology identifies geochemical extremes but does not distinguish between natural mineralization and anthropogenic inputs—that determination requires supplementary evidence including mineralogical speciation, vertical concentration profiles, spatial analysis relative to mining infrastructure, and isotopic fingerprinting where applicable.
For regulatory purposes, these values must be interpreted within their geological context. The arsenic baseline (66.9 mg · kg−1) may be appropriate near known mineralization but concerning in residential areas distant from geological sources. Regulatory decisions must consider both regional geochemical context and site-specific exposure scenarios. These baselines are specific to weathered surficial materials in the Chilean Iron Belt and cannot be extrapolated to unmineralized volcanic sequences or different geological settings. The methodology is transferable, but the numerical thresholds are not.

4.6. Limitations and Uncertainties

Key limitations remain. Sampling is strongly skewed toward Taltal, so coastal lithologies dominate and high-altitude trends may be under-represented. After the 50% missing-data filter, laboratory subsets retain only 19–32 elements, limiting complete-case statistics. Quality-control metadata are uneven: SERNAGEOMIN provides duplicates and certified standards [27]; WSP-EMGRISA reports field duplicates and accreditation only [28]; CENMA lists detection limits and duplicate precision [29]; CICITEM adds accredited ICP-AES data but omits blank values [30,35]. Where detection limits are absent, non-detects may have been replaced by half-limit values, adding unquantified censoring error.
Several limitations remain. At first, sampling is uneven: more than two-thirds of the observations come from Taltal, whereas coastal-Andean transects such as Mejillones and Ollagüe are lightly represented. This bias may shift background values toward coastal lithologies and mask high-altitude trends. Second, after removing variables with more than 50% missing data, the retained element lists still differ among laboratory-technique groups (19–32 variables), so analyzes based on complete cases cannot span the full chemical space of the region. Third, quality-control records are inconsistent. SERNAGEOMIN reports duplicates and certified reference materials in detail [27]; WSP-EMGRISA lists field duplicates and ISO 17025 accreditation but neither standards nor element-specific detection limits [28]; CENMA provides limits of detection and duplicate charts derived from its LE-174 protocol [29]; CICITEM offers an accredited aqua-regia ICP-AES dataset supported by paired portable X-ray fluorescence measurements, though individual blank values are still unavailable [30]. Where formal detection-limit tables are missing, non-detects may have been replaced by half-limit values, adding an unquantified source of censoring error.
Temporal dimension remains unexplored. Our dataset aggregates samples collected over multiple years without accounting for potential temporal trends in either natural processes (e.g., ENSO-related changes in dust deposition) or anthropogenic inputs (expansion or closure of mining operations). Future work should incorporate time-series analysis to distinguish between stable baselines and evolving contamination patterns.
While the consensus approach to anomaly detection reduces the impact of any single algorithm’s biases, it may be conservative in flagging borderline cases. The 95th percentile threshold, though standard in environmental applications, is somewhat arbitrary and could be refined using external validation data such as known contamination incidents or ecological impact assessments.

4.7. Broader Applications and Future Directions

The methodology developed here has broad applicability beyond the Atacama Desert, particularly in mineralized hyper-arid regions. These environments face similar challenges in baseline determination: sparse vegetation limits biological cycling, slow weathering preserves ancient geochemical signatures including mineralization-related enrichments, and mining often represents the primary economic activity. The framework is especially suited for distinguishing geogenic from anthropogenic metal sources in metallogenic provinces where naturally elevated concentrations overlap with potential contamination. This analytical workflow could be adapted to other mining districts in Peru, Argentina, Australia, and Nevada with minimal modification.
Future research should focus on three priority areas. First, integration of mineralogical data through techniques such as automated mineralogy or hyperspectral imaging could help distinguish between different forms of metal occurrence and their associated environmental risks. Second, machine learning methods could be extended to predict baseline values in unsampled areas using geological, topographic, and climatic covariates.

5. Conclusions

This study establishes that machine learning approaches can disentangle overlapping signatures of natural and anthropogenic metal enrichment in hyper-arid environments. The integrated analytical workflow combining compositional data analysis, robust dimensionality reduction, and consensus-based anomaly detection provides a framework for geochemical baseline determination.
The parallel implementation of chemistry-only and chemistry-plus-geography analytical workflows revealed the relative importance of lithological versus spatial controls on geochemical patterns. Robust preprocessing through RPCA effectively isolated background structure from localized anomalies while achieving substantial dimensionality reduction.
Inter-laboratory variability emerged as a critical factor, with baseline estimates varying significantly between analytical techniques. This finding underscores the necessity of maintaining technique-specific reference values alongside regional averages for environmental monitoring programs.
The methodology provides environmental regulators with regional reference values specific to the metallogenic context of the Coastal Range. These baselines account for elevated metal concentrations characteristic of mineralized volcanic terrains but do not distinguish between natural ore-related enrichment and anthropogenic input, as that determination requires site-specific investigation.
Future priorities include temporal analysis to track contamination evolution, integration with mineralogical and isotopic data for improved source apportionment, and development of predictive models for unsampled areas. As mineral extraction expands into increasingly remote environments, such tools become essential for balancing resource development with environmental protection in water-scarce regions where traditional monitoring approaches often fail to capture geochemical complexity.

Supplementary Materials

The following supporting information can be downloaded at: https://www.mdpi.com/article/10.3390/min15111185/s1.

Author Contributions

G.A.-A.: Conceptualization; Methodology; Software; Formal analysis; Data curation; Visualization. E.J.L.: Conceptualization; Project administration; Supervision; Funding acquisition. B.K.-N.: Conceptualization; Methodology; Supervision; Funding acquisition. Í.L.M.: Data curation; Investigation; Validation. A.F.: Data curation; Methodology; Validation. C.F.: Data curation; Methodology; Validation. J.B.: Investigation; Resources; Validation. All authors participated in the writing of the original draft and the review & editing of the document. All authors have read and agreed to the published version of the manuscript.

Funding

This study was funded by the ANID Subdirección de Investigación Aplicada/FONDEF IT24I0030 project titled “Intelligent platform for environmental management and soil monitoring in the Antofagasta region, through baseline modeling using artificial intelligence“.

Data Availability Statement

We have included the data used for the models in the Supplementary Materials.

Acknowledgments

The authors gratefully acknowledge the constructive insights of the three anonymous reviewers and the valuable editorial assistance provided by the editors. The first author also thanks José María Ponce for their continuous support.

Conflicts of Interest

The authors declare no conflicts of interest.

References

  1. Grantcharova, M.M.; Fernández-Caliani, J.C. Soil acidification, mineral neoformation and heavy metal contamination driven by weathering of sulphide wastes in a Ramsar wetland. Appl. Sci. 2021, 12, 249. [Google Scholar] [CrossRef]
  2. Reimann, C.; Filzmoser, P.; Garrett, R.G. Background and threshold: Critical comparison of methods of determination. Sci. Total Environ. 2005, 346, 1–16. [Google Scholar] [CrossRef]
  3. Reimann, C.; de Caritat, P. Establishing geochemical background variation and threshold values for 59 elements in Australian surface soil. Sci. Total Environ. 2017, 578, 633–648. [Google Scholar] [CrossRef]
  4. Tapia, J.; González, R.; Townley, B.; Oliveros, V.; Álvarez, F.; Aguilar, G.; Menzies, A.; Calderón, M. Geology and geochemistry of the Atacama Desert. Antonie Leeuwenhoek 2018, 111, 1273–1291. [Google Scholar] [CrossRef] [PubMed]
  5. Zanetta-Colombo, N.C.; Manzano, C.A.; Brombierstäudl, D.; Fleming, Z.L.; Gayo, E.M.; Rubinos, D.A.; Jerez, Ó.; Valdés, J.; Prieto, M.; Nüsser, M. Blowin’in the wind: Mapping the dispersion of metal (loid) s from Atacama mining. GeoHealth 2024, 8, e2024GH001078. [Google Scholar] [CrossRef] [PubMed]
  6. Reimann, C. Geochemical mapping: Technique or art? Geochem. Explor. Environ. Anal. 2005, 5, 359–370. [Google Scholar] [CrossRef]
  7. Filzmoser, P.; Hron, K.; Reimann, C. Principal component analysis for compositional data with outliers. Environmetrics 2009, 20, 621–632. [Google Scholar] [CrossRef]
  8. Grunsky, E.; Greenacre, M.; Kjarsgaard, B. GeoCoDA: Recognizing and validating structural processes in geochemical data. A workflow on compositional data analysis in lithogeochemistry. Appl. Comput. Geosci. 2024, 22, 100149. [Google Scholar] [CrossRef]
  9. Templ, M.; Filzmoser, P.; Reimann, C. Cluster analysis applied to regional geochemical data: Problems and possibilities. Appl. Geochem. 2008, 23, 2198–2213. [Google Scholar] [CrossRef]
  10. Ueki, K.; Hino, H.; Kuwatani, T. Geochemical discrimination and characteristics of magmatic tectonic settings: A machine-learning-based approach. Geochem. Geophys. Geosyst. 2018, 19, 1327–1347. [Google Scholar] [CrossRef]
  11. Filzmoser, P. Identification of multivariate outliers: A performance study. Austrian J. Stat. 2005, 34, 127–138. [Google Scholar] [CrossRef]
  12. Amirajlo, P.; Hassani, H.; Beiranvand Pour, A.; Habibkhah, N. Detection of multivariate geochemical anomalies using machine learning (ML) algorithms in Dehaq Pb-Zn mineralization, Sanandaj-Sirjan zone, Isfahan, Iran. Earth Sci. Inform. 2025, 18, 124. [Google Scholar] [CrossRef]
  13. Wen, W.; Yang, F.; Xie, S.; Wang, C.; Song, Y.; Zhang, Y.; Zhou, W. Determination of Geochemical Background and Baseline and Research on Geochemical Zoning in the Desert and Sandy Areas of China. Appl. Sci. 2024, 14, 10612. [Google Scholar] [CrossRef]
  14. Keith, B.F.; Lam, E.J.; Montofré, I.L.; Zetola, V.; Urrutia, J.; Herrera, C.; Bech, J. Evaluation of the geochemical background of soil in a hyper-arid zone using a multivariate statistical methodology: The case of the city of Antofagasta in the Atacama Desert. Chemosphere 2024, 366, 143472. [Google Scholar] [CrossRef]
  15. Salminen, R.; Gregorauskien, V. Considerations regarding the definition of a geochemical baseline of elements in the surficial materials in areas differing in basic geology. Appl. Geochem. 2000, 15, 647–653. [Google Scholar] [CrossRef]
  16. Hron, K.; Templ, M.; Filzmoser, P. Imputation of missing values for compositional data using classical and robust methods. Comput. Stat. Data Anal. 2010, 54, 3095–3107. [Google Scholar] [CrossRef]
  17. Prasianakis, N.; Laloy, E.; Jacques, D.; Meeussen, J.; Miron, G.; Kulik, D.; Idiart, A.; Demirer, E.; Coene, E.; Cochepin, B.; et al. Geochemistry and machine learning: Methods and benchmarking. Environ. Earth Sci. 2025, 84, 121. [Google Scholar] [CrossRef]
  18. Lam, E.J.; Keith, B.F.; Montofré, Í.L.; Gálvez, M.E. Copper uptake by Adesmia atacamensis in a mine tailing in an arid environment. Air Soil Water Res. 2018, 11, 1178622118812462. [Google Scholar] [CrossRef]
  19. Delouis, B.; Philip, H.; Dorbath, L.; Cisternas, A. Recent crustal deformation in the Antofagasta region (northern Chile) and the subduction process. Geophys. J. Int. 1998, 132, 302–338. [Google Scholar] [CrossRef]
  20. Blanco-Arrué, B.; Yogeshwar, P.; Tezkan, B.; Mörbe, W.; Díaz, D.; Farah, B.; Buske, S.; Ninneman, L.; Domagala, J.; Diederich-Leicher, J.; et al. Exploration of sedimentary deposits in the Atacama Desert, Chile, using integrated geophysical techniques. J. S. Am. Earth Sci. 2022, 115, 103746. [Google Scholar] [CrossRef]
  21. Gómez, J.; Schobbenhaus, C.; Montes, N. Geological Map of South America 2019. Scale 1:5000000; Commission for the Geological Map of the World (CGMW): Paris, France; Colombian Geological Survey, and Geological Survey of Brazil: Rio de Janeiro, Brazil, 2019. [Google Scholar] [CrossRef]
  22. Ramírez, L.E.; Palacios, C.; Townley, B.; Parada, M.; Sial, A.; Fernandez-Turiel, J.; Gimeno, D.; Garcia-Valles, M.; Lehmann, B. The Mantos Blancos copper deposit: An upper Jurassic breccia-style hydrothermal system in the Coastal Range of Northern Chile. Miner. Depos. 2006, 41, 246–258. [Google Scholar] [CrossRef]
  23. Boric, R. Geología y Yacimientos Metalíferos de la Región de Antofagasta; Servicio Nacional de Geologia y Mineria: Santiago, Chile, 1990; Volume 40, p. 246. [Google Scholar]
  24. Vivallo, W.; Henriquez, F. Génesis común de los yacimientos estratoligados y vetiformes de cobre del Jurásico Medio a Superior en la Cordillera de la Costa, Región de Antofagasta, Chile. Rev. Geol. Chile 1998, 25, 199–228. [Google Scholar] [CrossRef]
  25. Oliveros, V.; Féraud, G.; Aguirre, L.; Fornari, M.; Morata, D. The Early Andean Magmatic Province (EAMP): 40Ar/39Ar dating on Mesozoic volcanic and plutonic rocks from the Coastal Cordillera, northern Chile. J. Volcanol. Geotherm. Res. 2006, 157, 311–330. [Google Scholar] [CrossRef]
  26. Lam, E.J.; Montofré, I.L.; Álvarez, F.A.; Gaete, N.F.; Poblete, D.A.; Rojas, R.J. Methodology to prioritize chilean tailings selection, according to their potential risks. Int. J. Environ. Res. Public Health 2020, 17, 3948. [Google Scholar] [CrossRef]
  27. Servicio Nacional de Geología y Minería (SERNAGEOMIN). Geoquímica de Sedimentos, Hoja Taltal, Regiones de Antofagasta y Atacama; Technical Report Informe N° 11; SERNAGEOMIN: Santiago, Chile, 2022. [Google Scholar]
  28. WSP–EMGRISA. Geochemical Baseline Survey in Urban and Peri-Urban Soils of the Antofagasta Region: Sampling Design, ICP-MS Analytical Method and Quality-Control Procedures; Technical report; Internal technical report, Revision 2, November 2019; Williams Sale Partnership and Empresa para la Gestión de Residuos Industriales: Santiago, Chile, 2019. [Google Scholar]
  29. CENMA. QA/QC Manual for ICP-OES Determination of Trace Metals in Soils (USEPA 3052/6010C): Application to Environmental Monitoring Campaigns 2014–2019; Technical report; Laboratory procedure LE-174, updated July 2016; Centro Nacional del Medio Ambiente: Santiago, Chile, 2016. [Google Scholar]
  30. Tarvainen, T.; Reyes, A.; Sapon, S. Acceptable soil baseline levels in Taltal, Chile, and in Tampere, Finland. Appl. Geochem. 2020, 123, 104813. [Google Scholar] [CrossRef]
  31. Reimann, C. Experiences from 30 years of low-density geochemical mapping at the subcontinental to continental scale in Europe. Geochem. Explor. Environ. Anal. 2022, 22. [Google Scholar] [CrossRef]
  32. Helsel, D.R. Statistics for Censored Environmental Data Using Minitab® and R: Helsel/Statistics for Environmental Data 2E; John Wiley & Sons, Inc.: Hoboken, NJ, USA, 2011. [Google Scholar] [CrossRef]
  33. Noventa, S.; Pace, E.; Esposito, D.; Libralato, G.; Manfra, L. Handling concentration data below the analytical limit in environmental mixture risk assessment: A case-study on pesticide river monitoring. Sci. Total Environ. 2024, 907, 167670. [Google Scholar] [CrossRef]
  34. Eggen, O.A.; Reimann, C.; Flem, B. Reliability of geochemical analyses: Deja vu all over again. Sci. Total Environ. 2019, 670, 138–148. [Google Scholar] [CrossRef] [PubMed]
  35. Balaram, V.; Satyanarayanan, M. Data Quality in Geochemical Elemental and Isotopic Analysis. Minerals 2022, 12, 999. [Google Scholar] [CrossRef]
  36. Demetriades, A.; Smith, D.; Wang, X. General concepts of geochemical mapping at global, regional, and local scales for mineral exploration and environmental purposes. Geochim. Bras. 2018, 32, 136–179. [Google Scholar] [CrossRef]
  37. Harris, C.R.; Millman, K.J.; Van Der Walt, S.J.; Gommers, R.; Virtanen, P.; Cournapeau, D.; Wieser, E.; Taylor, J.; Berg, S.; Smith, N.J.; et al. Array programming with NumPy. Nature 2020, 585, 357–362. [Google Scholar] [CrossRef]
  38. McKinney, W. Data structures for statistical computing in Python. Scipy 2010, 445, 51–56. [Google Scholar]
  39. Virtanen, P.; Gommers, R.; Oliphant, T.E.; Haberland, M.; Reddy, T.; Cournapeau, D.; Burovski, E.; Peterson, P.; Weckesser, W.; Bright, J.; et al. SciPy 1.0: Fundamental algorithms for scientific computing in Python. Nat. Methods 2020, 17, 261–272. [Google Scholar] [CrossRef]
  40. Pedregosa, F.; Varoquaux, G.; Gramfort, A.; Michel, V.; Thirion, B.; Grisel, O.; Blondel, M.; Prettenhofer, P.; Weiss, R.; Dubourg, V.; et al. Scikit-learn: Machine learning in Python. J. Mach. Learn. Res. 2011, 12, 2825–2830. [Google Scholar]
  41. Hunter, J.D. Matplotlib: A 2D graphics environment. Comput. Sci. Eng. 2007, 9, 90–95. [Google Scholar] [CrossRef]
  42. Waskom, M.L. Seaborn: Statistical data visualization. J. Open Source Softw. 2021, 6, 3021. [Google Scholar] [CrossRef]
  43. Jordahl, K.; Van den Bossche, J.; Wasserman, J.; McBride, J.; Fleischmann, M.; Gerard, J.; Tratner, J.; Perry, M.; Farmer, C.; Hjelle, G.A.; et al. Geopandas/Geopandas: V0. 7.0; Zenodo: Meyrin, Switzerland, 2021. [Google Scholar]
  44. Batjes, N.H.; Calisto, L.; de Sousa, L.M. Providing quality-assessed and standardised soil data to support global mapping and modelling (WoSIS snapshot 2023). Earth Syst. Sci. Data 2024, 16, 4735–4765. [Google Scholar] [CrossRef]
  45. Palarea-Albaladejo, J.; Martín-Fernández, J.A. zCompositions—R package for multivariate imputation of left-censored data under a compositional approach. Chemom. Intell. Lab. Syst. 2015, 143, 85–96. [Google Scholar] [CrossRef]
  46. Templ, M.; Hron, K.; Filzmoser, P. robCompositions: An R-package for robust statistical analysis of compositional data. In Compositional Data Analysis: Theory and Applications; John Wiley & Sons: Hoboken, NJ, USA, 2011; pp. 341–355. [Google Scholar]
  47. Aitchison, J. The Statistical Analysis of Compositional Data. J. R. Stat. Soc. Ser. B Stat. Methodol. 1982, 44, 139–160. [Google Scholar] [CrossRef]
  48. Egozcue, J.J.; Pawlowsky-Glahn, V.; Mateu-Figueras, G.; Barcelo-Vidal, C. Isometric logratio transformations for compositional data analysis. Math. Geol. 2003, 35, 279–300. [Google Scholar] [CrossRef]
  49. Jolliffe, I.T.; Cadima, J. Principal component analysis: A review and recent developments. Philos. Trans. R. Soc. A Math. Phys. Eng. Sci. 2016, 374, 20150202. [Google Scholar] [CrossRef]
  50. Kaufman, L.; Rousseeuw, P.J. Finding Groups in Data: An Introduction to Cluster Analysis; John Wiley & Sons: Hoboken, NJ, USA, 2009. [Google Scholar]
  51. Cartone, A.; Postiglione, P. Principal component analysis for geographical data: The role of spatial effects in the definition of composite indicators. Spat. Econ. Anal. 2021, 16, 126–147. [Google Scholar] [CrossRef]
  52. Candès, E.J.; Li, X.; Ma, Y.; Wright, J. Robust principal component analysis? J. ACM 2011, 58, 1–37. [Google Scholar] [CrossRef]
  53. Sugar, C.A.; James, G.M. Finding the number of clusters in a dataset: An information-theoretic approach. J. Am. Stat. Assoc. 2003, 98, 750–763. [Google Scholar] [CrossRef]
  54. Kodinariya, T.M.; Makwana, P.R. Review on determining number of Cluster in K-Means Clustering. Int. J. 2013, 1, 90–95. [Google Scholar]
  55. Von Luxburg, U. A tutorial on spectral clustering. Stat. Comput. 2007, 17, 395–416. [Google Scholar] [CrossRef]
  56. Shi, J.; Malik, J. Normalized cuts and image segmentation. IEEE Trans. Pattern Anal. Mach. Intell. 2000, 22, 888–905. [Google Scholar] [CrossRef]
  57. Maier, M.; Luxburg, U.; Hein, M. Influence of graph construction on graph-based clustering measures. In Proceedings of the Advances in Neural Information Processing Systems 21 (NIPS 2008), Red Hook, NY, USA, 8–10 December 2008; Volume 21. [Google Scholar]
  58. Sreenivasulu, A. Evaluation of Cluster based Anomaly Detection. Master’s Thesis, University of Skövde, Skövde, Sweden, 2019. [Google Scholar]
  59. Hajihosseinlou, M.; Maghsoudi, A.; Ghezelbash, R. Intelligent mapping of geochemical anomalies: Adaptation of DBSCAN and mean-shift clustering approaches. J. Geochem. Explor. 2024, 258, 107393. [Google Scholar] [CrossRef]
  60. Varrica, D.; Medico, F.L.; Zuccolini, M.V.; Miola, M.; Alaimo, M.G. Geochemical baseline values determination and spatial distribution of trace elements in topsoils: An application in Sicily region (Italy). Sci. Total Environ. 2024, 955, 176951. [Google Scholar] [CrossRef] [PubMed]
  61. Demetriades, A.; Birke, M.; Albanese, S.; Schoeters, I.; De Vivo, B. Continental, regional and local scale geochemical mapping. J. Geochem. Explor. 2015, 154, 1–5. [Google Scholar] [CrossRef]
  62. Fernandez-Turiel, J.; Garcia-Valles, M.; Gimeno-Torrente, D.; Saavedra-Alonso, J.; Martinez-Manent, S. The hot spring and geyser sinters of El Tatio, Northern Chile. Sediment. Geol. 2005, 180, 125–147. [Google Scholar] [CrossRef]
  63. Kojima, S.; Trista-Aguilera, D.; Hayashi, K.i. Genetic Aspects of the Manto-type Copper Deposits Based on Geochemical Studies of North Chilean Deposits. Resour. Geol. 2009, 59, 87–98. [Google Scholar] [CrossRef]
  64. Sillitoe, R.H. Porphyry copper systems. Econ. Geol. 2010, 105, 3–41. [Google Scholar] [CrossRef]
Figure 1. Geologic map of the Antofagasta study region (northern Chile) with sample locations and major structural units (Source: [21]). Further explanations on the contents of the map can be found in the original source.
Minerals 15 01185 g001
Figure 2. Study area and soil-sample locations in the Antofagasta Region (Source: Own elaboration).
Minerals 15 01185 g002
Figure 3. Analytical workflow applied in the study (Source: Own elaboration).
Minerals 15 01185 g003
Figure 4. Frequency distributions of the five elements with the highest mean concentrations in each laboratory-technique subset (Source: Own elaboration).
Minerals 15 01185 g004
Figure 5. Consensus metrics for hierarchical clustering applied to principal component analysis transformed datasets without spatial variables. Optimal numbers of clusters are highlighted for each laboratory subset (Source: Own elaboration).
Minerals 15 01185 g005
Figure 6. Consensus metrics for hierarchical clustering applied to principal component analysis (low rank) transformed datasets without spatial variables. Optimal numbers of clusters are highlighted for each laboratory subset (Source: Own elaboration).
Minerals 15 01185 g006
Figure 7. Consensus metrics for spectral clustering applied to principal component analysis transformed datasets without spatial variables. Optimal numbers of clusters are highlighted for each laboratory subset (Source: Own elaboration).
Minerals 15 01185 g007
Figure 8. Consensus metrics for spectral clustering applied to principal component analysis (low rank) transformed datasets without spatial variables. Optimal numbers of clusters are highlighted for each laboratory subset (Source: Own elaboration).
Minerals 15 01185 g008
Figure 9. Consensus metrics for spectral clustering applied to principal component analysis transformed datasets with spatial variables. Optimal numbers of clusters are highlighted for each laboratory subset (Source: Own elaboration).
Minerals 15 01185 g009
Figure 10. Consensus metrics for hierarchical clustering applied to principal component analysis (low rank) transformed datasets with spatial variables. Optimal numbers of clusters are highlighted for each laboratory subset (Source: Own elaboration).
Minerals 15 01185 g010
Figure 11. Consensus metrics for spectral clustering applied to principal component analysis (low-rank) transformed datasets with spatial variables. Optimal numbers of clusters are highlighted for each laboratory subset (Source: Own elaboration).
Minerals 15 01185 g011
Figure 12. Consensus metrics for spectral clustering applied to principal component analysis (low rank) transformed datasets with spatial variables. Optimal numbers of clusters are highlighted for each laboratory subset (Source: Own elaboration).
Minerals 15 01185 g012
Figure 13. Comparison of hierarchical clustering on principal component analysis (low rank) embeddings for the WSP-EMGRISA ICP-MS subset: (a) NG (chemistry only) yields 14 clusters without strong spatial coherence; (b) YG (chemistry + geography) simplifies to 2 clusters aligned with geographic gradients (Source: Own elaboration).
Minerals 15 01185 g013
Figure 14. Geographic distribution of moderate to extreme geochemical anomalies in non-geographic (left) and geographic (right) datasets, classified using multiple clustering techniques (Source: Own elaboration).
Minerals 15 01185 g014
Figure 15. Map of soil-sample locations where both the chemistry-only workflow and the chemistry-plus-geography workflow agree on an anomalous geochemical signature. Symbols are coloured according to the cluster label assigned by the consensus of hierarchical and spectral methods (Source: Own elaboration).
Minerals 15 01185 g015
Table 1. Elements excluded (>50% blank entries) because they were not analyzed in the corresponding laboratory-technique subset (Source: Own elaboration).
Subset (Lab + Technique)Samples (n)Elements BeforeRemoved elements (>50% Missing)Retained
Unknown – SERNAGEOMIN5643211: Al, Ca, Cr, Fe, Li, Mg, Mn, P, K, Na, Ti21
ICP-MS – WSP-EMGRISA3033232
ICP-OES – CENMA1983213: Sb, Bi, Ca, Li, Mg, P, K, Na, Sr, Tl, Sn, Ti, U19
ICP-MS – SERNAGEOMIN1973211: Al, Ca, Cr, Fe, Li, Mg, Mn, P, K, Na, Ti21
ICP-AES – CICITEM142324: Cu, Li, Se, Sn28
Table 2. Number of principal components required to explain at least 95% of the total variance for each analytical workflow (conventional principal component analysis and its log-ratio variant), with and without the spatial variables. The percentage reduction refers to the relative decrease in dimensionality achieved after robust pre-processing (Source: Own elaboration).
PipelineInitial DataAnalysisLaboratory# Original# RetainedReduction Rate (%)Explained Variance (%)
NoGeoNormalizedUnknownSERNAGEOMIN211528.6%95.5%
NoGeoNormalizedICP-MSWSP-EMGRISA321843.8%95.5%
NoGeoNormalizedICP-OESCENMA191236.8%95.4%
NoGeoNormalizedICP-MSSERNAGEOMIN211433.3%95.0%
NoGeoNormalizedICP-AESCICITEM281450.0%95.4%
NoGeoLow-RankUnknownSERNAGEOMIN15473.3%96.7%
NoGeoLow-RankICP-MSWSP-EMGRISA18666.7%96.9%
NoGeoLow-RankICP-OESCENMA12466.7%96.2%
NoGeoLow-RankICP-MSSERNAGEOMIN14657.1%97.7%
NoGeoLow-RankICP-AESCICITEM14471.4%95.4%
GeoNormalizedUnknownSERNAGEOMIN231630.4%95.5%
GeoNormalizedICP-MSWSP-EMGRISA341944.1%95.6%
GeoNormalizedICP-OESCENMA211338.1%95.5%
GeoNormalizedICP-MSSERNAGEOMIN231534.8%95.0%
GeoNormalizedICP-AESCICITEM301550.0%95.4%
GeoLow-RankUnknownSERNAGEOMIN16475.0%96.5%
GeoLow-RankICP-MSWSP-EMGRISA19668.4%97.2%
GeoLow-RankICP-OESCENMA13376.9%95.3%
GeoLow-RankICP-MSSERNAGEOMIN15660.0%97.1%
GeoLow-RankICP-AESCICITEM15566.7%97.3%
Table 3. Robust principal component analysis outputs for each laboratory-technique subset, evaluated with and without spatial coordinates. Displayed metrics are: effective numerical rank of the low-rank component, proportion of non-zero entries in the sparse component, nuclear norm, L-one norm, reconstruction error (%), and number of augmented-Lagrangian iterations until convergence (Source: Own elaboration).
WorkflowAnalysisLaboratoryMatrix ShapeEffective RankSparsity (%)Nuclear NormL1 NormReconstruction Error (%)IterationsConverged
NoGeoUnknownSERNAGEOMIN564 × 15911.0%46.405316.35Below Tol147Yes
NoGeoICP-MSWSP-EMGRISA303 × 181011.7%45.833970.33Below Tol164Yes
NoGeoICP-OESCENMA198 × 12713.0%26.461603.50Below Tol180Yes
NoGeoICP-MSSERNAGEOMIN197 × 14912.3%25.041931.66Below Tol163Yes
NoGeoICP-AESCICITEM142 × 14812.5%20.861329.74Below Tol169Yes
GeoUnknownSERNAGEOMIN564 × 161110.4%57.985678.44Below Tol184Yes
GeoICP-MSWSP-EMGRISA303 × 191210.8%44.544225.01Below Tol193Yes
GeoICP-OESCENMA198 × 13813.2%28.151736.91Below Tol195Yes
GeoICP-MSSERNAGEOMIN197 × 151011.6%27.252102.32Below Tol139Yes
GeoICP-AESCICITEM142 × 15915.7%30.701321.85Below Tol183Yes
Table 4. Summary of cluster counts and anomalies detected across subsets for analytical workflows without (NG) and with (YG) spatial variables. HC = Hierarchical Clustering, SC = Spectral Clustering. (Source: Own elaboration).
SubsetMethodClusters (NG)Anomalies (NG)Clusters (YG)Anomalies (YG)
ICP-AES CICITEMHC-PCA1310311
HC-PCA-LR11624
SC-PCA312311
SC-PCA-LR11125
ICP-MS SERNAGEOMINHC-PCA13141313
HC-PCA-LR210211
SC-PCA810710
SC-PCA-LR210310
ICP-MS WSP-EMGRISAHC-PCA318213
HC-PCA-LR1319217
SC-PCA414213
SC-PCA-LR1317218
ICP-OES CENMAHC-PCA1413512
HC-PCA-LR412213
SC-PCA58410
SC-PCA-LR215211
Unknown SERNAGEOMINHC-PCA229430
HC-PCA-LR229430
SC-PCA429429
SC-PCA-LR229429
Table 5. Summary of geochemical anomalies. The table shows the number of samples per commune, analytical technique, and laboratory, together with their corresponding geological unit, rock type, and Stratigraphic framework. This format emphasizes the most robust anomalies in the dataset, i.e., those simultaneously detected by the chemistry-only and chemistry-plus-geography approaches.
ComuneAnalysisLaboratoryCodeRock TypeMin. PeriodMax. PeriodSamplesNG OnlyYG OnlyBoth
AntofagastaICP-MSWSP-EMGRISAJ γ PlutonicJurassicJurassic6213
AntofagastaICP-MSWSP-EMGRISANQs1SedimentaryQuaternaryNeogene2011
CalamaICP-MSWSP-EMGRISAJKs1SedimentaryCretaceousJurassic1001
CalamaICP-MSWSP-EMGRISANs1SedimentaryNeogeneNeogene2101
Sierra GordaICP-MSWSP-EMGRISAE γ PlutonicPaleogenePaleogene2011
Sierra GordaICP-MSWSP-EMGRISANs1SedimentaryNeogeneNeogene3102
Sierra GordaICP-OESCENMAE γ PlutonicPaleogenePaleogene4121
TaltalICP-AESCICITEMJ ω VolcanicJurassicJurassic7241
TaltalICP-AESCICITEMNs1SedimentaryNeogeneNeogene1001
TaltalICP-MSSERNAGEOMINJ γ PlutonicJurassicJurassic1001
TaltalICP-OESCENMAJ ω VolcanicJurassicJurassic10532
TaltalNot specifiedSERNAGEOMINCP γ PlutonicPermianCarboniferous3003
TaltalNot specifiedSERNAGEOMINDCm1MetamorphicCarboniferousDevonian2011
TaltalNot specifiedSERNAGEOMINE θ VolcanicPaleogenePaleogene211056
TaltalNot specifiedSERNAGEOMINJKs1SedimentaryCretaceousJurassic3012
TaltalNot specifiedSERNAGEOMINJ γ PlutonicJurassicJurassic4103
TaltalNot specifiedSERNAGEOMINJ ρ VolcanicJurassicJurassic3012
TocopillaICP-MSWSP-EMGRISAJ ω VolcanicJurassicJurassic1001
Table 6. Average baseline concentrations (mg · kg−1) for each element at the global level under four configurations (mean of Median + 2 · MAD , Q 3 + 1.5 · IQR , and P 95 ).
ElementsNG (with Outliers)NG (Without Outliers)YG (with Outliers)YG (Without Outliers)
Ag1.061.061.061.06
As75.47966.94675.47969.45
B168.185165.375168.185164.327
Ba988.2985.762988.2983.565
Be3.153.153.153.15
Cd1.7171.7081.7171.683
Co26.96126.75626.96126.79
Hg1.7111.5481.7111.265
Mo7.0716.6987.0716.517
Ni32.84632.59732.84631.873
Pb56.55553.59656.55555.6
V307.716307.046307.716306.267
Zn167.875167.625167.875166.83
Samples1404132814041321
Table 7. Average baseline concentrations in non-geographic (mg · kg−1) by technique+laboratory subset, with and without anomaly removal (mean of Median + 2 · MAD , Q 3 + 1.5 · IQR , and P 95 ).
ElementICP-MS +
CICITEM
(All)
ICP-MS +
CICITEM
(No Anomalies)
ICP-MS +
SERNAGEOMIN
(All)
ICP-MS +
SERNAGEOMIN
(No Anomalies)
ICP-MS +
WSP-EMGRISA
(All)
ICP-MS +
WSP-EMGRISA
(No Anomalies)
ICP-OES +
CENMA
(All)
ICP-OES +
CENMA
(No Anomalies)
N/A +
SERNAGEOMIN
(All)
N/A +
SERNAGEOMIN
(No Anomalies)
As34.3334.1840.7540.8669.8969.53611.5589.6953.4550.93
Ba184.83191.25647.83645.88121.95120.54558.7506.63815.13801.33
Be0.570.572.832.83221.651.652.833.83
B4545138.83138.38130.87111.84384.69380.18111.62109.79
Cd0.610.610.480.481.21.294.264.150.730.7
Co27.8327.8325.725.6418.5718.934.3733.4523.8823.59
Pb109.79110.3630.5931.5920.0419.87370.99334.4143.1638.22
Hg0.530.530.050.063.033.035.494.840.080.08
Mo6.336.383.563.593.023.0157.0344.585.074.77
Ni23.3223.6331.2931.920.7320.9592.4294.8925.0724.15
Ag1.171.090.10.10.60.62.682.660.170.13
V145.37145.35344.33341.8153.73159.5194.8192.26307.63307.13
Zn358.87375.8153.03153.28125.39128.63258.79247.3125.95121.5
Samples142138197188303287198189564526
Table 8. Average baseline concentrations in geographic analytical workflow (mg · kg−1) by technique+laboratory subset, with and without anomaly removal (mean of Median + 2 · MAD , Q 3 + 1.5 · IQR , and P 95 ).
ElementICP-MS +
CICITEM
(All)
ICP-MS +
CICITEM
(No Anomalies)
ICP-MS +
SERNAGEOMIN
(All)
ICP-MS +
SERNAGEOMIN
(No Anomalies)
ICP-MS +
WSP-EMGRISA
(All)
ICP-MS +
WSP-EMGRISA
(No Anomalies)
ICP-OES +
CENMA
(All)
ICP-OES +
CENMA
(No Anomalies)
N/A +
SERNAGEOMIN
(All)
N/A +
SERNAGEOMIN
(No Anomalies)
As34.33334.33340.75340.84369.89270.258611.496645.57253.45151.643
Ba184.833193.333647.833647.367121.95121.858558.697543.326815.133813.233
Be0.5650.5672.8332.833221.651.652.8332.833
B4545138.833139.6130.867132.487384.689391.389111.617110
Cd0.6080.6080.4830.4831.21.24.2563.9980.7330.71
Co27.83327.83325.70325.77718.5718.94734.36836.15423.88323.692
Pb109.792114.57530.58731.42720.03819.99370.994362.44943.15639.923
Hg0.5330.5330.0480.0483.0333.0335.4865.1910.0780.078
Mo6.3336.4833.5573.543.0173.01557.03447.3275.0734.767
Ni23.31723.63331.2931.7220.73321.07792.42390.82725.07324.185
Ag1.1671.0930.10.10.60.62.6812.7010.1670.167
V145.367143.533344.333342.7153.733160.438194.803193.831307.625307.267
Zn358.867375.8153.033154.933125.392130.212258.79196.582125.95121.783
Samples142132197189303282198183564535
Disclaimer/Publisher’s Note: The statements, opinions and data contained in all publications are solely those of the individual author(s) and contributor(s) and not of MDPI and/or the editor(s). MDPI and/or the editor(s) disclaim responsibility for any injury to people or property resulting from any ideas, methods, instructions or products referred to in the content.