1. Introduction
The semi-Autogenous Grinding (SAG) mill is widely used in metallurgy, mining, and other industries because of its advantages of short process, simple equipment, lower investment, and high degree of automation. The SAG mill utilizes shell liners which consist of flat liners and lifter bars to lift the ore and grinding balls to a certain height, then they are dropped and impact each other, so the ore becomes crushed. During the process, grinding is achieved by the shearing and edging action among the grinding balls, ore, and shell liner [
1]. Here, the shell liner provides support, endures wear and tear, and resists shock, so the rational design of this system determined the grinding efficiency and economic efficiency of the SAG mill [
2,
3].
Numerical calculation methods proved effective means, in particular, the Discrete Element Method (DEM) has become an important tool for studying the service performance of mills and is used to find the optimal solution to balance the wear life of liners and grinding efficiency [
4,
5]. For the SAG mill, there are many factors that should be studied. For example, mill operating parameters [
6], typically an appropriate mill filling rate [
7] can not only ensure high grinding efficiency and low energy consumption, but also reduce liner wear [
8]. The drum’s rotational speed affects the distribution of impact energy and increases the impact energy of the grinding balls. The higher the rotational speed is, the easier it is to crush the ore to be uniform-size particles, but if it is more severe, the liner will wear and tear [
9]. Origin ore properties [
10] such as size and shape are also key factors. If the particle size is larger, the liner wears more and more severely [
11,
12]. In addition, the service parameters [
9,
10] and structural dimensions [
13,
14] of shell liners are also main factors. As a key part of the SAG mill, the shape and dimensions of the cylinder liner play a vital role in improving the wear resistance, extending the service life and improving the service performance of the mill.
Previous studies have shown that liners in different structural forms can enhance the crushing effect of the grinding balls on the materials through adjusting the motion trajectory and loaded state of the grinding balls and mineral materials [
15]. These studies focus on the lifter bars and less on the flat liner. Increasing the height of the lifter bars will gradually increase the wear and tear of shell liner [
16], and in order to maintain a constant power consumption, a slower rotational speed is required [
17]. A lower lifter bar will reduce the ejection height and collision frequency, thereby decreasing the grinding efficiency. Moreover, at low rotational speeds, the mill power exhibits a positive correlation with the height of the lifter bars and conversely an inverse relationship at high rotational speeds [
18]. A suitable transition chamfer of the lifter bars’ cross-section can prevent premature liner wear failure and significantly improve the service performance of the mill [
19]. In addition, the number of lifter bars also affects the efficiency and steady-state power input of the mill [
20].
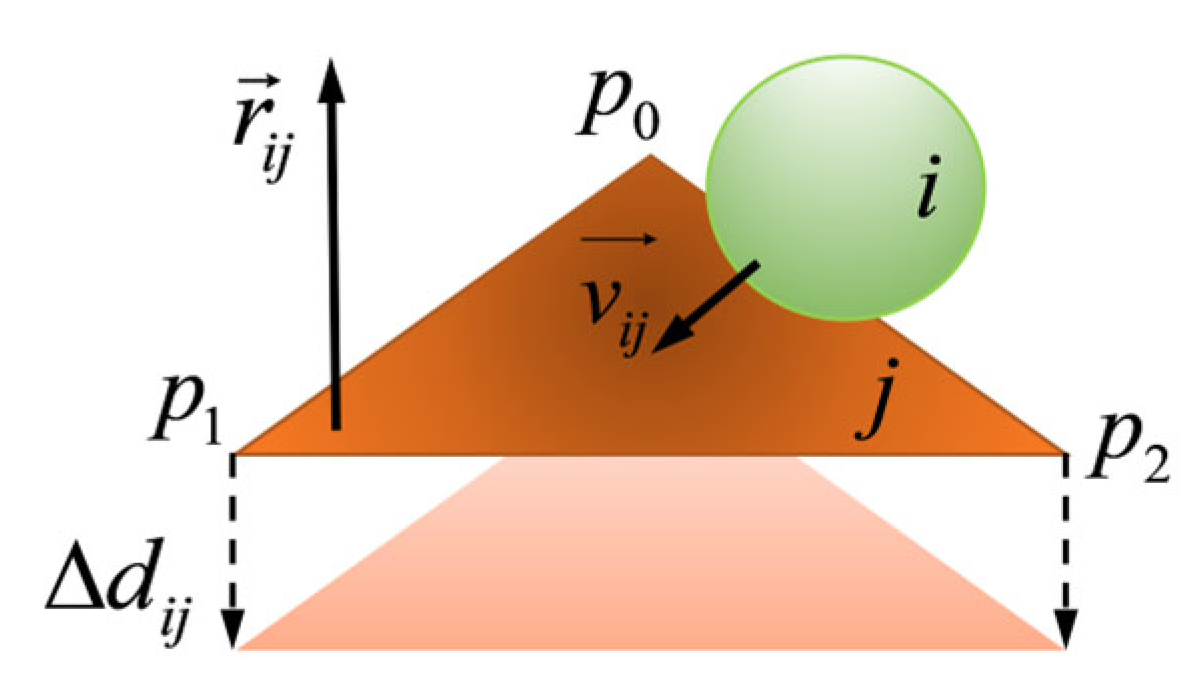
The Discrete Element Method (DEM) coupled with the Finite Element Method (FEM) can deliver a clear picture of bulk material behavior during different processes, and it can also be combined and used with FEM technology to further analyze the interaction between the structure and the bulk and illustrate the stress distribution and deformation characteristics of the liner. Here, how to realize the dynamic evolution of the wear profile of the lining plate is an important problem, which is to modify the model nodes’ coordination to simulate the wear process, thereby evaluating the strength and durability of the liner more accurately [
2,
21]. Another key problem is the selection of a suitable wear model. Based on different mechanisms of wear generation, there are four different wear models. Firstly, the Shear Impact Energy Model (SIEM) is an effective model for dealing with high-speed impact wear problems [
8,
16,
22,
23]. Secondly, the Filtering Impact Energy Erosion Model (FIEEM), eliminates the influence of low-collision energy particles by introducing a screening function [
24,
25] and focuses on the particle impact erosion on the loading behavior of the mill and the effect of liner wear. Thirdly, the Archard wear model [
6,
26] relates the wear rate to the contact pressure, sliding velocity, and material hardness, respectively, by means of a volumetric loss rate equation. This model mainly focuses on frictional losses at the contact surfaces. Finally, the Finnie wear model [
21,
27,
28] relates the wear rate to the kinetic energy ratio of particle impact surfaces through a function, distinguishing between friction wear and impact wear, and is suitable for wear simulations involving particle impact surfaces. The latter two models are the most widely used. Based on the Archard wear model, researchers have simulated the dynamic grinding evolution process of a high-pressure experimental mill by the DEM-FEM coupling approach [
29].
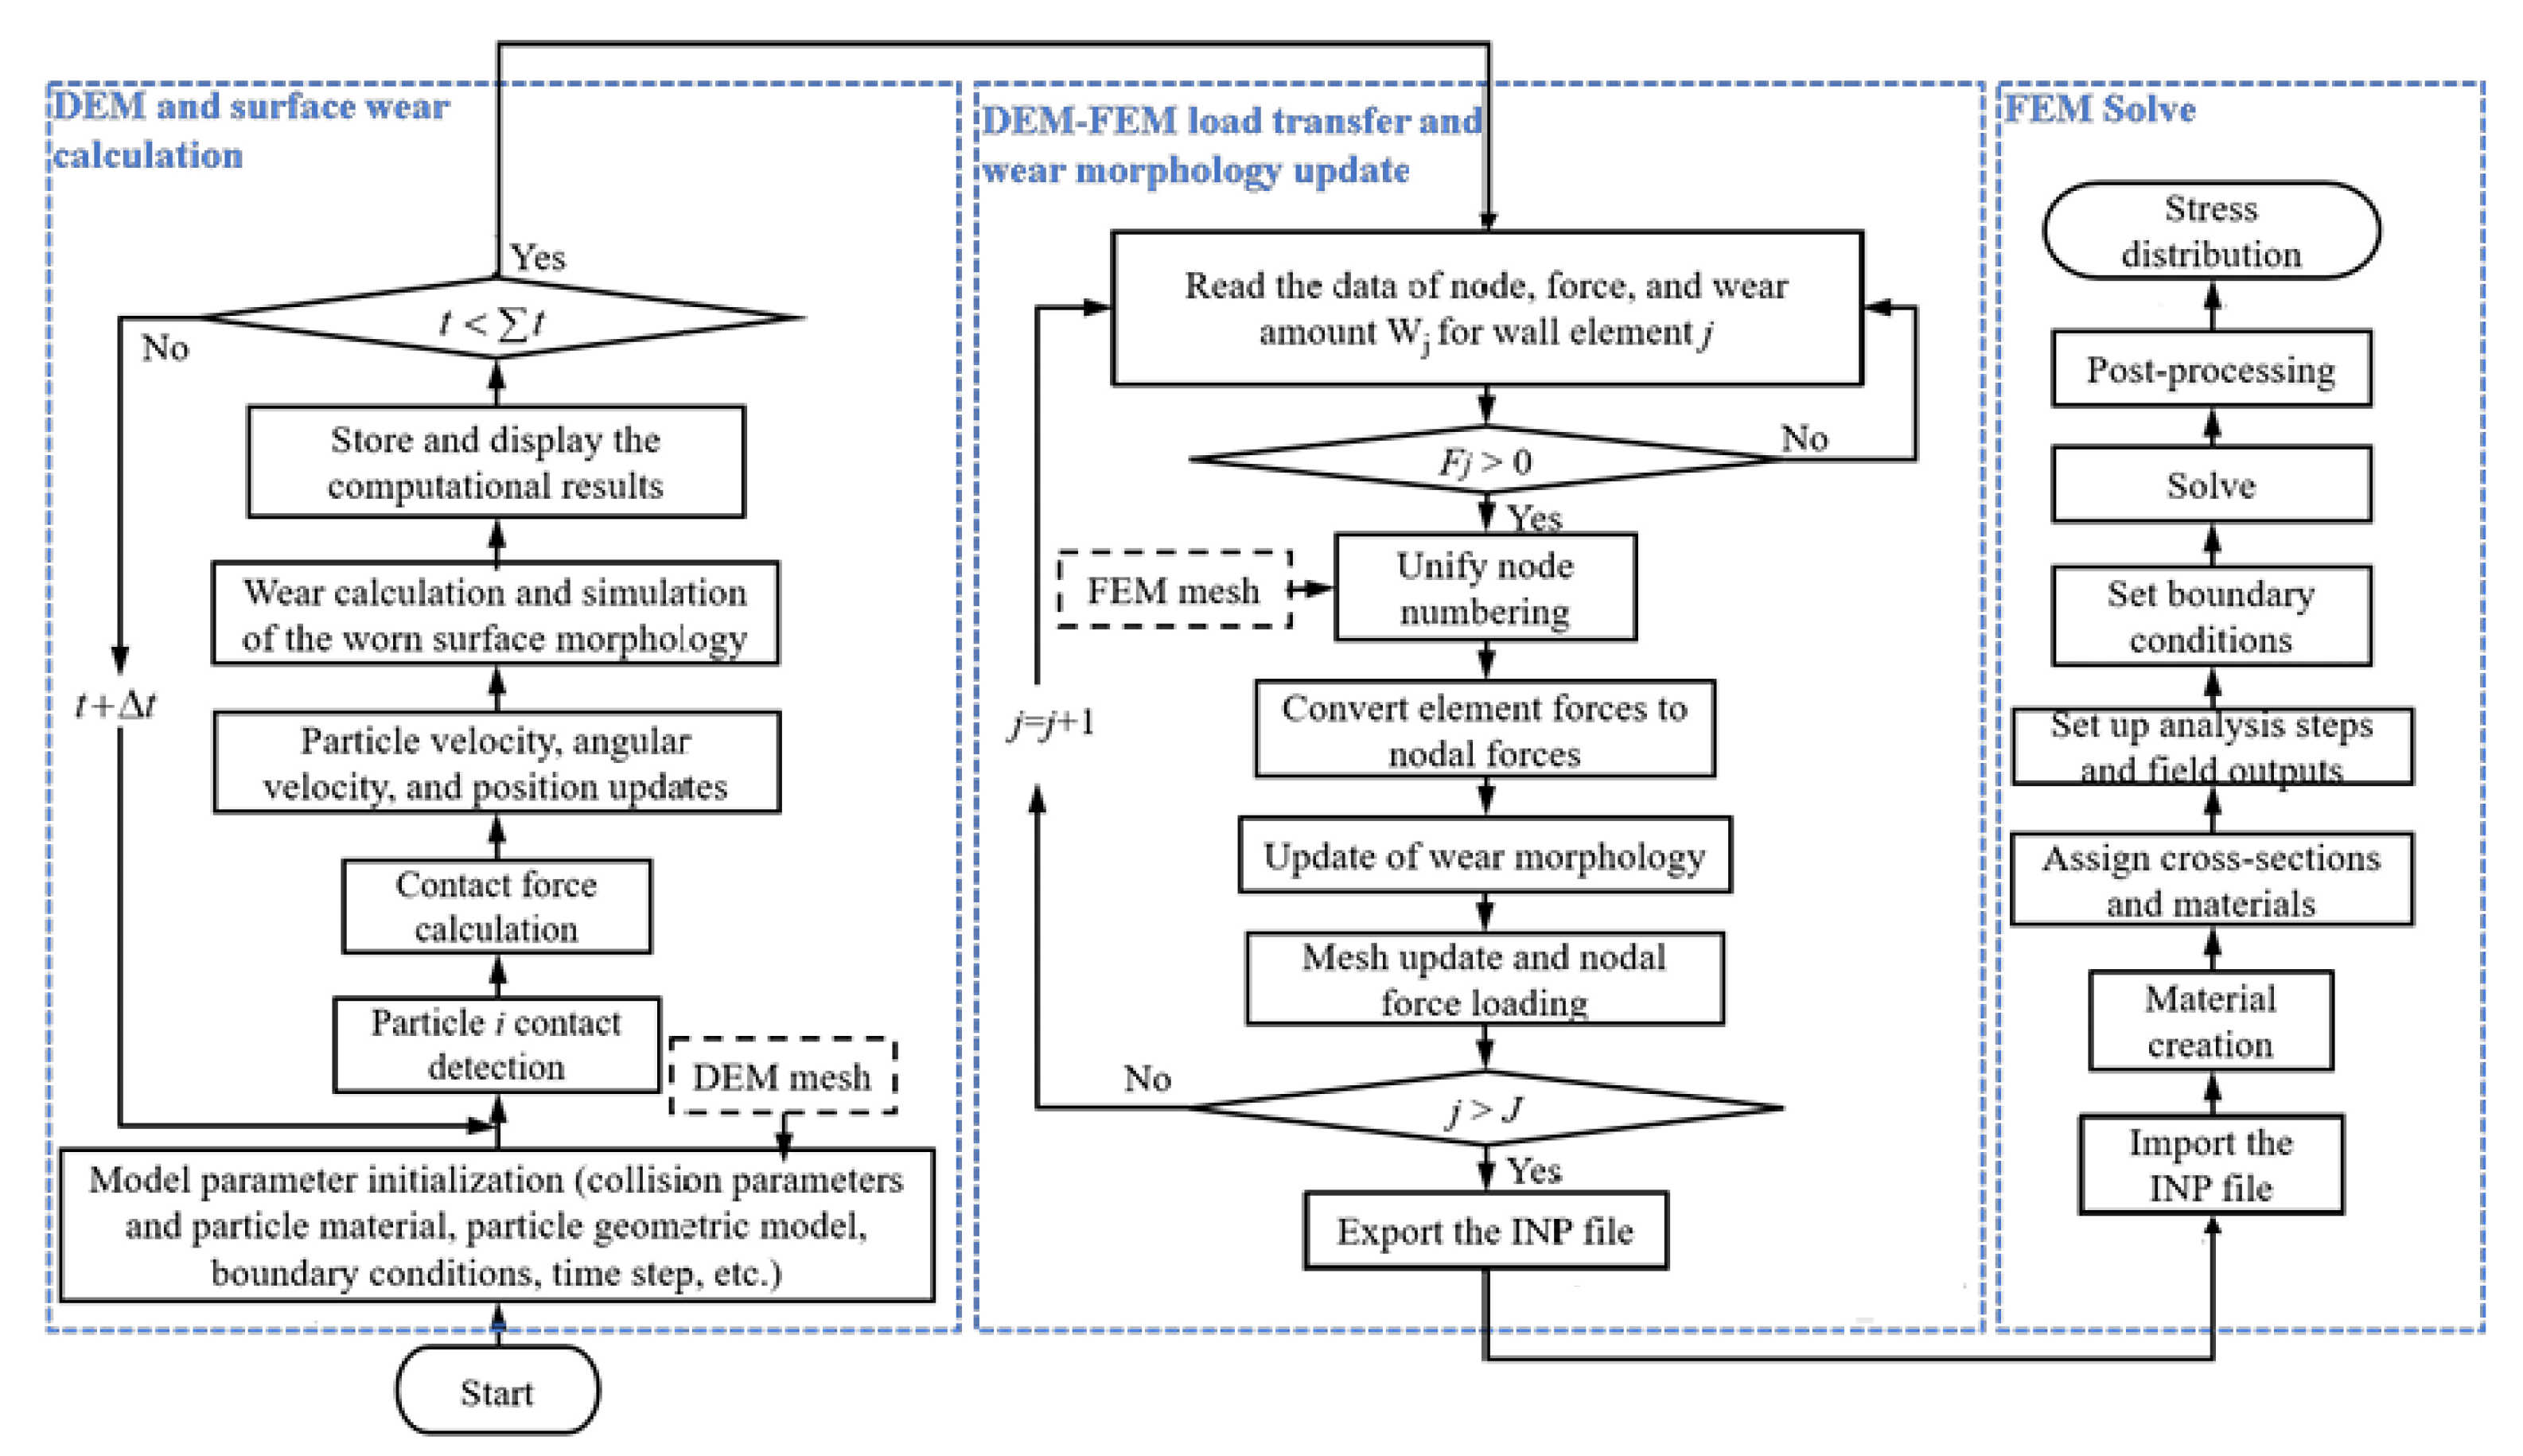
In this paper, the shell liner of a ϕ10.37 × 5.19 m SAG mill is investigated. A DEM-FEM coupling simulation program is constructed through Python code by use of the Finnie wear model, which considers the dynamic evolution of the liner wear process and realizes the grid model correction. Analysis on the service performance of the mill is conducted and the liner structural shapes are optimized, so as to support the technical design.
4. Numerical Coupling Simulation
4.1. Material Movement Characteristics
The grinding efficiency of the mill and the wear of the shell liners could be reflected by the movement of the material in the SAG cylinder [
15,
17], as shown in
Figure 9. In the velocity trace diagram, points A, B, C, and D are, respectively, the detachment point, falling back point, transition point, and discharge point of the material as the cylinder rotates, and Ω1∼Ω6 indicate the blank area, throwing area, crushing area, grinding area, discharge area, and inertia area in turn. Although the inertia area has no obvious zone boundary, there is always an area where the material movement speed tends to zero. In addition, there is a shoulder and a toe in the velocity trajectories. The distance from the apex of the shoulder region to the center of the mill is symbolized as
x1, named shoulder height. The distances from the vertices of the toe areas to the center of the mill are called toe height,
x2. Their sum,
x1 +
x2, reflects the crushing performance of the mill. The larger the sum is, the better the crushing performance of the mill will be.
In the crushing zone, the material changes direction at the transition point C under the action of the shell liner and gradually accelerates to be the same speed as the liner. Then, in the grinding zone Ω4, the materials are lifted by the liner. At the discharge point D some of them fall back to the crushing zone Ω5 due to gravity and the remaining material is thrown back to the crushing zone again from the detachment point A, thus a cycle is completed. In this process, ores are ground and crushed, and at the same time the liner is worn and torn.
Ores are mainly ground in the dropping zone, Ω
2, because there are direct collisions among ores, grinding balls, and shell liners during the dropping process and also the shearing effect of the liners. In
Figure 9b there are three typical grinding effects among the materials. Firstly, ores are ground at different speeds among the materials, which involves the materials in the discharge zone, the surface materials in the grinding zone, and the inner materials in the grinding zone. Secondly, the different movement directions of the inner materials cause ores to be ground. Thirdly, the various speeds between the bottom low-speed material and the inner higher-speed material cause grinding actions on the ores. In the grinding zone Ω
4 there are ring-shaped velocity traces, which means that the shearing effect is less in the elliptical orbit zone, so this zone is called the inertia zone Ω
6. In the inertia zone, minerals are hardly ground at all.
4.2. Wear Accumulated Simulation of the Cylinder Liner
Perazzo [
38] et al. obtained the same wear amount through experimental verification and simulation methods by increasing the wear rate and shortening the calculating time in the simulation. Experimental studies by Yudong Zou [
29] et al. and Nejad et al. [
39] show that the wear volume and depth linearly increase with time. So in the paper, it is assumed that the wear rate is constant over the whole service life, so the test data are linearly extrapolated based on the actual service life of the liner.
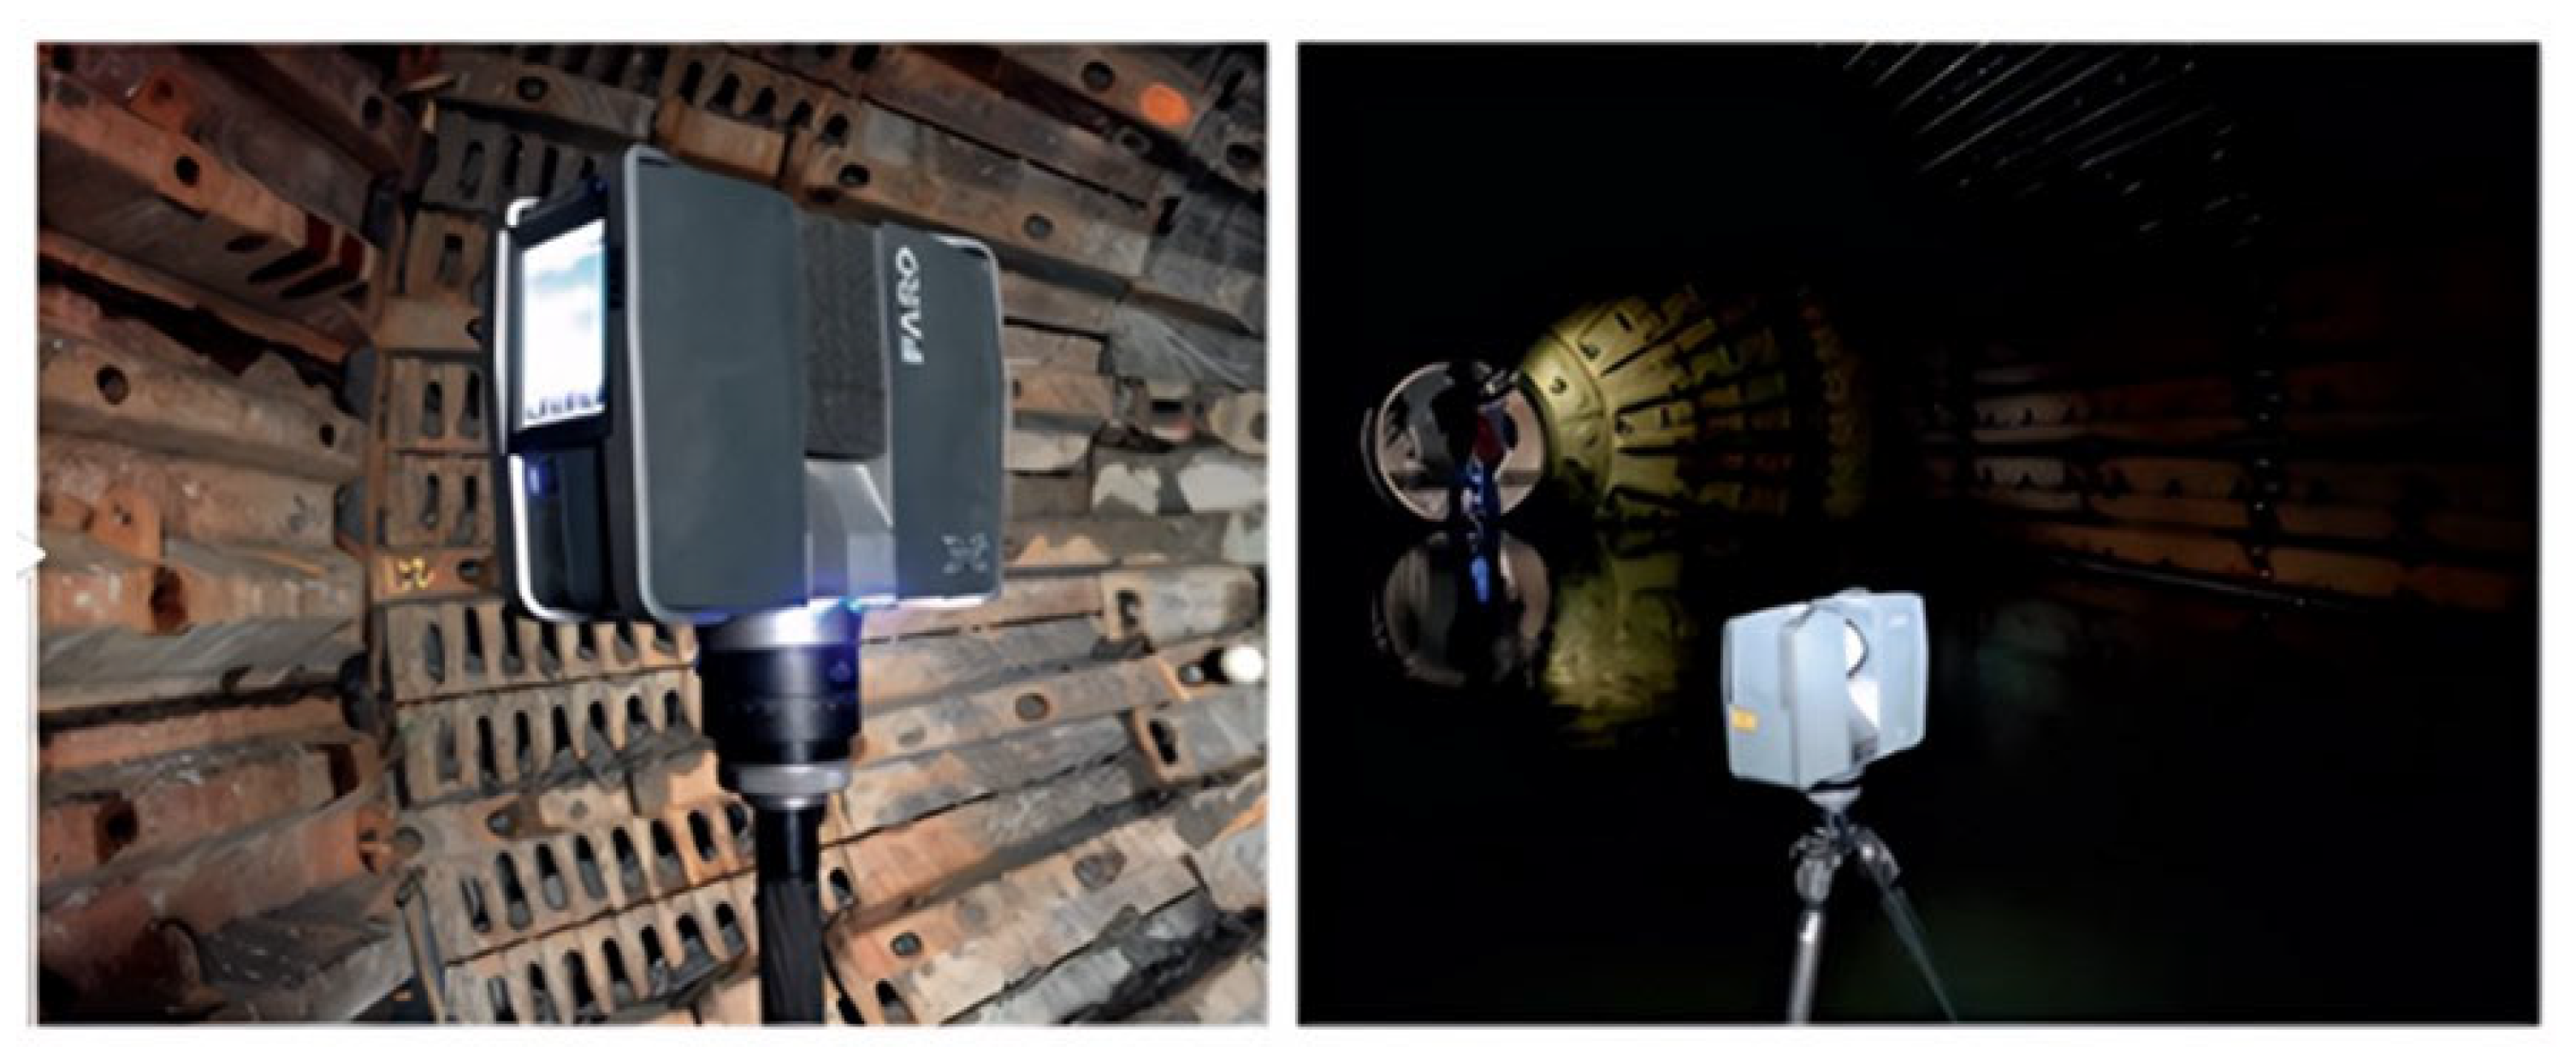
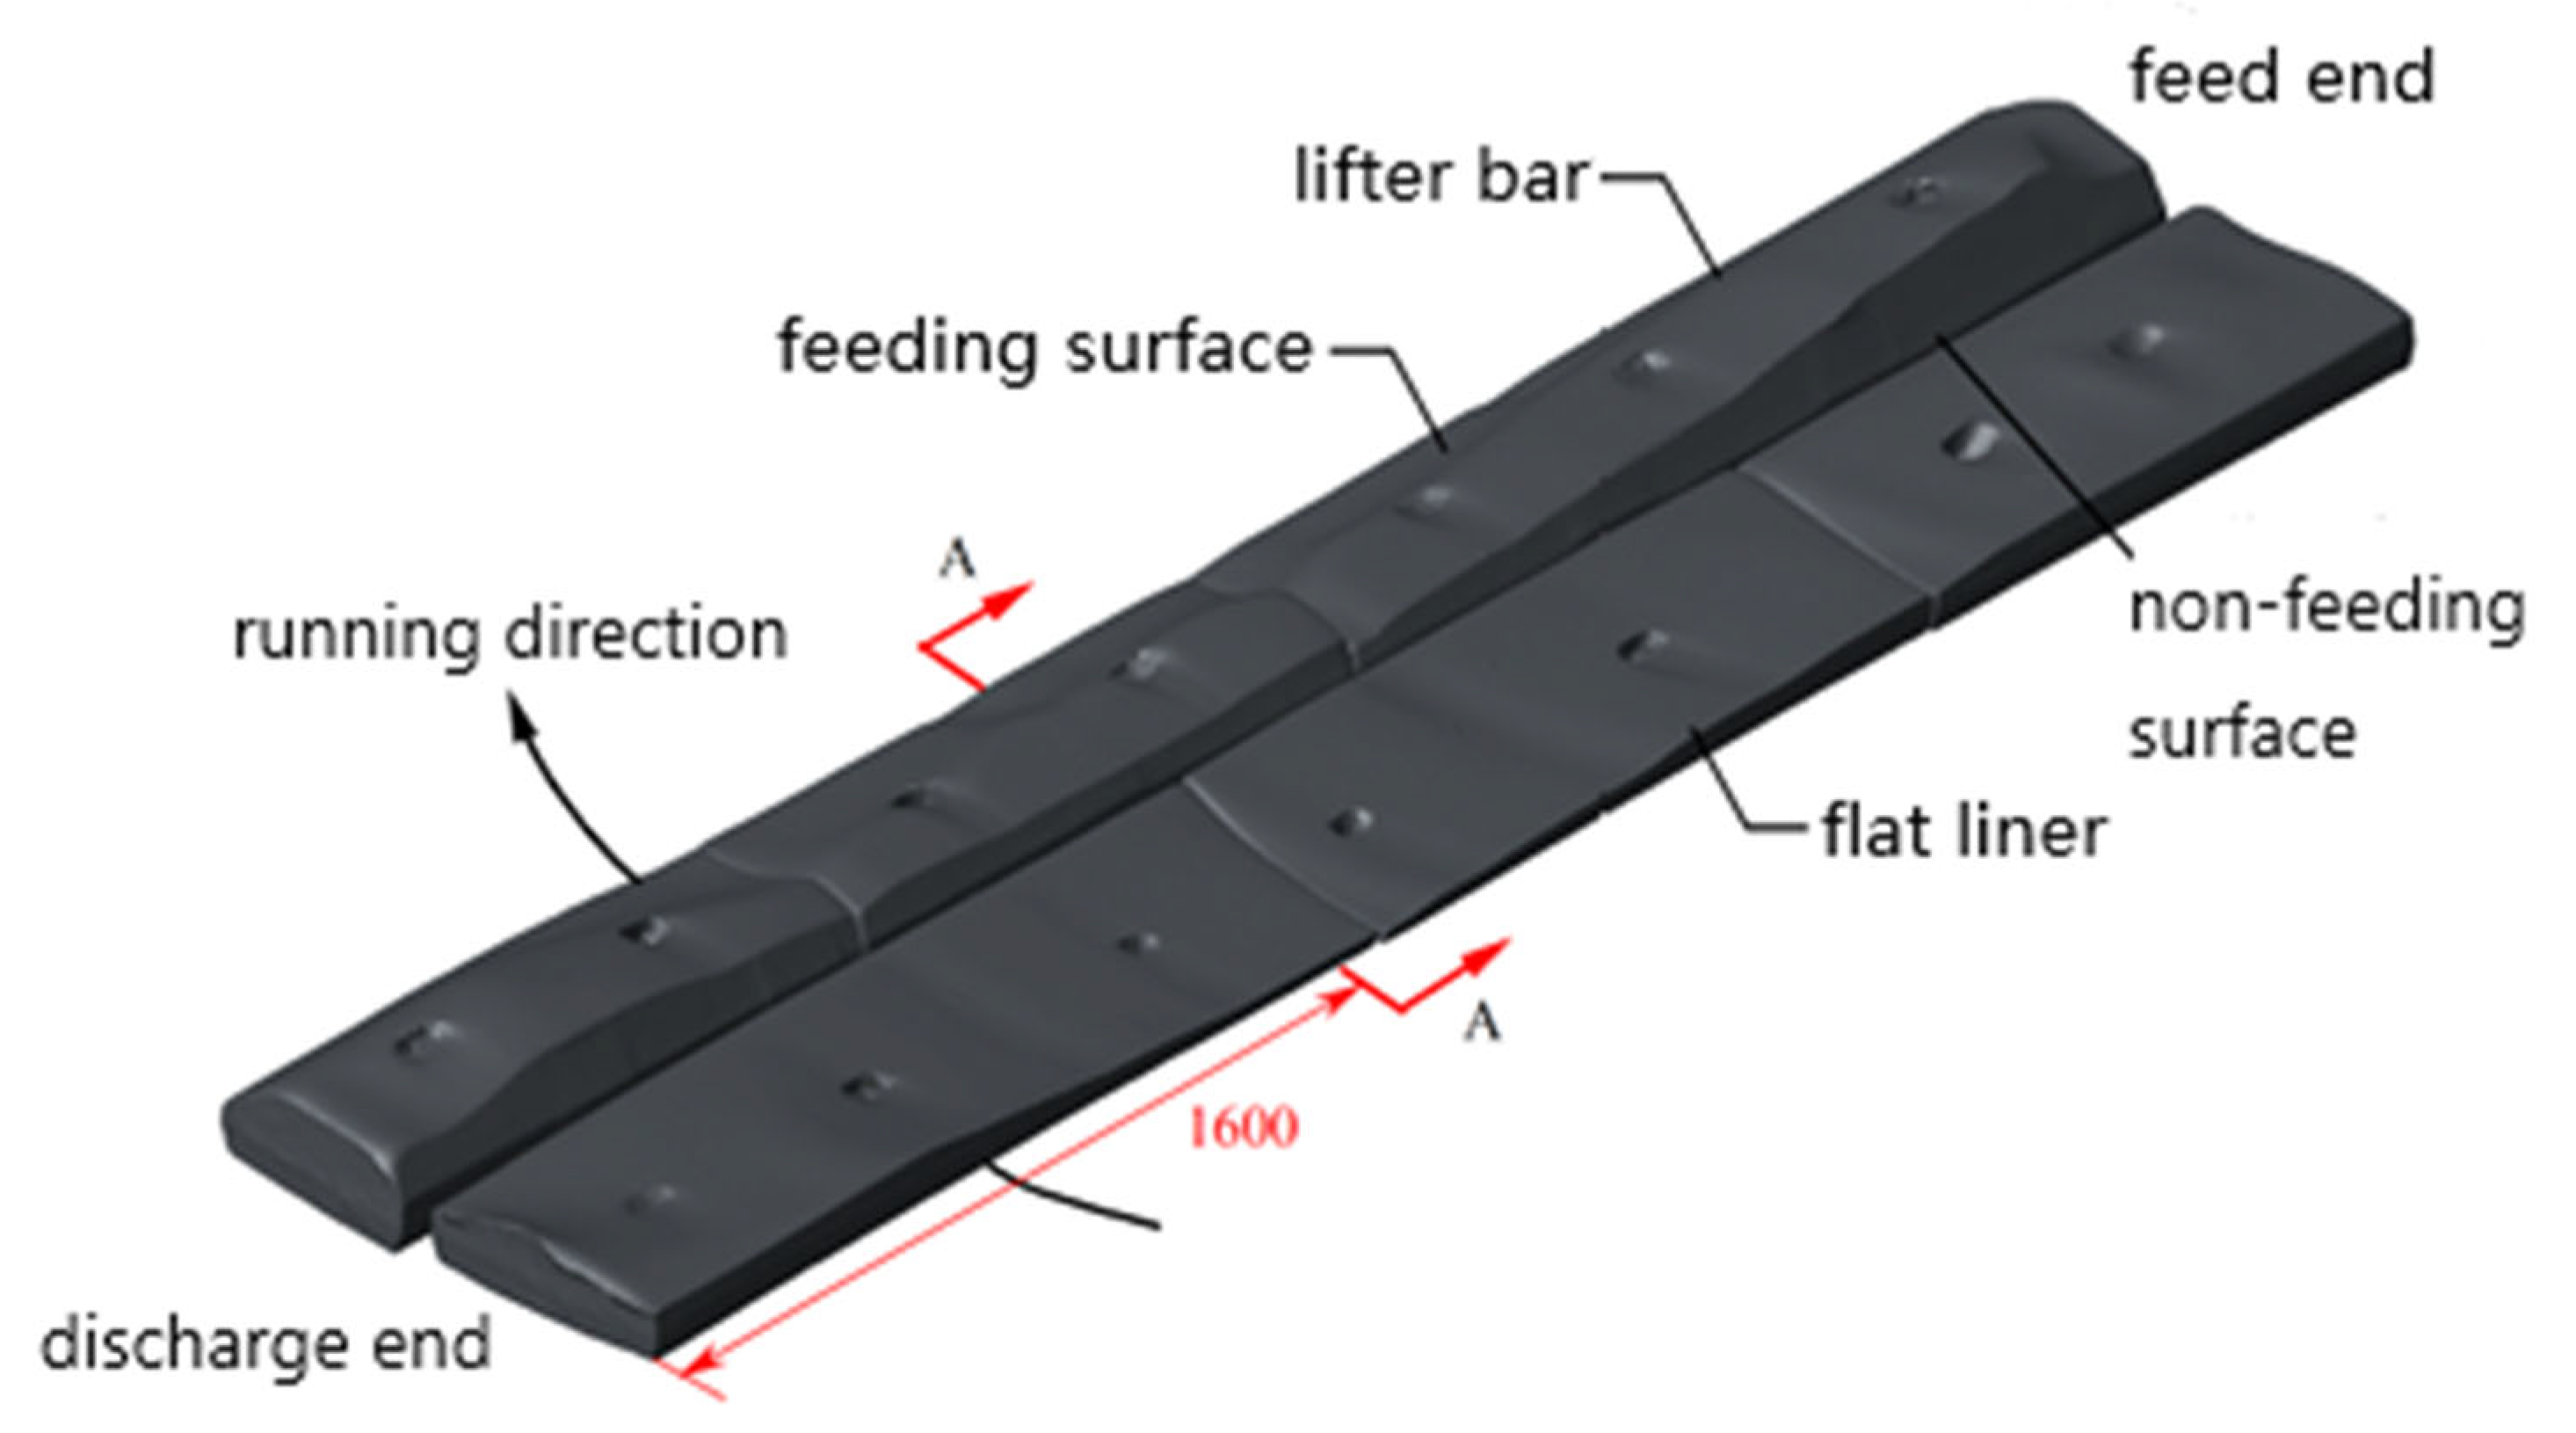
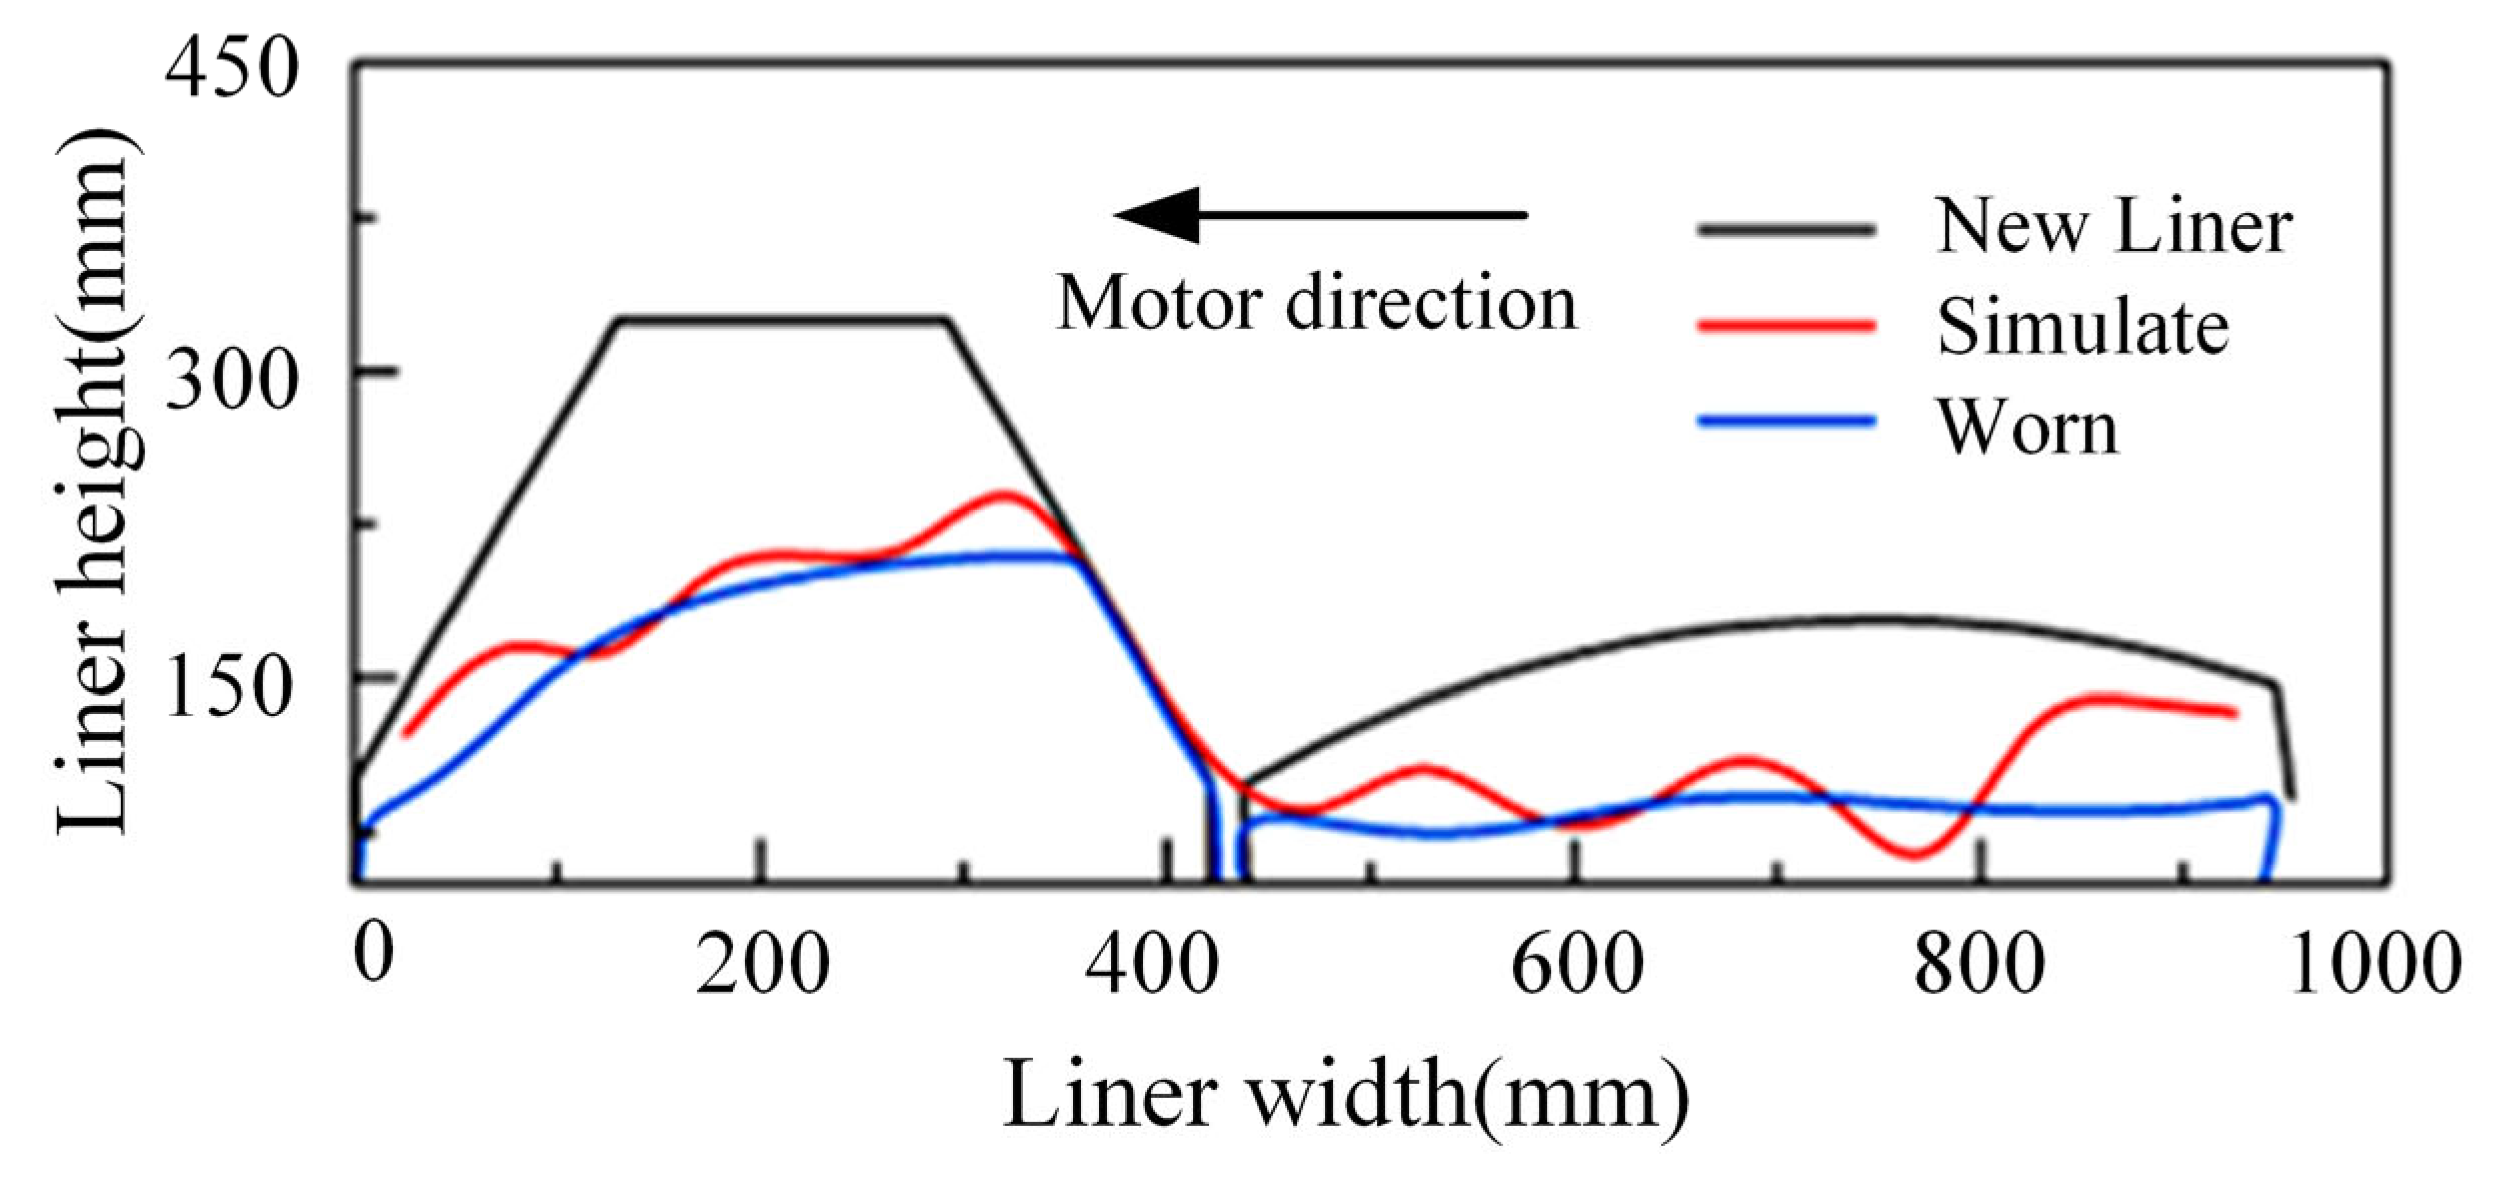
Figure 10 shows a comparison of the simulation data and the laser 3D scanning data for liner wear at section A-A in
Figure 6. It can be seen that the simulated final wear data are in satisfactory agreement with the experimental data. Only at the extreme right end of the flat liner are there relatively significant differences between the simulation and the experimental data. This may be caused by ignoring the influence of liquid under actual working conditions and the fluidity of liquid enforces the wear.
It is important to note that this study did not directly simulate the full 3192 h service life of the liner using the DEM. The DEM model of the φ10.37 × 5.19 m SAG mill contains over 100,000 discrete particles, and the time step for a single contact calculation must be on the order of 10−6 seconds. Directly simulating 3192 h of operation would require more than 100,000 core hours of computing resources, which is not feasible in engineering practice. Therefore, this study adopted a scientific method of steady-state accelerated simulation combined with linear extrapolation to achieve equivalent simulation of the long-term service process, with the specific workflow as follows:
First, a DEM-FEM coupled simulation equivalent to four revolutions of the mill was conducted. Pre-verification results show that after four revolutions, the fluctuation range of key indicators of material movement is very small. The instantaneous wear rate of the liner extracted at this stage can accurately reflect the real wear intensity under stable working conditions, eliminating interference from initial transient motion.
Long-term wear tests confirmed that the wear volume and depth of the liners increase linearly with service time, with no significant acceleration or deceleration of wear during the normal service cycle. Based on this, the instantaneous wear rate obtained from the 24 min steady-state simulation was linearly extrapolated to the total wear amount over the 3192 h service cycle.
The simulated wear profile in
Figure 10 is the result of the aforementioned extrapolation calculation. The average error between this profile and the on-site measured wear profile is almost the same. A slight deviation only exists at the right end of the flat liner, which arises from the omission of the liquid grinding-aid effect in actual working conditions during simulation. This further confirms that the steady-state accelerated simulation combined with linear extrapolation method can reliably reproduce the worn morphology of the liner after long-term service, while balancing computational efficiency and result authenticity.
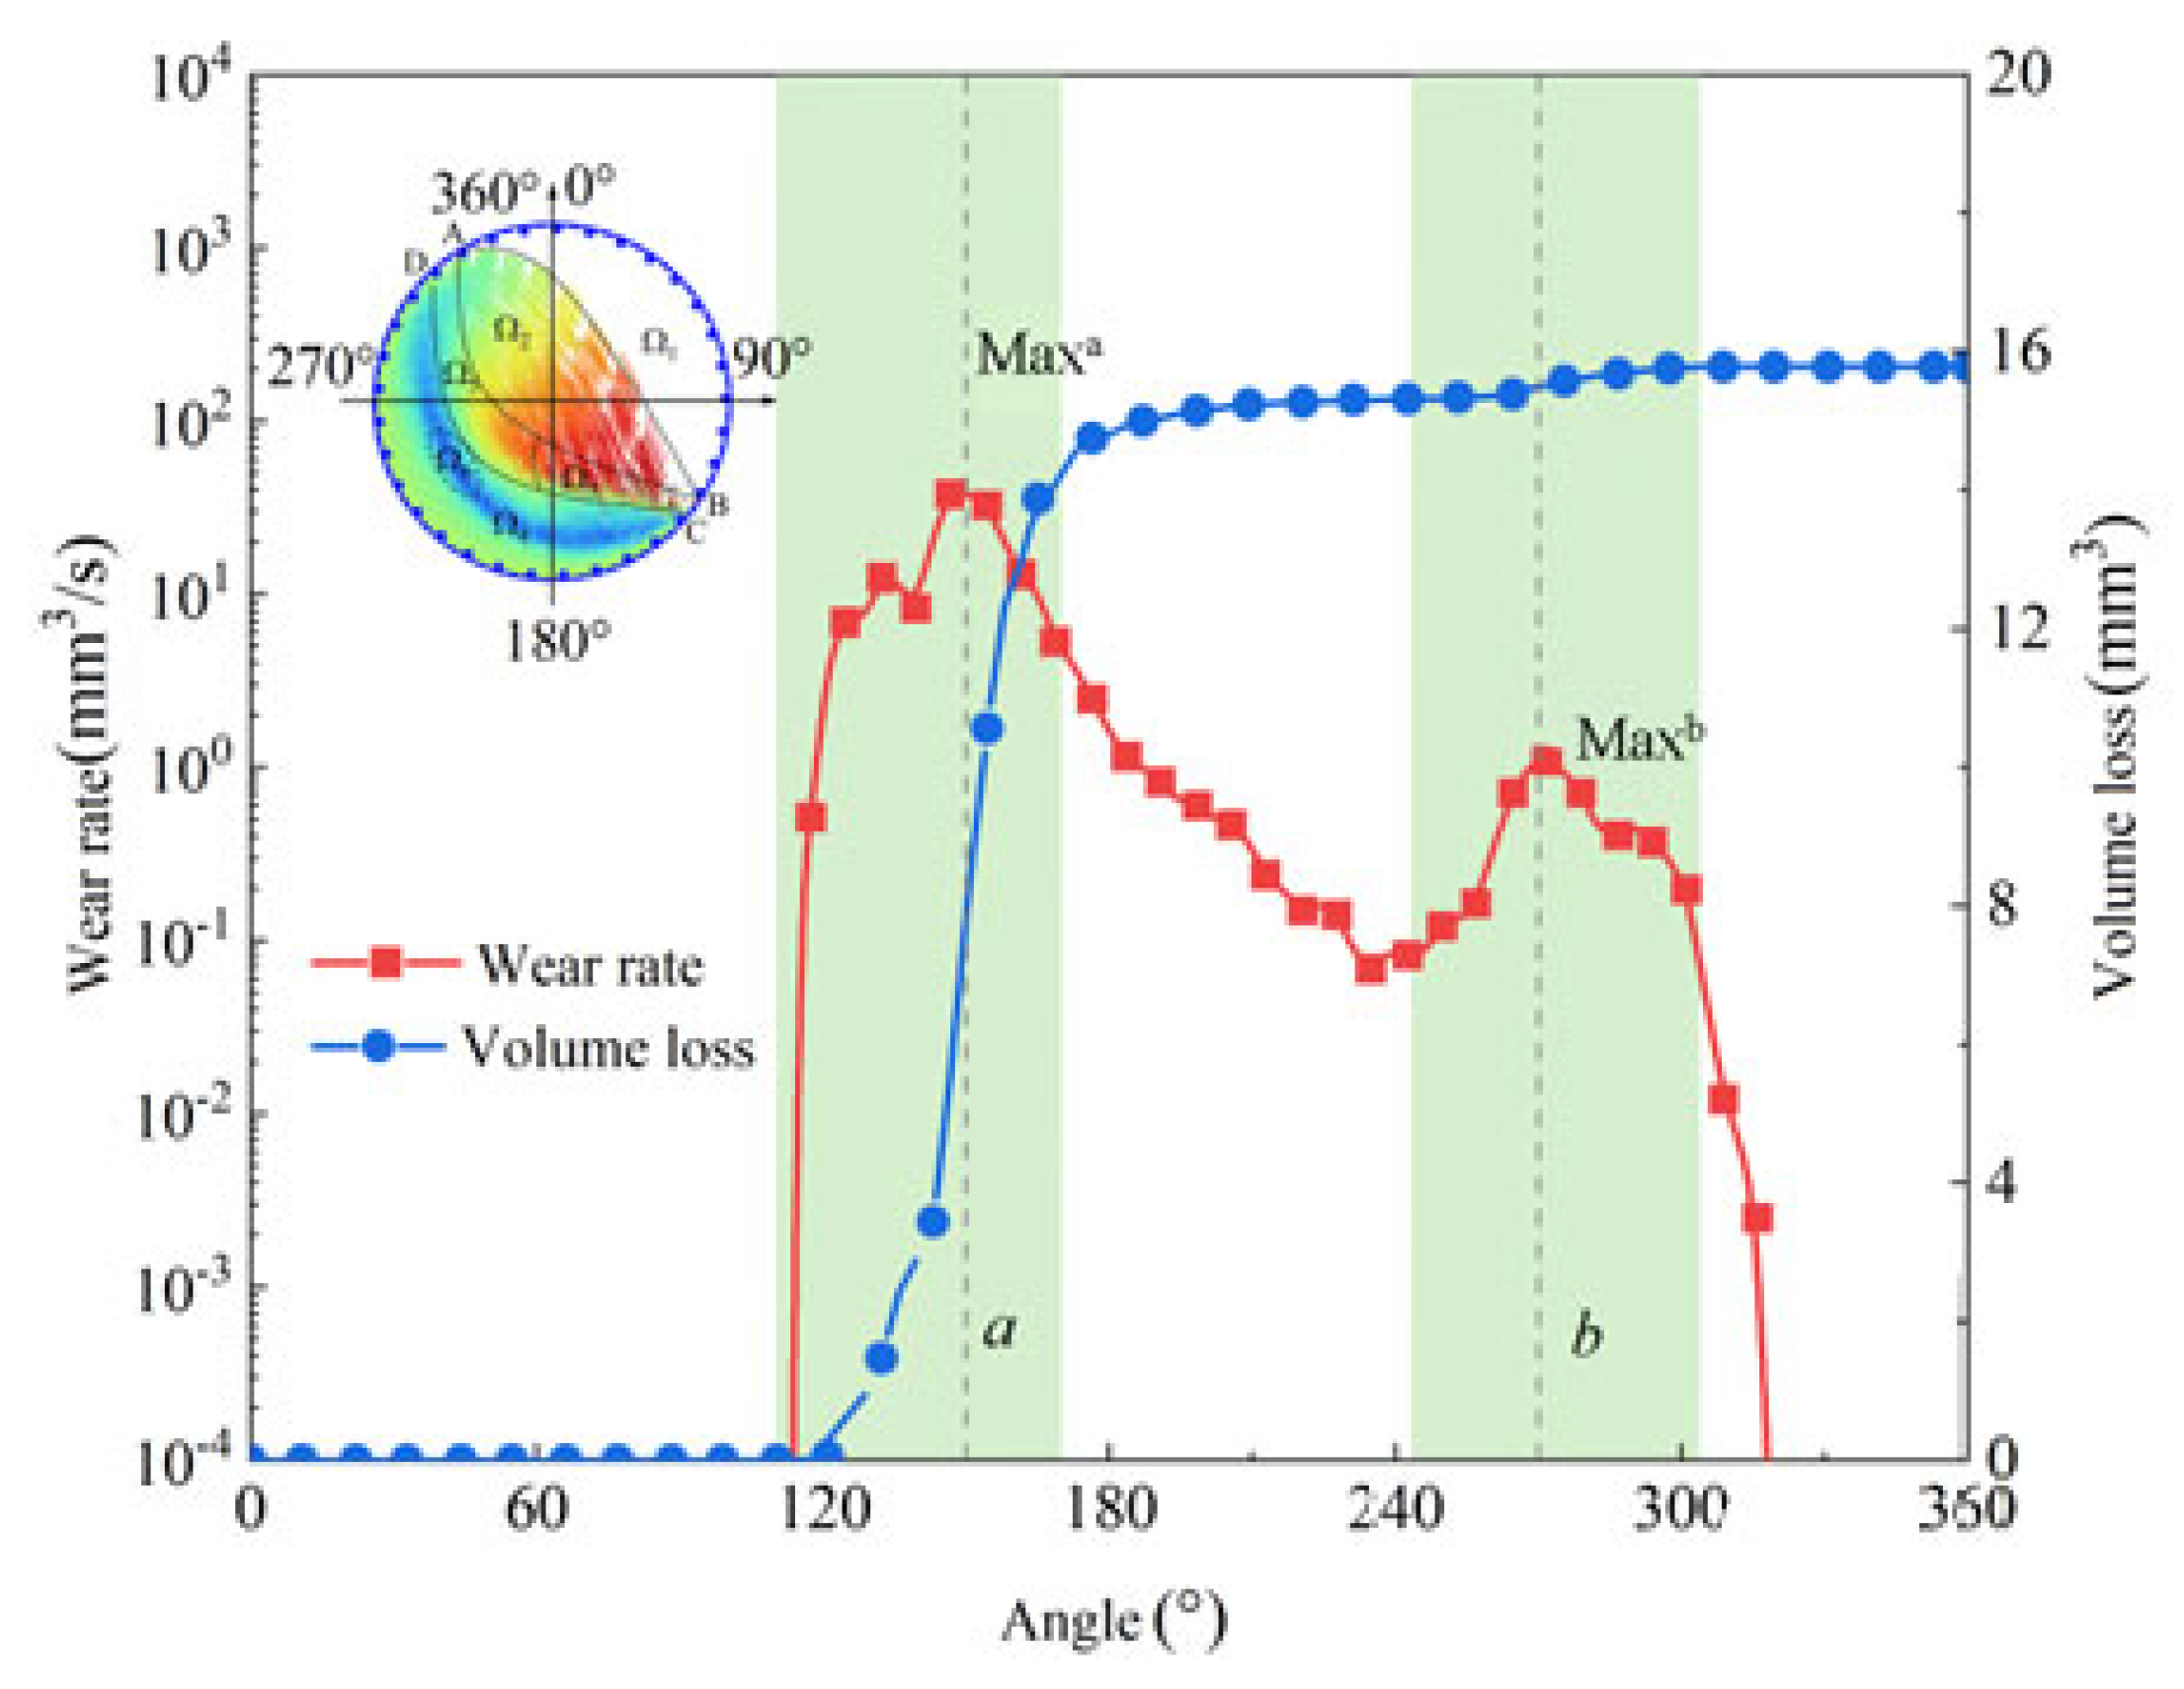
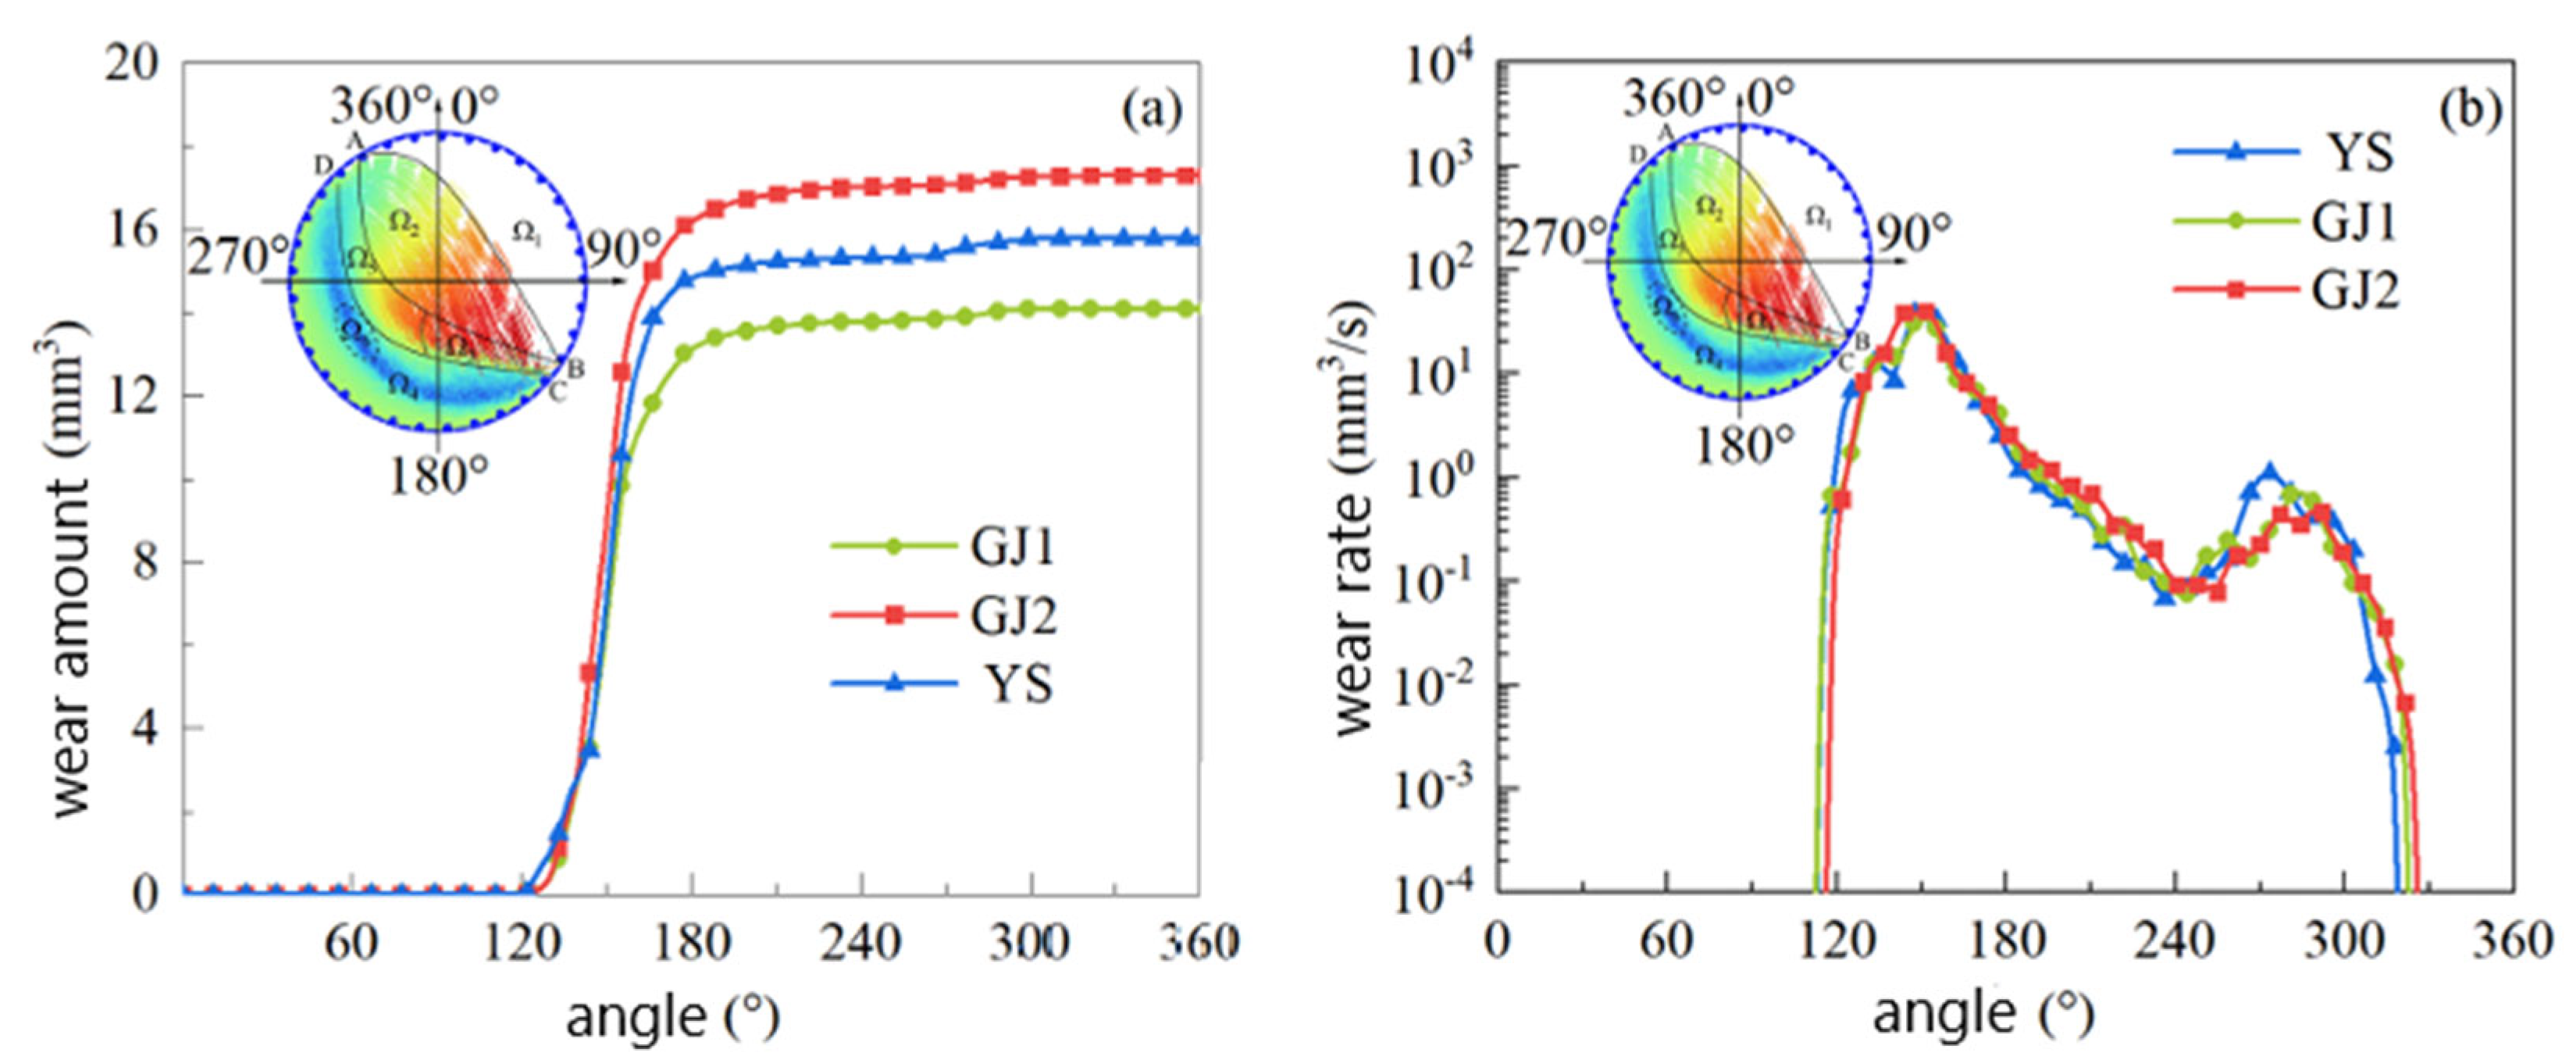
In order to reveal how the liner wears during the evolution process, the instantaneous wear rate curve and real-time mass loss of the mill shell liner during one revolution are reckoned and shown in
Figure 11. In the figure, the wear rate and volume loss increase sharply when the liner reaches a position in the 113° direction where the liner enters the crushing zone from point B. Near point B, the high-speed impact of the materials in the crushing zone causes the wear rate of the liner to increase sharply. As the liner continues to rotate, the wear rate reaches a maximum value
Maxa in the range of [113°, 170°] marked a and the materials are driven by the liner and drop to the bottom of the cylinder through the BC area. As before, the moving direction of the materials is changed and gradually accelerates to be the same as the liner. Then, speed variation in the materials causes a shearing movement between the materials and the liners. Therefore, the wear of the liners intensifies. After that, the relative movement is reduced between the materials and the liners, so the wear rate gradually decreases. When the liner is running the range of [243°, 302°] marked b, the wear rate gradually increases and reaches a sub-maximum value
Maxb. Finally, the wear rate of the liner is reduced to zero. This process is shown as in
Figure 9 corresponding to the CD and DA zones. In the latter half of the CD zone and the DA zone, the materials bore gravity greater than the friction forces provided by the liner. Therefore, the materials fall downward, the relative movement with the liner gradually increasing and the wear rate increases. In the DA zone, the material is thrown off, and the wear rate decreases to zero little by little as it separates from the liner.
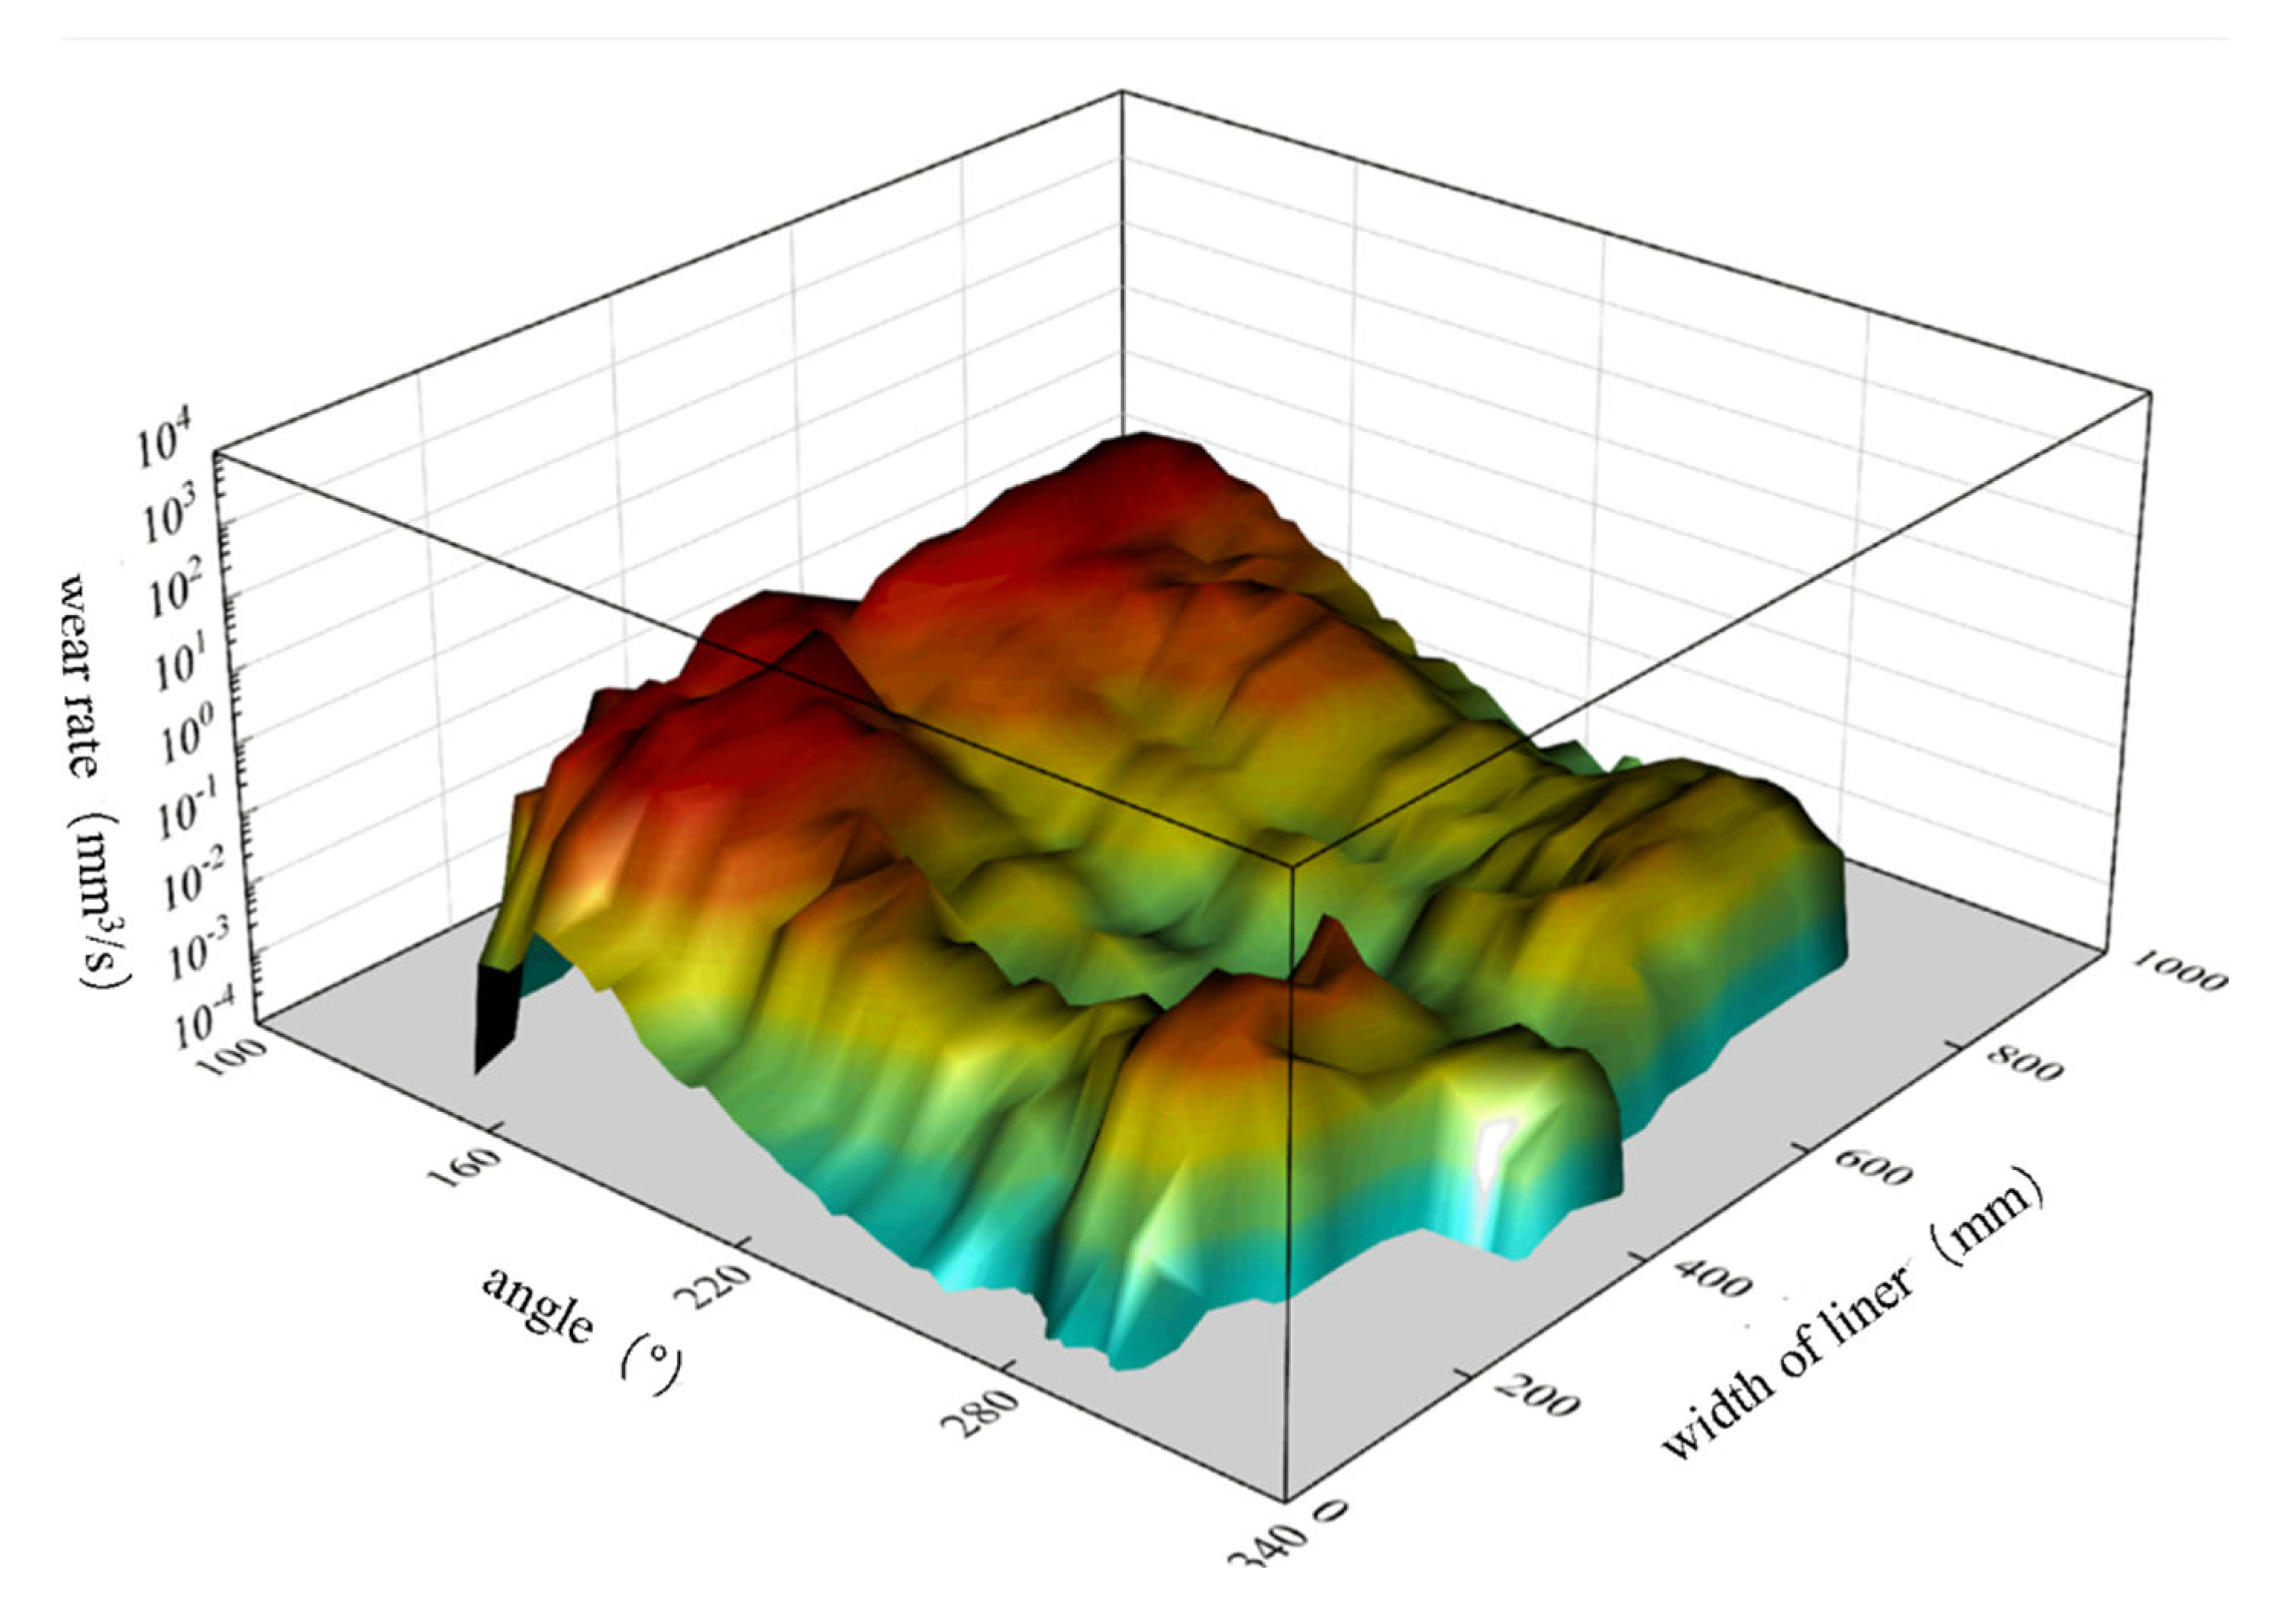
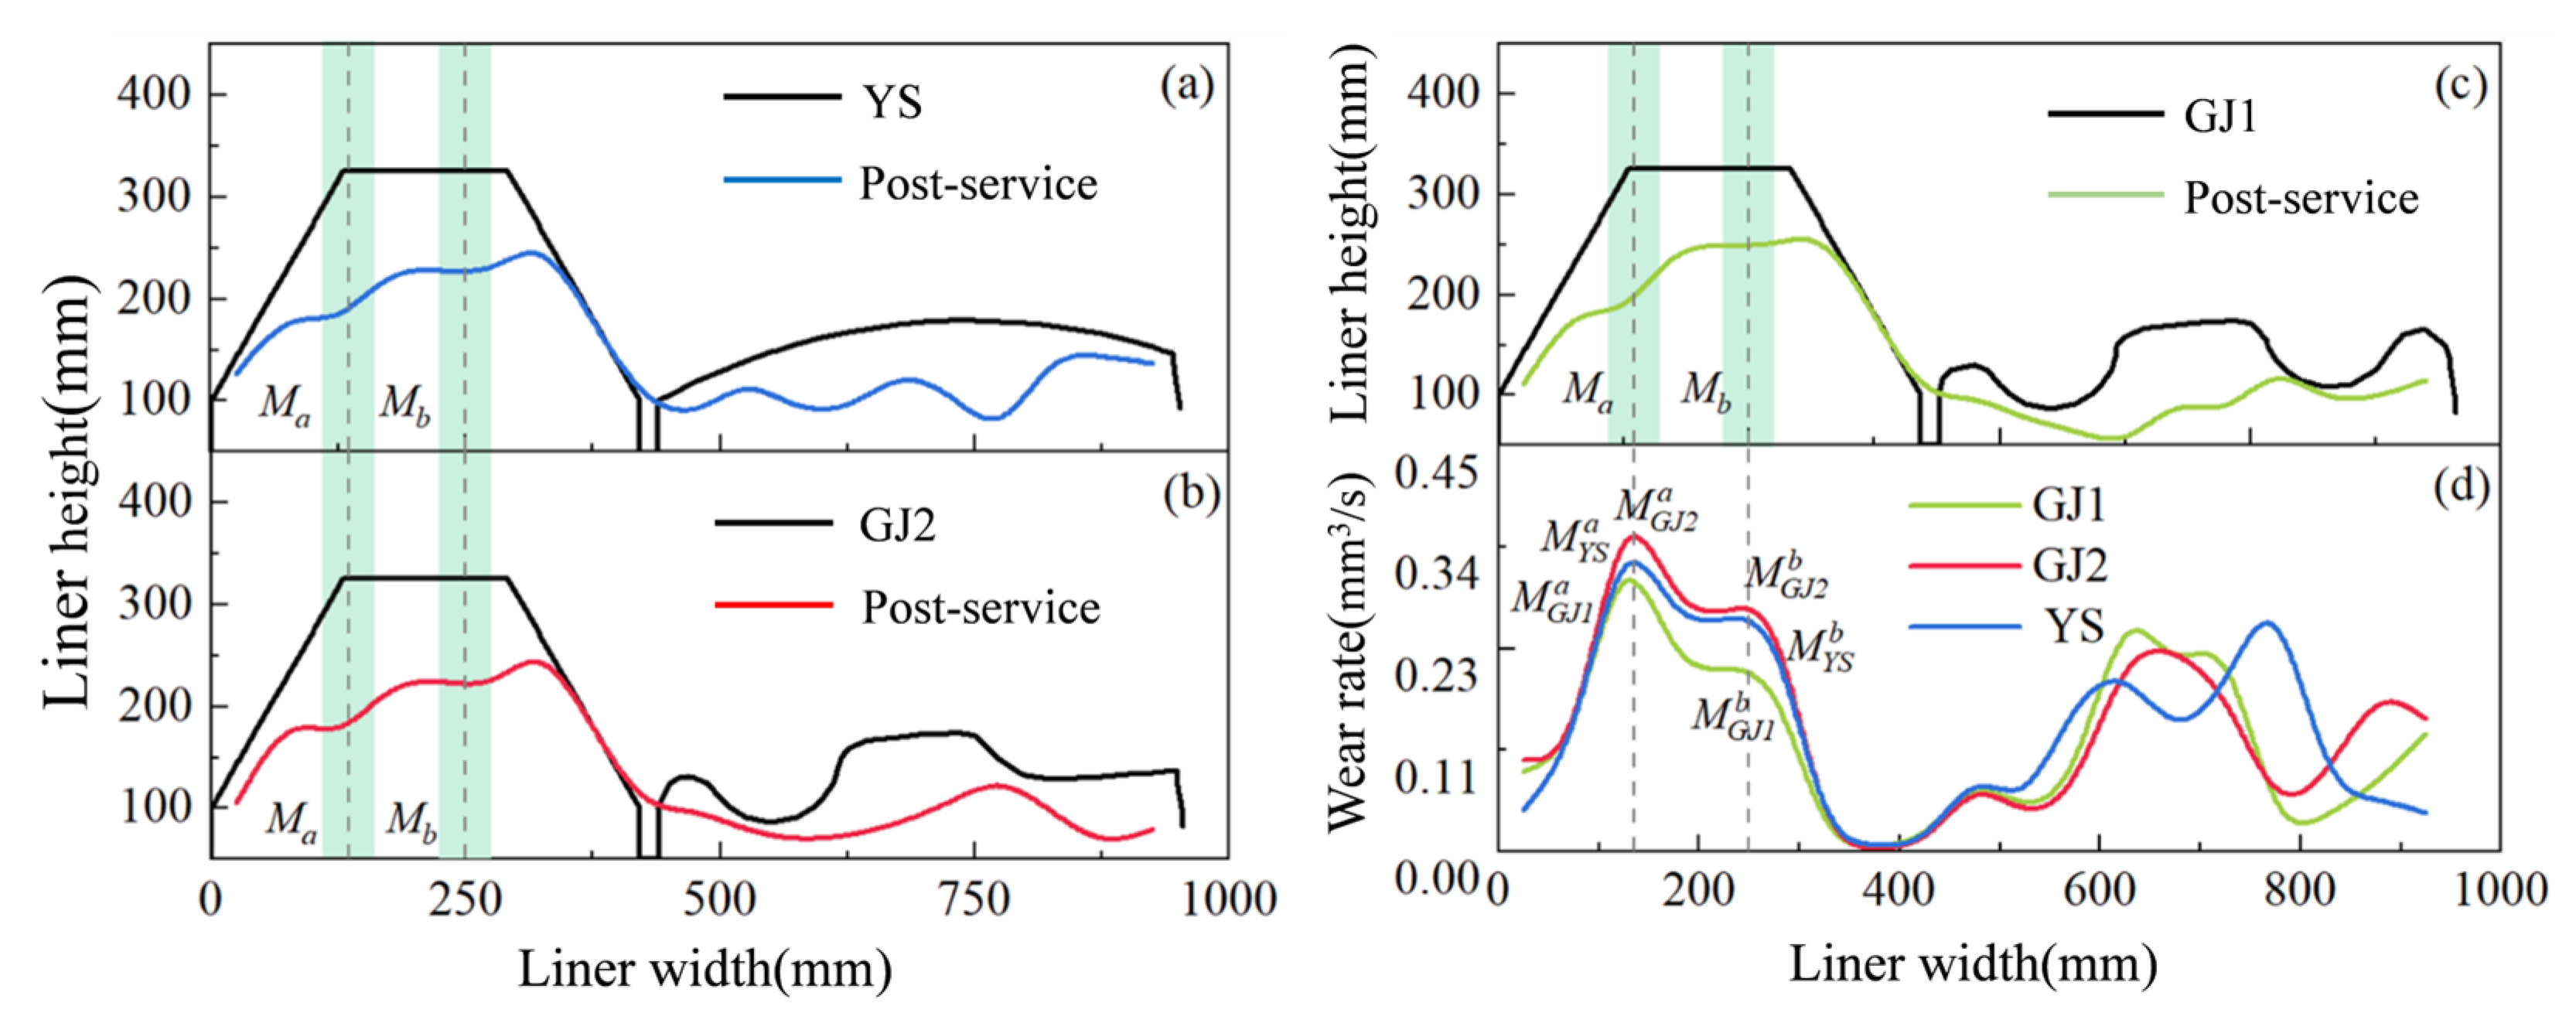
It is known that the wear loss is different in the width direction of the liner, and also different to that of the lifter bars and the flat liners in line with the simulation results and the experimental data.
Figure 12 shows the wear rate in the width direction of the liner during one operating cycle of the SAG mill. It can be seen that the wear rates have two peaks,
Maxa and
Maxb, and the wear rate of the flat liner is lower than that of the lifter bars. In addition, due to the materials contacting with lifter bars and the flat liners in sequence, the phase difference between the peak wear rates of the lifter bars and the flat liner is about 6°, which is close to the installation angle. In
Figure 12, the second peak of the wear rate on the flat liner is not obvious, because when the liner runs in the b area, the materials fall off under the force of gravity, and the material sliding against the flat liner is not severe. So, it can be inferred that the greater the lifting capacity of the flat liner, the greater its own wear. Inversely, if reducing the lifting capacity of the flat liner, the material will fall off more easily, which in turn will cause increased wear on the lifter bars.
4.3. Stress Distribution in the Shell Liner
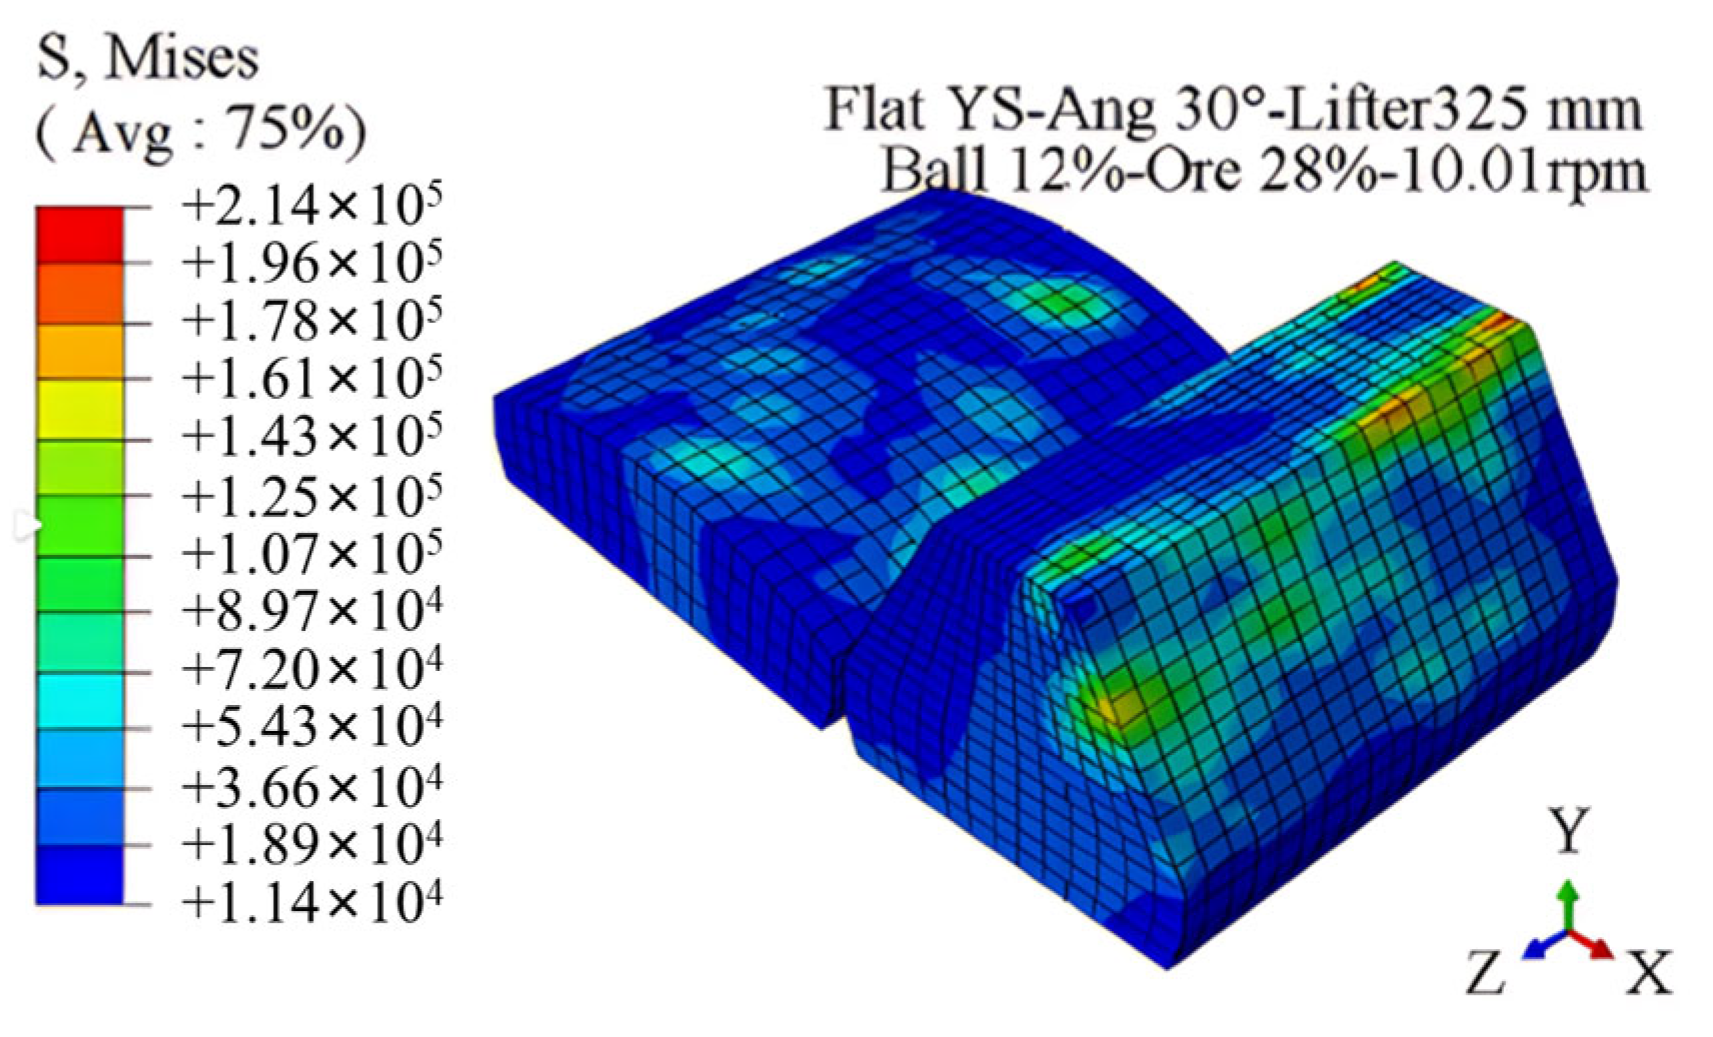
The stress nephogram of the shell liner when running to the lowest point is shown in
Figure 13, which is not evenly distributed. The material-receiving surface of the lifter bars and the middle of the flat liner are under greater stress, while the non-material-receiving surface of the liner is under less stress. The stress distribution of the liner is consistent with the wear change rule of the liner, which further verifies the correctness of the liner wear evolution.
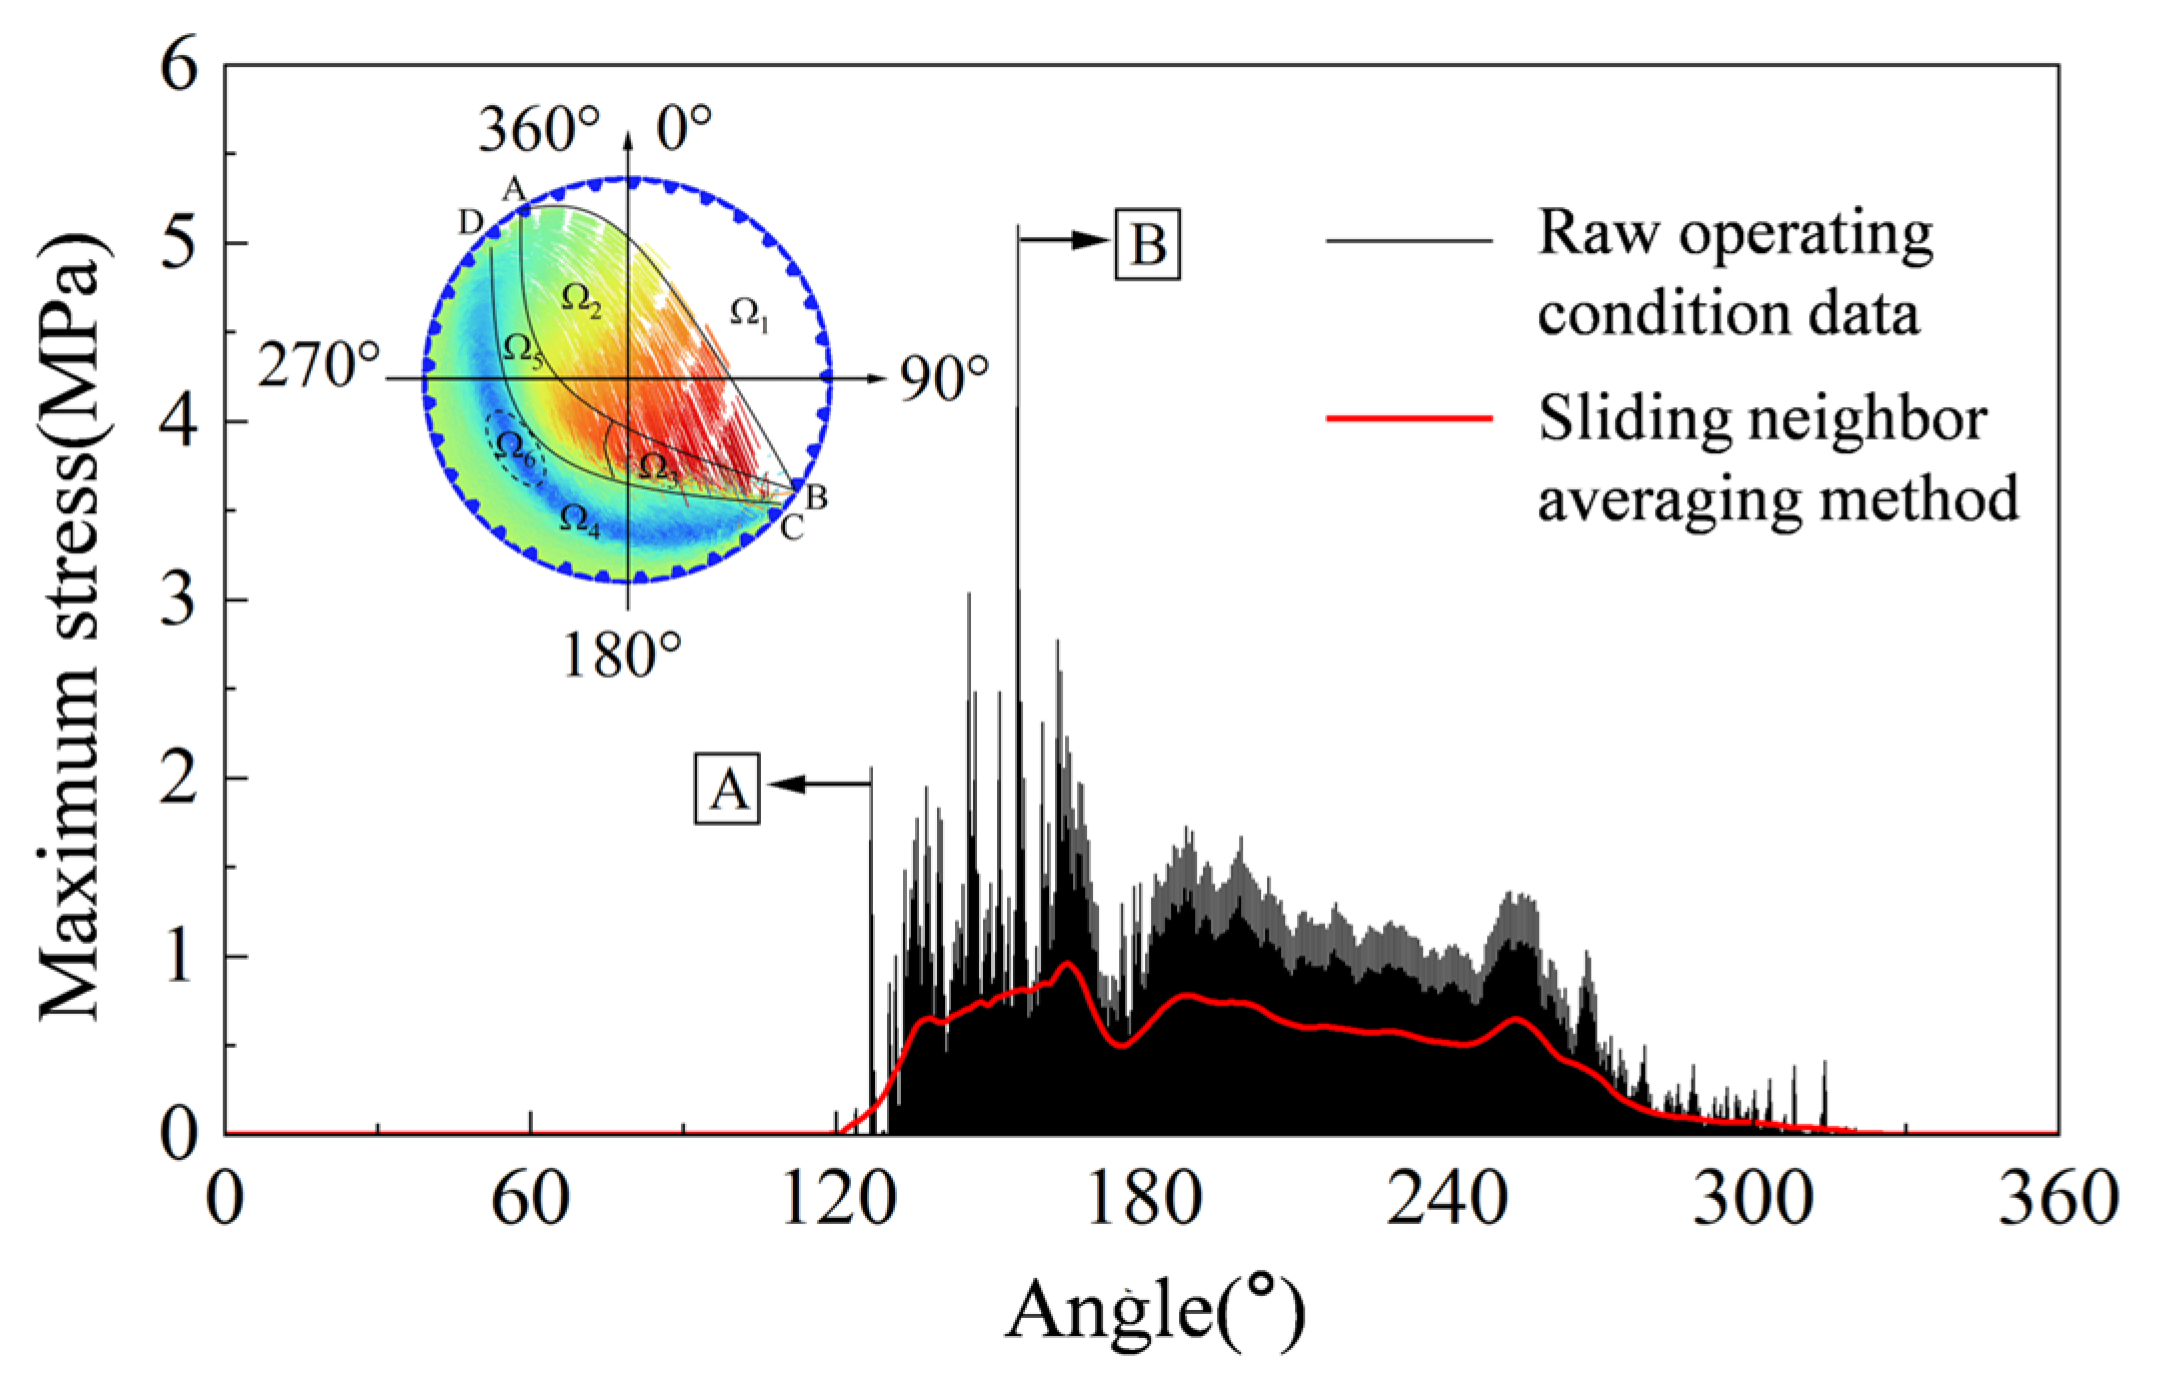
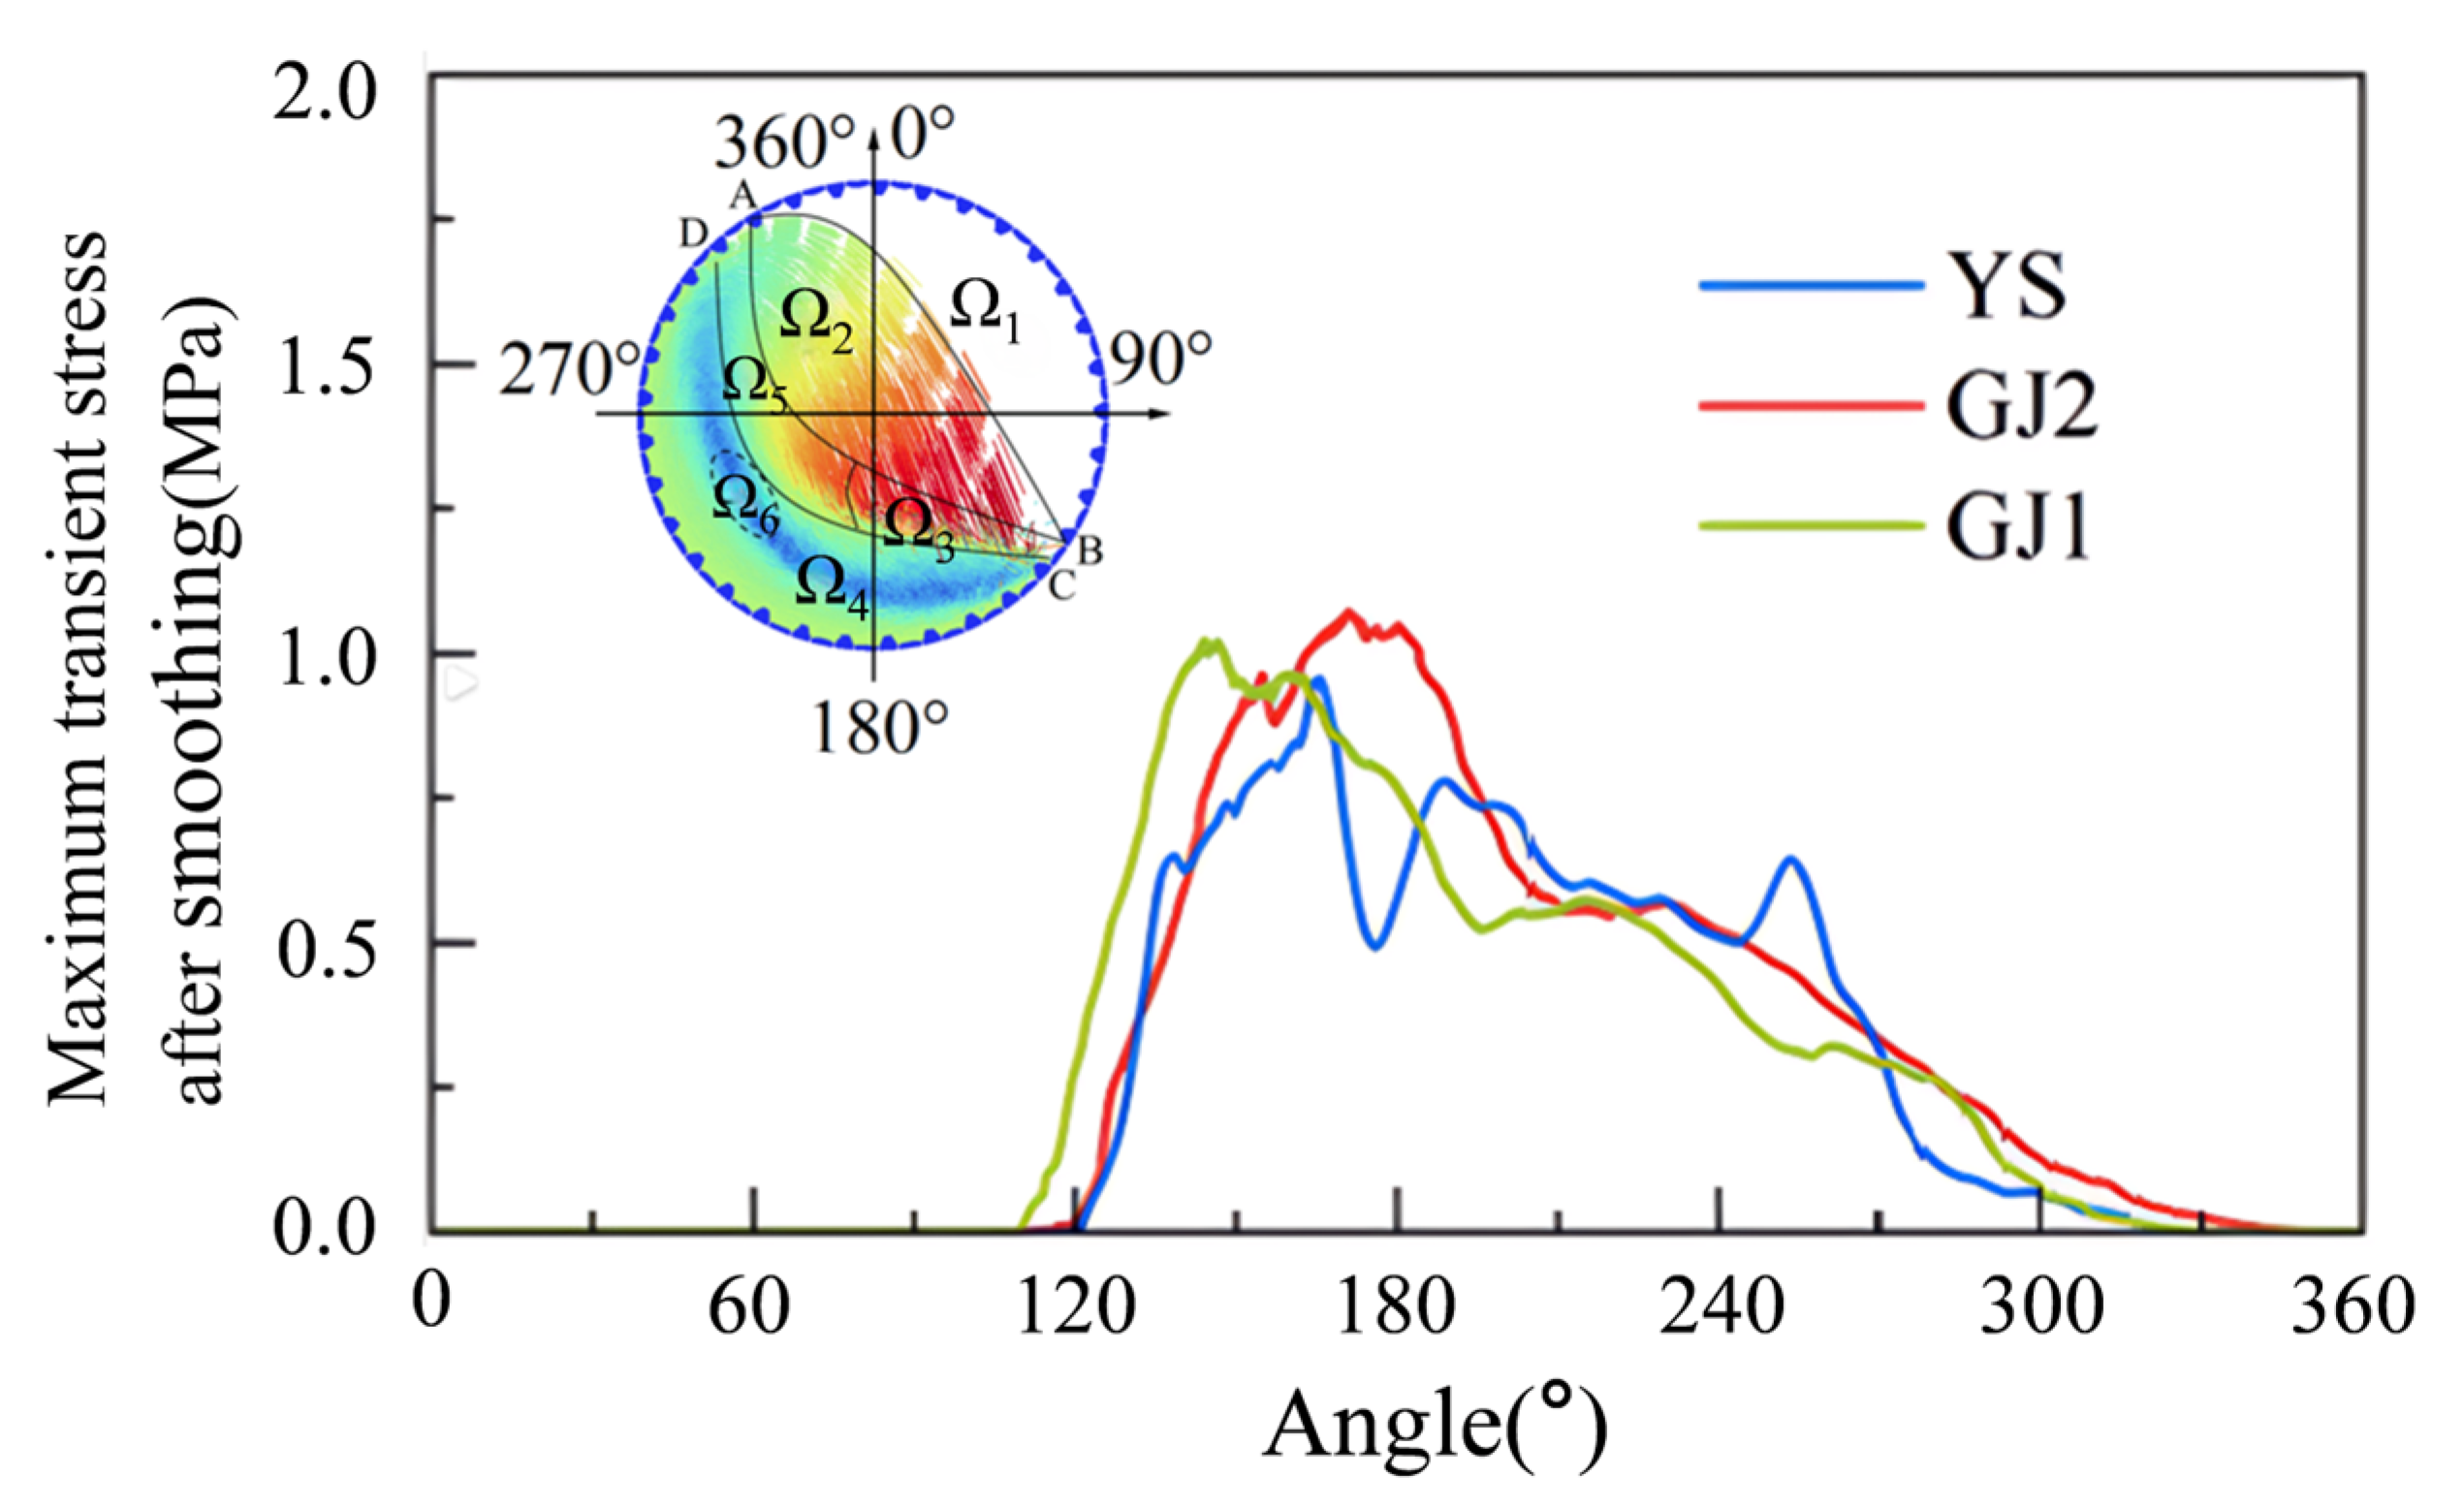
The instantaneous maximum stress–time history of the shell liner during one rotation was extracted as shown in
Figure 14. The instantaneous maximum stress of the liner during operation shows a pulse distribution, which matches the instant impact of discrete particles. When the liner is near 120°, the stress increases sharply, which is most likely due to the direct impact of a few materials. As the liner rotates to around 150°, the stress reaches a maximum value. At this time, the liner is located in the grinding zone, where a large number of materials are squeezed on the upper layer of the grinding zone in the liner, so the stress reaches a maximum value. Just like the previous analysis, this is also the area of the liner where wear is greatest. Therefore, it can be reasonably inferred that the peak instantaneous stress, A, reflects the intensity of the impact on the liner. The greater the peak value, the more severe the impact on the liner, and the more likely the liner is to break and deform. Peak value B reflects the instantaneous maximum stress on the liner and the crushing effect on the material in the grinding zone. The higher the stress level near the peak, the better the crushing effect of the material in the grinding zone.
In addition, the instantaneous liner stress in
Figure 14 is smoothed by the adjacent averaging method which can more clearly reflect that the instantaneous stress characteristics of the liner are consistent with the instantaneous wear rate characteristics. The stress is greatest in the grinding zone, which gradually decreases as the liner moves, and increases in the discharge zone.
6. Discussion
6.1. Interpretation of Core Research Findings
The core objective of this study was to address the limitations of traditional numerical simulation methods in reproducing the dynamic wear evolution of Semi-Autogenous Grinding (SAG) mill liners and clarify the mechanism by which flat liner shape affects the overall service performance of the mill. Through developing an improved Finnie-DEM wear model and a Python-based DEM-FEM bidirectional coupling framework, key findings were obtained, and their engineering and theoretical significance are interpreted as follows:
First, the validation results of the improved Finnie-DEM model showed that the simulated wear profile of the liner was highly consistent with the laser three-dimensional scanning (LTDS) data of the industrial φ10.37 × 5.19 m SAG mill after 3192 h of service. The only minor discrepancy at the right end of the flat liner was attributed to omitting the liquid grinding-aid effect in the simulation—an unavoidable simplification in numerical modeling, but one that did not affect the overall reliability of the model. This consistency confirms that the model effectively overcomes the defect of traditional wear models that only quantify wear volume without reproducing a morphological evolution. By dynamically updating the displacement of FEM mesh nodes based on wear volume, the model realizes synchronous simulation of “wear amount–surface morphology–stress distribution”, making it closer to the actual progressive wear process of industrial liners.
Second, DEM-FEM coupling analysis revealed two circumferential instantaneous wear extremes (Maxa > Maxb) and two lifter bar wear rate peaks (Ma > Mb). The liner’s stress distribution was consistent with its wear distribution, with the maximum instantaneous stress occurring at characteristic points A and B: stress at A reflects the impact intensity of materials on the liner, and stress at B indicates the mill’s ore-crushing capacity. This stress–wear correlation is a key insight that traditional single DEM or FEM simulations cannot capture. It provides a quantitative basis for evaluating liner service life.
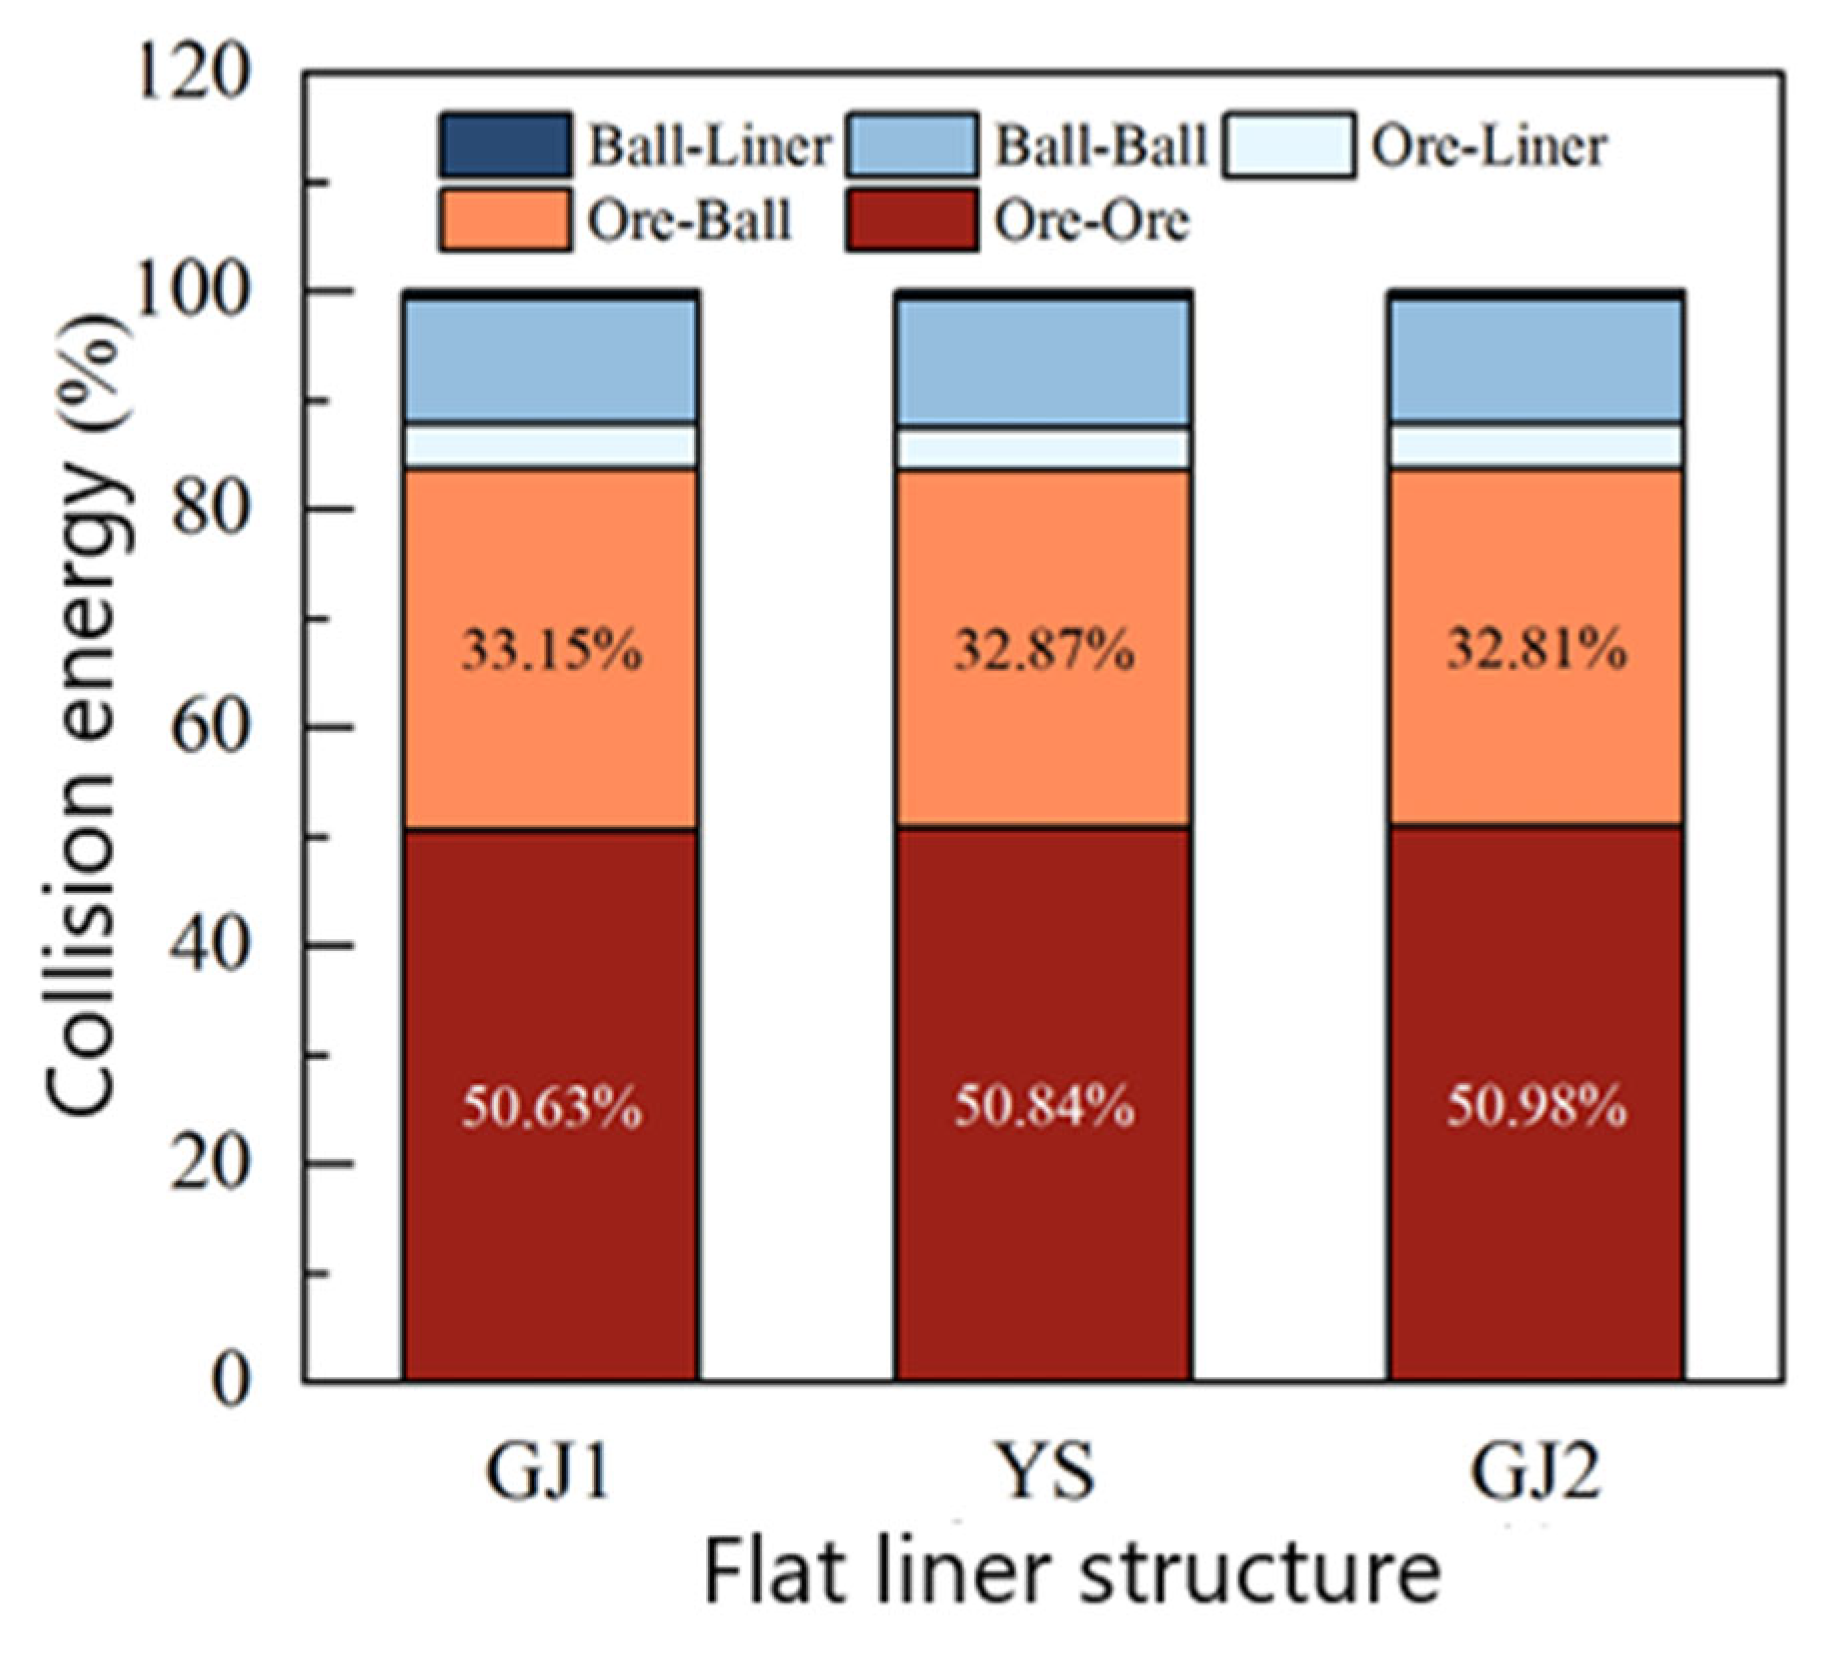
Finally, flat liner shape optimization showed that the GJ1-type flat liner reduced the total wear loss of the liner by 10.6% compared to the in-service YS-type, while increasing the mill’s effective collision ratio by 3.2% and the mass fraction of fine ore by 18.7%. In contrast, the GJ2-type flat liner, despite its smooth surface transition, increased wear loss by 9.5% due to enhanced relative sliding between the materials and liners. This finding challenges the traditional perception that “smooth flat liners reduce wear” and clarifies that the flat liner’s surface profile affects wear and grinding efficiency by regulating the movement trajectory of ore and grinding balls. Specifically, the moderate camber of the GJ1-type flat liner balances the lifting capacity of materials and the stability of the grinding zone, avoiding both excessive wear caused by over-lifting and reducing the grinding efficiency caused by insufficient lifting.
6.2. Comparison with Existing Wear Models
To highlight the innovations and advantages of the proposed model, a comparative analysis was conducted with four typical wear models widely used in SAG/ball mill liner research. The comparison focuses on model principles, simulation capabilities, applicability, and limitations, as shown in
Table 7.
As shown in
Table 7, the improved Finnie-DEM model in this study addresses the critical limitations of existing models:
(1) By integrating the dynamic mesh update mechanism, it realizes the simulation of liner wear morphology evolution, which is absent in the Archard model, original Finnie model, and SIEM;
(2) Through bidirectional DEM-FEM coupling, it solves the problem of stress–wear mismatch in one-way coupling models, ensuring that the stress distribution reflects the actual wear state;
(3) It is applicable to the comprehensive wear scenario of industrial SAG mills, whereas existing models are limited to single wear types. These advantages make the model a more practical tool for industrial liner design and optimization.
6.3. Theoretical and Engineering Implications
6.3.1. Theoretical Implications
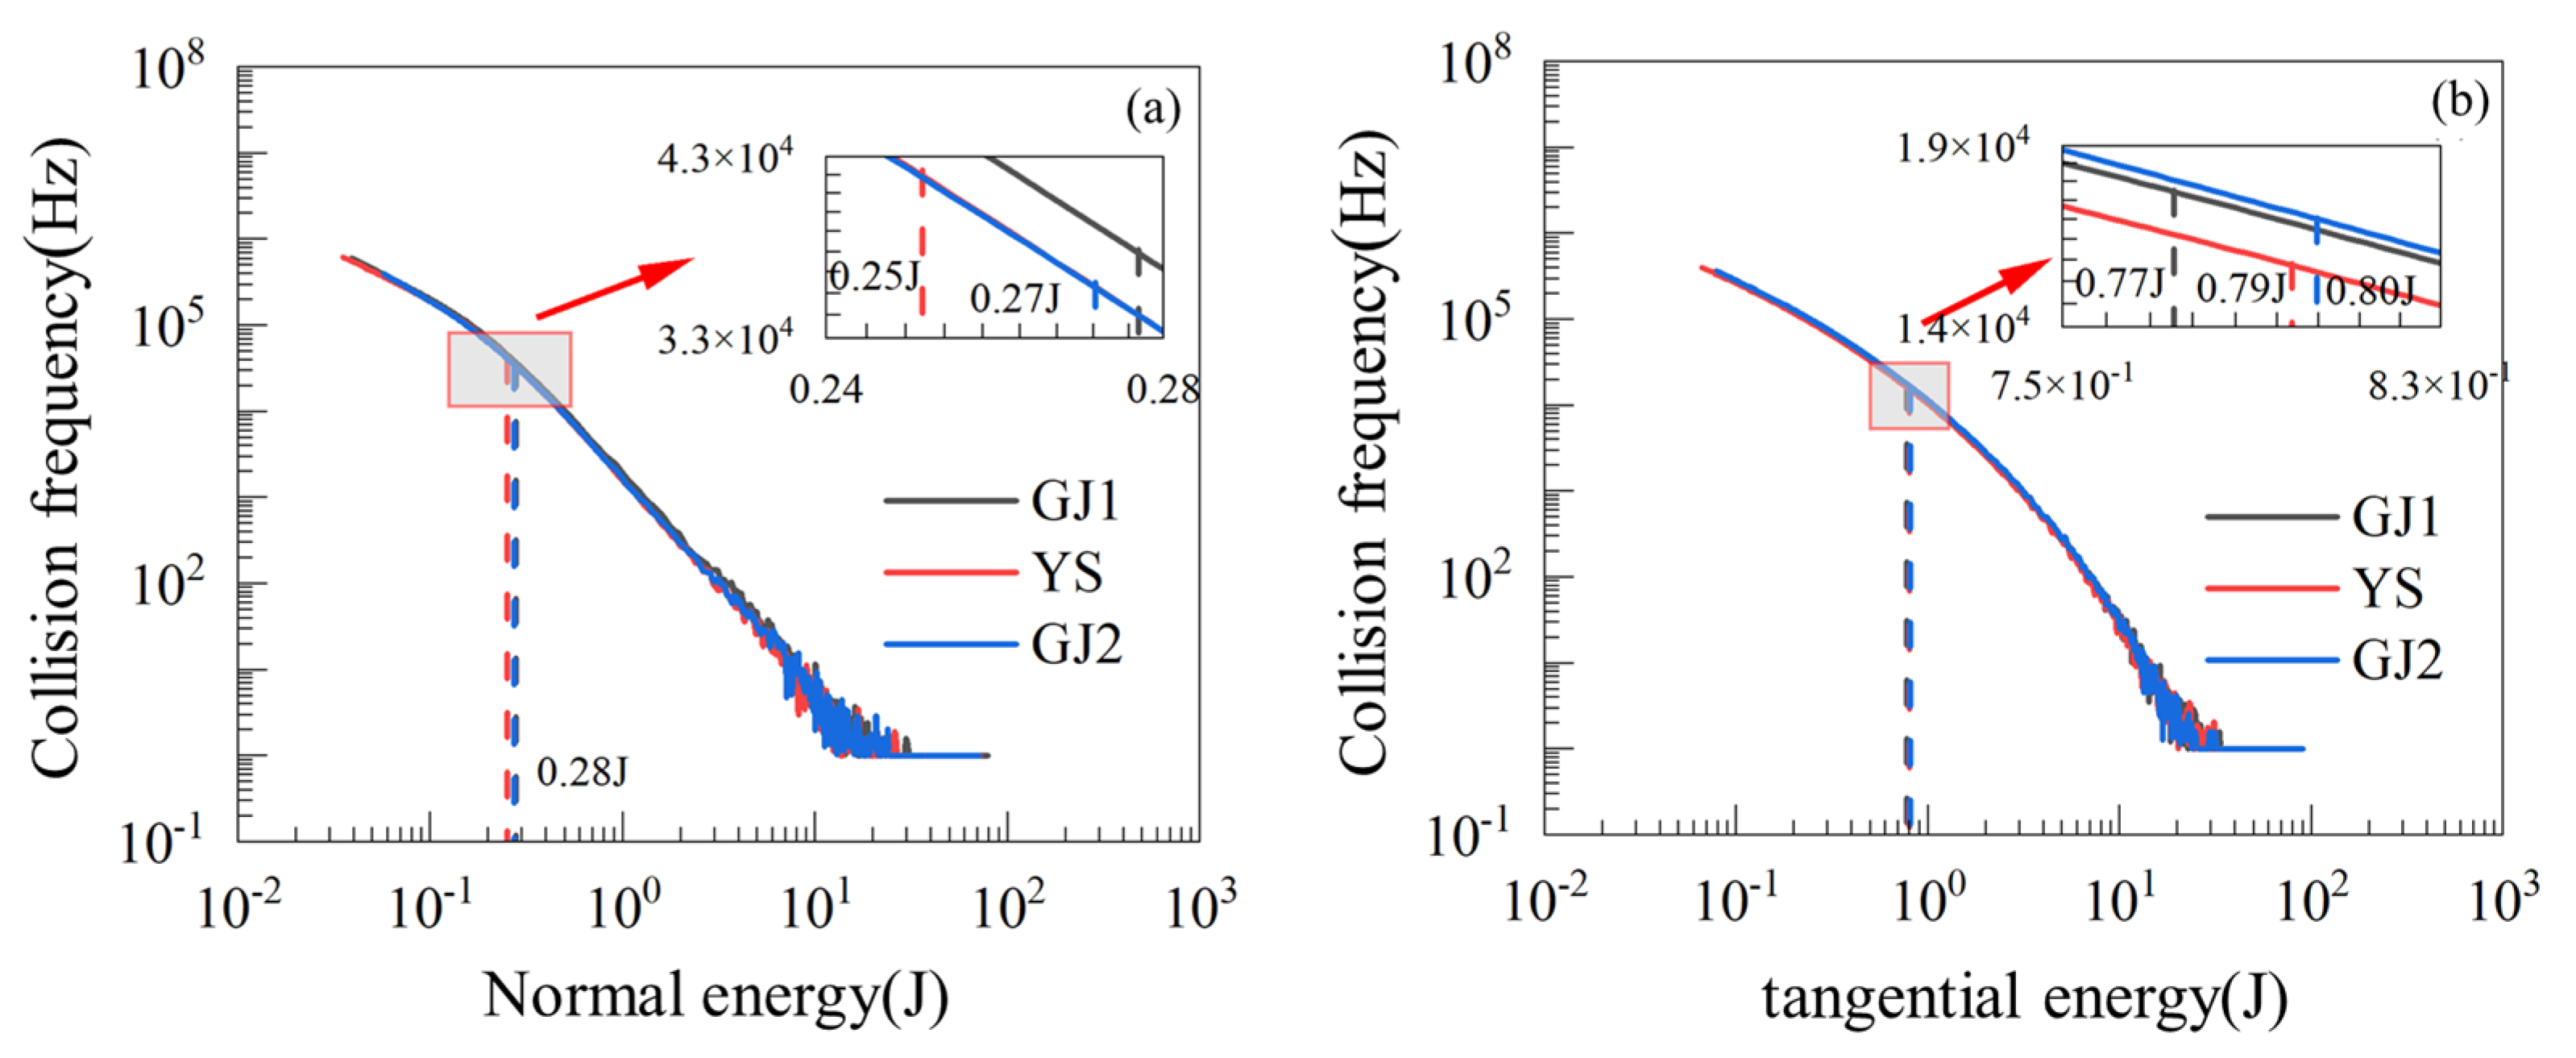
This study enriches the theoretical system of numerical simulation for SAG mill liner wear in two aspects: First, it proposes a “wear morphology–stress feedback” framework, which clarifies that the dynamic change in liner morphology affects the movement trajectory of ore/grinding balls, thereby altering the contact force distribution and further regulating the wear rate. This framework fills the theoretical gap in traditional models where “wear and stress are independent of each other”. Second, it quantifies the correlation between flat liner shape and mill energy utilization—by analyzing the ore collision energy spectrum, it was found that the normal collision energy and tangential collision energy are regulated by the flat liner’s surface profile, and the GJ1-type flat liner optimizes the energy allocation between crushing and grinding, providing a theoretical basis for the “shape–efficiency” design of liners.
6.3.2. Engineering Implications
The research findings have direct guiding significance for industrial SAG mill operations and liner design: (1) the improved Finnie-DEM model can be used to predict the service life of liners, helping mines formulate maintenance plans; (2) the GJ1-type flat liner optimized in this study can be directly applied to the φ10.37 × 5.19 m SAG mill, reducing maintenance costs by 10.6% (based on wear loss data) and improving grinding efficiency by 3.2% (based on effective collision ratio); (3) the model can be extended to other sizes of SAG/ball mills by adjusting key parameters, providing a universal numerical tool for the mining industry.
6.4. Limitations and Future Research Directions
Despite the contributions of this study, it has certain limitations: (1) The simulation omitted the liquid grinding-aid effect in actual mill operations, which led to minor discrepancies in the wear profile of the flat liner’s right end. Future research can integrate Computational Fluid Dynamics (CFD) into the DEM-FEM framework to simulate the coupled effect of solid and liquid phases; (2) The study assumed a constant wear rate over the liner’s service life, which may deviate from the actual wear acceleration in the late service stage. Future work can incorporate material fatigue damage models to improve the accuracy of long-term wear prediction; (3) The research focused on chromium–molybdenum alloy steel liners, and the applicability of the model to other materials needs further verification.
In future research, we will address the above limitations and explore the application of the model in intelligent mill control—for example, establishing a real-time feedback loop between the simulated wear rate and actual mill operating parameters to achieve adaptive optimization of mill performance.
7. Conclusions
The wear and wear process of SAG mill shell liners are studied in this paper. A Finnie-DEM wear model is established to consider the evolution of the surface morphology of the liners. The coupled DEM-FEM simulation code was written in Python to realize data transfer between software EDEM and software ABAQUS. In detail, the collision effect of discrete materials acted on the finite element in the form of forces to analyze whether the liner stress and node coordinate was corrected by the wear loss in the EDEM to simulate the evolution of the surface morphology of liner wear. The main results are as follows:
(1) The improved Finnie-DEM wear model can predict and simulate the wear evolution of the surface morphology of the liners with effects. The DEM-FEM coupling simulation by the Python program avoids a large number of data interactions and non-correspondence of nodes between DEM and FEM software, and also realizes the FEM model corrected to simulate the stress–time history during the wear evolution process.
(2) The liner wear analysis of an extra-large SAG mill was carried out by using the DEM-FEM coupling simulation method, and the profile of the simulated surface is more in line with the experimental wear results.
(3) The influence of the flat liner shape on wearing and tearing was analyzed by a stress nephogram. There are two extreme values of Maxa and Maxb for the instantaneous wear rate of the liner in the circumferential upward direction of the cylinder, and Maxa dominates. The stress distribution in the liner is consistent with the wear distribution and the instantaneous maximum stress when the liner runs into the grinding zone. For two characteristic value points A and B, the stress at point A reflects the magnitude of the direct impact on the liners and the stress at point B reflects the crushing capacity of the mill.
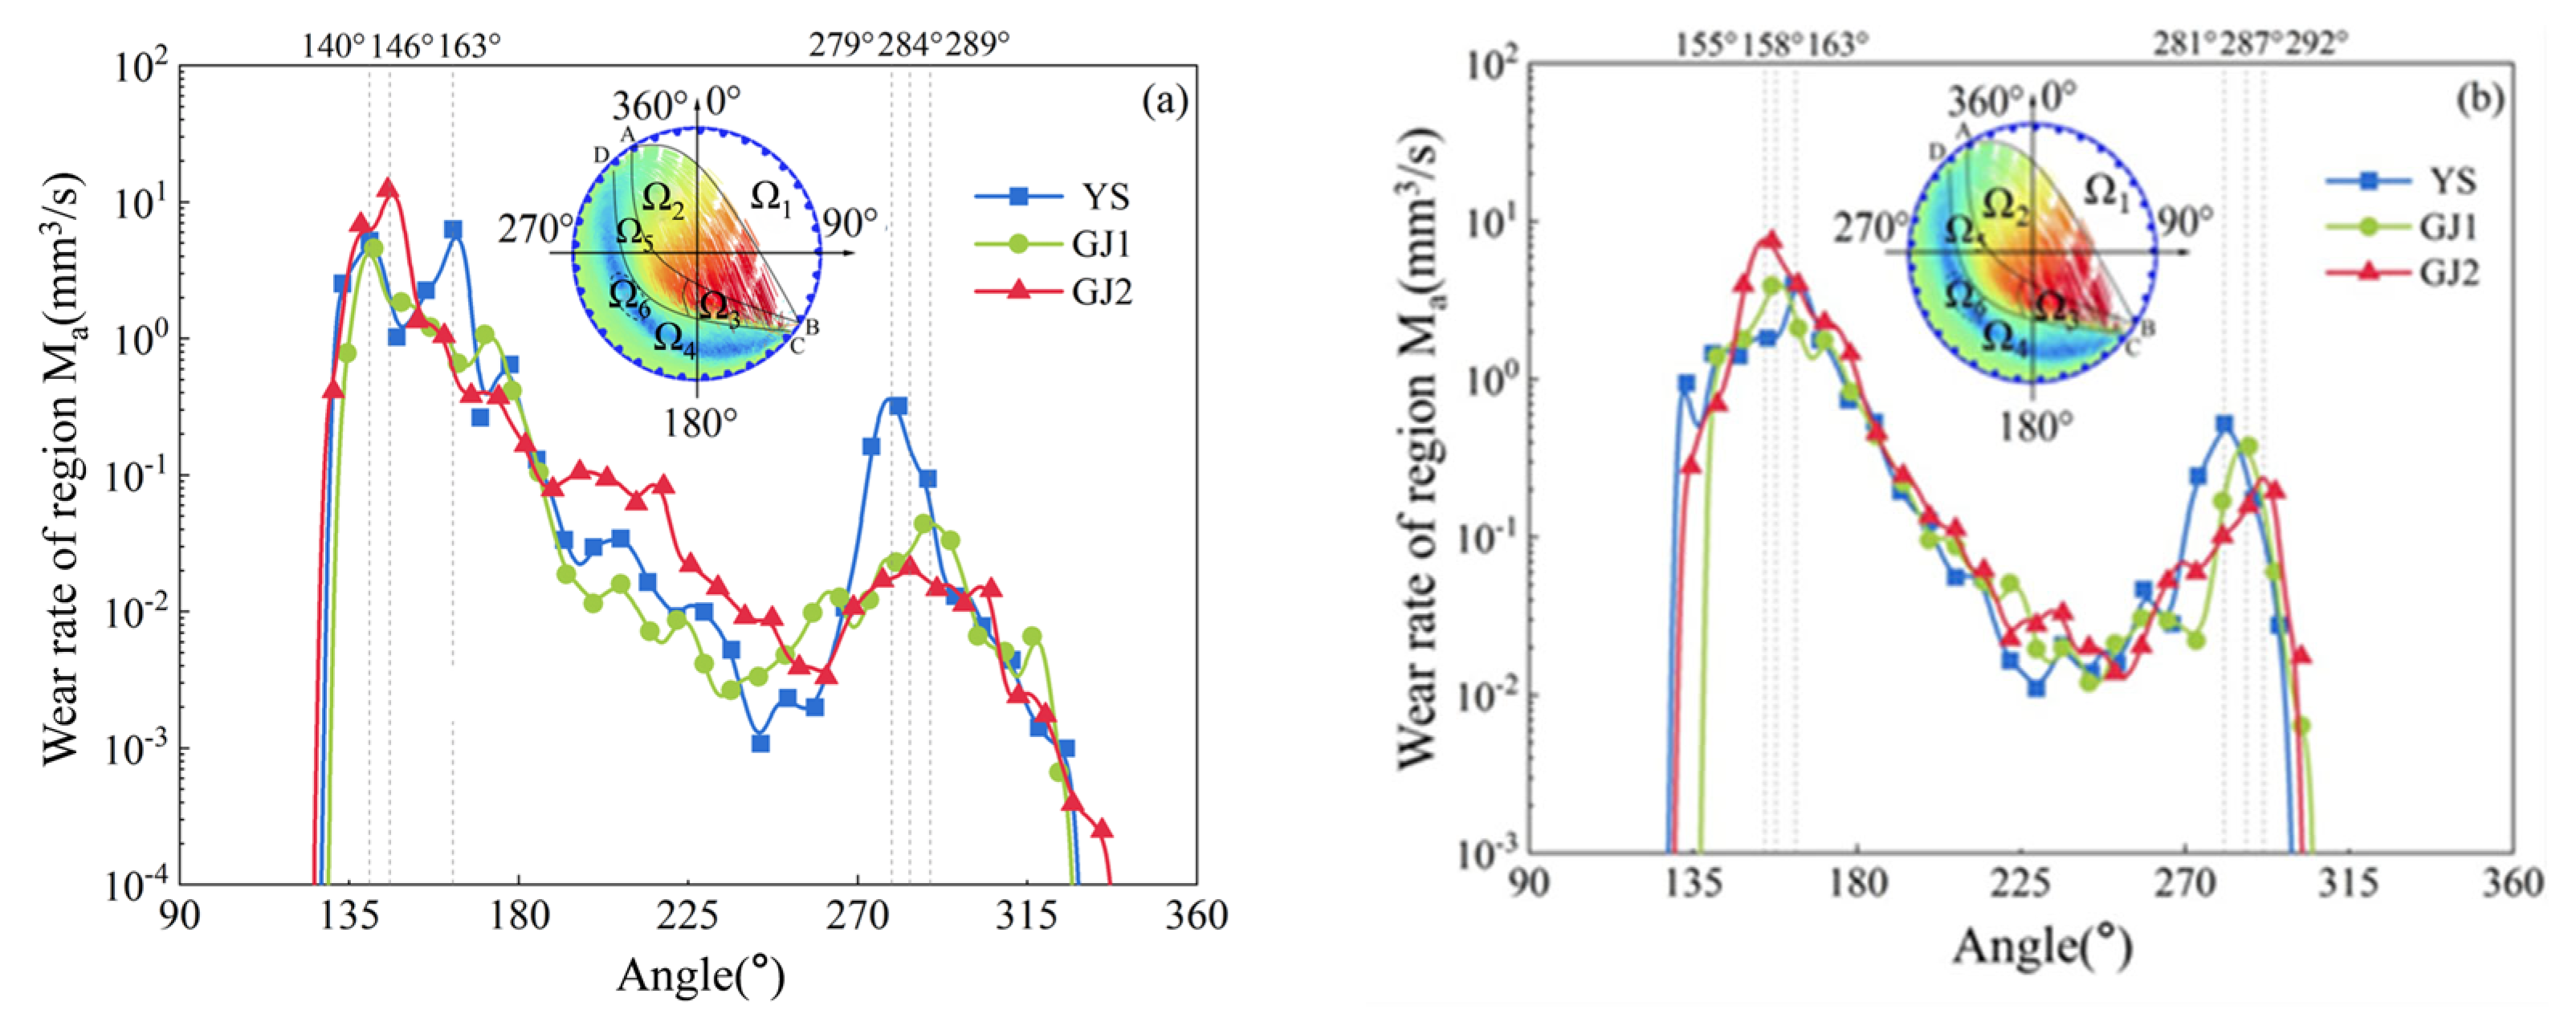
(4) The influence of the flat liner’s shape on the wear of lifter bars was analyzed. The results show that the flat liner shape could affect the magnitude of wear rate extremes Ma and Mb on the lifter bar, and smoothly curved surfaces or curved surfaces without peaks should be avoided, so it is desirable to adopt the structural type of GJ1. Different shapes of the flat liner have a significant effect on the stresses at points A and B, that is, it changes the direct impact force on the lining plate and the crushing capacity of the mill. Variations had a significant effect on the normal collision of material against ore but hardly affected the energy utilization of the mill.
