Article

Efficient Multi-Modal Learning for Dual-Energy X-Ray Image-Based Low-Grade Copper Ore Classification

1
School of Computer Science and Engineering, Central South University, Changsha 410083, China
2
School of Resources and Safety Engineering, Central South University, Changsha 410083, China
3
Faculty of Resource and Environmental Engineering, Jiangxi University of Science and Technology, Ganzhou 341000, China
*
Author to whom correspondence should be addressed.
Minerals 2025, 15(11), 1150; https://doi.org/10.3390/min15111150
Submission received: 28 September 2025 / Revised: 27 October 2025 / Accepted: 30 October 2025 / Published: 31 October 2025
(This article belongs to the Section Mineral Processing and Extractive Metallurgy)

Abstract

The application of efficient optical-electrical sorting technology for the automatic separation of copper mine waste rocks not only enables the recovery of valuable copper metals and promotes the resource utilization of non-ferrous mine waste, but also conserves large areas of land otherwise used for waste disposal and alleviates associated environmental issues. However, the process is challenged by the low copper content, fine dissemination of copper-bearing minerals, and complex mineral composition and associated relationships. To address these challenges, this study leverages dual-energy X-ray imaging and multimodal learning, proposing a lightweight twin-tower convolutional neural network (CNN) designed to fuse high- and low-energy spectral information for the automated sorting of copper mine waste rocks. Additionally, the study integrates an emerging Kolmogorov-Arnold network as a classifier to enhance the sorting performance. To validate the efficacy of our approach, a dataset comprising 31,057 pairs of copper mine waste rock images with corresponding high- and low-energy spectra was meticulously compiled. The experimental results demonstrate that the proposed lightweight method achieves competitive, if not superior, performance compared to contemporary mainstream deep learning networks, yet it requires merely 1.32 million parameters (only 6.2% of ResNet-34), thereby indicating extensive potential for practical deployment.

1. Introduction

Copper, as a key material for global industrial and electrical infrastructure, is of vital importance to modern economic and technological development. Its excellent ductility, electrical conductivity and thermal conductivity make it indispensable in wires, cables and electronic devices, and it is a very important non-renewable resource [1]. With the rapid economic development in the past decade, most high-grade ore deposits have been nearly exhausted, and the grade of copper ore worldwide has begun to decline gradually over the years [2]. Meanwhile, China’s copper ore resources present the characteristics of being “poor, fine and diverse”, with reserves accounting for less than 5% of the global total [3].
Due to the insufficient precision of traditional sorting techniques, a substantial volume of low-grade ores (with copper content ≥ 0.1%) is erroneously classified and discarded as waste rock during mining operations, leading to considerable economic inefficiency. Furthermore, Chinese metal mines have accumulated over 2.5 billion tons of tailings [4], the protracted storage of which not only consumes extensive land resources but also frequently precipitates environmental and safety hazards, including acidic wastewater contamination [5]. Therefore, there is a pressing imperative to devise a straightforward and effective automated method for distinguishing copper ore from waste rock, thereby facilitating the reclamation and re-utilization of resources embedded within these tailings.
Among the existing photoelectric separation technologies, visible light can classify most ores based on the color and texture differences of the ores [6,7]. However, low-grade copper ores are visually nearly indistinguishable from waste rocks, rendering differentiation challenging. While techniques like short-wave infrared (Vis-SWIR) and near-infrared (NIR) acquire information based on the distinct absorption and reflection properties of substances to various light spectra, enabling the effective sorting of complex ores such as gold, and tin [8]. In addition, X-ray fluorescence (XRF) distinguishes minerals, such as uranium [9], by the fluorescence characteristics produced by the electrons in the substance excited by X-rays.But the penetration depth of these methods is still limited. Consequently, for low-grade copper ores characterized by heterogeneous internal and external component distribution, diffuse reflection methods can only yield near-surface compositional data, proving inadequate for effective classification.
The X-ray transmission (XRT) method effectively penetrates ores, providing insight into their internal structural composition. This highly efficacious sorting technique proficiently classifies various ores, including tungsten [10,11]. Existing XRT-based sorting technologies are categorized by their operational principles into single-energy X-ray transmission (SE-XRT), dual-energy X-ray transmission (DE-XRT) and multi-energy X-ray transmission (ME-XRT) [12]. SE-XRT, among the earliest developed technologies, employs a single-energy X-ray source to analyze different ores based on their distinct X-ray absorption profiles and is widely adopted due to its simplicity and cost-effectiveness. Nevertheless, the inherent properties of copper ores, including their uniquely fine particle size distribution, intricate mineralogical composition, and complex intergrowth and associative patterns, render a single energy spectrum insufficient for effective discrimination from waste rock. In contrast, ME-XRT provides comprehensive analytical capabilities but requires advanced high-performance computing systems and incurs substantial costs.
In this work, we propose leveraging DE-XRT to effectively distinguish low-grade copper ores from waste rock due to its optimal balance between operational costs and the ability to handle complex sorting tasks. Specifically, we employ dual-energy X-ray imaging, treating high- and low-energy spectral images as distinct modalities. We then utilize multi-modal learning to fuse the characteristics of both high- and low-energy spectra for copper ore/waste rock classification. To achieve this, we designed an efficient dual-tower structure based on a lightweight convolutional neural network (CNN) to extract features from the high- and low-energy spectral images, which are then fused and input into a classifier built upon the emerging multi-layer Kolmogorov-Arnold network (KAN) [13] for final categorization.
Due to the scarcity of publicly available datasets specifically curated for copper ore/waste rock classification, we compiled a dataset comprising 31,057 copper ore and waste images, upon which we conducted extensive evaluations. Without bells and whistles, our methods achieved competitive or superior classification performance compared to existing mainstream networks, while requiring only 1.32 M parameters. Overall, our main contributions are as follows:
  • We suggest using DE-XRT to classify low-grade copper ores and wastes and construct a dual-energy spectral image dataset of copper ores. Multi-modal learning is utilized by treating the differences between high-energy and low-energy spectral images as distinct modalities.
  • We developed an efficient and lightweight dual-tower network that effectively integrates information from both energy spectra and employs a robust multi-layer KAN as a classifier. This architecture not only reduces computational costs and enhances operational efficiency but also improves sorting accuracy.
  • We curated a dataset of 31,057 dual-energy spectrum image pairs for copper ore and waste. Our proposed method achieves competitive or superior classification performance compared to mainstream networks, all while maintaining a remarkably compact model size of merely 1.32 M parameters.

2. Related Works

The effectiveness of photoelectric sorting algorithms for low-grade ores is highly contingent upon the mineralogical composition of a given deposit [14], and no single method offers universal applicability. In recent years, a variety of innovative approaches have been developed to address the classification of different mineral types. These methods can be broadly divided into two categories: feature engineering-based techniques and feature learning-based techniques.

2.1. Feature Engineering-Based Methods

Early approaches primarily leveraged manually engineered features alongside conventional machine learning techniques for ore/waste rock classification. For instance, Ebrahimi et al. [6] employed a multi-criteria decision-making approach to extract color and shape features of ores, and, in conjunction with the analytic hierarchy process (AHP), successfully classified 16 types of minerals using an artificial neural network (ANN). Zhu et al. [15] utilized the TESCAN Integrated Mineral Analyzer to analyze the composition of rare earth niobium-iron polymetallic minerals and performed ore classification through principal component analysis (PCA). Shatwell et al. [7] extracted color features using color statistics and PCA, and texture features via wavelet transform, subsequently employing ANN to classify rocks in gold and silver mines.
With the advancement of optoelectronic sorting technologies, researchers have progressed beyond surface feature extraction by incorporating additional spectral information to enhance classification accuracy. For instance, Chen et al. [16] achieved the classification of seven ore types by integrating a visible light and short-wave infrared imaging system with a support vector machine (SVM) classifier. Akbar et al. [17] employed linear spectral unmixing on hyperspectral images to estimate ore grades within sampling intervals and utilized a gradient boosting classifier (GBC) to differentiate ore from waste. Windrim et al. [18] addressed ore and waste rock classification in open-pit mines by applying dimensionality reduction to high-dimensional hyperspectral reflectance images, followed by K-Means clustering.
Despite the reasonable accuracy of these feature engineering-based approaches, they are heavily dependent on manual feature extraction and expert knowledge, which limits their adaptability, robustness, and generalizability in complex, real-world mining environments.

2.2. Feature Learning-Based Methods

Deep learning methods, especially CNNs, have shown superior performance in mineral image classification by automatically learning hierarchical features from raw data, thus eliminating manual feature engineering. For example, Liu et al. [19,20,21] systematically studied factors such as moisture content, model structure, and attention mechanisms to optimize CNN-based ore and coal image classification. Abdolmaleki et al. [22] combined hyperspectral remote sensing with deep learning for real-time ore/waste classification, while Chu et al. [23] used deep neural networks to analyze LIBS data for soil sample classification.
In very recent years, the Transformer architecture [24] has demonstrated remarkable superiority in natural language processing (NLP) due to its powerful long-term contextual modeling capabilities, subsequently inspiring its application in computer vision [25,26]. Consequently, a series of studies have explored the integration of Transformer models for mineral classification tasks. For example, Liu et al. [27] proposed the OreFormer method, which combines the local feature extraction capability of CNNs with the global attention mechanism of Transformers, achieving excellent performance in fine-grained coal classification. Similarly, Qiu et al. [9] leveraged the green fluorescence produced by ultraviolet irradiation of uranium ore and applied the Swin Transformer [26] to enhance uranium ore sorting.
It is well-established that feature learning-based methods are data-hungry, making data augmentation a conventional strategy. For instance, Zhou et al. [28] employed data augmentation and transfer learning techniques, utilizing five CNN models for weight acquisition, which effectively enhanced classification performance alongside model robustness and generalization ability. To further address the scarcity of sufficiently labeled data in the recognition and classification of visual ore images, Liu et al. [29] proposed three data augmentation methods based on generative adversarial network (GAN) [30] to synthesize high-fidelity ore images closely resembling real samples. Their experimental results indicate that this strategy significantly optimizes downstream sorting tasks and effectively improves the accuracy of most CNN models.
Despite the relatively high classification performance of the aforementioned methods across various ore systems, none are specifically designed for copper ore-waste sorting. The limited research dedicated to copper ore sorting primarily focuses on post-grinding stages [31,32] or higher-grade copper ores [33], where the observation and classification of copper ore particles are relatively straightforward. To our knowledge, an effective sorting method for low-grade copper ore/waste fragments remains unavailable.

3. Methodology

This section outlines the primary methodology of our ore separation algorithm. Specifically, to address the copper ore/waste rock sorting task in industrial settings, we propose a novel lightweight dual-tower CNN. This network performs feature learning and fusion, leveraging dual-energy spectral information for ore classification. The network comprises two parallel branches, each based on an identical convolutional neural network architecture, dedicated to processing data from both high- and low-energy spectra. The backbone of each branch integrates the improved residual modules and attention mechanism to enhance feature extraction. The algorithm’s overall framework is illustrated in Figure 1, and its components based on residual module and attenions will be elucidated in detail below.

3.1. The Improved Residual Module

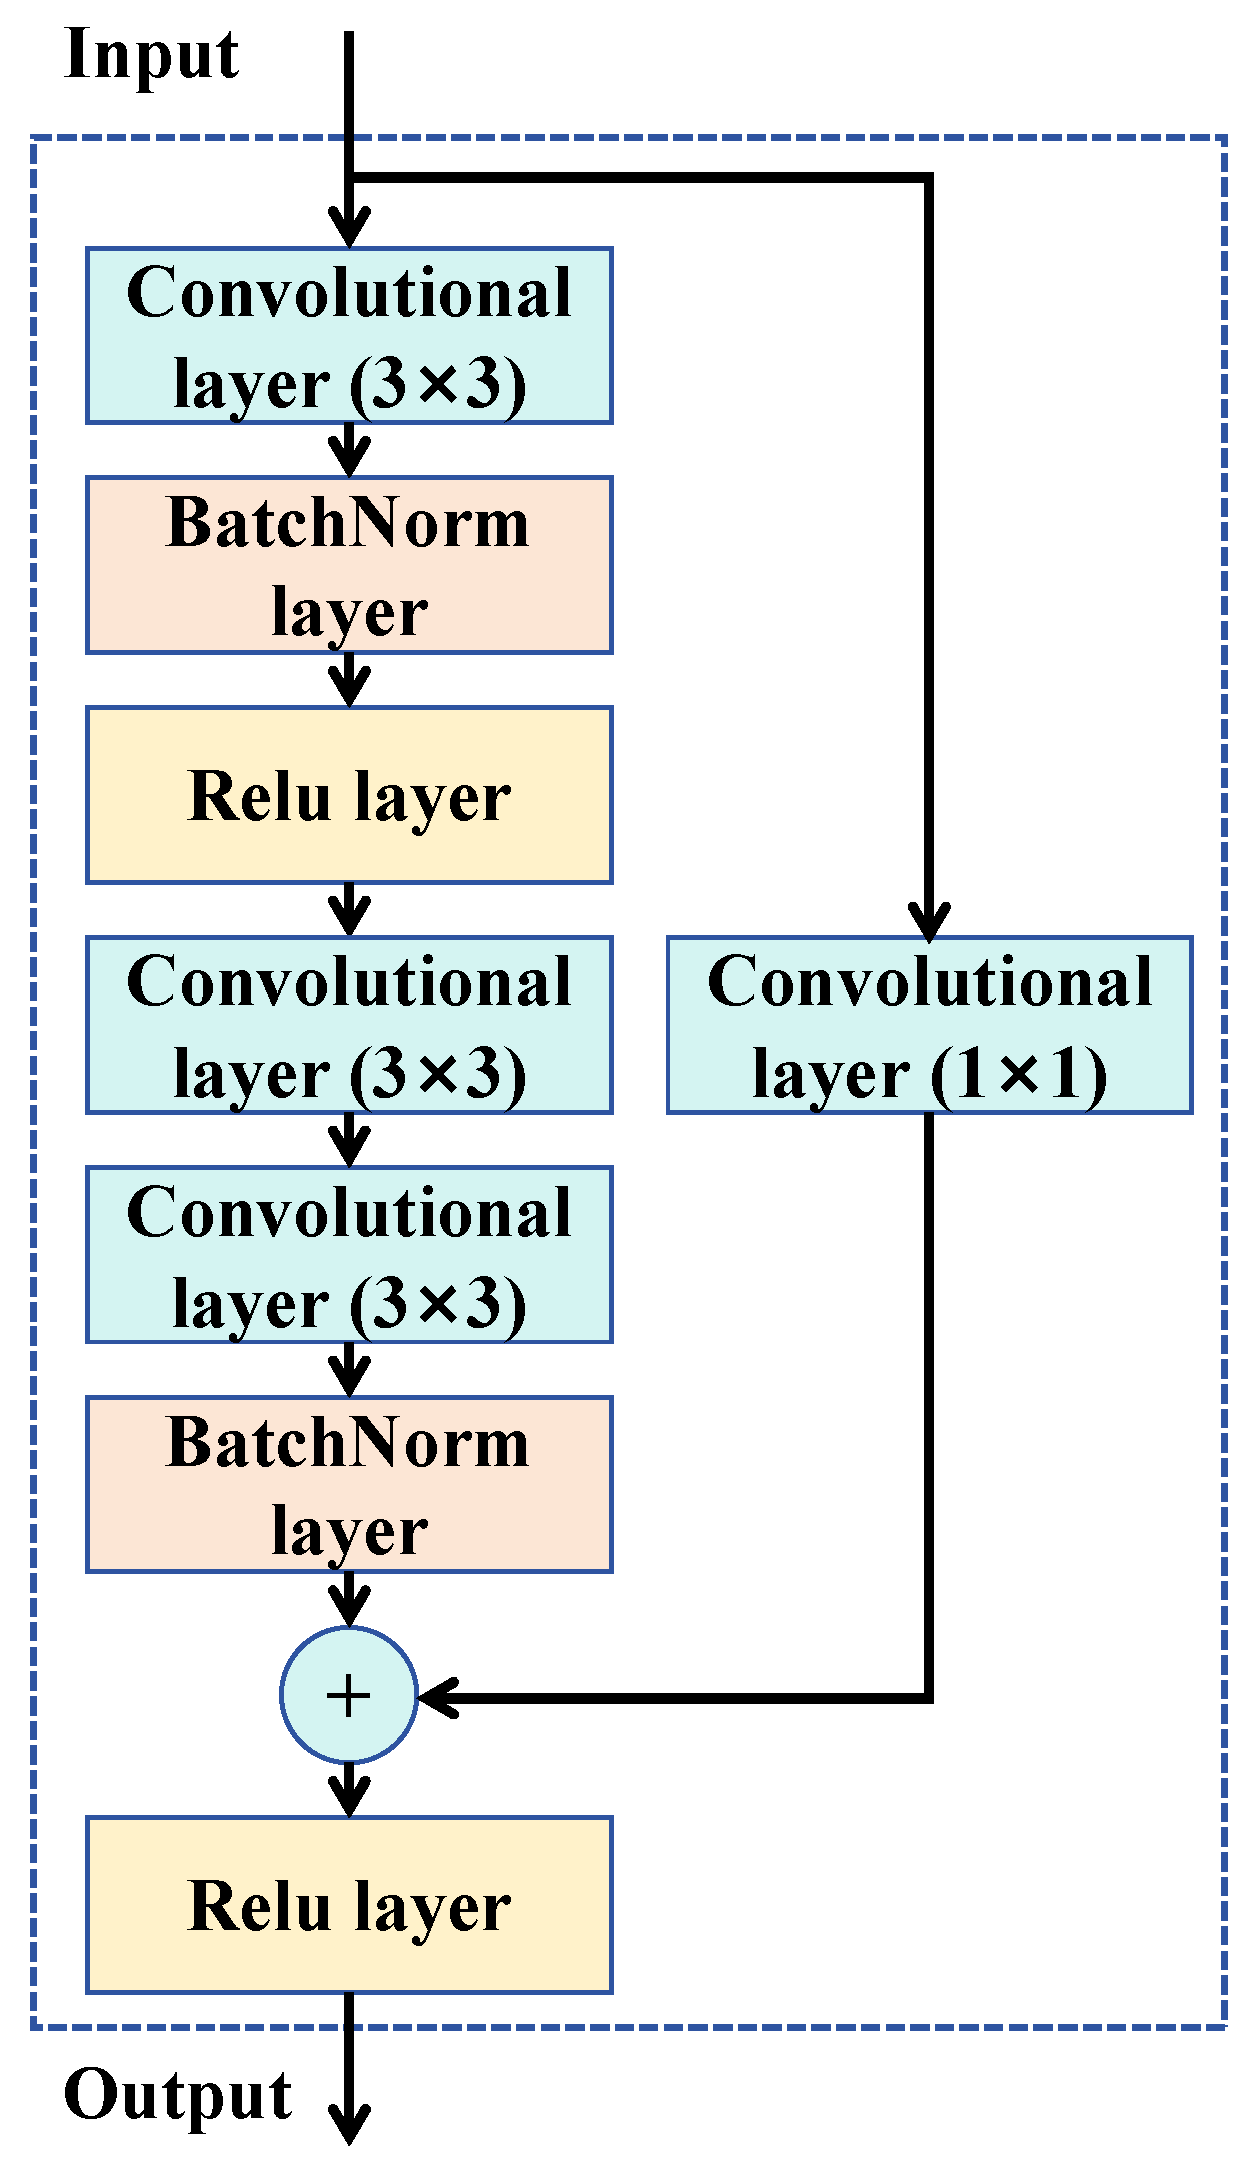
The well-known residual module, introduced by He et al. [34], is predicated on directly propagating the input x to the output via an identity mapping. Concurrently, the network endeavors to learn a residual function F ( x ) designed to rectify any shortcomings in the input x. Consequently, the network’s output can be expressed as y = F ( x ) + x , where F ( x ) denotes the residual function, x represents the input, and y signifies the output. This module effectively mitigates issues such as vanishing and exploding gradients, thereby enhancing both the training speed and accuracy of the model.
In addition, when the dimension of the output changes, that is, when the number of channels in the input feature map does not match the number of channels in the output feature map, the input and output cannot be directly added. The residual module will use the strategy of shortcut connection to solve this problem. It uses a projection operation. We adopt the method of passing the input x through a 1 × 1 convolutional layer to match the dimensions of the input and output.
Traditional residual blocks typically utilize uniform 3 × 3 convolutions, which may constrain their capacity to capture multi-scale features. To address this limitation, we enhance the basic residual module by incorporating multi-scale perception. As illustrated in Figure 2, the improved residual block is mathematically defined as:
F ( x ) = R ( C 2 ( R ( C 1 ( x ) ) ) + x ) ,
where C 1 ( · ) and C 2 ( · ) denote 3 × 3 and 5 × 5 convolutional layers, respectively, R ( · ) is the ReLU activation, and x is the input. For computational efficiency, the 5 × 5 convolution can be replaced by two consecutive 3 × 3 convolutions, reducing parameters from 25 to 18.

3.2. Attention Mechanism

Currently, the attention-based Transformer architecture dominates the field of image classification due to its exceptional flexibility and scalability. However, its reliance on large-scale training data, increased training complexity, and substantial model size render it less suitable for ore separation tasks. In contrast, CNN excel at capturing fine-grained image details, making them more appropriate for this application. This work, therefore, integrates a sophisticated attention mechanism into a CNN-based framework. Recognizing that a singular attention mechanism is often insufficient to comprehensively capture the intricate internal features of ore imagery, we employ a combined channel-spatial attention module. Particularly, in each branch, channel attention and spatial attention are sequentially introduced, which is formulated as follows:
T ( x ) = C A ( x ) x ,
A ( x ) = S A ( T ( x ) ) T ( x ) ,
where C A ( · ) and S A ( · ) represent channel and spatial attention operations, respectively, and T ( x ) denotes the feature map refined by channel attention, while A ( x ) is the final output after the subsequent application of spatial attention.
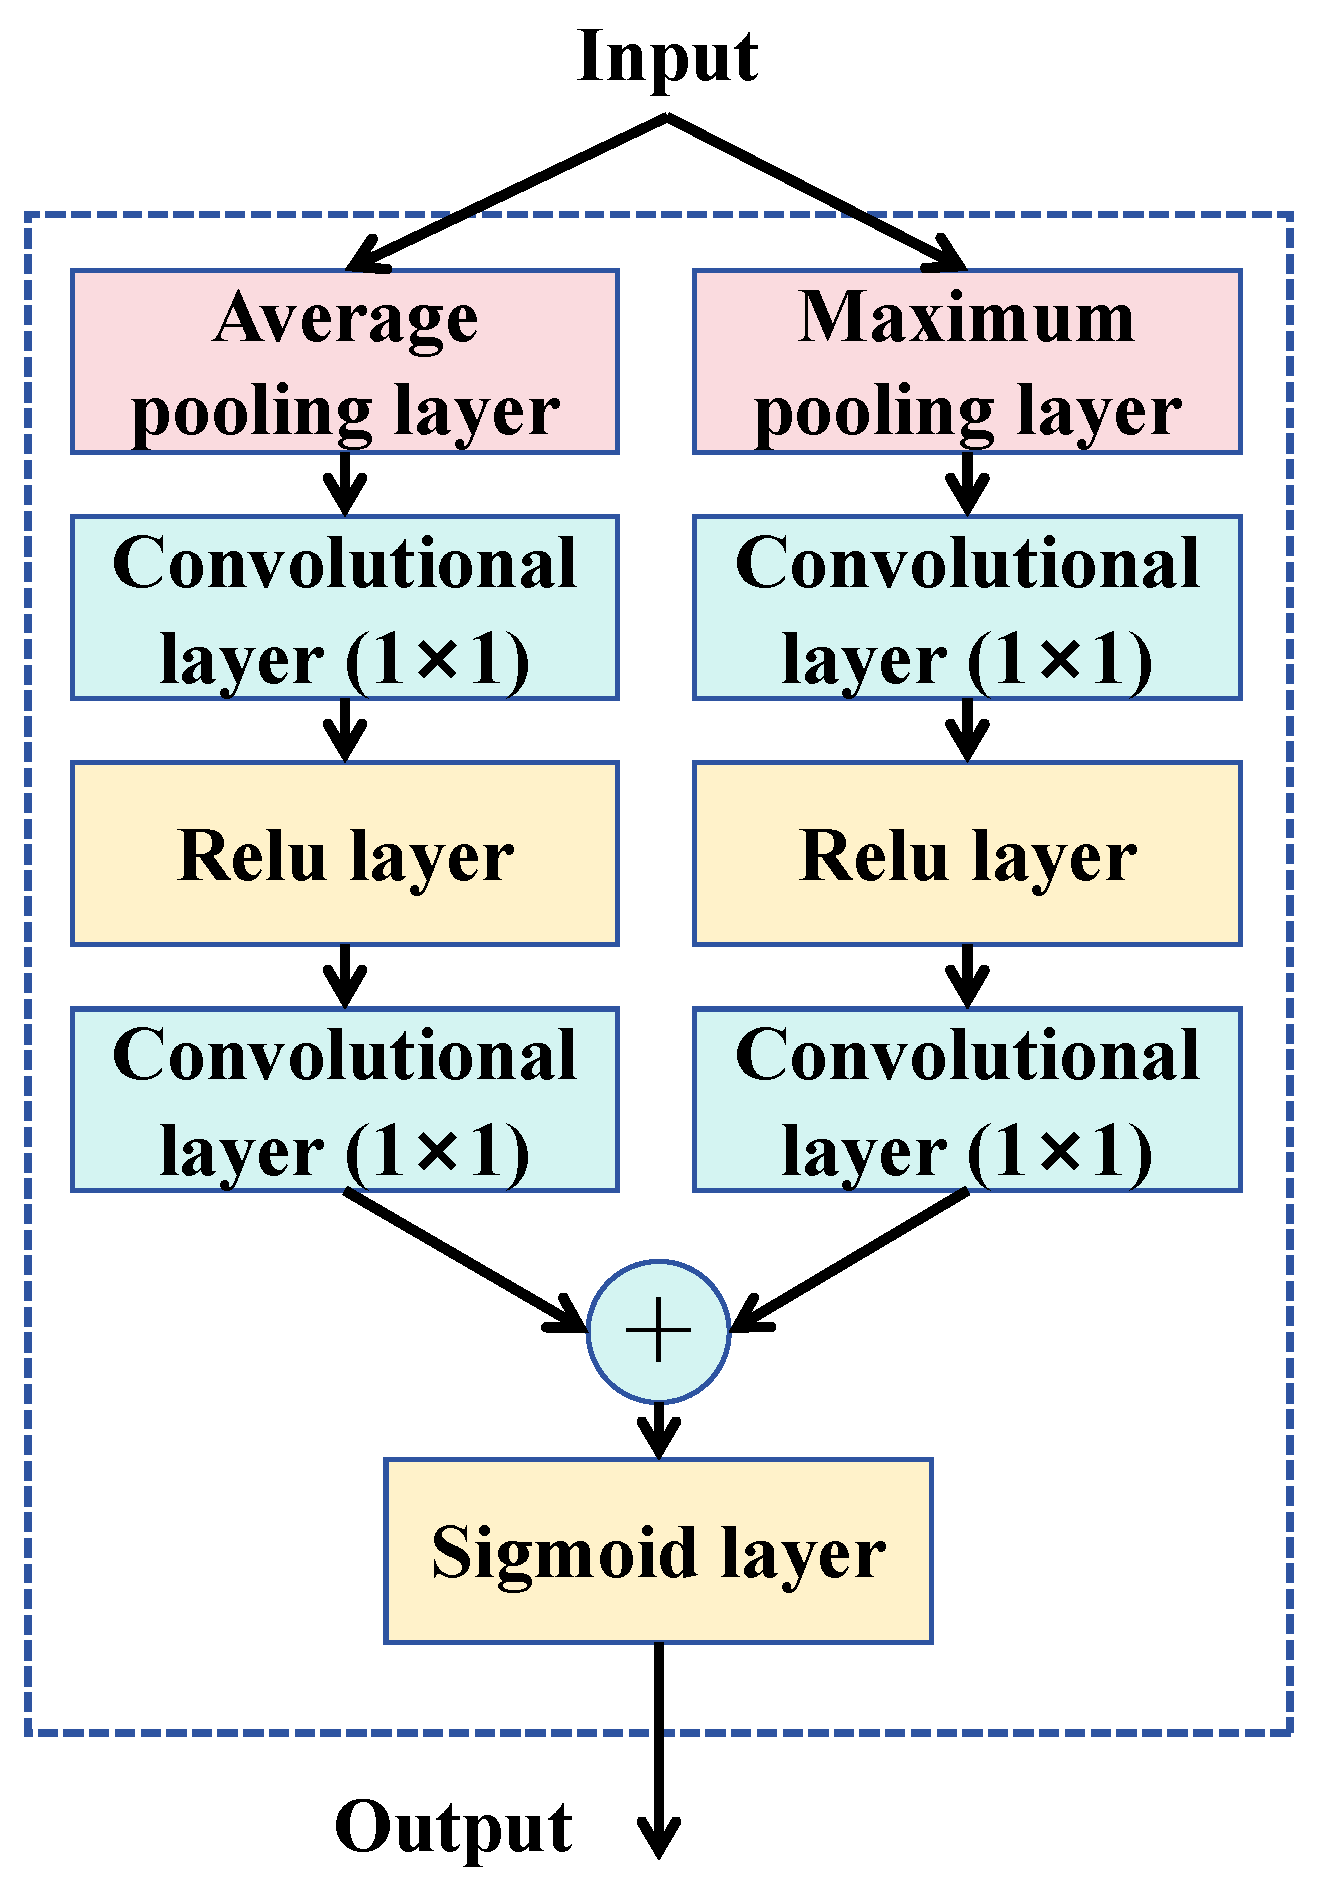
The channel attention mechanism, illustrated in Figure 3, initially computes the average and maximum values for each channel within the input feature map through adaptive average pooling and max pooling, respectively, thereby capturing global channel-wise information. These pooled features subsequently undergo compression via a 1 × 1 convolutional layer, followed by a ReLU activation to introduce nonlinearity. Subsequently, an additional 1 × 1 convolution restores the original channel dimension, yielding channel-wise weights. The weights derived from both average and max pooling are then summed to acquire comprehensive channel importance scores, which are subsequently normalized to the range [ 0 , 1 ] using a sigmoid activation function. This channel attention map is then multiplied element-wise with the original feature map, thereby enhancing salient features while attenuating less informative ones. The entire process can be represented as follows:
C A ( x ) = σ ( C ( R ( C ( AvgPool ( x ) ) ) ) + C ( R ( C ( MaxPool ( x ) ) ) ) ) ,
where C ( · ) represents a 1 × 1 convolutional layer and σ ( · ) is the Sigmoid activation function. AvgPool ( · ) and MaxPool ( · ) signify average-pooling and max-pooling operations, respectively.
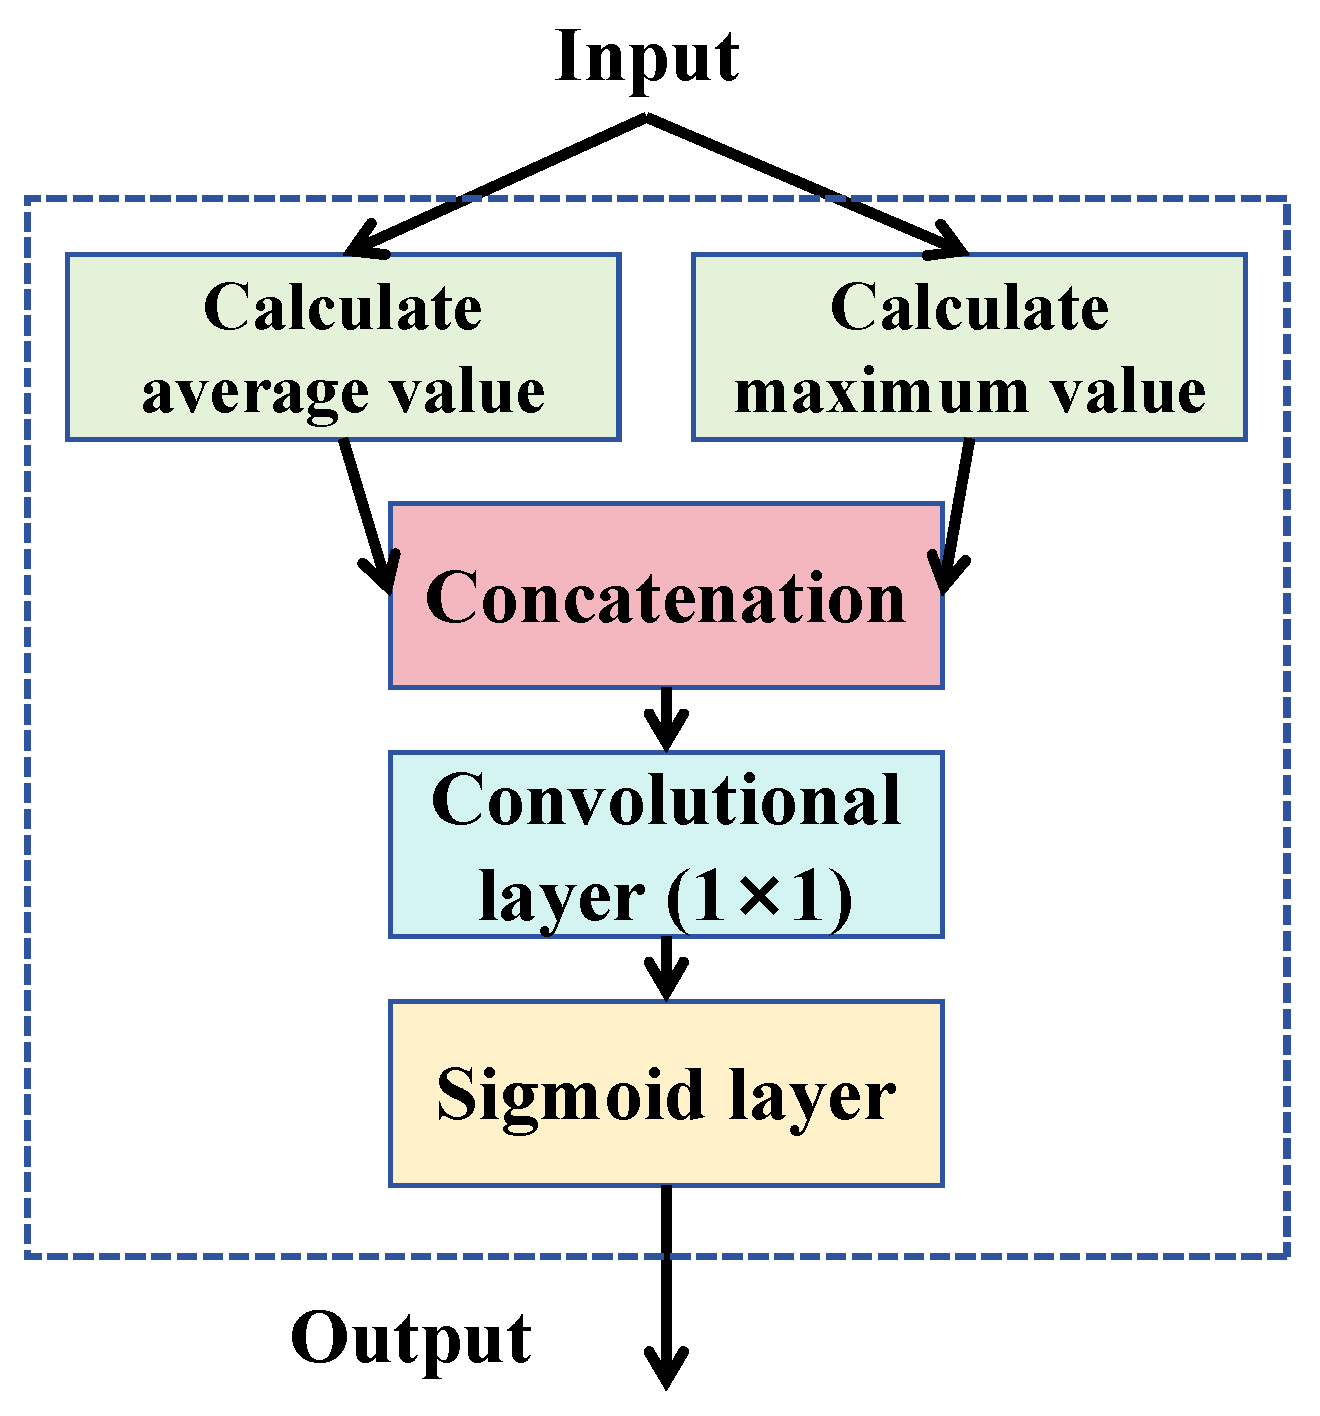
The spatial attention mechanism, as shown in Figure 4, first computes the average and maximum values across the channel dimension for each spatial location, capturing global spatial statistics. These two feature maps are concatenated along the channel axis and passed through a convolutional layer to produce a single-channel spatial attention map. Finally, a sigmoid activation function is applied to generate the spatial attention weights, which are used to refine the feature map by emphasizing informative spatial regions.
S A ( x ) = σ ( C ( [ ChannelAvg ( x ) ; ChannelMax ( x ) ] ) ) ,
where ChannelAvg ( · ) and ChannelMax ( · ) compute the mean and maximum values along the channel dimension, and [ · ; · ] denotes the concatenation operation.

3.3. Dual-Energy Spectrum Fusion

After individually extracting features from both high and low energy spectral images, we integrate them to formulate a comprehensive representation of copper ore/waste rock. For dual-energy spectrum XRT technology, its low-energy X-rays mainly undergo photoelectric effects with the inner electrons of the substance’s atoms, and the absorption coefficient is directly proportional to the atomic number. High-energy X-rays mainly undergo Compton scattering with the outer electrons of substances, and the absorption coefficient is related to the electron density. The intensity of the low-energy spectrum rays used is 100 kV and that of the high-energy spectrum is 200 kV. We will utilize the complementary information inherent in these two different energy spectra and enhance the expressive and generalization capabilities of the model through information integration.
Fusion methodologies can be broadly categorized into data-level, feature-level, decision-level, and hybrid approaches. Data-level fusion, an early fusion technique, involves the direct amalgamation of data from disparate modalities prior to feature extraction. However, this method often entails a loss of modality-specific information. Feature-level fusion, conversely, combines features from different modalities subsequent to their extraction. While this approach effectively utilizes individual modality features, it incurs a relatively high computational cost. Decision-level fusion consolidates the outputs of various modalities at the model’s terminal stage. Although this strategy preserves the independent information of each modality, it may necessitate a more intricate model architecture for processing. The hybrid fusion method is the most difficult to implement. It usually combines the previous several methods for fusion.
In light of these considerations, we have opted for a hybrid fusion methodology that integrates information at both the data level and feature level. At the data level, images from the two energy spectra undergo addition and subtraction operations prior to their ingestion into the model; these are then fed into their respective dual branches for feature extraction. Subsequently, at the feature level, the extracted feature outputs from the two sub-networks are fused, either through simple addition or concatenation, before being passed to the final classification layer.

3.4. KAN-Based Classifier Utilizing Chebyshev Polynomials

Multi-layer KANs [13] represent a novel neural network architecture derived from the Kolmogorov-Arnold representation theorem. This architecture distinguishes itself by incorporating learnable activation functions on the edges of network connections, a departure from the traditional placement on the nodes of multi-layer perceptrons (MLPs). Adaptive nonlinear transformation is achieved through B-spline parameterization. The core approach is to replace the linear weights with the learnable 1D function ϕ l , j , i , where the nodes only perform summation operations and adopt grid expansion and sparsification techniques to improve accuracy and interpretability. The calculation formula of the network layer is as follows:
x l + 1 , j = i = 1 n l ϕ l , j , i ( x l , i ) ,
among them, ϕ l , j , i is the learnable function of B-spline parameterization, x l , i is the activation value of the i-th node of the l-th layer, and x l + 1 , j is the value of the j-th node in the next layer.
Given the inherent characteristics of classification tasks and considering the global orthogonality of Chebyshev polynomials, more efficient nonlinear transformations can be realized at node positions. Drawing inspiration from ChebyKAN [35], this work leverages the basis function T K ( x ) in the iterative form of the K-order Chebyshev polynomial rather than the original B-spline parameterization. The Chebyshev polynomial is defined by the recurrence relation:
T 0 ( x ) = 1 , T 1 ( x ) = x , T K ( x ) = 2 x T K 1 ( x ) T K 2 ( x ) ,
here x R 1 × d represents the fused d-dimensional feature. By multiplying the basis functions T ( x ) with learnable coefficients W R d × O × ( K + 1 ) , the classifier’s prediction Φ ( x ) is obtained:
Φ ( x ) [ o ] = k = 0 K q = 1 d W [ q , o , k ] · T k ( x ) [ q ] ,
where K is the highest order of the Chebyshev polynomial, O represents the dimension of the prediction result, [ · ] denotes the indexing operation, and T k ( x ) [ q ] indicates that the Chebyshev basis function is applied to the q-th component of x. This formulation allows for efficient and flexible classification by leveraging the properties of Chebyshev polynomials, which are particularly well-suited for tasks requiring global orthogonality and nonlinear transformations.

4. Results and Discussion

4.1. Experimental Setting

Experimental dataset. We meticulously assembled a dataset comprising 31,057 pairs of dual-energy spectrum images of copper ore and waste rock, of which 19,175 image pairs belong to low-grade copper ore, and 11,882 to waste rock. Each ore specimen includes both its high and low energy spectrum images. These ores are all chalcopyrite, and the data calibration was mainly carried out through manual observation, supplemented by XRF instrument scanning. Diverging from conventional 8-bit deep color RGB three-channel images, the dual-energy spectrum images we acquired are single-channel, 16-bit deep grayscale images, preserved in TIFF format. The dataset was randomly partitioned into training (train), validation (val), and test (test) subsets at a ratio of 7:1.5:1.5. The final distribution of the dataset is detailed in Table 1. We conducted the comparative experiments on the test subset while the train and val subsets are used for training and ablation studies, respectively.
Implementation Details. We initialized the proposed dual-tower network using the Kaiming method [36]. During the training process, the cosine annealing algorithm is adopted as the learning rate scheduler. The initial learning rate is set to 3 × 10 5 , the minimum learning rate is set to 3 × 10 6 , the batch size is 64. Training extended for 200 epochs. The Adam optimizer was utilized, and the loss function was the standard categorical cross-entropy. For the KAN classifier, we selected a 6th-order Chebyshev polynomial as the basis function.
Evaluation metrics. To conduct quantitative evaluations, we employed standard metrics derived from the confusion matrix, specifically Accuracy, Recall, Precision, F1-score (F1), and the Area Under the Receiver Operating Characteristic curve (AUC). Accuracy is the most intuitive performance measure, representing the proportion of samples correctly classified by the model to the total number of samples, which is defined as follows:
Accuracy = T P + T N T P + T N + F P + F N ,
where T P (True Positive) is the number of positive samples correctly predicted as positive, T N (True Negative) is the number of negative samples correctly predicted as negative, F P (False Positive) is the number of negative samples incorrectly predicted as positive, and F N (False Negative) is the number of positive samples incorrectly predicted as negative.
Precision gauges the proportion of samples predicted as positive (ores) by the model that are indeed positive, while Recall assesses the proportion of all actual positive samples (ores) that are correctly identified by the model. The F1-score (F1) is the harmonic mean of precision and recall, which is used to comprehensively consider both. Their calculation can be obtained as follows:
Precision = T P T P + F P , Recall = T P T P + F N , F 1 = 2 × Precision × Recall Precision + Recall .
The AUC represents the total area beneath the Receiver Operating Characteristic (ROC) Curve that graphically illustrates the relationship between the true positive rate and the false positive rate of a classification model across varying thresholds. A higher AUC value signifies a stronger discriminative capability of the model between positive and negative instances.

4.2. Comparative Experimental Results

We evaluated our method against several prominent image classification networks, including AlexNet [37], VGG [38], ResNet [34], MobileNet V3 [39], EfficientNet V2 [40], ConvNeXt [41], ViT [25], and Swin Transformer [26]. These models were chosen for their widespread adoption and proven efficacy in image classification tasks. The results of these comparative experiments are detailed in Table 2, which elucidates the classification performance of the above model and the method we proposed on the dual-spectrum dataset, as well as the number of parameters of each method.
In addition, to meet the input requirements of the model mentioned above and the actual situation of the dual-energy spectrum dataset, we take the high-energy spectrum, low-energy spectrum, and the difference between the high- and low-energy spectra as the first, second, and third channels of the model input image, respectively. We maintain the network structure of the existing methods and avoid reconfiguring them as dual-branch networks, as their inherent high parameter counts would result in overly large models. To ensure experimental rigor, all experiments were conducted three times with varied random seeds.
The results of the comparative experiments show that our method achieves the highest performance in all indicators except the recall rate, which fully demonstrates its effectiveness. In addition, we can also observe a phenomenon that the classification performance of the model is basically positively correlated with the number of parameters in the network. The classification performance of networks with a large number of parameters, such as VGG-16 and ViT-Base, is better than that of the more advanced ResNet-34 and Swin-Tiny in the same period, respectively. However, our method breaks this rule through a dual-branch architecture and a unique modal fusion approach. Not only has the number of our network parameters been reduced to 1.32 M, but even compared with the highly effective lightweight network MobileNet V3, the classification performance of our method has basically been comprehensively surpassed.

4.3. Ablation Studies

We further conduct a series of ablation studies on the val subset to analyze the proposed modules and discuss their details subsequently.
Dual-energy spectrum dataset. We first analyzed the classification results obtained using a single energy spectrum on our network. We add a classification header behind a single branch network for classification. When testing the dual-spectrum dataset, we employed the proposed hybrid fusion method. After the combination, instead of using a KAN-based classifier, we only used one layer of MLP for classification to fairly compare the results of learning a single spectrum with a single branch.
It can be clearly found from Table 3 that the results obtained on our network using the dual-energy spectrum dataset are better than those of any single-energy spectrum dataset. And the classification results of using low-energy spectrum datasets alone are superior to those of using high-energy spectrum datasets alone. This might be due to the relatively strong energy of high-energy spectrum rays, resulting in fewer learnable features contained in the image.
High- and low-energy spectrum image fusion strategy. We analyze the effectiveness of the proposed hybrid fusion strategy by comparing it with other common fusion methods, including data-level fusion, decision-level fusion, and feature-level fusion. Specifically, data-level fusion involves inputting the high and low energy spectrum images as the first and second channels of a new image into a single-channel branch (modifying the convolution of the first layer to adapt to the input, thus eliminating the need for a doublechannel branch), and then adding a classification head after the branch for classification. Decision-level fusion involves adding a classification header after each branch and finally inputting the initial classification results of the two branches into the classifier. Feature-level fusion involves adding up the features extracted from each branch and then inputting them into a classifier for classification.
Hybrid fusion is the method proposed in this paper, where the data of high and low energy spectra are, respectively, added and subtracted and then input into different branches. Finally, the features extracted through the branch network are added and input into the classifier for classification. The classifier used in the current experiment is a twolayer Kan classifier. The results of these experiments are presented in Table 4. Similarly, we repeated each experiment three times by changing the random number seeds to ensure the rigor of the experiment.
It appears that models employing more intricate fusion methodologies are better able to discern the essential characteristics of the ore. While this does lead to a marginal increase in model parameters, it is entirely justified by the corresponding enhancement in performance. Notably, the hybrid fusion approach yields an approximate 1% improvement in the AUC metric compared to the simpler decision-level fusion. Furthermore, both Accuracy and Precision achieve their highest values, unequivocally demonstrating the efficacy of our chosen multimodal fusion method.
Multi-layer KAN-based classifier. We further investigated the efficacy of our multilayer KAN-based classifier. Table 5 presents the performance of standard MLP classifiers and multi-layer KAN-based classifiers across varying numbers of layers. We observed a general trend of performance improvement with an increased number of layers for both classifiers. Specifically, the MLP classifier achieved its optimal performance at four layers, whereas the KAN-based classifier peaked at six layers. Notably, the two-layer KAN-based classifier exhibited performance significantly superior to that of the MLP classifiers, thereby underscoring the advantages of the KAN classifier. Given that our extracted features had a dimension of 128 and the KAN classifier design incorporated dimensionality reduction by halving the dimension at each successive layer, the maximum feasible number of layers for the KAN classifier was six. Consequently, a six-layer KAN was selected as the final classifier.

4.4. Visualization

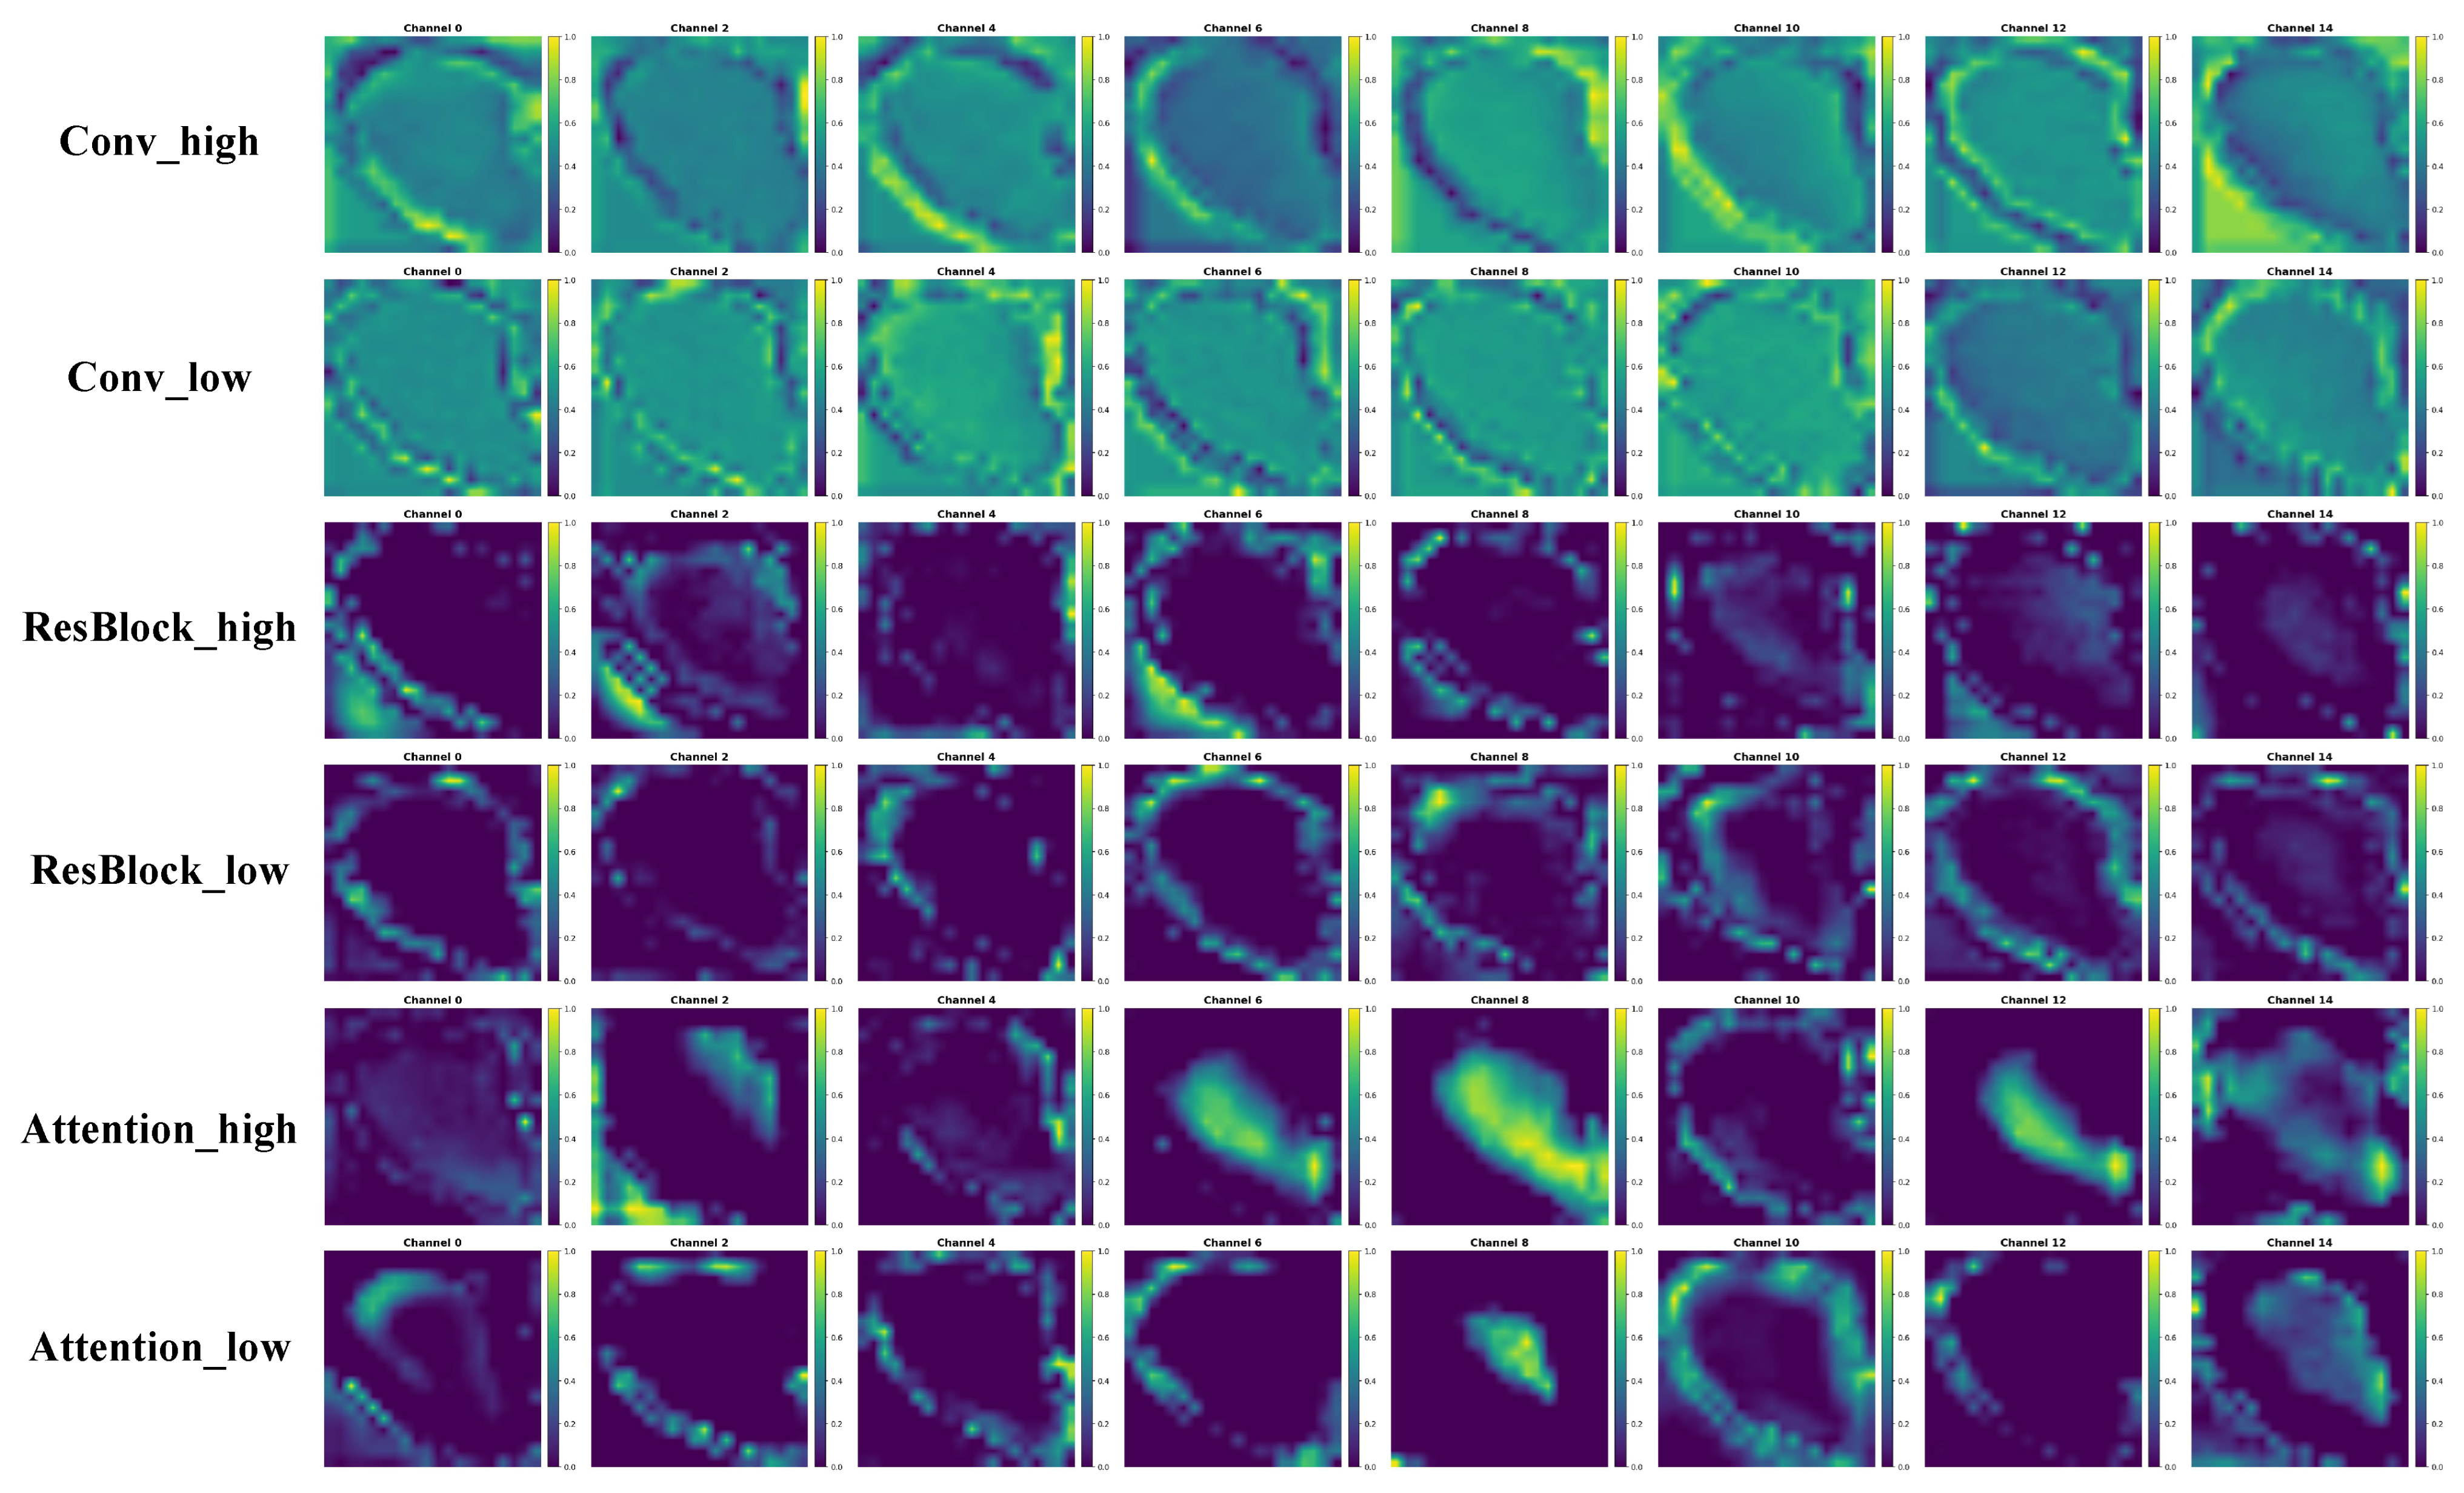
The interpretability of a neural network’s feature learning during classification can be enhanced through the visualization of intermediate feature maps. In this study, a channel visualizer employing deconvolution and directed backpropagation algorithms was utilized to illuminate the “black box” nature of the model’s training process. Figure 5 presents the channel visualization diagram of our network on the given dataset.
The visualization results indicate a progressive attenuation of the ore image’s contour feature representation as the network depth increases. At the initial Conv layer, ore contours are distinctly prominent, although internal information appears more abstract, and the contrast of green fluorescence intensity is diminished. In the intermediate stages, the ore image’s contrast is enhanced, its external contours become progressively smoother, and a greater wealth of internal features is preserved. Ultimately, within the Attention layer, the ore’s outline largely dissipates, giving way to the prominence of its internal information.
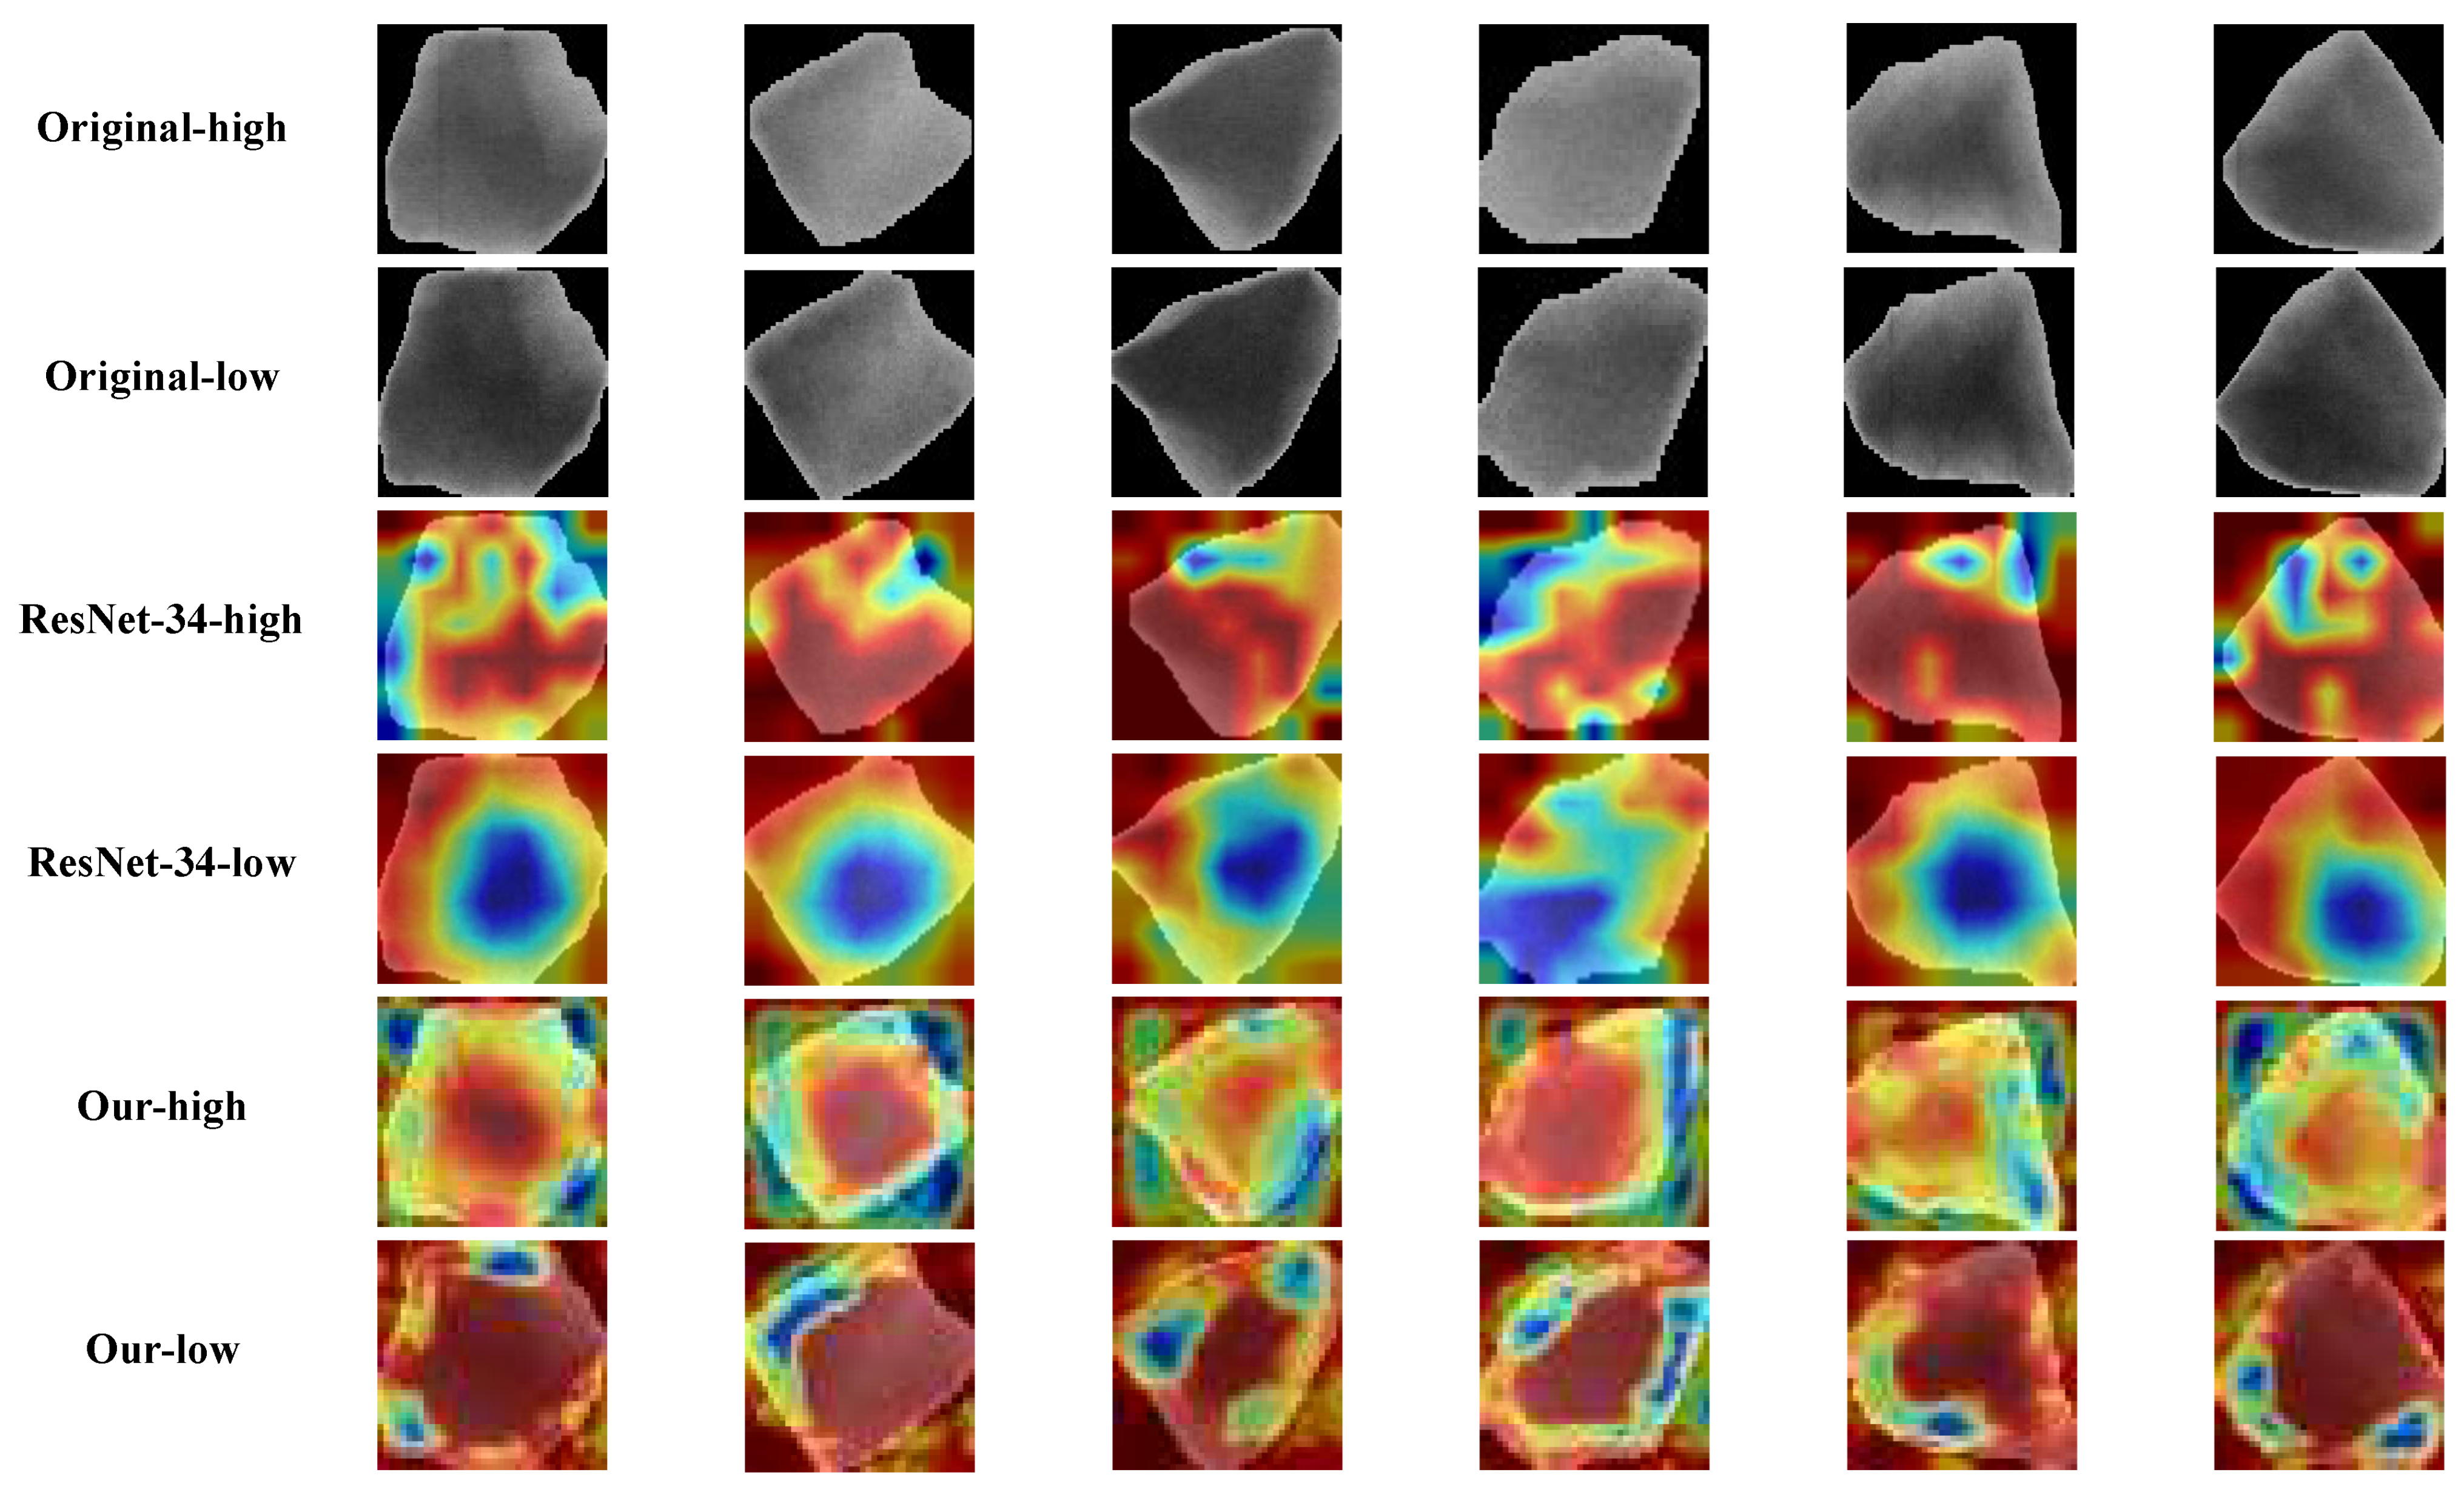
To visually corroborate the model’s proficiency in copper ore classification, we employed the Grad-CAM method [42] to visualize the layer preceding the classification output. For comparative analysis, the ResNet-34 network was simultaneously visualized using the same methodology. The resultant visualizations are depicted in Figure 6. In Grad-CAM generated heatmaps, color encoding serves to visually articulate the salience of distinct image regions in influencing the model’s classification decisions. A gradient color mapping, such as the jet colormap, is conventionally employed, wherein red signifies highly active areas that exert a substantial positive contribution to the prediction of the target category, while blue denotes regions of low or negligible contribution.
It can be found from the visualized heat map that the ResNet network performs relatively well in feature extraction on high-energy spectrum images and pays little attention to edge information. However, on low-energy spectrum images, it fails to focus on the most important internal structure information and mainly learns the information near the edge, resulting in the relatively low performance of this network. Compared with other networks, our model can focus more on learning the internal structural information of ores at low energy spectra to make effective classifications. In contrast, at high energy spectra, it might be because the energy is too strong and penetrates most of the atoms, resulting in the learned internal features not being very obvious.

5. Conclusions

This paper introduces a novel approach for copper ore/waste rock separation, leveraging dual-energy spectral imaging in conjunction with multi-modal learning to address the challenges of low-grade copper ore sorting. The principal findings of this study are summarized as follows:
(1)
The experimental results show that the fusion of dual-energy spectral image data significantly improves the classification performance of the model. Compared with the various indicators of the single energy spectrum, although the recall rate has slightly decreased, the average of the other four indicators has increased by approximately 1%. Furthermore, our model achieves the optimal comprehensive classification performance when the number of parameters is only 1.32 M (only 6.2% of ResNet-34). This result fully demonstrates the potential and effectiveness of the dual-energy spectral image combined with multi-modal learning method in the sorting of copper ore/waste rock.
(2)
The slightly poor performance of the model on high-energy spectrum data might be caused by the improper selection of the energy spectrum. The strong penetration ability of high-energy spectrum X-rays may lead to the loss of effective information in the image, thereby affecting the classification effect. Limited by the conditions of data collection, experiments with more energy spectrum data have not been conducted. However, the existing results have shown that the multi-energy spectrum classification method has great potential. In the future, by choosing a more appropriate energy spectrum image dataset, it is expected that the model performance will be further improved.
(3)
Through extensive visualizations, we have gained an in-depth understanding of the classification mechanism of the model. The visualization results show that the model is more inclined to classify by using the internal structure information of the ore rather than the external contour.
(4)
Although the classification method based on dual-spectral images is effective, its data collection difficulty and cost are relatively high, and the cost is higher than that of the general SE-XRT method. Therefore, exploring simpler and more efficient network structures and modal fusion methods, as well as testing more effective energy spectra, are the key directions for the optimization and improvement of this method.

Author Contributions

Conceptualization, Y.L., X.T. and Z.G.; methodology, X.G., X.M. and Y.L.; software, X.G.; validation, X.M., Y.L. and X.T.; formal analysis, Y.L., X.T. and Z.G.; investigation, Y.L.; resources, X.M. and Z.G.; data curation, X.G. and X.M.; writing—original draft preparation, X.G.; writing—review and editing, X.M. and Y.L.; visualization, X.G.; supervision, Y.L., X.T. and Z.G.; project administration, Y.L., X.T. and Z.G.; funding acquisition, Y.L., X.T. and Z.G. All authors have read and agreed to the published version of the manuscript.

Funding

This research was funded by the National Key Research and Development Program of China under Grant 2023YFC3904201.

Data Availability Statement

The source code is available at https://github.com/csu-guoxiao/copper.

Conflicts of Interest

The authors declare that they have no known competing financial interests or personal relationships that could have appeared to influence the work reported in this paper.

References

  1. Yin, S.h.; Chen, W.; Fan, X.l.; Liu, J.m.; Wu, L.B. Review and prospects of bioleaching in the Chinese mining industry. Int. J. Miner. Metall. Mater. 2021, 28, 1397–1412. [Google Scholar] [CrossRef]
  2. Northey, S.; Mohr, S.; Mudd, G.; Weng, Z.; Giurco, D. Modelling future copper ore grade decline based on a detailed assessment of copper resources and mining. Resour. Conserv. Recycl. 2014, 83, 190–201. [Google Scholar] [CrossRef]
  3. Li, L.; Pan, D.; Li, B.; Wu, Y.; Wang, H.; Gu, Y.; Zuo, T. Patterns and challenges in the copper industry in China. Resour. Conserv. Recycl. 2017, 127, 1–7. [Google Scholar] [CrossRef]
  4. Lu, H.; Qi, C.; Chen, Q.; Gan, D.; Xue, Z.; Hu, Y. A new procedure for recycling waste tailings as cemented paste backfill to underground stopes and open pits. J. Clean. Prod. 2018, 188, 601–612. [Google Scholar] [CrossRef]
  5. Kiventerä, J.; Perumal, P.; Yliniemi, J.; Illikainen, M. Mine tailings as a raw material in alkali activation: A review. Int. J. Miner. Metall. Mater. 2020, 27, 1009–1020. [Google Scholar] [CrossRef]
  6. Ebrahimi, M.; Abdolshah, M.; Abdolshah, S. Developing a computer vision method based on AHP and feature ranking for ores type detection. Appl. Soft Comput. 2016, 49, 179–188. [Google Scholar] [CrossRef]
  7. Shatwell, D.G.; Murray, V.; Barton, A. Real-time ore sorting using color and texture analysis. Int. J. Min. Sci. Technol. 2023, 33, 659–674. [Google Scholar] [CrossRef]
  8. Tuşa, L.; Kern, M.; Khodadadzadeh, M.; Blannin, R.; Gloaguen, R.; Gutzmer, J. Evaluating the performance of hyperspectral short-wave infrared sensors for the pre-sorting of complex ores using machine learning methods. Miner. Eng. 2020, 146, 106150. [Google Scholar] [CrossRef]
  9. Qiu, J.; Zhang, Y.; Fu, C.; Yang, Y.; Ye, Y.; Wang, R.; Tang, B. Study on photofluorescent uranium ore sorting based on deep learning. Miner. Eng. 2024, 206, 108523. [Google Scholar] [CrossRef]
  10. Kern, M.; Akushika, J.N.; Godinho, J.R.; Schmiedel, T.; Gutzmer, J. Integration of X-ray radiography and automated mineralogy data for the optimization of ore sorting routines. Miner. Eng. 2022, 186, 107739. [Google Scholar] [CrossRef]
  11. Xu, Q.H.; Liang, Z.A.; Duan, H.; Sun, Z.M.; Wu, W.X. The efficient utilization of low-grade scheelite with X-ray transmission sorting and mixed collectors. Tungsten 2023, 5, 570–580. [Google Scholar] [CrossRef]
  12. Fang, Z.; Song, S.; Wang, H.; Yan, H.; Lu, M.; Chen, S.; Li, S.; Liang, W. Mineral classification with X-ray absorption spectroscopy: A deep learning-based approach. Miner. Eng. 2024, 217, 108964. [Google Scholar] [CrossRef]
  13. Liu, Z.; Wang, Y.; Vaidya, S.; Ruehle, F.; Halverson, J.; Soljačić, M.; Hou, T.Y.; Tegmark, M. KAN: Kolmogorov-Arnold Networks. In Proceedings of the International Conference on Learning Representations (ICLR), Singapore, 24–28 April 2025. [Google Scholar]
  14. Tessier, J.; Duchesne, C.; Bartolacci, G. A machine vision approach to on-line estimation of run-of-mine ore composition on conveyor belts. Miner. Eng. 2007, 20, 1129–1144. [Google Scholar] [CrossRef]
  15. Zhu, X.F.; Zhang, C.; Huang, X.W.; Song, W.L.; Lu, L.N.; Hu, Q.C.; Shao, Y.Q. Principal component analysis of mineral and element composition of ores from the Bayan Obo Nb-Fe-REE deposit: Implication for mineralization process and ore classification. Ore Geol. Rev. 2024, 167, 105972. [Google Scholar] [CrossRef]
  16. Chen, Y.; Jiang, C.; Hyyppa, J.; Qiu, S.; Wang, Z.; Tian, M.; Li, W.; Puttonen, E.; Zhou, H.; Feng, Z.; et al. Feasibility study of ore classification using active hyperspectral LiDAR. IEEE Geosci. Remote Sens. Lett. 2018, 15, 1785–1789. [Google Scholar] [CrossRef]
  17. Akbar, S.; Abdolmaleki, M.; Ghadernejad, S.; Esmaeili, K. Applying knowledge-based and data-driven methods to improve ore grade control of blast hole drill cuttings using hyperspectral imaging. Remote Sens. 2024, 16, 2823. [Google Scholar] [CrossRef]
  18. Windrim, L.; Melkumyan, A.; Murphy, R.J.; Chlingaryan, A.; Leung, R. Unsupervised ore/waste classification on open-cut mine faces using close-range hyperspectral data. Geosci. Front. 2023, 14, 101562. [Google Scholar] [CrossRef]
  19. Liu, Y.; Zhang, Z.; Liu, X.; Wang, L.; Xia, X. Performance evaluation of a deep learning based wet coal image classification. Miner. Eng. 2021, 171, 107126. [Google Scholar] [CrossRef]
  20. Liu, Y.; Zhang, Z.; Liu, X.; Lei, W.; Xia, X. Deep learning based mineral image classification combined with visual attention mechanism. IEEE Access 2021, 9, 98091–98109. [Google Scholar] [CrossRef]
  21. Liu, Y.; Zhang, Z.; Liu, X.; Wang, L.; Xia, X. Ore image classification based on small deep learning model: Evaluation and optimization of model depth, model structure and data size. Miner. Eng. 2021, 172, 107020. [Google Scholar] [CrossRef]
  22. Abdolmaleki, M.; Consens, M.; Esmaeili, K. Ore-Waste discrimination using supervised and unsupervised classification of hyperspectral images. Remote Sens. 2022, 14, 6386. [Google Scholar] [CrossRef]
  23. Chu, Y.; Luo, Y.; Chen, F.; Zhao, C.; Gong, T.; Wang, Y.; Guo, L.; Hong, M. Visualization and accuracy improvement of soil classification using laser-induced breakdown spectroscopy with deep learning. iScience 2023, 26, 106173. [Google Scholar] [CrossRef] [PubMed]
  24. Vaswani, A.; Shazeer, N.; Parmar, N.; Uszkoreit, J.; Jones, L.; Gomez, A.N.; Kaiser, L.; Polosukhin, I. Attention Is All You Need. In Proceedings of the Advances in Neural Information Processing Systems (NeurIPS), Long Beach, CA, USA, 4–9 December 2017. [Google Scholar]
  25. Dosovitskiy, A.; Beyer, L.; Kolesnikov, A.; Weissenborn, D.; Zhai, X.; Unterthiner, T.; Dehghani, M.; Minderer, M.; Heigold, G.; Gelly, S.; et al. An Image is Worth 16×16 Words: Transformers for Image Recognition at Scale. In Proceedings of the International Conference on Learning Representations (ICLR), Vienna, Austria, 3–7 May 2021. [Google Scholar]
  26. Liu, Z.; Lin, Y.; Cao, Y.; Hu, H.; Wei, Y.; Zhang, Z.; Lin, S.; Guo, B. Swin Transformer: Hierarchical Vision Transformer Using Shifted Windows. In Proceedings of the IEEE Conference on Computer Vision (ICCV), Montreal, BC, Canada, 11–17 October 2021; pp. 10012–10022. [Google Scholar]
  27. Liu, Y.; Wang, X.; Zhang, Z.; Deng, F. OreFormer: Ore sorting transformer based on ConvNet and visual attention. Nat. Resour. Res. 2024, 33, 521–538. [Google Scholar] [CrossRef]
  28. Zhou, W.; Wang, H.; Wan, Z. Ore image classification based on improved CNN. Comput. Electr. Eng. 2022, 99, 107819. [Google Scholar] [CrossRef]
  29. Liu, Y.; Wang, X.; Zhang, Z.; Deng, F. Deep learning based data augmentation for large-scale mineral image recognition and classification. Miner. Eng. 2023, 204, 108411. [Google Scholar] [CrossRef]
  30. Goodfellow, I.; Pouget-Abadie, J.; Mirza, M.; Xu, B.; Warde-Farley, D.; Ozair, S.; Courville, A.; Bengio, Y. Generative adversarial networks. Commun. ACM 2020, 63, 139–144. [Google Scholar] [CrossRef]
  31. Wang, Q.q.; Sun, L.; Cao, Y.; Wang, X.; Qiao, Y.; Xiang, M.t.; Liu, G.b.; Sun, W. Recovery of copper and cobalt from waste rock in Democratic Republic of Congo by gravity separation combined with flotation. Trans. Nonferrous Met. Soc. China 2025, 35, 602–612. [Google Scholar] [CrossRef]
  32. Iyakwari, S.; Glass, H.J.; Rollinson, G.K.; Kowalczuk, P.B. Application of near infrared sensors to preconcentration of hydrothermally-formed copper ore. Miner. Eng. 2016, 85, 148–167. [Google Scholar] [CrossRef]
  33. Liu, Z.; Kou, J.; Yan, Z.; Wang, P.; Liu, C.; Sun, C.; Shao, A.; Klein, B. Enhancing XRF sensor-based sorting of porphyritic copper ore using particle swarm optimization-support vector machine algorithm. Int. J. Min. Sci. Technol. 2024, 34, 545–556. [Google Scholar] [CrossRef]
  34. He, K.; Zhang, X.; Ren, S.; Sun, J. Deep Residual Learning for Image Recognition. In Proceedings of the IEEE Conference on Computer Vision and Pattern Recognition (CVPR), Las Vegas, NV, USA, 27–30 June 2016; pp. 770–778. [Google Scholar]
  35. Dong, J.; Jiang, J.; Jiang, K.; Li, J.; Zhang, Y. Fast and Accurate Gigapixel Pathological Image Classification with Hierarchical Distillation Multi-Instance Learning. In Proceedings of the IEEE Conference on Computer Vision and Pattern Recognition (CVPR), Nashville, TN, USA, 10–17 June 2025; pp. 30818–30828. [Google Scholar]
  36. He, K.; Zhang, X.; Ren, S.; Sun, J. Delving Deep into Rectifiers: Surpassing Human-Level Performance on ImageNet Classification. In Proceedings of the Proceedings of the IEEE International Conference on Computer Vision (ICCV), Santiago, Chile, 7–13 December 2015. [Google Scholar]
  37. Krizhevsky, A.; Sutskever, I.; Hinton, G.E. ImageNet classification with deep convolutional neural networks. Commun. ACM 2017, 60, 84–90. [Google Scholar] [CrossRef]
  38. Simonyan, K.; Zisserman, A. Very deep convolutional networks for large-scale image recognition. In Proceedings of the International Conference on Learning Representations (ICLR), San Diego, CA, USA, 7–9 May 2015. [Google Scholar]
  39. Howard, A.; Sandler, M.; Chen, B.; Wang, W.; Chen, L.C.; Tan, M.; Chu, G.; Vasudevan, V.; Zhu, Y.; Pang, R.; et al. Searching for MobileNetV3. In Proceedings of the 2019 IEEE/CVF International Conference on Computer Vision (ICCV), Seoul, Republic of Korea, 27 October–2 November 2019; pp. 1314–1324. [Google Scholar] [CrossRef]
  40. Tan, M.; Le, Q. EfficientNetV2: Smaller Models and Faster Training. In Proceedings of the International Conference on Machine Learning (ICML), PMLR, Virtual Event, 18–24 July 2021; pp. 10096–10106. [Google Scholar]
  41. Liu, Z.; Mao, H.; Wu, C.Y.; Feichtenhofer, C.; Darrell, T.; Xie, S. A ConvNet for the 2020s. In Proceedings of the IEEE Conference on Computer Vision and Pattern Recognition (CVPR), New Orleans, LA, USA, 18–24 June 2022; pp. 11966–11976. [Google Scholar]
  42. Selvaraju, R.R.; Cogswell, M.; Das, A.; Vedantam, R.; Parikh, D.; Batra, D. Grad-CAM: Visual explanations from deep networks via gradient-based localization. Int. J. Comput. Vis. 2020, 128, 336–359. [Google Scholar] [CrossRef]
Figure 1. Overall architecture diagram of the algorithm.
Minerals 15 01150 g001
Figure 2. The structure of the residual module.
Minerals 15 01150 g002
Figure 3. Structure of the channel attention module.
Minerals 15 01150 g003
Figure 4. Structure of the spatial attention module.
Minerals 15 01150 g004
Figure 5. Channel visualization.
Minerals 15 01150 g005
Figure 6. Visualization of heat map.
Minerals 15 01150 g006
Table 1. The detailed class distribution of the dataset.
OreWasteTotal
train13,422831721,739
val287617824658
test287717834660
Total19,17511,88231,057
Table 2. Comparative results on the test subset. The results are presented as mean ± standard deviation over three runs. Bold font indicates the best performance.
ModelAUCF1RecallPrecisionAccuracyParams (M)
AlexNet [37]85.81±0.1786.24±0.1685.36±0.4387.10±0.4783.18±0.2214.57
VGG-16 [38]85.59±0.0786.21±0.1185.32±0.2687.12±0.1483.15±0.12134.27
ResNet-34 [34]85.32±0.3186.25±0.1286.12±0.8186.40±0.6383.05±0.1021.28
MobileNet V3-small [39]85.30±0.1985.94±0.2885.48±0.4586.40±0.5182.73±0.361.52
EfficientNet V2 [40]85.00±0.4485.76±0.2985.53±0.1186.00±0.5082.47±0.4020.18
ConvNeXt-Tiny [41]83.73±0.2884.88±0.4786.79±0.4083.05±0.6580.91±0.6327.82
ViT-Base [25]85.63±0.6086.04±0.4185.96±0.1286.12±0.8882.78±0.6085.41
Swin-Tiny [26]84.84±0.1285.75±0.1685.92±0.2585.59±0.5182.37±0.2724.52
Our Method85.90±0.0986.28±0.0985.46±0.1887.13±0.3183.23±0.151.32
Table 3. Ablation results of the dataset on the val subset. The results are presented as mean ± standard deviation over three runs. Bold font indicates the best performance.
DatasetAUCF1RecallPrecisionAccuracyParams (M)
High energy spectrum84.24±0.2485.10±0.2085.58±0.3384.64±0.4481.50±0.290.62
Low energy spectrum84.79±0.4085.29±0.5085.94±0.1184.66±0.2981.70±0.440.62
Dual-energy spectrum85.26±0.1185.91±0.1785.72±0.3286.10±0.3182.64±0.221.24
Table 4. Ablation results of modality fusion strategy on the val subset. The results are presented as mean ± standard deviation over three runs. Bold font indicates the best performance.
Fusion MethodAUCF1RecallPrecisionAccuracyParams (M)
Data-level fusion85.04±0.1685.16±0.6487.74±1.3982.78±2.2881.11±1.220.62
Decision-level fusion84.64±0.0985.69±0.1886.09±0.4285.29±0.0782.25±0.171.24
Feature-level fusion85.23±0.2985.82±0.0886.53±0.8085.12±0.9282.34±0.281.26
Hybrid fusion85.41±0.2285.78±0.1085.43±0.3786.14±0.4782.52±0.181.27
Table 5. Ablation results of classifier on the val subset. The results are presented as mean ± standard deviation over three runs. Bold font indicates the best performance.
ClassifierLayersAUCF1RecallPrecisionAccuracyParams (M)
MLP284.51±0.1785.51±0.2086.27±0.2884.77±0.4881.95±0.301.24
484.96±0.4685.59±0.0887.23±0.4084.01±0.5281.86±0.201.25
684.81±0.2585.68±0.1485.88±0.6385.48±0.4182.27±0.111.25
KAN285.41±0.2285.78±0.1085.43±0.3786.14±0.4782.52±0.181.27
485.45±0.2086.18±0.1686.05±0.7186.32±0.4182.96±0.091.31
685.66±0.1286.50±0.1486.11±0.7586.88±0.5883.40±0.111.32
Disclaimer/Publisher’s Note: The statements, opinions and data contained in all publications are solely those of the individual author(s) and contributor(s) and not of MDPI and/or the editor(s). MDPI and/or the editor(s) disclaim responsibility for any injury to people or property resulting from any ideas, methods, instructions or products referred to in the content.