3.1. Influence of Particle Migration on the Mechanical Behavior of Different Samples
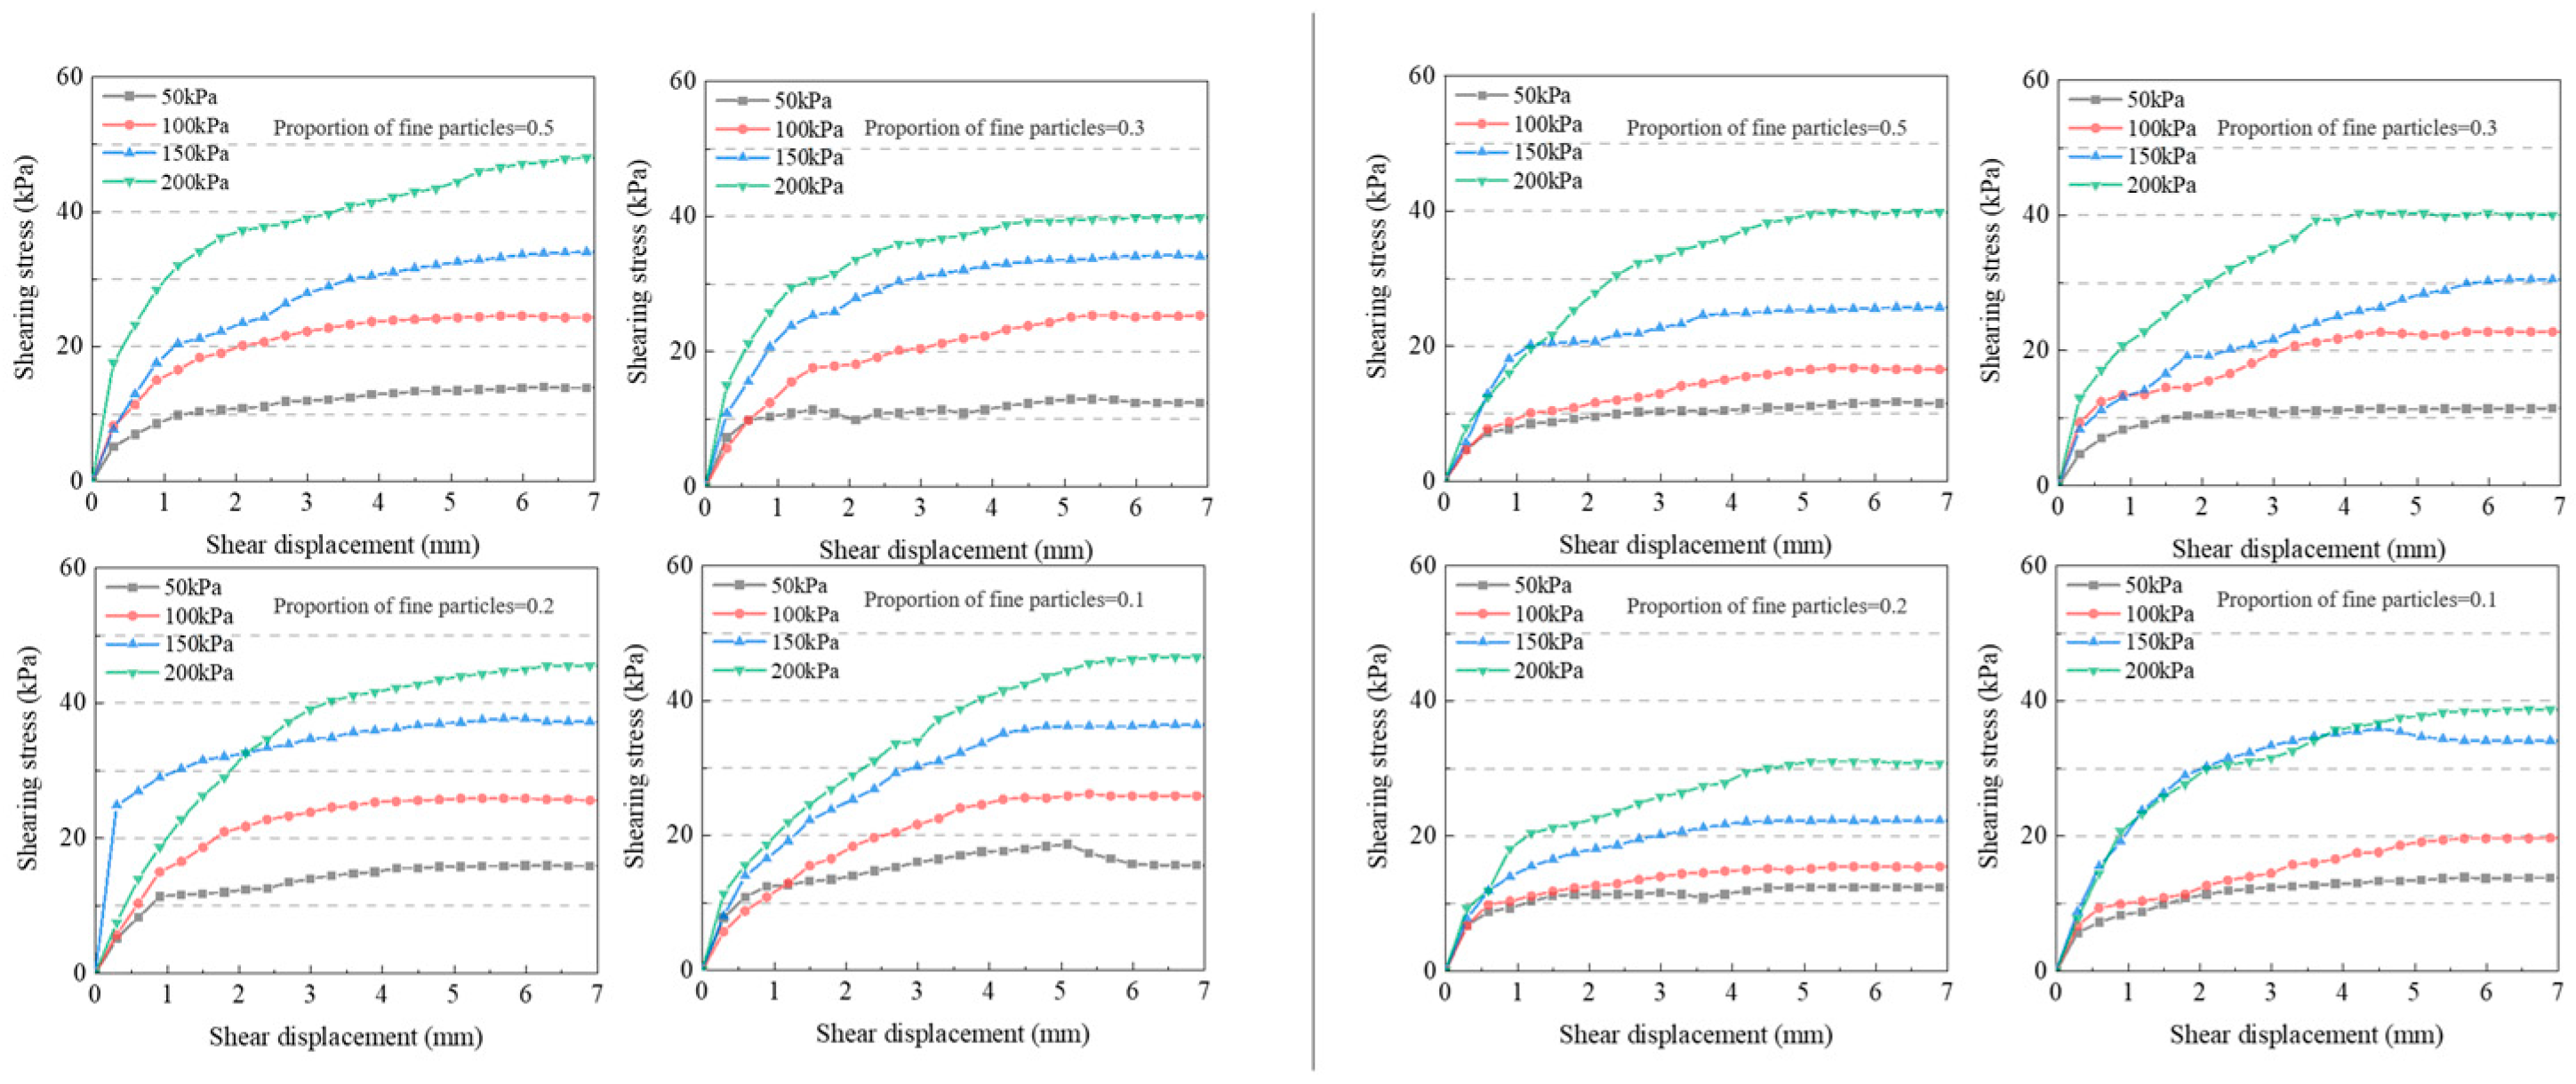
Shear strength tests of four kinds of ore samples with different fine particle ratios (a = 50%, b = 30%, c = 20%, d = 10%) before and after leaching were carried out. The stress-displacement curves are shown in
Figure 3. After leaching, the curves’ initial stages were generally flatter, especially for the b and c groups, showing looser particle bonds. Additionally, the shear strength was weakened under each proportion of fine particles. Group b had the most significant drop. At the start of the tests, closely packed soil particles with high friction and interlocking caused shear stress to rise quickly. As shear displacement increased, particle movement and reorganization formed a stable sliding surface, slowing the stress rise. After reaching peak strength, particles were still interlocked, bearing some shear force. Residual stress stabilized with minor fluctuations.
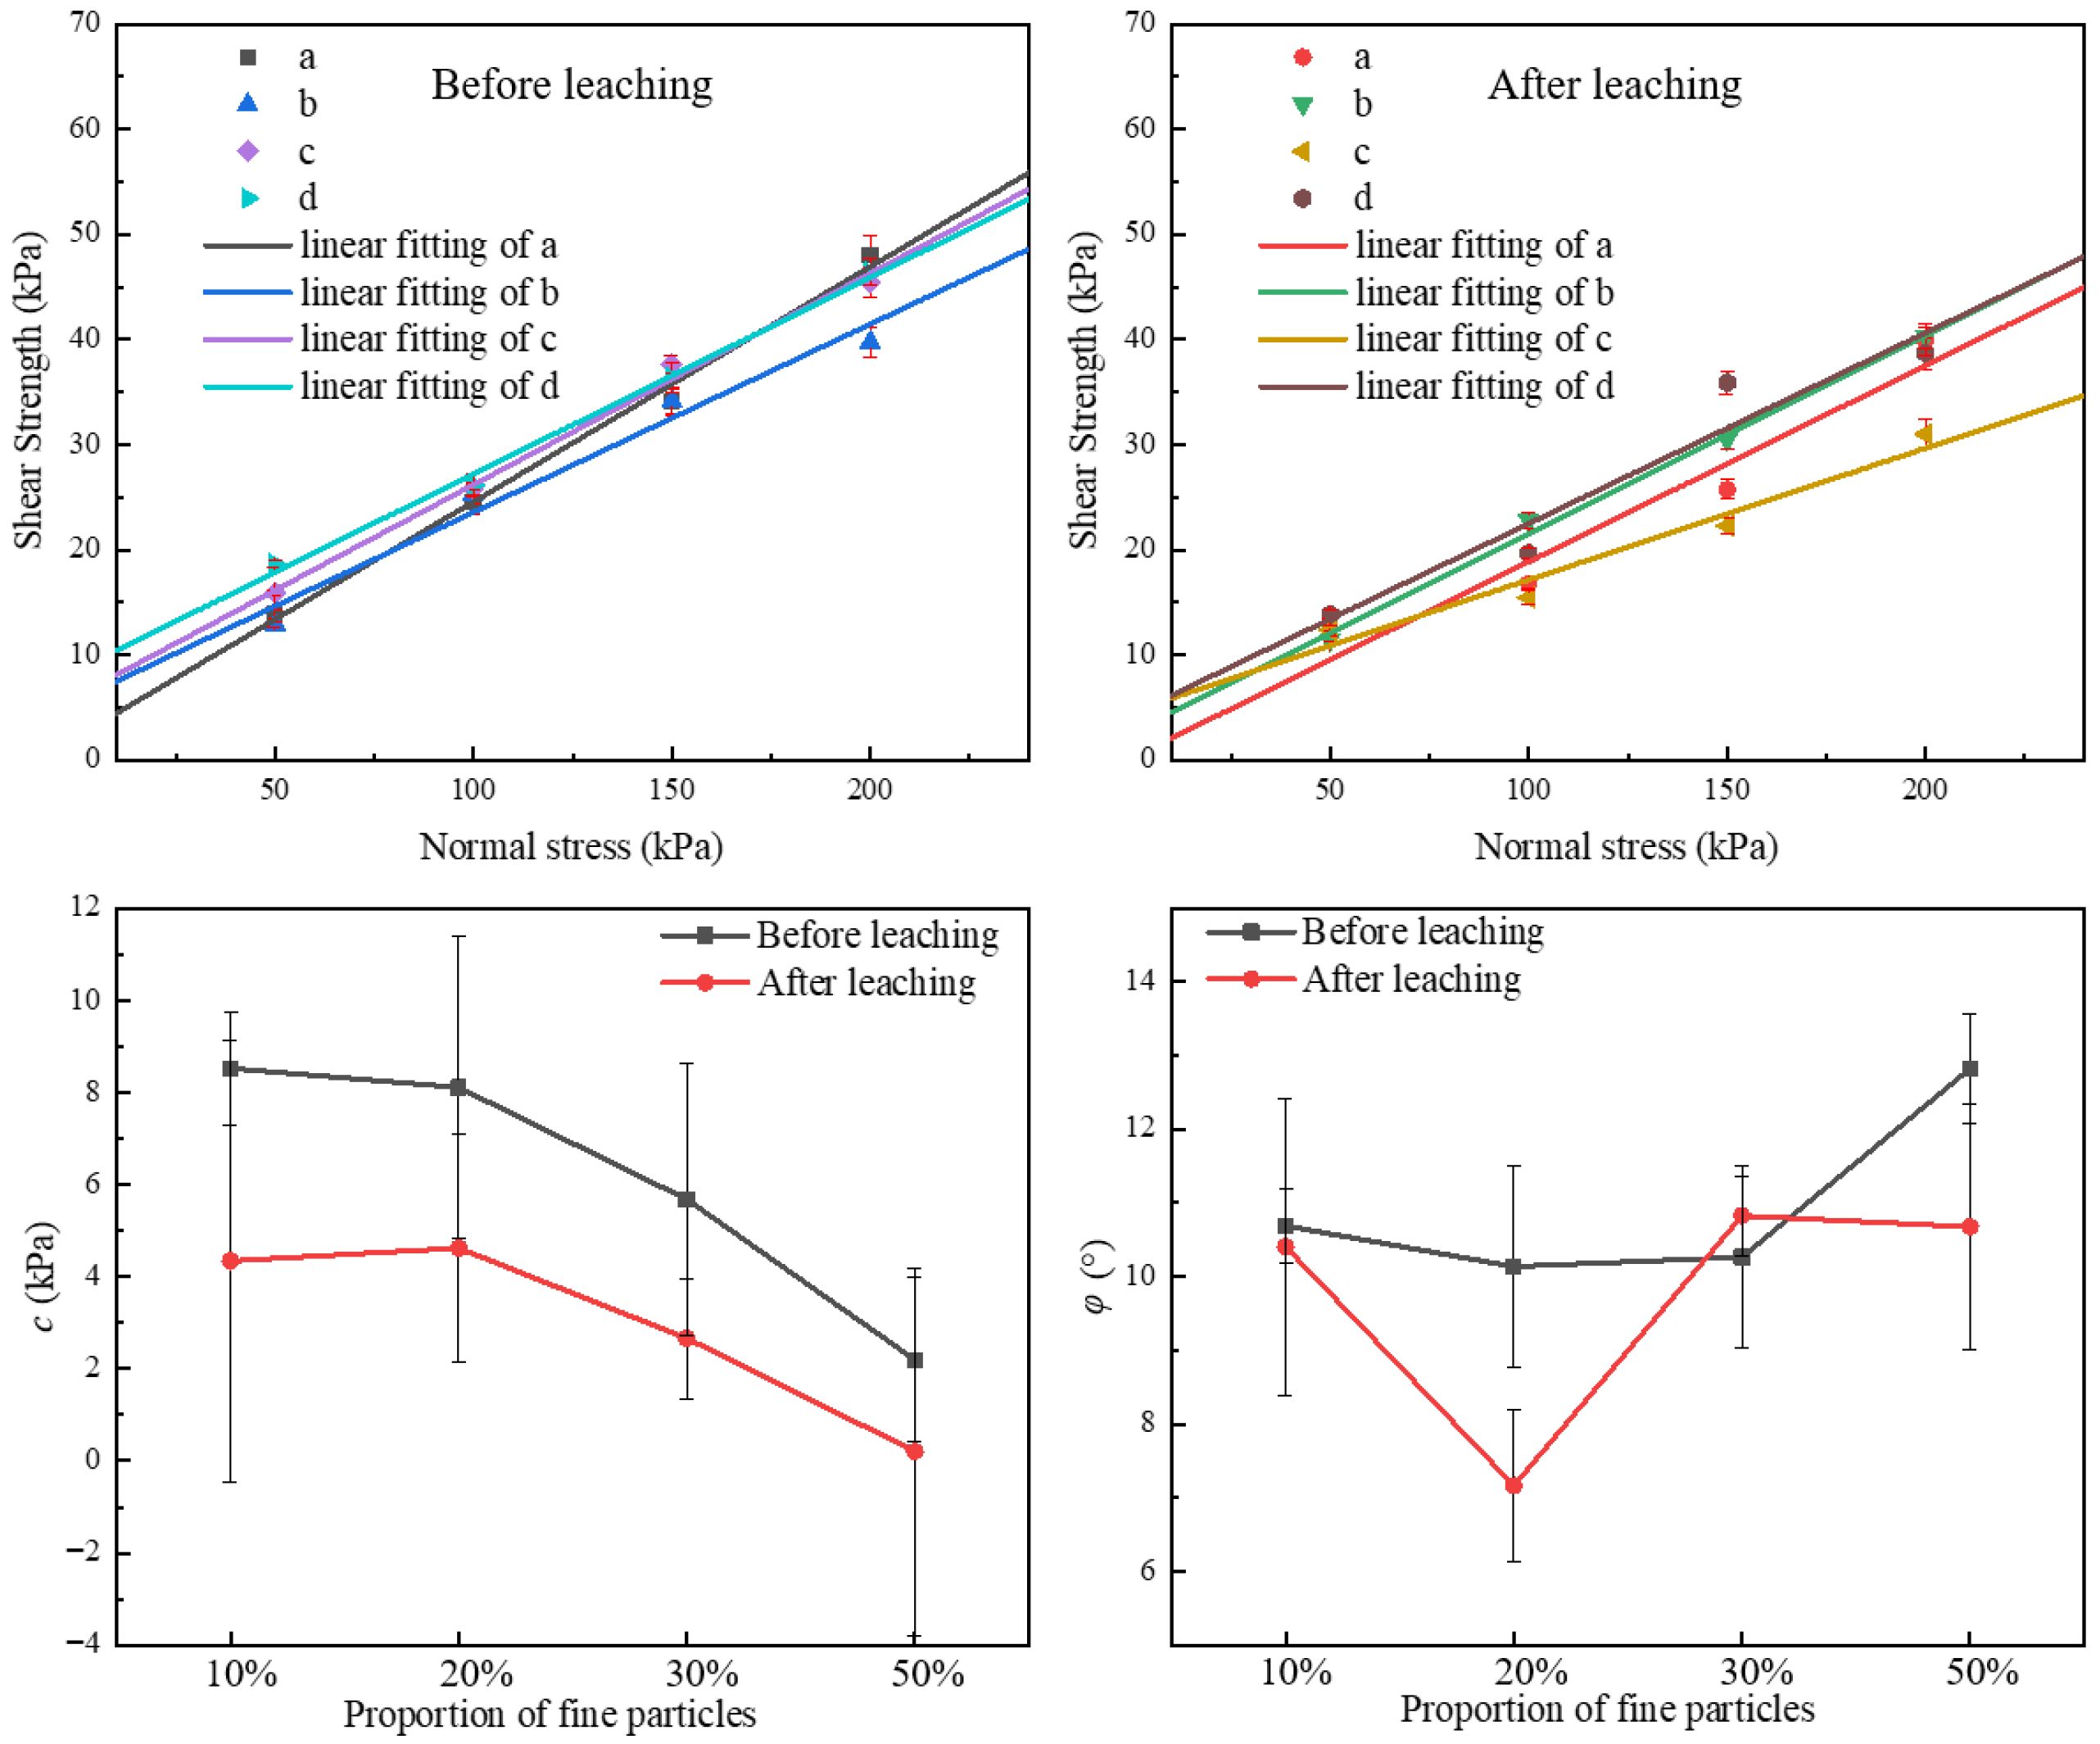
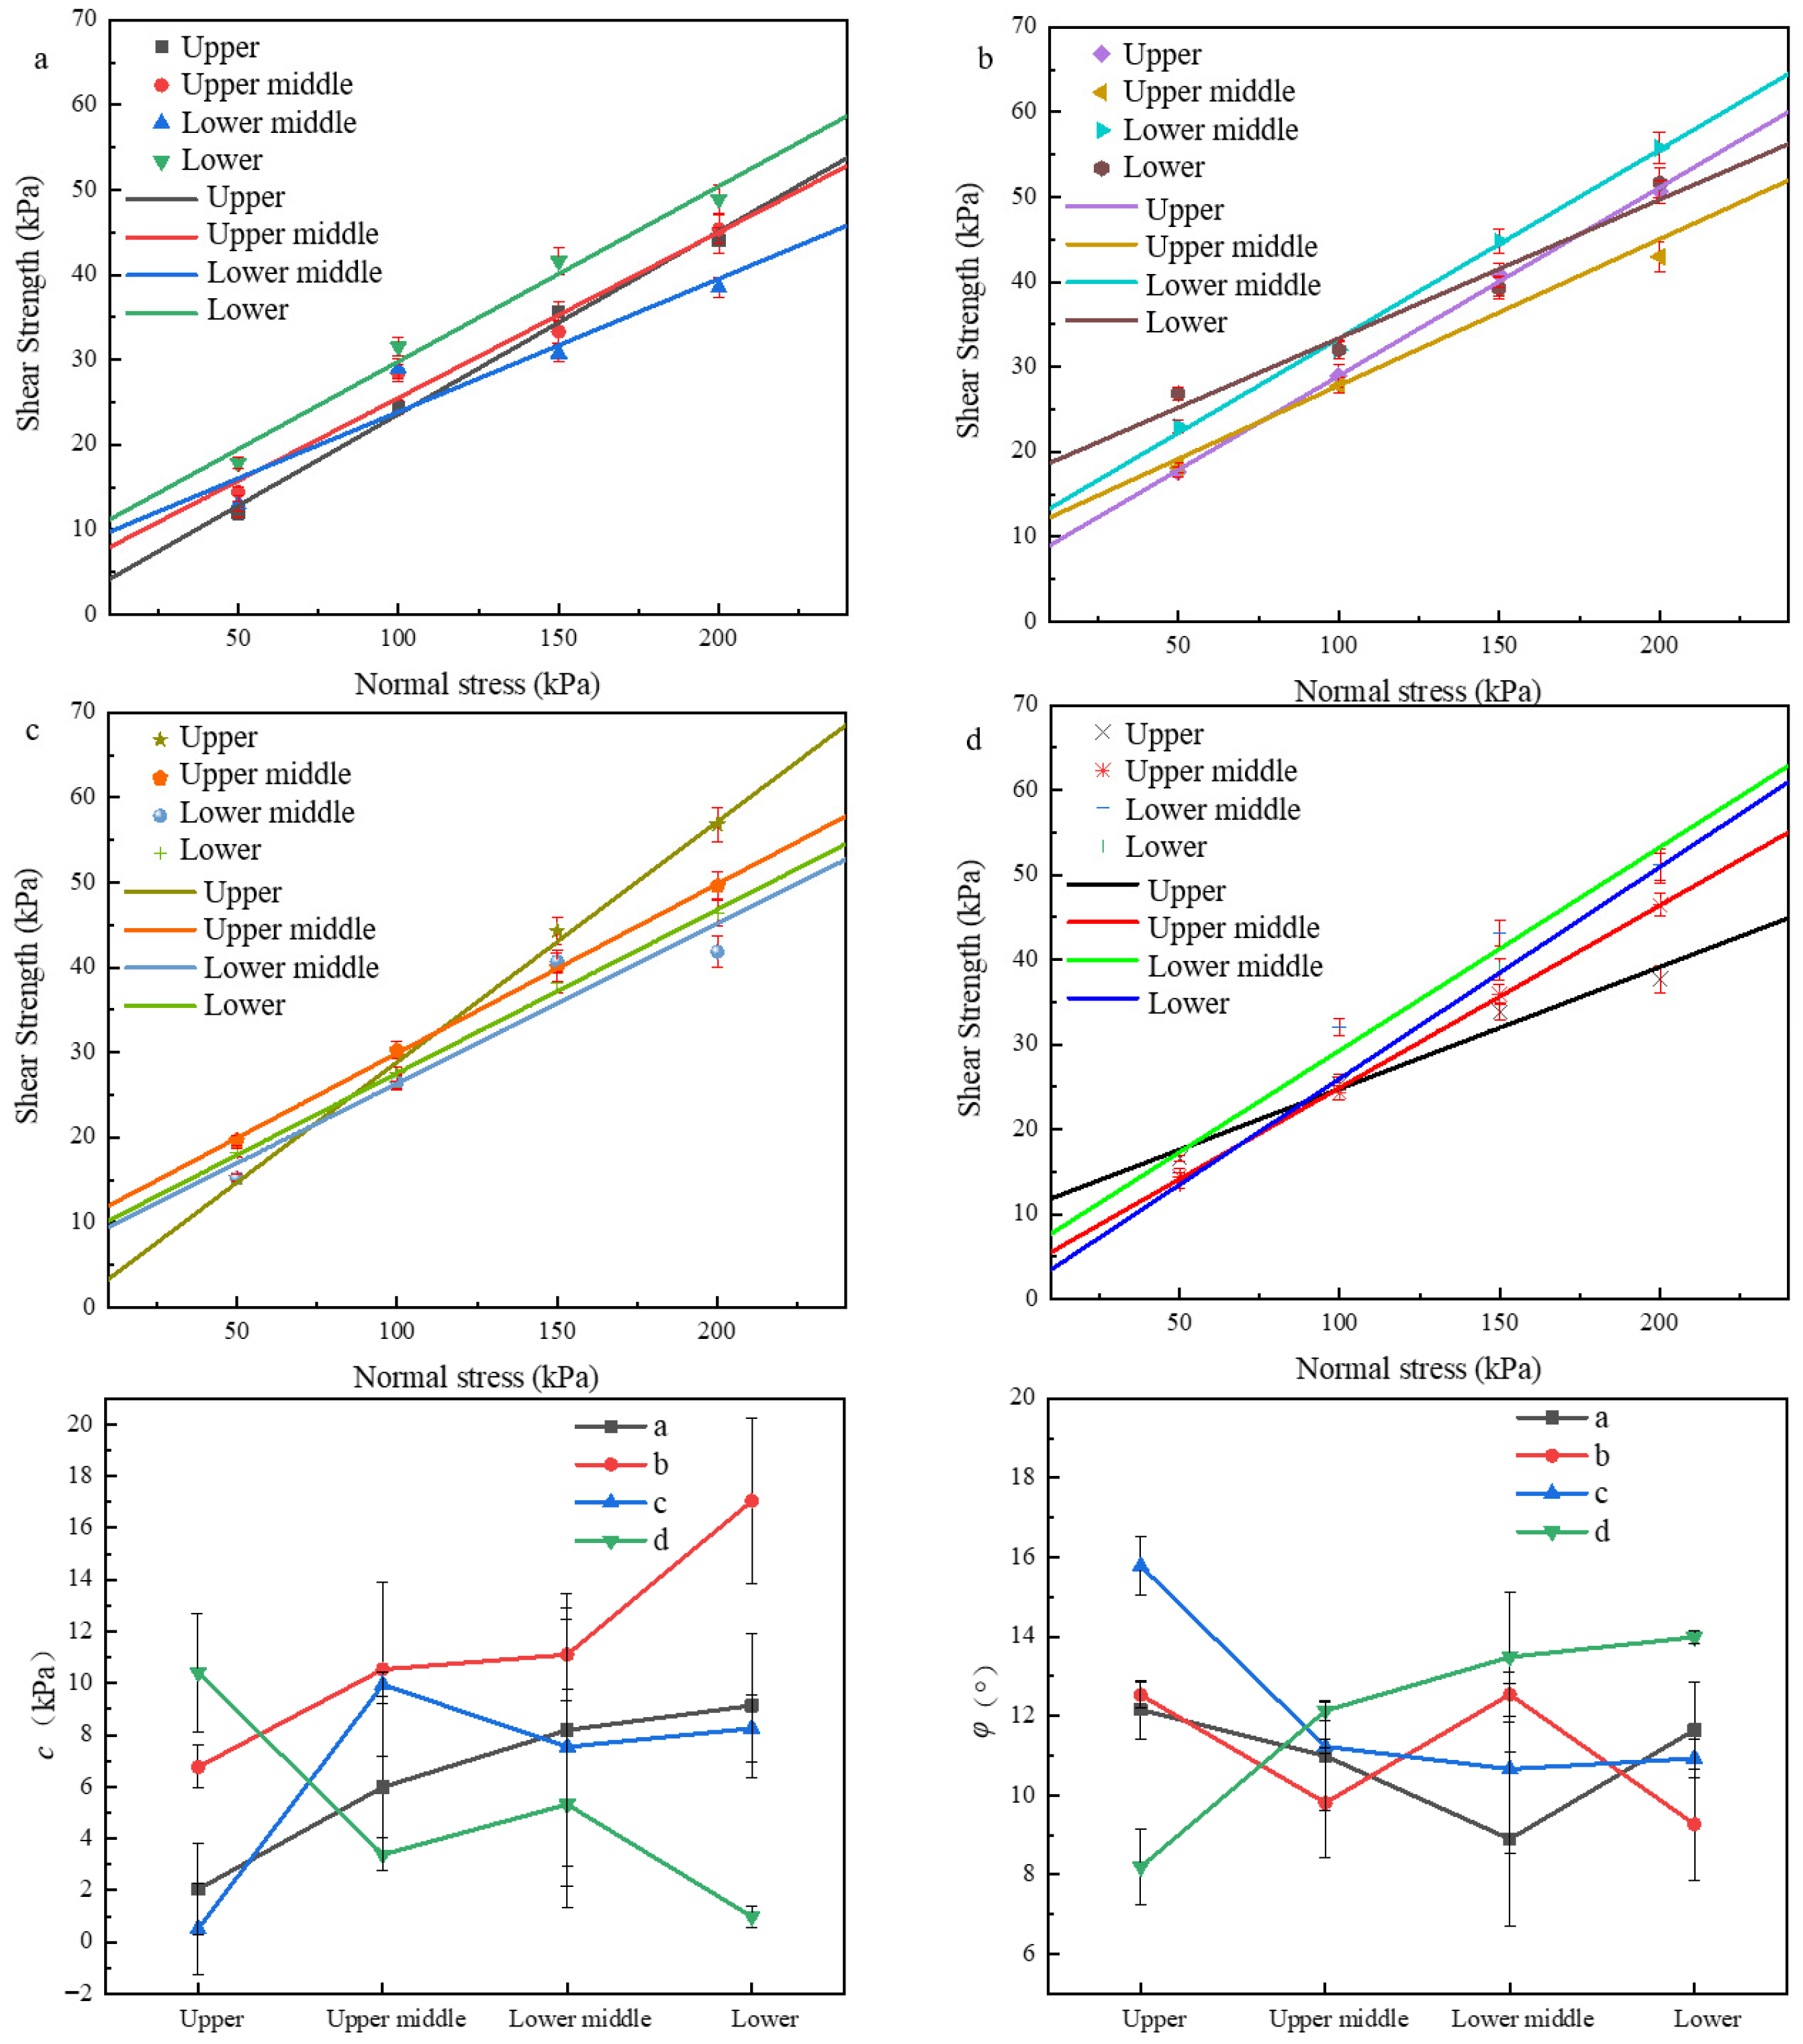
To understand these changes, experimental data were linearly fitted. The
c and
φ of four groups of samples were obtained, as shown in
Figure 4. Leaching reduced
c in all groups, while the
φ stayed similar. This showed that leaching weakened shear strength mainly by reducing
c. After leaching, the
c initially rose, then dropped as the proportion of −0.075 mm particles increased, while the friction angle first dropped, then rose, and then stabilized. Ratios above 20% showed lower
c. In summary, leaching weakened shear strength and
c, with fine particle ratios influencing this trend and particle migration during leaching. It may have played a key role in the experimental phenomenon.
3.2. Mechanical Behavior Characteristics of Samples with Different Burial Depths
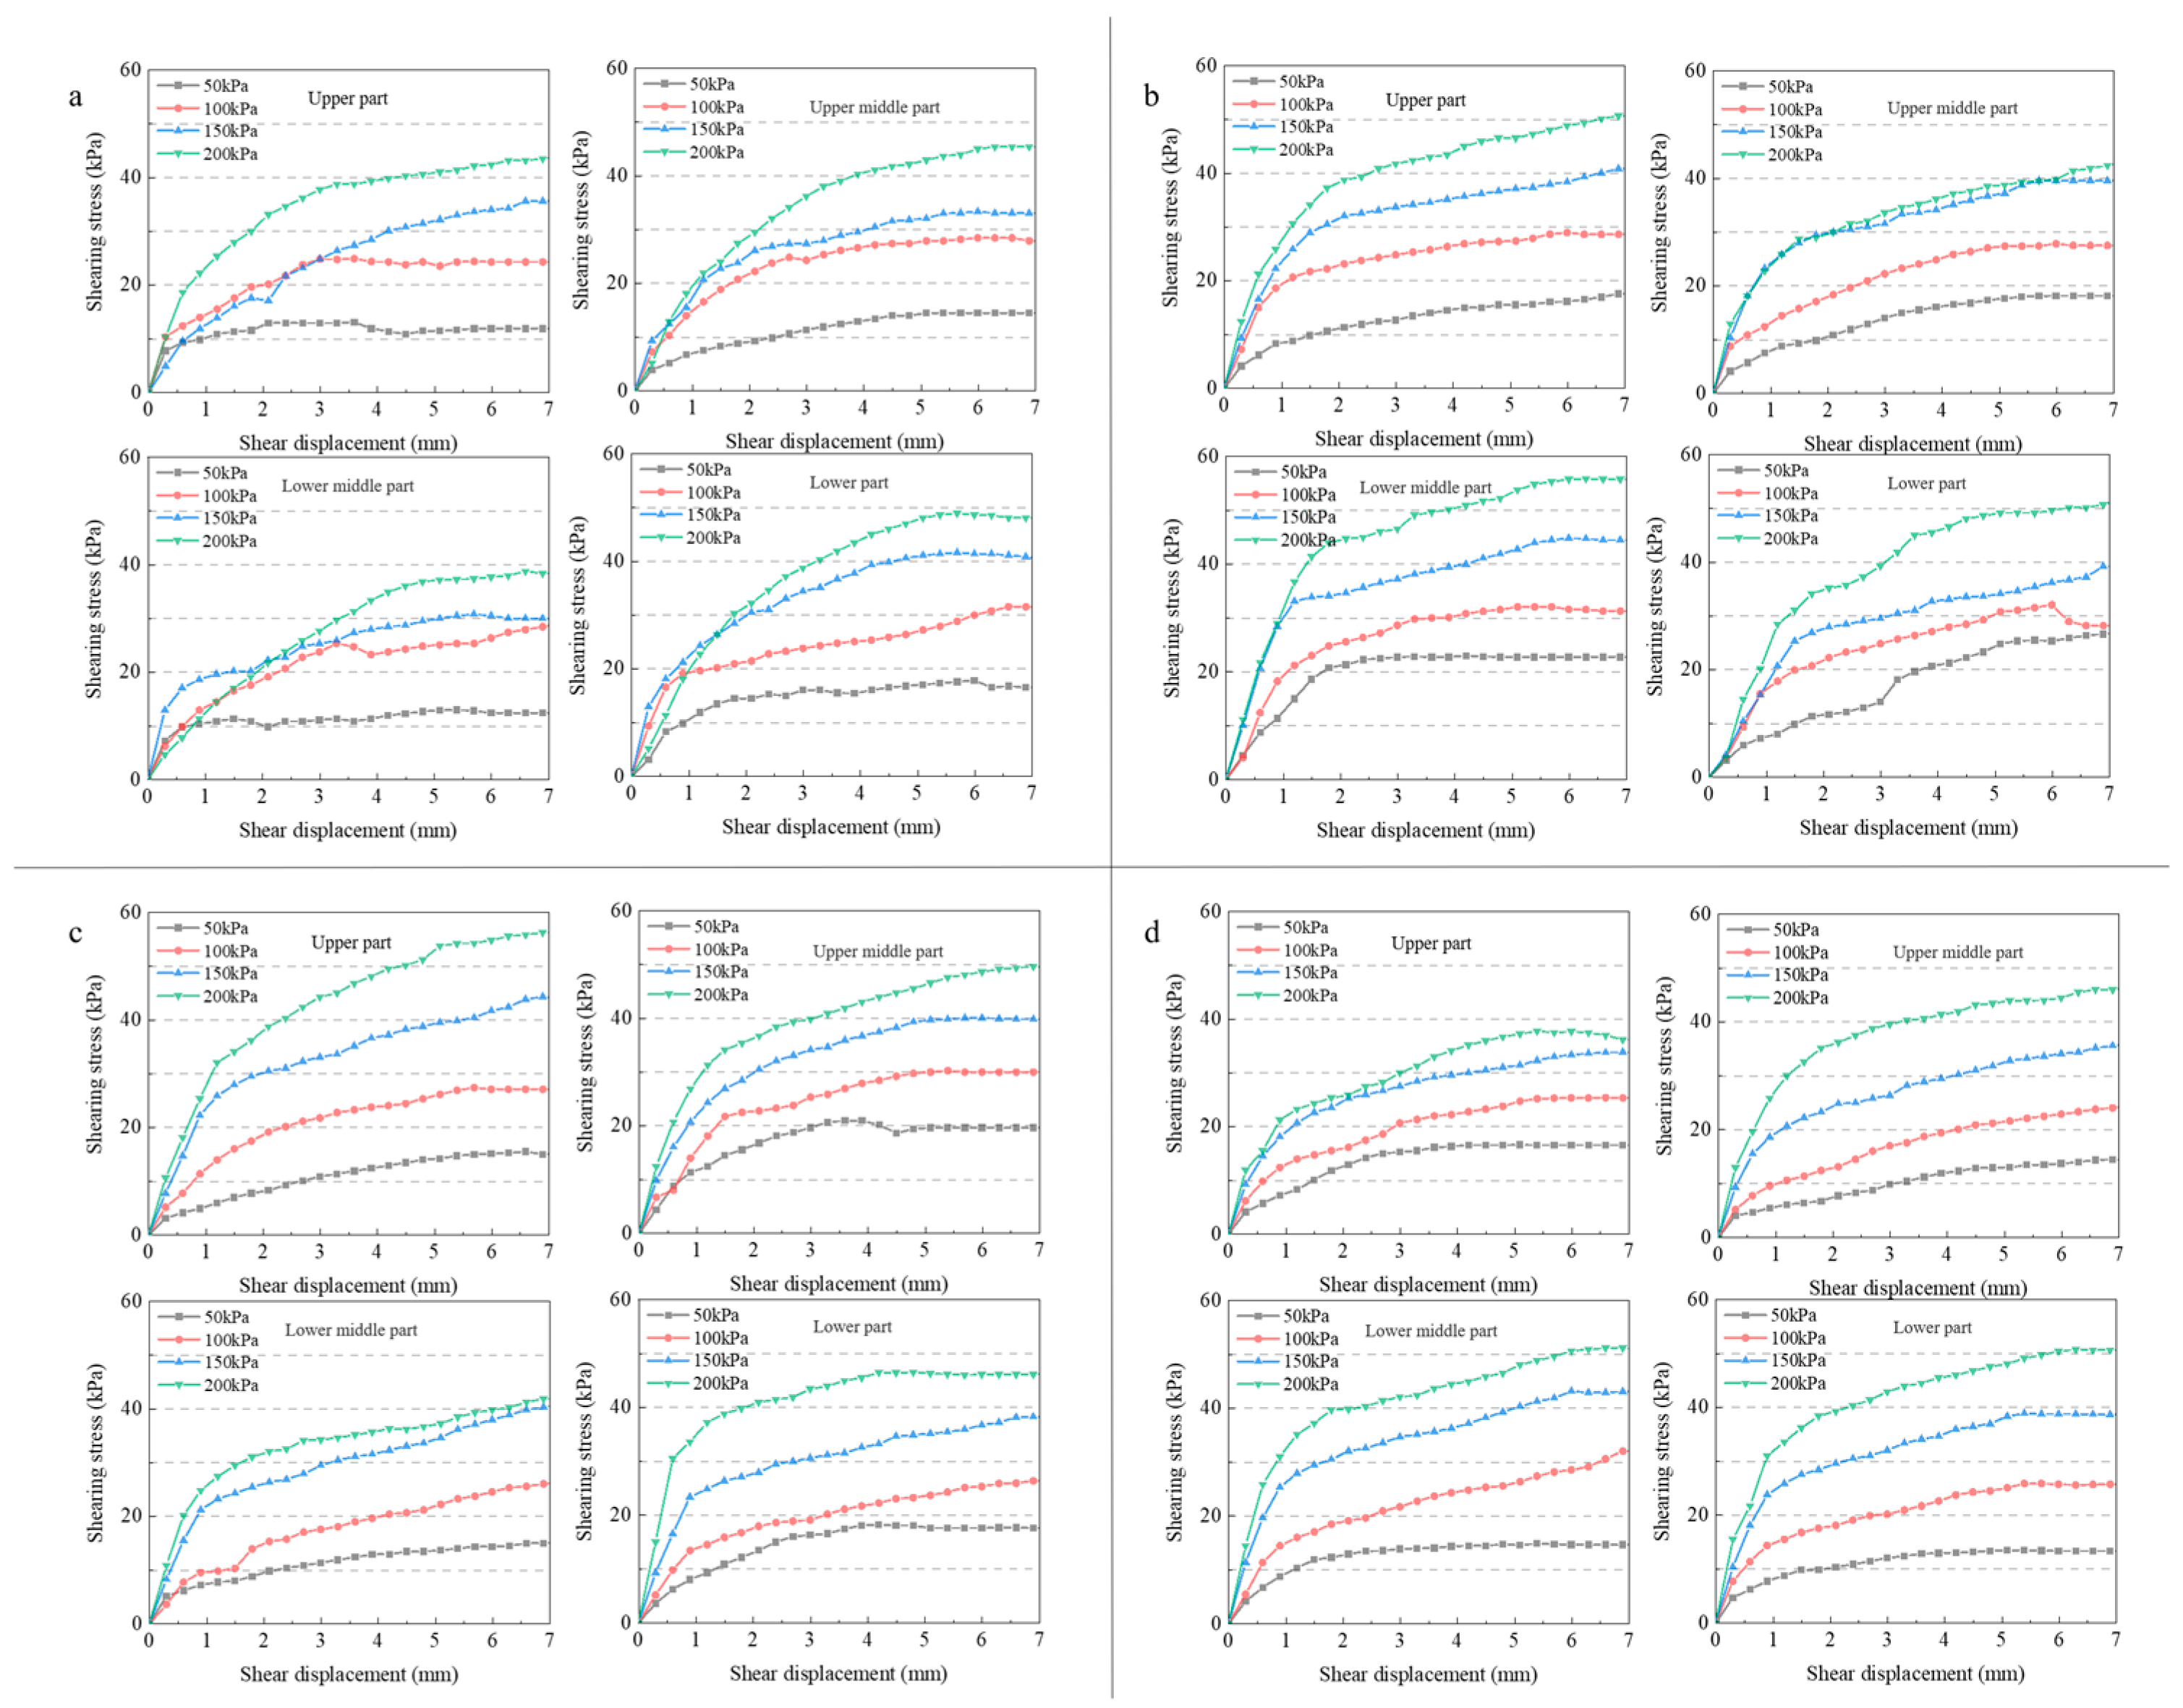
Shear tests were performed on four groups of ore samples with different burial depths after leaching. In this study, upper, upper middle, lower middle, and lower were defined as depths of 20–60 mm, 60–100 mm, 100–140 mm, and 140–180 mm, respectively. The shear stress–displacement curves were obtained, as shown in
Figure 5. They indicated that as the proportion of coarse particles increased, the yield point became more pronounced. This showed that samples with a higher proportion of coarse particles had greater stability after leaching, as they required more shear stress to yield.
Figure 6 illustrates the shear strength,
c, and
φ at different depths for each group. As the proportion of coarse particles increased, the position of maximum
c shifted upward. The
φ was less affected by particle ratio due to factors like particle combination.
For group a, c increased with depth. The φ first decreased and then increased. The lowest φ in the lower middle part. This was attributed to the low proportion of coarse particles and the easy flushing of fine particle blockages. In group b, c was higher overall, and φ fluctuated around 11°. It indicated that enhanced blockage resistance and restricted particle migration as the coarse particle ratio increased. Group c showed significant c fluctuations. The upper middle, lower middle, and lower parts had higher c than the upper part, along with lower φ. Group d displayed trends opposite to groups a and c. The c value steeply decreased and then slightly fluctuated from top to bottom, while φ sharply increased and then stabilized. This was because the fine particle ratio was the lowest, resulting in minimal blockage and greater buoyancy effects. The upper part also experienced compaction from water pressure, leading to maximum c. The reasons for the differences in c and φ were analyzed in combination with SEM (Scanning Electron Microscope) experimental results.
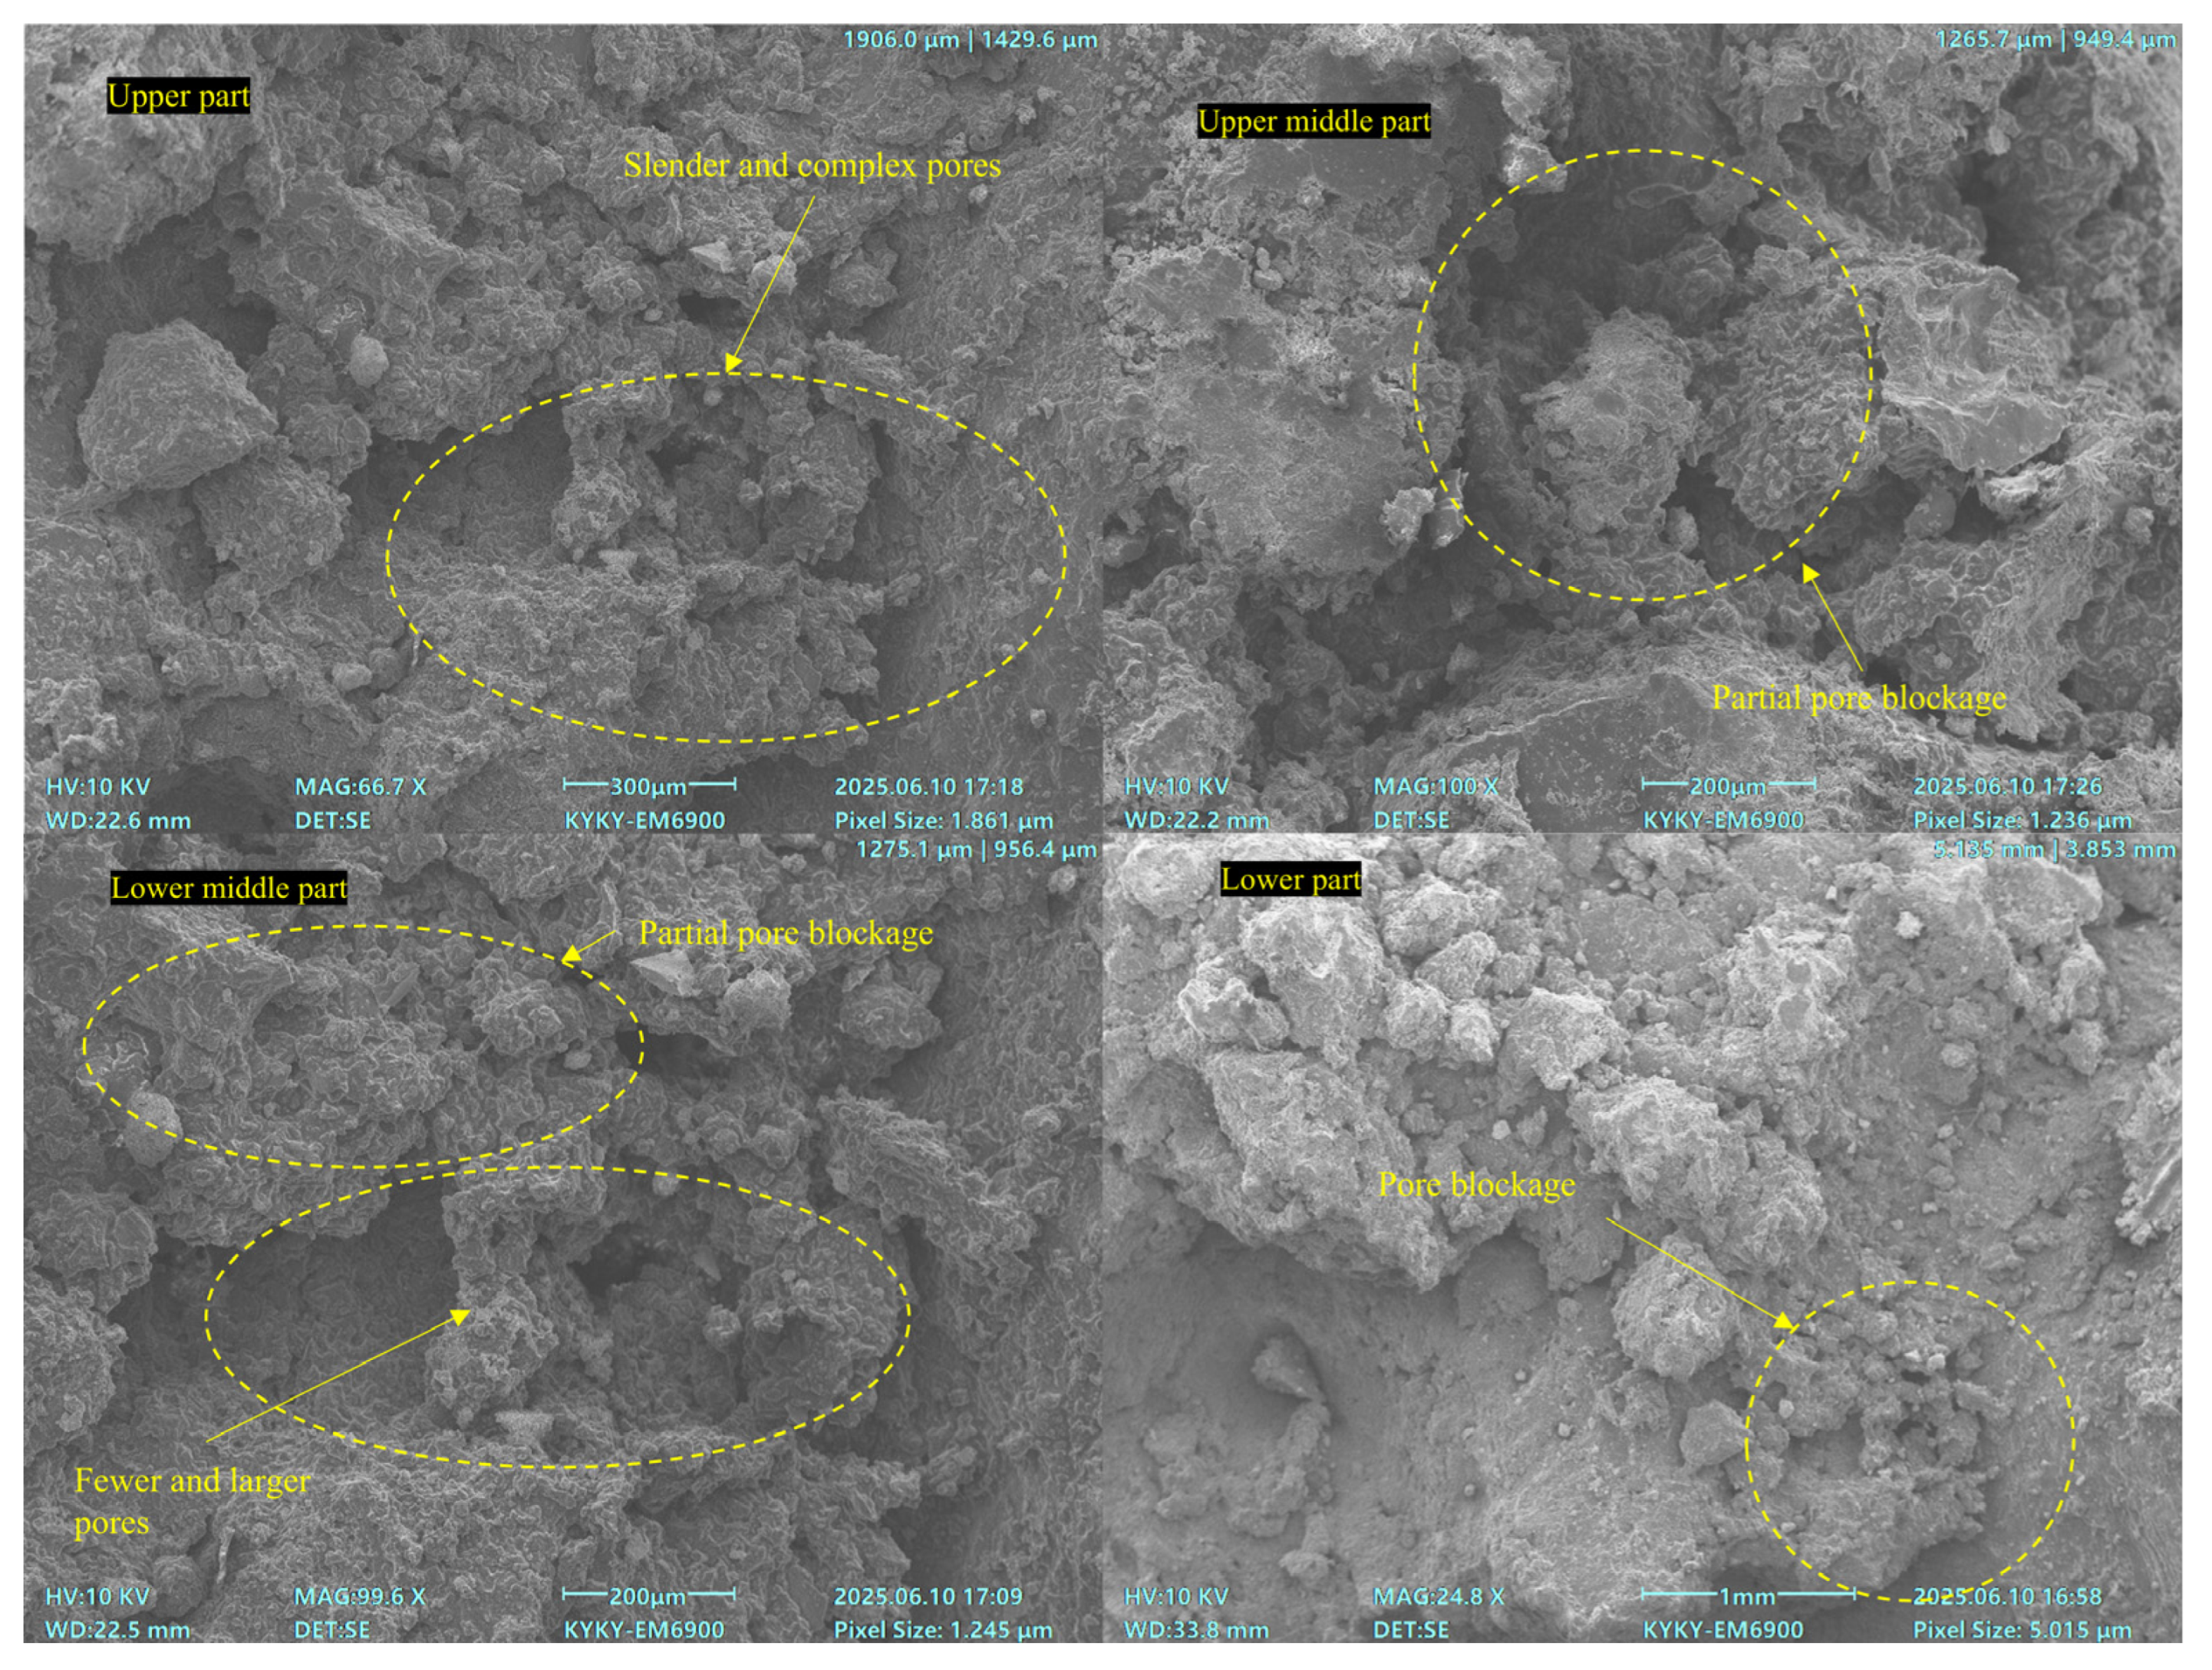
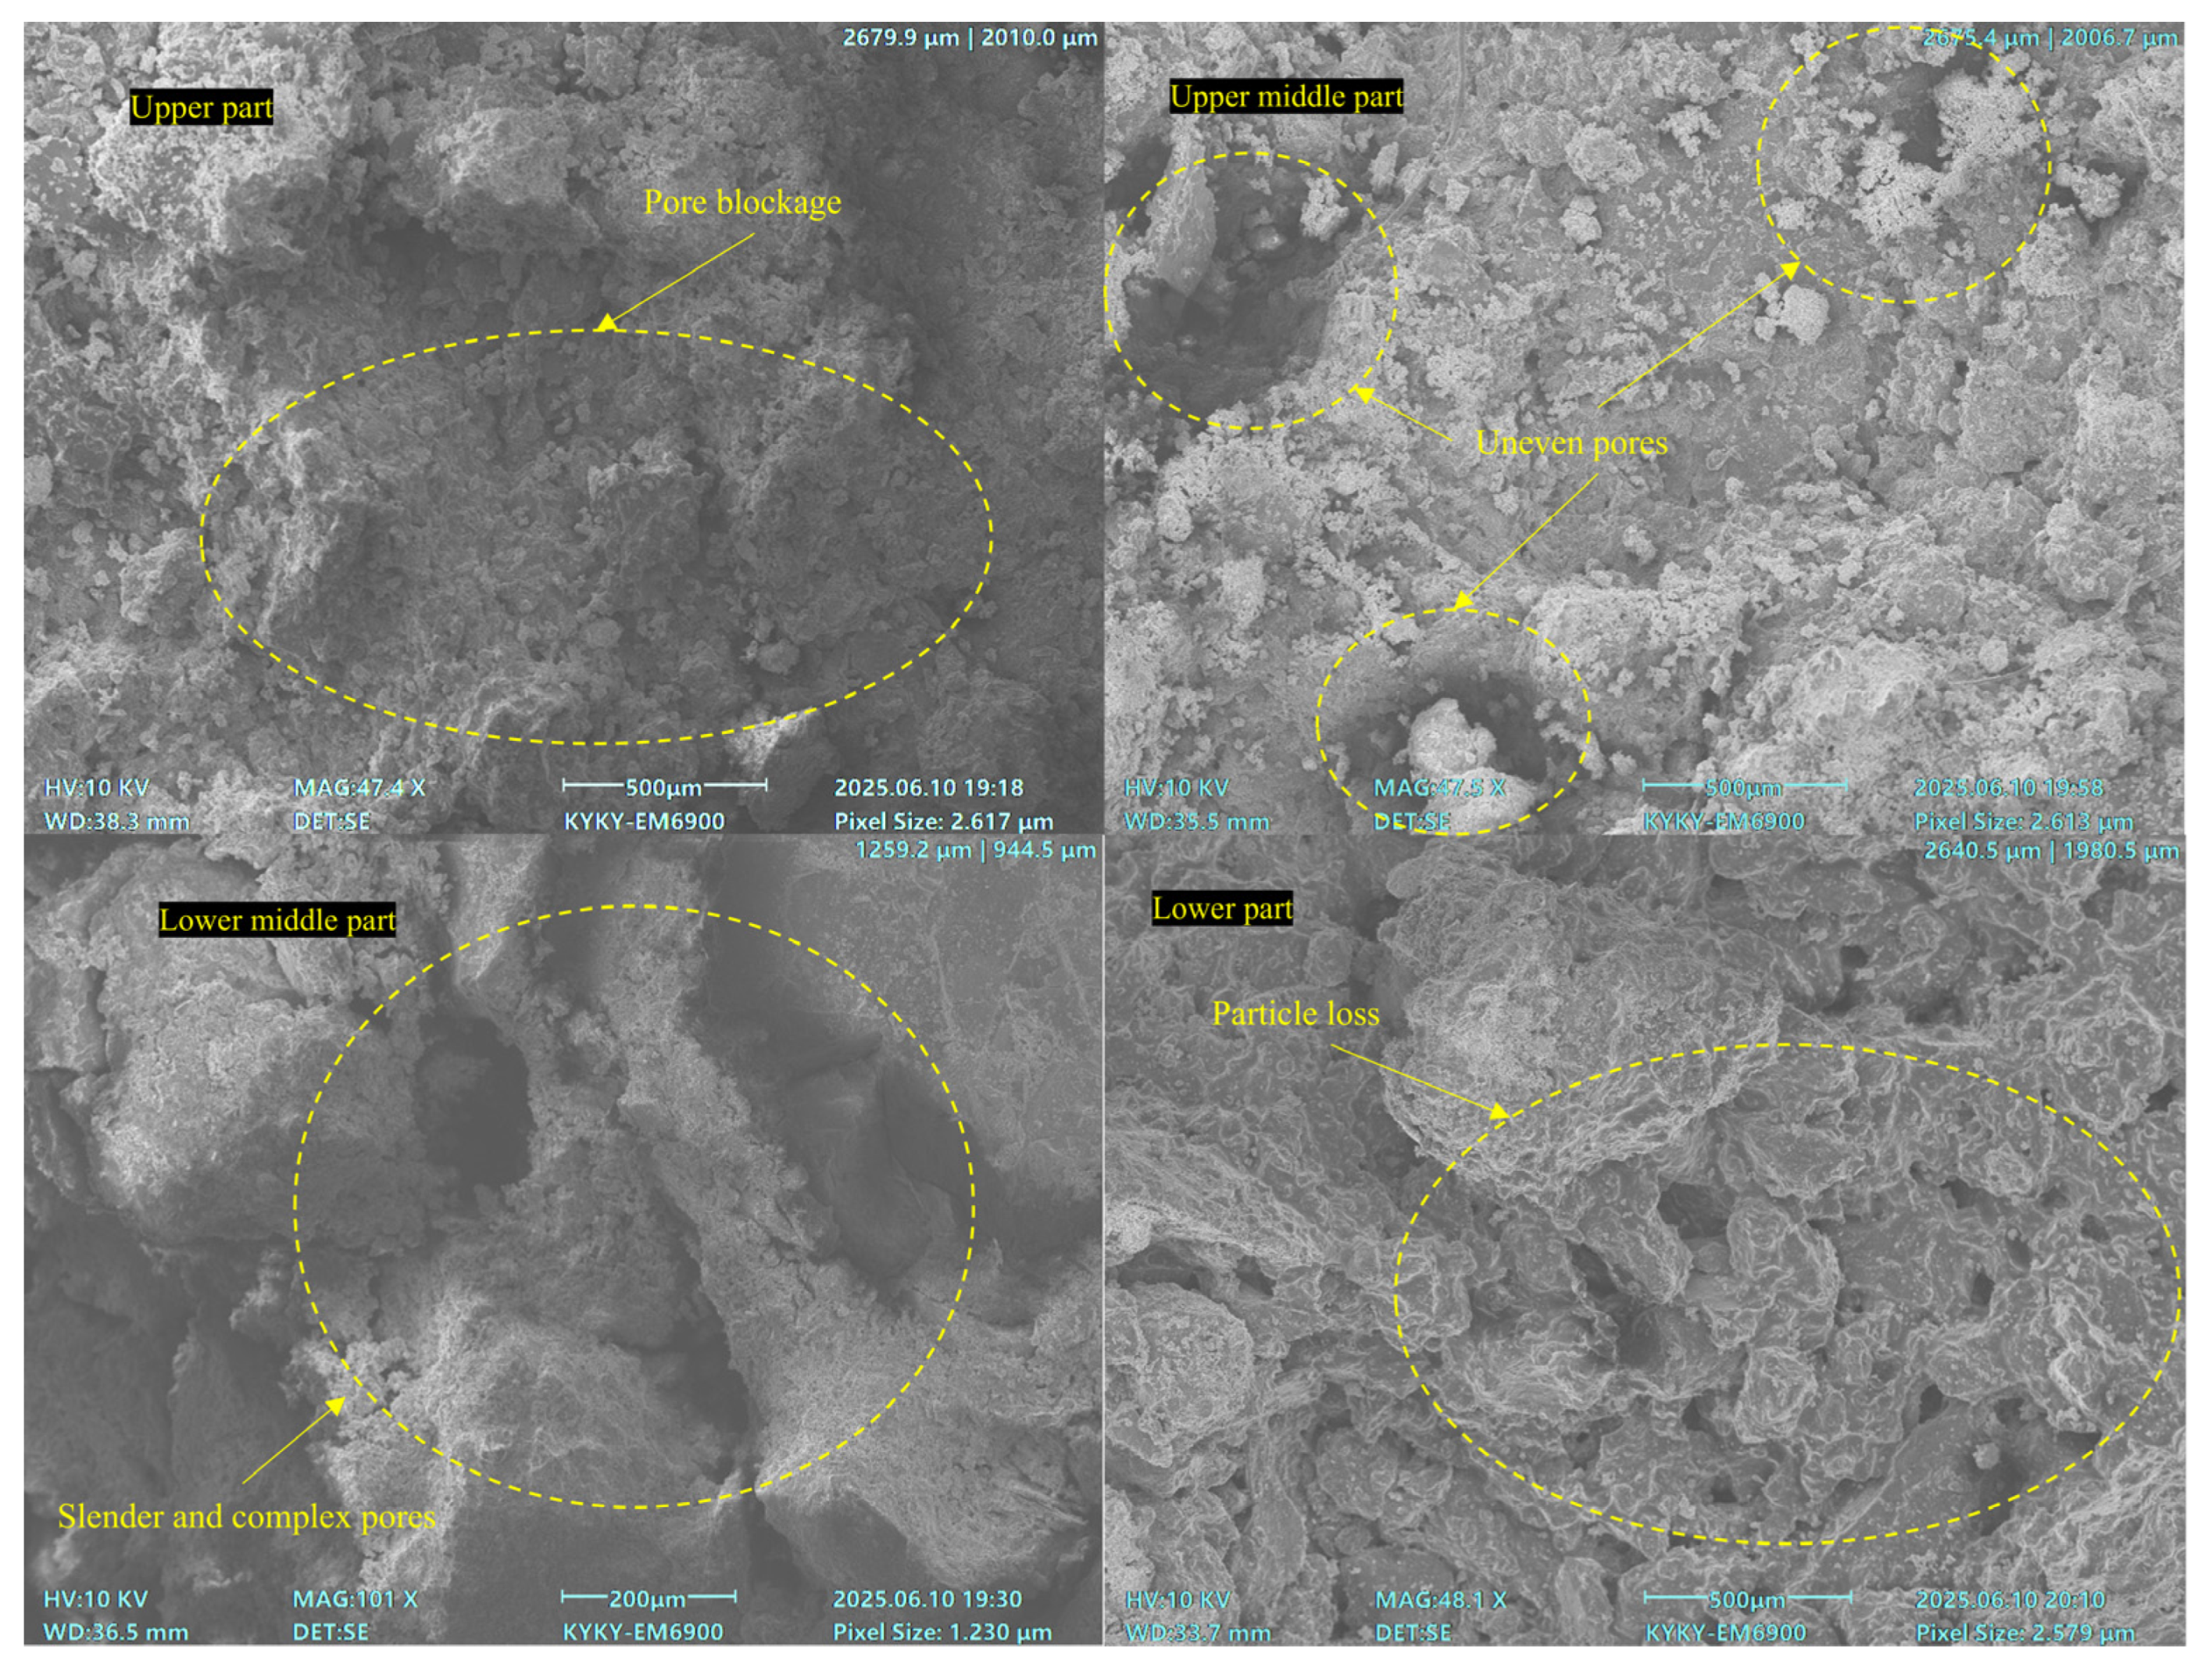
As indicated by the SEM results in
Figure 7, the lower part of group a was covered with a significant quantity of fine particles, leading to substantial blockage. The lower part experienced significant pore blockage. The pores were evenly deposited and spread out. These conditions led to high
c and
φ. Some particles were deposited in the upper middle and lower middle parts, causing pore blockage. In the lower middle part, fewer and larger pores were observed, and these pores were concentrated. During failure, these pores could easily merge. This merging led to a sharp reduction in
φ. The upper part had less interparticle deposition and uneven particle distribution. These characteristics made it unfavorable for maintaining
c. However, the slender and complex pores between particles helped maintain interparticle interlocking.
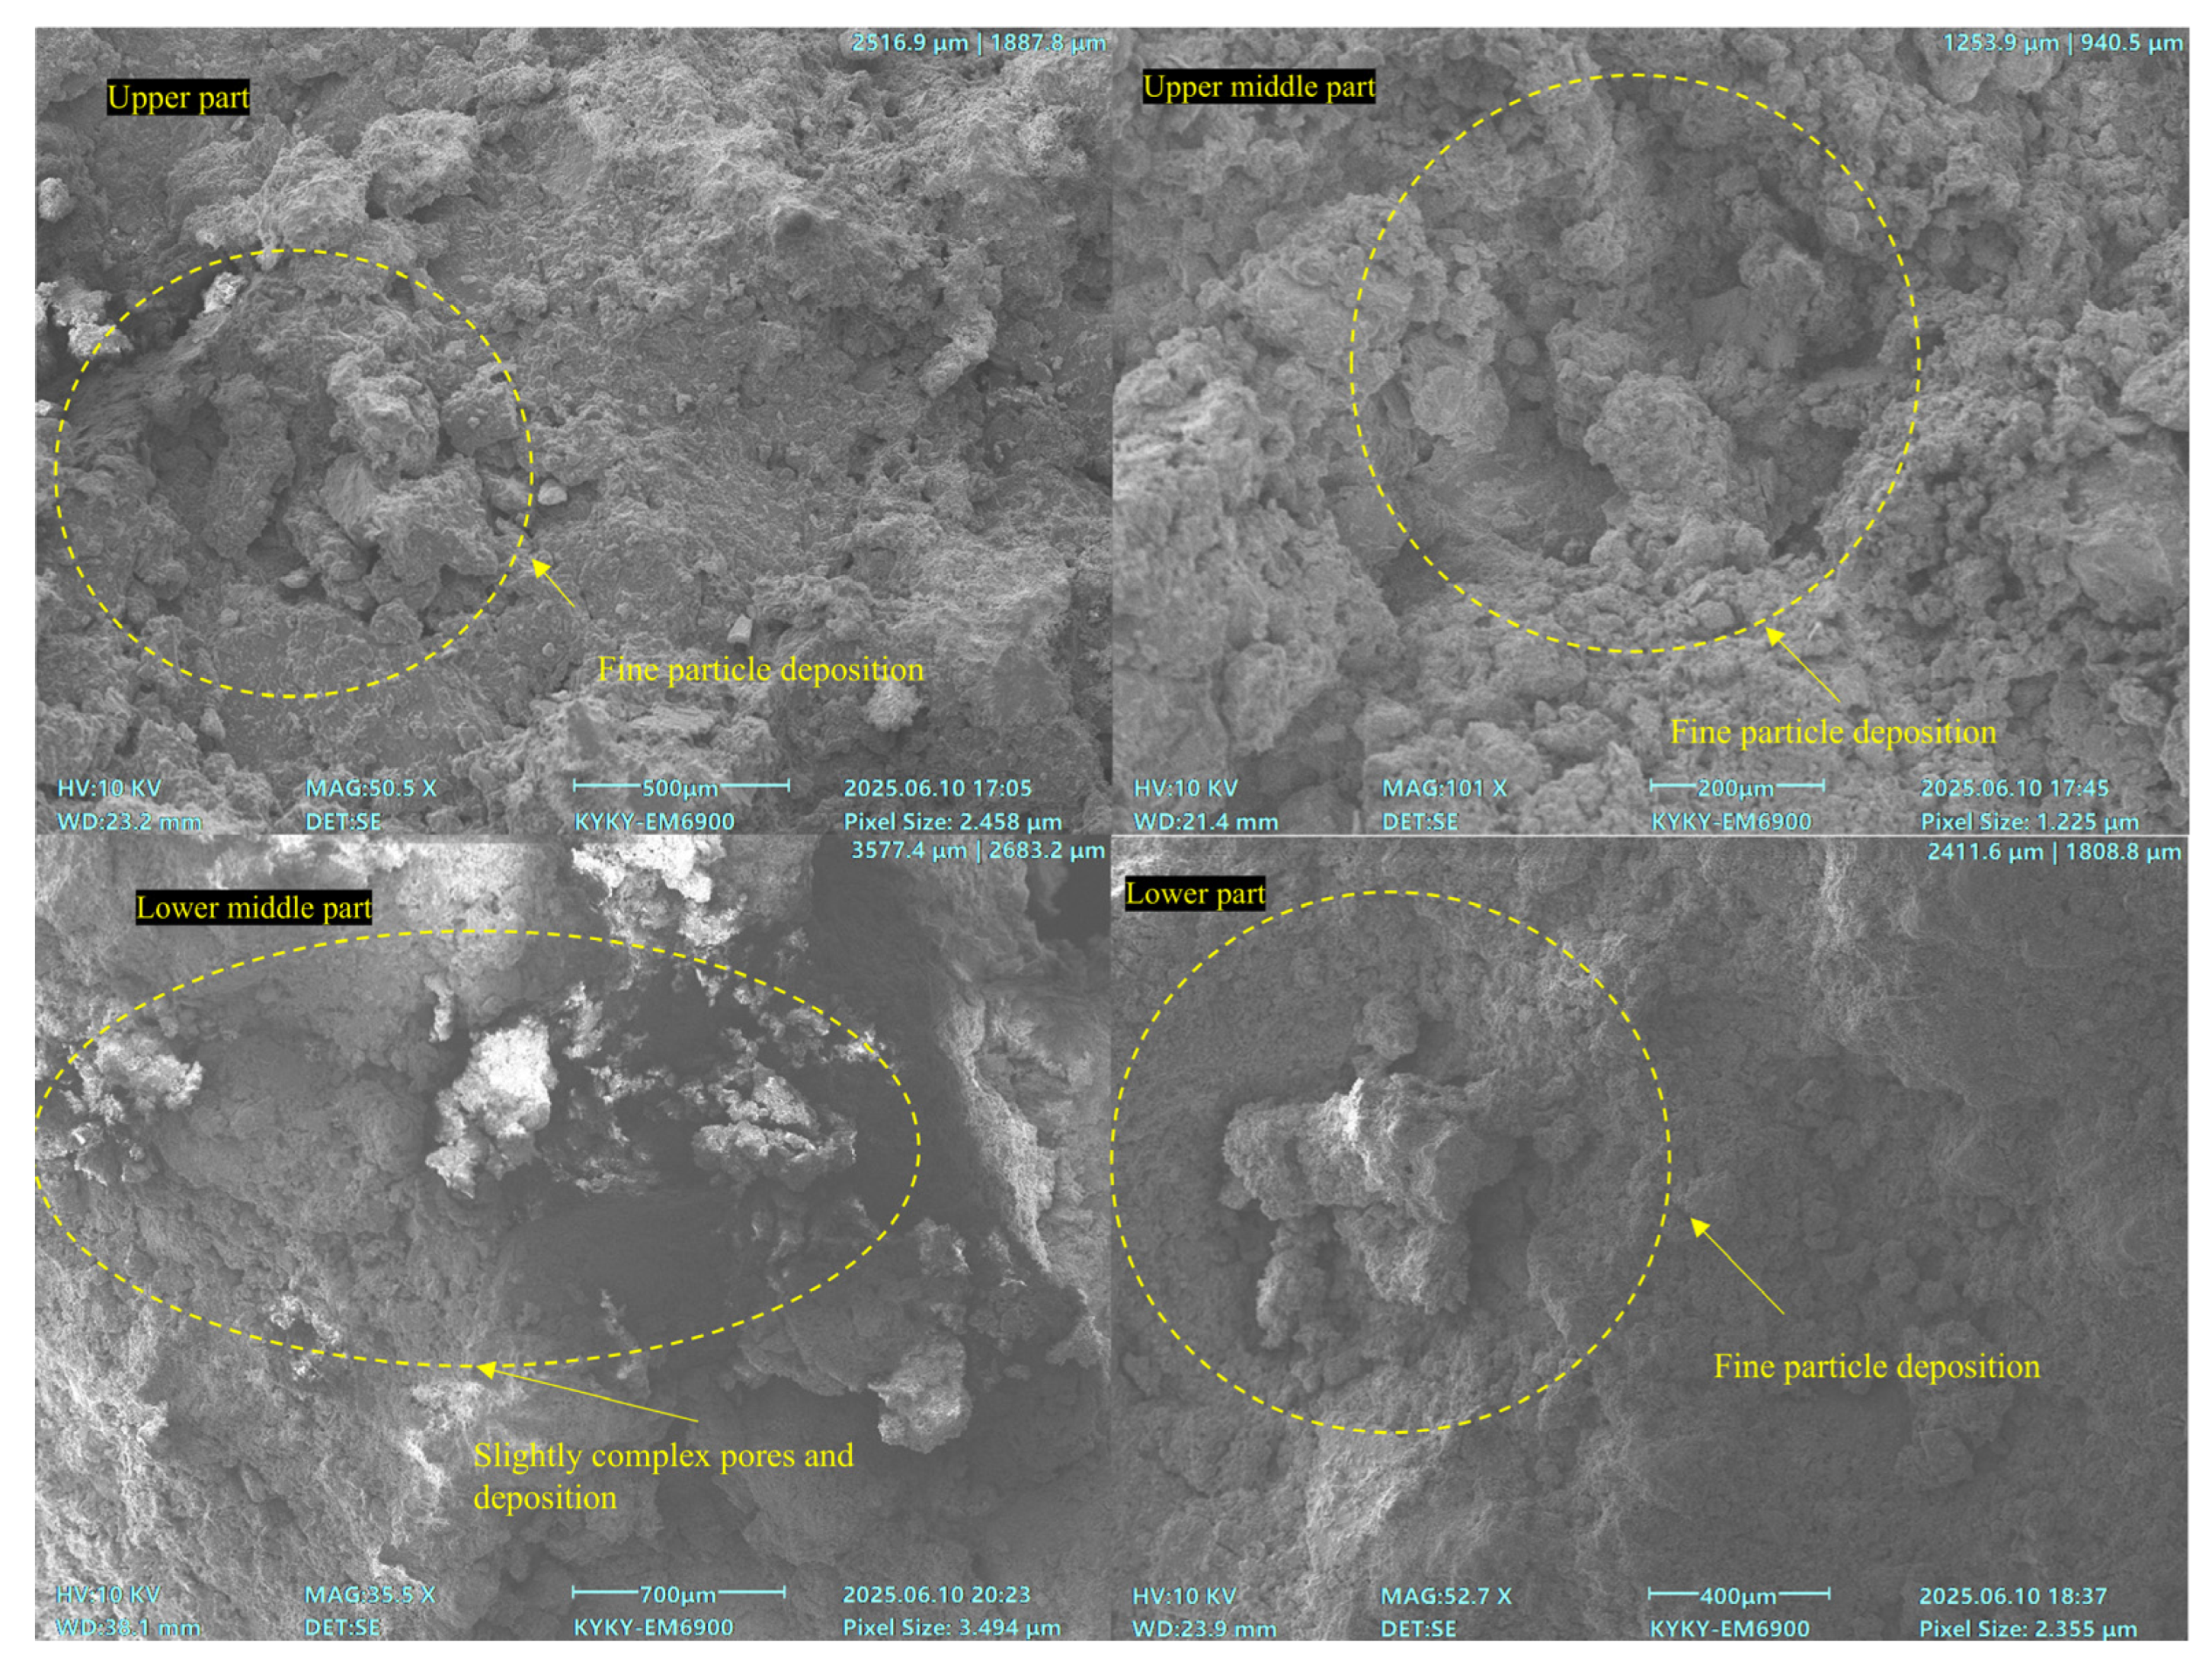
The widespread deposition of particles caused the high
c of ore sample b (
Figure 8). This deposition also hindered particle migration. Each layer was more uniform and compact, enhancing
c, with only the lower middle part slightly complex. This complexity improved the interlock, slightly increasing the
φ. Additionally, minimal particle loss resulted in higher overall
c compared to other groups.
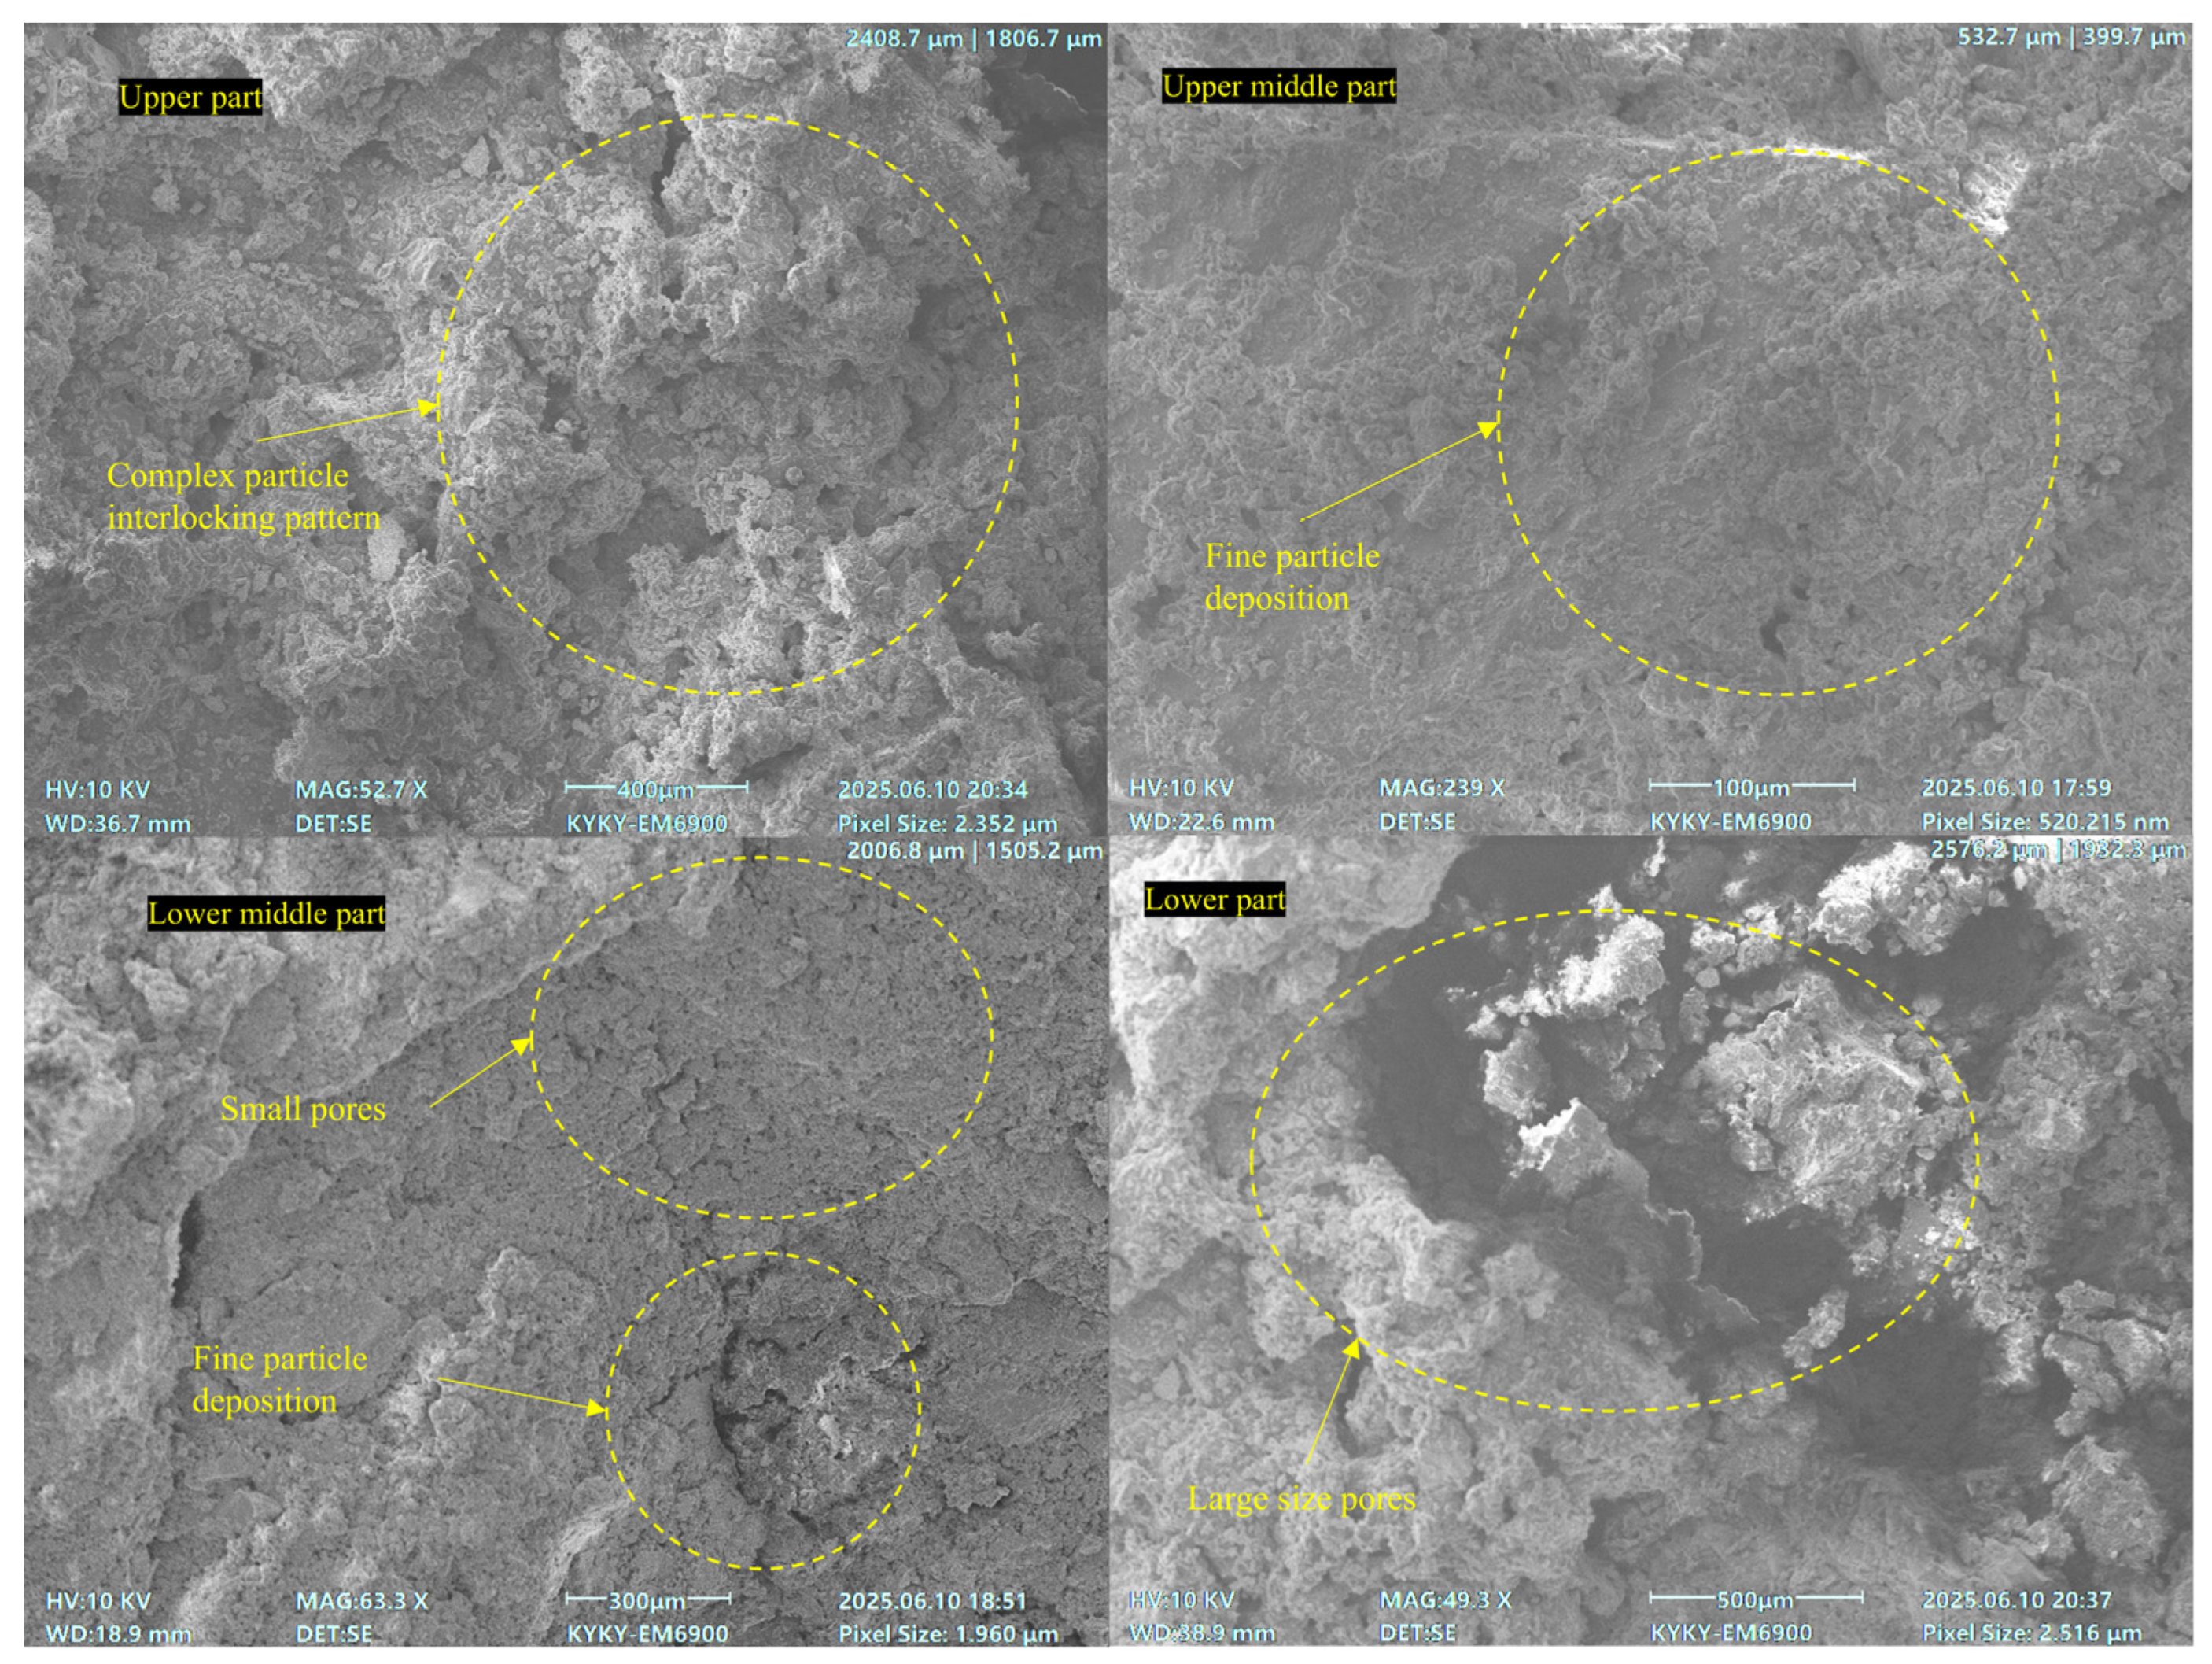
In group c, the upper middle, lower middle, and lower parts had a higher
c but a smaller
φ than the upper part. The upper part had a complex interlocking pattern of particles, as shown in
Figure 9. It also experienced a significant loss of fine particles. These factors resulted in fewer interparticle contacts. In contrast, both upper middle and lower middle parts had small and blocked pores. This indicated severe particle deposition. Fine particles from the upper part were deposited in the upper middle part. Some fine particles from the lower middle part were deposited in the lower part. This caused pore blockage in the lower part. Although the lower part’s pores were complex, their large size and low number made it hard to form interlocking structures. Particle loss mainly occurred in the upper part. Most deposition happened in the upper middle and lower middle parts. This distribution caused the difference in
c in this group.
In the SEM images of group d (
Figure 10), the upper part had more tiny and dense particles with a uniform pore structure and clogging. The upper middle part had uneven pore distribution, making it hard to maintain
c. Its slender particle shape led to complex interlocking and significant differences in the
φ. The lower middle part had some clogging and a slender pore structure, resulting in a high
φ. The lower part experienced more particle loss than deposition. However, its small and evenly distributed pores helped maintain the
φ. The upper and lower middle parts had a lot of framework particles. This caused them to clog easily. Once clogged, it was hard to clean them out. This caused less deposition in the upper middle and lower parts and led to a sharp drop in
c.
As the proportion of coarse particles increased, particle deposition moved upward. As coarse particles supported blockages and made deposited particles harder to flush away. Particle deposition significantly affected c and φ. It boosted c by making stress distribution more uniform and splitting large pores into smaller ones. The SEM results revealed that the φ is affected by several factors. These factors encompass particle migration and deposition, as well as the pore shape and distribution created by the coarse particles. After particle loss, if the pores were more dispersed and slender, the meshing ability between particles was stronger. It was more conducive to maintaining the φ.
3.3. Influence of Particle Migration on the Mineral of Samples at Different Depths
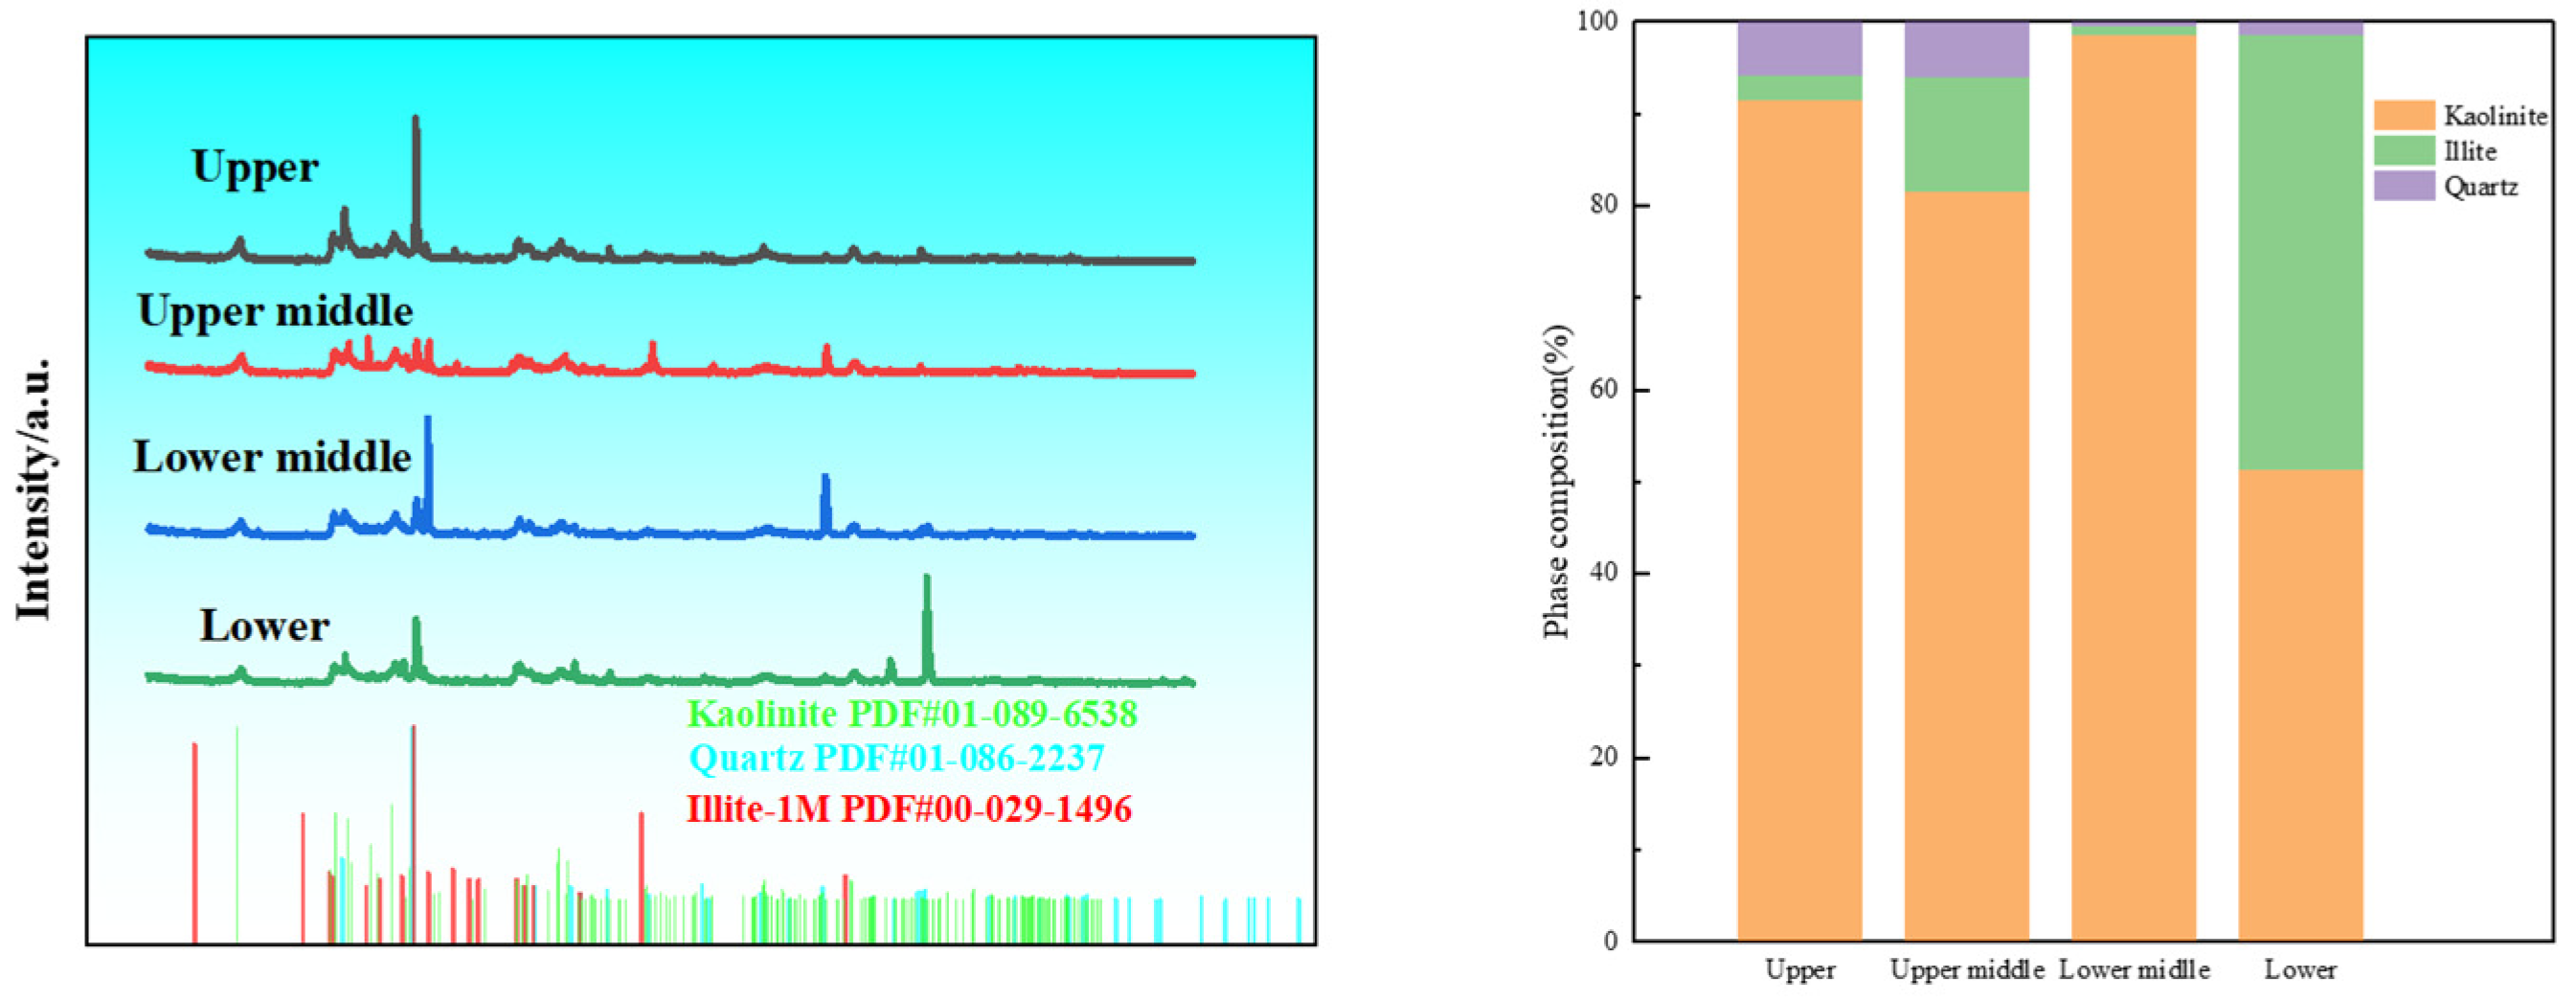
To explore the influence of particle migration on the mineral samples at different depths, ore samples of group a were selected as research objects by using XRD equipment, as shown in
Figure 11. The
c value is influenced by illite and kaolinite, while quartz content affects
φ. The main migration ability sequence of the three minerals is illite (mainly migrating three layers) > kaolinite (mainly migrating two layers) > quartz (partly migrating one layer). Illite is predominantly deposited in the lower part, kaolinite mainly settles in the lower middle part, and quartz is primarily found in the upper middle part. It is known from
Figure 7 that the deposition increases with burial depth. This makes quartz more abundant in the upper and upper middle parts than in the lower middle and lower parts. Some quartz moves from the upper to the upper middle part and from the lower middle to the lower part. Kaolinite and illite have the highest relative contents in the lower middle and lower parts, respectively. This indicates that kaolinite and illite are lost from the upper and upper middle parts, and they mainly deposit in the lower middle and lower parts. This makes the lower part have the highest
c. Meanwhile, some quartz moves from the lower middle to the lower part, making the lower middle part have the lowest
φ. Combined with shear test results, it is concluded that increasing kaolinite and illite contents enhances
c, while higher quartz content increases
φ.
3.4. Dynamic Analysis of Particle Migration at Different Depths
In this simulation, spherical particles and a bonded particle model were used to effectively simulate interparticle forces.
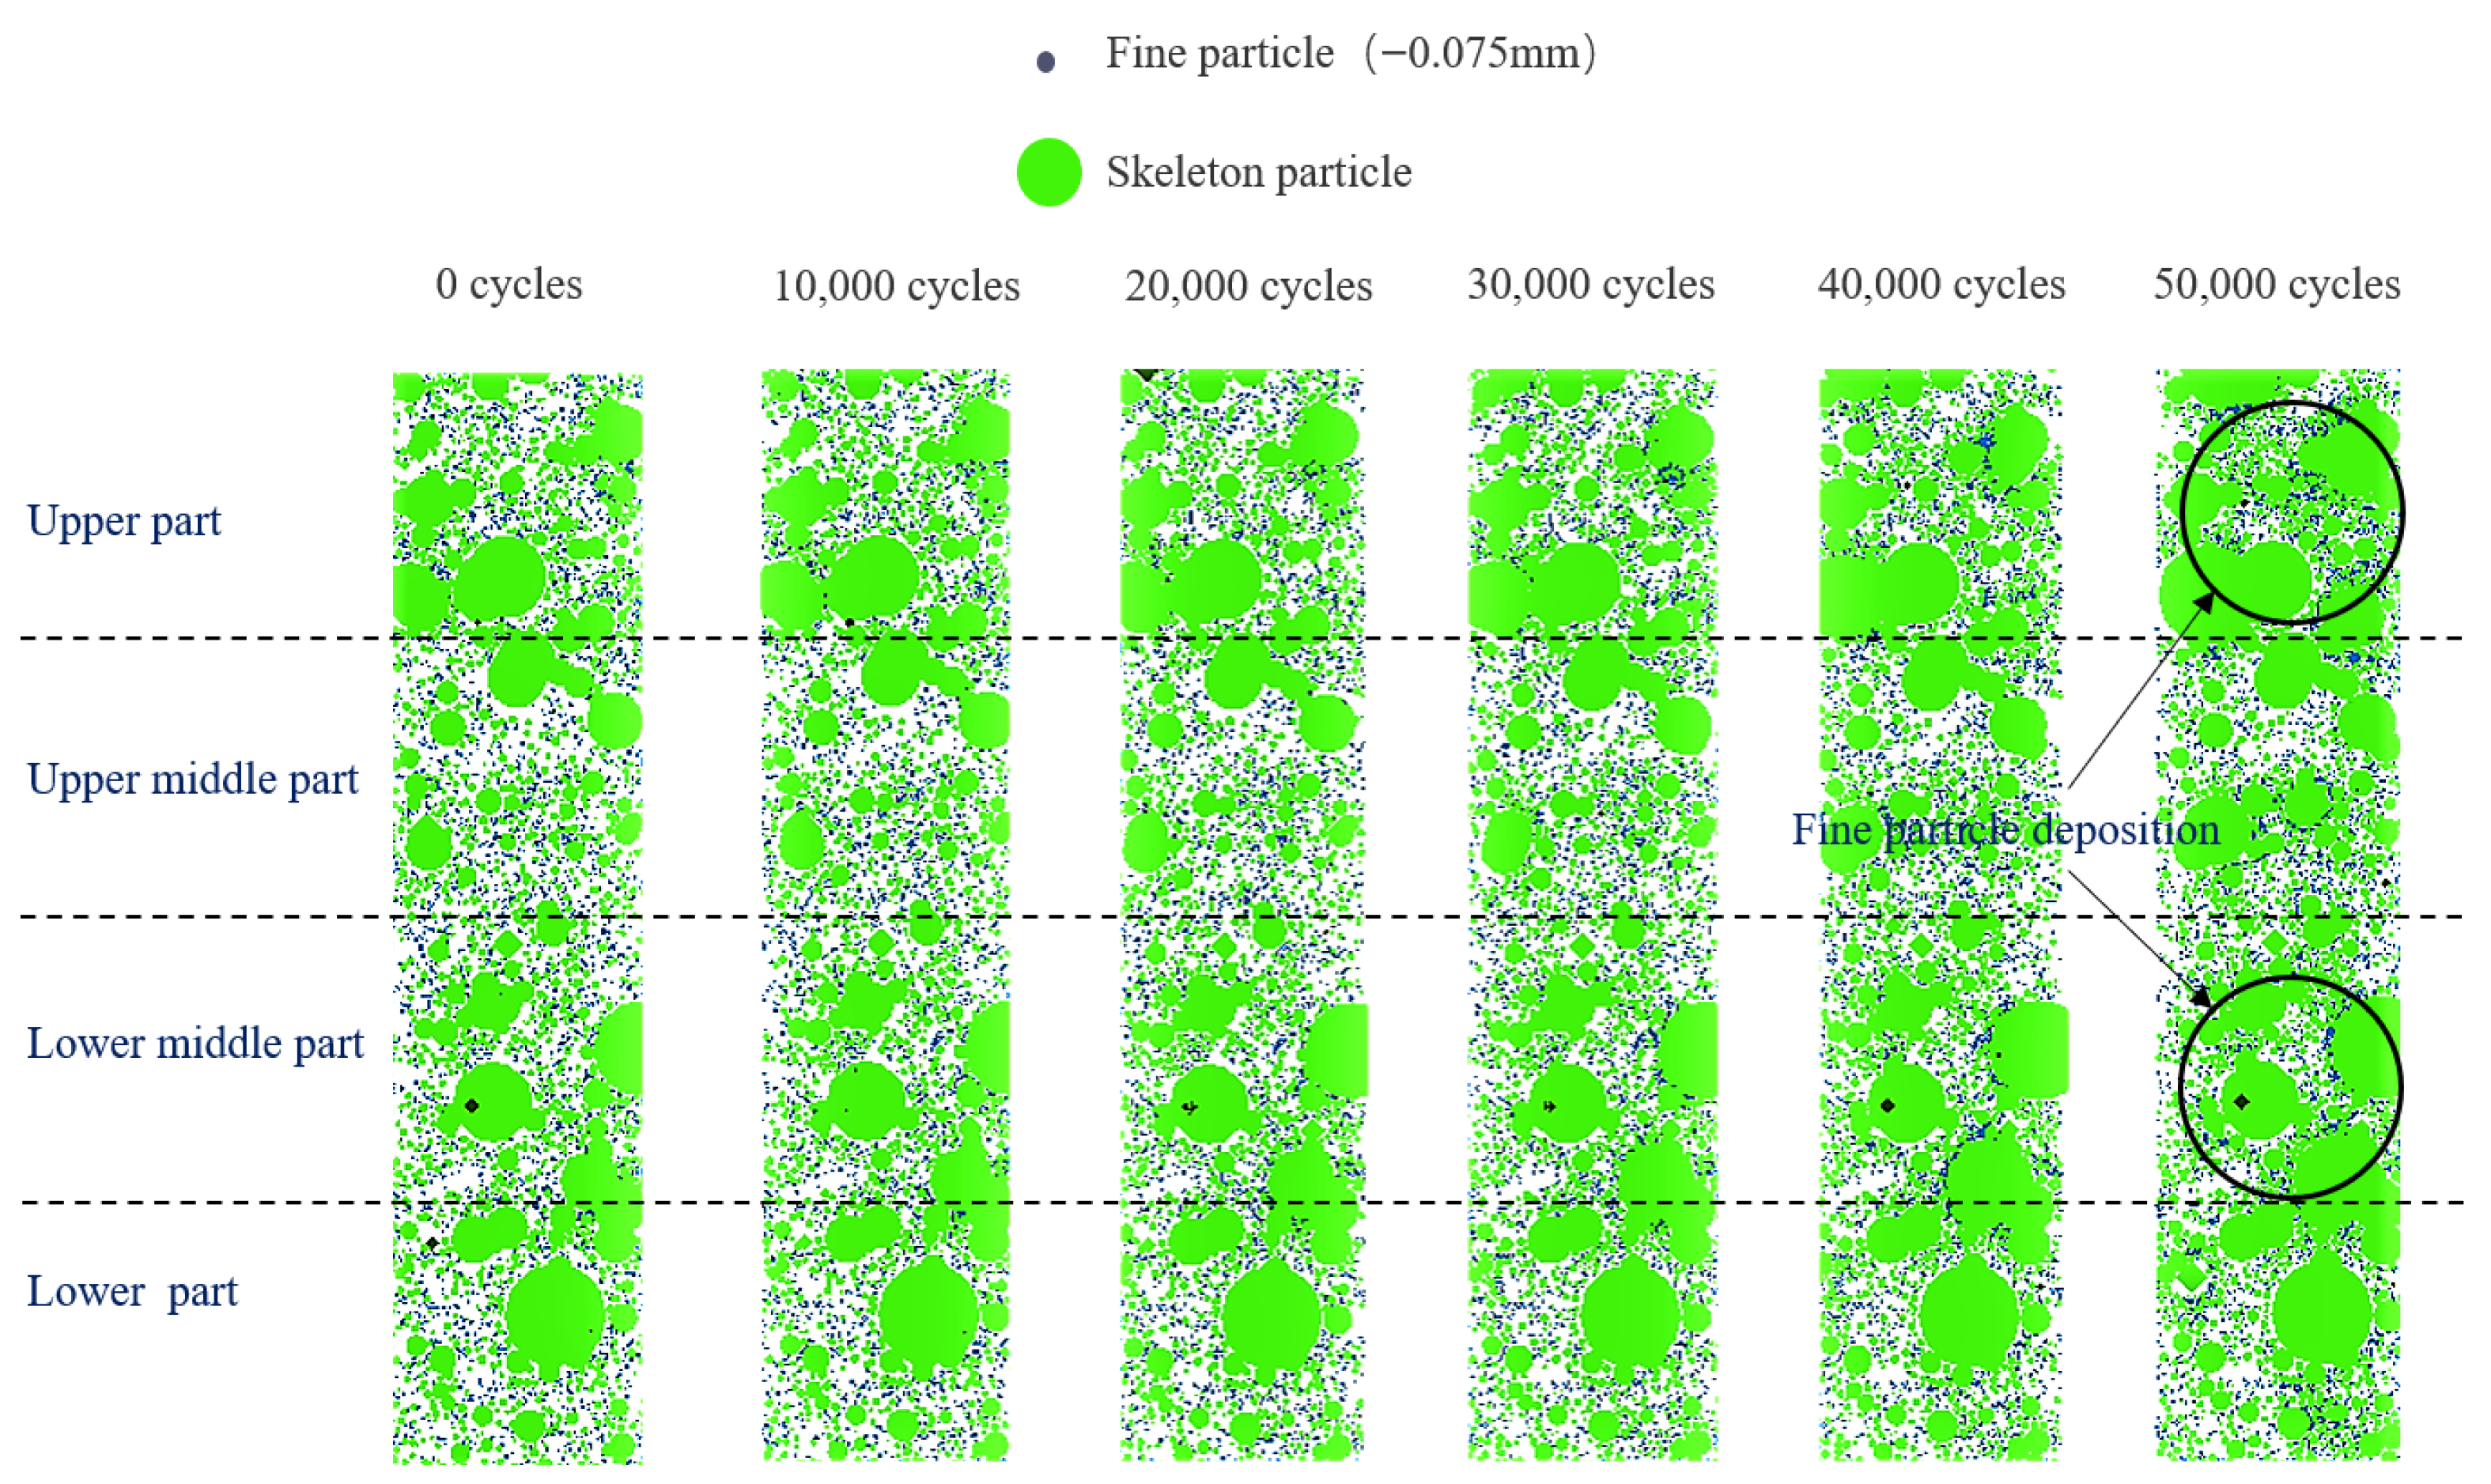
Figure 12 shows particle distribution in a vertical section with a fine particle proportion of 10% at different leaching stages to illustrate the influence mechanism of particle migration and deposition on the stability of the ore samples from the perspective of microscopic particle contact parameters. As leaching proceeded, noticeable particle deposition and clogging occurred in the upper and lower middle sections, while the upper middle and lower sections had minimal deposition and no clogging. Compared with the results of the shear experiment, it can be concluded that this clogging enhances particles’
c.
During the leaching process, the changes in contact number, coordination number, and porosity of the orebody are linked to its stability. The contact number distribution shows the closeness and diversity of connections between particles, while the coordination number directly reflects the packing density of orebody particles. Analyzing these two aspects can reveal whether the orebody has a loose or dense internal structure. The orebody’s strength largely depends on the interparticle connections. Areas with high contact and coordination numbers have strong interparticle support and greater strength, whereas areas with low values are more prone to failure. Variations in contact number and coordination number can alter the pore structure, affecting local stability. Porosity changes indicate particle deposition amounts. Lower porosity means higher deposition.
As shown in
Figure 13, after the leaching process, the contact number distribution across different parts of the ore sample exhibited a distinct pattern. The upper part of the sample demonstrated the highest contact number, indicating a denser network of particle interactions. This was followed by the middle and lower parts, which showed progressively fewer contacts. It is consistent with shear test results and indicates that the
c increases with contact number. Initially, the coordination number experienced a slight decline across all areas due to fluid-induced particle dispersion. As the process of particle migration began to unfold, the coordination number in the upper and lower middle parts displayed a steady upward trend. This increase suggests that these regions were undergoing active deposition. On the other hand, the upper middle part exhibited minimal change in coordination number, indicating that deposition in this area was relatively limited. In the lower part, the coordination number initially increased, which could be attributed to the initial stages of particle deposition. However, it then decreased, possibly due to the clearance of blockages caused by the deposited particles. Finally, it stabilized, implying that a balance had been achieved between deposition and blockage clearance.
Due to the limitations of the sampling process, the initial porosity showed slight variations across different areas. Despite these initial variations, porosity decreased consistently in all regions as a result of particle aggregation. It is important to note that the simulation did not take into account the potential effects of particle dissolution. The upper part experienced the most significant reduction in porosity, followed by the middle and lower parts. This trend in porosity reduction is indicative of an increase in c, as the closer packing of particles resulting from reduced porosity generally leads to enhanced cohesive forces within the soil or mineral matrix.
An increase in contact number and coordination number both resulted in greater c, whereas a rise in porosity led to a decrease in c. Understanding these relationships can help optimize leaching parameters and enhance mining safety.
3.5. Effect of Particle Migration on Shear Failure Behavior
Given the above conclusions, it is concluded that the reason for particle migration was the difference in fine particles at different depths. Therefore, in the skeleton particles without fines, fine particles of 5% and 10% of the skeleton particle mass were generated to investigate their shear failure behavior. In addition to the effect of fine particle proportion, the φ was largely influenced by particle assemblage. So spherical particles were used to rule out the impact of particle shape, aiming to probe into the effect of sediment amount on φ. To more comprehensively and intuitively show the processes of contact damage and crack development, a 2D simulation was adopted.
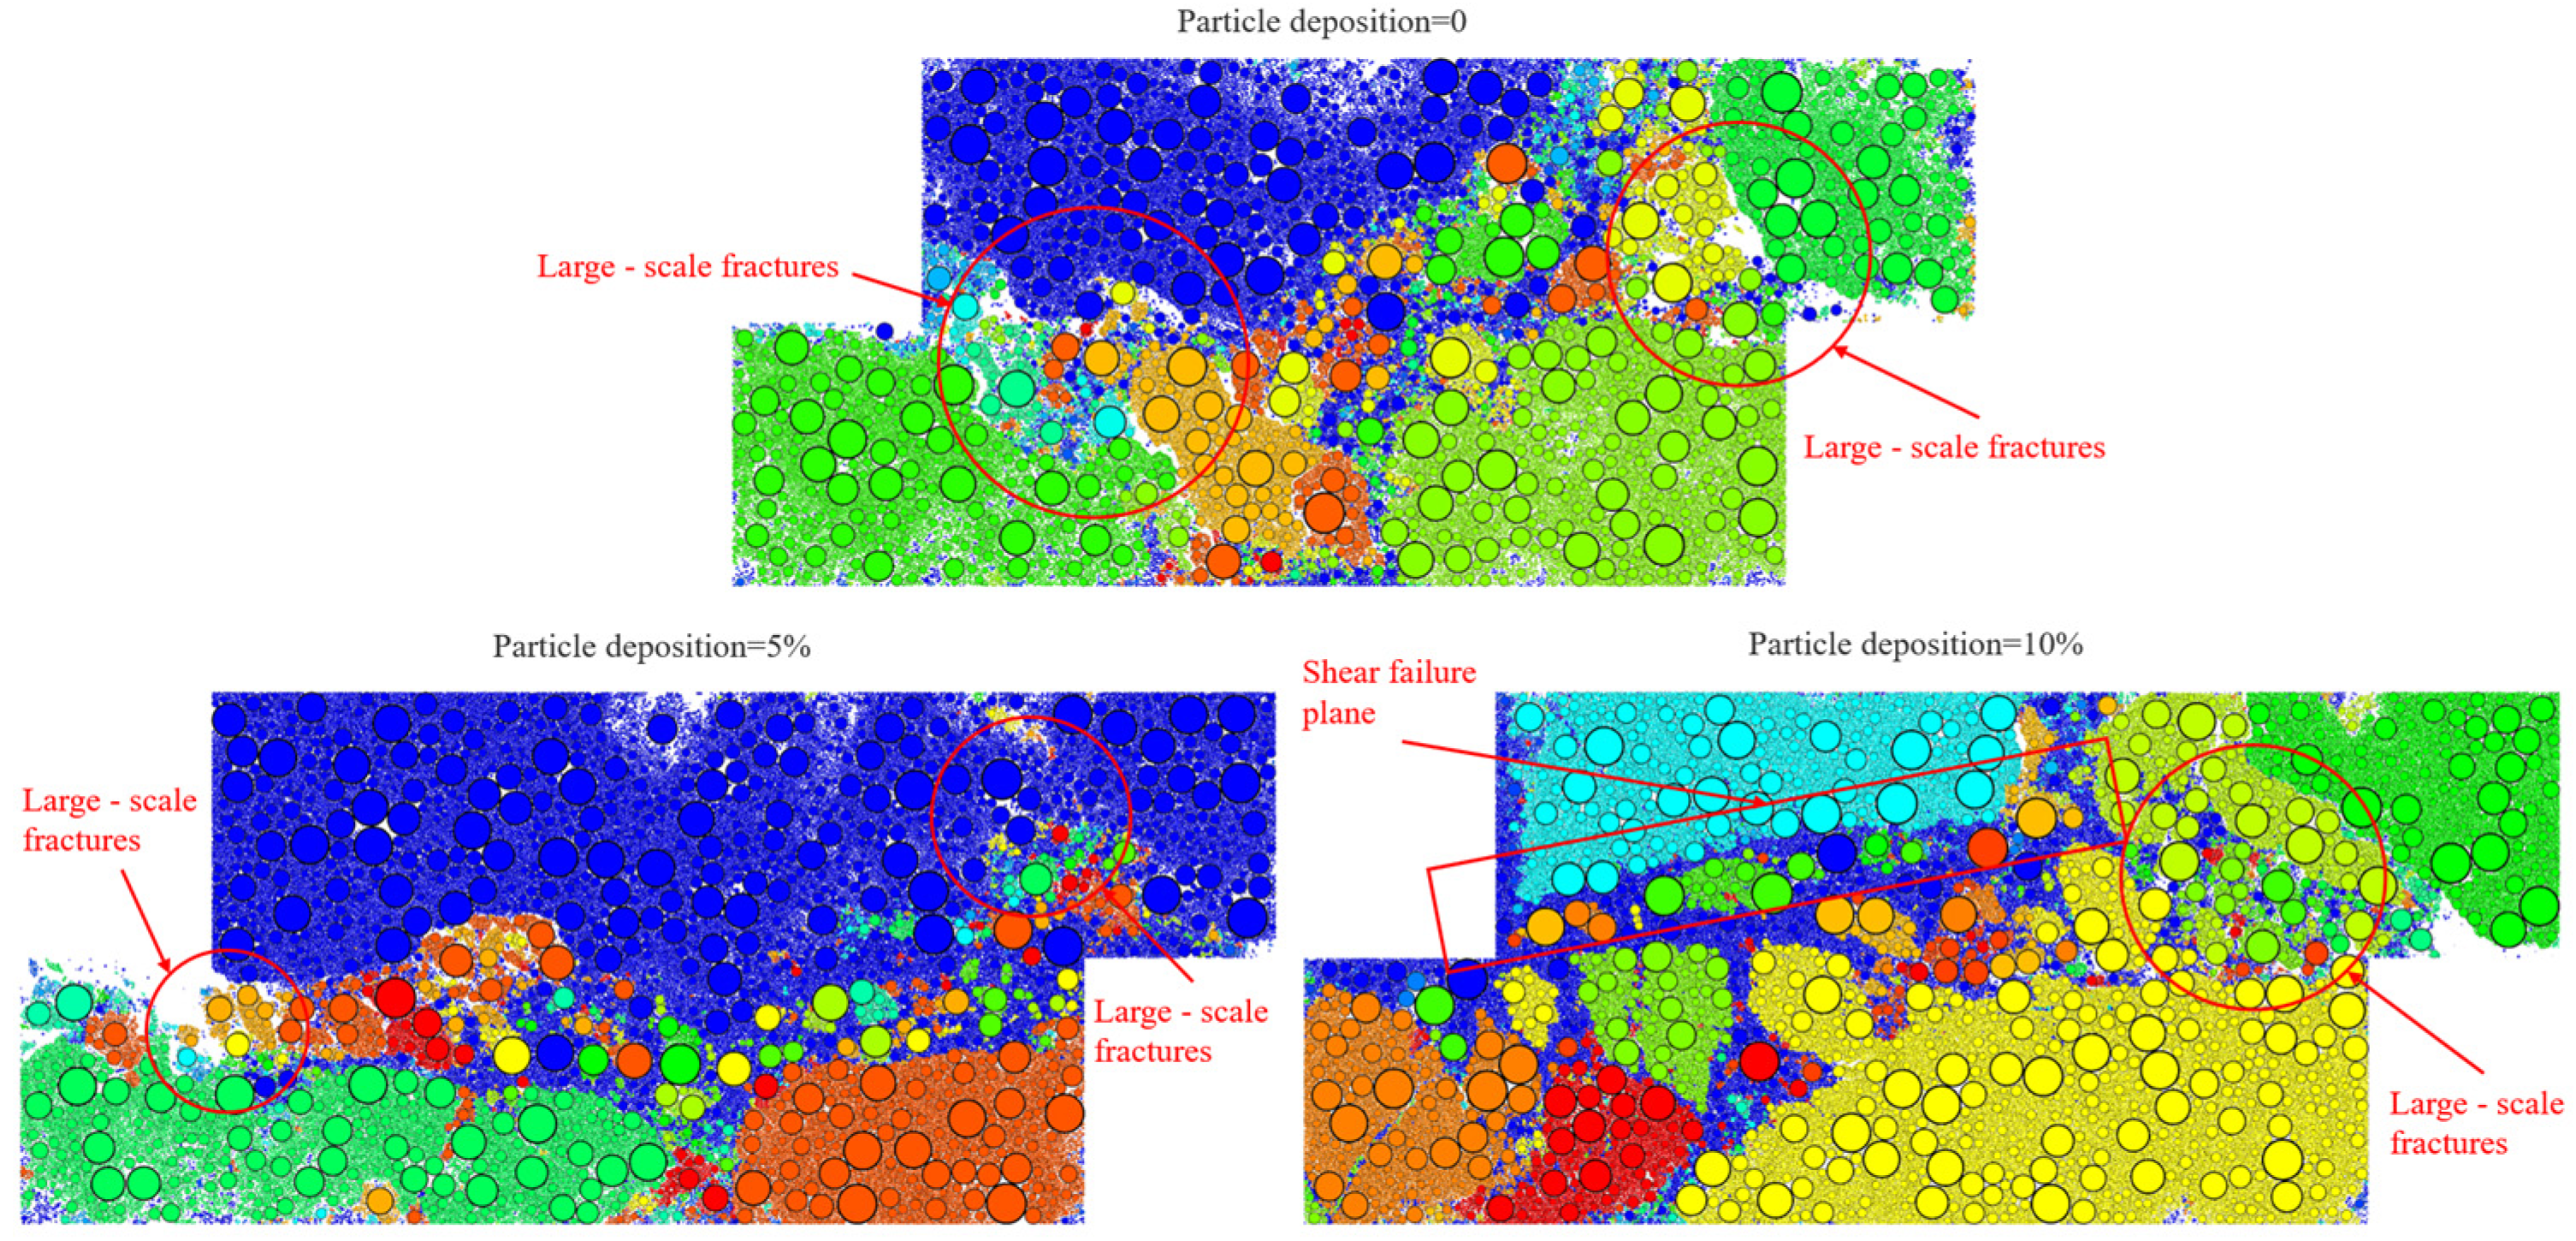
Figure 14 shows the shear failure modes of samples with different fine particle deposits. It could be seen that as the amount of deposited particles increased, large-scale fractures reduced significantly, and the overall structure became more cohesive. This indicated that particle deposition enhanced
c. Additionally, when the fine particle ratio was 10%, the shear failure plane formed a distinct angle with the horizontal plane. This demonstrated that particle deposition increased the
φ. Furthermore, a detailed analysis was carried out in conjunction with the simulated shear displacement nephogram and fracture orientation diagram, as shown in
Figure 15 and
Figure 16.
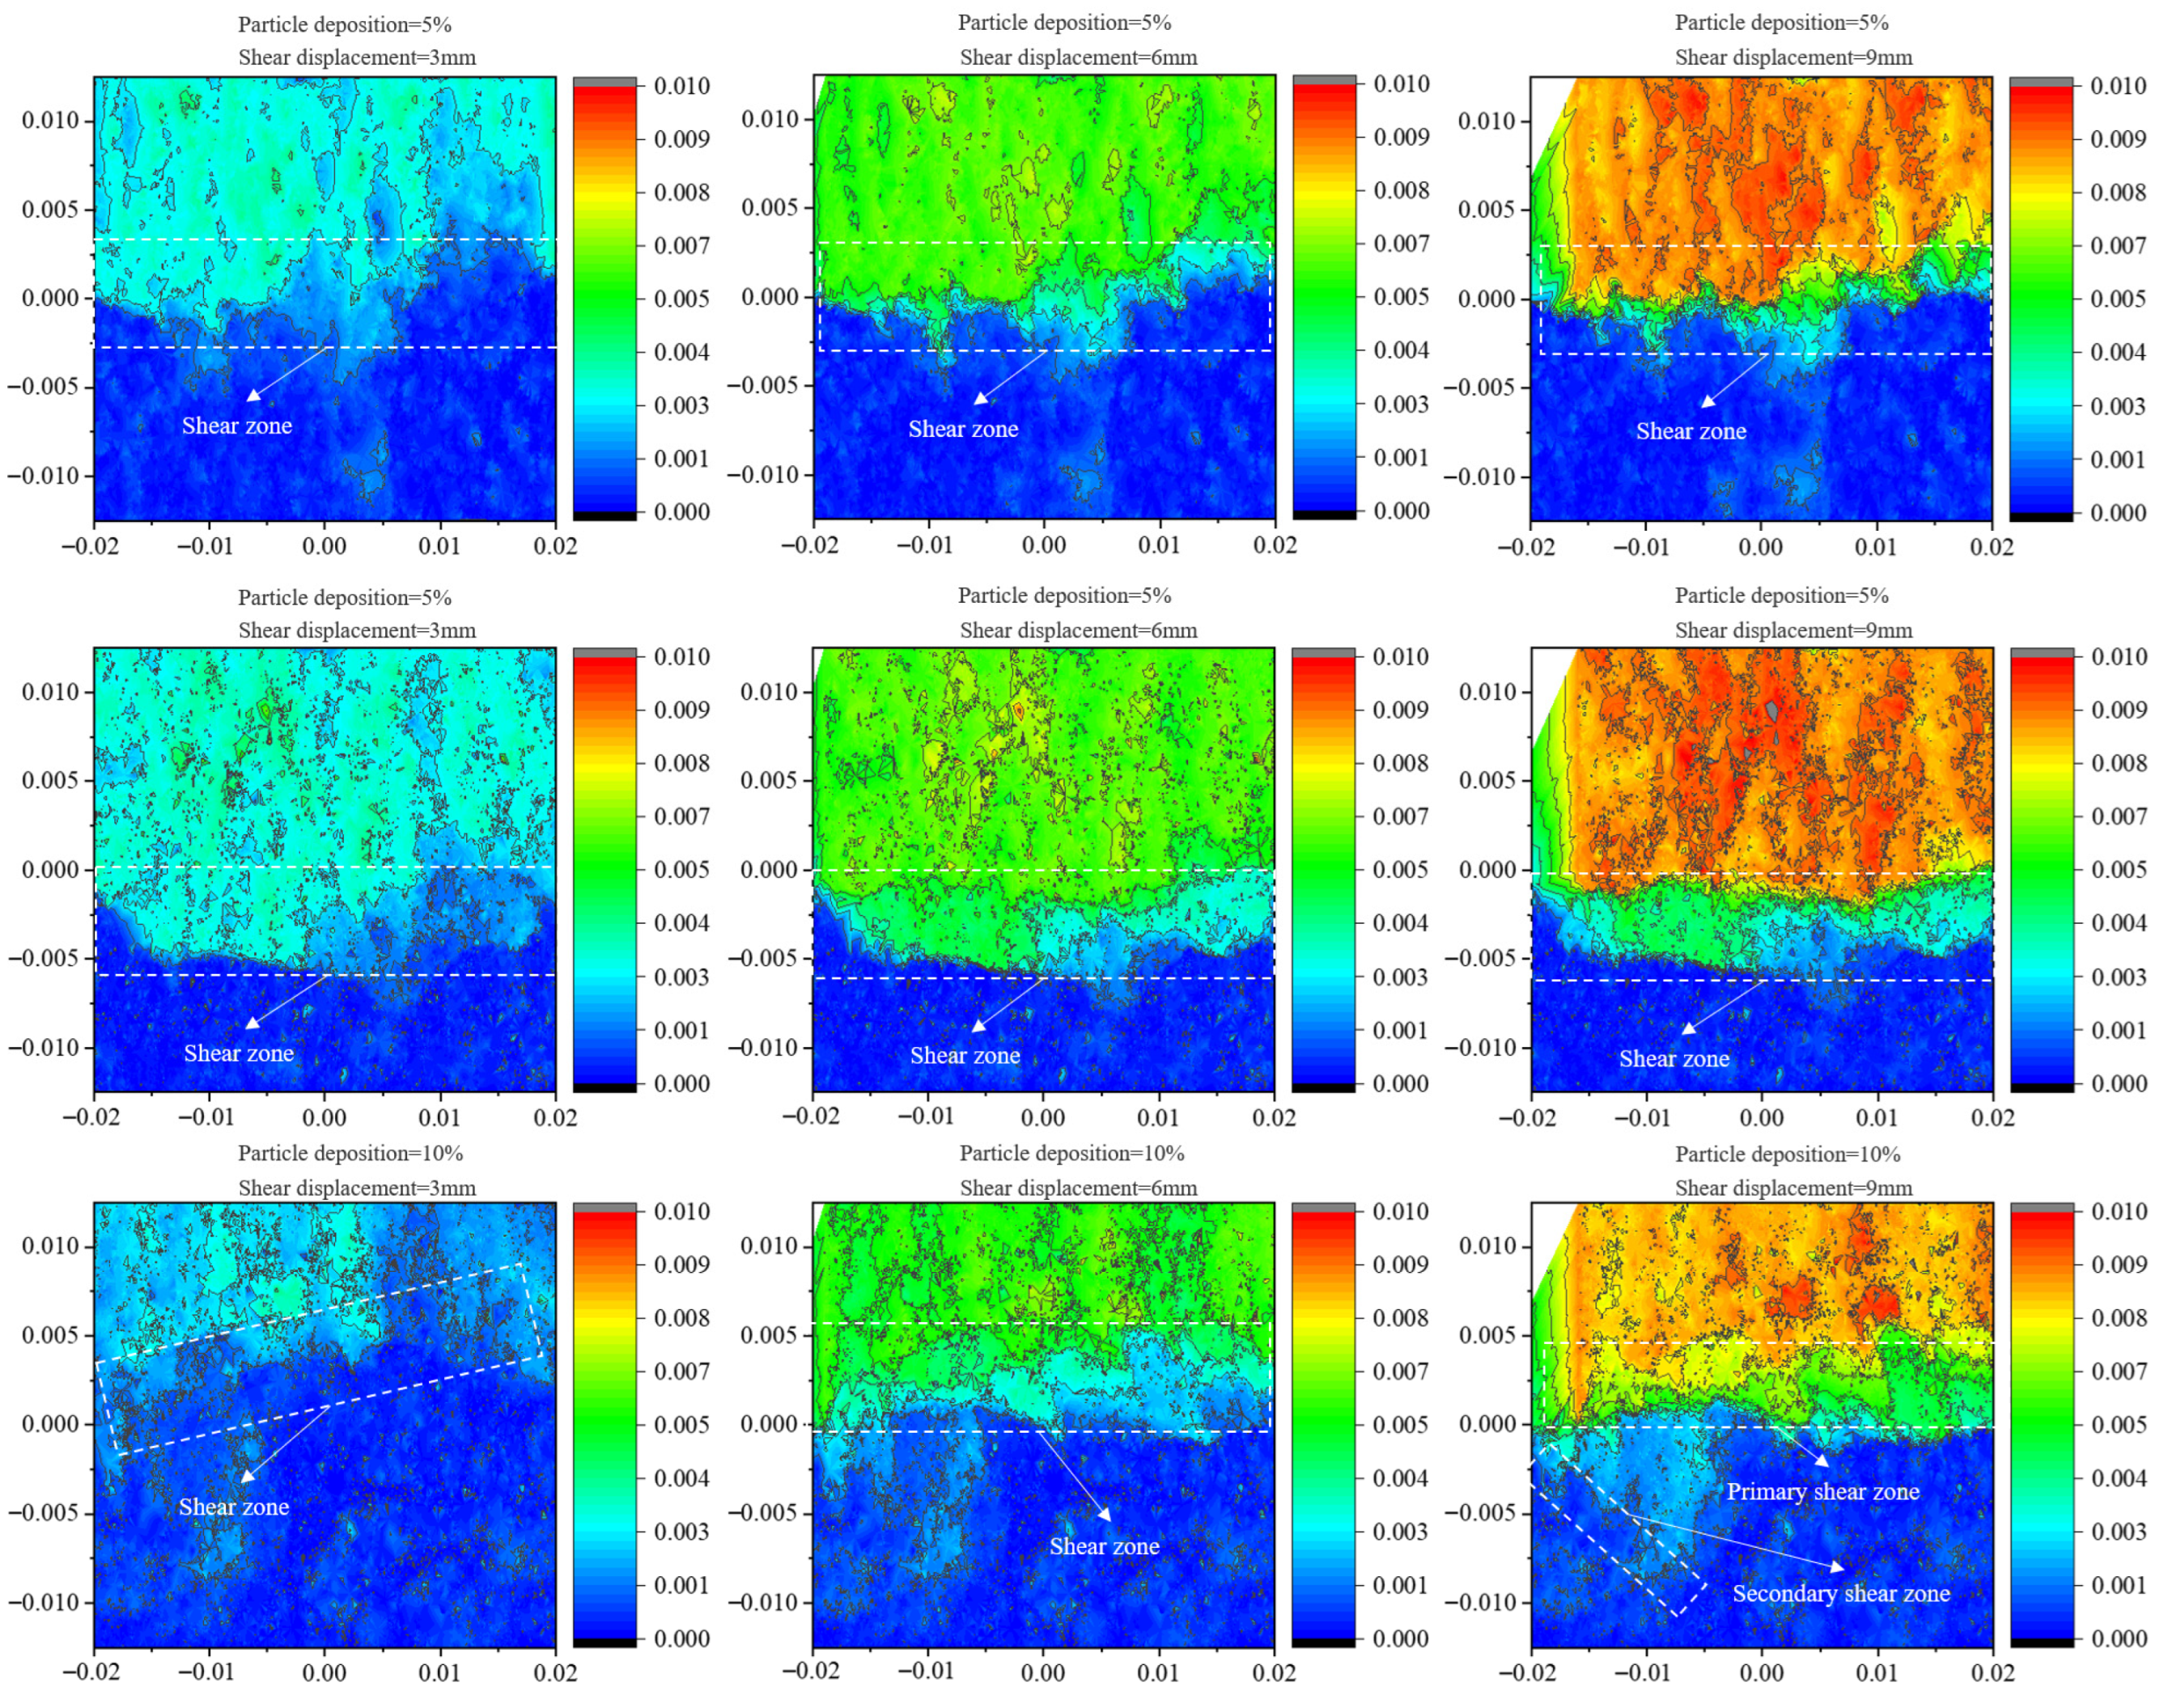
Figure 15 presents the displacement clouds during the shear process of ore samples with different fine particle deposits. As the deposited particles increased, both the
c and
φ values increased. Compared to ore samples without deposition, more deposited particles led to less relative particle displacement, showing stronger
c. This was because fine particles filled in and strengthened the overall ore body connection. Additionally, in the 10% deposition sample, a distinct shear-band angle formed early in shearing, and a secondary shear-band emerged later, indicating that more deposited particles increased the
φ.
In the 0% deposition sample, failure happened quickly in the early shearing stage, showing weak c. The shear-band path fluctuated up and down along the shearing direction without forming a certain angle, reflecting a small φ. This was due to the lack of fine-particle filling and cementation, which caused insufficient particle bonding and loose interlocking.
In the 5% deposition sample, after 3 mm of shear displacement, the left end of the shear band tilted downward and failed, and the sample had better integrity, indicating increased c and φ. The fine-particle deposition increased the contact points and friction between particles, thus improving the material’s shear resistance.
When the deposition was 10%, after 3 mm of shear displacement, the relative displacement in the sample was even smaller. The shear band tilted upward and maintained its angle for a longer length, showing that c and φ kept increasing. After 9 mm of shear displacement, a secondary shear band appeared in the lower-left corner, confirming the larger φ.
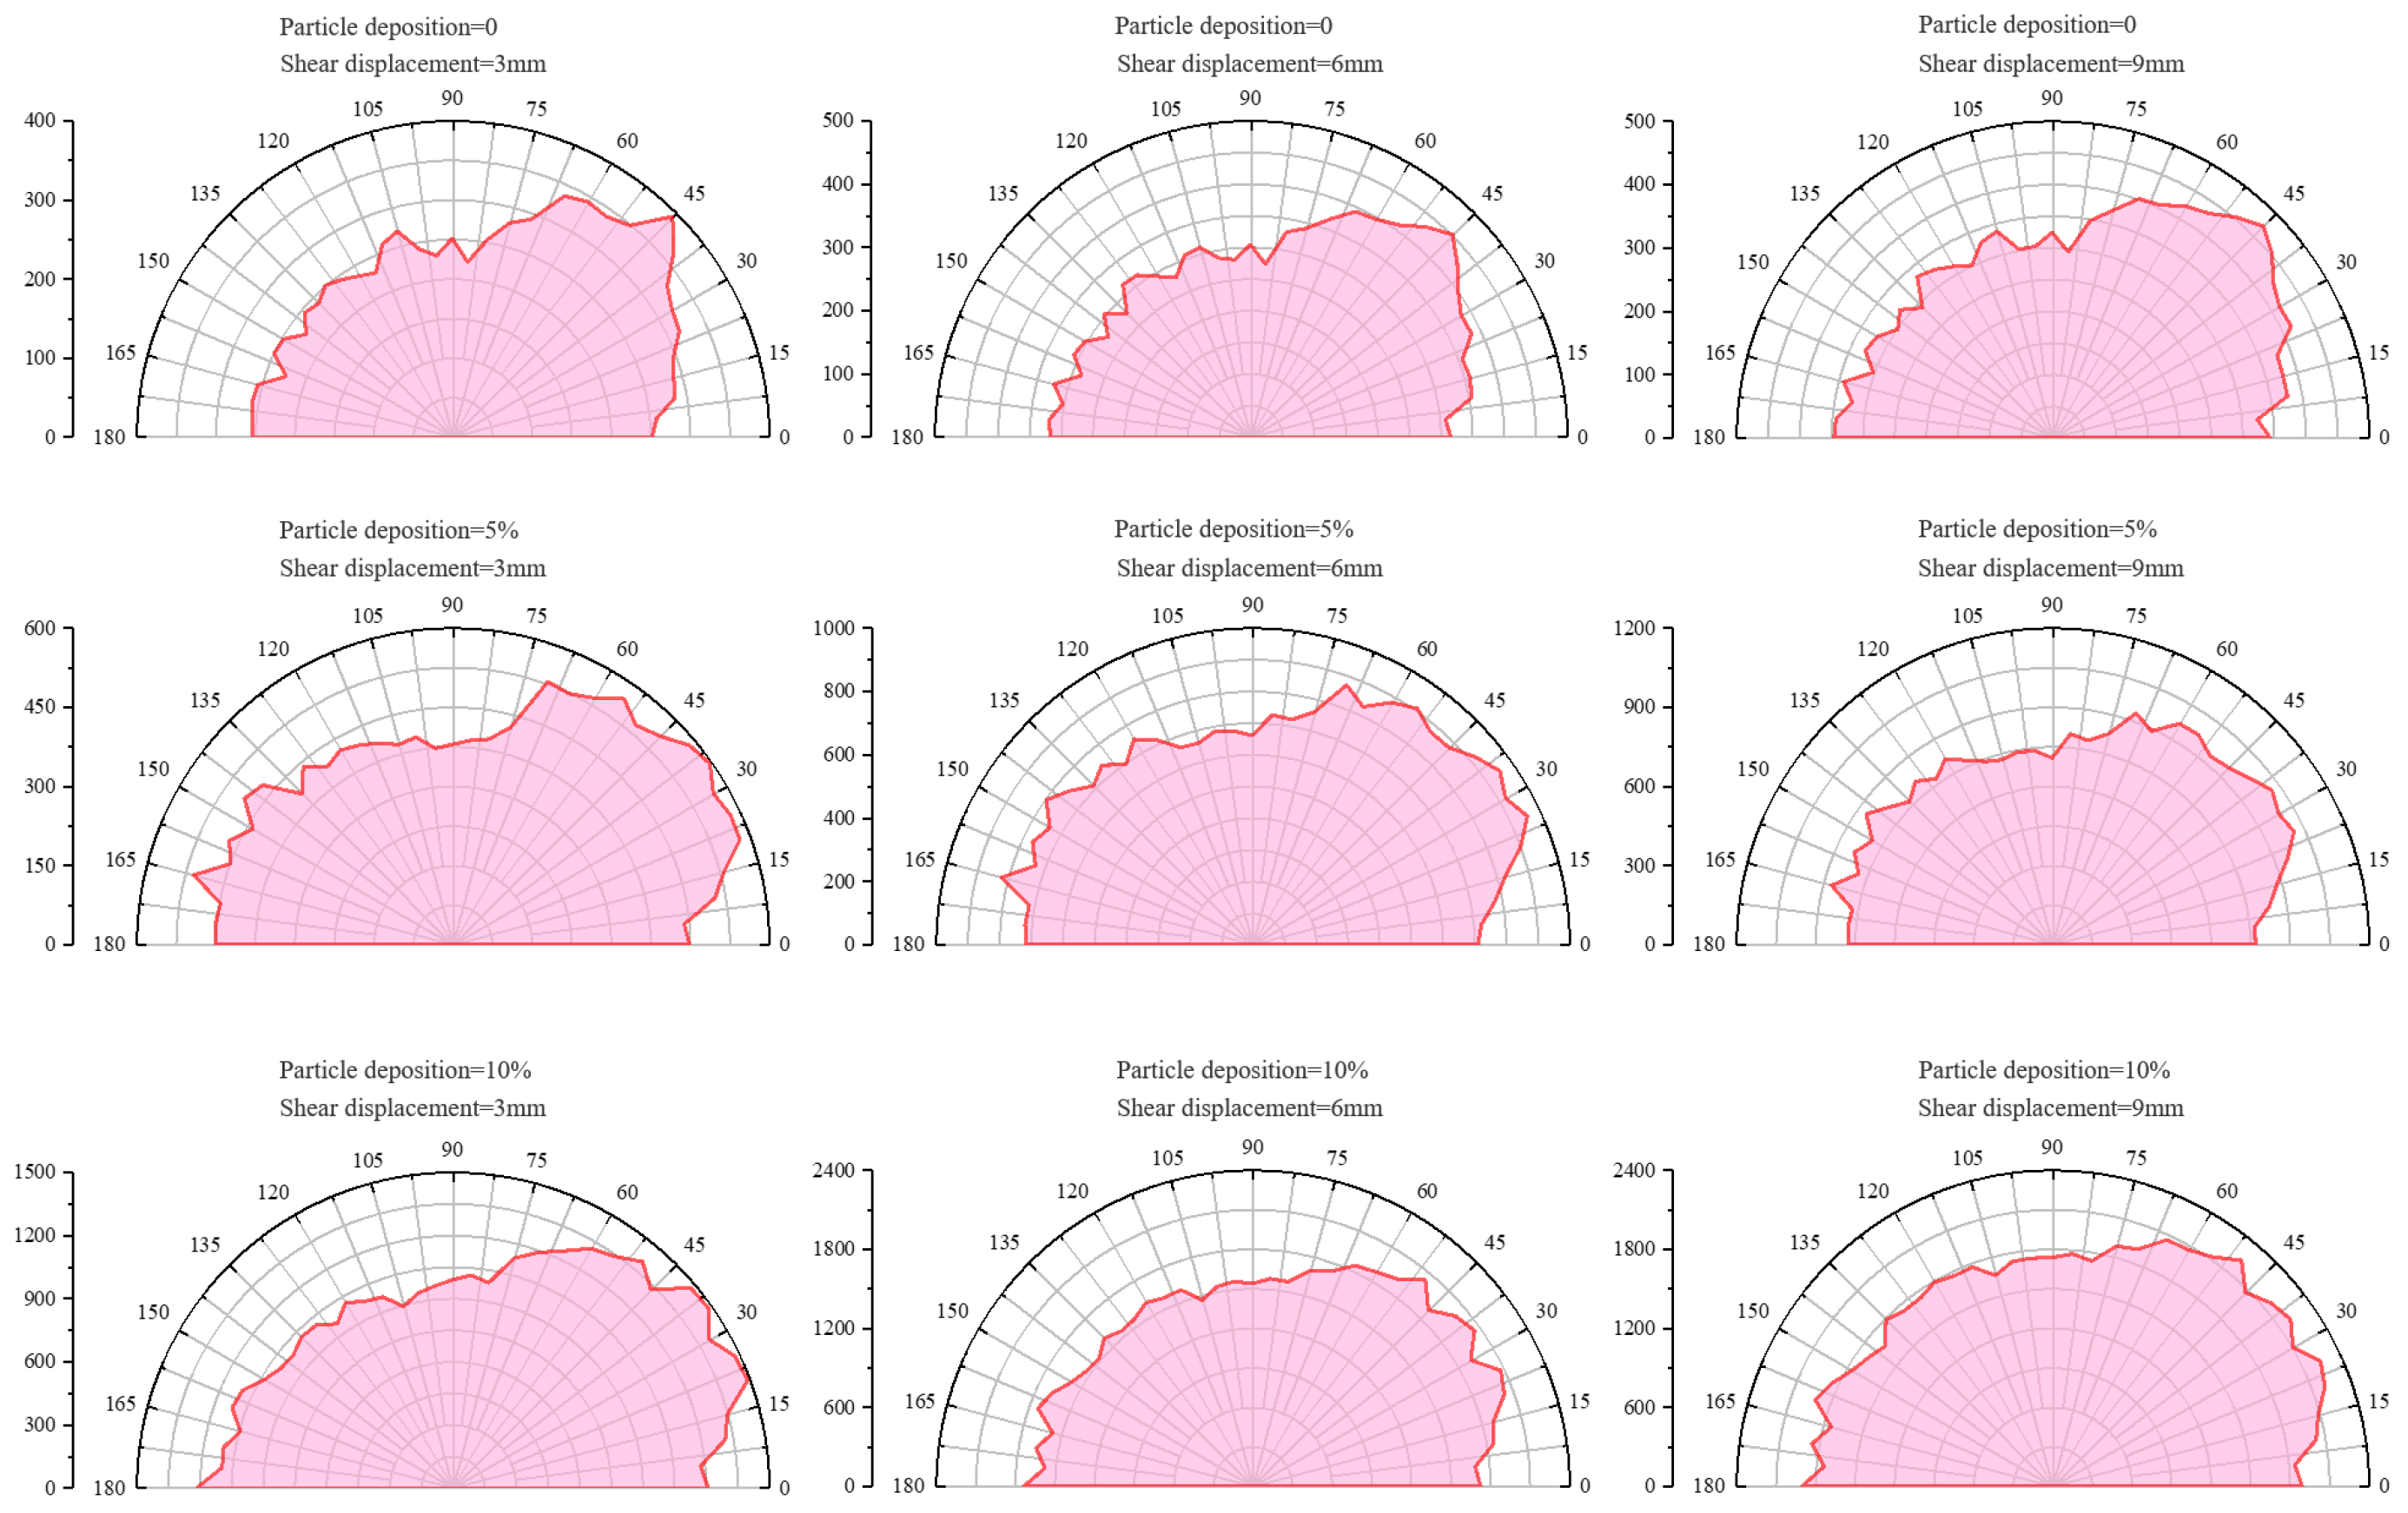
Figure 16 displays the rose diagrams of crack dip angles after shearing samples with different fine particle deposits. It was evident that increased deposition significantly boosted
c. The fine particles filled interparticle pores, creating more potential crack initiation sites and thus increasing crack numbers. Compared to samples without deposition, samples with higher deposition exhibited a wider and more uniform crack distribution, which further proved that increased deposition strengthened
c.
In the ore sample with 0 deposition, there were few fractures, and their dip angles were concentrated at around 45°, indicating a low c. This was due to the absence of fine particles, causing uneven particle contact and failure focused in the direction of the weakest c.
In the sample with 5% deposition, fracture dip angles ranged from 20° to 60°, with more and more evenly distributed fractures. The increase in fine particles split large fractures into smaller ones and strengthened particle bonding, resulting in a greater c.
In the 10% deposition sample, fracture numbers rose further and their distribution was even wider, indicating the highest c among the three groups.
