Article

Petrophysical Characteristics of Geological Formations of the Zhezkazgan Ore District (Kazakhstan) and Their Relationship with Mineralization

Department of Geophysics and Seismology, Satbayev University, 22 Satbayev Str., Almaty 050013, Kazakhstan
*
Author to whom correspondence should be addressed.
Minerals 2025, 15(11), 1106; https://doi.org/10.3390/min15111106
Submission received: 9 August 2025 / Revised: 18 October 2025 / Accepted: 19 October 2025 / Published: 23 October 2025
(This article belongs to the Section Mineral Exploration Methods and Applications)

Abstract

This work presents a generalization and analysis of the physical properties of rocks and ores from the Zhezkazgan ore district. Studies were carried out to identify general patterns in variations in the magnetic, density, velocity, and electrical parameters of the rocks that make up the geological section of the region. Based on the physical parameter measurements of the rock samples and drill cores collected in large quantities evenly throughout the region, a spatial analysis and quantitative assessment were conducted for the magnetic susceptibility, density, specific electrical resistivity, polarizability, and seismic velocity of the rocks. These properties were systematized at the level of formations, individual suites, and lithological heterogeneities. Correlations between the physical properties of the rocks, their composition, and the conditions of their formation were established. This study demonstrated the potential of using petrophysical characteristics in tectonic studies, geological mapping, and the identification of the exploration and ore-controlling factors in copper mineralization. It was found that the deposits of the productive horizons of the Zhezkazgan and Taskuduk suites are characterized by consistent physical parameters across the entire area, due to their relative homogeneity in lithological, structural–textural, and other features. The physical parameters of the rocks are influenced by several factors associated with mineralization processes, including changes in the total porosity, structure, and texture of the host rocks, alteration of the original mineral composition of the ores, fragmentation, fracturing, fissuring, and others. The obtained results significantly improve the reliability of geologically interpreting geophysical anomalies, especially in areas covered by loose sediments and where productive horizons are deeply buried. The detailed petrophysical analysis of the region has made it possible to provide recommendations for selecting an optimal set of geophysical methods for further successful work at the prospecting-evaluation and exploration stages in the Zhezkazgan ore district.

1. Introduction

This article focuses on the generalization and analysis of data on the physical properties of the rocks that compose the geological complexes of the Zhezkazgan ore district. The research results make it possible to model deep geological heterogeneities with a high degree of reliability during the analysis of geophysical fields and to detect the presence of new buried ore-prospective structures [1,2,3,4,5,6].
The Zhezkazgan ore district, located in Central Kazakhstan, is one of the largest copper-bearing regions in the Central Asia reserves and is characterized by unique geological–tectonic development and ore mineralization processes (Figure 1).
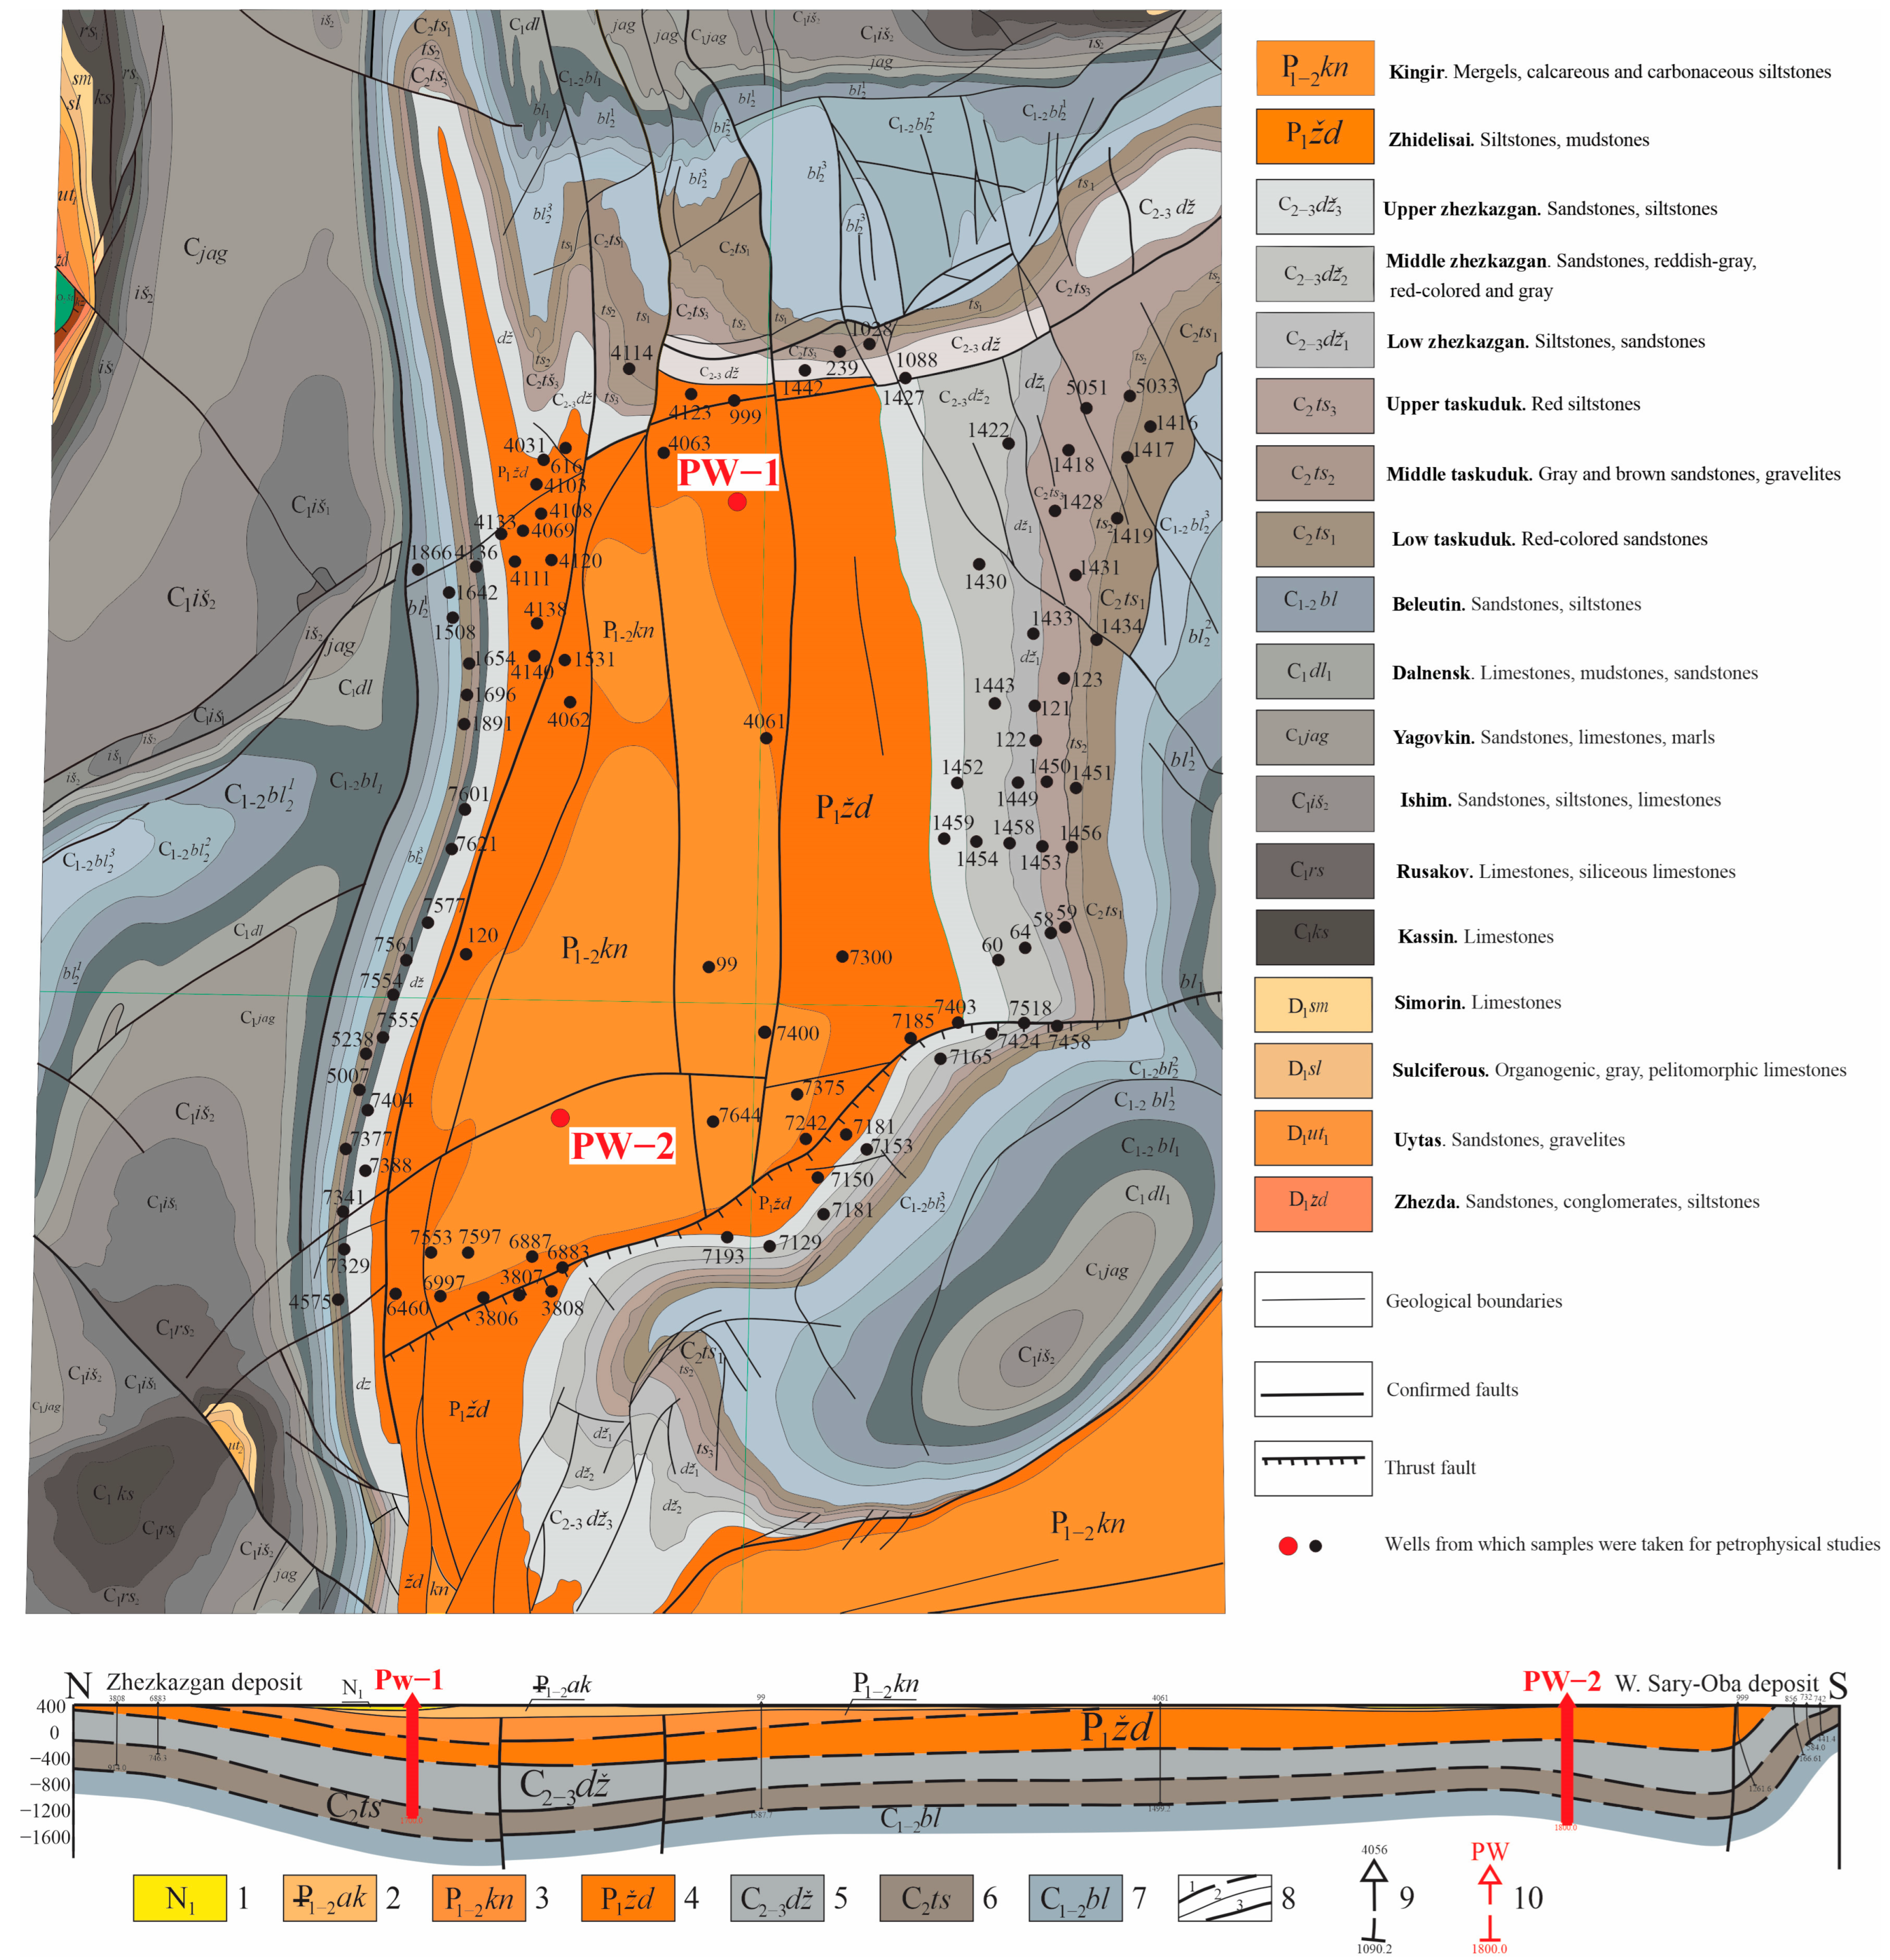
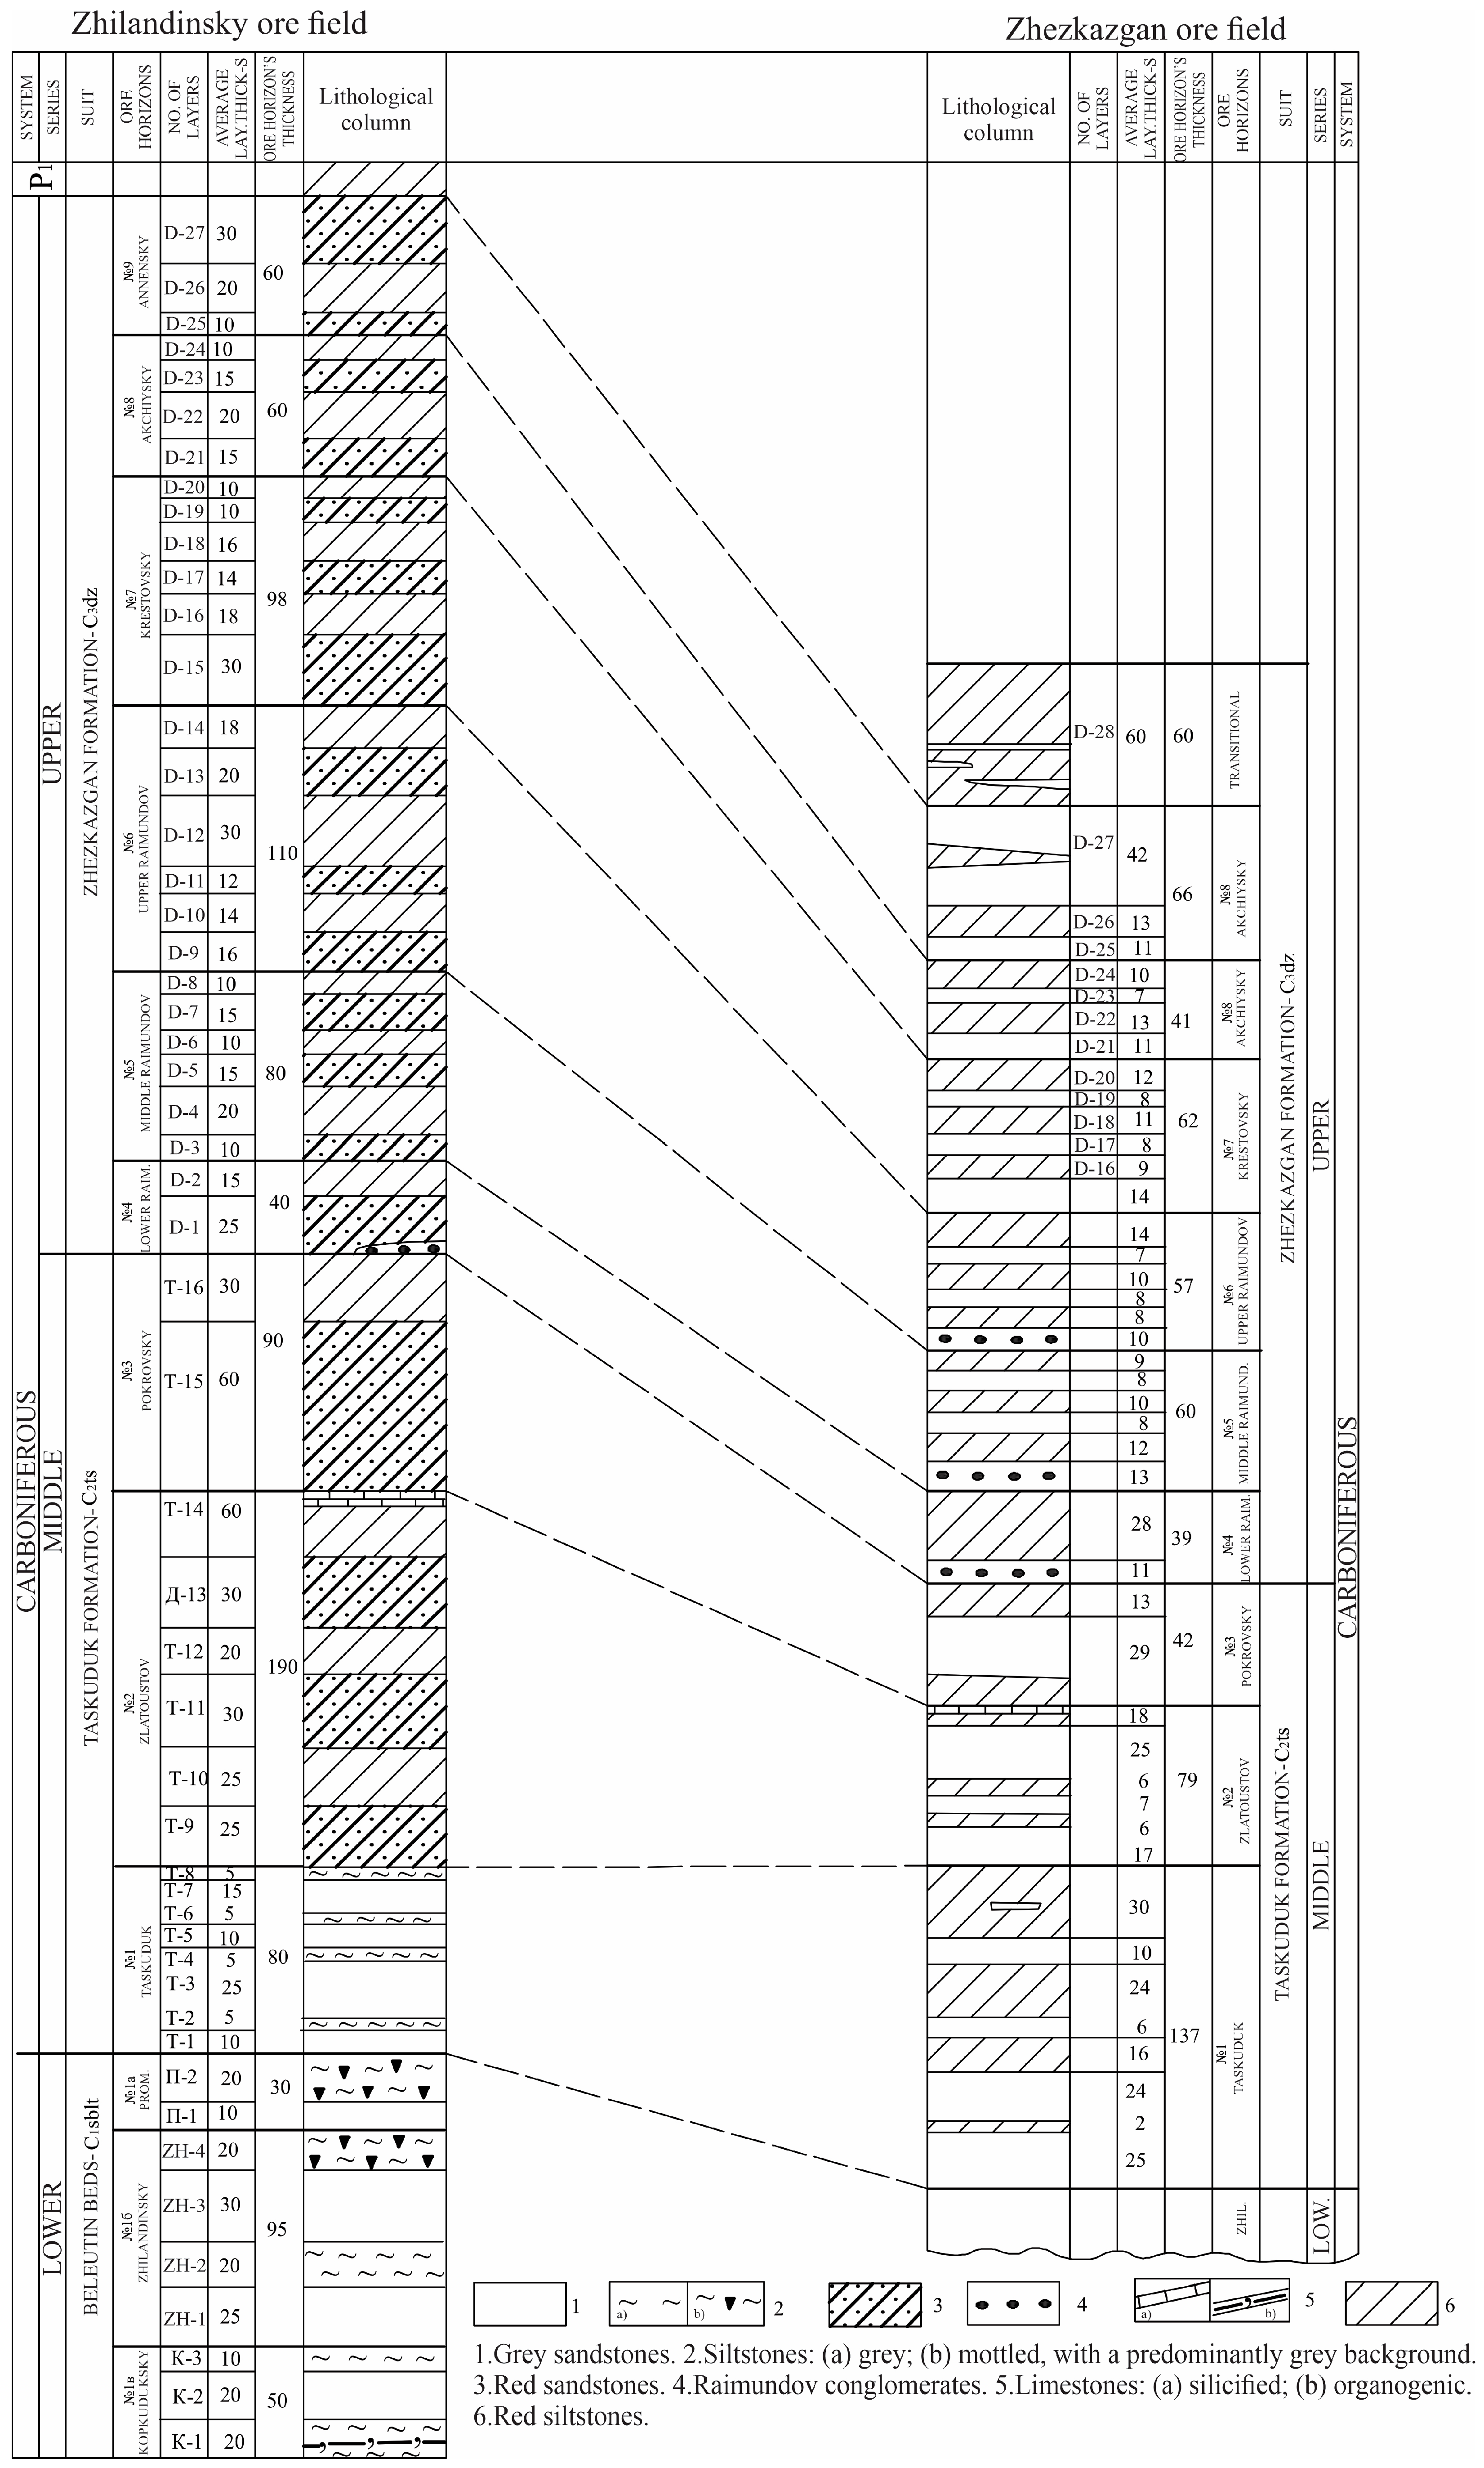
The Zhezkazgan structure is shaped like an asymmetrical trough with a meridional axis orientation. The polygenetic stratiform copper mineralization is represented by deposits and occurrences within the Taskuduk Suite of the Middle Carboniferous and the Zhezkazgan Suite of the Middle to Upper Carboniferous. The mineralization is associated with variegated sedimentary complexes, and ore bodies are localized in beds of gray-colored sandstones within these suites. Based on their formation conditions, they belong to the stratiform Zhezkazgan type (Figure 2 and Figure 3) [7,8,9].
Copper deposits in Zhezkazgan have been known since the Bronze Age and are genetically related to the polygenetic sedimentary–hydrothermal–metasomatic type. They are associated with the flanks of the Zhezkazgan syncline, situated within the large Sarysu–Teniz rift zone in Central Kazakhstan (Figure 2).
Within the ore district, two main groups of deposits have been identified, namely the Zhezkazgan and Zhilandy ore fields, including their flanks and deeper horizons (Figure 1). Over the years, several deposits and ore occurrences of the Zhezkazgan type have been discovered within the Zhezkazgan syncline and along its periphery, including Zhezkazgan, Karashoshak, Itauz, Kipshakpay, East Sary-Oba, West Sary-Oba, and Zhartas, as well as numerous ore occurrences and copper and polymetallic mineralization points [10].
The Zhezkazgan (southern) group of deposits, in addition to the main Zhezkazgan deposit, includes the North and South Akchiy occurrences, Spasskoye, and Taskuduk. The mineralization in this group is confined to the grey-colored horizons of the Zhezkazgan and Taskuduk ore-bearing formations.
The Zhezkazgan deposit is the largest in this group and in the entire region [11], containing the highest concentration of ore bodies. Its reserves are classified as unique, and it is situated at the southern closure of the syncline, where the constituent rocks gently dip over the uplift of the main depression. The deposit lies at the intersection of three deep-seated regional faults, in a structural node where three major fold structures—anticlines and synclines—converge [12,13]. The rocks here have undergone intense stress. The geological section is complicated by secondary folding—domes, depressions, and flexural bends in the strata. Deep faults played a dominant role in the localization of mineralization, creating favorable conditions for ore deposition and serving as pathways for metal-bearing fluids. In zones of maximum fracturing and high rock porosity, ore masses intrude, further deforming the host rocks and forming productive horizons [14,15].
The Zhilandy (northern) group includes the Sary-Oba, Itauz, Kipshakpay, and Karashoshak deposits and the Kopkuduk occurrence. It is associated with the Zhilandy syncline, which branches off from the northwestern end of the Zhezkazgan trough and stretches meridionally for nearly 20 km. This narrow (3 to 5–6 km) elongated structure exhibits features of a typical linear fold with complex internal architecture. It is subdivided into several synclinal cells, the southernmost of which is filled with sediments of the Taskuduk, Zhezkazgan, and Zhidelisai suites. The largest deposit in the northern group is Sary-Oba. In its central part, the Saryoba fault divides the ore field into two sections (West Sary-Oba and East Sary-Oba) and is expressed as a zone of intense deformation and brecciation, 250–400 m wide. The Saryoba fault and its accompanying minor disjunctive faults are ore-controlling structures. Overall, the structural framework of the Zhilandinsky (Northern) group of deposits and ore occurrences is characterized by complex tectonics, particularly at the Western and Eastern Saryoba and Itauz deposits. These areas have been subjected to intense stress, which led to the formation of not only folds but also major disjunctive faults, as well as zones of fracturing and rock fragmentation [16].
The Zhezkazgan syncline is geologically well studied. Detailed geological mapping, exploration, and geophysical surveys using a wide range of methods have been carried out within it. The region’s high level of exploration was achieved by the end of the last century through the efforts of various states. Numerous geological and geophysical investigations have been conducted here by both republican-level organizations and private companies. As a result, the prospects of the Zhezkazgan syncline itself—which measures approximately 22 by 12 km in plan view—have still not been fully determined to date. This is largely due to the deep burial of productive horizons in the central part of the syncline, reaching depths of 1600 m or more.
In 2017, two deep exploratory boreholes were drilled within the Zhezkazgan syncline, namely Borehole PW-1 (1800 m depth) in the northern part and Borehole PW-2 (1700 m depth) in the southern part of the structure, both with a high core recovery rate of 95%–100% (Figure 1). PW-1 intersected rocks of the Zhezkazgan suite (C2–3dz), Taskuduk suite (C2ts), and Beleutin layers (C1blt), confirming the presence of productive horizons in the northern part of the syncline, at the southern dip of the West Sary-Oba deposit. The drilling of PW-2 was halted at 1700 m in rocks of the Zlatoust horizon (C2zl). The results showed that the productive horizons of the Taskuduk suite and Beleutin layers in the southern part of the syncline lie deeper than in the north.
This has led to a focus on searching for buried and deeply seated ore bodies in the Zhezkazgan area. It is assumed that a significant portion of the structure, covering around 25 km × 15 km, may host medium-sized ore bodies in the form of sublatitudinal ribbon-like zones, located within uplifted blocks of the Zhezkazgan syncline at depths of up to 1500 m [17,18].
Since 2010, a new stage of exploration work has begun in the region, using advanced geological survey technologies in geological and exploration research. This includes innovative methods for processing, collecting, and analyzing geophysical data with the extensive use of geographic information systems (GISs). The high labor and financial costs, as well as risks and low economic efficiency of direct exploration methods (drilling) for deep targets, have justified the broad application of geophysical methods at both the prospecting and exploration stages.
The growing role of geophysics at various ore sites has demonstrated that it is becoming a recognized and established practice in Kazakhstan’s mining sector. Depending on the objectives, the research program includes a full range of geophysical methods, such as gravity surveying, magnetic surveying, various electrical prospecting modifications, and seismic exploration [19,20]. Borehole geophysical studies are widely used in combination with core sampling and lithogeochemical analysis.
Among these, electrical prospecting with its numerous modifications remains the leading method for ore exploration in the study area. When searching for mineralization beneath loose cover, it is especially effective at shallow depths (up to 250–400 m). At the exploration stage, gravity and magnetic methods are used in deep structural mapping—magnetic surveys are applied for the upper horizons (up to the first few kilometers) and gravimetric surveys for deeper sedimentary and magmatic layers, including structures of the lower horizons and the crystalline basement [21].
For the first time in Kazakhstan, in the Zhezkazgan region, the technology for three-dimensional geological modeling of ore bodies based on modern seismic exploration has been successfully applied in the ore district. The structural and tectonic characteristics of ore districts, the identification and refinement of ore-controlling structures, the detection and deep mapping of ore-controlling faults, the volumetric mapping of intrusions, and the determination of the spatial positions of ore-bearing zones are effectively studied using modern high-resolution seismic methods (including CDP (common depth point) profiling and 3D seismic exploration) [22,23].
Given the complex structural and geological setting of the forecasted ore-bearing geological complexes in the Zhezkazgan ore district, enhancing the effectiveness of geophysics in deep exploration has become especially important. The reliability and success of geophysical surveys are closely linked to improved methods of extracting information from field data using qualitative and quantitative methods [24,25]. The effectiveness of geological interpretation largely depends on the completeness of information on the physical property variation patterns and volumetric relationships among rocks in different geological formations and suites. The reliability and accuracy of geophysical anomaly interpretation are heavily dependent on the petrophysical characteristics of the studied section, including lithology, the physical properties of rocks and ores, and the patterns of their stratigraphic, spatial, and depth distribution [26,27,28,29]. Therefore, studying the petrophysical characteristics of geological formations in the Zhezkazgan ore district remains a critical task.

2. Materials and Methods

In studying the geological structure and identifying ore-prospective areas in the Zhezkazgan ore district, special attention was paid to spatial analysis and quantitative evaluation of the magnetic, density, electrical, and elastic properties of rocks and their systematization at the level of formations, individual suites, and lithological heterogeneities.

2.1. Characteristics of the Source Data

The physical properties of the rocks were studied through the compilation and analysis of data obtained from measuring and processing the physical parameters of several samples collected from various sites within the Zhezkazgan syncline and its surrounding areas.
Petrophysical investigations were carried out in two stages. The first stage involved collecting field data, archived materials, and published sources on the physical properties of rocks from the geological complexes in the study area. Primarily, data were gathered by generalizing and analyzing measurement results from several samples collected during field surveys over various years by geophysical and geological survey divisions of companies such as JSC “Zhezkazgangeologiya”, the Zhezkazgan Geological Exploration Expedition, the Zhezkazgan Geophysical Expedition, LLP “Tsentrgeols’emka”, the Kazakh Institute of Mineral Resources, and others. Samples for studying physical parameters were collected both from boreholes and along geological survey routes, covering all lithological variations in the stratigraphic units.
The samples were measured for two parameters: magnetic susceptibility (χ) and rock density (σ). Magnetic susceptibility was determined using a portable field kappameter PIMV-M (NPC “Geomer”), which was regularly calibrated in the magnetic laboratory following standard procedures, using reference samples. The volume of the control measurements was 10.0%, with an error margin not exceeding 4.18%.
Density (bulk weight) measurements were performed using laboratory scales equipped for hydrostatic weighing. The weight of the samples in air and in water was determined with an accuracy of up to 0.01 g. The volume of the control measurements accounted for 10.0% of the total sample set. The overall measurement error for density did not exceed ±0.007 g/cm3.
Information on the specific electrical resistivity (ρk) and polarizability (ηk) of the rocks was analyzed using logging data (resistivity logging, induced polarization logging) and electrical prospecting in various modifications, including electrical profiling (EP), dipole electrical sounding (DES), vertical electrical sounding (VES), induced polarization (IP), and near-field transient processes (NFTPs), among others. Logging operations were carried out using the automatic logging station (laboratory) AKS/L-7. These methods were applied over the years in individual prospective areas of the region by enterprises such as JSC “Zhezkazgangeologiya”, JSC “National Geological Exploration Company Kazgeology”, LLP “Centergeolsъeмka”, the Kazakh Institute of Mineral Resources (KazIMR), and others. Electrical prospecting work was actively carried out in the northern part of the Zhezkazgan syncline to study the petrophysical and geophysical characteristics of stratiform copper and polymetallic deposits to improve exploration methodology and evaluation techniques using various electrical prospecting methods.
The elastic properties of rocks within the Zhezkazgan depression and adjacent areas were studied based on the results of fieldwork conducted over the years using the correlation method of refracted waves (CMRW), the reflected wave method (RWM), and CDPM (common depth point method) seismic methods.
During the geological and geophysical studies conducted by specialists from JSC “Zhezkazgangeologiya”, vertical seismic profiling (VSP) was carried out in 12 boreholes located on adjacent areas of the Jaman-Aibat and Kumolin structures, which border the southeastern margin of the Zhezkazgan syncline. VSP surveys were conducted in boreholes within the ore field, specifically in tectonic deformation zones in the eastern near-fault part of the Jaman-Aibat structure, where there is a significant increase in the thickness of Carboniferous deposits, including productive intervals of the Taskuduk formation. Due to the insufficient depth of the boreholes, the Upper Devonian section remained unstudied in the investigated wells. For these horizons, velocity characteristics were obtained from boreholes in neighboring areas, where the average seismic velocity of these deposits ranges from 5000 to 6000 m/s.
The collected information on physical parameters was supplemented with data from the literature published in both national and international sources [30,31,32,33,34]. As a result, a primary petrophysical database was created, in which all materials were classified according to quality and representativeness and correlated with the current geological legend. A total of 15,000 samples were analyzed and systematized based on their physical properties, including samples from volcanogenic–sedimentary and intrusive complexes involved in the formation of the Zhezkazgan structural–formational zone. Physical parameter studies on core samples from deep boreholes with depths of 800–1200 m and 1700–1800 m were used extensively (Figure 2). Most of the boreholes drilled in the ore field of the Zhezkazgan district penetrated deposits of the Visean–Serpukhovian stages, so the physical properties of rocks from the Middle–Upper Carboniferous and Permian periods are the most thoroughly studied [35,36].

2.2. Methodology

The second stage of this study involved the compilation, analysis, and statistical processing of the collected petrophysical data. The authors systematized the physical parameters according to rock groups that were similar in age, lithological composition, and facies formation affiliation. Statistical processing was carried out using specialized computer programs, based on the normal distribution for density (σ g/cm3) and the log-normal distribution for magnetic susceptibility (χ SI units) [37,38,39].
For qualitative geological interpretation of gravity and magnetic anomalies and for constructing models of ore deposits, the most probable petrophysical density and magnetic properties of the rocks were calculated. Density and magnetic susceptibility values were systematized for individual lithological units. Then, considering the thickness and spatial distribution, weighted average values of these parameters were calculated within individual suites, complexes, and formations. When assessing the magnetic properties of the rocks, residual magnetization was also considered in addition to magnetic susceptibility [40,41,42,43,44].
The most reliable values of the physical parameters were used to construct variation curves and histograms of the distribution of the physical properties (Figure 4). These were used to assess the homogeneity in the samples, identify areas with complex and simple parameter distributions, and calculate the mean statistical and most probable values.
The average statistical characteristics of the physical parameter for the homogeneous samples and reconstructed distributions were calculated using the method of moments according to the following formulas:
σ ¯ = P 0 ± x m m h ,   S = h x 2 m m ( x m m ) 2 ,
where f is the mean statistical value of density; S is the standard deviation (root mean square deviation); m is the frequency of the grouped variation series; P0 is the reference point—the value of the characteristic corresponding to the midpoint of the interval at x = 0 (usually selected within the interval with the highest frequency); and h is the grouping interval.
The weighted average values of the physical properties were calculated for each lithological variety and its volumetric proportion within a given formation. For igneous rocks, average values of the parameters were calculated for specific intrusive bodies, which were then systematized by composition and age [45]. Based on the analysis of the obtained weighted averages, the role of different suites, rock sequences, and intrusive complexes in the formation of anomalous geophysical fields was assessed [46].
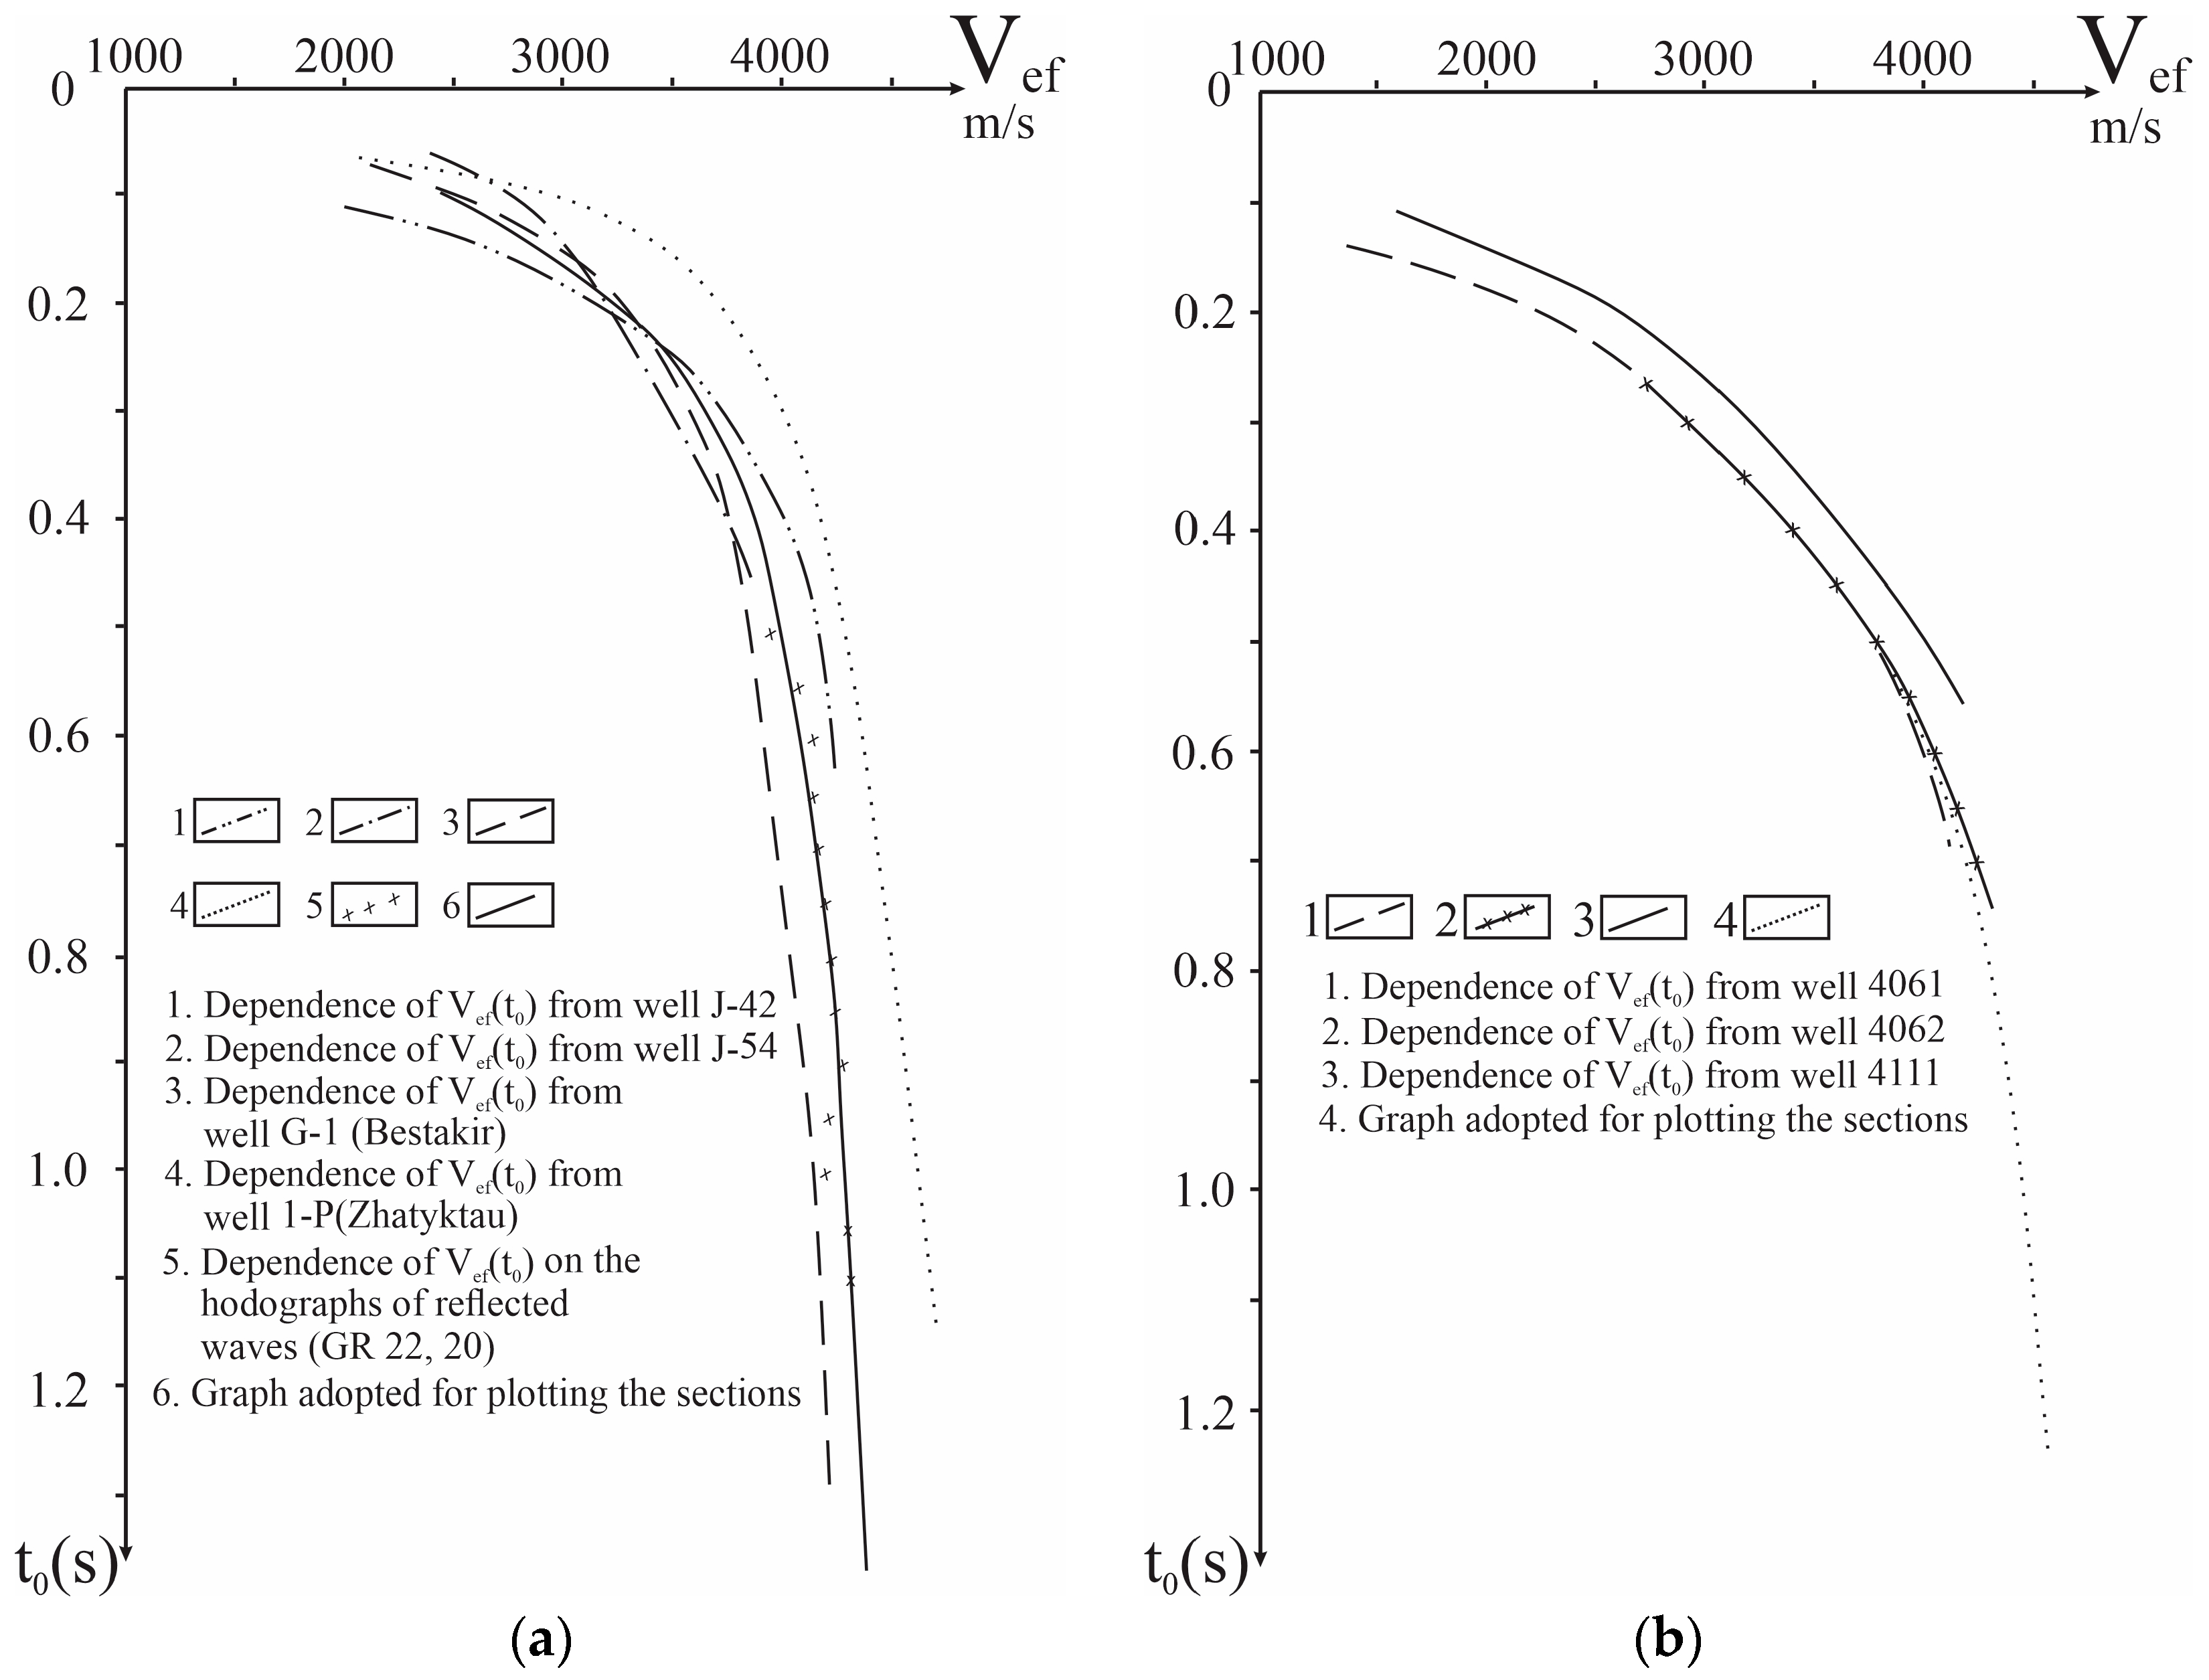
The velocity characteristics of the geological complexes were studied based on the borehole investigation results using vertical seismic profiling methods (VSP, PM-VSP) and well logging conducted in boreholes located directly within the Zhezkazgan and Zhilandinsky ore fields, as well as in areas adjacent to the Zhezkazgan ore field. This allowed for obtaining reliable data on the variation in average velocity with depth and for constructing V_avg(t0) dependency graphs. In addition to VSP data, graphs of effective velocity V_eff(t0) were also built based on V_avg values derived from travel–time curves of reflected waves recorded along seismic profiles. In this case, the borehole data values (V_avg(t0)) from nearby boreholes, obtained from VSP data, were considered (Figure 5a). The effective velocity variations in the region mostly correspond to the pattern of boundary velocity changes along the roof of Paleozoic deposits.
Figure 5b shows the V_avg(t0) graphs for the wells drilled in the crest of the Saryoba anticline, located in the northern part of the Zhezkazgan structure. An increase in average velocities is observed here, due to the thinning of low-velocity Permian deposits in the section. For seismic section construction in areas where the thickness of Permian deposits reaches 1600 m, a V(t0) graph was used that averages well log data from sections with thick low-velocity geological complexes.
Seismic data analysis revealed that interval velocity variations are well differentiated within the vertical section and, to a lesser extent, across the area, reflecting local heterogeneities in the sedimentary sequences. These variations are associated with different interbeds, substitution of carbonate cement with siliceous–carbonate and predominantly siliceous types, rock porosity, and the influence of tectonic movements [47].
Based on laboratory core studies, acoustic impedance was calculated for all the samples with measured velocity and density values. This calculation was necessary because seismic records reflect the distribution of reflection coefficients in the geological medium, which are directly related to the acoustic impedance contrasts between layers according to the formula:
χ ¯ n e g = ρ 1 v 1 ρ 1 v 2 ρ 1 v 1 + ρ 2 v 2 ,
where ρ is the rock density and V is the formation (layer) velocity.
To calculate acoustic impedance, formation velocity was used. This is due to the presence of a direct proportional relationship between formation velocities in the region and the significantly lower variability in density values across the geological section (Table 1).

3. Results

The generalization and analysis results of the rock petrophysical characteristics in the Zhezkazgan region are presented based on the structural–formational zones, individual suites, and lithological types within sedimentary–volcanogenic complexes, intrusive massifs, and productive horizons.
The study area covers fragments of the Sarysu–Teniz riftogenic structural zone (complexes of red-colored molasse of the initial rifting stage D3, terrigenous–carbonate deposits D3–C1, and carbonate–terrigenous deposits C1–2), as well as the Zhezkazgan structural–formational zone (SFZ), formed by complexes and structures related to the accumulation of a deformed sedimentary cover of continental crust (carbonate–terrigenous deposits of C2–P2). The far west contains small fragments of the Konskaya SFZ, composed of terrigenous complexes of marginal marine basins (O2), tectonically overlying Early Proterozoic schist–gneiss complexes, as well as fragments of the Shagyrlynsay SFZ, which represents a back-arc basin fragment associated with the Devonian volcano-plutonic belt [48].
The terrigenous formations of the oldest outcrops in the study area, from the Middle Ordovician (Shaitantas suite) and Lower Devonian (Kyzyltaus suite) deposits within the Konskaya and Shagyrlinskaya SFZs, respectively, are mapped in small fragments along the western boundary of the study area. The rocks have average weighted densities ranging from 2.65 to 2.73 g/cm3, but due to their small thickness, they do not significantly affect the gravitational field (Figure 6).
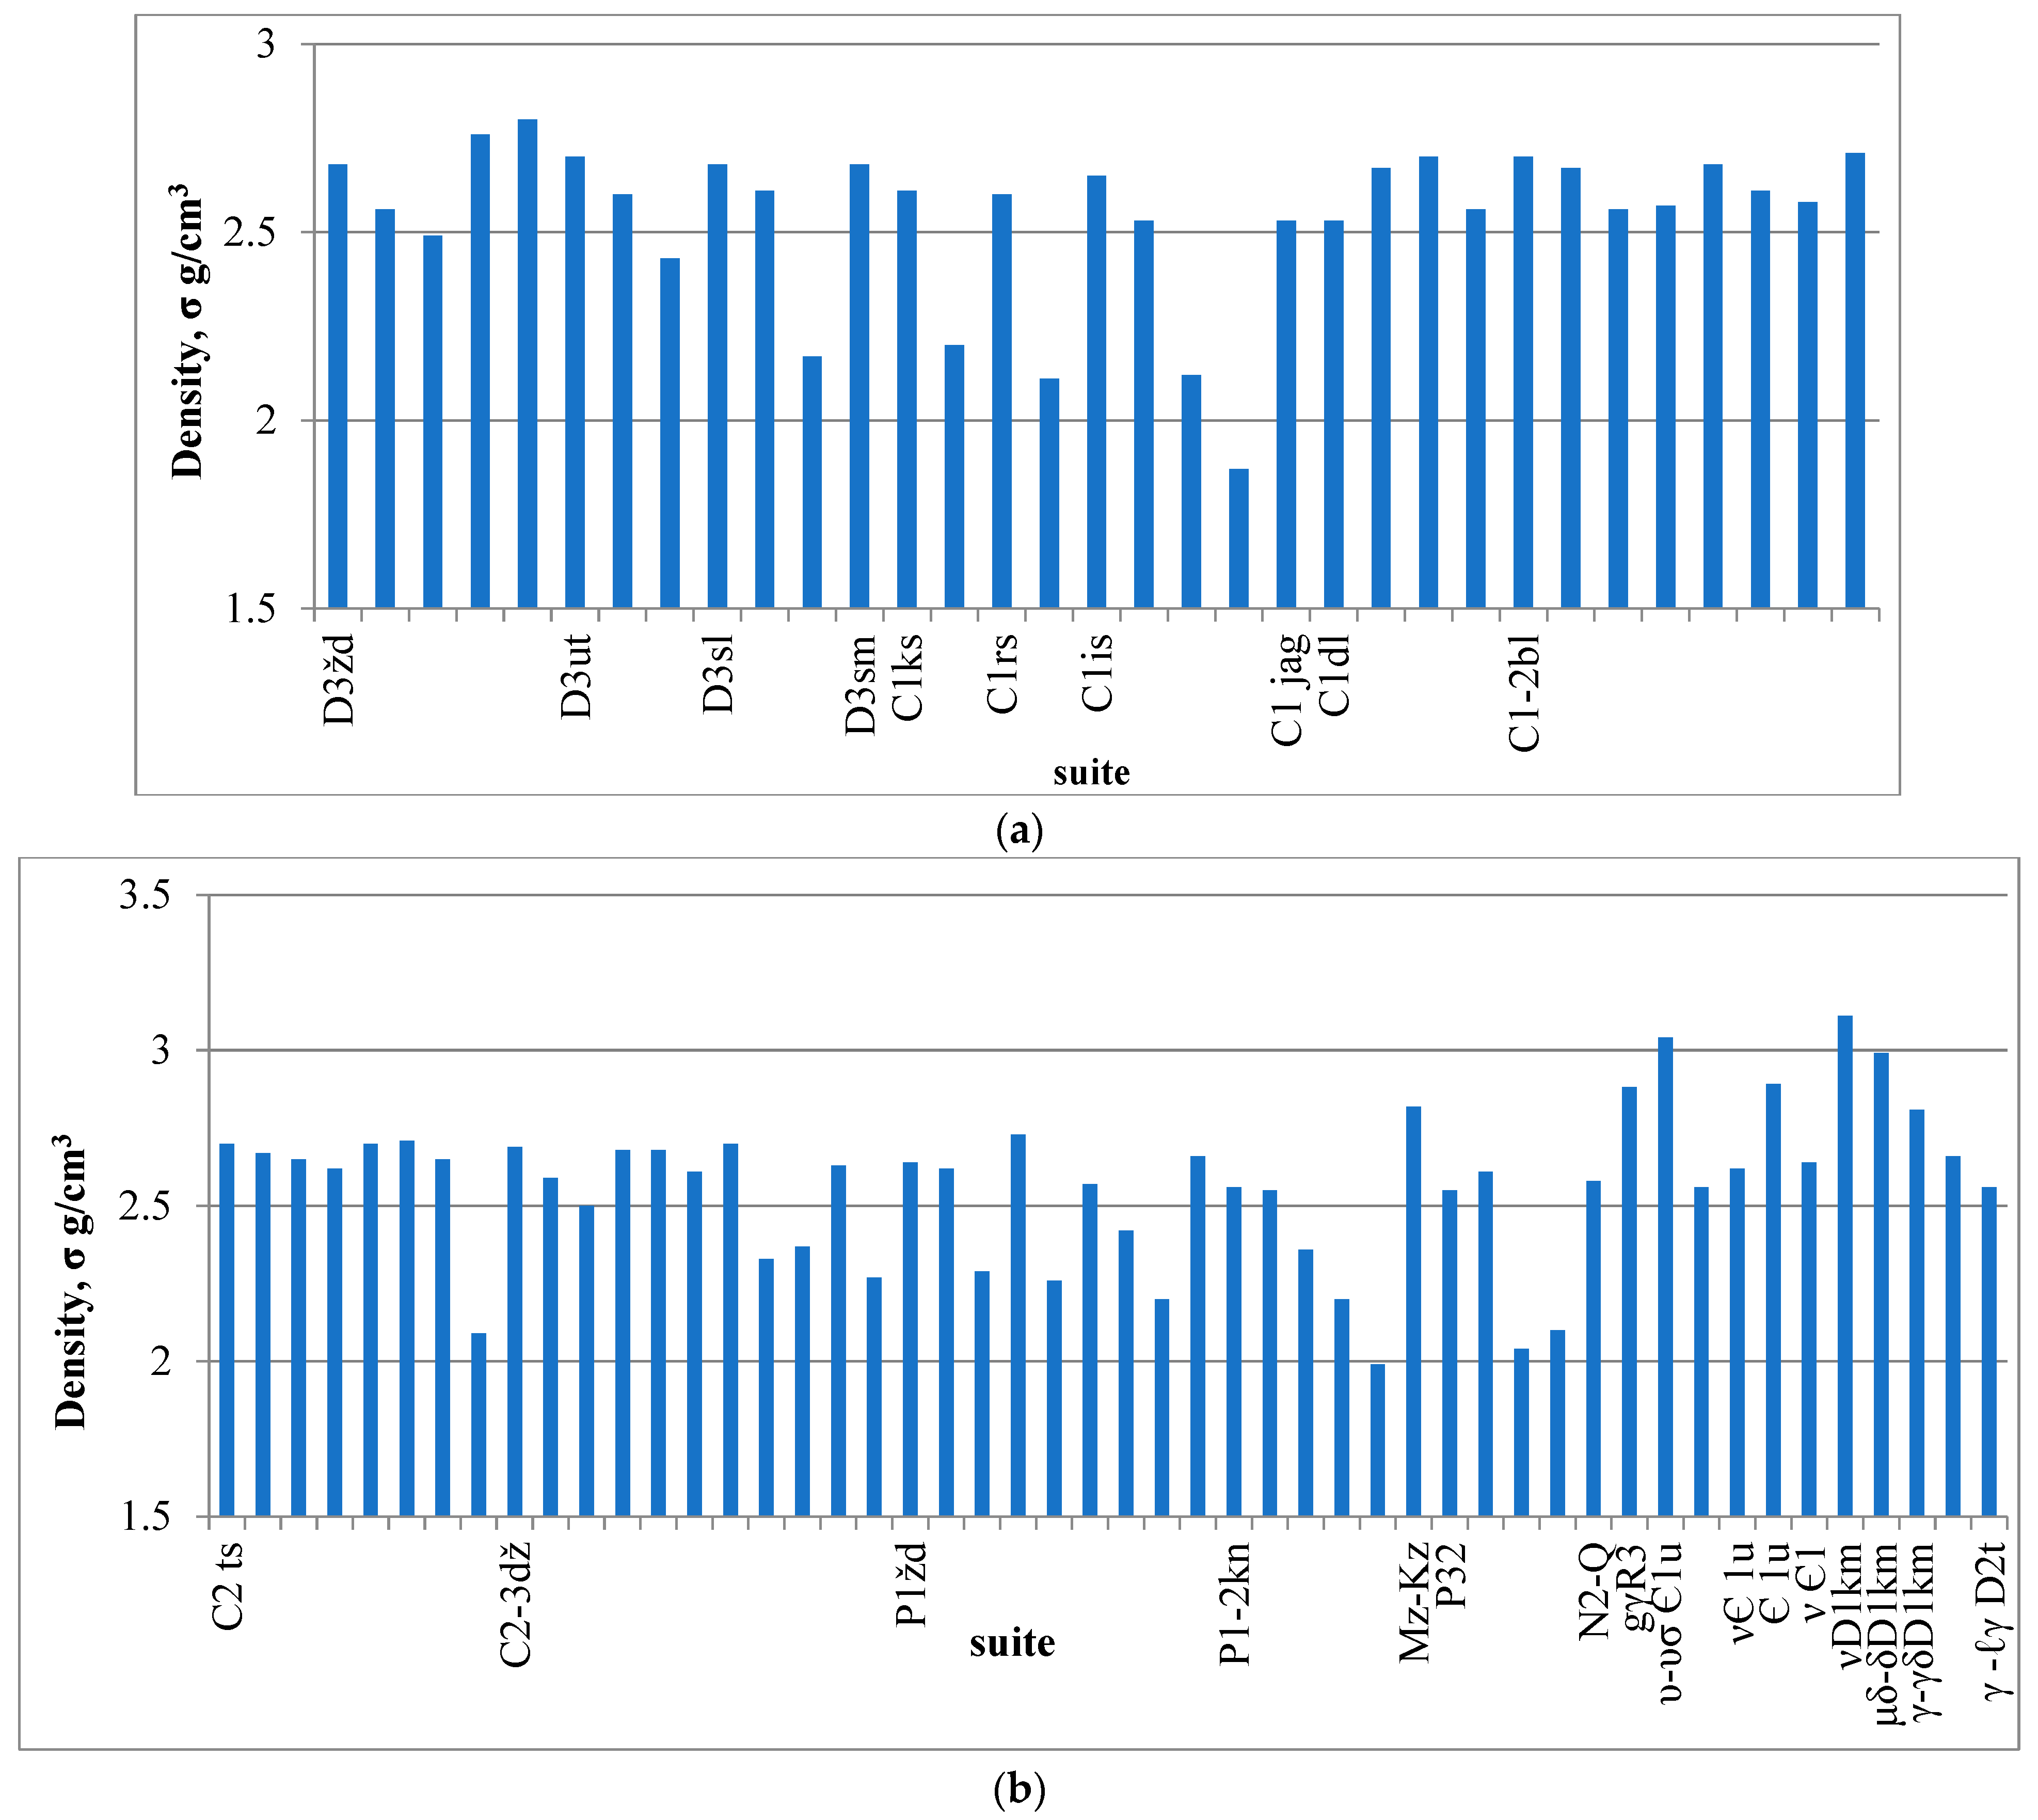
The average weighted density of the entire thick rock sequence of the Zhezkazgan structural–formational zone (SFZ) and the Sarysu–Teniz riftogenic structural zone (from the Upper Devonian to the Upper Permian) is 2.62 g/cm3. Against this background, an excess density of 0.04 to 0.08 g/cm3 is observed in the terrigenous deposits of the Taskuduk suite of the Middle Carboniferous (σ_avg = 2.70 g/cm3), the Zhezkazgan suite of the Middle–Upper Carboniferous (σ_avg = 2.68 g/cm3), and the Kingir suite of the Lower–Upper Permian (σ_avg = 2.66 g/cm3). The entire sedimentary–terrigenous section of the structural–formational zones of the Zhezkazgan region is generally non-magnetic. The average values of magnetic susceptibility (χ) range from 1 to 60 × 10−5 SI units (Table 2, Figure 7).
The entire sedimentary–terrigenous sequence within the structural–formational zones of the Zhezkazgan region is generally non-magnetic. The average magnetic susceptibility (χ) values range from 1 to 60 × 10−5 SI units. The deposits of the Lower Carboniferous system are also largely non-magnetic. In the magnetic field, they are characterized by a negative quiet magnetic background, with intensities ranging from 0 to −100 nT. The average magnetic susceptibility in these rocks varies from 3 to 48 × 10−5 SI units. Isolated low-intensity (up to 100–200 nT) ΔT anomalies of a small spatial extent are presumably associated with granodiorite intrusions at depth (χ_avg = 636 × 10−5 SI units), while more intense anomalies (exceeding 200 nT) are attributed to Alpine-type ultramafic and gabbroic bodies (χ_avg = 1652 × 10−5 SI units) [49].
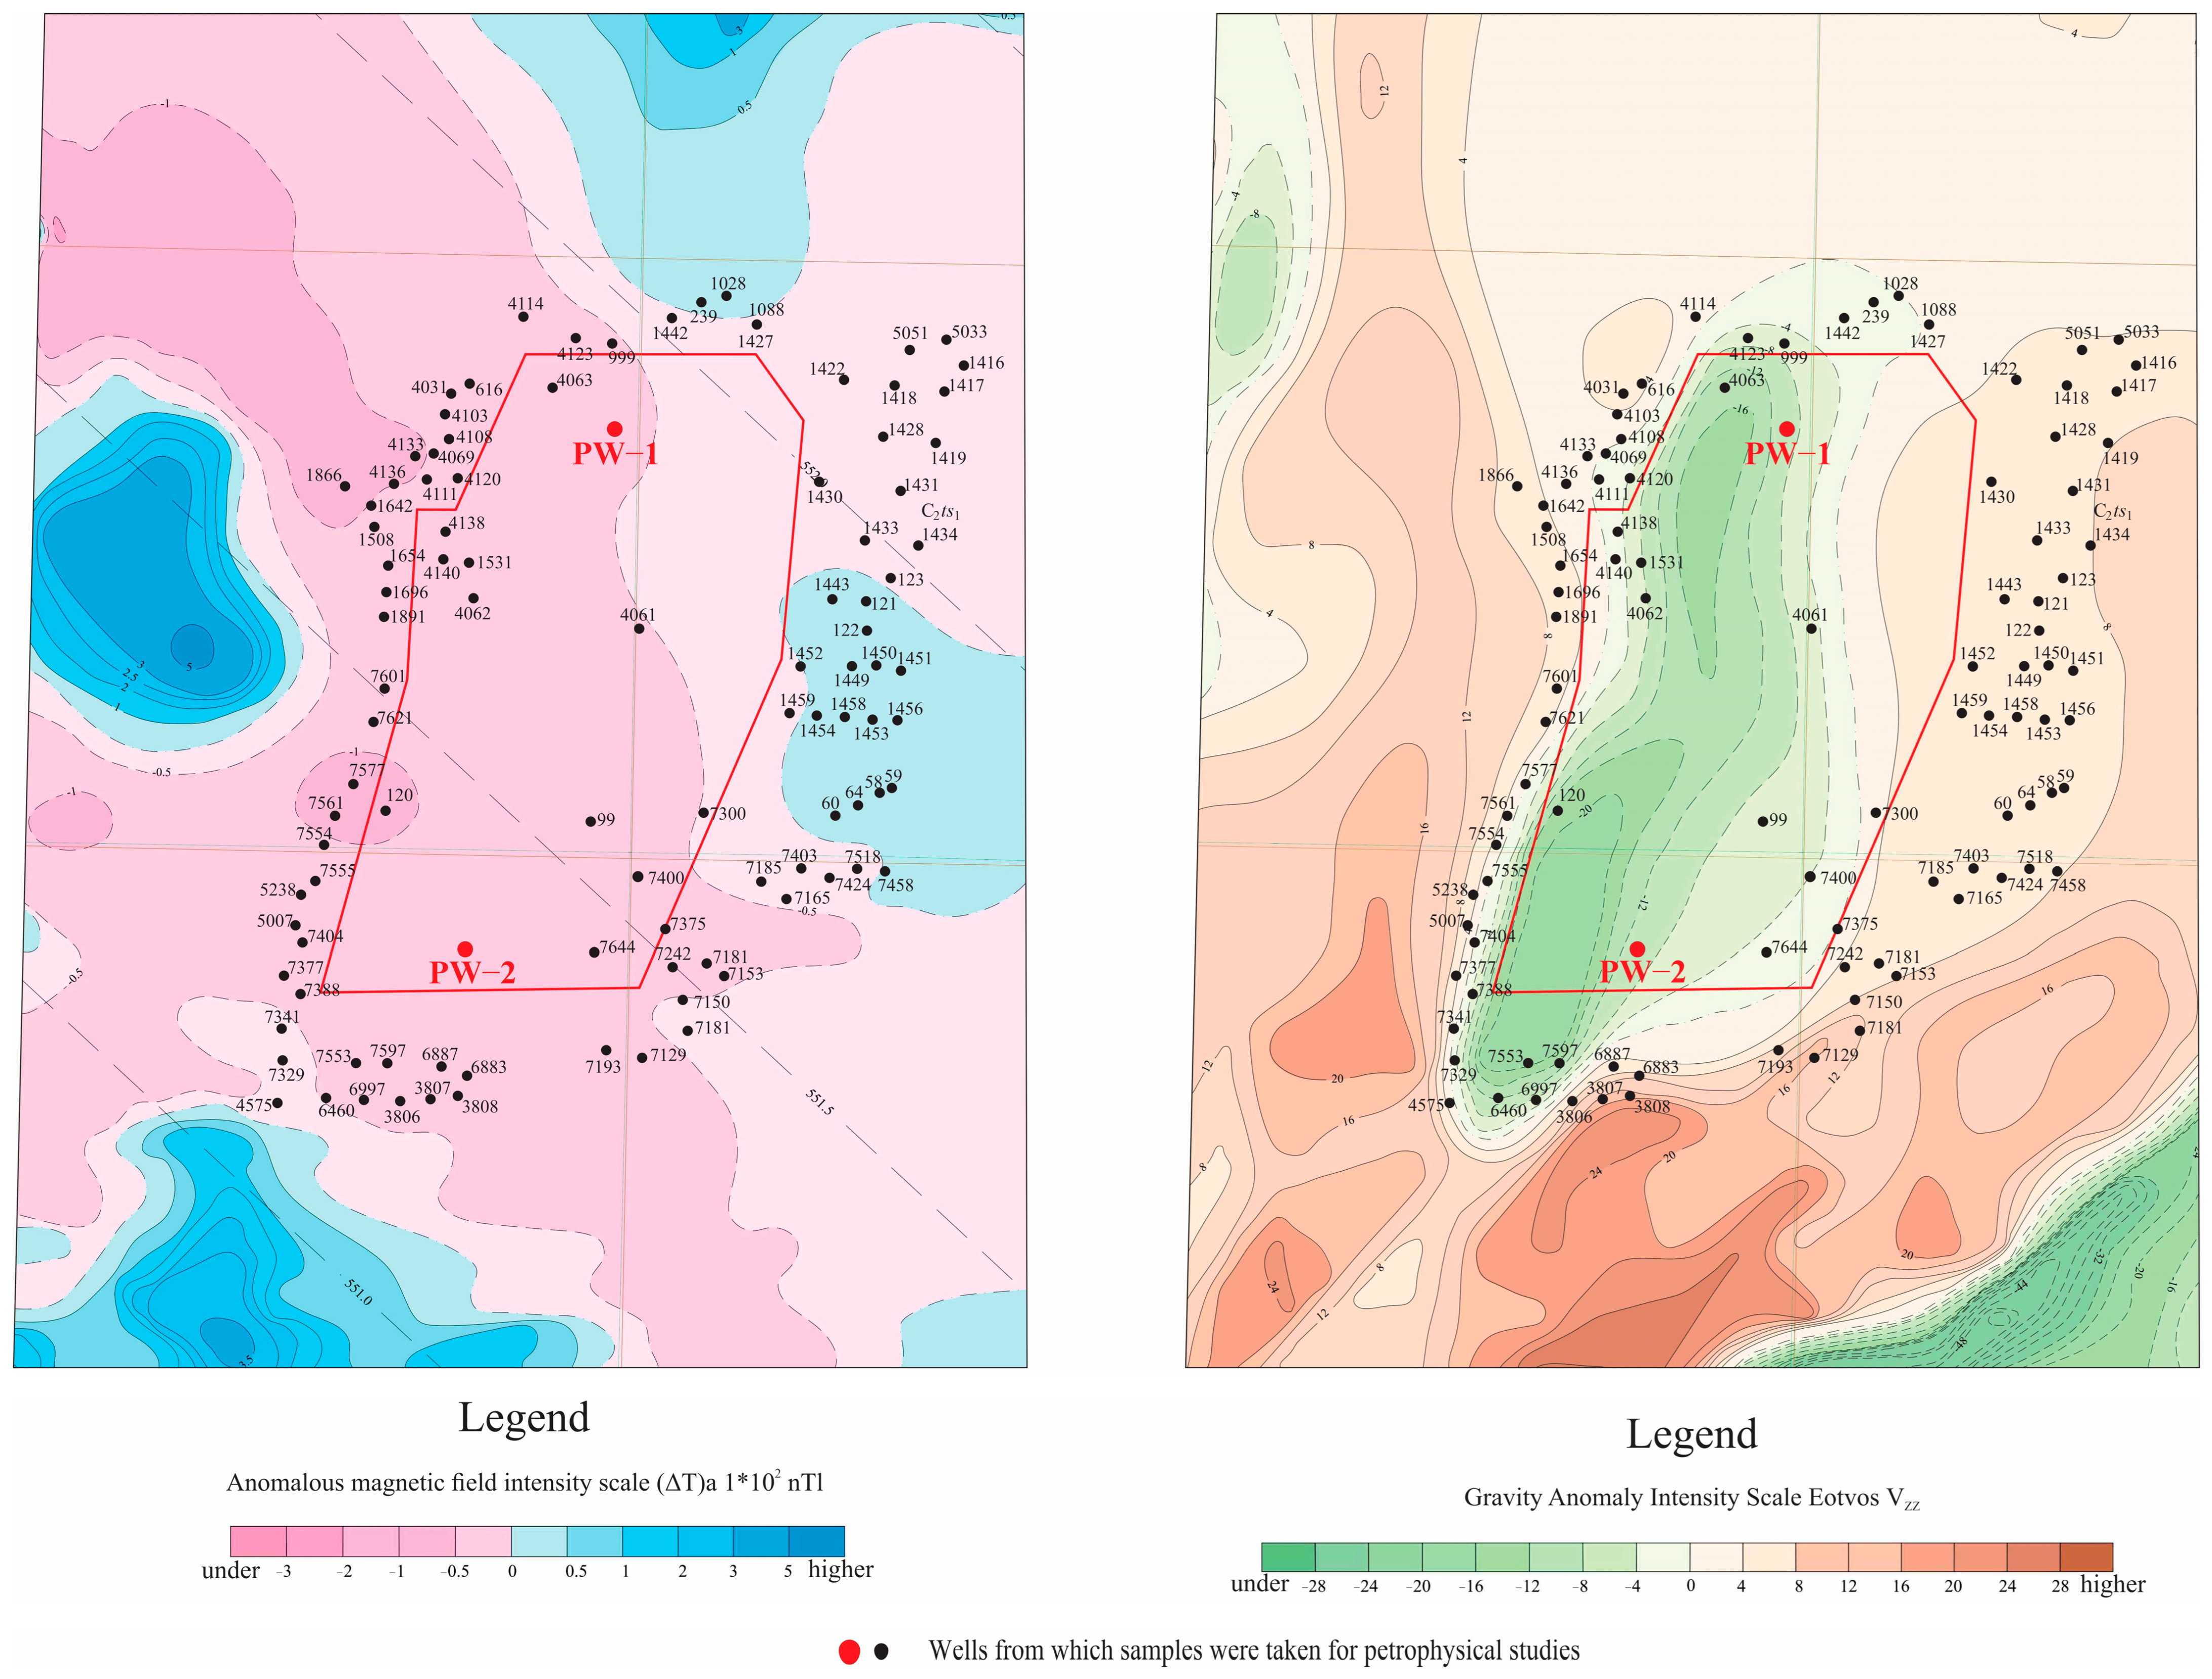
The average density of Lower Carboniferous rocks ranges from 2.08 g/cm3 for Tournaisian marls to 2.70 g/cm3 for limestones of the same age. Overall, the weighted average density of Lower Carboniferous rocks is 2.57 g/cm3. In the gravity field, terrigenous–carbonate formations of the Lower Carboniferous do not have distinct mapping expressions and are usually accompanied by gravity gradient zones (Δg) or, more rarely, by weak decreases in gravity on the background of gravity highs, generally reflecting the underlying basement of these structures (Figure 8) [49].
The terrigenous–sedimentary formations of the Middle–Upper Carboniferous (Taskuduk and Zhezkazgan suites) are composed of non-magnetic rocks (χ_avg = 14–40 × 10−5 SI units in the north of the area and χ_avg = 7–358 × 10−5 SI units in the south). The average density of the rocks in the Taskuduk suite in the north is 2.67 g/cm3, and that of the Zhezkazgan suite is 2.55 g/cm3. In the south, the average density of the Taskuduk suite is 2.70 g/cm3, and that of the Zhezkazgan suite is 2.68 g/cm3. In the gravitational field, these formations are mostly accompanied by a gradient zone, one of Δg, and on large-scale gravity anomaly Δgloc maps, the more massive units show localized positive anomalies with intensities exceeding 2 mGal. In the magnetic field, the Middle to Upper Carboniferous outcrops exhibit a calm, low-intensity alternating magnetic field (ΔTa), with field intensities ranging from −50 to +50 nT.
Permian terrigenous–sedimentary rocks are non-magnetic (χ_avg = 5–60 × 10−5 SI units) and low-density. The average density ranges from 2.1 to 2.66 g/cm3: the weighted average density of the Zhidelisai suite is 2.54–2.60 g/cm3, and that of the Kingir suite is 2.66 g/cm3. In geophysical fields, the Zhidelisai and Kingir suites are located in gravity-minimum zones. Local negative Δg anomalies with intensities down to −5 mGal delineate the marl deposits of the Kingir suite (average density σ = 2.1–2.2 g/cm3). The terrigenous–sedimentary formations of the Lower Permian are characterized by a calm magnetic field with intensities ranging from −50 to −150 nT. Isolated low-intensity positive ΔT anomalies (up to 100–200 nT) within the core parts of individual synclines are attributed to the presence at depth of granodioritic intrusions belonging to the Early Devonian Karamaindy complex (χ_avg = 636 × 10−5 SI units).
Loose deposits of the Meso-Cenozoic are non-magnetic and of low density. Their average density ranges from 1.8 to 2.38 g/cm3, which is 0.24–0.8 g/cm3 lower than that of the Paleozoic complexes.
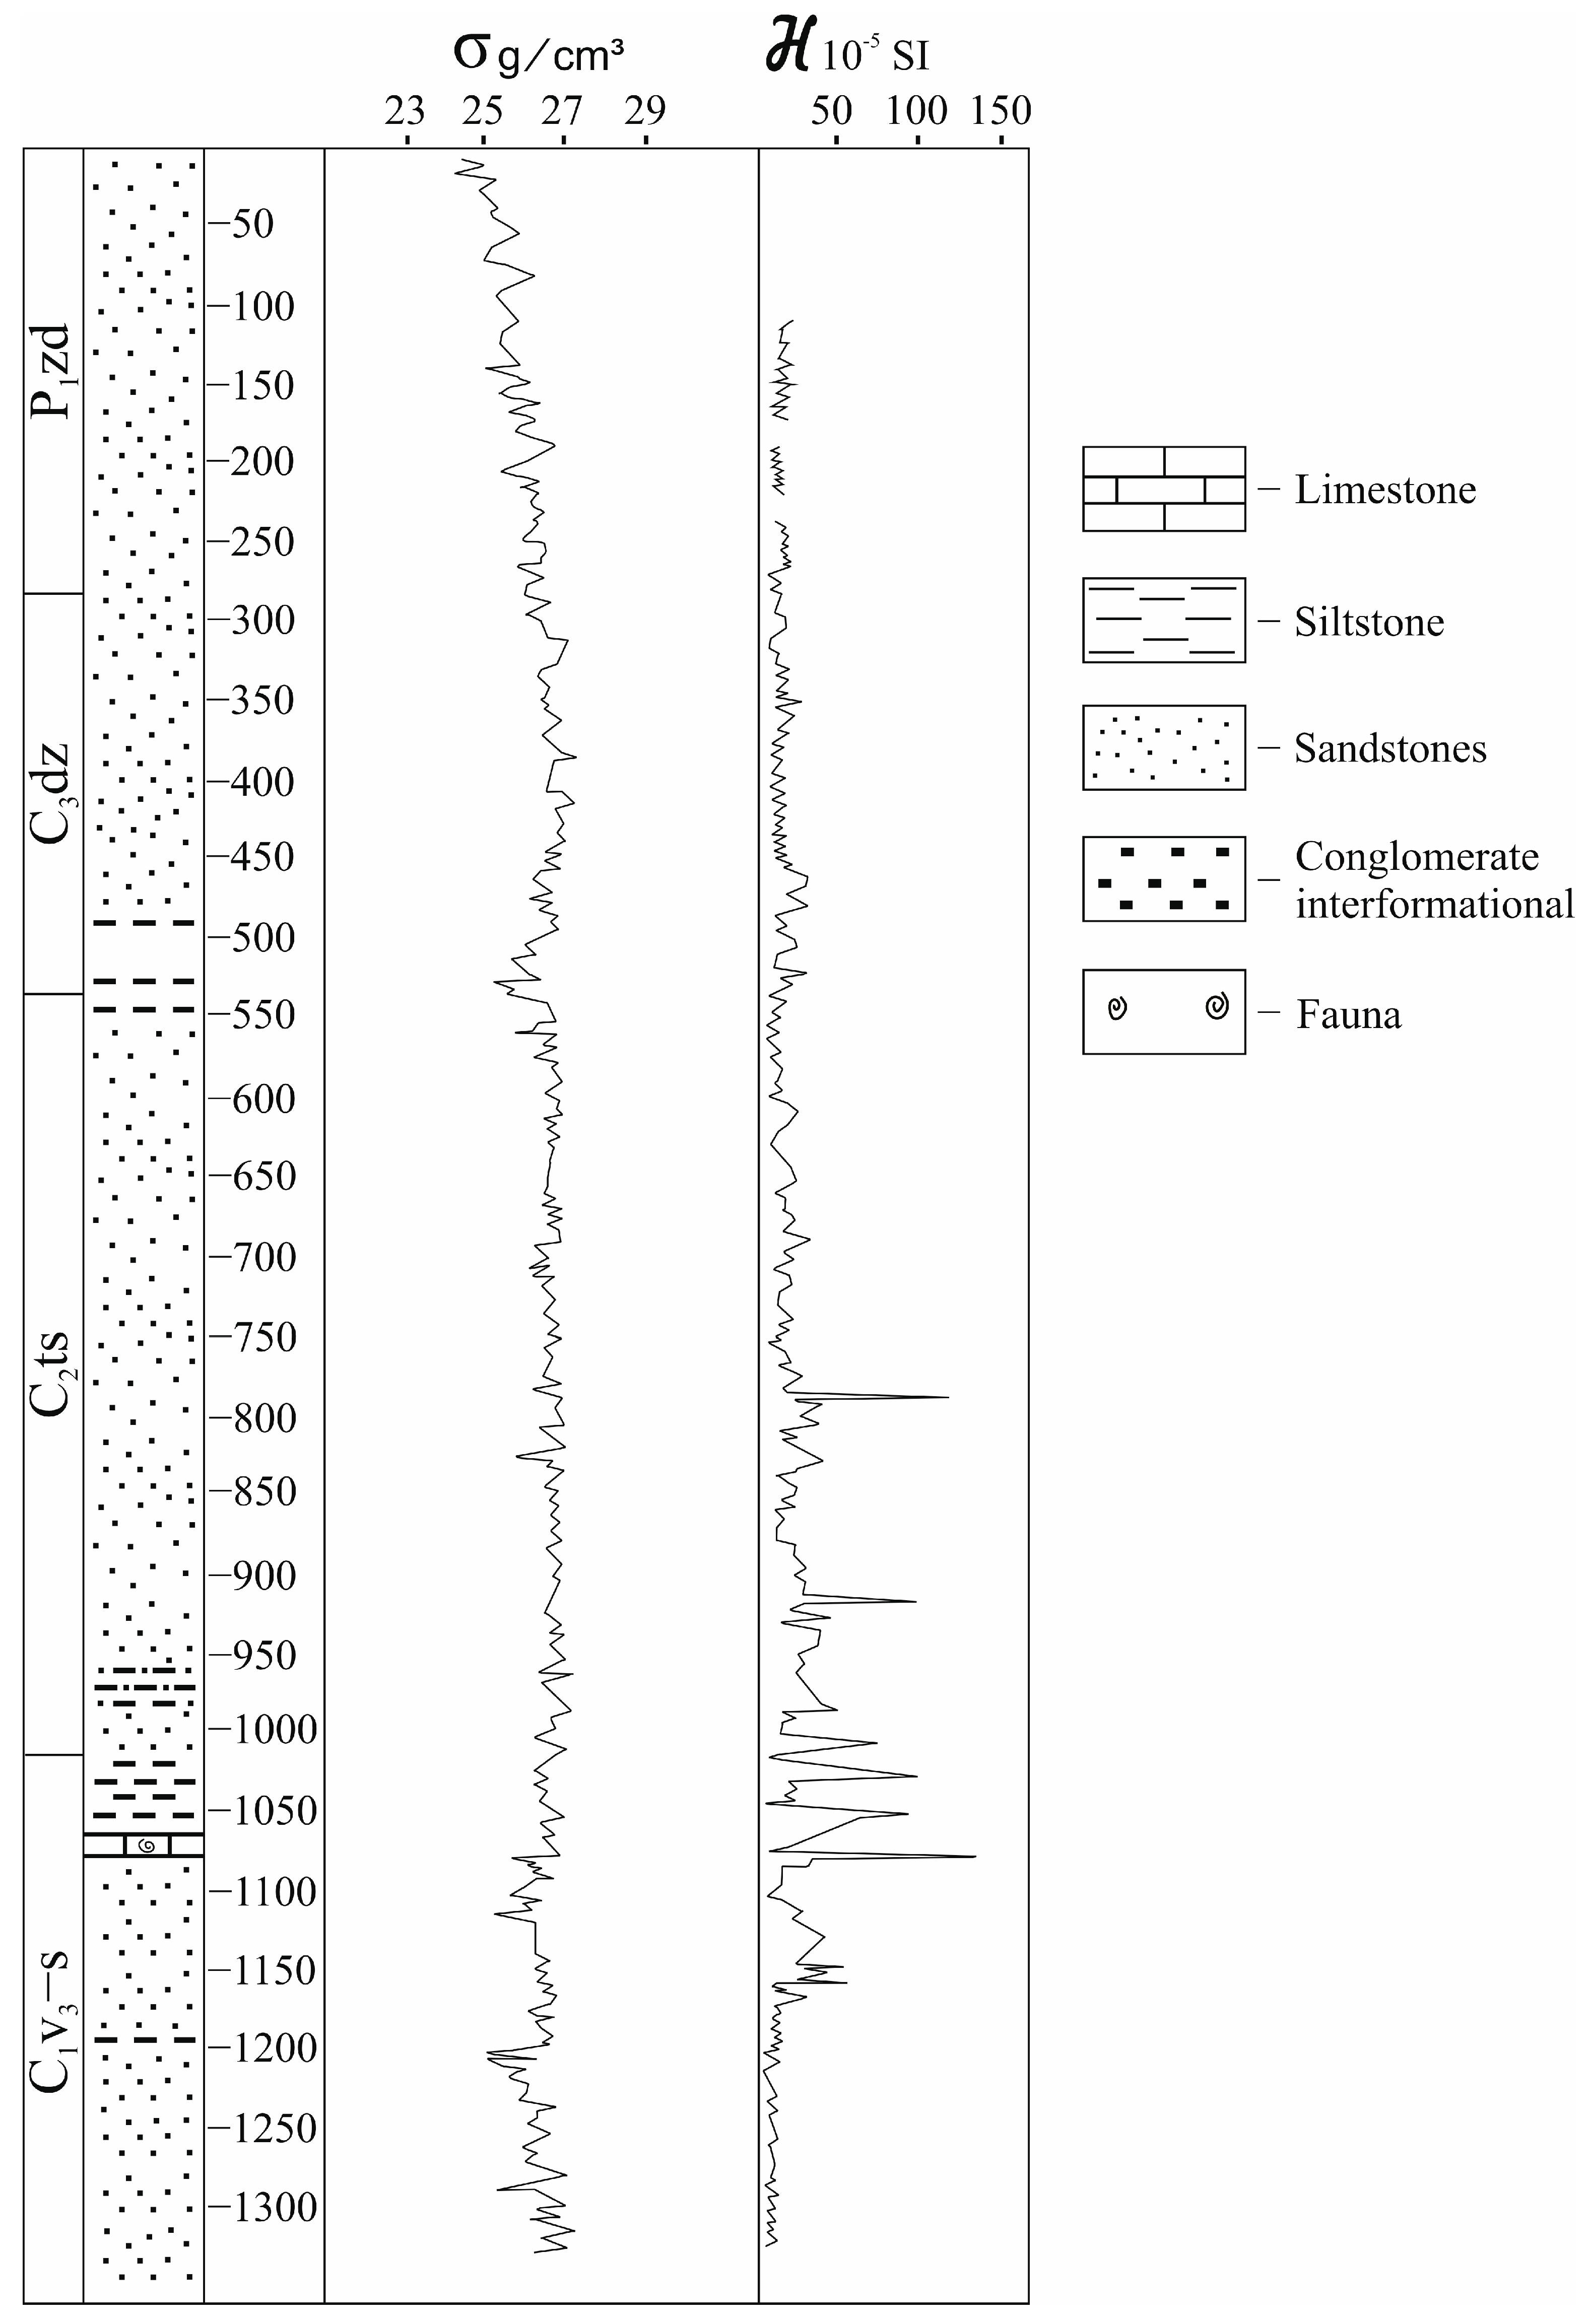
In ore-bearing areas, the borehole data indicate that the weighted average density of the entire rock sequence in the Zhezkazgan structure (from Upper Devonian to Upper Permian) is 2.62 g/cm3. Against this background, formations that host ores stand out with excess densities of 0.04–0.08 g/cm3: the terrigenous formations of the Middle Carboniferous Taskuduk suite (σ_avg = 2.70 g/cm3), the Middle–Upper Carboniferous Zhezkazgan suite (σ_avg = 2.68 g/cm3), and the Lower–Upper Permian Kingir suite (σ_avg = 2.66 g/cm3). The density of these latter formations can increase up to 2.72 g/cm3 due to the presence of dense marls. Notably, salt-bearing rocks of the Zhidelisai suite (Lower Permian) show a significant density deficit of up to −0.08 g/cm3 (σ_avg = 2.54 g/cm3) (Figure 9).
During the analysis of the physical properties of individual lithological and petrographic rock varieties, petromagnetic groups were identified based on magnetic susceptibility: rocks with values from 0 to 100 × 10−5 SI units were classified as non-magnetic, from 100 to 700 × 10−5 SI units as weakly magnetic, from 700 to 3000 × 10−5 SI units as magnetic, and above 3000 × 10−5 SI units as strongly magnetic. Variations in the magnetic susceptibility of lithological heterogeneities forming individual suites depend on their magnetite content [50]. Red-colored and gray sandstones of the Beleutin, Taskuduk, and Zhezkazgan suites have an average magnetic susceptibility of 100–195 × 10−5 SI units, with occasionally more magnetic varieties reaching 300–360 × 10−5 SI units (Figure 9). Copper ores do not differ in magnetic properties from the host rocks.
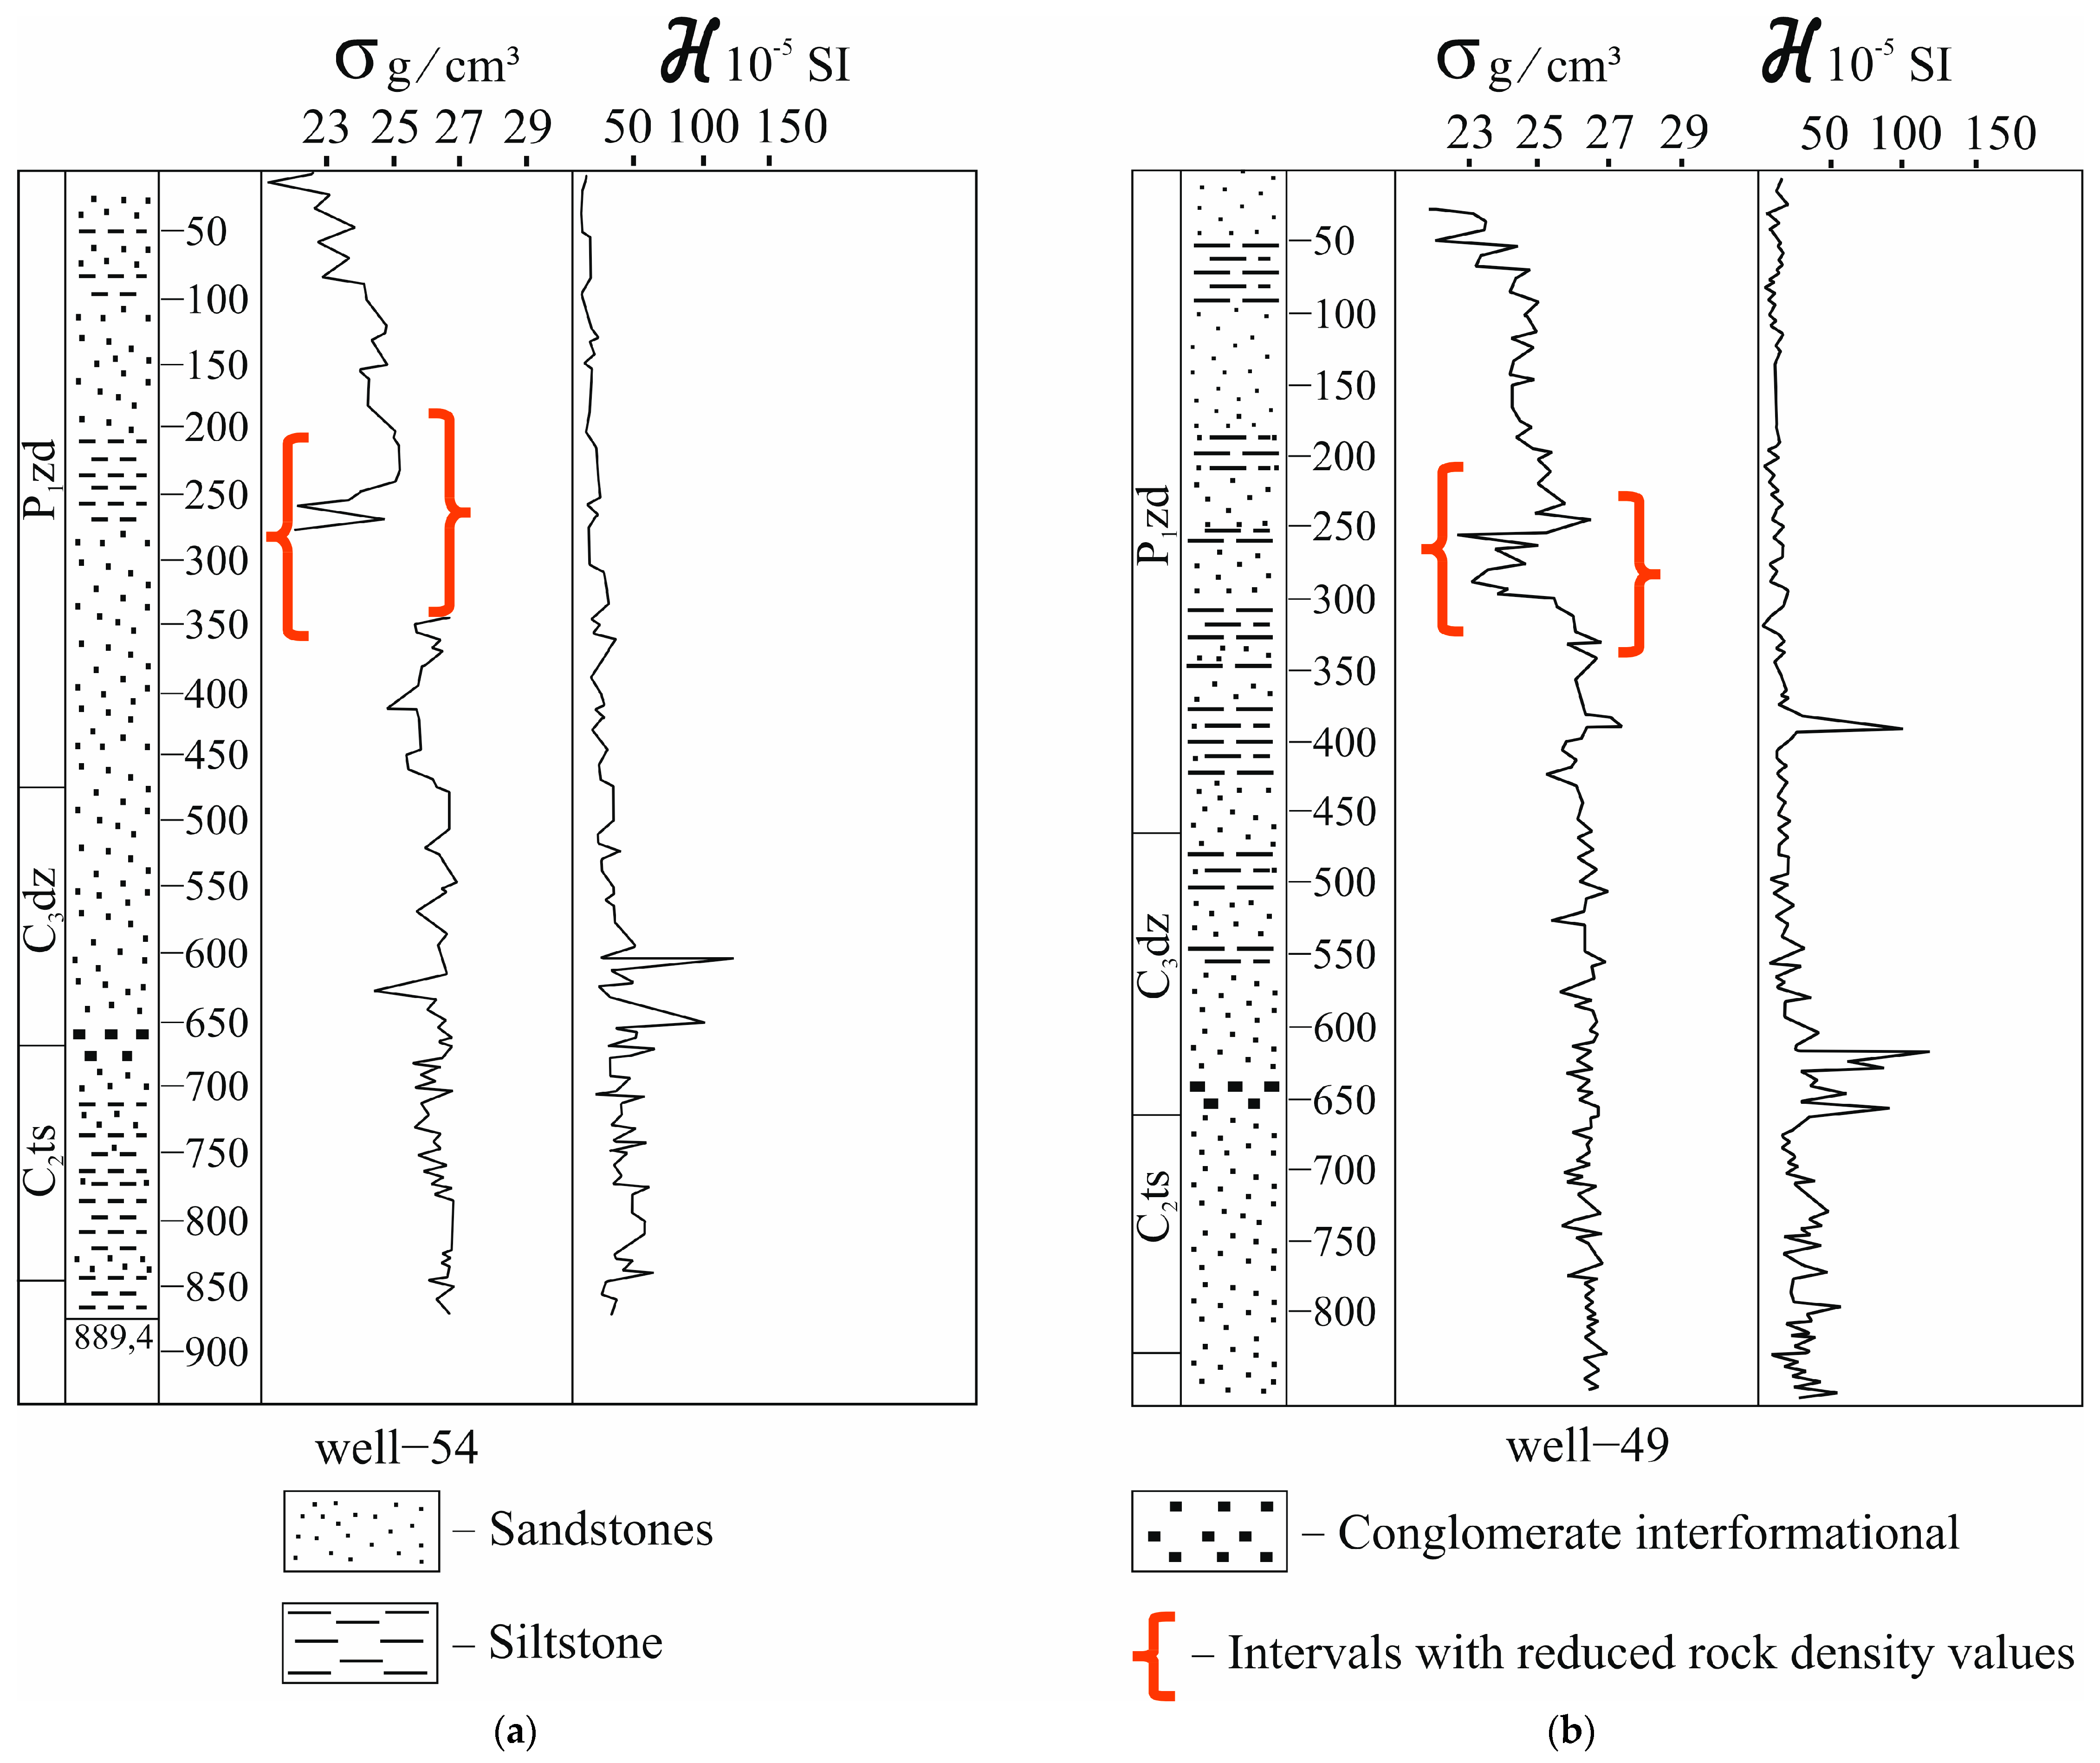
According to the borehole data, the average weighted density can decrease to 2.18–2.2 g/cm3 due to the saturation of the Lower Permian sequence with accumulations of rock salt, which are widely developed as beds and lenses and have a significant impact on the gravity field pattern. Additionally, the structure of the gravity field is influenced by rock hypergenic alteration processes, observed both within the Zhezkazgan deposit and the Zhezkazgan syncline as a whole, manifested in the form of weathering crusts, leaching, and decementation. As a result of these processes, changes in physical parameters occur [51,52]. Typically, these processes led to a significant decrease in density to 2.2–2.4 g/cm3 (Figure 10).
Magmatism in the region is represented by Precambrian and Hercynian granitoid massifs. The Hercynian granitoids in the Upper Paleozoic rocks are associated with deposits, such as Zhezkazgan, Saryoba, Itauz, Karashoshak, and Zhartas, while the Precambrian rocks are associated with tungsten–molybdenum deposits, such as Airshoky, Ulutau, and others. Iron–manganese deposits in Naizatas and Zhezdy are associated with Paleozoic volcanics. Deposits and occurrences of chromium, nickel, cobalt, and asbestos are localized within the serpentinite massifs of the Ulutau region. The closest rocks in composition to the deposits of the Zhilandinsky ore field (Eastern and Western Saryoba) are Hercynian-age granitoids (adamellites, granite porphyries, and alaskites), located in the Eskuly and Ulutau mountains and situated 20 and 37 km northwest of them, respectively.
There is a clearer differentiation in the physical properties of the intrusive rocks mapped north of the Saryoba ore field depending on their composition. For intrusive formations in the granite–ultrabasic rock series, the density values increase proportionally with the basicity of the rocks. Between granites and granodiorites, the density increase is 0.12–0.17 g/cm3; between granodiorites and diorites, the increase is 0.05–0.14 g/cm3; and between diorites and gabbros, the increase is 0.13–0.19 g/cm3. Leucogranites of the Terektinsky complex (Middle Devonian) are characterized by a low density of 2.56 g/cm3. The density of Early Devonian granodiorites is 2.66 g/cm3, that of quartz diorites is 2.81 g/cm3, and that of gabbros is up to 2.99 g/cm3, significantly differing from intermediate composition rocks. Early Cambrian serpentinites (Eskulin dome) form two groups: the first includes chrysotile serpentinites with a density of 2.57 g/cm3, the second includes amphibolized serpentinites with a density of 2.73 g/cm3. Gabbros have the highest density (average σ = 2.99 g/cm3).
In terms of magnetic properties, the entire granitoid group is practically non-magnetic. The exception is the biotite–hornblende granodiorites of the Karamendinsky complex (average χ = 636 × 10−5 SI units), which fall under the medium-magnetic classification. Rocks of intermediate-basic composition show increasing magnetic susceptibility from 714 × 10−5 SI units for Lower Cambrian pyroxenites to 1390 × 10−5 SI units for Lower Devonian quartz diorites. Among the ultrabasic rocks developed within thrust zones, serpentinites stand out with elevated magnetic susceptibility at 1684 × 10−5 SI units. In the Shaitantas overthrust zone, serpentinites are highly magnetic, with a modal magnetic susceptibility of 5560 × 10−5 SI units.
The electrical characteristics of rocks in the study area were assessed using data from field geophysical (electrical exploration) work and well logging data from specific promising areas and ore occurrences within the Zhezkazgan ore district. Table 3 presents the summarized results of the electrical parameters for various geoelectric horizons, based on the interpretation of parametric methods: VES (Vertical Electrical Sounding), DES (Deep Electrical Sounding), SP (Spontaneous Potential), borehole logging diagrams, and Lateral Logging Probing (LLP).
Meso-Cenozoic deposits, composed of rocks of various compositions in the region, are characterized by significant heterogeneity and a wide range of resistivity values. Among the deposits of this age, the lowest resistivity values (1–5 Ohm·m) are exhibited by dense, viscous Paleogene clays of considerable thickness, while the highest values (up to 500 Ohm·m) are observed in weathering crusts developed on Paleozoic rocks (Table 4).
Low-resistivity deposits include the sand–clay sediments of the Meso-Cenozoic and the siltstone–sandy formations of the Lower Permian Zhidelisai suite, with an average resistivity of about 50 Ohm·m. An increase in electrical resistivity is observed in the Lower Carboniferous carbonate–terrigenous sequence, as well as in the marl and terrigenous formations of the Lower Permian Kingir suite, reaching 120–100 Ohm·m, respectively.
Varicolored medium- and fine-grained sandstones, siltstones, and argillites, conglomerates, and limestones of the Middle–Upper Carboniferous, as well as the entire terrigenous sequence of the Middle–Upper Devonian and conglomerate porphyry formations of the Lower Devonian, have an average specific resistivity ranging from 200 to 300 Ohm·m. The sand–carbonate sequence of the Lower Carboniferous shows high resistivity; however, depending on the degree of rock disintegration, the values can vary widely. The effusive sedimentary deposits of the Lower–Middle Devonian and igneous formations generally have resistivity values exceeding 1000 Ohm·m.
The ore-hosting deposits of the Zhezkazgan and Taskuduk suites are also characterized by variable electrical resistivity values, which change both along strike and in section—from several tens to several hundred Ohm·m. The variegated deposits of the Zhezkazgan suite generally exhibit higher resistivity values compared to the underlying Taskuduk and overlying Zhidelisai suite rocks.
Changes in the resistivity of the Zhezkazgan suite rocks are largely determined by the amount of clay material they contain. There is a consistent increase in the clay content from the coarse-grained to fine-grained varieties. As grain size decreases, so does the specific electrical resistivity. For example, Zhezkazgan suite sandstones have resistivity values of 150–400 Ohm·m, while the values of argillites range from 10 to 150 Ohm·m. The observed higher resistivity of gray sandstones compared to red sandstones allows this parameter to be used as a prospecting criterion in electrical exploration. However, in some areas, the specific resistivity of barren brown medium- to fine-grained sandstones and their gray varieties is comparable, leading to ambiguity when interpreting areas with elevated apparent resistivity values [51].
Information on the apparent polarizability (ηk) of rocks and ores from the Zhezkazgan deposit and adjacent areas is presented in Table 5. At the Zhezkazgan deposit, the lithological and stratigraphic horizons exhibit increased polarizability in the range of 2.0%–3.97%.
According to the velocity characteristics obtained from the vertical seismic profiling (VSP) data, the section of the studied sequence is highly differentiated. Based on the available seismic data, the velocity characteristics of the entire section can be described as follows. At the very top of the section lies a highly unconsolidated layer corresponding to the low-velocity zone (LVZ), with a thickness ranging from 2–3 m to 25–35 m.
Stratigraphically, 500 to 1700 m/s corresponds to Quaternary deposits. Beneath the LVZ is a 20–60 m package of varicolored Cenozoic clays, with formation velocities in this unit that range from 1500 to 2400 m/s. Weathered zones in various rocks are recorded from 2200 to 2700 m/s.
Lower Carboniferous rocks display strong velocity differentiation (3500–6500 m/s). Tournaisian strata reach 5000–6000 m/s, owing to cherty limestones, while Visean units vary from 4000 to 6000 m/s; the highest values represent dense limestones, dolomites, and anhydrites [52]. The red terrigenous sequence of the Middle–Upper Carboniferous shows 4000–5500 m/s.
Permian deposits differ markedly across the basin. The red beds of the Zhidelisai suite and the light-colored marls, sandstones, and argillites at the base of the Kingir suite record 2600–4000 m/s (e.g., boreholes YU-29, YU-2). Halite-rich units within the Zhidelisai and lower Kingir suites span 3500–5000 m/s (YU-29). The upper Kingir suite (dark marls, limestones, sandstones) yields higher velocities of 5000–5500 m/s (YU-30, YU-17, etc., Table 6). In most cases, the Zhezkazgan suite averages 4700–5000 m/s; the VSP log data give 4600 m/s in YU-29 and 4500–4650 m/s in YU-24.
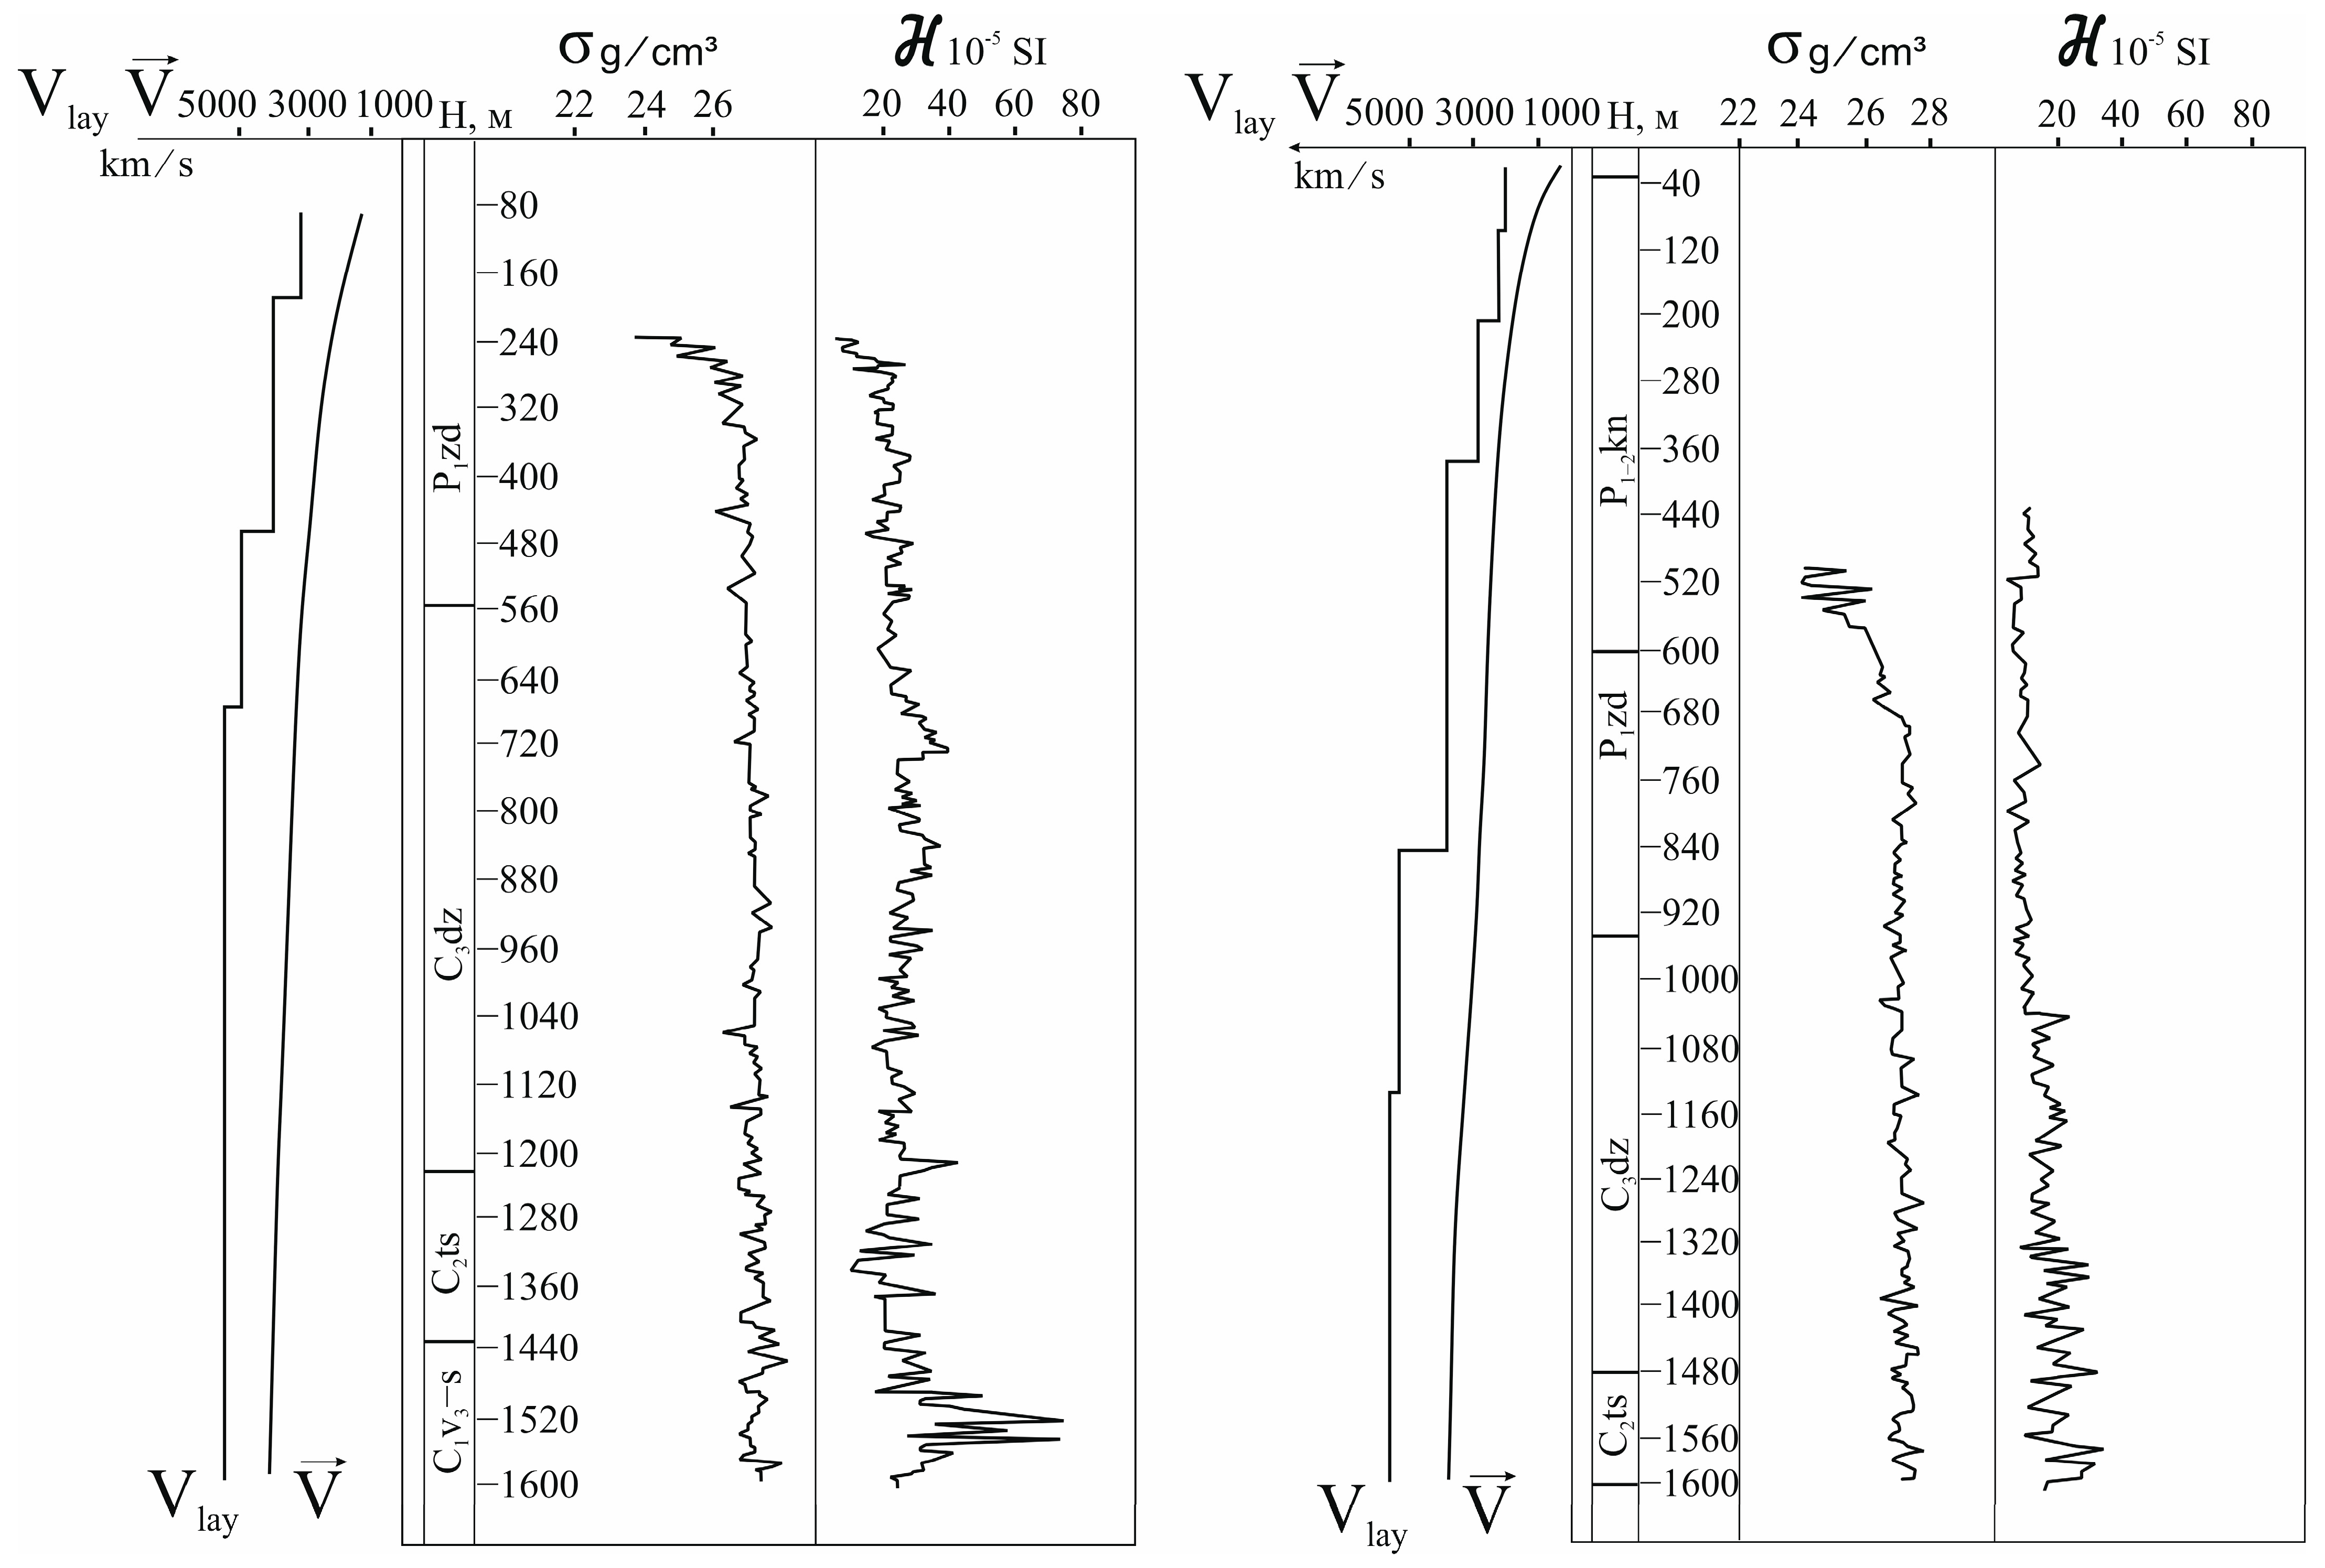
Overall, the P-wave velocity within the section varies from 1250 to 5200 m/s. Lower velocity values are characteristic of the rocks of the Zhidelisai suite, which is closest to the surface. Velocities in the range of 1250–2850 m/s were recorded in fractured zones, where weathering processes are most pronounced along tectonically disturbed areas (Table 6). The main factors influencing the variation in elastic wave velocities are fault zones with intense fracturing, increased porosity, and jointing of rocks, as well as facies changes (Figure 11) [53].
A key source of error in determining effective velocities is the heterogeneity in the shallow section (velocities from 100–150 up to 1000 m/s), which produces strong lateral velocity gradients. These heterogeneities arise mainly from sharp velocity contrasts within the Permian sequence and the irregular geometry of its bedding.

4. Discussion

By summarizing the analysis and systematization of the rock petrophysical properties in the Zhezkazgan ore district, the following main conclusions can be drawn:
  • In the Sarysu–Teniz riftogenic structural zone, two density boundaries are regionally distinguished: the first coincides with the base of the Famennian–Carboniferous deposits, which, having a density deficit of -0.06 to -0.10 g/cm3, will determine the appearance of negative gravity anomalies (Δg). The second density boundary is associated with the underlying Lower Proterozoic formations, which exhibit an excess density of 0.05–0.12 g/cm3. In the Zhezkazgan SFZ, in addition to the aforementioned density boundaries, two additional boundaries are distinguished.
One is due to the following:
  • The roof of the Lower–Upper Permian deposits (Kingir formation) and Middle–Upper Carboniferous (Zhezkazgan, Taskuduk, and, partially, Beleyutin suites) deposits, with a positive excess density of +0.06–+0.08 g/cm3;
  • Its approach to the surface and increase in thickness of the sequence, which may lead to the appearance of local second-order positive (Δg) anomalies.
The second is associated with the roof of Lower Permian salt-bearing formations, with a negative excess density from −0.08 to −0.3 g/cm3, which creates a negative effect and causes the appearance of more intense second-order negative gravity anomalies. The structure of the gravity field is also influenced by large intrusive massifs mapped in the northern marginal part of the Zhezkazgan syncline. Granitoid intrusions, with a mass deficit of up to -0.06 g/cm3 relative to the average density across the entire stratigraphic section (2.62 g/cm3), create the largest gravity minima, while dioritic and gabbroic intrusions, with a mass excess of 12–0 g/cm3, create gravity maxima.
2.
In terms of magnetic properties, the entire thick sedimentary–terrigenous sequence of the structural–formational zones, from the loose cover to the Middle Carboniferous and Permian formations, is practically non-magnetic. The nature of the magnetic field is mainly due to the heterogeneity in the basement lithology and the distribution of intrusive magmatism at depth beneath the Mesozoic–Upper Paleozoic cover, which is practically non-magnetic.
3.
The analysis of electrical parameters across the region shows a gradual increase in electrical resistivity down the section—from a few units for Meso-Cenozoic clays to hundreds and low thousands of Ohm·m for Caledonian basement rocks. Paleozoic and Riphean rocks are characterized by high specific electrical resistivity values (average ρ up to 1000 Ohm·m). In tectonic fault zones, in some cases, they exhibit resistivity values comparable to those of loose sediments and weathering crust formations. Intrusive formations also show high resistivity values (500–8000 Ohm·m).
Low-resistivity formations include the sandy–clayey deposits of the Meso-Cenozoic and the siltstone–sandy formations of the Lower Permian Zhidelisai formation, with an average resistivity of about 50 Ohm·m. A slight increase in electrical resistivity values is observed in the Lower Carboniferous carbonate–terrigenous sequence, as well as in the marly and terrigenous formations of the Lower Permian Kingir formation, reaching up to 120–100 Ohm·m. Ore-bearing grey sandstones with copper contents of up to 2%–3% do not differ in resistivity from barren ones. However, as the metal content increases to 5%–10%, their resistivity relative to the host rocks decreases by several tens of Ohm·m.
As a result of numerous experimental geoelectrical surveys conducted by production companies in specific areas of the ore fields, it was concluded that with overlapping resistivity values of Paleozoic basement rocks—especially in the presence of a cover of conductive loose deposits and widespread weathering crust—resistivity methods in electrical exploration are not always effective for direct ore prospecting. On the other hand, ore mineralization in the study area has never been recorded outside zones of high polarizability, which makes the polarizability parameter, although ambiguous, a sufficiently important prospecting indicator.
4.
By studying the velocity characteristics of the area, a generalized velocity model of the medium was constructed, showing a sharp increase in velocities in the upper part of the section up to 5600 m/s. The most distinct velocity boundaries include the base of loose deposits, the base of the Upper Tournaisian formations, the top of Upper Famennian substage limestones, and certain horizons within the productive Carboniferous and Famennian sequences.
The velocity and density data, summarized by formations, indicate a consistent increase in these parameters with the increasing age of the rocks. Acoustic stiffness jumps at age boundaries have led to the formation of key reflecting horizons at the bases of the Taskuduk, Zhezkazgan, and Zhidelisai formations. The identified patterns and features of elastic wave velocity distributions, taking into account the density characteristics of rocks in these sequences, indicate the fundamental possibility of identifying and mapping, at depth, local weakened structures that serve as pathways for metal-enriched fluids into the productive horizons.
Overall, the conducted analysis shows that the results of the physical properties of rocks within the research area can serve as a basis for detailed zoning of physical fields and their correlation with specific geological complexes and structures.
Considering the obtained data on the physical parameters of rocks and ores in the Zhezkazgan ore district, as well as the conclusions regarding the informativeness of geophysical methods, a rational integrated approach is recommended to ensure the successful identification and location of new targets during the prospecting-evaluation and exploration stages.
(1)
The primary direction for further exploration should be implementing detailed seismic surveys within the buried part of the Zhezkazgan syncline using high-resolution seismic methods, accompanied by VSP (Vertical Seismic Profiling), in future studies. This approach will make it possible to study its internal structure and to investigate deep geological heterogeneities, identify promising flexure-type related structures and lifted blocks, and provide recommendations for deep prospecting. The goal is to discover new ore-bearing prospective areas composed of productive deposits of the Taskuduk, Zhezkazgan, and Beleutin formations, particularly those buried beneath a thick sequence of Upper Paleozoic units.
(2)
For the detailed study of productive horizons, electrical prospecting should be conducted using IP and CSAMT (VES-VP) methods along profile lines to identify deep anomalous zones of electrical conductivity and polarizability and to establish their relationship with base and rare metal mineralization.

5. Conclusions

The newly obtained information on the petrophysical characteristics of the geological complexes in the Zhezkazgan ore district reveals the features of petrophysical heterogeneity in the stratigraphic section and establishes consistent patterns in the distributions of density, magnetic, and electrical properties and elastic wave velocity. The utility of petrophysical analysis is demonstrated by identifying local geophysical anomalies and correlating them with deep geological complexes, as well as structural features and lithological heterogeneities. The acquired data will serve as a foundation for delineating potential ore-bearing zones, studying their lithological and petrographic features, and developing predictive models of buried and deeply seated ore bodies.
The growing use of geophysics at various ore sites suggests that it is becoming an accepted and standard tool in Kazakhstan’s mining sector for the systematic and cost-effective discovery of concealed copper mineralization and for replenishing the mineral resource base of the Zhezkazgan region. This challenge is now being addressed through the broad application of modern geophysical technologies. This opens new opportunities for geophysicists and also sets new tasks for improving the methods used in the geological interpretation of geophysical fields. One of the key aspects is reducing the ambiguity in solving the geophysical inverse problem during the modeling of ore zones by incorporating reliable information on the petrophysical properties of rocks and ores.

Author Contributions

Conceptualization, S.I., L.I. and D.T.; methodology, S.I., D.T. and K.T.; software, D.T., Z.S. and A.I.; validation, L.I., S.I. and D.T.; formal analysis, S.I., L.I., D.T. and K.T.; investigation, S.I., L.I., D.T. and K.T.; resources, L.I., S.I., D.T., A.I., Z.S. and K.T.; data curation, S.I., L.I. and D.T.; writing—original draft preparation, S.I., D.T., A.I. and K.T.; writing—review and editing, L.I., S.I., D.T. and K.T.; visualization, D.T., Z.S. and K.T.; supervision, S.I. and L.I.; project administration, L.I.; funding acquisition, L.I. All authors have read and agreed to the published version of the manuscript.

Funding

This research was funded by the Science Committee of the Ministry of Science and Higher Education of the Republic of Kazakhstan (Grant № AP19680360; Modeling of stress and strain state of rock masses during development of ore deposits on the basis of complex geomechanical and geophysical studies).

Data Availability Statement

Data are contained within this article.

Conflicts of Interest

The authors declare no conflicts of interest. The funders had no role in the design of this study; in the collection, analyses, or interpretation of data; in the writing of this manuscript, or in the decision to publish the results.

Abbreviations

The following abbreviations are used in this manuscript:
CDPMCommon depth point method
CMRWCorrelation method of refracted waves
RWMReflected wave method
RLResistivity logging
IPLInduced polarization logging
EPElectrical profiling
DESDipole electrical sounding
VESVertical electrical sounding
IPInduced polarization
NFTPNear-field transient processes
VSPVertical seismic profiling
PM-VSPPolarization method of vertical seismic profiling
SFZStructural–formational zone
DESDeep Electrical Sounding
SPSpontaneous Potential
LLPLateral Logging Probing
LVZLow-velocity zone

References

  1. Ivanov, O.V. Geology of Central Kazakhstan; Science of the KazSSR: Alma-Ata, Kazakhstan, 1969; Volume 3, 229p. [Google Scholar]
  2. Orlov, I.V. Geology of the USSR, Central Kazakhstan Useful Minerals; Nedra: Moscow, Russia, 1989; 541p. [Google Scholar]
  3. Abdulin, A.A. Volcanogenic-Sedimentary Lithogenesis and Ore Genesis; Science of the KazSSR: Alma-Ata, Kazakhstan, 1981; 156p. [Google Scholar]
  4. Syusyura, B.B. Regularities of placement and forecasting of stratiform deposits of non-ferrous metals. Copp.-Bear. Sediment. Form. Kazakhstan 1983, 5, 17–32. [Google Scholar]
  5. Puchkov, E.V.; Naidenov, B.M. Formation of stratiform lead-zinc deposits of the Atasuy type. Mod. Geol. 1984, 1, 33–40. [Google Scholar]
  6. Bekzhanov, G.R.; Koshkin, V.Y.; Nikitchenko, I.I.; Skrinnik, L.I.; Azizov, T.M.; Timush, A.V. Geological Structure of Kazakhstan; Academy of Mineral Resources of the Republic of Kazakhstan: Almaty, Kazakhstan, 2000; 396p. (In Russian) [Google Scholar]
  7. Zaitsev, Y.u.A.; Gabay, N.L.; Golubovsky, V.A.; Potapochkin, V.M.; Martynova, M.V. Geology and Minerals of the Dzhezkazgan Ore Region; Nedra: Moscow, Russia, 1975; 284p. [Google Scholar]
  8. Satbayev, K.I. Mineral Resources of Kazakhstan: Non-Ferrous Metals (Copper, Lead, Zinc); Ministry of Science—Academy of Sciences of the Republic of Kazakhstan, Central State Archives of the Republic of Kazakhstan: Alma-Ata, Kazakhstan, 1998; Volume 3, 334p. [Google Scholar]
  9. Satbayev, K.I. Bolshoi Dzhezkazgan; Ministry of Science—Academy of Sciences of the Republic of Kazakhstan, Central State Archives of the Republic of Kazakhstan, Gylym: Alma-Ata, Kazakhstan, 1998; Volume 1, 528p. [Google Scholar]
  10. Krivtsov, A.I.; Andreev, V.L. Copper Ore Deposits—Types and Conditions of Formation; Nedra: Moscow, Russia, 1987; 198p. [Google Scholar]
  11. Ayagan, B. Kazakhstan National Encyclopedia; Madeni Mura (Cultural Heritage): Almaty: Kazakhstan, 2005; Volume 3, 560p. [Google Scholar]
  12. Satpayeva, M.K. Ores of Dzhezkazgan and the conditions of their formation. Science 1985, 1, 11–13. [Google Scholar]
  13. Seifulin, S.; Nuralin, N.N. Geological and Structural Conditions of the Formation of the Dzhezkazgan Deposit; Nauka: Alma-Ata, Kazakhstan, 1964; 217p. [Google Scholar]
  14. Nuralin, N.N.; Satpaeva, T.A.; Seifullin, S.S. Dzhezkazgan deposit. In Problems of Geology of Central Asia and Kazakhstan; Nauka: Moscow, Russia, 1964; pp. 133–142. [Google Scholar]
  15. Satpaeva, M.K.; Tanenov, T.I. Mineralogy of Ores and Zoning of Deposits of the Dzhezkazgan Deposit; Gylym: Almaty, Kazakhstan, 1995; 124p. [Google Scholar]
  16. Esenov, S.E.; Bakarasov, E.V.; Argenbaev, K.E. Geological and structural features of the Northern group of copper ore deposits of the Dzhezkazgan region. In Bolshoy Dzhezkazgan; Nauka: Alma-Ata, Kazakhstan, 1961; pp. 120–139. [Google Scholar]
  17. Baibatsha, A.B.; Kulkashev, N.T.; Bekbotaeva, A.A.; Shakirova, G.S. Prospects of Kazakhstan for the identification of non-traditional types of deposits of non-ferrous and precious metals. In Proceedings of the International Conference: Modern Problems of Geology and Exploration of Minerals, Tomsk, Russia, 5–8 October 2010. [Google Scholar]
  18. Rakishev, B.M. Role and prospects of mineral-raw materials resource in development of economy of Kazakhstan. News Natl. Acad. Sci. Repub. Kazakhstan Ser. Geol. Tech. Sci. 2016, 2, 29–39. [Google Scholar]
  19. Uzhkenov, B.S.; Alzhanova, B.G.; Petrovsky, V.B.; Fishman, I.L.; Yugin, V.V. Innovative technological schemes of forecasting and prospecting works in the search for copper deposits of the Zhezkazgan type. Kazakhstan 2011, 3, 74–78. [Google Scholar]
  20. Bybochkin, A.M.; Bykhovskiy, L.Z. Comprehensive Geological and Economic Assessment of Ore Deposits (Methodology Basics); Nedra: Moscow, Russia, 1990; 326p. [Google Scholar]
  21. Istekova, S.A. Modern methods of analysis and interpretation of geophysical data. News Natl. Acad. Sci. Repub. Kazakhstan Ser. Geol. Tech. Sci. 2006, 4, 23–30. [Google Scholar]
  22. Sirazhev, A.; Istekova, S. Geological and geophysical conditions for application of 3D seismic in mineral exploration. Proceeedings of the NSG2021 27th European Meeting of Environmental and Engineering Geophysics, Bordeaux, France, 29 August 2021–2 September 2021; Volume 2021, pp. 1–5. [Google Scholar] [CrossRef]
  23. Malehmir, A.; Durrheim, R.; Bellefleur, G.; Urosevic, M.; Juhlin, C.; White, D.J.; Milkereit, B.; Campbell, G. Seismic methods in mineral exploration and mine planning: A general overview of past and present case histories and a look into the future. Geophysics 2012, 77, WC173–WC190. [Google Scholar] [CrossRef]
  24. Sirazhev, A.; Istekova, S.; Tolybaeva, D.; Togizov, K.; Temirkhanova, R. Methodology and Results of Detailed 3D Seismic Exploration in the Zhezkazgan Ore District. Appl. Sci. 2025, 15, 567. [Google Scholar] [CrossRef]
  25. Ellansky, M.M. Petrophysical Foundations of Complex Interpretation of Geophysical Well Survey Data (Methodological Manual); GERS Publishing House: Moscow, Russia, 2001; 229p. [Google Scholar]
  26. Zinchenko, V.S. Petrophysical Foundations of Hydrogeological and Engineering-Geological Interpretation of Geophysical Data: Textbook for Students of Higher Educational Institutions; AIS Publishing House: Tver, Russia, 2005; 392p. [Google Scholar]
  27. Istekova, S.; Makarov, A.; Tolybaeva, D.; Sirazhev, A.; Togizov, K. Determining the Boundaries of Overlying Strata Collapse Above Mined-Out Panels of Zhomart Mine Using Seismic Data. Geosciences 2024, 14, 310. [Google Scholar] [CrossRef]
  28. Dentith, M.; Adams, C.; Bourne, B. The use of petrophysical data in mineral exploration: A perspective. ASEG Ext. Abstr. 2018, 1, 1–4. [Google Scholar] [CrossRef]
  29. Gubina, A.I.; Pleshkov, L.D.; Luppov, V.I. Petrophysics: Petrophysical Support of Geophysical Methods: Textbook; Perm State National Research University: Perm, Russia, 2016; 183p. [Google Scholar]
  30. Benevolensky, I.P.; Volozh, Y.u.A.; Lyapichev, G.F.; Patalakha, E.I. Petrophysical characteristics of geological bodies of structural-formational zones. In Petrophysics of Geological Formations. Balkhash Segment; Nauka: Alma-Ata, Kazakhstan, 1988; pp. 34–79. [Google Scholar]
  31. Kurskeev, A.K. Handbook of Physical Properties of Rocks of Kazakhstan; Nauka: Alma-Ata, Kazakhstan, 1977; 245p. [Google Scholar]
  32. Smelov, A.A. On the connection of physical properties of rocks with the processes of near-ore change. Issues Ore Geophys. Kazakhstan 1968, 2, 194–199. [Google Scholar]
  33. Dortman, N.B. Physical properties of rocks and minerals (petrophysics). In Geophysics Handbook; Nedra: Moscow, Russia, 1976; 527p. [Google Scholar]
  34. Ragdanova, A.; Mataibayeva, I.; Frolova, O.; Agaliyeva, B.; Dolgopolova, A.; Togizov, K. Structural-formational zones with porphyry copper mineralization—A promising mineral resource base for copper in Eastern Kazakhstan. Min. Miner. Depos. 2025, 19, 107–120. [Google Scholar] [CrossRef]
  35. Kamaliden, A.S. Petrographic characteristics of volcanogenic-sedimentary rocks of the Sarysu-Teniz uplift. Young Sci. 2020, 14, 126–130. [Google Scholar]
  36. Istekova, S.; Aidarbekov, Z.; Togizov, K.; Saurykov, Z.; Sirazhev, A.; Tolybayeva, D.; Temirkhanova, R. Lithophysical characteristics of productive strata of cupriferous sandstone within Zhezkazgan Ore District in the central Kazakhstan. Min. Miner. Depos. 2024, 18, 9–17. [Google Scholar] [CrossRef]
  37. Burlin, Y.u.K.; Ivanov, M.K.; Kalmykov, G.A.; Karnyushina, E.E.; Korobova, N.I. Petrophysical Methods of Studying Core Material (Terrigenous Deposits). Study Guide; Moscow University Publishing House: Moscow, Russia, 2008; 112p. [Google Scholar]
  38. McPhee, K.; Reed, J.; Zubizarretta, I. Laboratory Core Studies: A Guide to Best Practices; Institute of Computer Research: Izhevsk, Russia, 2018; 924p. [Google Scholar]
  39. Dobrynin, V.M.; Vendelshtein BYu Kozhevnikov, D.A. Petrophysics (Rock Physics): Textbook for Universities, 2nd ed.; Kozhevnikov, D.A., Ed.; FSUE Publishing House “Oil and Gas” of the Gubkin Russian State University of Oil and Gas: Moscow, Russia, 2004; 368p. [Google Scholar]
  40. Kobranova, V.N. Petrophysics: Textbook for Universities; Nedra: Moscow, Russia, 1986; 392p. [Google Scholar]
  41. Dortman, N.B. Petrophysics: Handbook. Rocks and Useful Minerals; Nedra: Moscow, Russia, 1992; 391p. [Google Scholar]
  42. Krylov, S.V.; Bryksin, A.V.; Ten, E.N. Elastic properties of silicate minerals and crystalline rocks for an isotropic model. Geol. Geophys. 1990, 12, 101–112. [Google Scholar]
  43. Glaznev, V.V. System for creating three-dimensional models of geological objects. Vestn. Voronezh. Univ. Series. Geol. 2000, 8, 205–207. [Google Scholar]
  44. Stern, D. Practical aspects of scaleup of simulation models. J. Pet. Technol. 2005, 57, 46–52. [Google Scholar] [CrossRef]
  45. Enkin, R.J.; Hamilton, T.S.; Morris, W.A. The Henkel petrophysical plot: Mineralogy and lithology from physical properties. Geochem. Geophys. Geosyst. 2020, 20, e2019GC008818. [Google Scholar] [CrossRef]
  46. Kuznetsov, V.G. Lithology. Sedimentary Rocks and Their Study: Textbook for Universities; Nedra Business Center: Moscow, Russia, 2007; 511p. [Google Scholar]
  47. Salkov, S.A.; Glybovsky, V.A. Features of mineralogy of copper sandstones of the Zhaman-Aibat structure. Petrol. Petrochem. Igneous Rocks Kazakhstan Depos. Assoc. Them 1987, 3, 37–45. [Google Scholar]
  48. Koshkin, V.Y.; Rakishev, B.M.; Uzhkenov, B.S.; Tsirelson, B.S. Tectonic Map of Kazakhstan Scale 1:1000000; Uzhkenov, B.S., Abdulin, A.A., Koshkin, V.Y., Eds.; Map Made in the Institute of Geological Sciences Named After K.I.Satpaev; Ministry of Energy and Mineral Resourses of the Respublic of Kazakhstan, Committe of Geology and Subsoil Using: Astana, Kazakhstan, 2007. [Google Scholar]
  49. Aidarbekov, Z.h.K.; Istekova, S.A.; Glass, H. Complex of geophysical research for studying geological structure of Zhezkazgan Ore Region in Kazakhstan. Eng. Min. Geophys. 2021, 1–9. [Google Scholar] [CrossRef]
  50. Bekeyeva, G.G.; Tungushbayeva, A.T.; Ponomareva, M.V. Mineragenic factors of ore containment in the Zhezkazgan mining district. Int. Sci. J. Symb. Sci. 2024, 12-2-2, 37–41. [Google Scholar]
  51. Lobanov, K.V. Relationships between tectonic deformations, metamorphism, petrophysical properties of rocks and ore mineralization. In Rocks and Minerals at Great Depths and on the Earth’s Surface: Subprojects. Apatity; MUP Poligraf: Moskow, Russia, 1999; pp. 47–50. [Google Scholar]
  52. Kassymkanova, K.K.; Istekova, S.; Rysbekov, K.; Amralinova, B.; Kyrgizbayeva, G.; Soltabayeva, S.; Dossetova, G. Improving a geophysical method to determine the boundariesof ore-bearing rocks considering certain tectonic disturbances. Min. Miner. Depos. 2023, 17, 17–27. [Google Scholar] [CrossRef]
  53. Blake Cross Christopher, L. Kirkland. Petrological control on chargeability with implications for induced polarization surveys. J. Appl. Geophys. 2021, 188, 104308. [Google Scholar]
Figure 1. Overview schematic map of the Zhezkazgan ore district.
Minerals 15 01106 g001
Figure 2. Schematic geological map (Pre-Cenozoic deposits) and geological section of the Zhezkazgan ore district.
Minerals 15 01106 g002
Figure 3. Schematic stratigraphic column of the Zhilandinsky and Zhezkazgan ore fields.
Minerals 15 01106 g003
Figure 4. Example of variogram construction for the distribution of effective (Vlay) and average velocities (Vef) of the Taskuduk formation. Vlay—(a) Zhideli area; (b) Zhaman-Aibat area, reflecting horizons RI, RII, and RIII. Vef—(c) Zhaman-Aibat area horizon RII; (d) Zhaman-Aibat area horizon RIII.
Minerals 15 01106 g004
Figure 5. Average velocity V_avg (t0) graphs based on VSP results. Wells: (a) J-42 and J-54 and (b) 4061, 4062, and 4011.
Minerals 15 01106 g005
Figure 6. Generalized density distribution scheme of the geological complexes in the Zhezkazgan ore district.
Minerals 15 01106 g006
Figure 7. Rock density distribution diagrams of the Zhezkazgan ore district: (a) Sarysu–Teniz structural–formational zone; (b) Zhezkazgan structural–formational zone.
Minerals 15 01106 g007
Figure 8. Map of magnetic and gravity fields with sampling wells.
Minerals 15 01106 g008
Figure 9. Graphs of density and magnetic susceptibility along borehole YU-42 (JSC “Zhezkazgangeologiya”).
Minerals 15 01106 g009
Figure 10. Density and magnetic susceptibility logs (graphs) from boreholes: (a) YU-54; (b) YU-49 (JSC “Zhezkazgangeologiya”).
Minerals 15 01106 g010
Figure 11. Results of PM-VSP processing and physical characteristics of the section from Borehole 4062 (JSC “Zhezkazgangeologiya”).
Minerals 15 01106 g011
Table 1. Formation velocity and density of the rocks in the Zhaman-Aibat structure.
AgeLithologiesLayer Velocities V, m/sDensity σ, g/cm3
1QSurface sands--
2Uz–KzDry sands, loams400–15001.8/1.60–2.60
3MzWeathering crust of Paleozoic rocks18001.80/1.60–2.60
4K2Variegated and gray clays1600–2200-
5P1–2knDark marls, limestones, sandstones5000–5500-
6P1–2knLight marls, sandstones, argillites3000–38002.20
7P1zdRed and grayish-red sandstones with gypsum inclusions, siltstones3000–38002.20
8P1zdArgillites, red and grayish-red sandstones with carbonate inclusions44002.47
9P1zd–C3dzSandstones 2.52
10C3dzRed and grayish-red sandstones4200–4800(up to 5000)Up to 2.65–2.73
11C2tsRed and grayish-red sandstones4200–48002.63
12C1v3–sRed and grayish-red sandstones4200–4800-
Table 2. Physical Properties of Rocks in the Zhezkazgan Structural-Formational Zone.
Index/NameLithologiesDensity, σ g/cm3Magnetic Sus-ty (χ) 1 × 10⁻⁵ Unit SI
Number of
Examples
Weighted AverageNumber of
Examples
Weighted Average
C2ts
Taskuduk
Red siltstones252.72511.2
Gray and brown sandstones, gravelites5632.6761023
Red-colored sandstones3182.6534221
Sandstones, brownish-gray, greenish-gray, purple, siltstones, conglomerates622.626286
Sandstones, gray siltstones4762.7--
Siltstones32.713136
Siltstones, sandstones, siliceous limestones552.65558
Sandstones, strongly weathered252.092514
C2–3
Zhezkazgan
Sandstones, siltstones8692.6994322
Sandstones, reddish-gray, red-colored and gray, conglomerates, silicified limestones392.593982
Siltstones, sandstones1692.51697.0
Siltstones3192.6833512.0
Sandstones, reddish-gray, red-colored and gray sandstones7662.68113618.0
Sandstones662.616634
Brown sandstones, brownish-red siltstones with interlayers of intraformational conglomerates2352.750214
entry 3Tuffaceous sandstones102.33631
Sandstones, conglomerates802.378027
Conglomerates152.631521
P1žd
Zhidelisai
Siltstones, mudstones2752.2737916
Gray siltstones462.644613
Red and grayish-red, gray and reddish-gray fine and fine-grained sandstones4462.6227914
Sandstones, siltstones, mudstones2522.2923829
Sandstones, siltstones, siltstones,
siltstones, mudstones
202.73207
Brown siltstones, brownish-red mudstones, siltstones interbedded with mudstones2532.26--
Sandstones6272.57933
Sandstones, siltstones, mudstones2822.4234915
Salt 2.2--
Table 3. Physical properties of rocks and ores of the Zhezkazgan ore district.
LithologiesAgeNumber of SamplesSpecific Electrical
Resistivity (ρk), Ohm·m
Density σ, g/cm3P-Wave
Velocity, km/s
minmaxavgminmax
1Sands, sandstones, loams, conglomeratesMz–Kz1002100300.21.20.5–1.5
2Marls, marly limestones, sandstones, siltstones, argillitesP1kn300502001000.52.03.5–4.5
3Crimson-red argillites, siltstones, sandstonesP1qd270550300.21.01.8–3.6
4Red-colored fine-grained sandstones, siltstones, argillitesC2–32261504002000.51.04.1–4.6
5Medium-grained brown and gray sandstones, siltstones, conglomerates, limestonesC2–31653008003000.52.2-
6Greenish-gray sandstones, limestones, argillitesC1286502001200.62.2-
7Red arkosic sandstonesD2–32362005003000.62.25.0–5.5
8Conglomerate porphyry formationD121220030003000.62.2-
9Schists, porphyroids, effusive sedimentary rocksPz12807005000to 10000.52.0to 6.0
10Metamorphic schists,
gneisses, marbles
R3505006000to 10000.92.06.0–6.5
11GranitoidsD1284500800010000.51.36.0
12Gabbroids 272500800010000.51.36.0
13Copper oresC2–3200.150204.023-
14Rich copper oresC2–3300.050.10.071427-
Table 4. Summary table of specific electrical resistivity values for individual geoelectric horizons.
Geological IndexLithologiesElectrical Resistivity (Ohm·m)Most Frequent
Resistivity
QSands and loams50–1000100–800
₧-NClays2–207–10
“Drainage” sandstones100–800
KSands, gravel100–300
KGravel, pebbles10–12
KClays25–30
P1–2knMarls, interbedding of marls with sandstones and siltstones90–350
P1–2knMarls100–300100
P1–2knDense marls, marly clays20–50
Table 5. Average physical properties of rocks and ores of the Zhezkazgan deposit.
AreaUnit Typeσavg.(n)/Sχavg.(n)/Sηk avg.(n)/SVavg./S
ZhezkazganZhidelisai suite2.66(1195)/0.0818(1169)/-2.24(744)/1.864.46(775)/1.79
Zhezkazgan suite2.69(3633)/007316(3927)/-2.81(2299)/2.224.90(2381)/1.19
Taskuduk suite2.69(2555)/0.7518(2551)/-2.88(1684)/1.945.09(1674)/1.19
Serpukhovian stage2.70(2006)/0.03215(2029)/-3.00(1087)/2.374.97(1088)/1.41
Akchiy-SpasskZhidelisai suite2.66(861)/0.05418(829)/-2.50(570)/2.004.38(567)/2.02
Zhezkazgan suite2.69(1820)/003118(1716)/-3.16(1123)/2.164.65(1091)/1.54
Taskuduk suite2.70(773)/0.02216(782)/-2.97(569)/2.384.74(630)/1.67
ZhezkazganAleurolite2.70(624)/0.04218(589)/-3.28(328)/3.054.80(184)/1.44
Sandstone2.69(8584)/0.09222(8518)/0.0102.77(5256)/2.044.92(5836)/1.37
Fine-grained sandstone (dark/greenish/green-grey)2.71(740)/0.01916(768)/-2.33(430)/2.355.02(404)/1.55
Fine-grained grey sandstone2.71(620)/0.01818(628)/-2.00(351)/1.815.39(452)/1.28
ZhezkazganFine-grained red sandstone2.70(2027)/0.06119(2025)/-2.29(1198)/2.044.67(1250)/1.39
Fine-grained dark-grey sandstone2.69(311)/0.03016(311)/-3.37(148)/2.584.90(523)/1.93
Fine-grained grey sandstone2.67(2980)/0.07015(2892)/-3.22(1955)/1.724.92(2250)/1.32
Fine-grained grey-red sandstone2.68(791)/0.07819(787)/-2.56(466)/1.675.13(523)/1.33
Fine-grained reddish-grey sandstone2.69(72)/0.03518(70)/-1.93(48)/1.244.98(45)/1.42
Medium-grained grey sandstone2.66(109)/0.02414(111)/-3.97(86)/2.024.45(92)/1.91
Conglomerate2.68(116)/0.03014(119)/-3.24(80)/2.134.94(90)/2.32
Limestone2.70(174)/0.02814(173)/-2.38(59)/2.155.84(61)/1.84
Organogenic limestone2.71(38)/0.02716(38)/-2.30(4)/-5.47(5)/-
Ore Horizons (Host Rocks)
ZhezkazganI2.70(1106)/0.06821(1120)/-2.88(721)/1.995.10(735)/1.27
II2.68(813)/0.02615(821)/-3.00(489)/2.394.87(520)/1.54
Ore Horizons (Ore Itself)
ZhezkazganI2.63(28)/-10(2)/--5.25(2)/-
II2.83(36)/0.20913(33)/11.0-5.60(30)/0.69
III2.77–2.8513–28-5.19–5.76
Table 6. Results of P-wave velocity measurements in the Zhezkazgan ore district.
LithologiesAgeLayer Velocities (m/s)Method of
Determination
Region/Location
1Sands, loamsQ400–800CMP (CDP)Zhezkazgan depression
2Sandy loams, claysKz800–2200CMP (CDP)Zhezkazgan depression
3Marls, dark-colored limestonesP1–2kn4700–5500Seismo-logging (VSP)Boreholes 1700,
YU-16, YU-30
4Marls, sandstones, gray siltstonesP1–2kn2000–4000Seismo-logging (VSP)Eastern part of depression
5SaltP1–2kn P1žd4000–4400
3300–3900
Seismo-logging, sonic loggingBH YU-30BH YU-29
6Red-colored sandstones, siltstonesP1žd1800–2000
3400–4500
Seismo-logging (VSP)Zhezkazgan depression BH YU-30, YU-27, YU-29
7Red-colored sandstones (lower section)P1žd4250–4550Seismo-loggingBH 7852, 7860
8Brown and gray sandstones, siltstones, argillitesC2–34850–4920Seismo-loggingBH 7852, 7860, 7862
9Sandstones, siltstones, argillitesC2ts5200–5400Seismo-loggingBH 7852, 7860, 7862
10Sandstones, limestonesC1v15000–5900Seismo-logging (VSP)BH YU-23, YU-27, 7862
11Limestones, sandstonesC1t5000–6100VSPFlanks of the depression
12LimestonesD3fm5060SeismoscopyBH 29
13Crystalline schistsPR6000–6200VSPUytas uplift
Disclaimer/Publisher’s Note: The statements, opinions and data contained in all publications are solely those of the individual author(s) and contributor(s) and not of MDPI and/or the editor(s). MDPI and/or the editor(s) disclaim responsibility for any injury to people or property resulting from any ideas, methods, instructions or products referred to in the content.