Abstract
The heavy mineral-rich wadi deposits sourced from various wadis close to Gabal Homret Waggat in the central eastern Desert of Egypt are being analyzed to assess their genesis and paleoenvironment. This study integrates remote sensing (ALOS/PALSAR DEM and ASTER imagery), mineralogical, and geochemical analyses (XRF and SEM-EDX). Remote sensing analysis (ASTER and ALOS/PALSAR) delineated three main watersheds and identified granitic plutons as the primary source rocks. Mineralogical analysis revealed a diverse heavy mineral assemblage, including zircon, rutile, ilmenite, magnetite, staurolite, and sillimanite, indicative of a provenance dominated by granitic and metamorphic rocks. Grain size analysis shows that the samples range from very platykurtic to extremely leptokurtic (Kg: 0.598–5.350 φ), indicating deposition in predominantly fluvial environments. Geochemical data show enrichment in SiO2, Al2O3, K2O, and Na2O, indicating a felsic (granitic) source with low Chemical Index of Alteration (CIA: 41.89–51.83) and Plagioclase Index of Alteration (PIA: 37.97–52.78) values, and indicating that the source rocks show low to moderate chemical weathering. Tectonic discrimination diagrams suggest that the source rocks were formed in a continental island arc or active continental margin, consistent with the Arabian–Nubian Shield. The presence of economically valuable minerals like zircon and rare-earth-element-bearing monazite and columbite highlights the significant resource potential of these placer deposits.
1. Introduction
The Arabian–Nubian Shield (ANS) is a significant Neoproterozoic juvenile continental crust that includes the basement complex of the Sinai Peninsula in Egypt. This region features a variety of rock formations, such as metamorphic units, calc-alkaline granites, and within-plate granites, with distinct suites of older and younger granites. The younger granites, including A-type granites, are linked to specific tectonic settings and have complex petrogenetic relationships that are not yet fully understood [1,2,3,4].
Mineral sands are valuable deposits formed when waves, wind, and water naturally sort and concentrate heavy minerals like ilmenite, rutile, zircon, and monazite in coastal or river environments. This process accumulates these dense minerals, making them a primary source for critical industrial materials such as zirconium, titanium, and rare-earth elements [5,6,7]. The provenance and evolution of heavy minerals in sedimentary environments provide crucial insights into the geological history, source rock composition, and tectonic evolution of a region [8,9,10]. In arid to semi-arid regions like the Central Eastern Desert of Egypt, the study of heavy mineral assemblages offers valuable information about erosion, weathering, and depositional processes.
The mineralogy of clastic sediment reveals key information about its origin, including source rock types and transport history. Mineral sands, formed by weathering in mountain belts, are transported by rivers, glaciers, or wind and deposited as placer deposits [11]. Heavy minerals are not only characterized by their higher density but also by their greater resistance to weathering processes compared to many light minerals. This dual property makes them particularly reliable indicators in provenance analysis. Heavy minerals respond differently to magmatic and metamorphic processes, providing insights into provenance, tectonic settings, and host rock composition. They also help reconstruct metamorphic conditions and the cooling history of orogenic belts. The occurrence and relative abundance of minerals such as zircon, tourmaline, rutile, and garnet provide insights into the source rock composition and the tectonic setting of the sedimentary basin [12,13]. For example, zircon is highly resistant to both mechanical abrasion and chemical weathering, and therefore its persistence in the sedimentary record allows for robust interpretations of source-area characteristics and recycling processes [14]. Placer deposits are classified into different types based on their formation environment: aeolian (wind-driven), colluvial (gravity-driven), alluvial (stream-deposited), and beach placers [15,16,17,18].
Sediment production and erosion rates are influenced not only by tectonics but also significantly by climate, through the combined effects of mechanical and chemical weathering. Mechanical weathering alters rock volume via processes like exfoliation, hydration, and freeze–thaw cycles, while chemical weathering depends on temperature and precipitation, affecting reaction kinetics and rock alteration. The mineralogy and texture of exposed lithologies ultimately control sediment yield. Studies have ranked chemical weathering rates across rock types, showing that carbonates and evaporites weather rapidly, while plutonic and sandstone rocks weather more slowly [19,20,21]. Chemical weathering can drastically alter detrital mineralogy, sometimes producing mature sediments like clay-rich quartz arenites. Despite climatic influences, topographic relief plays a key role in preserving provenance signals. In glacial settings, intense mechanical weathering can lead to significant feldspar loss and quartz enrichment, highlighting the complex interplay between climate, lithology, and geomorphic conditions in sediment generation [22,23,24].
This study uses a multidisciplinary approach, combining remote sensing, geochemical data, and sedimentology, to conduct a thorough analysis of heavy mineral deposits in Egypt’s Wadi El Tuleia area. This research seeks to identify the minerals’ composition, origin, depositional environment, and weathering history, with a specific goal of assessing the concentration of valuable industrial minerals like zircon, ilmenite, and garnet. By evaluating the quality and abundance of these resources, we aim to enhance resource assessment and guide future exploration using our findings, potentially supporting local Egyptian industries through the sustainable development of these deposits.
2. Geological Setting and Climate
The Wadi El-Tuleia district, located in the central Eastern Desert of Egypt about 70 km west of Marsa Alam on the Red Sea coast, spans approximately 120 km2 between latitudes 25°04′–25°14′ N and longitudes 34°09′–34°24′ E. The region has a hot, arid, and humid climate in summer, and is warm and dry in winter, with occasional flash floods. Vegetation is sparse, consisting mainly of grass and a few scattered trees. Stream sediments in Wadi El Tuleia are colluvial-alluvial deposits formed recently on the flood plains. The feldspar sands from Homret Waggat have a low quartz to feldspar ratio of 1:2 and the carbonate minerals are nearly absent [25].
The study area is composed of Precambrian ophiolite, island arc, and granitic rocks. Granitic plutons form the highest elevations, including parts of Gabal Homret Waggat and Gabal Abu Diab (~1145 m), and Gabal El-Yatima (650–750 m). The region is intersected by several wadis, notably Wadi El-Yatima, Wadi El Tuleia, and Wadi El-Faliq (Figure 1).
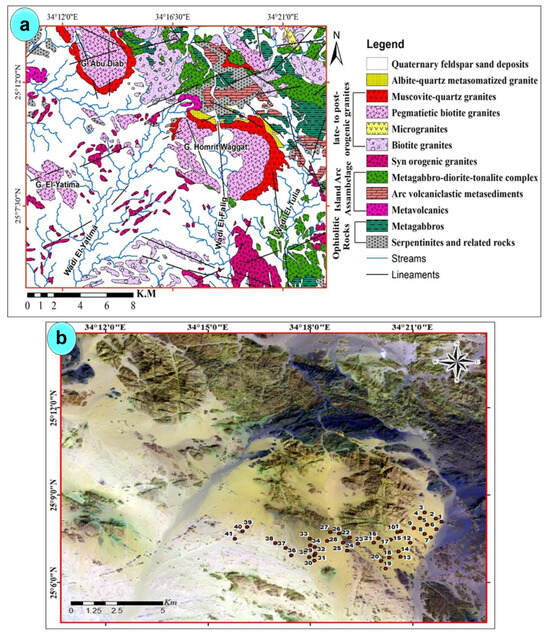
Figure 1.
(a) Geologic map for Gabal Homret Waggat district [26]. (b) False color composite (FCC) image ASTER bands 981 in RGB and samples’ location.
The Homret Waggat granites include both older and younger types. The older granites appear as separate, exfoliated gray masses with fine to medium grains, surrounding two main oval-shaped granite bodies (Figure 2a). These bodies consist of five distinct rock types arranged chronologically from oldest to youngest: deformed granodiorite (in contact with the southern part of the eastern outcrop), highly altered biotite granodiorite, biotite granite, buff-colored alkali feldspar granite, and red microcline granite. These are intersected by numerous quartz veins [25]. The wadi deposits (feldspar sand) in the study area form alluvial fans and are primarily made up of sand, gravel, and rock fragments. These sediments also contain economically important heavy minerals derived from surrounding rocks such as metavolcanics, metasediments, quartz diorite, biotite granite, and alkaline granite (Figure 2b).
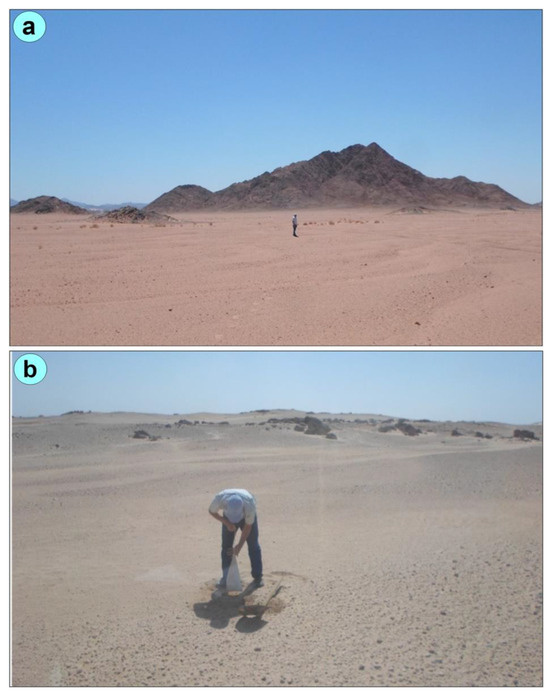
Figure 2.
(a) Field photograph showing the Wadi El Tuleia feldspar sands. (b) Field photograph showing the sampling of feldspar sand deposits.
3. Materials and Methods
3.1. Remote Sensing Data
The Advanced Spaceborne Thermal Emission and Reflection Radiometer (ASTER) and ALOS/PALSAR (DEM) data were used to differentiate wadi deposits by analyzing their spectral reflectance through both unsupervised and supervised classification methods (Figure 3). Additionally, these datasets helped characterize the primary constituents of alluvial sediments within the wadi system.
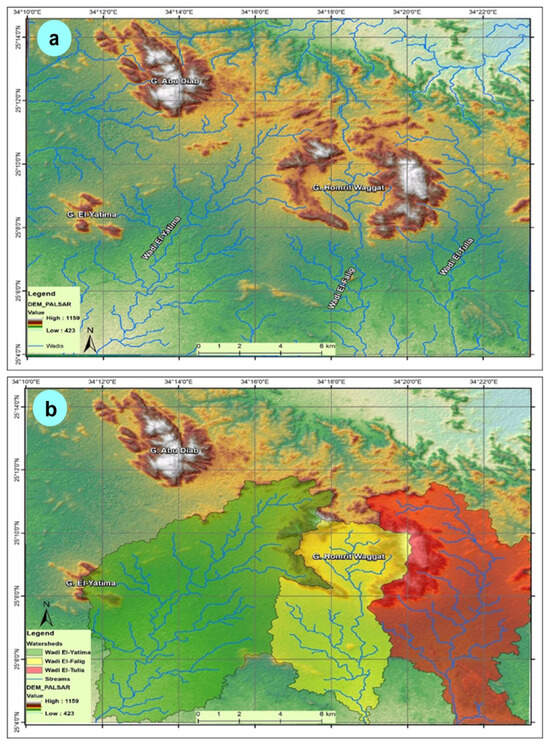
Figure 3.
(a) ALOS/PALSAR derived DEM (12.5 m) with the extracted wadi channels; (b) ALOS/PALSAR derived DEM (12.5 m) with watersheds.
The Advanced Land Observing Satellite (ALOS), developed by Japan’s Aerospace Exploration Agency (JAXA), was launched on 24 January 2006, and remained operational until 21 April 2011, when its power generators failed (https://www.eorc.jaxa.jp/ALOS-2/en/about/palsar2.htm) (accessed on 20 October 2024). It carried the Phased Array L-band Synthetic Aperture Radar (PALSAR), a sensor designed for continuous land monitoring, capable of operating day and night under any weather conditions [24]. A single ASTER_L1T image from 4 June 2002, was downloaded for the study area. This date was selected to ensure the usability of SWIR bands 4–9, which became unreliable after 23 April 2008, UTM zone 36N and WGS84 datum (https://asterweb.jpl.nasa.gov/). Image processing was conducted using ENVI 5.6, applying various analytical methods, including false color composites, band ratios, and principal component analysis (PCA) classification.
3.2. Field Sampling, Heavy Mineral Separation and Analytical Techniques
A total of 41 feldspar sand samples were collected from 15 geomorphological profiles perpendicular to the wadis in the study area. While most profiles provided three samples each, profiles 8 and 9 contributed only one sample each (Figure 1b and Figure 2a,b). The sampling spanned from Wadi El Tuleia in the west to Wadi El-Yatima in the east, ensuring broad geographic coverage. Each sample was sieved using a Ro-tap shaker and a set of seven standard mesh sizes for 15 min. The resulting grain size fractions were weighed and analyzed using Gradistat software version 8.0 [27], to determine sedimentological parameters such as mean grain size, sorting, skewness, and kurtosis. The study of the grain size composition of the stream sediments aims to apply some of the various methods of interpretation of grain size data in an endeavor to test their usefulness in disclosing the paleo-environment.
To investigate the heavy minerals, each sample was sieved into different grain sizes. The 250 μm to 106 μm, and 106 μm to 75 μm fractions were treated with bromoform (specific gravity 2.82) to separate heavy minerals from light minerals. Individual heavy mineral grains were then manually selected under a stereomicroscope, as well as polarizing microscope. These were analyzed using a Philips XL 30 Scanning Electron Microscope (SEM) coupled with Energy Dispersive X-ray analysis (EDX) (Philips, Eindhoven, The Netherlands) at the Central Laboratories of the Egyptian Geological Survey, as well as at the Nuclear Materials Authority (NMA), Egypt. The SEM-EDX analyses were made for the individual mineral grains using counting time 180 s for some selected spots near the centers of the grains to avoid diffraction of the electron beam at the grain margins. The analytical conditions were 25–30 kV accelerating voltages, 1–2 mm beam diameter and 60–120 s counting time. Minimum detectable weight concentration is from 0.1 to 1 wt%. Precision is well below 1% while the relative accuracy of concentration measurements ranges from 2% to 10% for elements with Z > 9 (F) and from 10% to 20% for the lighter elements B, C, N, O and F. SEM-EDX analyses were also made to investigate morphological characteristics of these minerals as well as to give a semi-quantitative evaluation of their elemental composition.
Mineralogical composition was identified using an X-ray diffraction (XRD) instrument (Empyrean 2020, Malvern Panalytical B.V., Almelo, The Netherlands) equipped with a Cu-Kα radiation tube operated at 40 kV and 30 mA, with a Ni filter. The scan was performed over a 2θ range of 5°–70°, with a step size of 0.02° and a counting time of 1 s per step. Phase identification was carried out using the PDF-2 database (2020 release) and HighScore Plus software version 4.9. Semi-quantitative analysis of mineral abundances was performed using the Rietveld refinement method.
Approximately 1 kg of each feldspar sand sample was prepared for geochemical analysis by crushing, quartering, and then grounding to a fine powder (<75 μm, passing a 200-mesh sieve) to ensure the homogeneity for X-ray fluorescence (XRF) analysis. The samples were analyzed at the NMA in Egypt using a Philips X-Unique II XRF spectrometer (PW-1510, Philips Analytical, Eindhoven, The Netherlands) with an automatic sample changer to determine major oxides and trace elements. The results were used to interpret the samples’ provenance, depositional environment, and degree of paleoweathering.
4. Results and Discussion
4.1. Remote Sensing and Drainage Pattern
A high-resolution ALOS/PALSAR Digital Elevation Model (DEM) with 12.5 m spatial resolution was used to accurately extract drainage networks and watersheds for the three main wadis in the study area: Wadi El Tuleia, Wadi El-Falig, and Wadi El-Yatima. This extraction is crucial for identifying the upstream rock types that contribute to the composition of wadi deposits. Using a consistent flow direction algorithm, the DEM provided more detailed and smoother topographic data than the SRTM-DEM, which is especially important for the relatively small study area. The three watersheds were delineated as follows: El Tuleia basin in the west, El-Falig basin in the center, and El-Yatima basin in the east (Figure 1b and Figure 4a).
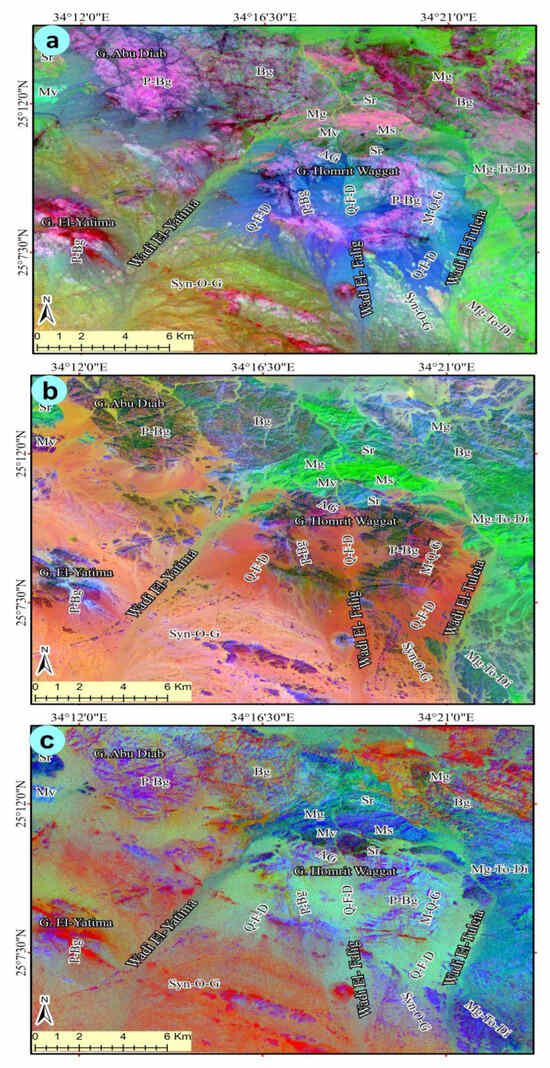
Figure 4.
(a) FCC image ASTER (432) in RGB. (b) The color composite (PCA) ASTER image (PC1 PC2 PC3) in RGB; (c) ASTER band ratio image (7/6, 6/5, 6/4) RGB for the study area [27]; Note, Q-F-D: Quaternary feldspar sand deposits; A-G: Albite-quartz metasomatized granites; M-Q-G: Muscovite quartz Granites; P-B-G: Pegmatietic biotite granites; Micro-G: Microgranites; BG: Biotite granites; Syn-O-G: Syn orogenic granites; Mg-To-Di: Metagabbro diorite tonalite complex; Ms: Arc volcaniclastic metasediments; Mv: Metavolcanics, Sr: Serpentintes and related rocks; Mg: Metagabbros.
The false color composite (FCC) image from ASTER, using bands 9, 8 and 1 (Figure 1b), as well as 4, 3, and 2 in RGB, is particularly effective for distinguishing granite types in the study area. In this imagery, biotite granite appears pink and muscovite granite shows up as bluish white, especially around Gabal Homret Waggat. Gabal Abu Diab and Gabal El Yatima also appear pink, indicating the presence of biotite granite. This visual interpretation suggests that granite—especially around Gabal Homret Waggat is the primary source of feldspar-rich wadi deposits, which appear blue in the imagery (Figure 4a).
Principal Component Analysis (PCA) images (using PC1, PC2, and PC3 in RGB) effectively distinguish the feldspar-rich wadi deposits around the rim of Gabal Homret Waggat from the surrounding country rocks. In the ASTER imagery, these deposits appear reddish, likely due to their high content of flux minerals like potassium and albite feldspars, which have lower reflectance. In contrast, feldspar sands rich in kaolinite—especially along the southwestern part of Wadi El-Yatima—appear yellowish in the imagery (Figure 4b).
An ASTER band-ratio image using bands 7/6, 6/5, and 6/4 (as applied by [27]) was used to distinguish biotite granite at Gabal Homret Waggat and Gabal Abu Diab from surrounding rocks. In this image, granite appears in blue, clearly separating it from adjacent formations (Figure 4c). Wadi deposits also show up as light blue, though those in the northern and southern parts of the study area are not clearly identifiable using this method.
4.2. Grain Size Analysis
The grain size data, including histograms, frequency distributions, and cumulative curves, were interpreted following the methodology of [28], as illustrated in Figure 5. The analyzed samples range from medium to very coarse sand, with mean grain sizes (Mz) between −0.898 φ and 1.693 φ. Notably, samples 32 and 39 fall within the medium sand category (Figure 5a). Moreover, the samples exhibit sorting levels ranging from moderately well sorted to very poorly sorted (σI values between 0.681 φ and 2.308 φ). This variation suggests ongoing input of both fine and coarser particles in differing amounts. The sediment samples range from very fine skewed to symmetrical, with skewness values between 0.000 φ and 1.993 φ.
This variation reflects the influence of both high- and low-energy environments, likely caused by wave action from different directions. Wave washing and backwashing tend to trap coarser particles among finer sediments [29]. The most of samples are varying from very platykurtic to extremely leptokurtic (Kg values range from 0.598 φ to 5.350 φ). They show a wide range of kurtosis values, from very flat (platykurtic) to highly peaked (leptokurtic). This variation suggests that the sediments were sorted in high-energy environments and likely originate from multiple sources, including riverine or aeolian (wind-driven) and marine settings [30].
In the study area, scatter plots based on parameters from graphical and logarithmic methods (Figure 5b–d) were used to interpret sedimentary environments. According to classification schemes proposed by [31,32,33,34], the plots indicate that most wadi sediment samples were deposited in fluvial settings, with a smaller portion linked to nearshore environments.
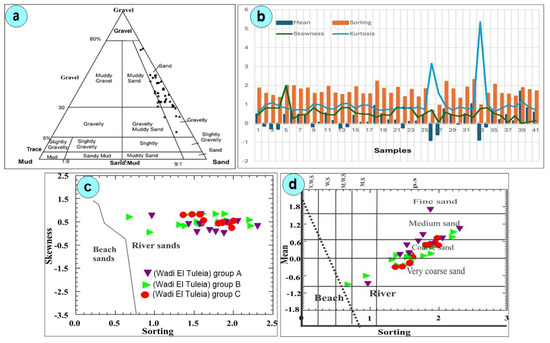
Figure 5.
(a) Plot of the study feldspar sand deposits on the nomenclature triangle [28]; (b) Variation chart of the studied textural parameters for the studied feldspar sand deposits; (c) Relationships between simple sorting and simple skewness [32]; (d) Bivariate plot of mean size (MZ) versus sorting [31]. Symbols are the same as in Figure 5c.
4.3. Mineralogical Investigation
Table 1 presents the calculated proportions of heavy and light mineral fractions in the analyzed samples. The light fraction mainly consists of quartz and feldspar, while the heavy fraction includes an opaque mineral as magnetite, hematite and ilmenite, and nonopaque minerals are biotite, chlorite, zircon, rutile, staurolite, tourmaline and sillimanite.

Table 1.
Weight contents of heavy and light minerals in the investigated feldspar sand deposit samples (wt.%).
Tourmaline appears in colorless, gray, and greenish–gray hues, typically forming long, slender prismatic crystals. It is present in the fine sand fraction of the feldspar-rich sand deposits (Figure 6a). Goethite is found as angular to sub-rounded grains with a submetallic or dull luster. It lacks cleavage and displays a range of colors including red, reddish-black, yellowish, and brownish-yellow (Figure 6b). Goethite can form as a primary mineral in hydrothermal environments, such as the metasomatized granitic rocks of Homret Waggat [35].
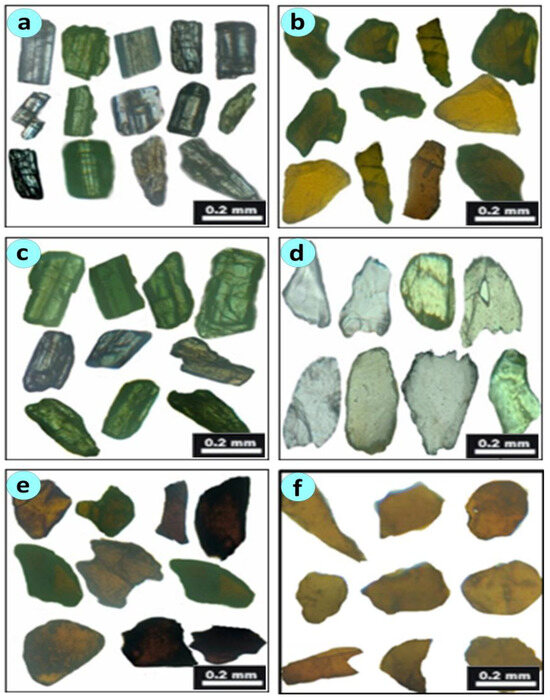
Figure 6.
Photomicrograph showing the recorded heavy minerals under plane polarized light. (a) Tourmaline; (b) Goethite; (c) Sillimanite; (d) Zircon; (e) Rutile; (f) Staurolite.
Sillimanite is one of the most abundant heavy minerals, occurring as irregular, angular, and somewhat platy grains in shades from yellowish to dark yellowish-brown (Figure 6c). Zircon is the most common non-opaque heavy mineral in the samples. It occurs as well-formed prismatic crystals, as well as broken and eroded grains with sharp edges, in both long and short forms (Figure 6d). Rutile grains are typically lath-shaped and vary from angular to rounded. They come in deep red, reddish-brown, and golden-yellow colors, and are noted for their high relief and occasional solid inclusions (Figure 6e).
Staurolite is widely present across the samples, appearing as prismatic grains that range from angular to subangular. Its colors include pale brown, straw yellow, and golden yellow (Figure 6f). Biotite and chlorite are present in all analyzed samples as tabular grains. Biotite shows strong pleochroism. Chlorite, which forms from biotite, appears yellow to pale olive and typically occurs as irregular, foliated or bent scaly aggregates or dispersed grains.
Ilmenite appears as sub-angular to sub-rounded opaque grains, some grains show a brownish hue, likely due to partial alteration. SEM-EDX analysis of selected ilmenite crystals shows high concentrations of iron (44.14%), titanium (25.35%), and oxygen (18.70%) (Figure 7a; Table S1, Supplementary Material). Smaller amounts of magnesium (2.12%), aluminum (3.40%), silicon (5.67%), and calcium (0.62%) are also detected. Magnetite grains range from angular to sub-rounded in shape. These grains are often heterogeneous, frequently containing inclusions of quartz, garnet, and monazite, along with intergrowths of hematite. According to SEM-EDX analysis, magnetite crystals are primarily composed of iron (67.18%) and oxygen (16.54%) (Figure 7b; Table S1, Supplementary Material), with trace amounts of aluminum (5.62%), silicon (9.89%), and calcium (0.77%) also detected.
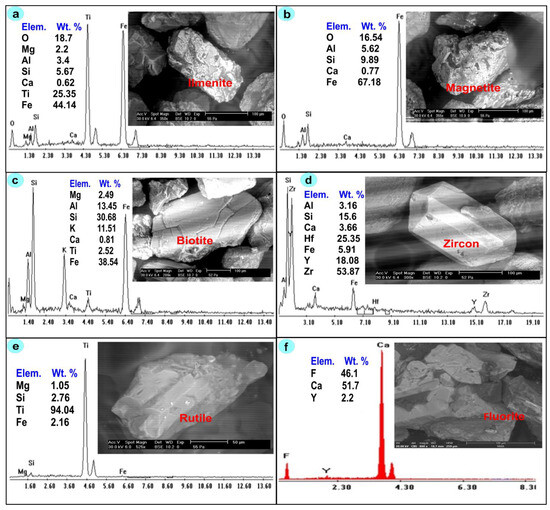
Figure 7.
SEM and EDX semi-quantitative microchemical analysis. (a) ilmenite; (b) magnetite; (c) biotite; (d) zircon; (e) rutile; (f) fluorite.
EDX analysis reveals that biotite is predominantly composed of Fe (38.54%), Si (30.68%), Al (13.45%), K (11.51%), and Mg (2.49%) (Figure 7c; Table S1, Supplementary Material), with smaller quantities of Ti (2.52%) and Ca (0.81%) also present.
Zircon is predominantly composed of zirconium, with Zr content ranging substantially from 53.87% to 65.44% (Figure 7d; Table S1, Supplementary Material). EDX microanalysis further detected trace amounts of Al, Si, Ca, Fe, Hf, and Y in the examined zircon samples. The EDX results demonstrate that rutile consists predominantly of Ti (94.04%), with accessory elements including Si (2.76%), Fe (2.16%), and Mg (1.05%) occurring as either substitutions or mineral inclusions (Figure 7e; Table S1, Supplementary Material). Fluorite typically occurs in veins, often alongside quartz and calcite. It is mainly found in the quartz and fluorite veins of Homret Waggat, which are the source of fluorite in the feldspar sand deposits of the study area. Representative SEM–EDX analysis exhibits a composition dominated by calcium (51.7 wt%) and fluorine (46.1 wt%), with a significant yttrium content (2.2 wt%) (Figure 7f; Table S1, Supplementary Material). The measured fluorine content is slightly lower than the theoretical value of 48.7% for pure fluorite, which is a known limitation of EDX analysis for light elements like fluorine [36]. The presence of Y is a common characteristic of fluorite in evolved pegmatitic systems, where Y3+ substitutes for Ca2+ in the crystal lattice. This composition aligns with Y-bearing fluorite described in pegmatites by [36], who notes that such chemistry is a reliable monitor for hydrothermal processes. The identity of the mineral fluorite (CaF2) was confirmed by X-ray diffraction (XRD) analysis, which showed major peaks at 2Theta positions matching the standard reference for fluorite (Ref. No. 75-97). These peaks in the diffractogram confirm the presence of fluorite as the main mineral in the sample (Figure A1a, Appendix A).
Microchemical analysis of goethite shows high levels of iron (69.13%) and oxygen (14.55%), along with smaller amounts of silicon (9.64%), aluminum (5.73%), and calcium (0.95%) (Figure 8a; Table S1, Supplementary Material).
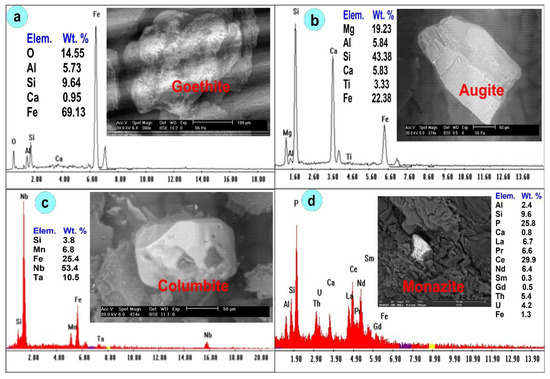
Figure 8.
SEM and EDX semi-quantitative microchemical analysis. (a) goethite; (b) augite; (c) columbite; (d) monazite.
Pyroxene (augite) occurs in dark green, black, and brown varieties, displaying stubby prismatic, elongated, acicular, skeletal, and occasionally dendritic crystal habits. EDX semi-quantitative analyses of titano-ferroaugite reveal elevated concentrations of silicon (38.49–43.38%), iron (20.57–22.38%), and magnesium (10.23–19.23%) (Figure 8b; Table S1, Supplementary Material).
Columbite has been identified within metasomatized granitic rocks at Homret Waggat [37,38]. The mineral occurs dark, anhedral crystals exhibiting a sub-metallic or resinous luster and leaves a dark red to black streak. The analyzed sample exhibits a chemical composition enriched in Nb (53.4 wt%) and Fe (25.4 wt%), with subordinate Ta (10.5 wt%) and Mn (6.8 wt%). The values of the Ta/(Ta + Nb) ratio (0.16) and the Mn/(Mn + Fe) ratio (0.21) firmly classify the mineral as Columbite-(Fe) with the idealized formula (Fe,Mn,Nb,Ta)2O6 [39,40,41] (Figure 8c; Table S1, Supplementary Material). This geochemical signature is characteristic of columbite-group minerals formed highly fractionated peraluminous granites and their associated pegmatites [42,43]. The minor silicon content (3.8 wt%) is attributed to analytical surface contamination or minute silicate inclusions, which does not affect the primary identification. Furthermore, XRD analysis was conducted to identify the crystalline phases present in the sample. The resulting diffraction pattern exhibited multiple distinct peaks that were matched against standard reference data. The peaks corresponded closely with those of ferrocolumbite, as indicated by the reference pattern of Ref. No. 16-337 (Figure A1b, Appendix A). This confirms that the mineral belongs to the columbite group, specifically the iron-rich member known as ferrocolumbite (Figure 8d).
Monazite occurs as subrounded to rounded grains with a rich yellow hue. Chemical analysis (SEM-EDX) reveals that it is a Ce-monazite (Ce,La,Pr,Nd,Th,Ca)(P,Si)O4, based on its high concentrations of Ce (29.9 wt%), P (25.8 wt%), and other light REEs (La, Pr, Nd). The high Ce content, together with significant Th and U concentrations, is characteristic of Ce-monazite derived from peraluminous granitic systems [39] (Figure 8d; Table S1, Supplementary Material). While the REE and Th contents are characteristic of monazite [44], the elevated P and the presence of Si and Al indicate a slight deviation from ideal stoichiometry, suggesting a solid solution towards a huttonite (ThSiO4)-like component, which is common in monazite from high-temperature environments. This deviation, together with the calculated Th/U ratio (≈1.32) that agrees with the expected value (>1), reflects crystallization within a peraluminous pegmatitic system or under high-grade metamorphic conditions [39]. Ce-Monazite was identified based on the X-ray diffraction (XRD) pattern, which showed major peaks at 2Theta positions matching the standard reference for monazite (Ref. No. 89-2431). These peaks confirm the presence of monazite (Ce) as the main mineral in the sample (Figure A1c, Appendix A).
4.4. Wadi Deposits Chemistry of Feldspar Sands
The major elements content of the studied Wadi El-Tulia deposits (feldspar sand) is listed in Table S2 (Supplementary Material). They are primarily composed of SiO2, which dominates with concentrations ranging from 49.48 wt% to 76.36 wt% (average: 70.22 wt%). This high silica content likely results from abundant free quartz and minimal clay minerals. Other major oxides include Na2O (1.52–3.60 wt%, avg. 2.88 wt%), K2O (2.31–6.48 wt%, avg. 4.90 wt%), Al2O3 (11.25–18.31 wt%, avg. 13.03 wt%), CaO (0.85–11.52 wt%, avg. 2.83 wt%). In contrast, Fe2O3 (1.29–8.07 wt%, avg. 2.61 wt%) and MgO (0.34–2.77 wt%, avg. 1.06%) occur in lower amounts, consistent with the mineralogical composition of feldspar-rich sands. The studied feldspar sand deposits are significantly enriched in SiO2, Al2O3, K2O, Na2O, and CaO, while showing low levels of Fe2O3 and MgO, suggesting intense leaching caused by warm, humid climate conditions. In contrast, they are slightly depleted in TiO2, SO3, P2O5, and Cl. These findings indicate a consistent and likely granitic rock source for the deposits.
Wadi deposits show a notable enrichment in certain trace elements, as depicted in Table S3 (Supplementary Material), especially Rb, Mn, Zr, Y, Ce, Zn, Nb, Sr, and Ba. In contrast, elements like Co, Ni, Cu, Ga, Pb, Th, and U are found in lower concentrations within these deposits. The feldspar sand deposits contain notable concentrations of trace elements, with Ba showing the highest levels (285–666 ppm, avg. 488 ppm). Rb averages 175.6 ppm (range: 91–316 ppm), while Sr varies widely (25–705 ppm, avg. 111.5 ppm). Zr is also abundant (166–632 ppm, avg. 349 ppm), and Nb exhibits a broad range (9–230 ppm, avg. 58.4 ppm). These variations suggest diverse mineralogical influences in the deposits. Low chromium (Cr) concentrations are commonly found near the entrance of Wadi El-Tulia. The notably depleted Cr levels, coupled with elevated K, Th, U, and REEs levels, suggest a geological association with felsic igneous rocks, particularly kaolinite-altered intrusive formations.
4.5. Weathering Conditions and Provenance
The intensity of chemical weathering in source rocks is primarily controlled by four key factors: (1) source rock composition, (2) exposure duration, (3) prevailing climate, and (4) tectonic uplift rates [31]. Since feldspars, which make up about 50–60% of the Earth’s upper crust, are highly susceptible to chemical weathering, their alteration commonly produces clay minerals as end products [45,46,47,48]. Volcanic glass, present in volcanic terrains, is also unstable and alters readily to clay.
The ternary diagram (Fe2O3* + MgO) − Na2O − K2O, introduced by [49], is used to differentiate lithic sandstones, greywackes, and arkoses. In this study, most samples fall within the arkose sandstone category, except for three (samples 32, 33, and 39), which are classified as lithic sandstone (Figure 9a). A Ni vs. Cr bivariate plot [50] was used to assess the possible protoliths of the deposit. The plotted data (Figure 9b) suggests multiple source rocks, including both basaltic and granitic origins, indicating variability in the deposit’s precursor materials.
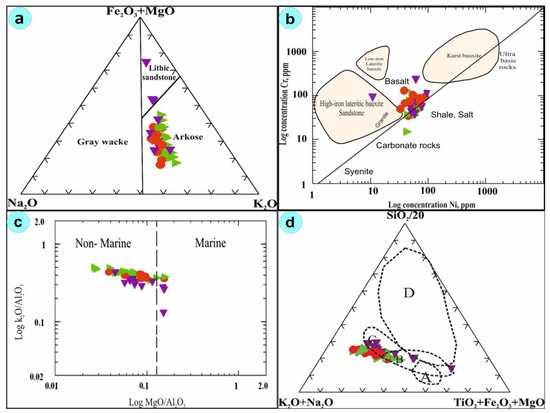
Figure 9.
(a) (Fe2O3 + MgO)–(Na2O)–(K2O) ternary diagram of the studied samples [49]; (b) Ni-Cr binary diagram of the studied samples [50]; (c) log MgO/Al2O3 and log K2O/Al2O3 binary diagram of the studied samples [51]; (d) SiO2/20 − (K2O + Na2O) − (TiO2 + Fe2O3 + MgO) ternary diagram [47] (A: Oceanic Island arc, B: Continental Island, C: Active continental margin, D: Passive margin). Symbols are the same as in Figure 5c.
Roaldset (1978) [51] employed the Log (K2O/Al2O3) vs. MgO/Al2O3 relationship to distinguish between marine and non-marine deposits. When applied to the studied feldspar sands (Figure 9c), most samples plot in the non-marine field, except for four (samples 1, 32, 33, and 39), which suggests marine deposition. This implies that the feldspar sands were likely deposited under either oxidizing marine or continental conditions. The SiO2/20 − (K2O + Na2O) − (TiO2 + Fe2O3 + MgO) ternary diagram [52] was used to analyze the tectonic setting of the feldspar sand deposits. The plotted data in Figure 9d indicates that these deposits were likely formed in a continental island arc or active continental margin environment.
Weathering indices in sedimentary rocks offer insights into the tectonic and climatic conditions of their source regions. According to [53], a higher degree of chemical weathering typically reflects reduced tectonic activity and/or a shift toward a warmer, more humid climate. To evaluate the weathering intensity in the study area, several geochemical indices were analyzed, including the Chemical Index of Alteration (CIA), Plagioclase Index of Alteration (PIA), as well as K/Rb and TiO2/Al2O3 ratios. The CIA and PIA values for the wadi deposits were calculated using the following formula established by [54].
CIA = {Al2O3/(Al2O3 + CaO* + Na2O + K2O)} × 100
PIA = {(Al2O3 − K2O)/(Al2O3 + CaO* + Na2O − K2O)} × 100
The Chemical Index of Alteration (CIA) was computed by attributing all CaO content to the silicate fraction, yielding values ranging from 41.89 to 51.83 (average: 47.13%; Table S2 (Supplementary Material)). However, these abnormally low values inaccurately represent the actual degree of chemical weathering in the recycled sediments of the study area, rendering them unreliable for interpretation.
The Plagioclase Index of Alteration (PIA) serves as an indicator of weathering intensity, where a maximum value of 100 represents completely altered material (kaolinite and gibbsite), while unweathered plagioclase scores 50. In the studied feldspar sand deposits, PIA values range from 37.97 to 52.78, averaging 45.47 (Table S2, Supplementary Materials). These results suggest low to moderate plagioclase weathering in the source area.
Additionally, the K/Rb ratio serves as an indicator of depositional environments [55], with values of 250–300 for non-marine, 200–250 for brackish water, and 150–200 for marine deposits. Based on this ratio, the studied feldspar sands were deposited in a non-marine setting. Migdisov [56] proposed that a high TiO2/Al2O3 ratio in clays reflects a humid climate. However, the studied samples exhibit a low ratio (0.01–0.04), suggesting deposition under arid climatic conditions.
In the A-CN-K ternary diagram [53], most of the analyzed samples are plotted near the average granite composition line, reflecting their K-feldspar-rich nature (Figure 10a). This suggests the sediments were primarily derived from granitic source rocks. The wadi deposits (feldspar sand) were analyzed using CIA (Chemical Index of Alteration) plotted against Al/Na and Ti/Al ratios (Figure 10b,c), following the methodology of [57]. The results indicate these deposits primarily originated from granitic source rocks that underwent limited chemical weathering.
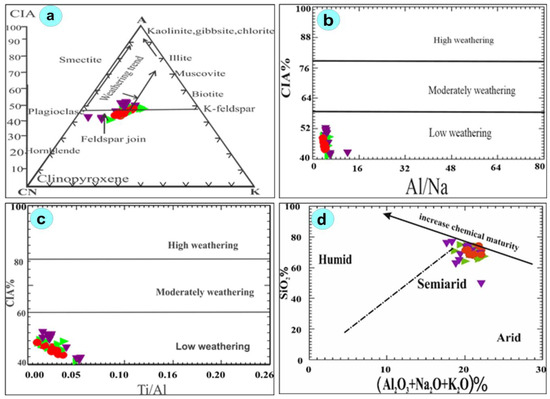
Figure 10.
(a) Al2O3–(CaO*+ Na2O)–K2O (A–CN–K) diagram of the feldspar sand deposits (compositions as molar proportions, CaO* represents CaO of the silicate fraction only). Selected rock and mineral compositions and weathering trends after [56]; (b) Plot of CIA values versus Al/Na ratio of the studied samples [47]; (c) Plot of CIA values versus Ti/Al ratio [52]; (d) SiO2 versus (Al2O3 + K2O + Na2O) to discriminate paleoclimatic condition during the deposition of the feldspar sand deposits [58]. Symbols are the same as in Figure 5c.
The SiO2 versus (Al2O3 + K2O + Na2O) relationship [58] was employed to assess the paleoclimatic conditions in the sediment source area. The plotted data (Figure 10d) indicate that the studied feldspar sands were derived from a humid to semi-arid climatic environment.
The sedimentological and remote sensing data from the Wadi El Tuleia region reveal distinct depositional patterns influenced by upstream and downstream positions within the watershed. Upstream areas, particularly near granitic outcrops such as Gabal Homret Waggat, are characterized by coarser, poorly sorted feldspar-rich sands with angular heavy mineral grains, indicating minimal transport and direct derivation from nearby source rocks. These sediments often form alluvial fans and are enriched in unstable minerals like feldspar, suggesting weathering limited environment. In contrast, downstream deposits exhibit finer grain sizes, better sorting, and more rounded heavy mineral grains, reflecting longer transport distances and greater sediment reworking. The presence of etched zircon and other weathered heavy minerals in downstream samples further supports enhanced chemical alteration during transport. These variations underscore the influence of topography and hydrodynamics on sediment deposition and mineral preservation across the wadi system.
The morphology of heavy mineral grains in the Wadi El Tuleia deposits provides valuable insights into the intensity and nature of chemical weathering processes affecting the source rocks. Minerals such as zircon, rutile, and monazite frequently exhibit etched surfaces, rounded edges, and dissolution features, indicating prolonged exposure to chemical alteration. These features suggest that the source rocks, primarily granitic in composition, underwent low to moderate chemical weathering under arid to semi-arid climatic conditions. The preservation of unstable minerals like feldspar alongside etched heavy minerals reflects limited leaching and supports the geochemical evidence of low CIA and PIA values. Thus, the morphological characteristics of these grains serve as direct mineralogical evidence of weathering intensity and help refine interpretations of provenance and paleoclimatic conditions [59,60].
Zircon grains observed in the studied samples frequently exhibit etched morphologies, characterized by irregular textures. This feature is a significant indicator of chemical weathering, as zircon is one of the most chemically resistant minerals in sedimentary environments. The presence of etching suggests prolonged exposure to weathering agents, likely under acidic or reactive conditions, which supports the interpretation of low to moderate chemical weathering derived from geochemical indices (CIA and PIA). Furthermore, etched zircons provide valuable insights into sediment recycling and provenance, indicating that the source rocks—primarily granitic—underwent substantial alteration before sediment deposition. This morphological evidence complements the geochemical data and reinforces the interpretation of a felsic source under arid to semi-arid climatic conditions.
In summary, the wadi deposits in the Wadi El Tuleia area are fluvial placers sourced from nearby granitic and metamorphic rocks that experienced limited chemical weathering. The presence of a rich and diverse suite of heavy minerals (e,g. zircon and rare earth element-bearing monazite and columbite) underscores the region’s potential for future mineral exploration and resource development, aligning with the geological framework of the Arabian-Nubian Shield.
5. Conclusions
Quaternary feldspar-rich sands in Wadi El Tuleia rest on basement rocks unstably. The remote sensing analysis (ASTER and ALOS/PALSAR) effectively delineated three main watersheds (El Tuleia, El-Faliq, and El-Yatima) and identified the granitic plutons of Gabal Homret Waggat and Gabal El-Yatima as the primary source rocks for the feldspar-rich wadi deposits.
The heavy mineral assemblage—comprising both opaque (magnetite, ilmenite, goethite) and transparent minerals (zircon, rutile, staurolite, tourmaline, sillimanite)—reflects a diverse source rock composition, predominantly granitic, with contributions from metavolcanic and metasedimentary units. Grain size analysis revealed sediments ranging from moderately well sorted to very poorly sorted, with textures varying from symmetrical to very fine skewed. Bivariate plots of statistical parameters indicate that the majority of the sediments were deposited in a fluvial (river) environment, with a minor contribution from nearshore marine settings. This is consistent with the geochemical proxy (K/Rb ratio), which also suggests a predominantly non-marine depositional environment.
The geochemical data show the deposits are significantly enriched in SiO2, Al2O3, K2O, and Na2O, which is characteristic of sediments derived from felsic (granitic) source rocks. The low values of CIA and PIA indicate that the source rocks underwent low to moderate chemical weathering under predominantly arid to semi-arid climatic conditions. This limited weathering allowed for the preservation of unstable minerals like feldspar and the efficient concentration of dense, resistant heavy minerals. Trace element enrichment and tectonic discrimination diagrams further support a provenance linked to granitic rocks within a continental island arc or active margin setting.
Overall, the findings underscore the geological complexity and resource potential of the Wadi El Tuleia area, offering valuable insights for future mineral exploration and environmental reconstruction in similar arid-region wadi systems.
Supplementary Materials
The following supporting information can be downloaded at: https://www.mdpi.com/article/10.3390/min15101058/s1, Table S1: Results of EDX semi-quantitative microchemical analysis of the investigated minerals; Table S2: Chemical composition of the feldspar sand deposits for major oxides (wt. %); Table S3: Chemical composition of the feldspar sand deposits for trace elements (ppm).
Author Contributions
Data curation, H.M.E.-D., A.E., and H.A.A.; Formal analysis, T.M.S., S.A.T., and A.M.E.-B.; Investigation, T.M.S., S.A.T., and O.R.E.; Methodology, H.M.E.-D., O.R.E., A.E., and H.A.A.; Project administration, S.A.T., and A.E.; Resources, T.M.S., and A.M.E.-B.; Software, T.M.S., and S.A.T.; Supervision, H.M.E.-D., and A.E.; Validation, O.R.E., and H.A.A.; Visualization, T.M.S., H.M.E.-D., and S.A.T.; Writing—original draft, T.M.S., H.M.E.-D., S.A.T., O.R.E., A.M.E.-B., and H.A.A.; Writing—review and editing, T.M.S., S.A.T., and A.E. All authors have read and agreed to the published version of the manuscript.
Funding
The authors A.E. and H.A.A. acknowledge the support of the institutional grant awarded by Dunarea de Jos University of Galati, Romania, contract no. 9187/2023.
Data Availability Statement
The authors confirm that the data supporting the findings of this study are available within the article.
Acknowledgments
The authors thank the academic editors and three anonymous reviewers for their valuable comments which significantly contributed to the paper quality improvement.
Conflicts of Interest
The authors declare no conflicts of interest.
Appendix A
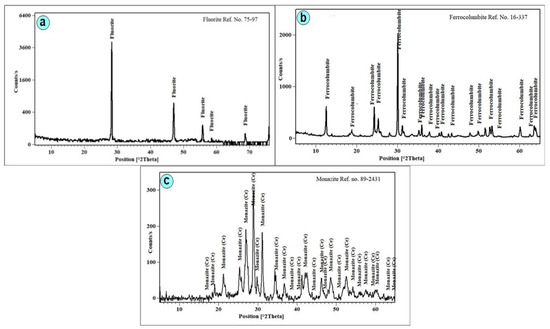
Figure A1.
XRD pattern of: (a) fluorite; (b) columbite; (c) monazite.
References
- El Bahariya, G.A. Geochemistry and Tectonic Setting of Neoproterozoic Rocks from the Arabian-Nubian Shield: Emphasis on the Eastern Desert of Egypt. In Applied Geochemistry with Case Studies on Geological Formations, Exploration Techniques and Environmental Issues; L. Felipe Mazadiego, L., De Miguel Garcia, E., Barrio-Parra, F., Izquierdo-Díaz, M., Eds.; Intech Open: Rijeka, Croatia, 2020. [Google Scholar] [CrossRef]
- El-Desoky, H.M.; Khalil, A.E.; Salem, A.K.A. Ultramafic rocks in Gabal El-Rubshi, Central Eastern Desert, Egypt: Petrography, mineral chemistry, and geochemistry constraints. Arab. J. Geosci. 2015, 8, 2607–2631. [Google Scholar] [CrossRef]
- Taalab, S.A.; Abdel-Rahman, A.M.; El-Awny, H.; Awad, H.A.; Zakaly, H.M.H.; Fahmy, W.; Ene, A. Petrogenesis and Tectonic Evolution of Kab Amiri Ophiolites and Island-Arc Assemblages, Central Eastern Desert, Egypt: Petrological and Geochemical Constraints. Minerals 2023, 13, 528. [Google Scholar] [CrossRef]
- Shahin, T.M. Petrogenesis and Geochemical Implications of Neoproterozoic Gabal Ras Zeraib Granites, Central Eastern Desert, Egypt. Dokl. Earth Sc. 2023, 512, 983–997. [Google Scholar] [CrossRef]
- Jones, G. Mineral Sands: An Overview of the Industry. In Proceedings of the Seventh International Mining Geology Conference 2009, Perth, Western Australia, 17–19 August 2009; Australasian Institute of Mining and Metallurgy: Carlton, VIC, Australia, 2009; pp. 213–222. Available online: https://www.ausimm.com/publications/conference-proceedings/seventh-international-mining-geology-conference-2009/mineral-sands---an-overview-of-the-industry/ (accessed on 10 March 2025).
- Taalab, S.A.; Zakaly, H.M.H.; Ivanov, V.; Alrowaily, A.W.; Awad, H.A.; Abed, N.S.; Issa, S.A.M.; Eltohamy, A.M.; Ene, A. Notable changes in geochemical and mineralogical characteristics of different phases of episyenitization: Insights on the radioactive and shielding of the late phase. Front. Earth Sci. 2023, 11, 1241975. [Google Scholar] [CrossRef]
- Khattab, M.R.; Abed, N.S.; Monged, M.H.E.; Tawfic, A.F.; Taalab, S.A.; Faraj, T.K.; Khandaker, M.U.; Hanfi, M.Y. Mineralogical investigation and environmental radioactivity risk of uranium mineralization from altered granites. J. Radioanal. Nucl. Chem. 2025, 334, 3173–3184. [Google Scholar] [CrossRef]
- Morton, A.C. Value of heavy minerals in sediments and sedimentary rocks for provenance, transport history and stratigraphic correlation. In Quantitative Mineralogy and Microanalysis of Sediments and Sedimentary Rocks; Sylvester, P., Ed.; Mineralogical Association of Canada Short Course Series; Mineralogical Association of Canada: Sudbury, ON, Canada, 2012; Volume 42, pp. 133–165. [Google Scholar] [CrossRef]
- Saad, A.M.; Sakr, M.A.H.; Selim, M.S.A.; Taalab, S.A.; Zakaly, H.M.H.; Aboueldahab, S.M.; Omar, A.E.; Mahmoud Zayed, M.; Issa, S.A.M.; Awad, H.A. Geotechnical and geophysical investigations for infrastructure safety zones: A case study of the supporting ring road, Cairo, Egypt. Sci. Rep. 2024, 14, 29670. [Google Scholar] [CrossRef]
- Le Pera, E.; Tangari, A.C.; Marinangeli, L.; Morrone, C.; Riber, L.; Andò, S. Provenance of modern sands from Baja California rivers (Mexico): Petrographic constraints from light and heavy minerals. Sediment. Res. 2023, 93, 617–641. [Google Scholar] [CrossRef]
- Khalil, M.; Khan, M.; Kabir, M.; Majumder, R.; Ali, M.; Paul, D.; Islam, S. Heavy Minerals in Sands along Brahmaputra (Jamuna) River of Bangladesh. Int. J. Geosci. 2016, 7, 47–52. [Google Scholar] [CrossRef]
- Morton, A.C.; Hallsworth, C.R. Processes controlling the composition of heavy mineral assemblages in sandstones. Sediment. Geol. 1999, 124, 3–29. [Google Scholar] [CrossRef]
- Garzanti, E.; Andò, S. Heavy mineral concentration in modern sands: Implications for provenance interpretation. Dev. Sedimentol. 2007, 58, 517–545. [Google Scholar] [CrossRef]
- Joshi, K.B.; Banerji, U.S.; Dubey, C.P.; Oliveira, E.P. Heavy minerals in provenance studies: An overview. Arab. J. Geosci. 2021, 14, 1330. [Google Scholar] [CrossRef]
- El-Leil, I.A.; Tolba, A.S.; Shahin, T.M. Mineralogical studies of placer wadi deposits of Gabal El Dob area, North Eastern Desert, Egypt; A good preliminary tool for prospecting ores in Arabian–Nubian Shield. Int. J. Innov. Sci. Eng. Technol. 2015, 2, 68–93. Available online: https://ijiset.com/articlesv2/articlesv2s10.html (accessed on 10 March 2025).
- El-Rahmany, M.M.; El-Desoky, H.M.; El-Sherif, A.M.; El-Awny, H.M. Mineralogical and sedimentological studies of the placer deposits at Wadi Khashir—Wadi Ras El-Kharit, South Eastern Desert, Egypt. Sedimentol. Egypt 2019, 24, 81–95. [Google Scholar]
- Khattab, M.R.; Mohamed, W.H.; Shetaia, S.A.; Ahmed, M.S.; Taalab, S.A.; Saadawi, D.A.; Sakr, A.K.; Khandaker, M.U.; Elshoukrofy, A.S.M.; Hanfi, M.Y. Radiological, environmental, and structural investigations of Wadi El Markh granitic rocks, southeastern desert, Egypt. Nucl. Eng. Technol. 2024, 56, 4522–4530. [Google Scholar] [CrossRef]
- Abdallah, M.; El-Mezayen, A.M.; Adel, E.H.; El-Shabasy, A.M.; Draz, O.; Taalab, S.A. Radionuclides migration related to alteration and mineralogical investigations of El Sela uraniferous two mica granites. Egypt. J. Chem. 2025, 68, 437–452. [Google Scholar]
- Covington, L. Carbonates in the Critical Zone. Earth’s Future 2023, 11, e2022EF002765. [Google Scholar] [CrossRef]
- Gázquez, F.; Sharp, Z.D.; De los Ríos, P. Global compilation of carbonate weathering rates: Implications for climate and landscape evolution. Earth Surf. Dyn. 2023, 11, 247–265. [Google Scholar] [CrossRef]
- Jiang, H.; Wu, L.; Zhang, H. Erosion and weathering regimes controlled by lithology in the eastern Tibetan Plateau. Earth Surf. Dyn. 2022, 10, 513–530. [Google Scholar] [CrossRef]
- Critelli, S.; Marsaglia, K.M.; Busby, C. Tectonic history of a Jurassic backarc-basin sequence (the Gran Cañon Formation, Cedros Island, Mexico), based on compositional modes of tuffaceous deposits. Geol. Soc. Am. Bull. 2002, 114, 515–527. [Google Scholar] [CrossRef]
- Caracciolo, L. Sediment generation and sediment routing systems from a quantitative provenance analysis perspective: Review, application and future development. Earth-Sci. Rev. 2020, 207, 103226. [Google Scholar] [CrossRef]
- Lee, J.S.; Pottier, E. Polarimetric Radar Imaging: From Basics to Applications; CRC Press: Boca Raton, FL, USA, 2017. [Google Scholar] [CrossRef]
- Hassaan, M.M.; Saleh, M.; El-Desoky, H.M.; Amer, R.M.; El-Kady, A.M. Lithological-Structural Setting of Homrit Waggat Granites in Central Eastern Desert, Egypt: New Contributions. Int. J. Innov. Sci. Eng. Tech. 2015, 11, 670–690. [Google Scholar]
- Azer, M.K.; Abdelfadil, K.M.; Asimow, P.D.; Khalil, A.E. Tracking the transition from subduction-related to post-collisional magmatism in the north Arabian-Nubian Shield: A case study from the Homrit Waggat area of the Eastern Desert of Egypt. Geol. J. 2020, 55, 4426–4452. [Google Scholar] [CrossRef]
- Wolter, J.M.; Goldin, L.; Watts, D.R.; Harris, N.B.W. Remote sensing of gneiss and granite in southern Tibet. Geol. Soc. Am. Abstr. Programs 2005, 37, 93. [Google Scholar]
- Folk, R.L.; Ward, W.C. Brazos River bar: A study in the significance of grain size parameters. J. Sediment. Petrol. 1957, 27, 3–27. [Google Scholar] [CrossRef]
- Rajasekhara, R.D.; Karuna, K.T.; Deva, V.D. Textural characteristics of south western part of Mahanadi Delta, east coast of India. J. Ind. Assoc. Sed. 2008, 27, 111–121. [Google Scholar]
- Baruah, J.; Kotoky, P.; Sarma, J.N. Textural and geochemical study on river sediments: A case study on the Jhanji River, Assam. J. Indian Assoc. Sedimentol. 1997, 16, 195–206. [Google Scholar] [CrossRef]
- Moiola, R.; Weiser, D. Textural parameters: An evaluation. J. Sediment. Petrol. 1968, 38, 45–53. [Google Scholar] [CrossRef]
- Friedman, G.M. Distinction between dune, beach and river sands from textural characteristics. J. Sediment. Petrol. 1961, 31, 514–529. [Google Scholar] [CrossRef]
- Koldijk, W.S. On environment-sensitive grain-size parameters. Sedimentology 1986, 10, 57–69. [Google Scholar] [CrossRef]
- Baiyegunhi, T.L.; Liu, K.; Gwavava, O.; Baiyegunhi, C. Textural characteristics, mode of transportation and depositional environment of the Cretaceous sandstone in the Bredasdorp Basin, South Africa: Evidence from grain size analysis. Open Geosci. 2020, 12, 112–130. [Google Scholar] [CrossRef]
- Castroviejo, R. Goethite (gth/Nadeleisenerz). In A Practical Guide to Ore Microscopy; Springer: Cham, Switzerland, 2023; Volume 1. [Google Scholar] [CrossRef]
- Dill, H.G.; Weber, B. Variation of color, structure and morphology of fluorite and the origin of the hydrothermal F-Ba deposits at Nabburg-Wölsendorf, SE Germany. N. Jb. Miner. Abh. 2010, 187, 113–132. [Google Scholar] [CrossRef]
- Saleh, G.M. Whole rock and mineral chemistry of the rare metals-bearing mylonitic rocks, Homrit Waggat area, Eastern Desert, Egypt: Petrography and geochemistry. J. Afr. Earth Sci. 2022, 193, 104572. [Google Scholar] [CrossRef]
- Rashwan, M.A.; Lasheen, E.S.R.; Azer, M.K. Thermal and physico-mechanical evaluation of some magmatic rocks at Homrit Waggat area, Eastern Desert, Egypt: Petrography and geochemistry. Bull. Eng. Geol. Environ. 2023, 82, 222. [Google Scholar] [CrossRef]
- Dill, H.G. Pegmatites and aplites: Their genetic and applied ore geology. Ore Geol. Rev. 2015, 69, 417–561. [Google Scholar] [CrossRef]
- Cerny, P.; Ercit, T.S. Some recent advances in the mineralogy and geochemistry of Nb and Ta in rare-element granitic pegmatites. Bull. Mineral. 1985, 108, 499–532. [Google Scholar] [CrossRef]
- Alfonso, P.; Hamid, S.A.; Garcia-Valles, M.; Llorens, T.; López Moro, F.J.; Tomasa, O.; Calvo, D.; Guasch, E.; Anticoi, H.; Oliva, J.; et al. Textural and mineral-chemistry constraints on columbite-group minerals in the Penouta deposit: Evidence from magmatic and fluid-related processes. Mineral. Mag. 2018, 82, S199–S222. [Google Scholar] [CrossRef]
- Linnen, R.L.; Samson, I.M.; Williams-Jones, A.E.; Chakhmouradian, A.R. Geochemistry of the rare-earth element, Nb, Ta, Hf, and Zr deposits. In Treatise on Geochemistry, 2nd ed.; Holland, H.D., Turekian, K.K., Eds.; Elsevier: Amsterdam, The Netherlands, 2014; Volume 13, pp. 543–567. [Google Scholar]
- Hu, J.J.; Chen, Y.; Wang, R.C.; Li, Y.; Zhang, X. Textures and chemistry of columbite-group minerals record crystallization dynamics and trace-element signatures in rare-element granites and pegmatites. Ore Geol. Rev. 2024, 173, 106319. [Google Scholar] [CrossRef]
- Deer, W.A.; Howie, R.A.; Zussman, J. An Introduction to the Rock-Forming Minerals, 3rd ed.; Mineralogical Society of Great Britain and Ireland: London, UK, 2013. [Google Scholar] [CrossRef]
- Wronkiewicz, D.J.; Condie, K.C. Geochemistry and mineralogy of sediments from the Ventersdorp and Transvaal Supergroups, South Africa: Cratonic evolution during the early Proterozoic. Geochim. Cosmochim. Acta 1987, 54, 343–354. [Google Scholar] [CrossRef]
- Nesbitt, H.W.; Young, G.M. Formation and diagenesis of weathering profiles. J. Geol. 1989, 97, 129–147. [Google Scholar] [CrossRef]
- Taylor, S.R.; McLennan, S.M. The Continental Crust: Its Composition and Evolution; Blackwell Publishing: Oxford, UK, 1985; 311p. [Google Scholar]
- Fedo, C.M.; Nesbitt, H.W.; Young, G.M. Unravelling the effects of potassium metasomatism in sedimentary rocks and paleosols, with implications for paleo-weathering conditions and provenance. Geology 1995, 23, 921–923. [Google Scholar] [CrossRef]
- Pettijohn, F.J.; Potter, P.E.; Siever, R. Sand and Sandstone; Springer: New York, NY, USA, 1972; 618p. [Google Scholar]
- Schroll, E.; Sauer, D. Beitrag zur Geochemie von Titan, Chrom, Nikel, Cobalt, Vanadium und Molibdan in bauxitischen Gesteinen und Problem der stofflichen Herkunft des Aluminiums. Trav. ICSOBA 1968, 5, 83–96. [Google Scholar]
- Roaldset, E. Mineralogical and Chemical Changes During Weathering, Transportation and Sedimentation in Different Environments with Particular References to the Distribution of Yttrium and Lanthanide Elements. Ph.D. Thesis, Geological Institute, University of Oslo, Oslo, Norway, 1978. [Google Scholar]
- Kroonenberg, S.B. Effects of provenance, sorting and weathering on the geochemistry of fluvial sands from different tectonic and climatic environments. In Proceedings of the 29th International Geological Congress, Part A, Kyoto, Japan, 24 August–3 September 1992; pp. 69–81. [Google Scholar]
- Jacobson, A.D.; Blum, J.D.; Chamberlain, C.P.; Craw, D.; Koons, P.O. Climate and tectonic controls on chemical weathering in the New Zealand Southern Alps. Geochim. Cosmochim. Acta 2003, 37, 29–46. [Google Scholar] [CrossRef]
- Nesbitt, H.W.; Young, G.M. Prediction of some weathering trends of plutonic and volcanic rocks based on thermodynamic and kinetic considerations. Geochim. Cosmochim. Acta 1984, 48, 1523–1534. [Google Scholar] [CrossRef]
- Campbell, F.A.; Williams, G.D. Chemical composition of shales of the Monville group (Lower Cretaceous) of central Alberta, Canada. Am. Assoc. Pet. Geol. Bull. 1965, 49, 81–87. [Google Scholar] [CrossRef]
- Migdisove, A.A. On the titanium/aluminum ratios in sedimentary rocks. Geochemistry 1960, 2, 178–194. [Google Scholar]
- Roy, P.D.; Caballero, M.; Lozano, R.; Smykatz-Kloss, W. Geochemistry of late Quaternary sediments from Tecocomulco Lake, Central Mexico: Implication to chemical weathering and provenance. Chem. Erde Geochem. 2008, 68, 383–393. [Google Scholar] [CrossRef]
- Suttner, L.J.; Dutta, P.K. Alluvial sandstone composition and paleoclimate. I. Framework mineralogy. J. Sediment. Petrol. 1986, 56, 329–345. [Google Scholar] [CrossRef]
- Ando, S.; Garzanti, E.; Padoan, M.; Limonta, M. Corrosion of heavy minerals during weathering and diagenesis: A catalog for optical analysis. Sediment. Geol. 2012, 280, 165–178. [Google Scholar] [CrossRef]
- Tangari, A.C.; Le Pera, E.; And, S.; Garzanti, E.; Piluso, E.; Marinangeli, L.; Scarciglia, F. Soil-formation in the central Mediterranean: Insight from heavy minerals. Catena 2021, 197, 104998. [Google Scholar] [CrossRef]
Disclaimer/Publisher’s Note: The statements, opinions and data contained in all publications are solely those of the individual author(s) and contributor(s) and not of MDPI and/or the editor(s). MDPI and/or the editor(s) disclaim responsibility for any injury to people or property resulting from any ideas, methods, instructions or products referred to in the content. |
© 2025 by the authors. Licensee MDPI, Basel, Switzerland. This article is an open access article distributed under the terms and conditions of the Creative Commons Attribution (CC BY) license (https://creativecommons.org/licenses/by/4.0/).