Abstract
Accurate quantification of minor mineral phases is important in Powder X-Ray Diffraction (PXRD) and Rietveld phase quantification. The precise limit of quantification for the various phases is rarely considered but rather approximated to 0.2–2 wt% by applying a global minimum weight percentage threshold. This approximation often leads to false positive or false negative phase quantity, jeopardizing the trustworthiness of the analytic method in general. In this work (1) we propose a dynamic and adaptable false positive filtering method for Rietveld Quantitative X-ray diffraction (QXRD) based on a phase-specific signal-to-noise ratio referred to as “Phase-SNR”; (2) we introduce the method baptized “Phase Guard” which is implemented in the software HighScore Plus. Phase Guard is based on peaks counting statistics and it automatically adapts to different mineral scattering powers, different mineral crystallinity, instrumental configuration and measurement time. Its applicability and benefits are demonstrated with several examples in cement and mining applications. The adoption of Phase Guard is especially beneficial for industrial black-box solutions, where all “probable” phases are included in the model, even when they are absent from the sample. Phase Guard eliminates false positives, it reduces the likelihood of false negatives, and it is an essential tool to answer the question “what is the limit of quantification for Rietveld analysis?”
1. Introduction
Powder X-ray diffraction (PXRD) and Rietveld refinement are established methods for the mineral and phase quantification of natural and synthetic materials, mostly in solid form. In a standard PXRD experiment, a powdered sample is mounted on a sample holder and placed in the center of a goniometer. The goniometer arms are equipped with an X-ray tube and a detector. The raw data consists of intensities collected over diffraction angles, counts over 2θ° angles [1]. There is a direct relation between the diffraction angles and the interatomic distances in the sample as expressed by Bragg law. By collecting a list of interatomic distances and comparing it with databases, phase identification is performed.
Among several methods to perform quantitative analysis from PXRD data, Rietveld refinement is the most widely used [2,3,4]. Rietveld refinement is a whole powder pattern decomposition (WPPD) method which can properly redistribute the intensities of overlapping peaks. Rietveld refinement is particularly useful when calibration standards are not available [5]. QXRD with Rietveld are essential technologies in modern industrial operations adopting mineralogical monitoring and control [6,7,8,9,10].
There are several weaknesses of the QXRD and Rietveld methods, many of which have solutions. The Rietveld method can only quantify crystalline materials: when amorphous components are present in the sample, the Rietveld analysis overestimates the crystalline phases. Various methods are available to overcome this issue: the use of internal standard [11], the use of an external standard [2] and the use of pre-calibrated PONKCS phases [12]. Rietveld analysis also requires the knowledge of all crystalline structures present in the samples. In case the structures are not known, the analyst can use a modified-PONKCS approach [13], the Direct Derivation Method [14] and the Molecular Scattering Power method [15]. Micro-absorption can also spoil the Rietveld results. Although Rietveld corrections exist [16] the best approach is to grind the material to smaller particle sizes or to change the X-ray source to minimize the absorption contrast.
A lesser-known problem of QXRD is false positives and the correct estimation of the limit of quantification for minor phases [17,18]. XRD is known to have a LOQ of approximately 1 wt%, ranging from 0.2 wt% to 2 wt%. It has a wide range as it depends on several factors including but not limited to the used instrument, its configuration and scanning parameters, the phase scattering powder, the phase crystallinity/broadening and preferential orientation and the mass absorption coefficient of the sample.
The problem of false positives is particularly present in industrial applications. While QXRD is commonly used in academic and research laboratories to develop new materials, it is also an important tool for quality and process control in many industries: cement, mining, metal, pharma, ceramics and advanced materials [10,19]. The widespread use of XRD and Rietveld analysis in industrial operations was favored by two factors. First, the introduction of linear detector decreased the measurement time from tens of hours to 5 to 10 min. This allowed proper quality and process control, fast feedback loops and high sample throughput. Second, the implementation of automatic Rietveld routines (control files) working as black-box solution to standardize the analysis and making the technique more accessible to non-experts [20].
Automatic Rietveld analysis often involves the application of an analysis template containing a list of phases and a refinement strategy. Industrial samples can have large variability in sample mineralogy, reflecting multiple suppliers, processes and ore domains. In such cases, the list of phases in a control file can easily be larger than 20, including minerals which may seldomly occur. A large list of phases increases the likelihood of encountering false positives. The short XRD scanning time used in process control environments leads to data quality with a higher limit of quantification (LOQ) for minor phases.
In this work we use counting statistics to estimate a pseudo-SNR for peaks of each mineral in a XRD pattern. The noise associated with X-ray photon detection follows Poisson statistics and shot noise behavior [21,22], see Figure 1. The SNR of each diffraction peak is proportional to the square root of the scanning time. For example, scan times need to be four times longer to double the SNR and halve the limit of quantification. To calculate the SNR of a specific phase we distinguished the Bragg intensity of the phase from the background intensities and from overlapping peaks belonging to other phases. A whole powder pattern decomposition (WPPD) approach was used, in particular Rietveld refinement. This method is implemented in HighScore Plus [23] under the name Phase Guard and it calculates the so-called “Phase-SNR”, also referred to as “Peak-SNR”. The method is available starting from HighScore Plus version 5.3.
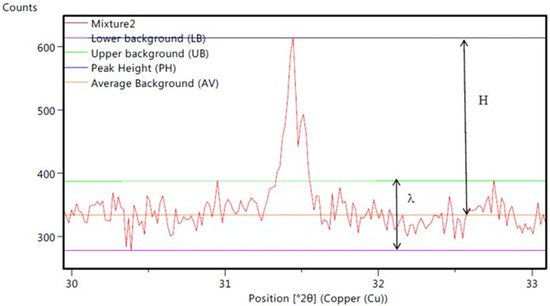
Figure 1.
Example of XRD pattern showing the net peak intensity (H) and the shot noise (λ), which is proportional to the square root of the background.
The false positive filtering procedure has 3 steps: (1) performing a Rietveld refinement; (2) calculating the Phase-SNR of each phase and scan from the calculated Rietveld profile using the Phase Guard algorithm; (3) applying the Phase Guard filter by selecting a Phase-SNR threshold value. The Phase-SNR considers the three most intense Bragg reflections of the phases as present in the Rietveld calculated model. If only one or two peaks are present in the scan angular range, then the Phase-SNR is calculated for those applying a correction factor.
A SNR of 3 and 10 are often adopted by the scientific literature as thresholds for the limit of identification and quantification, respectively [24]. In an industrial environment and with Phase Guard, we recommend the use of Phase-SNR = 7 as threshold, as demonstrated in this work. The third step described above—the filtering—can be completely automatized in an industrial black-box solution, therefore providing Rietveld results without false positives. The threshold values can be adjusted on demand and particular phases can be excluded by the Phase Guard filter. Alternatively, the third step can be omitted, and the unfiltered Rietveld results can be reported together with the Phase-SNR; the analyst can better judge the presence of minor phases detected with QXRD using this additional information.
2. Materials and Methods
2.1. Materials
In this study, we used different industrial samples which are commonly tested with X-ray diffraction for process and quality control. They include 544 copper ore samples in the form of 454 flotation feeds and 90 flotation concentrates (Huelva, Spain), 51 bauxite ores samples (10 Alcan and NIST standard and 41 industrial samples), 6 types of cement including a CEM I sample, a CEM II/AS with slag, 3 cements with calcined clay and a ternary cement with calcined clay and slag. For more information on the copper flotation samples and bauxite ore samples, please refer to dedicated Rietveld studies [6,7].
2.2. Method
Sample preparation for XRD included grinding with a swing mill to reduce particle size below 60 µm and improve mineral quantification by QXRD. Samples were prepared for XRD analysis in a 27 mm backloading sample holder (copper ore samples) or pressed in 51 mm steel rings using 100 kN pressure for 30 s (cements and bauxite samples).
The XRD scans were collected using an Aeris compact X-ray diffractometer (40 kV-15 mA), goniometer radius 145 mm. Optical components included 0.04 Soller slits, ½° divergence slits, a 23 mm mask and a beam-knife. Common measurement conditions included step size of 0.02°, 10–65 2θ° angular range and 10 min scanning time. Some scanning parameters were optimized based on the sample and type of experiment.
A cobalt-anode X-ray tube was used for bauxite and copper ore samples, while a copper-anode tube was used for cement samples. The use of a cobalt tube for iron-rich materials avoids iron fluorescence usually observed with Cu-radiation, therefore improving penetration depth of X-ray in the sample, improving counting statistics and minimizing micro-absorption issues. In the copper ore case study, a PIXcel1D-Medipix3 (Malvern Panalytical, Malvern, UK) detector was used. The 1Der detector was used for the other case studies.
The Rietveld results were generated by the software HighScore Plus 5.3 and RoboRiet 5.3. RoboRiet is a dedicated implementation of the structure and profile-fit methods for automation projects (black-box solution) and it is included in the Aeris XRD (Malvern Panalytical, Malvern, UK) instrument.
Some case studies focus on the effect of scanning time for the quantification of the various phases. Other case studies focus on multiple samples with varying concentration of phases, measured with the same measurement time. In all cases the Phase-SNR (or Peak-SNR) values were calculated by Phase Guard in HighScore Plus and they were used to assess the limit of quantification for each phase, the presence of false positives and the suitability of the scanning time.
3. Results
3.1. Case Study 1: Effect of Scanning Time on Analysis of Cement VDZ100
The evolution of the signal-to-noise ratio (SNR) over scanning time was assessed for VDZ100, an industrial reference material for CEM-I prepared by the German cement industry association (Verein Deutscher Zementwerke, VDZ). The press pellet sample was analyzed 100 times with Aeris XRD and a 1Der detector with a scanning time ranging from 1 min to 100 min, with a 1 min interval. Three representative scans are shown in Figure 2 and Figure 3 demonstrating the different noise levels of the XRD scans, decreasing with the scanning time.
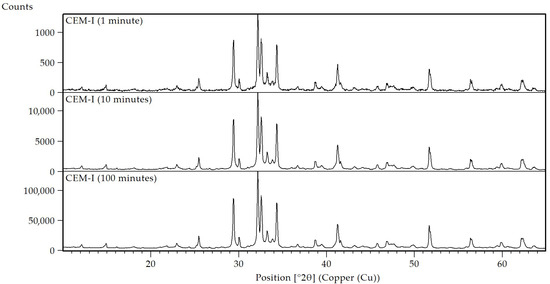
Figure 2.
XRD patterns of a CEM-I sample (VDZ100) measured for 1, 10 and 100 min with Aeris XRD.
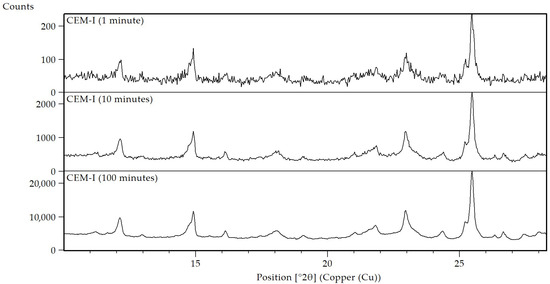
Figure 3.
Details at low angles of XRD patterns of a CEM-I sample (VDZ100) measured for 1, 10 and 100 min with Aeris XRD.
Rietveld refinements of all scans were performed; the analysis of the 10 min scan is shown in Figure 4. The quantitative results are in accordance with the reference values, Table 1. The reference values were provided by the cement supplier VDZ, and they are based on a Round Robin involving approximately 20 laboratories.
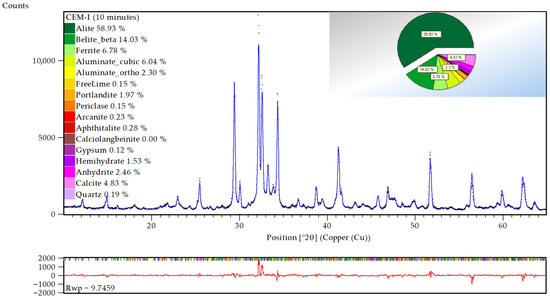
Figure 4.
Rietveld refinement of a CEM-I sample (VDZ100) measured in 10 min. Black dots are the measured data, the blue line is the Rietveld model (Rwp = 9.7%, GoF = 2.69).

Table 1.
Reference values and Rietveld results of a CEM-I sample (VDZ100). The Rietveld results are accurate and within the confidence interval of the reference, in brackets.
Phase Guard calculated the Phase-SNR of the 16 phases for the 100 refinements. The Phase-SNR are plotted in Figure 5 and they show a clear increase with the square root of time, as expected from a Poisson distribution. Major phases (alite, belite, ferrite…) have larger Phase-SNRs than minor phases (lime, quartz, periclase…).
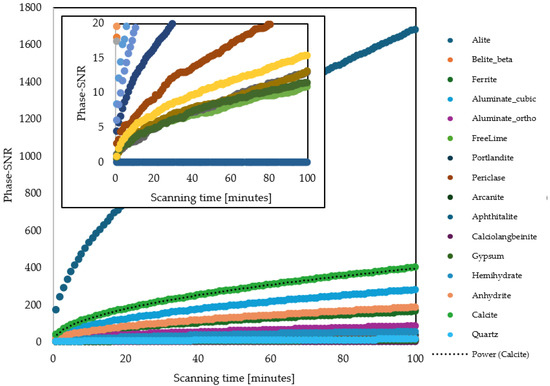
Figure 5.
Signal-to-noise ratios of the Rietveld phases at different scanning times for a CEM-I sample (VDZ100). A power function Phase-SNR = c × (time)0.5 can be used to fit the curve, see example of calcite.
The increase in Phase-SNR with scanning time “t”—expressed in minutes—can be described with the following equation: Phase-SNR = c∙sqrt[t]. For each phase, a power regression was performed on the calculated Phase-SNR values and the scanning time t to obtain the “c” coefficient, reported in Table 2. The higher the weight percentage of the phase in the cement, the larger the “c” coefficient. Major phases do not require a long scanning time to be quantifiable, that is having a Phase-SNR > 7. Using the equation and “c” coefficient various statistical values of interest were calculated, such as the scanning time needed to obtain a Phase-SNR = 7 for each phase, Table 2.
Table 2.
Calculated coefficients “c” relating the scanning time to the Phase-SNR for each phase of VDZ100 measured with Aeris 1Der, and derived values of interest.
For cement quality and process control operations, the measurement time is often restricted to 5–10 min. Under these conditions phases below 0.3 wt% have a Phase-SNR < 7 and therefore cannot be quantified with confidence. Applying the Phase Guard filter would therefore set their weight percentage to zero. With a scanning time of 45 min all phases have a Phase-SNR > 7 and can be quantified with statistical confidence. These conditions can be used in a research and development environment which typically allows for longer analysis time.
A total of 0.2 wt% of quartz in this cement measured in 10 min has a Phase-SNR = 6, as shown in Figure 6. This diffractogram was chosen to show the difficulty of choosing an indisputable, common Phase-SNR threshold value. The quartz signal is visible, nonetheless, its weak intensity is likely associated with poor repeatability. Choosing a lower different Phase-SNR threshold might increase the false positives while decreasing the false negatives.
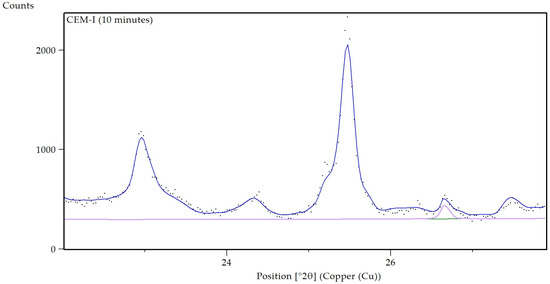
Figure 6.
Detail of Rietveld refinement of a CEM-I sample (VDZ100) measured in 10 min. The purple bottom line represents the Rietveld contribution of quartz SiO2 at 2θ ≈ 26.4° (0.2 wt% and Phase-SNR = 6).
3.2. Case Study 2: QXRD of Complex Blended Cements with Low CO2
Six distinct cements with and without calcined clay and slag additions were mixed and measured with Aeris XRD with a scanning time of 10 min (Figure 7). The Rietveld analysis used two distinct PONKCS phases for the calcined clay and slag. It is possible to quantify the two phases separately due to differences in the peak position and shape of their amorphous humps, located at 2θ = 22° for calcined clay and 2θ = 31° for slag.
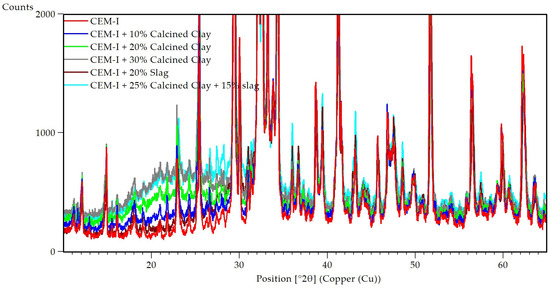
Figure 7.
Section of XRD patterns of six cements with different contents of calcined clays and slag.
An automatic Rietveld routine for quality and process control was created. The Rietveld quantitative results for calcined clay and slag are reported in Table 3, together with the Phase-SNR calculated by Phase Guard and the corrected Rietveld analysis using a threshold filter value of 7 Phase-SNR.
Table 3.
Rietveld results of six blended cements with and without false positive filtering (Phase-SNRthreshold = 7). The Phase-SNR of the calcined clay and slag are also reported for the various samples.
Phase Guard successfully detected and filtered out false positives of slag in CEM-I and in all cements with calcined clays CC. For instance, “CEM-I + 10% of CC” had no slag but the Rietveld routine found 7.6% of slag with a Phase-SNR = 4.9. It is quite common to find slag false positives for two reasons: the broad peak of slag (FWHM ≈ 14°), and the overlap of the peak with the major clinker phases (2θ ≈ 31°).
In contrast to the slag, Rietveld refinements did not produce false positives of calcined clays in samples lacking the phase, such as “CEM-I” and “CEM-I + 20% slag”. But a true positive of calcined clay was labeled as a false positive for “CEM-I + 10% of CC” by Phase Guard. The low amount of calcined clay has a Phase-SNR = 4 which is not satisfactory for quantification with the current measurement time. The XRD signal for 10% calcined clay in cement is shown in Figure 8. The rather high limit of quantification is mainly caused by the broad peak of the calcined clay peak with a FWHM of 9° 2θ.
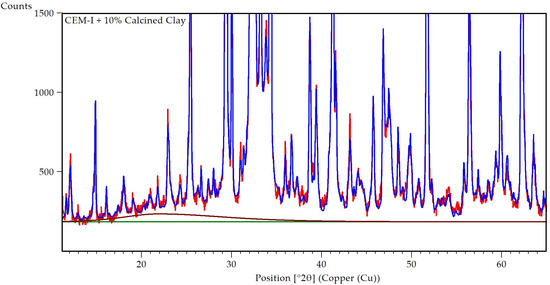
Figure 8.
XRD pattern (red) and Rietveld model (blue) of a cement with 10% calcined clay. The background (green) and calcined clay contribution (brown) are also displayed.
3.3. Case Study 3: Automatic QXRD in the Mineral Industry: Copper
An automatic Rietveld routine for quality control of copper flotation feeds and concentrates was developed and tested on 544 samples. More information about the samples can be found in [6]. The XRD data were collected using Aeris XRD with a scanning time of 20 min, a cobalt X-ray tube and a PIXcel1D-Medipix3 detector, see Figure 9.
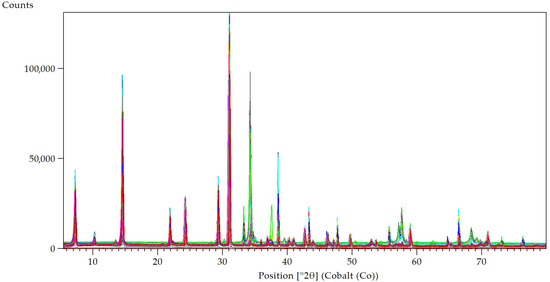
Figure 9.
XRD patterns of 544 copper flotation samples.
The 544 quantitative mineralogical analyses were performed by an automatic Rietveld routine (control file) which included Phase-SNR calculation based on Phase Guard. The accuracy of the XRD results was verified by comparing the elemental composition calculated from the Rietveld refinements with the ICP-OES elemental analysis. The control file was calibrated based on elemental composition. The samples show variable concentration of minor phases, such as chalcopyrite, sphalerite, galena, arsenopyrite, covellite, etc. The quantification of all those minor phases is important in copper flotation operations.
The weight percentages of selected minor phases and their respective Phase-SNRs are shown in Figure 10. The relation between these two quantities is different for each phase due to differences in the minerals’ scattering powers. For low Phase-SNR and similar mineralogy it is possible to approximate a linear relation with the phase concentration. The linear coefficients for the various phases are reported in Table 4. By selecting an appropriate threshold Phase-SNR and multiplying it by the linear coefficients, a more precise estimation of the LOQ can be performed. Assuming a threshold Phase-SNR = 7, the limit of quantification for sphalerite is 7 × 0.011 = 0.08 wt%, for rutile is 7 × 0.027 = 0.19 wt% and for covellite it is 7 × 0.25 = 1.75 wt%. This demonstrates that using a filter based on Phase-SNR is better than a filter based on weight percentages. A weight percentage threshold of 1 wt% will generate a false positive for covellite and false negatives for sphalerite and rutile.
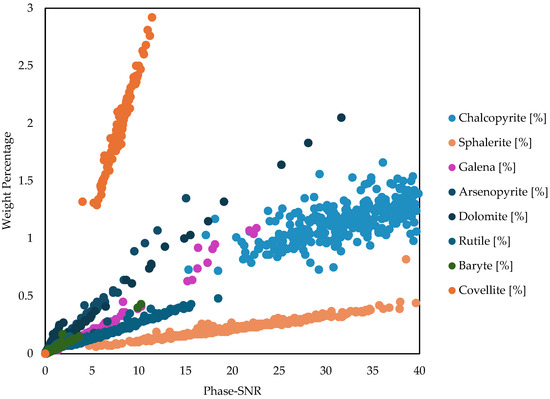
Figure 10.
Variation in Phase-SNR for selected minerals’ phases in 544 copper flotation samples, with varying concentration. Different phases exhibit different trends due to differences in scattering power and other reasons, such as line broadening from initial crystallization or sample preparation (digenite and covellite), difference in sample MAC, micro-absorption (case of galena) and preferential orientation.
Table 4.
Calculated slope of wt% and Phase-SNR for different minerals in copper flotation and estimated LOQ when using a threshold Phase-SNR = 7. Errors are in brackets. We reported the Reference Intensity Ratio (RIR) values (from the CIF file) and hardness (from www.mindat.org) of the phases. Minerals are sorted based on Slope wt% vs. Phase-SNR.
The LOQ for Rietveld analysis is different for each mineral, but the same minerals could also have different LOQs based on the overall mineralogical composition. When the mass absorption coefficient MAC of the samples increases, the penetration depth and the diffraction intensities are lower while the LOQ is larger. This can be seen in Figure 11 for mineral tetrahedrite in flotation feeds and flotation concentrates. The feed samples have a higher content of aluminosilicates and have an average MAC ≈ 55 cm2/g, while the concentrates are richer in copper and have an average MAC ≈ 90 cm2/g. From the slope of Figure 11 it is clear how the LOQ of tetrahedrite is higher in concentrate. Therefore, the average LOQs expressed in Table 2 cannot be used as a criterion to filter false positives, they are only an approximation to show how the LOQ varies among phases. The false positive detection and filtering must rely exclusively on the Phase-SNR which is based on peak statistics of each individual mineral as measured and modeled in each XRD scan.
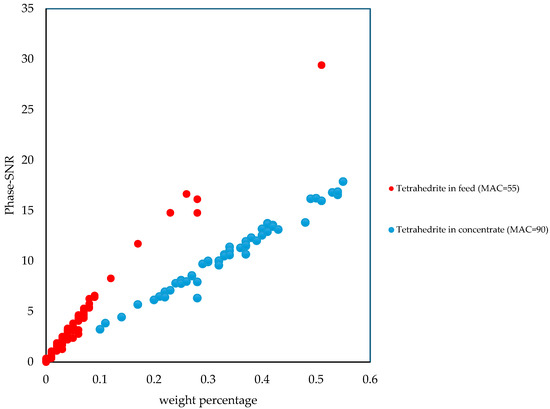
Figure 11.
Variation in Phase-SNR for tetrahedrite with varying concentration in copper flotation feeds and concentrates. The trends are different in feed and concentration due to differences in mass absorption coefficients, respectively, 55 cm2/g and 90 cm2/g for feeds and concentrates.
The false positives were manually checked by observing the phase contribution in the XRD in the raw data and in the Rietveld refinement. Particular attention was paid to verify the correct value of the Phase-SNR threshold. For instance, a true positive and a false positive of galena are shown in Figure 12. While a Phase-SNR = 3 does not provide clear proof of galena presence, the sample with Phase-SNR = 7 has an obvious diffraction peak.

Figure 12.
XRD patterns of copper concentrates. Rietveld refinement results for galena are 0.13 wt% and 0.3% for the sample in red (false positive) and blue (true positive). The respective Phase-SNR values are 3.1 and 7.5.
To assess the effect of Phase Guard we looked at the number of phases with a concentration of 0%, before and after applying the filter. There are 8160 minerals quantified in this case study, that is 15 mineral phases per sample and 544 total samples. Without the filter, 3417 phases were considered absent by the Rietveld refinement. The Phase Guard filter with a threshold Phase-SNR = 7 found an additional 3108 absent phases; in total 63% of minerals included in the Rietveld model are absent. When no filter is used, the Rietveld results have many false positives, approximately 30% of all the quantitative results.
The choice of Phase-SNR threshold value is a compromise between false positives and false negatives. The effect of the threshold value of Phase-SNR was investigated and reported in Figure 13 and Figure 14, alone or in combination with different threshold values for a filter based on weight percentages. When the weight percentage threshold is set to 0 wt% or 0.1 wt%, the percentage of phases excluded by the Phase-SNR filter continuously increases from 30% to 70% as the threshold varies from Phase-SNRthreshold = 0 to Phase-SNRthreshold = 20, see Figure 13. When a weight percentage threshold of 0.5 wt% or 1 wt% is adopted, the Phase-SNR filter has a relatively small effect as most phases are already filtered out, including phases that are considered true positives by the Phase-SNR filter. A Rietveld analysis with those weight percentage thresholds therefore have several false negatives, Figure 13.
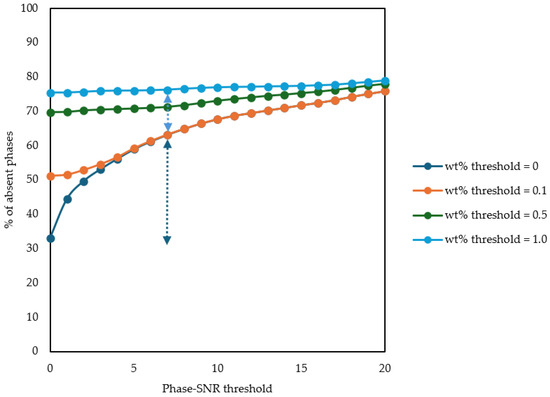
Figure 13.
Effect of different Phase-SNR and wt% threshold values on the percentage of phases considered absent in copper samples. Dark blue arrow represents the amount of false positive when no filters are used. Light blue arrow represents the amount of false negative when a wt% threshold of 1 wt% is adopted.
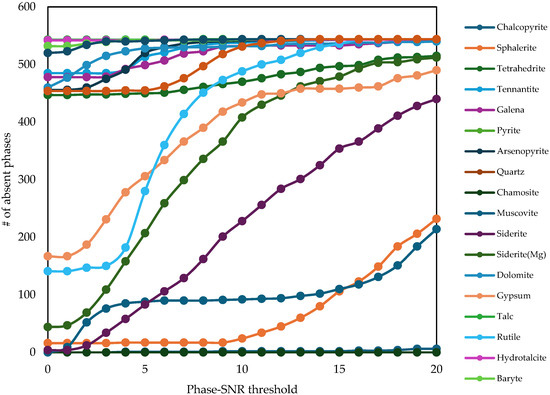
Figure 14.
Effect of different Phase-SNR threshold values on the number of phases considered absent in copper samples. The Phase-SNR filter was used in combination with a weight percentage filter with threshold = 0.1 wt%.
We further investigated the effect of Phase-SNR threshold values on the filtering of individual minerals, Figure 14. Some phases—such as galena and dolomite—are present in only a small percentage of samples and only with a small Phase-SNR. Other phases—such as chamosite and chalcopyrite—are present in all samples with Phase-SNR > 15. Siderite, gypsum and rutile show intermediate behavior: they are present in most samples but often with a Phase-SNR between 3 and 10. Many samples contain these minerals in a concentration very close to the limit of quantification. For these minerals, the choice of threshold for Phase-SNR has a large effect on the ratio of false positive over false negative. If these minerals at these concentration levels (approximately 0.2–0.4 wt%, see Table 4) are important for the process control of the flotation circuit, it is recommended to increase the scanning time to improve the counting statistic.
3.4. Case Study 4: Automatic QXRD in the Mineral Industry: Aluminum
An automatic Rietveld routine for the quality control of bauxite was developed and tested for 51 samples. More information on the samples can be found in [7]. The XRD data were collected using Aeris XRD with a scanning time of 10 min, a cobalt X-ray tube and 1Der detector, see Figure 15.
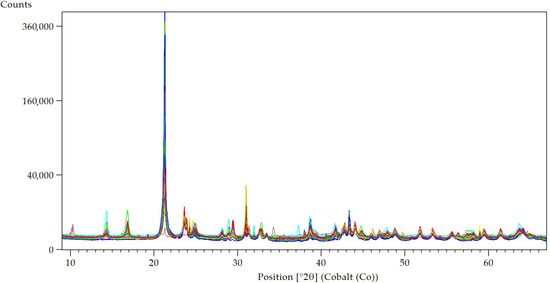
Figure 15.
XRD patterns of 51 bauxite samples.
The 51 quantitative mineralogical analyses were performed by an automatic Rietveld routine (control file) which included a Phase-SNR calculation based on Phase Guard. Ten of the fifty-one bauxite samples were NIST standards or ALCAN reference materials with mineralogical reference values; the accuracy of the control file results was validated against them. The samples show variable concentration of minor phases, such as boehmite, kaolinite, goethite, quartz and mica. Kaolinite quantification is important in bauxite processing as it contains reactive silica which dissolves in alkaline conditions.
The weight percentages of selected minor phases and their respective Phase-SNRs are shown in Figure 16. The relation between these two quantities is different for each phase: while quartz concentration increases slowly with the Phase-SNR, kaolinite increases much faster. Assuming equal concentrations, quartz has a much larger Phase-SNR than kaolinite. Quartz also has a lower limit of quantification than kaolinite.
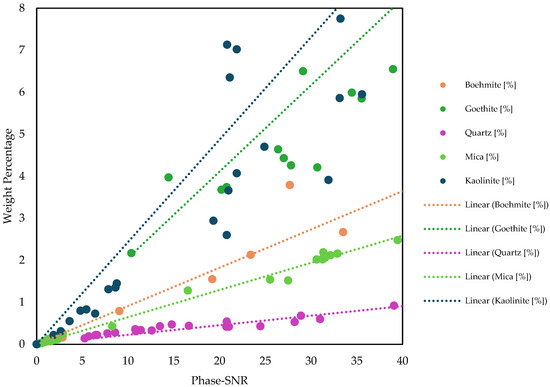
Figure 16.
Variation in signal-to-noise ratio Phase-SNR for selected minerals phases in 55 bauxite samples with varying concentrations. Different phases exhibit different trends due to difference in scattering power and other reasons, such as line broadening from initial crystallization or sample preparation, difference in sample MAC, micro-absorption and preferential orientation.
For a small Phase-SNR range and similar mineralogy, it is often possible to approximate a linear relation between the Phase-SNR and the phase concentration, Figure 16. The linear coefficients for the various phases are reported in Table 5. If a Phase-SNR threshold of 7 is used for limit of quantification, such limit is 0.023 × 7 = 0.16 wt% for quartz and 0.24 × 7 = 1.7 wt% for kaolinite. It demonstrates that using a filter based on Phase-SNR is better than a filter based on weight percentages. A weight percentage threshold of 1 wt% will generate false positives for kaolinite and false negatives for quartz.
Table 5.
Calculated slope of wt% and Phase-SNR for different minerals in bauxite and estimated LOQ when using a threshold Phase-SNR = 7. Errors are in brackets. We reported the RIR values (from CIF file) and hardness (from www.mindat.com) of the phases. Minerals are sorted based on Slope wt% vs. Phase-SNR.
To assess the effect of Phase Guard we looked at the number of phases with a concentration of 0%, before and after applying the filter. There are 663 minerals quantified in this case study, that is 13 mineral phases per sample and 51 total samples. Without the filter, 194 phases were considered absent by the Rietveld refinement. The Phase Guard filter with a threshold Phase-SNR = 7 found and additional 122 absent phases, in total 48% of minerals included in the Rietveld model are absent. When no filter is used, the Rietveld results have many false positives, approximately 18% of all the quantitative results.
The effect of the threshold value of Phase-SNR was investigated alone or in combination with different threshold values for a filter based on weight percentages as in the previous case study, see Figure 17. The use of a classic weight percentage threshold would generate either lots of false positive or false negative when compared with the Phase-SNR filtering approach.
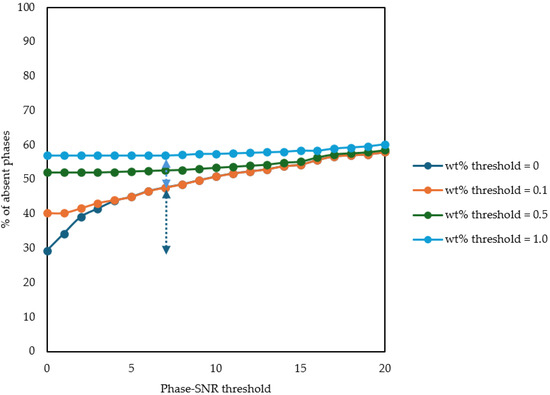
Figure 17.
Effect of different Phase-SNR and wt% threshold values on the percentage of phases considered absent in bauxite samples. Dark blue arrow represents the amount of false positive when no filters are used. Light blue arrow represents the amount of false negative when a wt% threshold of 1 wt% is adopted.
It is beyond the scope of this paper to justify in detail the different linear coefficients observed in Table 5. Such coefficients are specific to the XRD instrument, scanning time, overall sample composition and sample preparation. Preferential orientation and other variables can also affect the linear coefficients.
For instance, not all kaolinite samples have the same level of crystallinity [7]. Low crystallinity kaolinite has broader peaks than high crystalline kaolinite. In Figure 18 the XRD patterns of two bauxite samples with the same kaolinite content are shown. While the integrated areas of the kaolinite peaks are the same, the peak broadening reduces the Phase-SNR from 32 to 22. This variation in kaolinite crystallinity among the 51 samples causes a less linear behavior, seen in Figure 16.
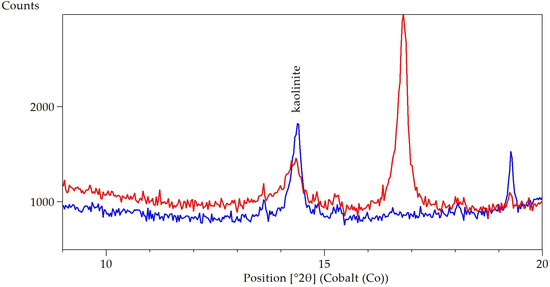
Figure 18.
XRD patterns of two bauxite samples, focused on the kaolinite peak at 2θ ≈ 14.4°. Both samples have the same kaolinite content (≈4%) but have different peak broadening (0.19° and 0.4°) and Phase-SNR (32 and 22), respectively scan in blue and red.
The limit of quantification for QXRD therefore depends on multiple factors and it should be estimated based on Phase-SNR values individually checked for each scan and each mineral. When a common Phase-SNR limit is not sufficient, individual limits per phase should be used.
4. Discussion
QXRD is used in research and industrial environments to quantify major and minor mineral phases. The accurate quantification of some minor phases is often very important, for instance the lime content in clinker or the chalcopyrite content in copper ore deposits. The limit of quantification for minor phases depends on multiple factors which are instrument and material specific. The diffractometer type, configuration and scanning parameters affect the limit of quantification, Figure 5. The material contributions include the individual phase scattering power (Figure 10), peak broadening (Figure 18), preferential orientation and overall sample composition affecting the MAC of the mixture (Figure 11). The latter affects the penetration depth and therefore the probed volume of the samples in XRD.
Counting statistics is a useful tool for the detection of false positives in QXRD of cement blends, see Table 3. This tool can also be used in mining operations for complex automatic QXRD analysis with 20+ phases, filtering out minor phases which are below the limit of quantification, see Figure 10 and Figure 16. Those are either not present (false positives) or cannot be quantified with confidence with the current quality of data. On the other hand, the tool gives confidence in the quantification of minor phases that were successfully quantified by passing the filter criteria. While QXRD can prove the presence of a specific mineral, it cannot prove its absence. Nonetheless, considering the SNR, it is possible to affirm that, with the actual data quality, the phase is certainly below the limit of quantification. Moreover, counting statistics gives an objective assessment of the suitable scanning time for the goal of the analysis, as shown in Figure 5.
In the Highscore Plus software implementation of the filter—Phase Guard—the Phase-SNR (or Peak-SNR) of the individual phases is obtained from the WPPD performed by the Rietveld. A proper background model is essential to perform the Phase-SNR calculation. It is also the main limitation of this method: mistakes in the background modeling can lead to wrong Phase-SNR estimations. Therefore, a proper phase identification and robust Rietveld refinement strategy is a precondition for the successful use of Phase Guard.
In Phase Guard a Phase-SNR of 7 is a reasonable common threshold for both false positives and concentrations precluded by the data quality. The selection of the threshold is a compromise between false positives and false negatives. Validation was performed by manual evaluation of the Rietveld fits by a subject matter expert, see examples in Figure 6, Figure 8, Figure 12 and Figure 18. Phase Guard detected and filtered out 3108 and 122 false positives in QXRD of copper flotation and bauxite ore samples, respectively. The percentage of false positives were, respectively, 30% and 18% of all quantitative results.
It is also possible to report the unfiltered Rietveld results together with the Phase-SNR, so the analyst can manually assess the presence of minor phases, Figure 19. This filter can be used alone or in combination with others, such as common weight percentages threshold. The Phase Guard filter is compatible with amorphous determination using the external standard method, also known as the K-factor in HighScore Plus. When a mineral is excluded from the quantification due to Phase-SNR considerations, both the amorphous quantification and the mass absorption coefficient of the mixture are updated.
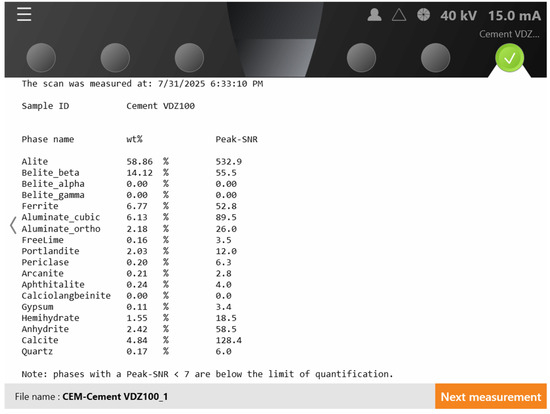
Figure 19.
Example of implementation of Phase Guard for a cement control file on Aeris XRD. The Phase-SNR, here referred to as Peak-SNR, is calculated by Phase Guard and visualized on the instrument screen. In this case, the false positives are not filtered out, leaving the decision to the operator.
It is possible to rationalize the trends of Phase-SNR for different minerals, but the relation is complex and mineral specific as it involves scattering power (approximated by the RIR in first instance), crystallite size, preferential orientation and the overall composition affect the MAC of the mixture. While the peak broadening caused by excessive grinding during sample preparation often correlates with mineral hardness, the latter cannot account for peak broadening due to initial crystallization conditions, see Figure 18.
In this work, we used various models to describe the limit of quantification based on the Phase-SNR trends. In Table 2 we used a power law to fit the Phase-SNR over scanning time; we calculated the minimum scanning time to quantify the various phases present in a cement. The results of these calculations are sample and instrument specific and cannot be generalized. In the copper and aluminum case studies we used a linear fit to describe the increase in Phase-SNR with the concentration to determine the limit of quantification. Again, the results of these calculations are instrument and sample specific and cannot be generalized.
The complex variability of the limit of quantification of minor phases in QXRD requires a dynamic filter that adapts to all changing conditions and parameters. The use of individual and phase-specific SNRs based on the Rietveld whole pattern decomposition analysis can fulfill these requirements. Phase Guard is a substantial improvement compared to a global weight percentage threshold.
5. Conclusions
A filter based on the signal-to-noise ratio of phase peaks was developed and assessed with multiple case studies of QXRD. It has implications on the quantitative mineral analysis of minor phases. The use of statistical analysis (SNR) for each phase detects false positives and filters out phases which are not quantifiable with the given data quality. The resulting quantitative mineralogical results are therefore more trustworthy, especially when it comes to minor phase quantification.
The filter has broad implications in automated Rietveld routine analysis performed in various industrial sectors for quality and process control, including but not limited to cement, mining, metals, pharmaceuticals, ceramics and advanced materials. These industrial applications often contain more than 20 mineralogical phases, not all of them being present in the samples, and automatic Rietveld routines often generate false positives which need to be dealt with.
The knowledge of the individual SNR for the various phases can lead to a better experimental setup and improved scan time, where the minor phases of interest can be quantified with confidence.
Author Contributions
Conceptualization, M.P. and S.M.; methodology, M.P. and S.M.; validation, M.P. and S.M.; formal analysis, M.P. and S.M.; investigation, M.P. and S.M.; data curation, M.P. and S.M.; writing—original draft preparation, M.P.; writing—review and editing, M.P. and S.M.; visualization, M.P. All authors have read and agreed to the published version of the manuscript.
Funding
This research received no external funding.
Data Availability Statement
The data are not public but can be shared by the authors. Data from copper flotation and bauxite mines cannot be shared due to industry preferences.
Acknowledgments
We acknowledge Thomas Degen and Thomas Dortmann for developing Phase Guard and supporting this study with their expertise. No GenAI has been used for the creation of this manuscript.
Conflicts of Interest
The authors, Matteo Pernechele & Sheida Makvandi, are employees of Malvern Panalytical B.V., a manufacturer of X-Ray Diffraction equipment and provider of analytical solutions. The paper reflects the views of the scientists and not the company.
Abbreviations
The following abbreviations are used in this manuscript:
| XRD | X-ray Diffraction |
| PXRD | Powder X-ray Diffraction |
| QXRD | Quantitative X-Ray Diffraction |
| WPPD | Whole Powder Pattern Decomposition |
| SNR | Signal-to-Noise Ratio |
| LOD | Limit Of Detection |
| LOQ | Limit Of Quantification |
| CEM | Cement |
| CC | Calcined Clay |
| RIR | Reference Intensity Ratio |
| MAC | Mass Absorption Coefficient |
| VDZ | Verein Deutscher Zementwerke |
| ICP-OES | Inductively Coupled Plasma Optical Emission Spectrometry |
References
- Dinnebier, R.E.; Billinge, S.J.L. Powder Diffraction: Theory and Practice; The Royal Society of Chemistry: London, UK, 2008; ISBN 978-0-85404-231-9. [Google Scholar]
- O’Connor, B.H.; Raven, M.D. Application of the Rietveld Refinement Procedure in Assaying Powdered Mixtures. Powder Diffr. 1988, 3, 2–6. [Google Scholar] [CrossRef]
- Chung, F.H. Quantitative Interpretation of X-Ray Diffraction Patterns of Mixtures. I. Matrix-Flushing Method for Quantitative Multicomponent Analysis. J. Appl. Crystallogr. 1974, 7, 519–525. [Google Scholar] [CrossRef]
- Hill, R.J.; Howard, C.J. Quantitative Phase Analysis from Neutron Powder Diffraction Data Using the Rietveld Method. J. Appl. Crystallogr. 1987, 20, 467–474. [Google Scholar] [CrossRef]
- Rietveld, H.M. A Profile Refinement Method for Nuclear and Magnetic Structures. J. Appl. Crystallogr. 1969, 2, 65–71. [Google Scholar] [CrossRef]
- Pernechele, M.; López, Á.; Davoise, D.; Maestre, M.; König, U.; Norberg, N. Value of Rapid Mineralogical Monitoring of Copper Ores. Minerals 2021, 11, 1142. [Google Scholar] [CrossRef]
- Makvandi, S.; Pernechele, M.; Koenig, U.; Wang, L.; Zhang, G. High-Throughput Bauxite Characterization and Process Monitoring via Automated QXRD Integrated with Cluster Analysis and PLSR Modeling. In Proceedings of the TRAVAUX 54, Proceedings of the 43rd International ICSOBA, Nanning, China, 26–31 October 2025. [Google Scholar]
- Feret, F.R. Selected Applications of Rietveld-XRD Analysis for Raw Materials of the Aluminum Industry. Powder Diffr. 2013, 28, 112–123. [Google Scholar] [CrossRef]
- König, U.; Norberg, N.; Gobbo, L. From iron ore to iron sinter—Process control using X-ray Diffraction (XRD). In Proceedings of the Anais dos Seminários de Redução, Minério de Ferro e Aglomeração, Ouro Preto, Brazil, 10–13 September 2017; Editora Blucher: São Paulo, Brazil, 2017; pp. 146–153. [Google Scholar]
- Meier, R.; Anderson, J.; Verryn, S. Industrial X-Ray Diffraction Analysis of Building Materials. Rev. Mineral. Geochem. 2012, 74, 147–167. [Google Scholar] [CrossRef]
- Alexander, L.; Klug, H.P. Basic Aspects of X-Ray Absorption: In Quantitative Diffraction Analysis of Powder Mixtures. Anal. Chem. 1948, 20, 886–889. [Google Scholar] [CrossRef]
- Scarlett, N.V.Y.; Madsen, I.C. Quantification of Phases with Partial or No Known Crystal Structures. Powder Diffr. 2006, 21, 278–284. [Google Scholar] [CrossRef]
- Wang, X.; Hart, R.D.; Li, J.; McDonald, R.G.; Van Riessen, A. Quantitative Analysis of Turbostratically Disordered Nontronite with a Supercell Model Calibrated by the PONKCS Method. J. Appl. Crystallogr. 2012, 45, 1295–1302. [Google Scholar] [CrossRef]
- Toraya, H. A New Method for Quantitative Phase Analysis Using X-Ray Powder Diffraction: Direct Derivation of Weight Fractions from Observed Integrated Intensities and Chemical Compositions of Individual Phases. J. Appl. Crystallogr. 2016, 49, 1508–1516. [Google Scholar] [CrossRef]
- Wang, X.; Spratt, H. Incorporating the Direct Derivation Method and Molecular Scattering Power Method into the Rietveld Quantitative Phase Analysis Routine in TOPAS. J. Appl. Crystallogr. 2025, 58, 1159–1173. [Google Scholar] [CrossRef] [PubMed]
- Brindley, G.W. XLV. The Effect of Grain or Particle Size on x-Ray Reflections from Mixed Powders and Alloys, Considered in Relation to the Quantitative Determination of Crystalline Substances by X-Ray Methods. Lond. Edinb. Dublin Philos. Mag. J. Sci. 1945, 36, 347–369. [Google Scholar] [CrossRef]
- León-Reina, L.; Garciá-Maté, M.; Álvarez-Pinazo, G.; Santacruz, I.; Vallcorba, O.; De La Torre, A.G.; Aranda, M.A.G. Accuracy in Rietveld Quantitative Phase Analysis: A Comparative Study of Strictly Monochromatic Mo and Cu Radiations. J. Appl. Crystallogr. 2016, 49, 722–735. [Google Scholar] [CrossRef] [PubMed]
- Shrivastava, A.; Gupta, V. Methods for the Determination of Limit of Detection and Limit of Quantitation of the Analytical Methods. Chron. Young Sci. 2011, 2, 21. [Google Scholar] [CrossRef]
- Chung, F.H.; Smith, D.K. Industrial Applications of X-Ray Diffraction; Marcel Dekker: New York, NY, USA, 2000; ISBN 9780824719920. [Google Scholar]
- Scrivener, K.L.; Füllmann, T.; Gallucci, E.; Walenta, G.; Bermejo, E. Quantitative Study of Portland Cement Hydration by X-Ray Diffraction/Rietveld Analysis and Independent Methods. Cem. Concr. Res. 2004, 34, 1541–1547. [Google Scholar] [CrossRef]
- Schottky, W. Über Spontane Stromschwankungen in Verschiedenen Elektrizitätsleitern. Ann. Phys. 1918, 362, 541–567. [Google Scholar] [CrossRef]
- Sakhatskyi, K.; Turedi, B.; Matt, G.J.; Wu, E.; Sakhatska, A.; Bartosh, V.; Lintangpradipto, M.N.; Naphade, R.; Shorubalko, I.; Mohammed, O.F.; et al. Stable Perovskite Single-Crystal X-Ray Imaging Detectors with Single-Photon Sensitivity. Nat. Photonics 2023, 17, 510–517. [Google Scholar] [CrossRef]
- Degen, T.; Sadki, M.; Bron, E.; König, U.; Nénert, G. The HighScore Suite. In Powder Diffraction; Cambridge University Press: Singapore, 2014; Volume 29, pp. S13–S18. [Google Scholar]
- ICH. Guidance for Industry, Q2B, Validation of Analytical Procedures: Methodology; ICH: Geneva, Switzerland, 1997. [Google Scholar]
Disclaimer/Publisher’s Note: The statements, opinions and data contained in all publications are solely those of the individual author(s) and contributor(s) and not of MDPI and/or the editor(s). MDPI and/or the editor(s) disclaim responsibility for any injury to people or property resulting from any ideas, methods, instructions or products referred to in the content. |
© 2025 by the authors. Licensee MDPI, Basel, Switzerland. This article is an open access article distributed under the terms and conditions of the Creative Commons Attribution (CC BY) license (https://creativecommons.org/licenses/by/4.0/).