Abstract
Wet agglomeration is essential in heap leaching of minerals, as it improves permeability by forming agglomerates through capillary and viscous forces. The Discrete Element Method (DEM) has been used to model this phenomenon, enabling the detailed tracking of interactions between individual particles. This study employs DEM to analyze the effect of particle-size distribution (PSD) on agglomerate formation inside a rotating agglomeration drum. The DEM model was validated using geometry and parameters reported in the literature, which are based on experimental studies of agglomeration in rotating drums. Both wide and bimodal PSD cases were simulated. The results demonstrate that DEM simulations of drums with exclusively fine particles are prone to producing poorly defined macrostructures. In contrast, the presence of coarse particles promotes the formation of stable agglomerates with fine particles attached to them. Additionally, decreasing the maximum particle size increases the number of agglomerates and improves the homogeneity of the final PSD. These findings improve our understanding of wet agglomeration dynamics and provide practical criteria for optimizing feed design in mineral-processing applications.
1. Introduction
Agglomeration is the process of consolidating fine particles into larger aggregates through mechanical agitation [1]. In copper mineral processing, agglomeration plays a crucial role in enhancing the permeability of heap-leaching piles by promoting the formation of porous agglomerates that facilitate solution percolation and improve metal recovery [2]. In wet systems, agglomeration is typically achieved by adding binders such as water or acid solutions. These generate cohesive forces, including capillary and viscous interactions, that enable particles to adhere and form stable clusters, commonly called glomeruli or aggregates. Agglomeration is commonly performed in agglomerating drums, which typically measure approximately 12 m in length and 4 m in diameter, operate at about five revolutions per minute, and process up to 2000 t/h. These drums are fed with ore originating from secondary or tertiary crushing stages, characterized by a particle-size distribution of approximately mm, mm and a fine-particle content of around 8.5% [3]. Once agglomerated, the resulting material exhibits improved properties, such as increased permeability, wear resistance, and reduced dust. These properties facilitate handling and improve performance in heap leaching [4].
Computational simulations have become powerful tools for process optimization [5,6,7], failure detection [8], and modeling complex interactions [9]. The discrete element method (DEM) has been widely used in agglomeration to simulate agglomerating drums [10,11,12,13,14,15]. Alternative modeling techniques include computational fluid dynamics (CFD) [16], population balance models (PBM) [17], and their couplings, such as DEM–PBM [18,19] and CFD–DEM–PBM [20]. DEM offers a unique advantage in that it resolves particle-level contact forces and interactions, unlike these methods. In wet systems, the liquid phase is not explicitly modeled; cohesive forces are incorporated through liquid bridge models that capture capillary and viscous effects [10].
Several studies have applied DEM to simulate agglomeration in rotating drums. For instance, Liu et al. [11] investigated wet particle flow in a rotating drum and validated their simulations against experimental data, using monodisperse spherical glass beads with diameters of 1.3 mm. Trung Vo et al. [12] studied the growth of a single granule within a dense flow of wet and dry particles, showing that the granule size follows an exponential growth law driven by the conservation of liquid and the reduction in the number of available wet particles. The particles in their study ranged from 10 to 1500 μm in diameter, with size ratios between 1 and 5. Shi et al. [13] simulated the granulation of iron ore using DEM, categorizing particles into nuclei (+1.5 mm), intermediates (−1.5 mm + 0.5 mm), and fine particles (<0.5 mm). Particle-size distribution was analyzed using virtual sieving techniques. Wang et al. [14] examined the granulation behavior of a mixture of iron ore, coke, and flux. While coke and flux had fixed sizes of 0.5 mm, ore particles ranged in size from 0.6 to 10 mm. Their simulations demonstrated that fine particles adhere to coarser ones through liquid bridge forces, forming stable agglomerates. In a subsequent study, Wang et al. [15] explored the effects of particle shape and baffle configuration. No significant differences were found between spherical and non-spherical particles, and the optimal configuration involved four equidistant baffles.
The literature suggests that monodisperse systems are ineffective for agglomerate formation in DEM simulations [11,21]. In contrast, systems with broader size distributions promote the formation of composite agglomerates composed of large central particles surrounded by finer particles [12,13,14,15]. In the context of copper mineral processing, particle-size distributions are often skewed toward fine particles, which increases the computational demands of DEM simulations and complicates the identification of agglomerates [22,23].
This study aims to address this gap by numerically evaluating the role of particle-size distribution in the formation and growth of agglomerates inside a rotating drum. Using the validated drum geometry and material properties reported by Wang et al. [14], we conduct a parametric study on particle-size distribution (PSD). Agglomerates are quantified using an in-house algorithm based on inter-particle contact and capillary-bonding criteria. The findings of this work provide new insights into the mechanisms of agglomerate formation and offer practical guidance for optimizing feed design in wet agglomeration processes across mineral-processing applications.
2. Materials and Methods
2.1. Numerical Model
The Discrete Element Method is a numerical technique used to simulate the dynamics of particle systems [24]. This method makes it possible to determine the forces acting on each particle through contact models. From these forces, Newton’s equations of motion are applied at each time step, calculating and updating the position of the particles for the next step. It is possible to analyze how the particles in the system move and interact over time by iteratively repeating this process. Discrete element analysis is a dynamic and transient process that considers the continuous interactions between particles that can move and influence each other. In this methodology, particles are represented as ideal rigid bodies that can move and rotate but not deform. The contacts in the simulation can be classified as particle-to-particle or particle-to-wall contacts [25]. For these two types of contacts, the corresponding forces are calculated. Within this approach, several contact models exist. The Hertzian spring-dashpot model is a nonlinear formulation that describes the behavior of normal forces in particle–particle contacts. Unlike in the linear model, both the elastic and dissipative components of the force depend nonlinearly on the overlap between particles in this case. The elastic component is based on Hertz’s contact theory, which assumes that contact between two elastic bodies produces a force proportional to a power of the overlap . In this model, the general form of the normal force, , is expressed as follows:
The stiffness constant, , is defined as follows:
where is the reduced Young’s modulus and is the effective contact radius given by
The damping constant for the Hertzian used in this work is defined as follows:
On the other hand, Mindlin and Deresiewicz [26] proposed a model to calculate tangential forces. The Mindlin–Deresiewicz model describes tangential forces at a contact point by considering elastic deformation and relative slip between particles. Unlike simpler tangential models, the Mindlin–Deresiewicz model allows for a more realistic transition between the sticking and sliding states at contact. The tangential force, , is defined by the following relation:
where is defined as
where is the coefficient of friction, is the normal force, is the relative tangential displacement at the contact, is the tangential component of the relative velocity at the contact, is the maximum relative tangential displacement at which the particles begin to slide, is the effective mass, and is the tangential damping ratio. Liquid bridge models are numerical representations of the interaction between solid particles and a liquid within a system [27]. In agglomeration, these models focus on understanding and predicting the formation and breakdown of solid agglomerates in a liquid suspension by studying how the agglomerates evolve over time. This involves studying the kinetics of liquid bridge formation and agglomerate consolidation, as well as the influence of factors such as surface tension, liquid viscosity, and particle concentration. A liquid bridge forms when wet particles approach each other or a boundary, as shown in Figure 1. According to a correlation derived by Mikami et al. [28], for a bridge, the magnitude of the force is given by the following:
where is the surface tension; is the geometric mean of the particle radius; is the dimensionless distance separating the two particles; and A, B and C are coefficients that depend on the dimensionless volume of the liquid bridge and the contact angle , according to the following expressions in the case of particle–particle contact:
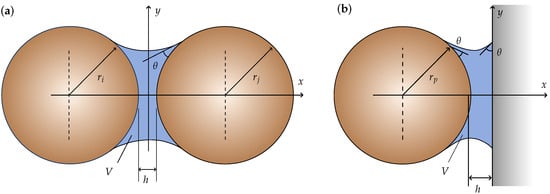
Figure 1.
Liquid bridge: (a) particle–particle contact, (b) contact.
For the case of particle–wall contact, the following expressions apply:
In addition to capillary forces, the liquid bridge model incorporates viscous forces, , which oppose the relative motion of particles, or a particle and a boundary bridged by a liquid bridge. These viscous forces are derived from lubrication theory and are taken from Nase et al. [29]. Unlike capillary force, which always acts in the normal direction, viscous forces have normal and tangential components. The expressions for these components are, respectively, as follows:
where is the viscosity of the liquid and is effective radius, as previously defined.
The dimensionless equivalent radius is defined as follows:
The distance will be given by the following equation:
where is a user parameter.
When the particles are within the volume defined to be wetted, and during the time interval specified by the user, the amount of liquid assigned to each particle, , will be determined by
where is the mass flow assigned to the region, is the simulation time step, and corresponds to the number of particles within the injection region at a given time step. Although the volume of liquid is initially distributed equally among all particles, a liquid bridge and the associated cohesive force occurs form only when two wet particles approach each other at a distance less than the critical distance defined in Equation (17).
2.2. Material
The material simulated in this study consists of iron ore, coke, and flux, all represented as spherical particles based on the data reported by Wang et al. [14]. Although the shape of the particle is important in DEM modeling [30,31,32], spherical particles are used because no relevant differences were found for agglomeration [15], and this choice also helps to reduce computational cost [33]. It should be noted that spherical particles yield a greater number of adhering particles per unit area [15], which may affect the results obtained in this study.
The particle-size distribution of the iron ore was modified in two ways:
- By varying the top particle size to , 6.5, 4, 2, and 0.85 mm. In all modified cases, the relative proportions in mass of intermediate and fine particles were preserved, and the PSDs are shown in Figure 2. In this way, the relative proportion between different size classes is maintained. For example, the ratio between sizes 2 mm and 0.85 mm is equal to 1.2292.
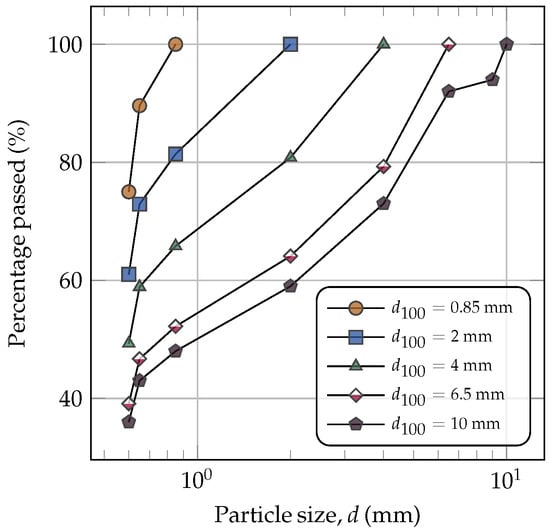 Figure 2. Particle size distributions of the agglomerates.
 - By creating bimodal monodisperse distributions composed of a single coarse particle surrounded by finer particles at seven different size ratios (e.g., 0.7:10, 0.75:10, 0.9:10, 1:10, 1.5:10, 2:10, and 3:10) to study localized agglomerate formation. The coarse particle size selected is 10 mm. The distribution is composed of a 17.4% 10 mm coarse ore, with the rest composed of fine particles: 9.9% coke, 5.7% flux, and 67% fine ore. Although there is no single industrial standard for particle-size ratios, the selected values were chosen with the aim of representing conditions commonly found in fine-concentrate granulation processes, covering a range of relevant agglomeration scenarios.
The original PSD, based on [14], used mm. The particle sizes for coke and flux were kept constant at 0.5 mm in diameter.
The material and contact parameters are listed in Table 1 and Table 2 and were obtained from the literature [14]. The mechanical properties of the drum walls are defined with a Young’s modulus of GPa, a density of 7850 kg/m3, and a Poisson’s ratio of 0.3.

Table 1.
Materials and contact parameters.

Table 2.
Properties of the liquid film.
2.3. DEM Simulation
The DEM model was set up in Ansys Rocky 2025 R1. The geometry and operating conditions used in the DEM simulations are based on Wang et al. [14], consisting of a laboratory-scale rotating drum with a diameter of 0.1 m and a length of 0.05 m. The internal configuration includes four equidistant rectangular lifters, as shown in Figure 3. The drum rotates at a constant speed of 28 rpm.
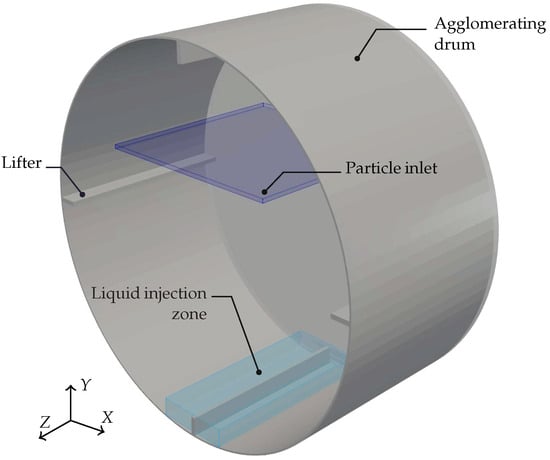
Figure 3.
Setup of the DEM model of the agglomerating drum.
The simulation began with a particle-filling stage lasting 0.5 s, during which the drum was loaded with 2.316 g of coke, 4.7675 g of flux, and 52 g of iron ore. From 0.5 s to 5 s, the dry particles were mixed inside the rotating drum. Between 5 s and 10 s, liquid was introduced at a rate of 0.9475 kg/s to initiate agglomeration. The simulation continues until 35 s, when particle positions and contact data were extracted for post-processing and agglomerate quantification. The total number of particles simulated ranged from 65,000 to 120,000, depending on the PSD, and the time step was set to 10−6 s to ensure numerical stability. To reduce computational cost, 25% of particles in mass was used (0.06 kg), in comparison with the literature (0.23 kg approximately). This simplification decreases the number of particles in the system and therefore decreases the collision frequency, which may have affected the quantitative dynamics of the system. However, the relative trends in adhesive contact formation and glomerule development remain valid. The results of an additional simulation supporting this assumption are provided in the Supplementary File.
An in-house postprocessing algorithm was developed to quantify agglomerate growth. The algorithm identifies metaparticles by searching for particle clusters connected via liquid bridges. Once the clusters are defined, their sizes are computed, and the corresponding agglomerate-size distribution is generated. Agglomerate size was defined as the mesh size of the metaparticle.
3. Results
This section presents the results of the DEM simulations, which are divided into two parts: the effect of the top particle size and the effect of size ratios on agglomeration dynamics.
3.1. Effect of Top Particle Size
The influence of the top particle size, , was assessed using six different particle-size distributions (Figure 2). Figure 4 shows snapshots of the particle configurations at the final simulation time ( s), at which point the liquid content has been fully distributed across all particles. Fine particles (with mm) are rendered translucent in the images to highlight the agglomeration behavior around coarser particles.
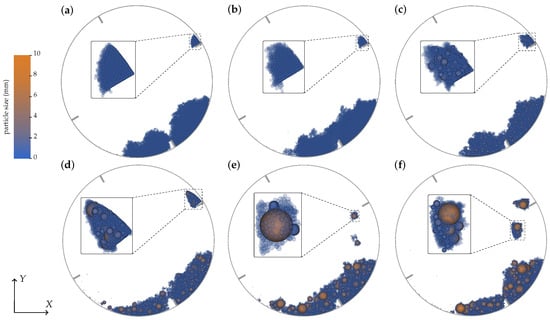
Figure 4.
Snapshots of the DEM simulations for different top particle sizes, : (a) 0.6 mm, (b) 0.85 mm, (c) 2 mm, (d) 4 mm, (e) 6.5 mm, (f) 10 mm. Fine particles ( mm) are shown as translucent. Zoomed views highlight representative agglomerates.
It is evident that in simulations composed primarily of fine particles, agglomeration is diffuse and poorly structured. A large mass of loosely bonded particles is formed and lacks distinct glomerular clusters, as shown in Figure 4a,c. In these cases, the clusters formed at the lifters disperse upon release, and the structural cohesion of agglomerates is lost. Conversely, the formation of agglomerates is clearly observed in the presence of coarser particles. Zoomed-in views in Figure 4d–f illustrate how fine particles adhere to the surfaces of larger particles, forming well-defined, compact agglomerates, where finer particles are joined around bigger particles.
Figure 5 presents the results for adhesive force. In subplot (a), the temporal evolution of the average adhesive force (calculated across all particles) is shown. Since no liquid is present before s, adhesive forces are initially zero and are not presented. From 5 to 10 s, the force increases as liquid bridges form, stabilizing after 10 s with values between 0.7 and 0.8 mN. It is observed that the average adhesive force increases increasing top particle size. Subplot (b) provides a more detailed analysis by separating the adhesive forces of coarse ( mm) and fine ( mm) particles, and their dependence on this size is analyzed. For cases with and mm, which contain only fine particles, only the total values are plotted. Results are averaged over the period from 20 to 35 s. Error bars indicate the 16th and 84th percentiles across all particles. The increase in average adhesive force with increasing top particle size is primarily due to stronger interactions among coarse particles, while the force among fine particles remains approximately constant. While the increase in agglomeration observed in the coarse fraction may appear to be a direct consequence of (7), it is essential to note that adhesive force is not the only interaction governing particle behavior. In the DEM framework, particle dynamics are also influenced by repulsive normal and tangential contact forces, which are functions of contact parameters such as damping and stiffness. Additionally, the collective dynamics inside the drum (including flow patterns, collision frequency, and local rearrangements) play a critical role in determining whether agglomeration occurs. Therefore, the observed trends, although consistent with the adhesive model, result from the complex interplay of multiple physical phenomena.
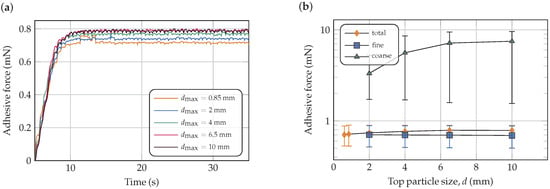
Figure 5.
Effect of top particle size on adhesive forces: (a) time evolution of the average adhesive force; (b) average adhesive force versus for all particles and for fine and coarse classes.
To further analyze agglomerate formation, selected particles from the simulations were tracked over time. The coordination number (), defined as the number of particles in adhesive contact with a given particle [31], was computed considering only adhesive contact. Table 3 reports the averaged values over time. Results show that increases with particle size. However, when the data are normalized by particle surface area (), the trend reverses: larger particles have fewer contacts per unit surface, indicating more open structures. This is visually confirmed in Figure 6, where fine particles almost surround the 3.94 mm particle. In contrast, the 9.45 mm particle exhibits significant gaps, despite being immersed in fine particles, as seen in Figure 4.

Table 3.
Coordination number and normalized contact density for selected particles. represents surface area.
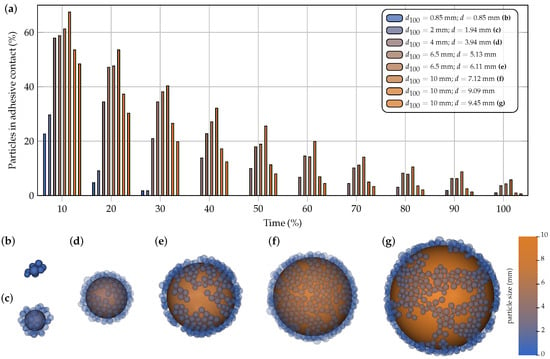
Figure 6.
(a) Histogram of particles maintaining adhesive contact during the final 15 s of the simulation (20–35 s). Images of the final configuration of selected particles and their surroundings: (b) mm and mm; (c) mm and mm; (d) mm and mm; (e) mm and mm; (f) mm and mm; (g) mm and mm. The colormap represents the size of the particles and the color of the bars. The relative size of the images corresponds with their particle size.
Notably, alone does not indicate whether adhesive contacts are persistent and thus does not indicate whether agglomerates are formed. The adhesive contacts of the same selected particles from Table 3 and two more were analyzed to quantify temporal stability.
The particle identification numbers (IDs) of the particles in contact were tracked, and the number of time steps over which each contact was maintained was recorded. Figure 6a shows a histogram of contact duration (from 20 to 35 s), expressed as a percentage of total time. Subplots (b)–(g) show the representative tracked particles with the surrounding particles in adhesive contact at the final simulation time. Particles with size 0.85 and 1.94 mm (Figure 6b,c) maintain few stable contacts: fewer than 30% of neighboring particles remain in contact for up to 10% of the time (1.5 s), and only about 2% (fewer than five particles) remain in contact beyond 4.5 s. None of the contacts persist for more than 30% of the time.
In contrast, the particle with mm (Figure 6f) is the one that maintains most adhesive contacts over time and best forms an agglomerate. About 60% of neighbor particles remain in adhesive contact for at least 10% of the simulation time, and 5.8% (84 particles) remain in contact for over 13.5 s. On the other hand, the largest particle (Figure 6g) keeps half of the particles in contact for 10% of the time and retains 0.6% of the particles (23 particles) in contact for more than 90% of the analyzed time. It should be noted that the particle that maintains contact for the longest time ( mm) also exhibits the greatest surface coverage by surrounding particles, as shown in Figure 6f). The sustained contacts are favored not only by the adhesive interactions between the fine particles and the central coarse particle but also by the additional adhesive forces acting among the fine particles themselves, which reinforce the overall stability of the agglomerate.
A detailed tracking of agglomerate formation was carried out in the simulations corresponding to particle-size distributions with = 4 mm and = 6.5 mm. For this analysis, a representative agglomerate was selected in each case, as shown in Figure 7, to observe its evolution, quantify its final size, and identify the sizes of the particles composing it.
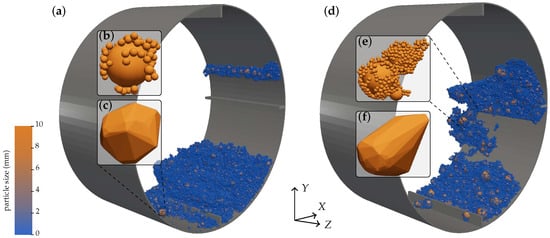
Figure 7.
Agglomerate formation: (a) simulation with mm, (b) zoom in on the agglomerated particles, (c) 3D model of the agglomerate; (d) simulation with mm, (e) zoom in on the agglomerated particles, (f) 3D model of the agglomerate.
The comparison between the two cases reveals apparent differences in agglomeration dynamics. Although both agglomerates initially contain a significant number of fine particles, the inclusion of coarser particles in the = 6.5 mm case promotes the formation of significantly larger agglomerates; these reach a final size of 11.63 mm compared to only 5.05 mm in the = 4 mm case. This difference is also reflected in the PSD of each agglomerate, where larger particles are found in the composition of the 8 mm case, as shown in Figure 8. Notably, in both scenarios, the base of the agglomerate corresponds to a coarse particle, indicating that the presence of large particles facilitates nucleation and enhances radial growth, promoting the consolidation of larger agglomerates. In contrast, systems with a lower tend to form more uniform structures with limited growth potential, which may negatively impact processes that require high strength or structural porosity.
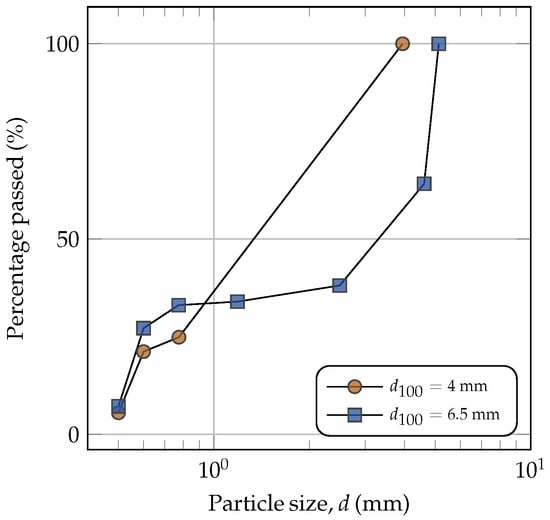
Figure 8.
Particle-size distributions of the agglomerates.
3.2. Effect of Particle-Size Ratio
The influence of the ratio of coarse to fine particle sizes on agglomeration behavior was investigated by simulating seven distinct size ratios. These simulations employed the same configuration used previously (Figure 4). Figure 9 presents final snapshots at s of the agglomerating drum for each tested ratio. Clear glomeruli formation is observed in the 0.7:10 and 1:10 size-ratio cases, in which fine particles efficiently adhere to coarse ones, forming distinguishable agglomerates. In contrast, the 1.5:10 and 2:10 cases display less consistent behavior, with only partial or weak agglomeration. Finally, for the 3:10 ratios (Figure 9f), agglomeration is not evident due to the relatively large binder particles, which hinder capillary bridge formation and limit adequate surface coverage.
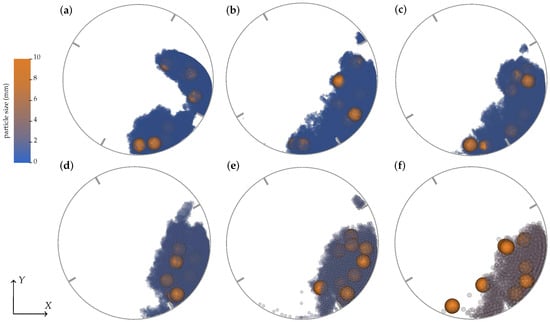
Figure 9.
Snapshots of the DEM simulations for various particle-size ratios: (a) 0.7:10, (b) 0.75:10, (c) 1:10, (d) 1.5:10, (e) 2:10, (f) 3:10.
Figure 10 shows the evolution of the average values of adhesive forces for all simulations. In subplot (a), the average adhesive force over coarse particles is plotted against time. The highest average force is observed for the 0.7:10 ratio, reaching 226.09 mN after stabilization. In subplot (b), adhesive forces are separated into contributions from fine, coarse, and all particles. It is observed that the average adhesion force of all the particles increases as the size of the fine particles increases. By contrast, the average adhesion force of coarse particles decreases with increasing size. This trend is attributed to the reduced number of fine particles at larger diameters (assuming fixed total mass), which increases inter-particle spacing and hence reduces liquid bridge formation, as governed by the particle-separation distance (h) in the liquid bridge model.
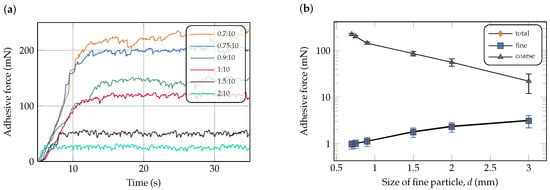
Figure 10.
Effect of particle-size ratio on adhesive force: (a) evolution of the average adhesive normal force of the coarse particles, (b) adhesive force as a function of size of fine particles, disaggregated by particle type.
It is worth noting that, although classical models such as Rumpf’s [34] predict a decrease in cohesive stress with increasing particle size due to scaling effects (e.g., ), these formulations often neglect dynamic factors such as fluid viscosity and contact mechanics. Recent studies [35,36] have emphasized that models based only on static capillary forces cannot accurately capture cohesive behavior in wet agglomerates. The present DEM results highlight that total adhesive force per particle is influenced by local interactions and dynamic conditions and may not follow the trends expected from simplified continuum models.
To evaluate the structural formation of aggregate, the number of coarse-particle–fine-particle adhesive interactions over time was analyzed. Figure 11b presents the average coordination number, considering the contacts of the coarse particles. As expected from the images in Figure 9, lower size ratios result in more adhesive contacts per coarse particle. For instance, the simulation with a 3:10 ratio yields approximately 20 adhesive contacts per coarse particle on average, while lower ratios (0.7:10 and 0.75:10) exhibit higher values of 1218.15 and 1029.43. A temporal analysis of adhesive contact persistence is shown in Figure 11a, where an average histogram of contact duration (between 20 s and 35 s) is presented. The contact duration for each coarse particle of 10 mm is analyzed (11 particles in total), and the averaged values are presented. The 0.7:10 ratio results in the most stable glomerular structure, with 62.6% of neighboring particles maintaining contact for at least 10% of the observed time window.
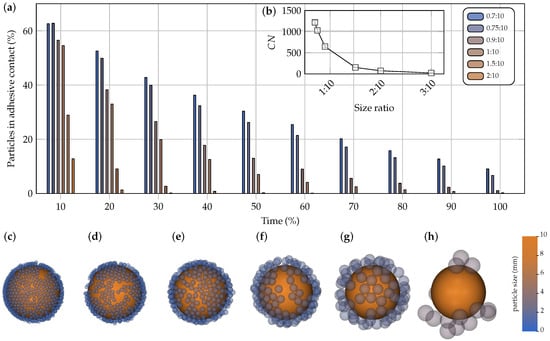
Figure 11.
(a) Histogram of particles maintaining adhesive contact during the final 15 s of the simulation (20–35 s). (b) Average coordination numbers for coarse particles under different size ratios. Images of the final configurations of selected particles of 10 mm and their surroundings: (c) 0.7:10; (d) 0.75:10; (e) 1:10; (f) 1.5:10; (g) 2:10; (h) 3:10; The colormap represents the size of the particles. The relative sizes of the images correspond with the sizes of their particles.
4. Discussion
The numerical results presented in this study provide important insights into the agglomeration behavior of granular materials under varying particle-size distributions in the context of wet granulation with liquid bridge interactions. The results demonstrate that the presence of coarse particles, in combination with fine ones, is critical for promoting the formation of agglomerates within an agglomerating drum, agreement with Wang et al. [14]. These coarse particles act as nuclei around which fine particles aggregate, enhancing the structural integrity of the agglomerates. By contrast, systems composed exclusively of fine particles develop weak and transient contacts that prevent the formation of stable agglomerates. This observation supports the hypothesis that agglomeration is not driven solely by liquid content or adhesive potential, but by the spatial arrangement and hierarchical structure of the particles involved.
The adhesive-force analysis further clarified this phenomenon. While the adhesive force among fine particles remained relatively constant across different particle-size distributions, simulations with increasing showed a substantial increase in total adhesive force. This effect was attributed to the formation of liquid bridges involving coarse particles, which sustain larger liquid bridge forces due to their larger radii and greater surface-contact areas. These adhesive forces stabilized shortly after liquid injection and remained steady during the simulation, indicating rapid establishment of cohesive networks.
However, instantaneous coordination metrics are insufficient to characterize the full dynamics of agglomerate formation. Agglomeration is inherently a time-dependent process. In experimental setups, especially at the laboratory scale, agglomeration typically evolves over a period ranging from 1 to 10 min [37,38]. In DEM simulations, replicating such timescales is computationally intensive. Here, by evaluating the persistence of adhesive contacts and monitoring agglomerate size, we identified parameters that predict long-term structure from early-time behavior, enabling the finding of meaningful results at reduced computational cost. Although the numerical results are not fully conclusive—since ideally most contacts should persist and not fewer than 20% should survive during agglomeration—the proposed methodology provides a solid basis for quantifying glomerule development with the liquid bridge model in agglomerating drums.
It should also be emphasized that adhesive properties depend on the granular material and liquid characteristics. Parameters such as surface tension, contact angle, and viscosity strongly influence adhesion, and variation in these values may lead to different outcomes. On the other hand, the influence of operational parameters, such as filling level (see Supplementary File) and operating speed, significantly affect the interaction of particles and therefore the formation of agglomerates. Moreover, agglomeration is a multiphase phenomenon and can also be affected by electrostatic, van der Waals, and hydrophobic forces [39], which should be considered in future studies.
Although the present work focuses on laboratory-scale conditions, the observed trends regarding particle-size distribution are expected to extend to industrial systems [38]. Parameters such as contact frequency, particle cohesion, and distribution uniformity are relevant at both scales. However, rigorous quantitative extrapolation will require scaling laws or dimensionless groups. In the case of industrial-scale agglomerating drums, the formation of agglomerates typically promotes clumping through coalescence of fine particles without a central nucleus. Modeling these systems poses significant challenges, especially considering the elevated mass-flow rates and the large numbers of fine particles involved. These conditions drastically increase computational requirements for DEM simulations. To address this, it is essential to explore strategies that reduce the number of simulated particles while preserving physical accuracy [40]. These may include coarse-graining, population balance models coupled with DEM, or simplified interaction rules for glomerule representation.
5. Conclusions
This study investigated the influence of particle-size distribution on agglomeration behavior in an agglomerating drum using the discrete element method with a liquid bridge model. The results show that a wide particle-size distribution, particularly one that includes coarse particles, is essential for effective formation of agglomerates. In monodisperse or fine-only systems, agglomeration was found to be diffuse and structurally unstable, with adhesive contacts that break down over time. In contrast, the presence of coarse particles promoted the formation of well-defined agglomerates, as fine particles adhered to their surfaces via capillary forces.
Adhesive-force analyses revealed that coarse particles hold the bonds together due to their greater adhesive force, while fine particles exhibited relatively uniform and weaker interactions. Furthermore, persistent contact tracking demonstrated that only large particles retained significant adhesive interactions over time, confirming their central role in sustaining agglomerate formation.
Supplementary Materials
The following supporting information can be downloaded at:
https://www.mdpi.com/article/10.3390/min15101033/s1, Figure S1: Snapshot of the DEM simulation with mm and a total particle mass of 0.161 kg.; Figure S2: Histogram of particles maintaining adhesive contact during the final 15 s of simulation (20–35 s) of the simulation with = 10 mm and total particle mass of 0.161 kg.
Author Contributions
Conceptualization, M.M., C.H. and P.T.; methodology, M.M., C.H. and P.T.; software, M.M., C.H. and P.T.; validation, M.M., P.T., C.G.R. and F.B.; formal analysis, M.M., C.G.R. and F.B.; investigation, M.M., C.G.R. and P.T.; resources, M.M.; data curation, M.M. and C.H.; writing–original draft preparation, M.M., C.H. and P.T.; writing–review and editing, M.M., C.H., C.G.R. and F.B.; visualization, M.M.; supervision, C.G.R. and F.B.; project administration, M.M., C.G.R. and F.B.; funding acquisition, M.M. and F.B. All authors have read and agreed to the published version of the manuscript.
Funding
M. Moncada acknowledges partial support from Fondecyt Iniciación grant No. 11251676. P. Toledo acknowledges funding by the National Agency for Research and Development (ANID) Doctorado Nacional 2023-21230407. F. Betancourt acknowledges support by ANID/FONDAP/15130015, ANID/FONDAP/1523A0001 and ANID/ACT210030.
Data Availability Statement
Dataset available on request from the authors.
Conflicts of Interest
The authors declare no conflicts of interest.
References
- Bouffard, S.C. Review of agglomeration practice and fundamentals in heap leaching. Miner. Process. Extr. Metall. Rev. 2005, 26, 233–294. [Google Scholar] [CrossRef]
- Robertson, S.; Basson, P.; Brill, S.; van Staden, P.; Petersen, J. Properties governing the flow of solution through crushed ore for heap leaching: Part III—Low-permeability ores. Hydrometallurgy 2024, 224, 106247. [Google Scholar] [CrossRef]
- Guzman, A.; Korsikas, S.S.; Olson, T.; Zepeda P., Y.O. Agglomeration Scale: A Method to Improve Leaching Performance. Min. Metall. Explor. 2024, 41, 501–514. [Google Scholar] [CrossRef]
- Urtubia, R.; Suárez, F. Stochastic representation of the agglomeration process: Implications on the saturation variability in a dynamic heap leach. Hydrometallurgy 2020, 191, 105158. [Google Scholar] [CrossRef]
- Xu, N.; Yu, C.; Gong, S.; Zhao, G.; Lin, D.; Wang, X. Numerical study and multi-objective optimization of flexible screening process of flip-flow screen: A DEM-FEM approach. Adv. Powder Technol. 2022, 33, 103650. [Google Scholar] [CrossRef]
- Xu, N.; Wang, X.; Lin, D.; Zuo, W. Numerical Simulation and Optimization of Screening Process for Vibrating Flip-Flow Screen Based on Discrete Element Method–Finite Element Method–Multi-Body Dynamics Coupling Method. Minerals 2024, 14, 278. [Google Scholar] [CrossRef]
- Gu, R.; Wu, W.; Zhao, S.; Xing, H.; Qin, Z. Simulation and Parameter Optimisation of Edge Effect in Ore Minerals Roll Crushing Process Based on Discrete Element Method. Minerals 2025, 15, 89. [Google Scholar] [CrossRef]
- Fletcher, D.F. The future of computational fluid dynamics (CFD) simulation in the chemical process industries. Chem. Eng. Res. Des. 2022, 187, 299–305. [Google Scholar] [CrossRef]
- Larsson, S.; Rodríguez Prieto, J.M.; Heiskari, H.; Jonsén, P. A Novel Particle-Based Approach for Modeling a Wet Vertical Stirred Media Mill. Minerals 2021, 11, 55. [Google Scholar] [CrossRef]
- Mishra, B.; Thornton, C.; Bhimji, D. A preliminary numerical investigation of agglomeration in a rotary drum. Miner. Eng. 2002, 15, 27–33. [Google Scholar] [CrossRef]
- Liu, P.Y.; Yang, R.Y.; Yu, A.B. Dynamics of wet particles in rotating drums: Effect of liquid surface tension. Phys. Fluids 2011, 23, 013304. [Google Scholar] [CrossRef]
- Trung Vo, T.; Nezamabadi, S.; Mutabaruka, P.; Delenne, J.Y.; Izard, E.; Pellenq, R.; Radjai, F. Agglomeration of wet particles in dense granular flows. Eur. Phys. J. E 2019, 42, 127. [Google Scholar] [CrossRef] [PubMed]
- Shi, X.; Li, C.; Wang, Q.; Li, G.; Zhang, W.; Xue, Z. Numerical study of the dynamic behaviour of iron ore particles during wet granulation process using discrete element method. Powder Technol. 2022, 401, 117296. [Google Scholar] [CrossRef]
- Wang, Y.; Xu, J.; He, S.; Liu, S.; Zhou, Z. Numerical simulation of particle mixing and granulation performance in rotating drums during the iron ore sintering process. Powder Technol. 2023, 429, 118890. [Google Scholar] [CrossRef]
- Wang, Y.; Xu, J.; He, S.; Liu, S.; Zhou, Z. Effect of nuclei particle shape and baffle setting on the drum granulation in iron ore sintering process. Powder Technol. 2024, 433, 119222. [Google Scholar] [CrossRef]
- Oyegbile, B.; Akdogan, G.; Karimi, M. Experimental and CFD Studies of the Hydrodynamics in Wet Agglomeration Process. ChemEngineering 2018, 2, 32. [Google Scholar] [CrossRef]
- Dhawan, N.; Rashidi, S.; Rajamani, R.K. Population Balance Model for Crushed Ore Agglomeration for Heap Leach Operations. KONA Powder Part. J. 2014, 31, 200–213. [Google Scholar] [CrossRef][Green Version]
- Barrasso, D.; Ramachandran, R. Multi-scale modeling of granulation processes: Bi-directional coupling of PBM with DEM via collision frequencies. Chem. Eng. Res. Des. 2015, 93, 304–317. [Google Scholar] [CrossRef]
- Nakamura, H.; Baba, T.; Ohsaki, S.; Watano, S.; Takehara, K.; Higuchi, T. Numerical simulation of wet granulation using the DEM–PBM coupling method with a deterministically calculated agglomeration kernel. Chem. Eng. J. 2022, 450, 138298. [Google Scholar] [CrossRef]
- Maharjan, R.; Jeong, S.H. High shear seeded granulation: Its preparation mechanism, formulation, process, evaluation, and mathematical simulation. Powder Technol. 2020, 366, 667–688. [Google Scholar] [CrossRef]
- Wan, Z.; Yang, S.; Hu, J.; Wang, H. DEM analysis of flow dynamics of cohesive particles in a rotating drum. Adv. Powder Technol. 2024, 35, 104379. [Google Scholar] [CrossRef]
- Gómez, R.; Castro, R.L.; Casali, A.; Palma, S.; Hekmat, A. A Comminution Model for Secondary Fragmentation Assessment for Block Caving. Rock Mech. Rock Eng. 2017, 50, 3073–3084. [Google Scholar] [CrossRef]
- Moncada, M.; Rojas, C.; Toledo, P.; Rodríguez, C.G.; Betancourt, F. Influence of Particle Shape and Size on Gyratory Crusher Simulations Using the Discrete Element Method. Minerals 2025, 15, 232. [Google Scholar] [CrossRef]
- Toledo M., P.; Moncada M., M.; Ruiz S., C.; Betancourt C., F.; Rodríguez, C.G.; Vicuña, C. A review of the application of the discrete element method in comminution circuits. Powder Technol. 2025, 459, 121027. [Google Scholar] [CrossRef]
- Di Renzo, A.; Di Maio, F.P. Comparison of contact-force models for the simulation of collisions in DEM-based granular flow codes. Chem. Eng. Sci. 2004, 59, 525–541. [Google Scholar] [CrossRef]
- Mindlin, R.D.; Deresiewicz, H. Elastic Spheres in Contact Under Varying Oblique Forces. J. Appl. Mech. 1953, 20, 327–344. [Google Scholar] [CrossRef]
- Cui, H.; Zhao, H.; Ji, S.; Zhang, X.; Awadalseed, W.; Tang, H. A machine learning model of liquid bridge force and its application in discrete element method. Constr. Build. Mater. 2024, 411, 134174. [Google Scholar] [CrossRef]
- Mikami, T.; Kamiya, H.; Horio, M. Numerical simulation of cohesive powder behavior in a fluidized bed. Chem. Eng. Sci. 1998, 53, 1927–1940. [Google Scholar] [CrossRef]
- Nase, S.T.; Vargas, W.L.; Abatan, A.A.; McCarthy, J. Discrete characterization tools for cohesive granular material. Powder Technol. 2001, 116, 214–223. [Google Scholar] [CrossRef]
- Moncada, M.; Betancourt, F.; Rodríguez, C.G.; Toledo, P. Effect of Particle Shape on Parameter Calibration for a Discrete Element Model for Mining Applications. Minerals 2022, 13, 40. [Google Scholar] [CrossRef]
- Adesina, P.; O’Sullivan, C.; Wang, T. DEM study on the effect of particle shape on the shear behaviour of granular materials. Comput. Part. Mech. 2023, 11, 447–466. [Google Scholar] [CrossRef]
- Costa, F.d.A.; Barrios, G.K.P.; Fidalgo, A.P.; Tino, A.A.A.; Tavares, L.M. Modeling Shapes of Coarse Particles for DEM Simulations Using Polyhedral Meta-Particles. Minerals 2025, 15, 103. [Google Scholar] [CrossRef]
- Deshpande, R.; Mahiques, E.; Wirtz, S.; Scherer, V. Resolving particle shape in DEM simulations from tabulated geometry information. Powder Technol. 2022, 407, 117700. [Google Scholar] [CrossRef]
- Rumpf, H. The Strength of Granules and Agglomerates. In Agglomeration; Interscience: New York, NY, USA, 1962; pp. 379–418. [Google Scholar]
- Iveson, S.M.; Litster, J.D.; Hapgood, K.; Ennis, B.J. Nucleation, growth and breakage phenomena in agitated wet granulation processes: A review. Powder Technol. 2001, 117, 3–39. [Google Scholar] [CrossRef]
- Mitarai, N.; Nori, F. Wet granular materials. Adv. Phys. 2006, 55, 1–45. [Google Scholar] [CrossRef]
- Nosrati, A.; Addai-Mensah, J.; Robinson, D.J. Drum agglomeration behavior of nickel laterite ore: Effect of process variables. Hydrometallurgy 2012, 125–126, 90–99. [Google Scholar] [CrossRef]
- Adam, M.; Addai-Mensah, J.; Begelhole, J.; Asamoah, R.K.; Skinner, W. The Influence of Drum Operating Parameters on Granulation and Product Attributes. Minerals 2025, 15, 224. [Google Scholar] [CrossRef]
- Chang, Z.; Niu, S.; Shen, Z.; Zou, L.; Wang, H. Latest advances and progress in the microbubble flotation of fine minerals: Microbubble preparation, equipment, and applications. Int. J. Miner. Metall. Mater. 2023, 30, 1244–1260. [Google Scholar] [CrossRef]
- Scheffler, O.C.; Coetzee, C.J. Discrete Element Modelling of a Bulk Cohesive Material Discharging from a Conveyor Belt onto an Impact Plate. Minerals 2023, 13, 1501. [Google Scholar] [CrossRef]
Disclaimer/Publisher’s Note: The statements, opinions and data contained in all publications are solely those of the individual author(s) and contributor(s) and not of MDPI and/or the editor(s). MDPI and/or the editor(s) disclaim responsibility for any injury to people or property resulting from any ideas, methods, instructions or products referred to in the content. |
© 2025 by the authors. Licensee MDPI, Basel, Switzerland. This article is an open access article distributed under the terms and conditions of the Creative Commons Attribution (CC BY) license (https://creativecommons.org/licenses/by/4.0/).