Article

Preparation of High-Purity Quartz by Roasting–Water Quenching and Ultrasound-Assisted Acid Leaching Process

1
State Key Laboratory of Chemistry and Utilization of Carbon Based Energy Resources, College of Chemistry, Xinjiang University, Urumqi 830017, China
2
College of Civil Engineering and Architecture, Xinjiang University, Urumqi 830017, China
3
College of Chemical Engineering, Xinjiang University, Urumqi 830017, China
4
Xinjiang Zijin Zinc Industry Co., Ltd., Kizilsu Kirghiz 845350, China
*
Authors to whom correspondence should be addressed.
Minerals 2025, 15(10), 1028; https://doi.org/10.3390/min15101028
Submission received: 1 September 2025 / Revised: 21 September 2025 / Accepted: 26 September 2025 / Published: 28 September 2025

Abstract

High-purity quartz is a key material for photovoltaics, semiconductors, and optical fibers. The raw material for high-purity quartz mainly comes from natural crystal and pegmatite. It is an attractive research field to excavate alternative feedstocks for traditional materials. Quartz conglomerate is a coarse-grained, clastic sedimentary rock that is cemented by a secondary silica or siliceous matrix. Economically, quartz conglomerate is gaining attention as a strategic alternative to depleting high-grade quartz veins and pegmatites. In this study, high-purity quartz was prepared by purifying quartz conglomerate from Jimunai, Altay, Xinjiang. The method combined high-temperature roasting, water quenching, and ultrasonic-assisted acid leaching. The effects of process parameters on purification efficiency were systematically investigated with the aid of XRD, SEM-EDS, and ICP-OES quantitative element detection. Many cracks formed on the quartz during roasting and quenching. These cracks exposed gap-filling impurities. Gas–liquid inclusions were removed, improving acid leaching. Under optimal ultrasonic-assisted acid leaching conditions (80 °C, 4 h, 10% oxalic acid + 12% hydrochloric acid, 180 W), the Fe content decreased to 6.95 mg/kg, with an 85.6% removal rate. The total impurity content decreased to 210.43 mg/kg. The SiO2 grade increased from 99.77% to 99.98%. Compared to traditional acid leaching, ultrasonic-assisted acid leaching improved Fe removal and reduced environmental pollution.

1. Introduction

As one of the most widely distributed minerals in nature, quartz is mainly composed of SiO2, which belongs to the trigonal crystal system of sheet-like silicate minerals [1,2,3]. With its excellent physical and chemical properties, quartz is irreplaceable in the fields of photovoltaics, semiconductors, optical fibers, and advanced optical devices [4]. Driven by the exponential growth of high-tech sectors, the global demand for high-purity quartz (≥99.9% SiO2) has surged, particularly for monocrystalline silicon ingots, photovoltaic cells, integrated circuits, and quartz crucibles, where impurity tolerances approach the parts-per-million level [5,6]. However, natural quartz is ubiquitously tainted by trace elements (Fe, Al, Ti, Li) and abundant fluid inclusions, whose presence markedly compromises thermal stability, optical transmittance, and dielectric performance [7,8,9]. Consequently, the development of a highly efficient, environmentally benign purification route to ultra-pure quartz remains a pivotal challenge in contemporary materials science.
Quartz predominantly contains iron and aluminum as primary impurities, exhibiting fundamentally distinct geochemical origins and structural incorporation patterns [10]. Fe impurities mostly exist in the form of independent mineral phases, such as hematite (Fe2O3), goethite (FeOOH), magnetite (Fe3O4), and other fine particles, which often exist in the micro-cracks and surface of quartz, which are the main factors causing the deterioration of quartz’s optical properties [11,12]. The Al impurities in quartz mainly come from the weathering residues or hydrothermal alteration products of aluminosilicate minerals such as feldspar and mica, and some Al3+ exists in the form of a homogeneous form—that is, Al3+ replaces Si4+ in the quartz lattice through ion substitution, and this lattice defect will significantly affect the electrical properties of quartz [13]. When impurities exist in large quantities in the form of inclusions or lattice substitution, it is often difficult for traditional physical purification methods (such as magnetic separation [14], flotation [15], etc.) to meet the purity requirements of high-purity quartz, and chemical purification methods such as acid leaching [16,17,18] and high-temperature chlorination must be relied on [19]. Among them, there are significant differences in the removal efficiency, cost, and environmental impact of Fe impurities in quartz by different methods. The best purification process needs to be selected according to the occurrence form of Fe and the terminal application requirements of quartz. While removing Fe efficiently, it is also necessary to balance economic benefits and environmental friendliness, thereby promoting the green and sustainable development of high-purity quartz.
In recent years, significant progress has been made in the research of high-purity quartz purification technology, and various innovative methods have demonstrated advantages in impurity removal efficiency and environmental friendliness. Xiong Kang et al. [20] employed a mixed HCl and HF leaching system to remove impurity minerals from quartz, achieving remarkable removal efficiencies of 95.52% for Fe, 94.89% for Al, 83.16% for Mg, 96.71% for K, and 35.55% for Na. This treatment reduced the total impurity content to 40.71 mg/kg, with an overall removal rate of 91.11%, ultimately yielding quartz with a purity of 99.993% SiO2, which meets high-purity quartz standards. Tuncuk A et al. [21] used H2SO4 and H2C2O4 mixed acid leaching to remove Fe impurities, and the removal rate of Fe2O3 in quartz reached 86.6%, and the Fe2O3 content in the product was 11.8 mg/kg after treatment at 1:10 and 90 °C for 120 min. Shao et al. [22] prepared high-purity quartz by an alkali corrosion acid leaching process, and the quartz was first reacted with 12% NaOH at 200 °C for 100 min and then leached with 4 mol/L HCl, 1 mol/LHNO3, and 0.25 mol/L HF at 200 °C for 5 h. The content of impurity elements decreased from 73.63 mg/kg to 38.85 mg/kg, the total removal rate of impurities was 47.21%, and the purity of SiO2 could reach 99.994%, reaching the standards of high-purity quartz. Wu Xiao et al. [23] used NH4Cl as the chlorinating agent to obtain quartz concentrate with an impurity element content of 31.07 × 10⁻⁶ mg/kg under chlorination roasting conditions at 600 °C and 180 min. Although the combination of various acids can significantly remove Fe impurities, a portion of Fe still remains in the matrix. To improve the removal efficiency of Fe in quartz, roasting–water quenching is introduced before acid leaching. In addition, ultrasound has been widely used in various industries as an adjunct method [24].
In this paper, a quartz conglomerate in Xinjiang was taken as the research object, and analytical techniques such as XRD phase analysis, SEM-EDS microscopic morphology characterization analysis, and ICP-OES element quantitative detection were adopted. The effect of high-temperature roasting on quartz purification was emphatically explored, and compared with the traditional process, the synergistic effect of roasting, water quenching, and ultrasonic-assisted acid leaching significantly improved the removal rate of Fe impurities. The use of environmentally friendly acids, such as oxalic acid and hydrochloric acid, instead of hydrofluoric acid effectively reduces environmental pollution and acid dosage. This approach provides theoretical guidance for the green and efficient purification of high-purity quartz, as well as a theoretical basis and technical support for the effective removal of Fe impurities.

2. Materials and Methods

2.1. Materials

The quartz conglomerates used in this study were collected from the Altaji Muno Quartz Conglomerate in Xinjiang, China, which is a sedimentary rock. The ore exhibits good transparency and a dense and hard texture, and its SiO2 content is 99.77% according to preliminary analysis, indicating potential for the development of high-purity quartz raw materials. The samples were first crushed using a crusher and a ball mill and then sieved through a nylon standard sieve to obtain a quartz sample with a particle size of 106–212 μm. This sample was then subjected to physical purification processes, including magnetic separation and flotation. In this study, the flotation concentrate was used as raw material for further purification by roasting and acid leaching. The oxalic acid and hydrochloric acid used in the acid leaching process are all analytically pure (Sinopharm Chemical Reagent Co., Ltd., Shanghai, China). Deionized water was used for solution preparation and water quenching.

2.2. Experimental Procedure

2.2.1. Raw Material Pretreatment

The sieved quartz ore sample was subjected to magnetic separation to remove Fe. The slurry flow rate was 15 mL/s, and the magnetic induction intensity was 3500 Gs. After separation, quartz underwent flotation experiments at a pH of 2.0 to 3.0. The collector combined dodecamine and sodium petroleum sulfonate (in a 1:1 molar ratio, 150 g/t), with 750 g/t oxalic acid serving as the inhibitor. The slurry was adjusted for 2 min and then floated for 5 min. The product was rinsed repeatedly with distilled water until it was neutral, and then it was dried at 105 °C. The impurity content in the quartz concentrate was then determined by ICP-OES.

2.2.2. Roasting and Acid Leaching Experiments

The flotation-processed quartz concentrate was calcined in a muffle furnace at 600 °C, 900 °C, and 1200 °C for 2.5 h each, the initial temperature was set at 25 °C, the rate was 10 °C/min, and the sample was quickly poured into ultra-pure water at 10 ± 2 °C for water quenching. At this point, significant thermal stress is generated, causing micro-cracks to form within the quartz particles. This fully exposes the previously encapsulated impurities, creating diffusion pathways for subsequent ultrasonic-assisted acid leaching. This process efficiently dissolves impurity ions. Finally, the supernatant is discarded, and the remaining powder is dried at 105 °C for later use. Place 10 g of quartz sample calcined at 900 °C into a 250 mL conical flask, then add 50 mL of mixed acid solution. The reaction was conducted under constant temperature conditions (50~90 °C) for a specified duration. To enhance leaching efficiency, ultrasonic assistance was applied at varying power levels during the process. Finally, the acid-leached sample was rinsed to neutrality and dried. A schematic diagram of the experimental setup is shown in Figure 1. ICP-OES was used to determine the content of impurity elements in the acid leaching product, and the removal rate of Fe was calculated. All experiments were repeated three times, and the average was taken as the final result. Equation (1) was used to compute the removal rate of Fe:
η = 1 β α × 100 %
where η is the % Fe removed, β is the amount of Fe in the leaching product sample (mg/kg), and α is the content of Fe in the quartz after roasting (mg/kg).

2.3. Equipment and Characterization

The sample was ground in a wet mill (Anhui Bojin Chemical Machinery Co., Ltd., Hefei, China) at a speed of 800 r/min. High-temperature roasting was conducted in a muffle furnace (SX2-2.5-12A), and ultrasonic equipment was a KQ5200DE-type CNC ultrasonic cleaner (Kunshan Ultrasonic Instrument Co., Ltd., Suzhou, China).
The crystalline phase of quartz was determined by X-ray diffraction (XRD, Bruker D8) using Cu Kα radiation, with a 2θ range of 5° to 80° and a scanning speed of 10°/min. The main elemental oxides in quartz were determined by X-ray fluorescence spectroscopy (XRF, Bruker, Bremen, Germany). Fourier transform infrared absorption spectrometry (FTIR, Great 10, Tianjin, China) was used to qualitatively determine the content of gas–liquid inclusions in quartz, and the scanning range was 4000~100 cm−1. The surface morphology of quartz was observed by a Hitachi S-4800 (Hitachi, Beijing, China) series scanning electron microscope (SEM). The phase transition temperature of the quartz ore was investigated by thermogravimetry and differential scanning calorimetry (TG–DSC), which heated the samples from room temperature to 1400 °C in an air atmosphere at a heating rate of 10 °C/min. Inductively coupled plasma optical emission spectrometry (ICP-OES) was used to determine the content of impurity elements in quartz.

3. Results and Discussion

3.1. Characterization of Quartz Conglomerate Ore

The content of the impurity elements in the quartz ore was determined by ICP-OES, as shown in Table 1, from which it can be seen that the main impurity elements (>100 mg/kg) in the quartz ore included Fe, Al, Na, Mg, K, etc. As can be seen from Figure 2a,b, the surface of the quartz ore is relatively clean and does not contain a large amount of colored impurities. XRD analysis revealed no peaks except for the quartz peak [SiO2 PDF# 98-000-0369]; therefore, the raw ore was relatively pure. However, owing to the detection limit of the XRD analysis, this does not guarantee that the quartz was free of other impurities. The hydroxyl group (–OH) appears as a signal in the FTIR spectrum in the wavenumber range of 3000–3700 cm−1 [16]. A small amount of the hydroxyl group is noticeable in the spectrum of the raw ore in Figure 2c, which can be expected to be removed during the purification treatment [25].
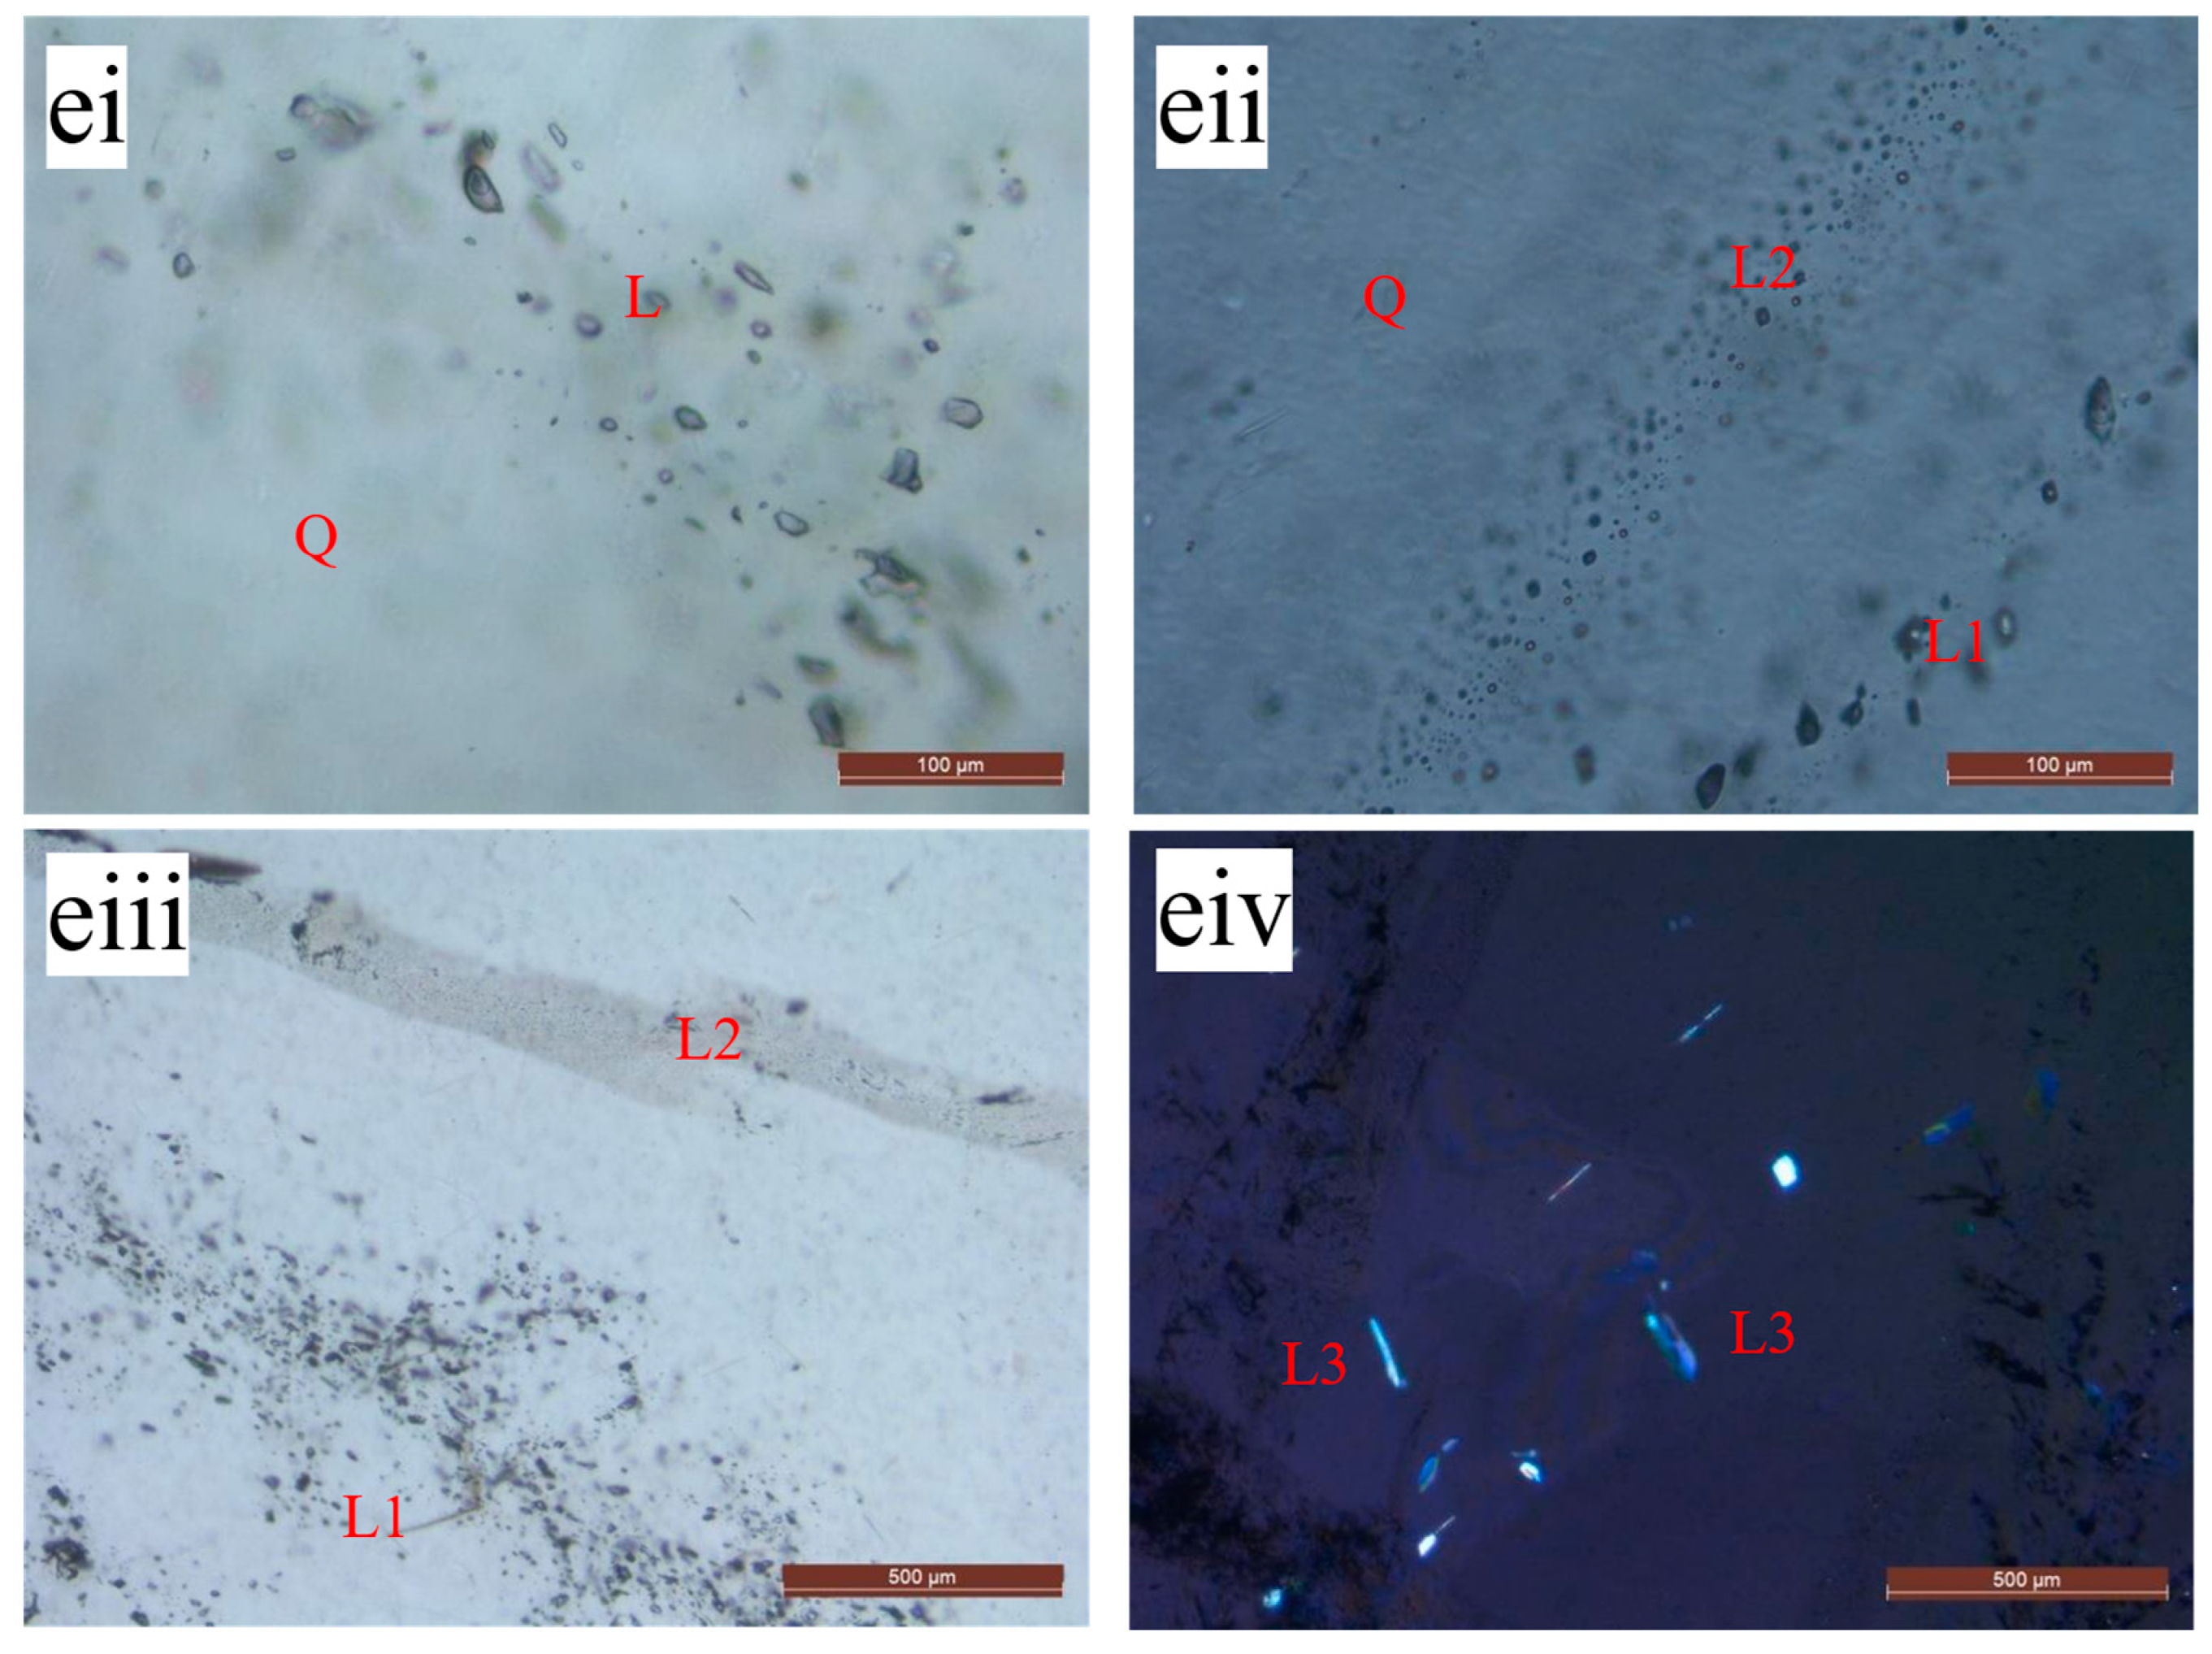
The TG–DSC analysis of the quartz conglomerate raw ore samples is shown in Figure 2d. When the temperature reaches 573.5 °C, there is a sharp endothermic peak in the DSC curve, which is due to the reversible phase transition from α-quartz to β-quartz at about 573.5 °C, and when the temperature rises to 857.1 °C, the DSC curve shows that it begins to absorb heat continuously, which is due to the transformation of β-quartz into β-leitmoclite when the temperature reaches 857.1 °C, and the crystal structure of the two is quite different. This transition process will absorb a lot of heat and consume more time, and when the temperature is greater than 1015.6 °C, the DSC curve continues to rise, and the quartz sample absorbs heat, which is the result of the energy consumption when the β-letimoquartz is transformed into β-cristobalite [26]. From the TG curve, it can be seen that from 541.9 °C, the weight of the quartz shows an obvious continuous weightlessness, which is due to the high-temperature decomposition of carbonate and sulfate in quartz, and, on the other hand, it is mainly due to the escape of the adsorbed water on the surface of the quartz and the silicon hydroxyl group (Si-OH) in the structure when heated [27]. Many fluid inclusions were found in the raw material by observing inclusion slices using a polarized light microscope. Figure 2(ei–eiii) shows that the inclusions exhibit two distinct distribution patterns: banded (L1) and dispersed (L2). In addition, Figure 2(eiv) shows that various mineral inclusions (L3) have developed inside the quartz.

3.2. Research on Impurity Removal Effect of Quartz by Roasting

3.2.1. Effect of Roasting on Crystal Structure of Quartz

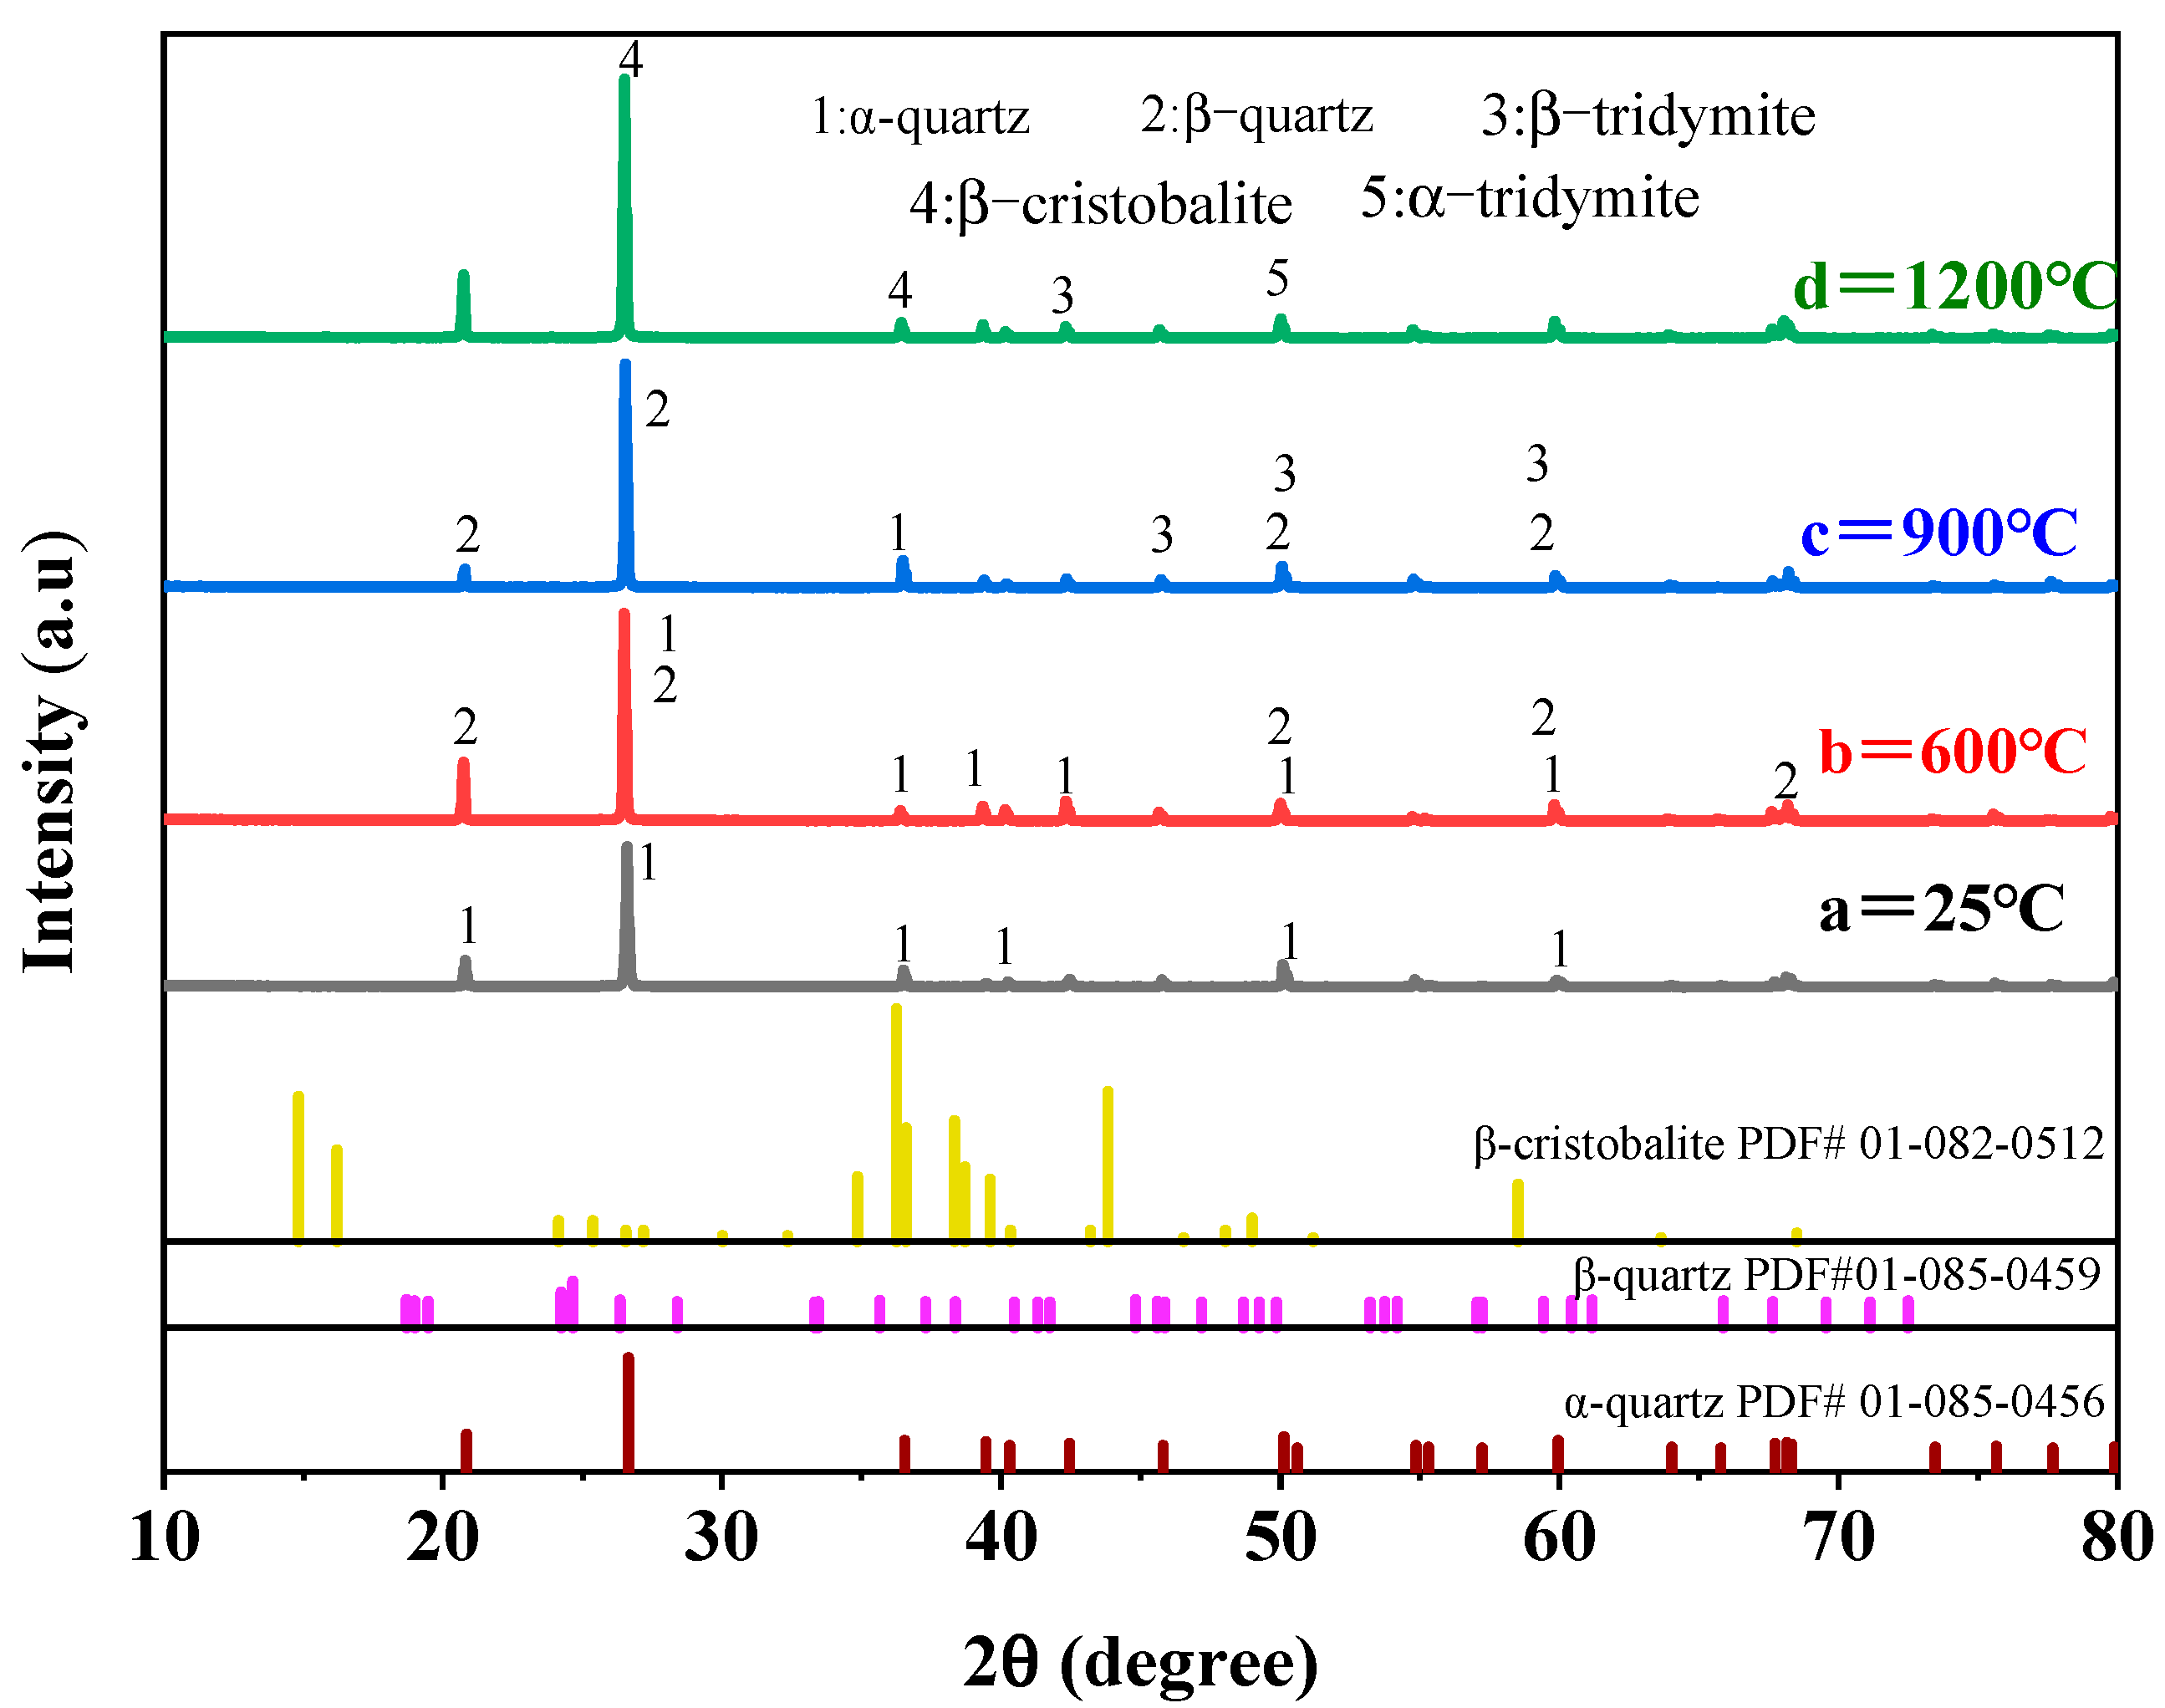
According to the TG–DSC analysis curve of the quartz conglomerate ore in Section 3.1, XRD analysis was carried out on the quartz conglomerate ore and the samples roasted at different temperatures (600 °C, 900 °C, 1200 °C) with water quenching after holding for 2.5 h. As shown in Figure 3, the quartz underwent a transformation from a low-temperature state to a high-temperature state during calcination at three distinct temperatures. Water quenching significantly influenced the phase transition behavior and crystal structural integrity of the quartz [28]. The primary phase of the 600 °C calcined sample remained α-SiO2. Although 573 °C represents the equilibrium phase transition point between α-quartz and β-quartz, rendering β-quartz thermodynamically stable above this temperature, the phase transformation is reconstructive in nature. It requires substantial energy and an extended duration. Consequently, only a partial phase conversion occurred after holding at 600 °C for 2.5 h. During water quenching, the converted β-quartz phase reversibly transformed back to α-quartz. Compared with the original quartz pattern, the XRD pattern shows no systematic shift in diffraction peak positions, indicating no abrupt change in lattice constants. The half-width at half-maximum of the primary diffraction peak at 26.6° (101) has slightly increased, and the peak shape has broadened slightly [29]. After calcination at 900 °C followed by water quenching, the primary phase in the sample was β-quartz, though trace amounts of tridymite began to form. The diffraction peaks of β-quartz remain clearly visible, with a very faint, broadened shoulder peak appearing near 21.8–22.0° (2θ)—the position of tridymite’s main diffraction peak. Further heating to 1200 °C resulted in significant changes to the phase composition. The original β-quartz diffraction peak in the XRD pattern completely disappeared, and a distinct double peak characteristic of quartz appeared in the range of 2θ = 21.8–22.3°, highly consistent with the quartz standard card. This result indicates that the 1200 °C treatment triggered a complete phase transformation, generating a large amount of quartz accompanied by the formation of a partial amorphous phase, with the original quartz structure being completely altered [30].

3.2.2. Effect of Roasting on Morphology of Quartz

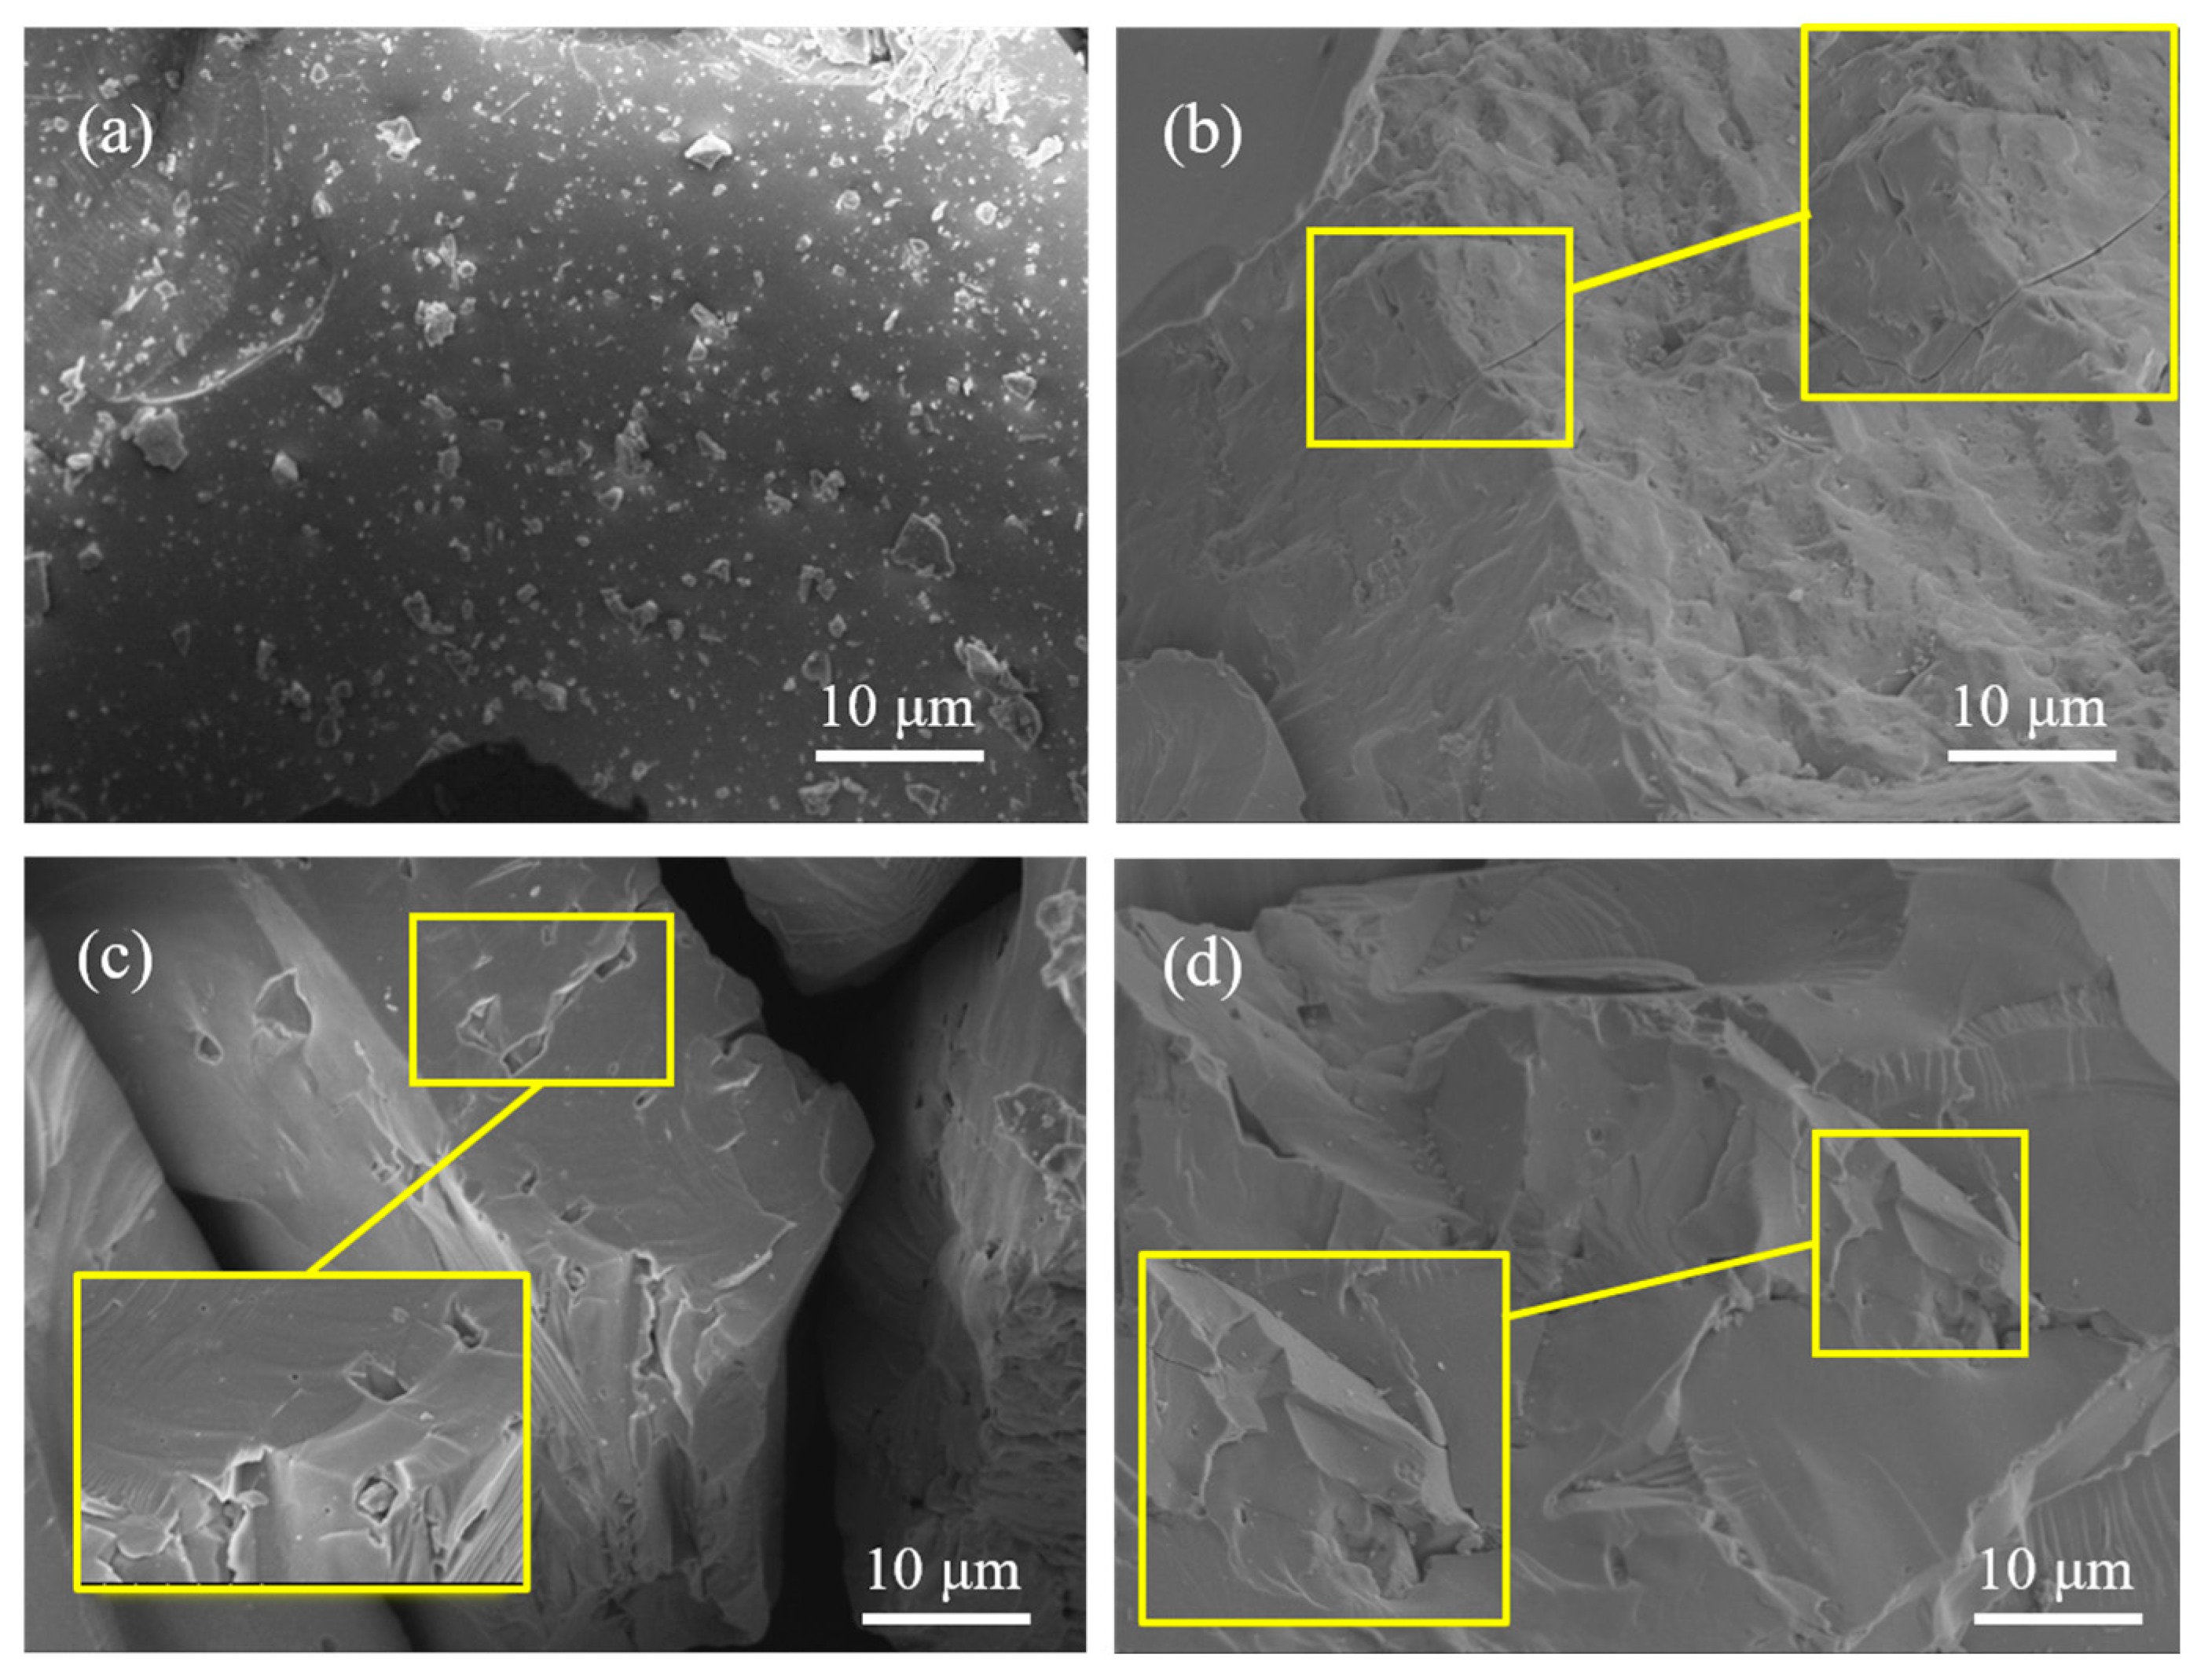
SEM analysis was performed on the quenched quartz samples at 600 °C, 900 °C, and 1200 °C, as shown in Figure 4. The surface of the quartz ore shows subtle undulations and is concave and convex, and the overall shape of the quartz particles remains roughly unchanged, as shown in Figure 4b, after 600 °C roasting–water quenching, but there are tiny cracks and defective corrosion pits on the surface of the quartz crystal, which are relatively fine and relatively sparsely distributed. This is due to the fact that when the temperature reaches 600 °C, thermal stress begins to occur within the quartz crystal, resulting in significant differences in the coefficient of thermal expansion in different directions within the crystal [31]. It can be seen from Figure 4c that after the 900 °C high-temperature roasting–water quenching treatment, the surface roughness of the quartz particles increases significantly, the edges and corners are partially broken due to crack expansion, and the number of cracks and pits on the quartz surface increases significantly, which is conducive to the subsequent acid leaching solution entering the quartz particles. As can be seen from Figure 4d, the quartz cracks did not increase significantly after 1200 °C roasting–water quenching, and the quartz particles showed a broken and loose phenomenon, and the surface showed porous structural characteristics, which was due to the destruction of the internal crystal structure and the migration of materials, resulting in the formation of pores in some areas [32].

3.2.3. Effect of Roasting on Fluid Inclusion Removal in Quartz

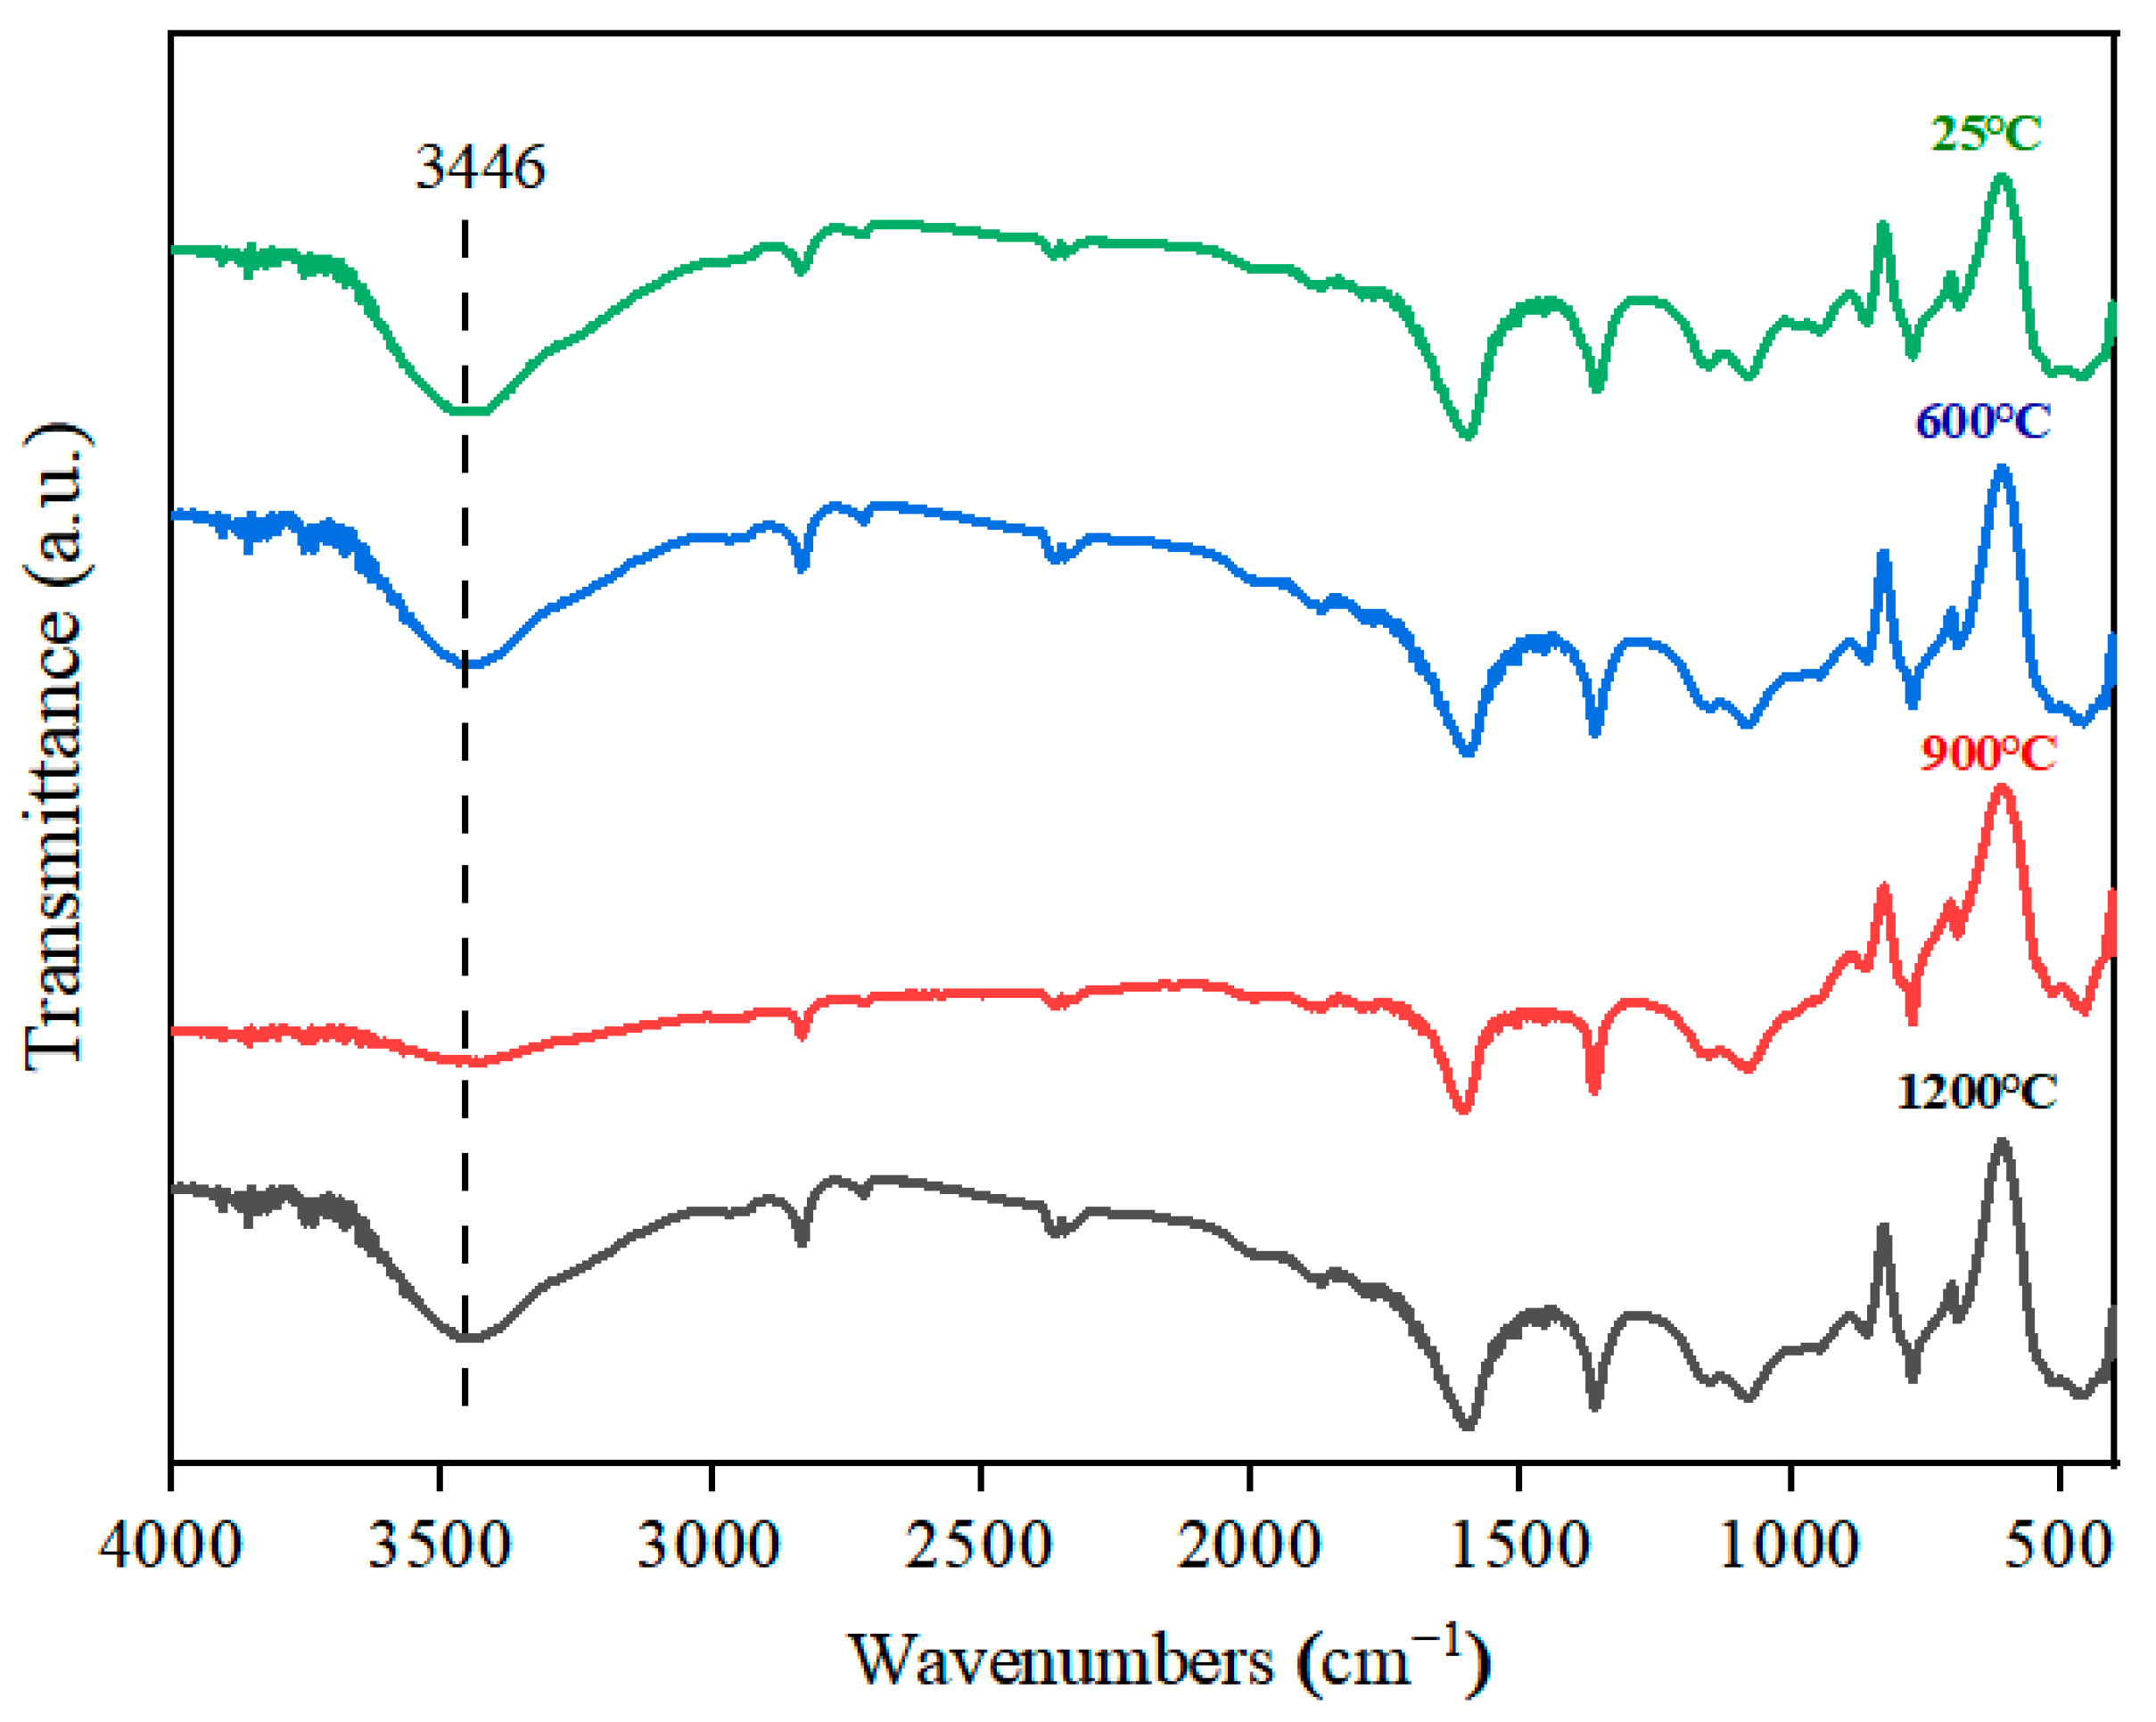
The water in quartz exists in two forms: One is adsorbed water, which is physically adsorbed on the surface or pores of quartz and is not chemically bonded to the quartz structure. The other is hydroxyl water, which is chemically bonded to quartz lattice defects and surfaces in the form of silicon hydroxyl groups (Si-OH), which can replace Si-O-Si bridging oxygen bonds [33]. The quenched quartz samples were dried at 600 °C, 900 °C, and 1200 °C for 12 h to ensure that the water on the surface of the quartz had been completely removed, and the dried quartz samples were analyzed by FTIR determination, as shown in Figure 5. In the range of 3200 cm−1 to 3700 cm−1, it is primarily the characteristic infrared absorption peak of water molecules in quartz. As shown in Figure 5, the intensity and area of the infrared absorption peak of the water molecules in the quartz change significantly with an increase in roasting temperature. At the roasting temperature of 600 °C, the adsorbed water in the quartz has been basically removed, and new water molecules are formed by diffusion outward through quartz lattice defects and newly formed fractures [34], resulting in an infrared absorption peak intensity and peak area of water molecules at this temperature that are higher than those of the 25 °C unroasted sample.
The FTIR spectrum of the quartz sample calcined at 1200 °C was subjected to peak deconvolution in the hydroxyl stretching vibration region (3000–4000 cm−1), and the results are shown in Figure 6. Each sub-peak corresponds to a hydroxyl group or water molecule in a specific chemical environment. As can be seen from Figure 6, both isolated silanol groups (3740–3750 cm−1) and hydrogen-bonded hydroxyl groups (3550–3650 cm−1) exist on the quartz surface. This indicates that the quartz surface is neither completely hydrophobic nor completely hydrophilic but rather contains multiple active sites. Among them, chemically adsorbed water exists in the form of surface silanol groups, while physically adsorbed water is adsorbed on the surface via hydrogen bonds. Although the sharp peak of the isolated silanol groups is very obvious, a strong hydrogen-bonded peak still exists, indicating that the sample was not completely dehydroxylated after calcination at 1200 °C and that the surface still retains a certain degree of hydrophilicity [35]. With the increase in roasting temperature, the new liquid-phase group increases, and the removal rate of gas–liquid inclusions at high temperatures is not as fast as that of the new liquid-phase group. Consequently, the infrared absorption peak intensity and area of water molecules gradually increase [36].
At 900 °C, the intensity of the infrared absorption peak of the water molecules in the quartz decreased sharply, and the infrared absorption intensity and area of the characteristic peak of the water molecules at 3446 cm−1 were the smallest, and the content of the water molecules was the lowest, indicating that the liquid inclusions were almost completely removed. This is because the quartz was transformed into β-quartz and cristobalite at 900 °C, and the lattice expansion was intensified, and the pressure in the inclusions exceeded the critical value, resulting in the bursting of most inclusions [37], and most of the lattice hydroxyl groups were effectively removed at 900 °C compared to 600 °C and 1200 °C. Therefore, 900 °C was determined to be the optimal roasting temperature.
The hydroxyl stretching vibration peaks for physically adsorbed water and chemically adsorbed water are shown with different line types.

3.2.4. Effect of Roasting on Impurity Removal of Quartz by Acid Leaching

According to the ICP-OES results (Table 1), the main impurity elements in the quartz ore were Fe (1882 mg/kg), Al (608 mg/kg), K (350 mg/kg), and Na (171 mg/kg), accounting for 85.61% of all impurities. Therefore, based on the impurity removal rates of Fe, Al, K, and Na, the acid leaching removal effect of roasting temperature on metal impurities in quartz was studied. The acid leaching experiments were performed on quartz samples roasted at 25 °C, 600 °C, 900 °C, and 1200 °C, followed by water quenching, with the Fe, Al, K, and Na content determined by ICP-OES, and the purification results at different roasting temperatures are presented in Table 2 and Figure 7. As shown in Table 2 and Figure 7, the acid leaching removal of the four impurities in quartz initially increased and then decreased as the roasting temperature increased from 600 °C to 1200 °C. This is due to the fact that when the calcination temperature is lower than 900 °C, the quartz part completes the α→β phase transformation, the lattice expansion is not sufficient, the quartz gas–liquid inclusions are partially broken, and the Al3+ part is precipitated from the [SiO4] tetrahedron. Al is easily dissolved and removed by acid corrosion, and the free Fe3+ in the quartz is removed, while the Fe2+ in the inclusions is not completely oxidized.
As shown in Figure 7d, when the roasting temperature is 1200 °C, the removal rate of the four impurities is lower than that at 900 °C. This is because at higher temperatures, quartz undergoes a transformation into the cristobalite phase (β•cristobalite phase), accompanied by the high-temperature densification and re-encapsulation of impurities. This process involves particle sintering and pore closure, making it difficult for acid solutions to penetrate the densified quartz bulk phase, resulting in undissolved impurities being enclosed within. As shown in Figure 7c, the removal rates of the four impurity elements were the best at 900 °C, and the removal rates of Fe, Al, K, and Na were 86.95%, 65.60%, 36.41%, and 64.03%, respectively. This is because 900 °C is exactly between the α-β phase transition (573 °C) and the β-cristobalite phase transition (1050 °C), and the β-quartz is completely stabilized. At this time, the lattice is significantly recombined but not completely densified. The Al and Na removal rates were W900 > W600 > W1200 > W, while the Fe and K removal rates were W900 > W1200 > W600 > W. The choice of 900 °C roasting–water quenching has the best effect on acid leaching and impurities removal in the later stage.

3.3. Research on Fe Removal from Quartz by Ultrasonic-Assisted Acid Leaching

3.3.1. Effect of Acid Leaching Temperature on Fe Removal Rate

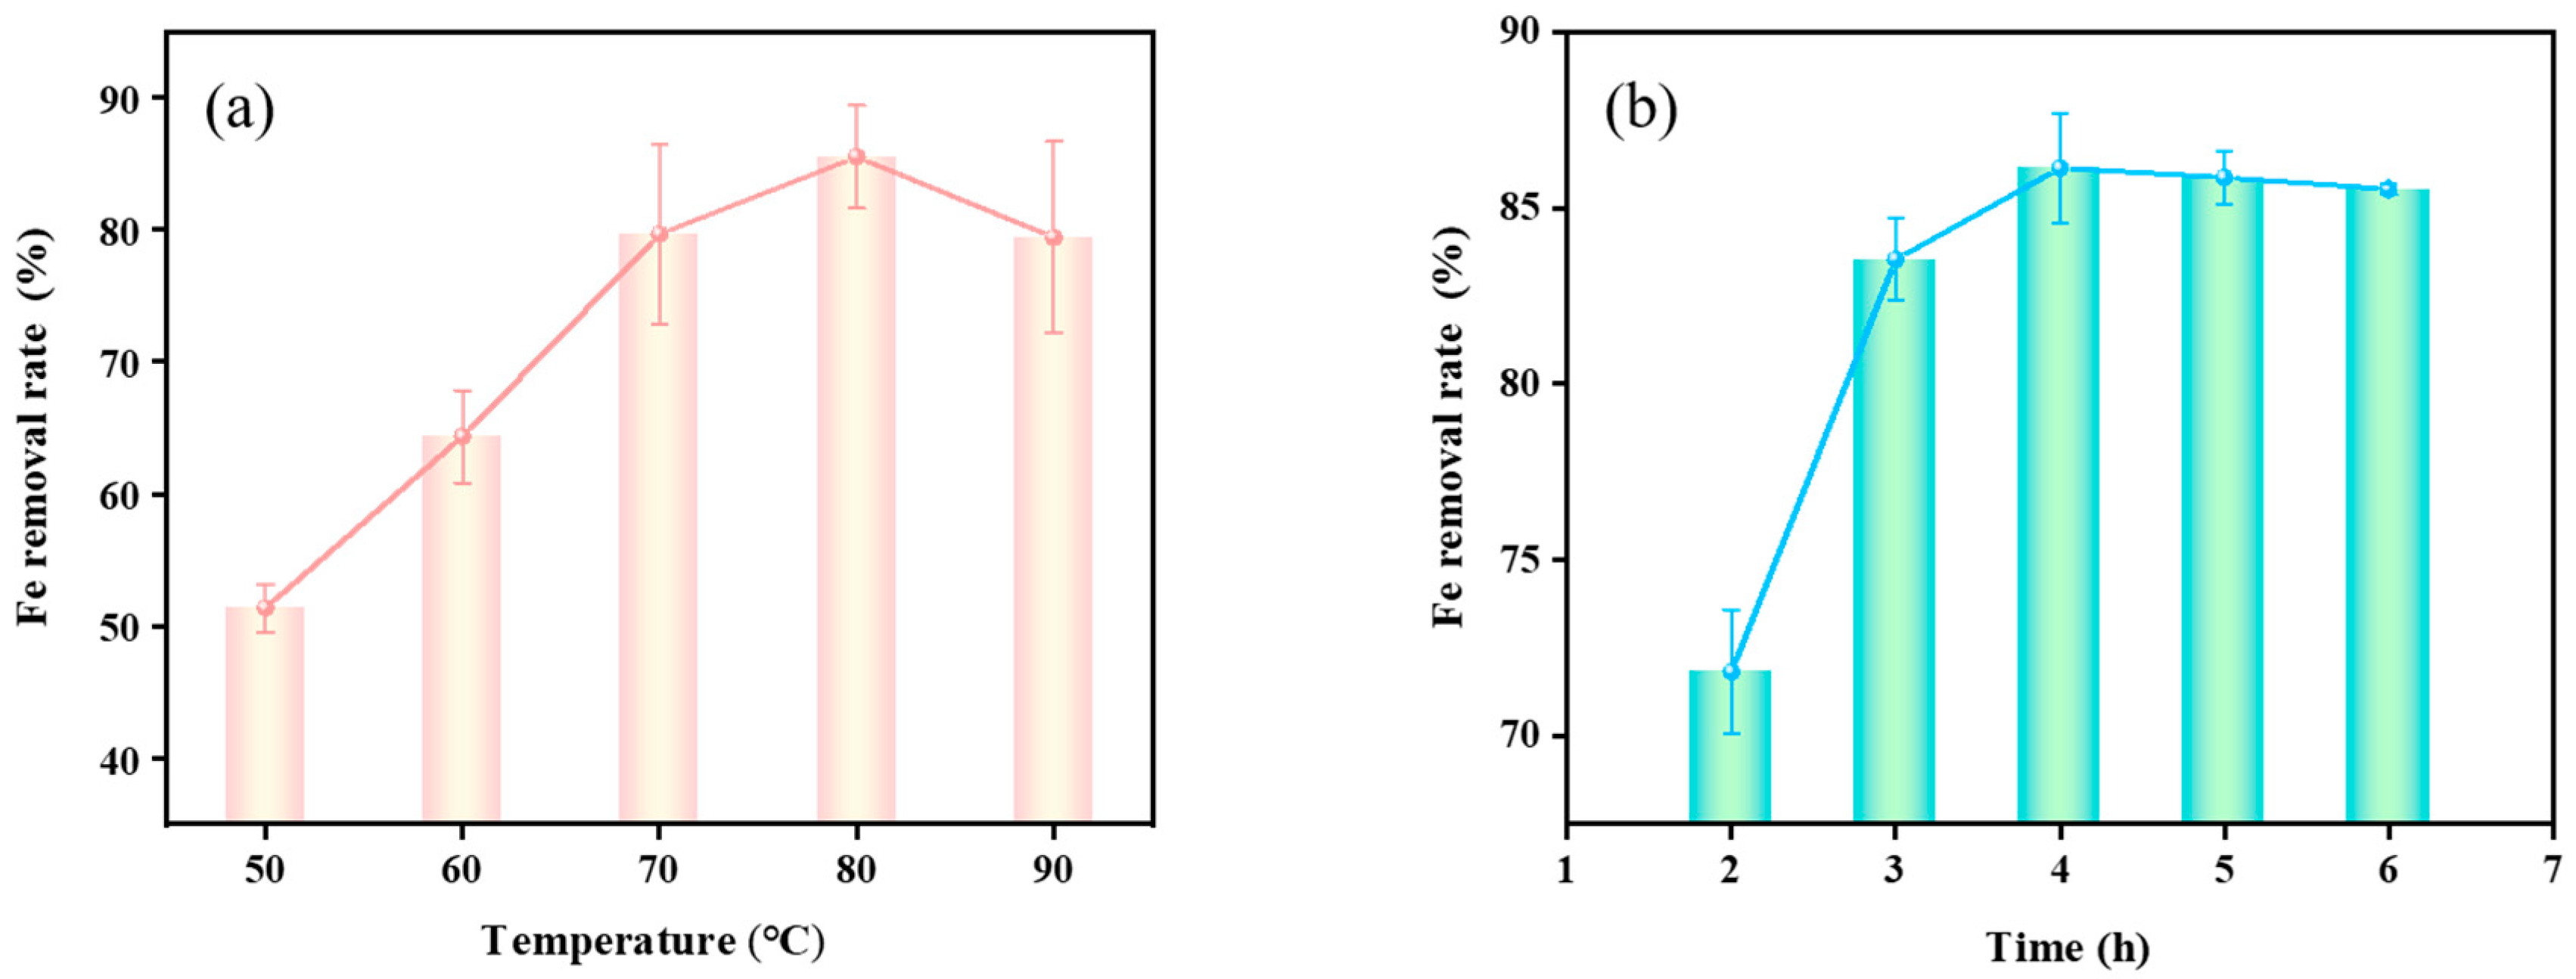
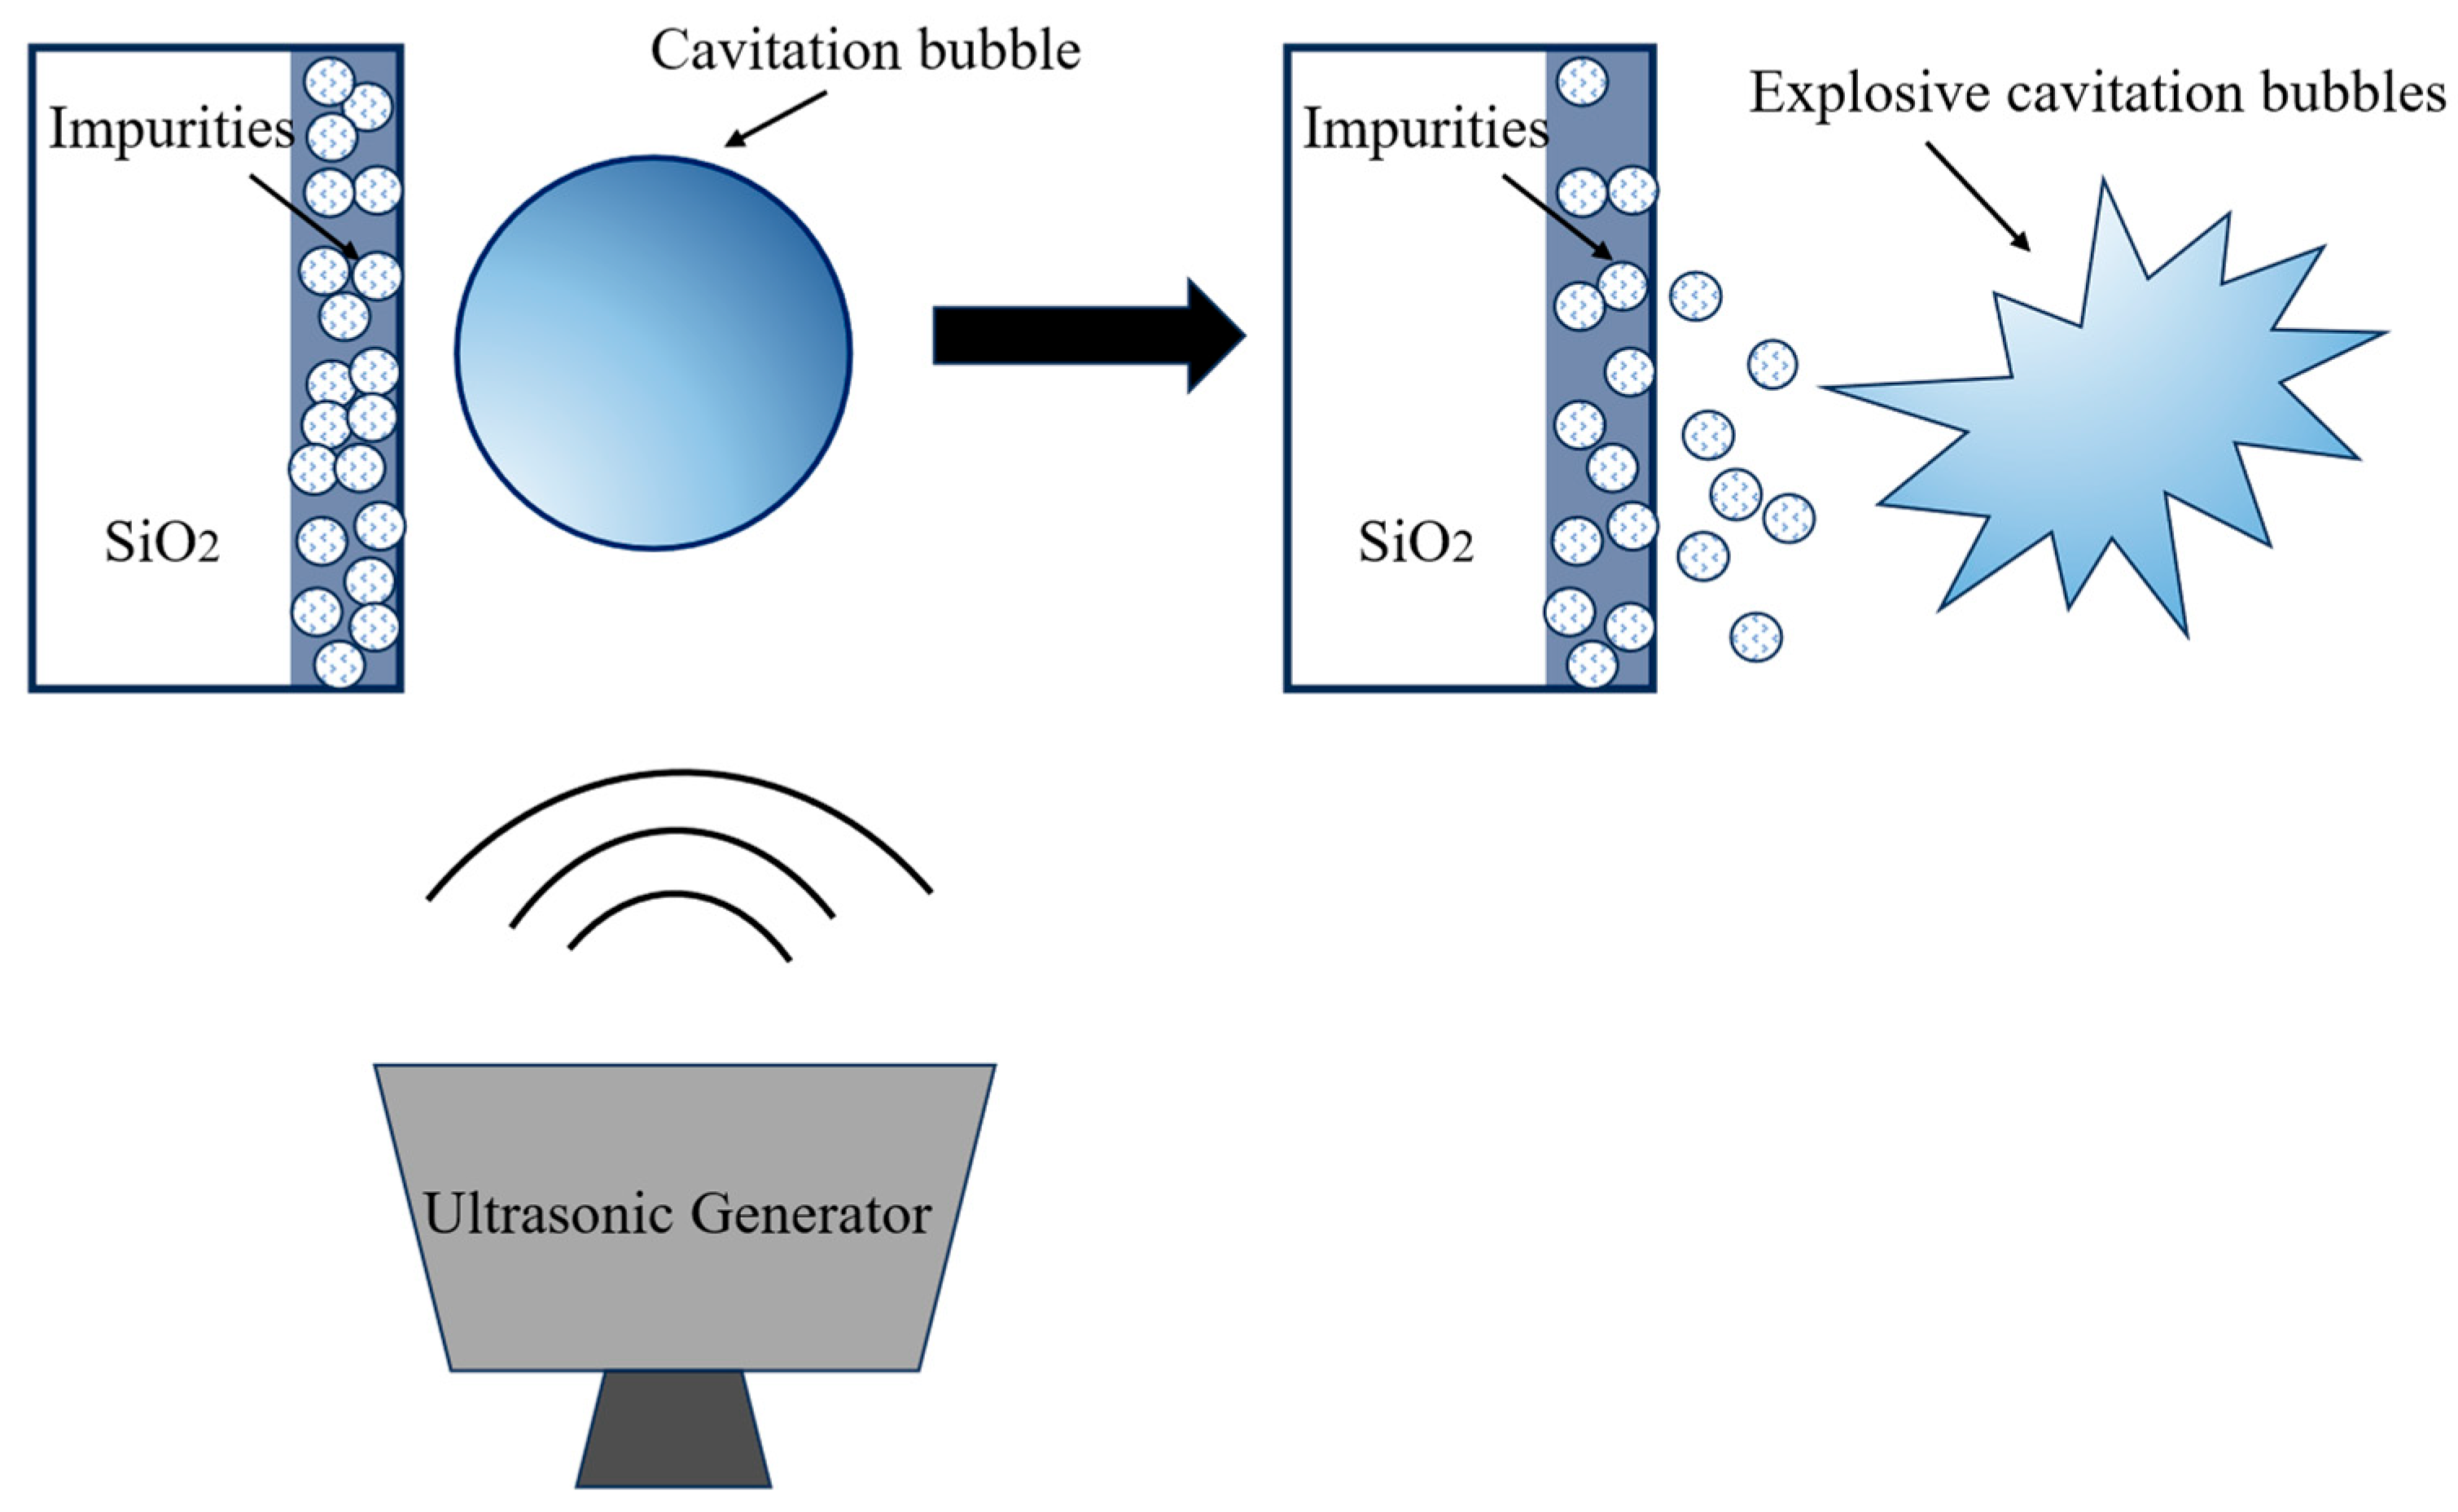
The effects of the acid leaching temperature on the Fe removal rate were investigated, and the results are illustrated in Figure 8a. The acid leaching conditions were designed using a univariate method to evaluate the effect of temperature, a 4 h time period, and a mixed acid concentration of 10% oxalic acid and 12% hydrochloric acid, with an ultrasonic power of 180 W. As the reaction temperature increased from 50 °C to 80 °C, the removal rate of Fe in the quartz conglomerate increased significantly, from 51.37% to 85.53%. With the increase in the leaching temperature, the dissolution equilibrium of Fe3+ and Fe2+ in the acid shifted in the direction of a positive reaction, resulting in an acceleration of the leaching rate. At the same time, the ultrasonic cavitation effect synergized with thermal motion, as shown in Figure 9, which increased the mass transfer rate and interfacial reactivity of H in the acid and reduced the activation energy of Fe-O bond cleavage [38]. However, when the temperature exceeded 80 °C, the removal rate of Fe in the quartz conglomerate dropped to 79.5%. The reason is that, on the one hand, at higher temperatures, HCl undergoes a longer period of volatilization, resulting in a decrease in the effective acid concentration and, consequently, a decrease in the dissolution of Fe impurities. On the other hand, the vapor pressure of the solution increases due to the high temperature, which weakens the strength of the ultrasonic cavitation effect, reduces the impact force and stirring effect generated by the collapse of the cavitation bubbles, and, thus, affects the removal rate of Fe. Thus, considering both leaching efficiency and operational economy, 80 °C was the optimal temperature for ultrasonic-assisted acid leaching.

3.3.2. Effect of Acid Leaching Time on Fe Removal Rate

Additionally, the effect of the acid leaching time on the Fe removal rate was investigated, and the results are presented in Figure 8b. The conditions for studying the effect of acid leaching reaction time on Fe removal were as follows: a temperature of 80 °C, a mixed acid concentration of oxalic acid 10% and hydrochloric acid 12%, and an ultrasonic power of 180 W. When the acid leaching time was increased to 4 h, the removal rate of Fe increased to the maximum value of 85.4%. This is due to the fact that at the beginning of the reaction, the Fe impurities in the quartz conglomerate are in full contact with the acid solution, thereby accelerating the interfacial reaction rate. At the same time, with the assistance of ultrasonic power, the high-frequency vibration generated by the ultrasonic power triggers the periodic growth and collapse of cavitation bubbles, continuously impacts the surface of the quartz, destroys the binding force of the Fe impurities and quartz lattice, accelerates the reaction between the acid leaching solution and the impurities, and leads to a continuous increase in the Fe removal rate. However, when the reaction time was longer than 4 h, the removal rate of Fe no longer increased significantly but instead leveled off and remained constant. This is due to the fact that not only does a prolonged reaction fail to effectively remove stable iron impurities encapsulated within the quartz, but the evaporation and decomposition of the acid solution also lead to a decrease in the effective concentration. The current acid concentration and ultrasonic energy were insufficient to disrupt the quartz structure and release it; all leachable iron was already extracted. Prolonging the leaching time further only increases energy consumption and duration. Therefore, 4 h was selected as the optimal leaching time to achieve a balance between economic efficiency and purification effectiveness.

3.3.3. Effect of Oxalic Acid Concentration on Fe Removal Rate

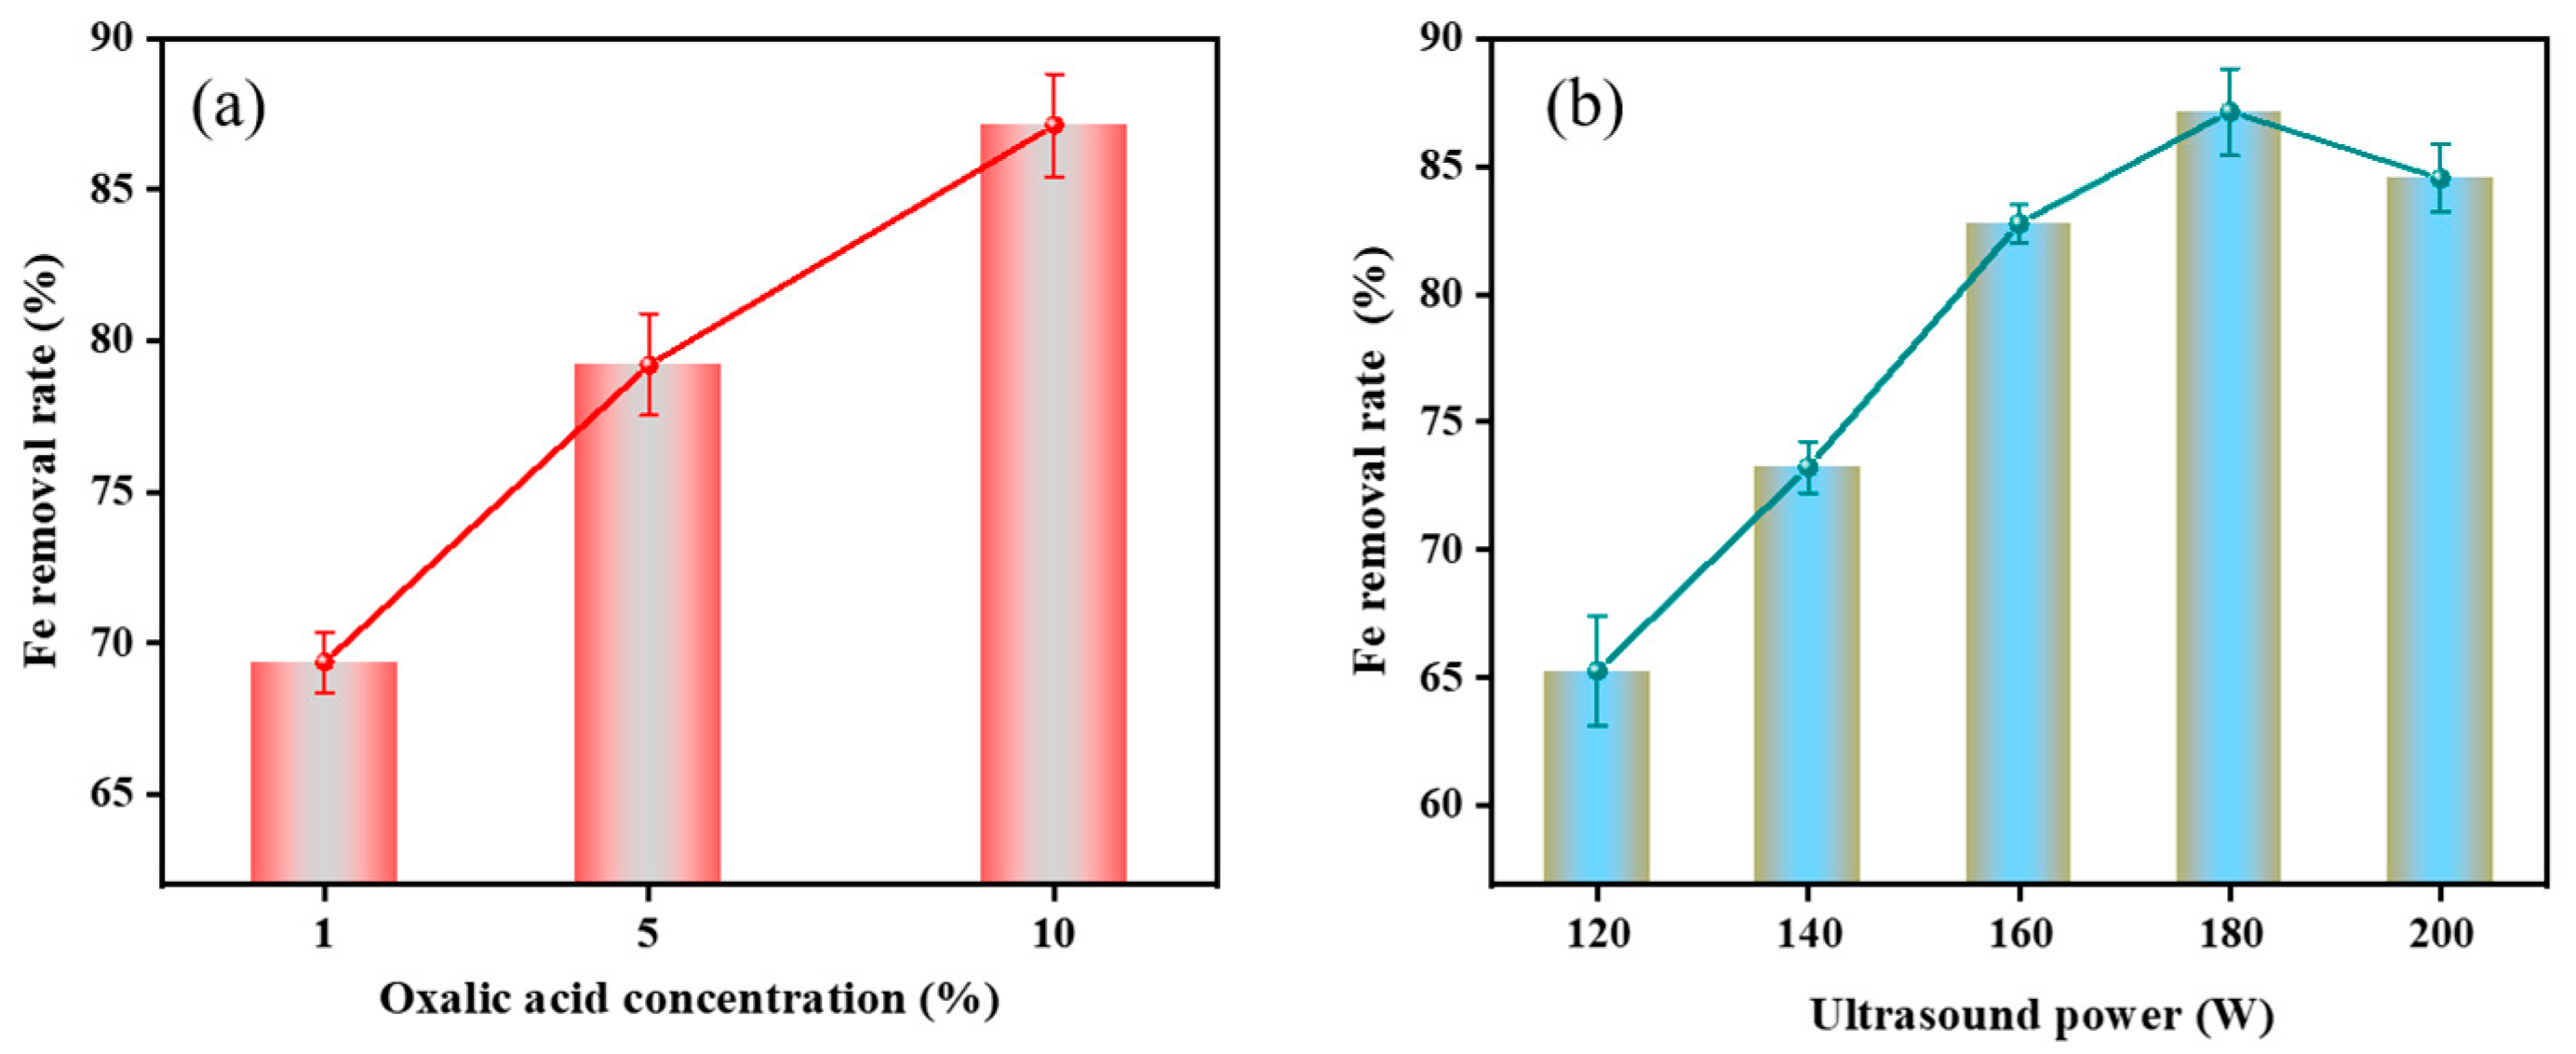
Based on the experimental effect of acid leaching temperature and time on the removal of Fe in quartz, the effect of oxalic acid concentration on the removal rate of Fe was studied, and the results are shown in Figure 10a. The univariate method was used to design the acid leaching conditions: temperature, 80 °C; time, 4 h; hydrochloric acid concentration, 12%; and ultrasonic power, 180 W. The removal rate of Fe increased with the increase in oxalic acid concentration, and when the oxalic acid concentration increased from 1% to 10%, the removal rate of Fe increased by 17.8%. When the oxalic acid concentration is 1%, the oxalate ions produced by ionization in the solution are few, and the number of stable complexes formed with Fe3+ is limited, which makes it difficult to efficiently break the binding of Fe impurities and the quartz lattice, resulting in a low removal rate [39]. When the concentration is increased to 5%, the complexation reaction rate is accelerated; however, it still does not reach the critical concentration required for the complete dissolution of Fe impurities. When the oxalic acid concentration reaches 10%, a large number of oxalate ions produced by its ionization can quickly form a stable [Fe(C2O4)3]3− complex with Fe3+, see Equations (2) and (3).
Fe 2 O 3 + 6 H 2 C 2 O 4 2 [ Fe ( C 2 O 4 ) 3 ] 3 + 6 H + + 3 H 2 O
2 Fe 3 + + H 2 C 2 O 4 2 Fe 2 + + 2 H + + 2 CO 2
The [Fe(C2O4)3]3− generated in it is soluble in water, thereby separating Fe impurities from quartz. The high concentration of oxalic acid not only enhances the acidity of the solution but also reduces the pH of the solution, together with hydrochloric acid, and promotes the dissolution of Fe. In addition, the cavitation effect produced by ultrasound is enhanced in the high-concentration oxalic acid system, which accelerates the spalling of the complex from the quartz surface into the solution [40]. However, excess oxalic acid can cause side reactions, resulting in the product covering the quartz surface and hindering the reaction, thus weakening the ultrasonic cavitation effect. Therefore, in the presence of hydrochloric acid, 10% oxalic acid is the optimal concentration for the ultrasonic-assisted acid leaching process.

3.3.4. Effect of Ultrasonic Power on Fe Removal Rate

The effects of different ultrasonic power levels on the Fe removal rate were studied under conditions of 80 °C, a 4 h leaching time, and a mixed acid solution of 10% oxalic acid and 12% hydrochloric acid. The results are shown in Figure 10b. Ultrasonic power has a significant impact on the Fe removal rate. The maximum Fe removal rate was 87.1% at 180 W. When the ultrasonic power is lower than 180 W, cavitation bubbles form with insufficient strength. The weak impact on the quartz surface results in poor contact between the leaching reagent and Fe impurities, lowering Fe removal. At 180 W, high-frequency ultrasonic vibration ensures that the acid leaching reagent efficiently penetrates quartz. It also helps disperse dissolved Fe ions into the solution quickly. If the power exceeds 180 W and rises to 200 W, excessive ultrasonic energy causes cavitation bubbles to overgrow and collapse early. This reduces the stability of cavitation and disrupts complexes formed by oxalic acid and Fe ions [41,42]. High ultrasonic power can also cause a sharp temperature increase in the solution. This can intensify side reactions and weaken Fe removal. Thus, 180 W was selected as the optimal condition for acid leaching. The impurity content of the quartz concentrate under the best conditions (80 °C, 4 h, 10% oxalic acid, 12% hydrochloric acid, 180 W), measured by ICP-OES, is shown in Table 3. SiO2 increased from 99.77% to 99.98%. The Fe content dropped to 6.95 mg/kg, and the total impurity content fell to 210.43 mg/kg.
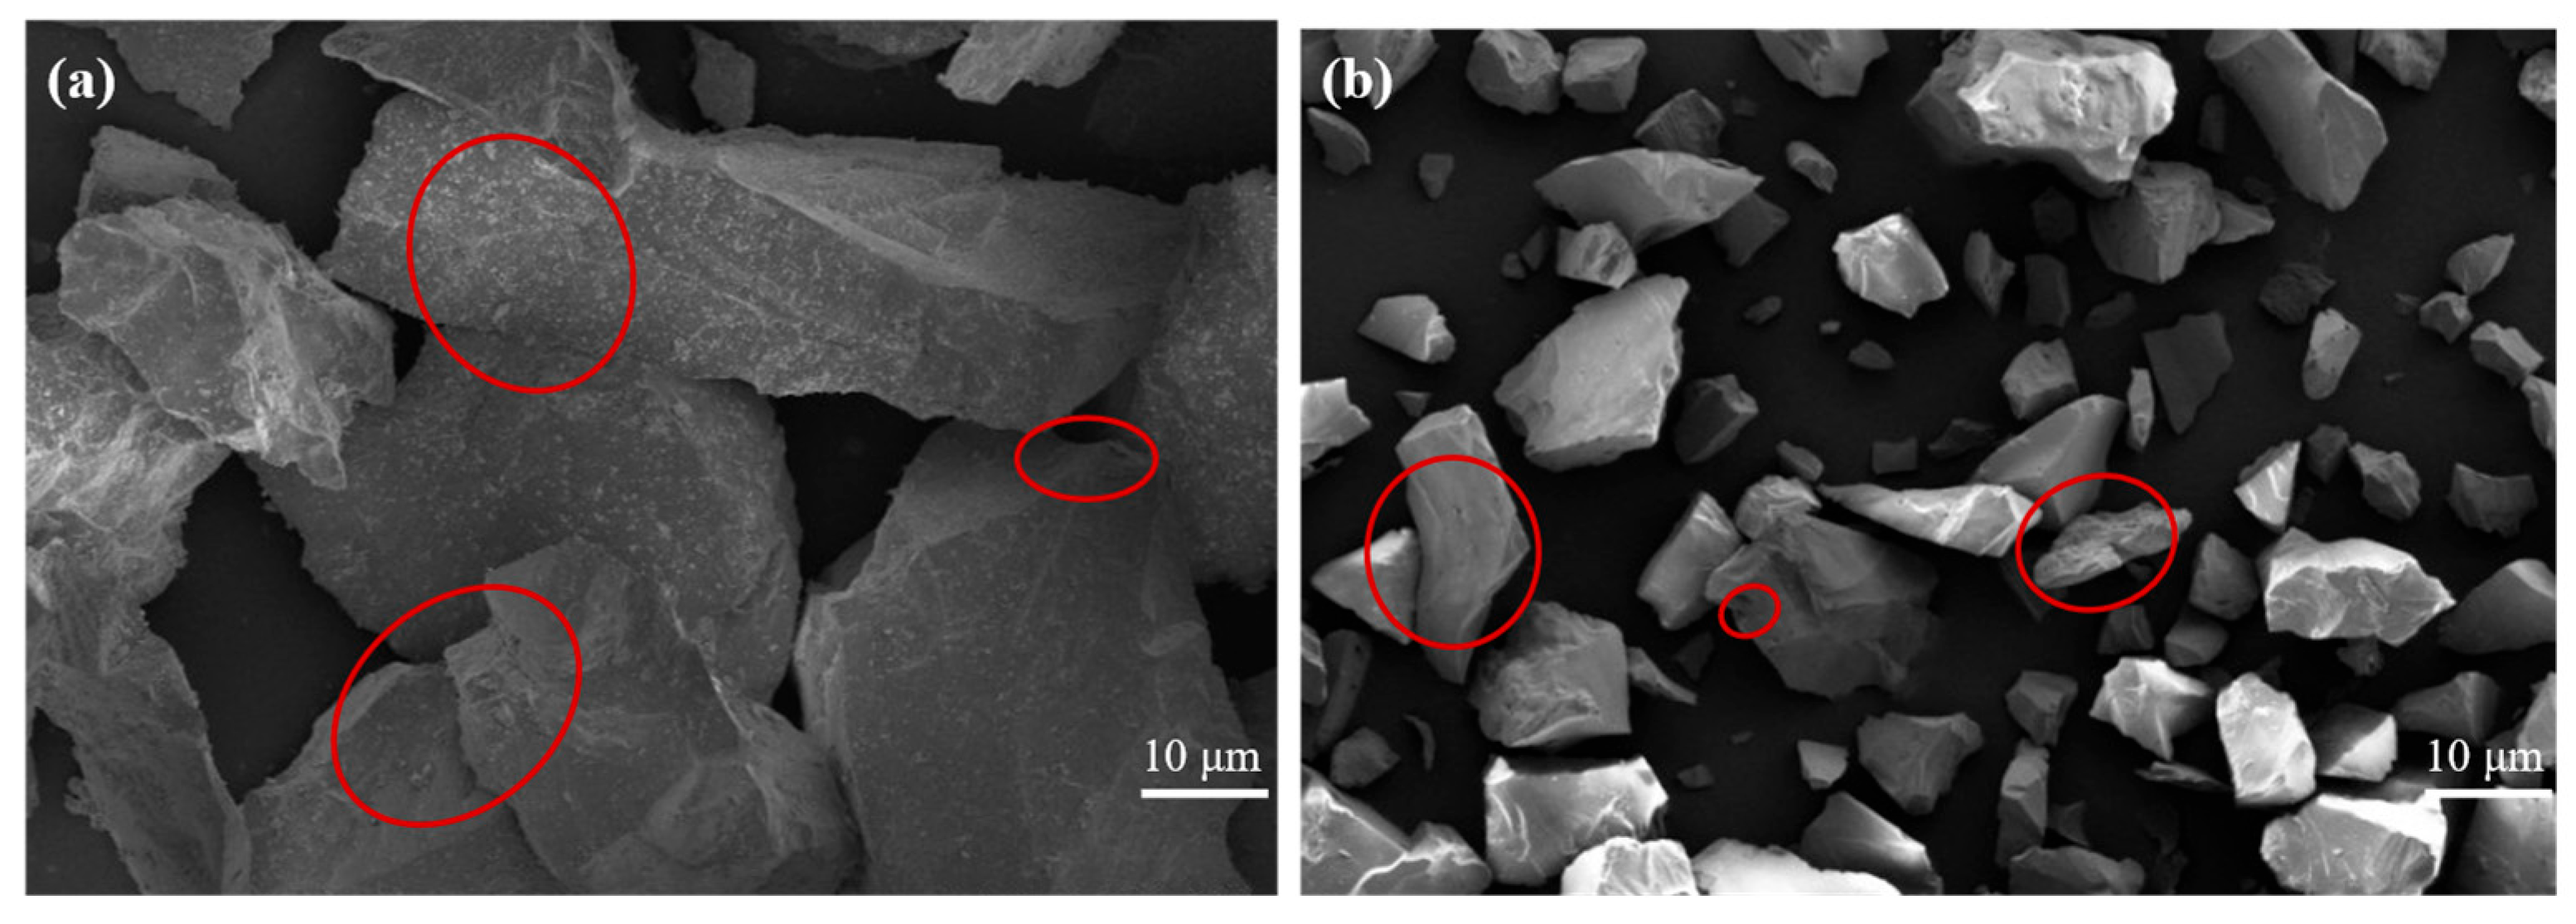
Ultrasonic-assisted acid leaching significantly enhanced the removal of impurities from the quartz surface. The SEM analysis of the surface morphology of the quartz before and after ultrasonic-assisted acid leaching is presented in Figure 11. As shown in Figure 11a, There were many impurities attached to the surface of the quartz before ultrasound was used, and small particles were attached to or embedded in the surface of the quartz. After ultrasonic-assisted acid leaching, as shown in Figure 11b, all small particles almost disappeared, and some micropores and cracks appeared on the surface. This is because powerful ultrasound can strip the impurities attached to the quartz particles in the acid solution, facilitating further reactions.

4. Conclusions

In this paper, the effect of roasting–water quenching pretreatment combined with ultrasonic-assisted acid leaching on the removal of impurities in quartz was investigated. The results showed that under the optimal conditions, i.e., roasting at 900 °C for 2.5 h and then quenching, the acid leaching temperature was 80 °C, the leaching time was 4 h, the mixed acid concentration was 10% oxalic acid and 12% hydrochloric acid, and the ultrasonic power was 180 W. The Fe content decreased to 6.95 mg/kg (the removal rate reached 85.6%), the total impurity content decreased to 210.43 mg/kg, and the SiO2 content in the quartz increased from 99.77% to 99.98%. Compared with the traditional process, roasting–water quenching combined with ultrasonic-assisted acid leaching significantly improved the removal effect of the impurities in the quartz. At the same time, the use of strong acids such as hydrofluoric acid was replaced by environmentally friendly acids such as oxalic acid and hydrochloric acid, which avoided unnecessary environmental pollution.

Author Contributions

All authors contributed to the study conception and design. L.J. was responsible for the research design, experimental implementation, and writing of the first draft of the paper; L.W. and G.W. were involved in data analysis and charting; S.L. and Y.L. conducted the experiments, surveys, interviews, and data collection; and Y.H. and Y.Z. provided theoretical guidance, revised the paper, and completed the final review. All authors have read and agreed to the published version of the manuscript.

Funding

This work was financially supported by the Xinjiang Uygur Autonomous Region Major Science and Technology Special Project “Research on Key Technologies for High Purity Quartz, Fluorite and Graphite Selection and Metallurgy in Xinjiang” (No. 2023A03004).This study was financially supported by the “2+5” Key Talent Program Project of Xinjiang Uygur Autonomous Region (Project Title: “Research on Key Technologies for Design and Construction of Prefabricated Bridges in Xinjiang”).

Data Availability Statement

The data presented in this study are available on request from the corresponding author.

Conflicts of Interest

Guirong Wei is an employee of Xinjiang Zijin Zinc Industry Co Ltd. The paper reflects the views of the scientists and not the company.

References

  1. Mecchia, M.; Sauro, F.; Piccini, L.; De Waele, J.; Sanna, L.; Tisato, N.; Lira, J.; Vergara, F. Geochemistry of Surface and Subsurface Waters in Quartz-Sandstones: Significance for the Geomorphic Evolution of Tepui Table Mountains (Gran Sabana, Venezuela). J. Hydrol. 2014, 511, 117–138. [Google Scholar] [CrossRef]
  2. Xia, M.; Sun, C.; Yang, X.Y.; Chen, J. Assessment of Gold-Bearing Quartz Vein as a Potential High-Purity Quartz Resource: Evidence from Mineralogy, Geochemistry, and Technological Purification. Minerals 2023, 13, 261. [Google Scholar] [CrossRef]
  3. Götze, J.; Pan, Y.; Müller, A. Mineralogy and mineral chemistry of quartz: A review. Mineral. Mag. 2021, 85, 639–664. [Google Scholar] [CrossRef]
  4. Liang, G.B.; Li, Y.H.; Yang, C.; Zi, C.Y.; Zhang, Y.Q.; Hu, X.; Zhao, W.B. Production of biosilica nanoparticles from biomass power plant fly ash. Waste Manag. 2020, 105, 8–17. [Google Scholar] [CrossRef]
  5. Prakash, V.; Agarwal, A.; Mussada, E.K. Processing Methods of Silicon to its Ingot: A Review. Silicon 2019, 11, 1617–1634. [Google Scholar] [CrossRef]
  6. Liu, C.; Wang, W.; Wang, H.; Zhu, C.; Ren, B. A Review on Removal of Iron Impurities from Quartz Mineral. Minerals 2023, 13, 1128. [Google Scholar] [CrossRef]
  7. Xie, Y.; Xia, M.; Yang, X.; Khan, I.; Hou, Z. Research on 4N8 High-Purity Quartz Purification Technology Prepared Using Vein Quartz from Pakistan. Minerals 2024, 14, 1049. [Google Scholar] [CrossRef]
  8. Qi, D.; Ren, Z.; Song, Y.; He, Y.; Li, P.; Yin, H. Purification of Different-Sized Quartz Crystals in Granitic Pegmatite. Miner. Eng. 2024, 216, 108856. [Google Scholar] [CrossRef]
  9. Wei, Z.; Li, Y.; Li, P.; Pan, L.; Hu, X.; Gu, Y.; Tian, Y. Migration Mechanisms of Al3+/Li+ Lattice Impurities during Phase Transition from α-Quartz to β-Quartz: An Implication for Purification of High-Purity Quartz. Minerals 2023, 13, 1280. [Google Scholar] [CrossRef]
  10. Li, J.S.; Li, X.X.; Shen, Q.; Zhang, Z.Z.; Du, F.H. Further Purification of Industrial Quartz by Much Milder Conditions and a Harmless Method. Environ. Sci. Technol. 2010, 44, 7673–7677. [Google Scholar] [CrossRef]
  11. Li, Y.K.; Li, S.Q.; Zhao, X.; Pan, X.D.; Guo, P.H. Separation and purification of high-purity quartz from high-silicon iron ore tailing: An innovative strategy for comprehensive utilization of tailings resources. Process Saf. Environ. Prot. 2023, 169, 142–148. [Google Scholar] [CrossRef]
  12. Hagemann, S.G.; Angerer, T.; Duuring, P.; Rosière, C.A.; Figueiredo e Silva, R.C.; Lobato, L.; Hensler, A.; Walde, D. BIF-Hosted Iron Mineral System: A Review. Ore Geol. Rev. 2016, 76, 317–359. [Google Scholar] [CrossRef]
  13. Ortiz-Mosquera, J.F.; Nieto-Muñoz, A.M.; Rodrigues, A.C.M. Influence of Al3+ on Glass-Forming Ability, Structural and Electrical Properties of the Na3.4Sc22Si0.4P2.6O12 Superionic Conductor. J. Alloys Compd. 2021, 850, 156670. [Google Scholar] [CrossRef]
  14. Song, W.; Jiang, X.; Chen, C.; Ban, B.; Wan, S.; Chen, J. Purification of Quartz via Low-Temperature Microwave Chlorinated Calcination Combined with Acid Leaching and Its Mechanism. Silicon 2023, 15, 971–981. [Google Scholar] [CrossRef]
  15. Larsen, E.; Kleiv, R.A. Flotation of Quartz from Quartz-Feldspar Mixtures by the HF Method. Miner. Eng. 2016, 98, 49–51. [Google Scholar] [CrossRef]
  16. Gui, Y.Z.Y.; Zhu, X.X.; Fu, H.; Jiang, X.S.; Sun, J.F.; Wang, L.; Ban, B.; Chen, J. Preparation of Silica Powder from Low-Grade Quartz by Mechanical Activation Acid Leaching and Its Mechanism. Silicon 2025, 17, 835–849. [Google Scholar] [CrossRef]
  17. Yang, S.C.; Han, S.F.; Wan, H.L.; Wei, K.X.; Ma, W.H. Silicon and Quartz Recovery and Purification from Waste Quartz Crucible Ash with a Combined Process of Electric Separation and Hydrometallurgy. Silicon 2024, 16, 4025–4035. [Google Scholar] [CrossRef]
  18. Qu, J.Y.; Chen, Z.J.; Wu, D.D.; Ma, W.H. Study on the Purification Mechanism of Low-Grade Silicon Ore through a Combination of Direct Roasting and Pressure Leaching. Silicon 2024, 16, 5257–5271. [Google Scholar] [CrossRef]
  19. Deng, L.J.; Ma, F.Y. Study on Dynamic Behavior and Mechanism of Reverse Flotation of Micro-fine Hematite (MFH) Enhanced by Nanobubbles (NBs). JOM 2019, 76, 7387–7397. [Google Scholar]
  20. Xiong, K.; Pei, Z.Y.; Zang, F.F.; Lin, M. Study on Preparation Process and Mechanism of High-Purity Quartz by Mixed Acid Leaching. Non-Met. Mines 2016, 39, 60–62. (In Chinese) [Google Scholar]
  21. Tuncuk, A.; Akcil, A. Removal of Iron from Quartz Ore Using Different Acids: A Laboratory-Scale Reactor Study. Miner. Process. Extr. Metall. Rev. 2014, 35, 217–228. [Google Scholar] [CrossRef]
  22. Shao, H.; Zang, F.; Ji, M.; Yu, M. Preparation and Mechanism of High Purity Quartz by Alkali Corrosion and Acid Leaching Process Using Vein Quartz. Silicon 2022, 14, 12475–12483. [Google Scholar] [CrossRef]
  23. Wu, X. Study on Evaluation and Purification Process of High Purity Quartz Raw Materials. Master’s Thesis, Southwest University of Science and Technology, Mianyang, China, 2016. (In Chinese). [Google Scholar]
  24. Liu, A.; Fan, P.P.; Qiao, X.X.; Li, Z.H.; Wang, H.F.; Fan, M.Q. Synergistic effect of mixed DDA/surfactants collectors on flotation of quartz. Miner. Eng. 2020, 159, 106605. [Google Scholar] [CrossRef]
  25. Guo, W.; Lu, H.; Zhang, Z.; Jiang, L.; Wu, H.; Liu, D.; Chi, R. Crystal Structure Transformation and Lattice Impurities Migration of Quartz During Chlorine Roasting. Int. J. Min. Sci. Technol. 2024, 34, 1465–1474. [Google Scholar] [CrossRef]
  26. Li, Y.; Li, S.; Pan, X.; Zhao, X.; Guo, P.; Zhao, Z. Recovery and preparation of high-grade silica from iron ore tailings by S-HGMS coupling with acid leaching technology: Description of separation mechanism and leaching kinetics. Powder Technol. 2023, 424, 118523. [Google Scholar] [CrossRef]
  27. Wang, M.; Yao, H. A Novel Organic–Inorganic Hybrid Admixture for Increasing Flowability and Reducing Viscosity of Ultra-High Performance Paste. Materials 2020, 13, 3385. [Google Scholar] [CrossRef]
  28. Khanlary, M.R.; Rahmani, E.; Pasalari, Z.; Reyhani, A. Post-Annealing Effect on the Structural and Optical Properties of Tungsten Trioxide Thin Films Prepared by Thermal Evaporation. Mater. Chem. Phys. 2025, 338, 130670. [Google Scholar] [CrossRef]
  29. Li, W.; Xu, C.; Xie, A.; Chen, K.; Yang, Y.; Liu, L.; Zhu, S. Microstructure Study of Phase Transformation of Quartz in Potassium Silicate Glass at 900 °C and 1000 °C. Crystals 2021, 11, 1481. [Google Scholar] [CrossRef]
  30. Li, Y.; Ma, Q.; Xia, Z.; Li, W.; Lei, S. Influences of Na2CO3 Roasting and H3PO4 Hot-Pressure Leaching on the Purification of Vein Quartz to Achieve High-Purity Quartz. Hydrometallurgy 2023, 218, 106065. [Google Scholar]
  31. Chayab Draa, A.; Mokhtari, F.; Lasloudji, I.; Zermout, S.; Lebbou, K. Internal Radiation Effect on Semiconductor β-Ga2O3 Crystals Grown by the VB Method and Anisotropic Thermal Stress. J. Cryst. Growth. 2024, 648, 127910. [Google Scholar] [CrossRef]
  32. Austrheim, H.; Dunkel, K.G.; Plümper, O.; Ildefonse, B.; Liu, Y.; Jamtveit, B. Fragmentation of Wall Rock Garnets during Deep Crustal Earthquakes. Sci. Adv. 2017, 3, e1602067. [Google Scholar] [CrossRef] [PubMed]
  33. Adeagbo, W.A.; Doltsinis, N.L.; Klevakina, K.; Renner, J. Transport Processes at α-Quartz-Water Interfaces: Insights from First-Principles Molecular Dynamics Simulations. ChemPhysChem 2008, 9, 994–1002. [Google Scholar] [PubMed]
  34. Sanchez-Navas, A. Sequential Kinetics of a Muscovite-Out Reaction: A Natural Example. Am. Miner. 1999, 84, 1270–1286. [Google Scholar] [CrossRef]
  35. Gaweł, B.A.; Ulvensøen, A.; Łukaszuk, K.; Arstad, B.; Muggerud, A.M.F.; Erbe, A. Structural Evolution of Water and Hydroxyl Groups during Thermal, Mechanical and Chemical Treatment of High Purity Natural Quartz. RSC Adv. 2020, 10, 29061–29069. [Google Scholar] [CrossRef]
  36. Gaweł, B.A.; Ulvensøen, A.; Łukaszuk, K.; Muggerud, A.M.F.; Erbe, A. In Situ High Temperature Spectroscopic Study of Liquid Inclusions and Hydroxyl Groups in High Purity Natural Quartz. Miner. Eng. 2021, 174, 107238. [Google Scholar] [CrossRef]
  37. Gui, Y.; Chen, X.; Zhu, X.; Fu, H.; Jiang, X.; Sun, J.; Wang, L.; Ban, B.; Chen, J. Quartz Lattice Al Impurity Removal: A Simple Annealing-Leaching Process and Analysis. Mater. Lett. 2025, 357, 135712. [Google Scholar] [CrossRef]
  38. Ai, G.; Guo, S.; Zhao, J.; Deng, X.; Wei, K.; Ma, W. Hot-Pressure Acid Leaching Changes Grain Boundaries to Deeply Remove Impurities in Quartz Sand. J. Mater. Res. Technol. 2024, 28, 4321–4332. [Google Scholar] [CrossRef]
  39. Li, Y.; Pan, X.; Li, S.; Zhao, X.; Guo, P.; He, T. Innovative Technology for Preparation of High-Purity Silica from Vein Quartz Ore through S-HGMS Coupling Acid Leaching Process. Process Saf. Environ. Prot. 2023, 179, 632–643. [Google Scholar] [CrossRef]
  40. Li, F.; Jiang, X.; Zuo, Q.; Li, J.; Ban, B.; Chen, J. Purification Mechanism of Quartz Sand by Combination of Microwave Heating and Ultrasound Assisted Acid Leaching Treatment. Silicon 2021, 13, 531–541. [Google Scholar]
  41. Lin, M.; Pei, Z.Y.; Li, Y.B.; Liu, Y.Y.; Wei, Z.L.; Lei, S.M. Separation Mechanism of Lattice-Bound Trace Elements from Quartz by KCl-Doping Calcination and Pressure Leaching. Miner. Eng. 2018, 125, 42–49. [Google Scholar]
  42. Yuan, J.; Xiao, J.; Li, F.; Wang, B.; Yao, Z.; Yu, B.; Zhang, L. Co-Treatment of Spent Cathode Carbon in Caustic and Acid Leaching Process under Ultrasonic Assisted for Preparation of SiC. Ultrason. Sonochem 2017, 39, 654–662. [Google Scholar] [CrossRef] [PubMed]
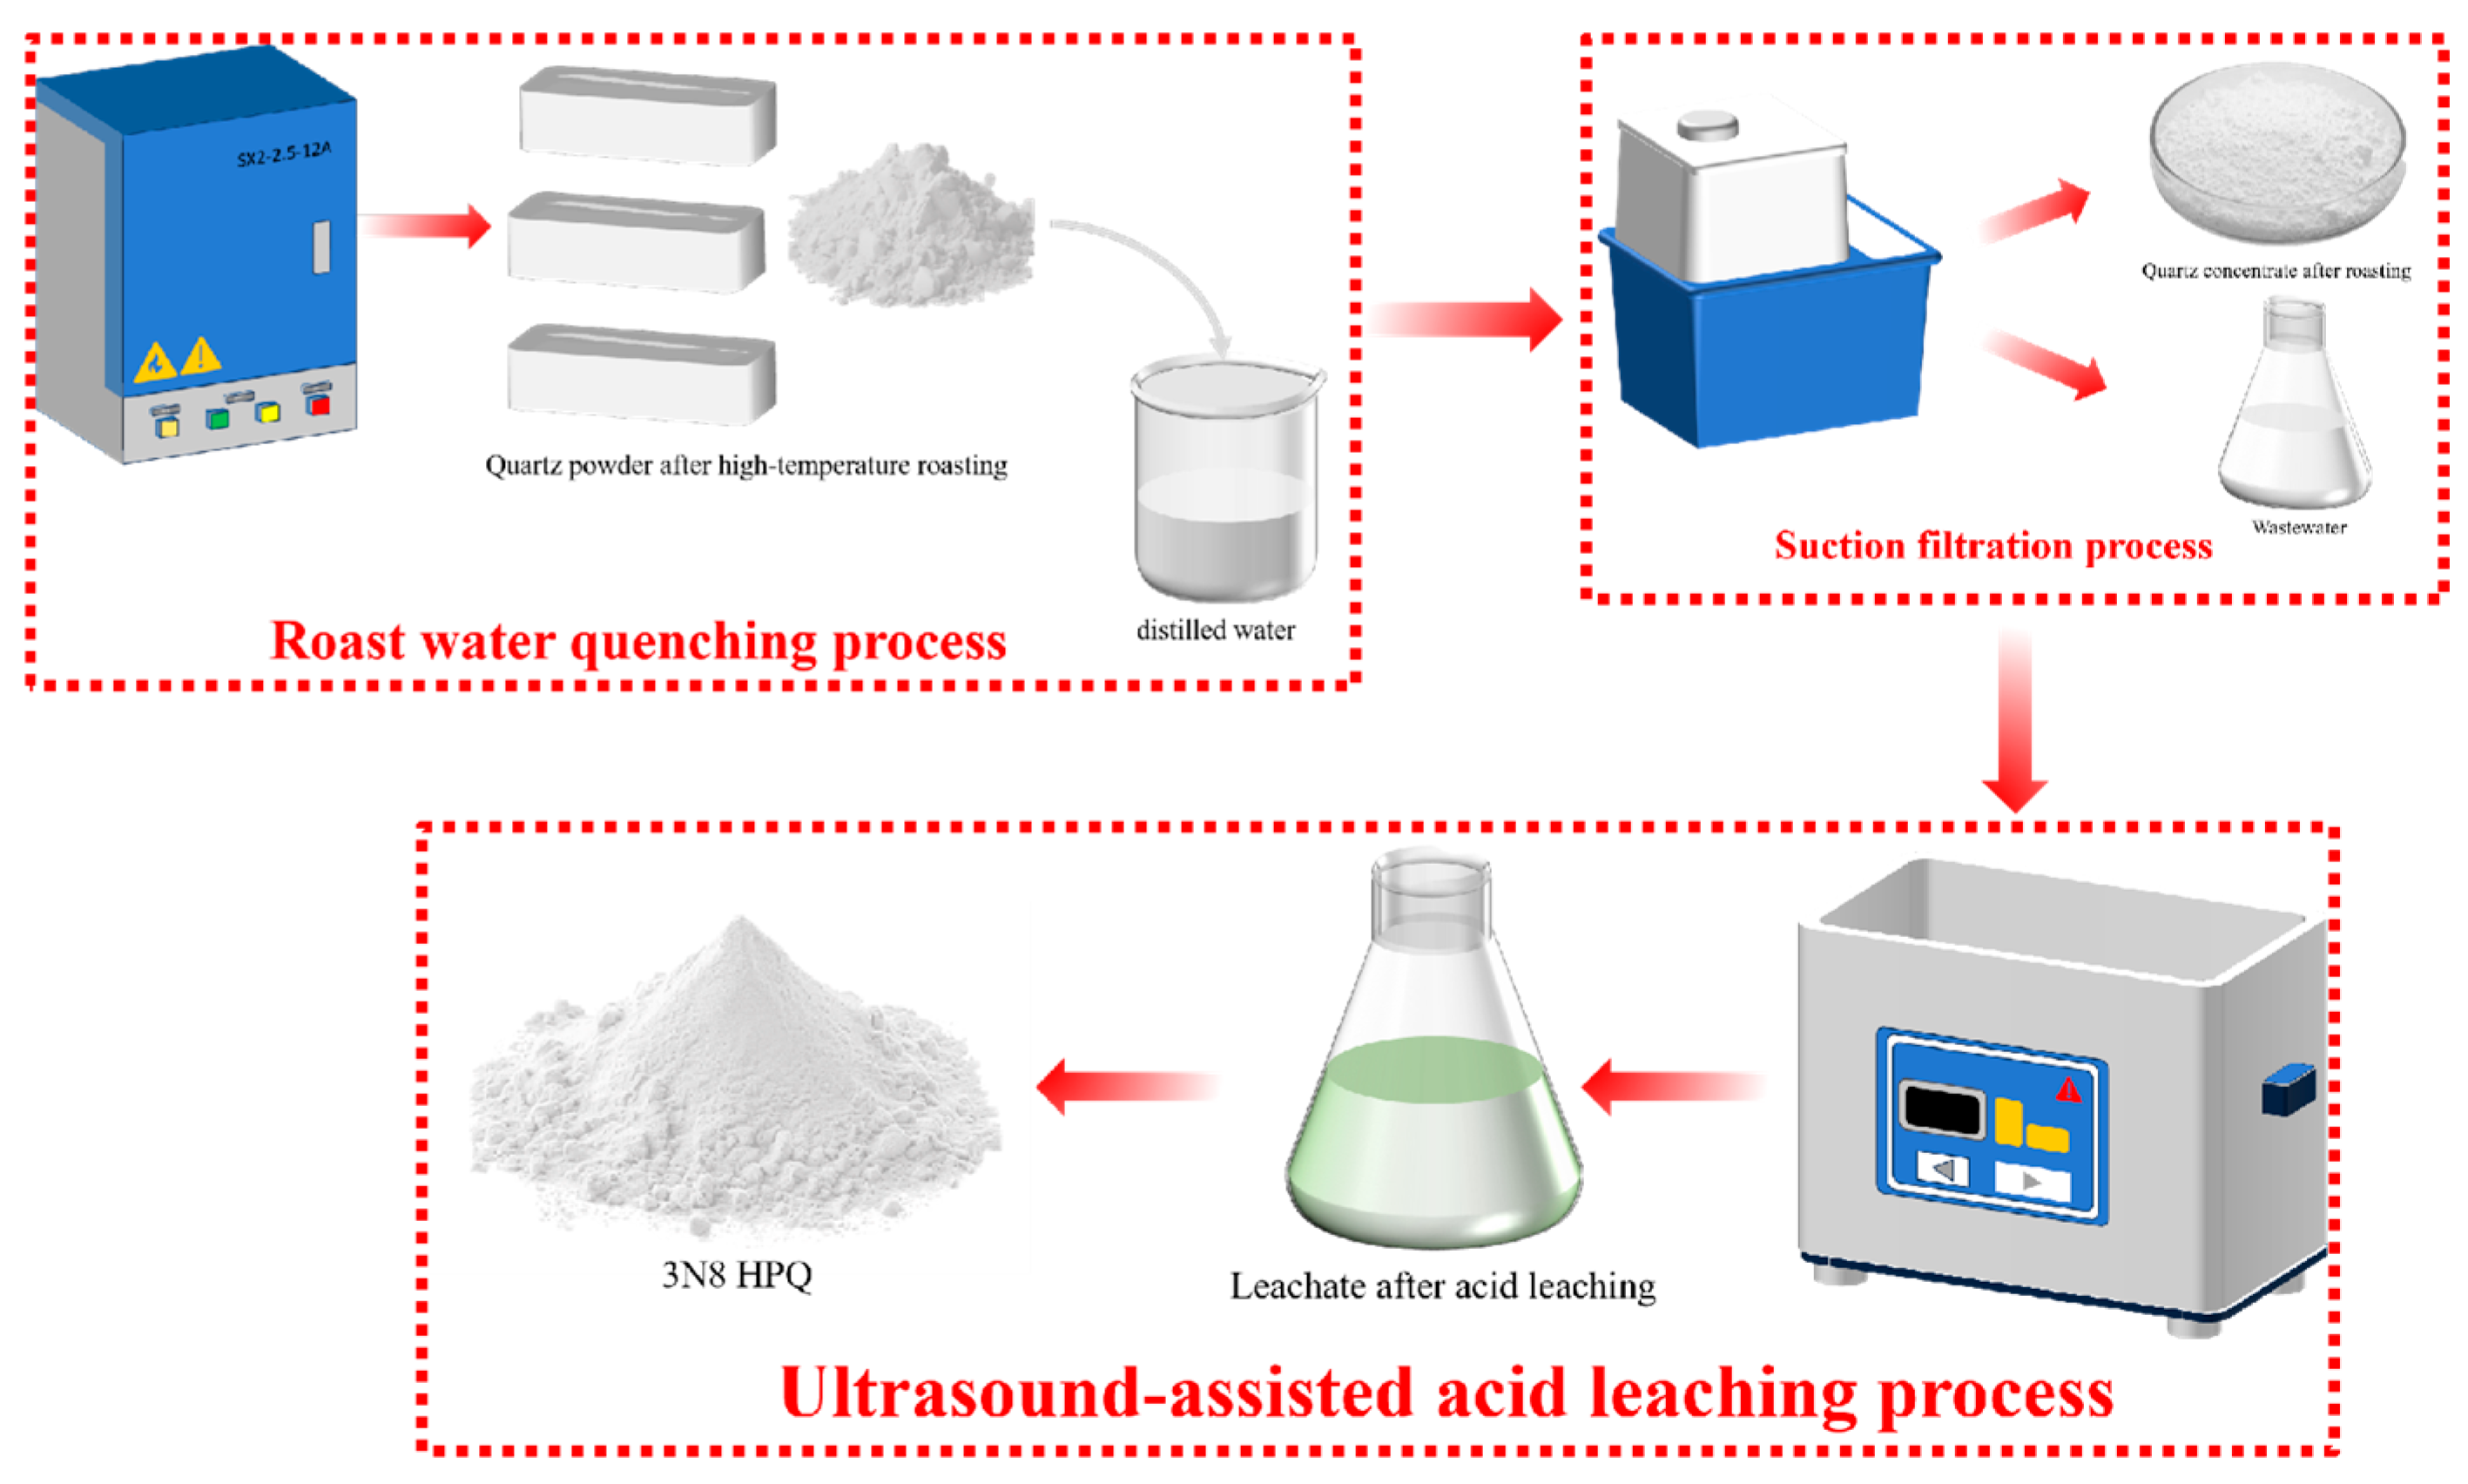
Figure 1. Schematic of the experimental procedure.
Minerals 15 01028 g001
Figure 2. Mineralogical characterization of raw ore: (a) raw ore, (b) XRD, (c) FTIR, (d) TG–DSC, (e) polarized light microscope observation of the quartz conglomerate: (ei) (Q: Quartz, L: Fluid inclusion); (eii,eiii) (L1: Band-like distribution L2: Diffuse distribution); (eiv) (L3: Mineral inclusions).
Minerals 15 01028 g002aMinerals 15 01028 g002b
Figure 3. XRD Patterns of Quartz at Different Roasting Temperatures.
Minerals 15 01028 g003
Figure 4. Morphology of quartz at different roasting temperatures: (a) raw ore; (b) 600 °C; (c) 900 °C; (d) 1200 °C.
Minerals 15 01028 g004
Figure 5. FTIR spectra of quartz after roasting–water quenching at different temperatures.
Minerals 15 01028 g005
Figure 6. FTIR spectrum of samples calcined at 1200 °C and their peak fitting.
Minerals 15 01028 g006
Figure 7. Content and removal rates of Al, Fe, K, and Na by acid leaching after roasting at different temperatures: (a) Al; (b) Fe; (c) K; (d) Na.
Minerals 15 01028 g007
Figure 8. (a) Effect of acid leaching temperature on Fe removal rate, (b) effect of acid leaching time on Fe removal rate.
Minerals 15 01028 g008
Figure 9. Schematic diagram of the ultrasonic cavitation effect.
Minerals 15 01028 g009
Figure 10. (a) Effect of oxalic acid concentration on Fe removal rate, (b) effect of ultrasonic power on Fe removal rate.
Minerals 15 01028 g010
Figure 11. SEM images of quartz: (a) leached quartz samples(Red circle: Quartz impurity without ultrasonic assistance), (b) ultrasound-assisted leached quartz samples(Red circle: Quartz impurity under ultrasound guidance).
Minerals 15 01028 g011
Table 1. The contents of impurity elements of raw quartz by ICP-OES analysis (mg/kg).
ElementNaMgKCaAlTiFeMnCrOthersTotal
Content17138.72190.67168.07421.4516.041204.7354.2919.71118.922403.6
Table 2. Contents and removal rates of Al, Fe, K, and Na by acid leaching after roasting at different temperatures (acid leaching conditions: 10% H2C2O4, 15% HCl, 90 °C, 4 h, and a L/S ratio of 10:1).
SamplesContent (mg/kg)% Removal
AlFeKNaAlFeKNa
Wraw254.5625.09128.44113.0649.8653.630.4349.00
W600219.1515.8771.3377.3657.3068.9228.1556.91
W900183.8210.5956.7442.7465.6086.9536.4164.03
W1200221.1320.7272.5263.5850.6976.6030.9353.75
Table 3. The content of impurity elements in quartz after ultrasonic-assisted acid leaching (mg/kg).
ElementNaMgKCaAlTiFeMnCrOthersTotal
Content after acid leaching32.721.6546.740.29108.233.976.950.130.769.07210.43
Disclaimer/Publisher’s Note: The statements, opinions and data contained in all publications are solely those of the individual author(s) and contributor(s) and not of MDPI and/or the editor(s). MDPI and/or the editor(s) disclaim responsibility for any injury to people or property resulting from any ideas, methods, instructions or products referred to in the content.