Article

Effect of Acidified Water Glass on Flotation Separation of Fluorite and Calcite

1
School of Mining and Coal, Inner Mongolia University of Science and Technology, Baotou 014010, China
2
Inner Mongolia Key Laboratory of Mining Engineering, Baotou 014010, China
3
Inner Mongolia Research Center for Coal Safety Mining and Utilization Engineering and Technology, Baotou 014010, China
4
Inner Mongolia Cooperative Innovation Center for Coal Green Mining and Green Utilization, Baotou 014010, China
5
China-Mongolia Belt and Road Joint Laboratory of Mineral Processing Technology, Inner Mongolia Academy of Science and Technology, Hohhot 010018, China
*
Author to whom correspondence should be addressed.
Minerals 2025, 15(10), 1020; https://doi.org/10.3390/min15101020 (registering DOI)
Submission received: 31 July 2025 / Revised: 19 September 2025 / Accepted: 25 September 2025 / Published: 27 September 2025
(This article belongs to the Section Mineral Processing and Extractive Metallurgy)

Abstract

Flotation separation of fluorite and calcite, by adding AWG (acidified water glass) as inhibitor and NaOL (sodium oleate) as collector, has been investigated by means of micro-flotation tests, flotation solution chemistry, zeta potential measurements, Fourier transform infrared spectroscopy (FTIR), and X-ray photoelectron spectroscopy (XPS) in this study. The micro-flotation results demonstrate that NaOL exhibits strong collecting power toward both fluorite and calcite, making effective separation of the two minerals unachievable in the absence of depressants. When AWG is applied as a depressant, it shows selective depression toward calcite, while exhibiting little effect on fluorite. Solution chemistry analysis, contact angle measurements, zeta potential measurements, FTIR, and XPS analyses collectively confirm that AWG can adsorb onto the calcite surface, but not onto fluorite. This adsorption prevents NaOL from interacting with the calcite surface. In contrast, the absence of AWG adsorption on fluorite allows NaOL to freely adsorb and thereby collect fluorite particles.

1. Introduction

Fluorite, also known as “fluorspar”, is an important raw material for the modern fluorination industry due to its high fluorine content, and is widely used in new energy, national defense, semiconductors, medical care, and other fields [1,2,3,4]. As a non-renewable non-metallic resource, fluorite is hailed as a “rare earth-like” mineral and has been included in strategic minerals by China, the United States, the European Union, Japan, and others. High-grade fluorspar concentrate is often used in the fluorine chemical industry, while low-grade lump fluorspar is mainly applied in the metallurgical industry [5,6,7,8]. There are mainly three types of fluorite deposits in nature, namely quartz-fluorite type, quartz-fluorite-barite type, and quartz-fluorite-calcite type. Calcite is the most common gangue mineral of fluorite. The two minerals have similar physical and chemical properties and belong to the category of slightly soluble minerals. The dissolution or adsorption of slurry components can cause the surface properties of fluorite and calcite to converge, making it difficult to effectively separate them by flotation. Especially when using fatty acid collectors, the floatability of calcite is similar to or even better than that of fluorite, so the separation of fluorite and calcite has always been one of the difficulties in mineral processing [9].
To explore regulators with efficient and selective inhibitory effect on calcite, many researchers have studied numerous inorganic and organic inhibitors, including water glass, polyphosphates, starch, tannins, and others [10,11,12]. Water glass (Na2O·mSiO2) is one of the most common inorganic inhibitors. It is a compound composed of sodium oxide and silicon dioxide in different proportions, with m representing the proportion of silicon dioxide. Water glass can prevent the adsorption of collectors on the surface of minerals through physical or chemical actions, thereby achieving the inhibitory effect. However, in the actual industrial production process, a large amount of water glass is used. While it inhibits calcite, it also has an inhibitory effect on fluorite, resulting in the difficulty of fluorite flotation. Currently, many researchers are considering modifying water glass to improve its selectivity in flotation [13,14,15].
At present, the main methods for modifying water glass are acidification of water glass and modification of water glass with metal ions. Feng et al. acidified sodium silicate with oxalic acid, and the resulting substance can be used as an effective inhibitor for the flotation separation of scheelite and calcite [16]. Tian et al. demonstrated that the combination of Al3+ and water glass enables the flotation separation of fluorite and celestite [17]. Cao et al. achieved effective inhibition of bastnaesite by modifying water glass with Ca2+ [18]. Deng et al. found that Fe2+ can enhance the selective adsorption of water glass on calcite, which results in the flotation separation of scheelite from calcite [19].
Acid-modified water glass has a distinct selective inhibitory effect on silicate and carbonate minerals. Currently, it is mainly applied in the flotation of ores where the gangue minerals are silicate or carbonate, such as the flotation separation of barite and calcite and the separation of ilmenite from olivine [10]. This paper took fluorite and calcite as the research objects and studied the effect of the combined inhibitor of oxalic acid and sodium silicate on the flotation separation of fluorite and calcite through the flotation tests of single minerals and artificially mixed minerals. The mechanism of selective inhibition of AWG was preliminarily explored through Zeta potential measurement, flotation solution chemical calculation, infrared spectroscopy analysis, and XPS analysis.

2. Materials and Methods

2.1. Materials and Reagents

The fluorite and calcite used in this study were mined from the Inner Mongolia Autonomous Region, China. After manual crushing of the ore sample, mineral particles with good crystallization and high purity were manually selected. After grinding by a ceramic ball mill, the −150 + 38 μm particle size was screened out for flotation tests and contact angle measurements. The −38 μm particle size was returned to the ceramic ball mill for grinding to −5 μm for Zeta potential tests and infrared spectroscopy tests. The chemical compositions and XRD patterns of the fluorite and calcite samples are provided in Table 1 and Figure 1, respectively. Chemical analysis indicates that the mineral samples possess high purity levels of 99.1% for fluorite and 98.3% for calcite, fulfilling the requirements for subsequent experiments. Acidified water glass (AWG) is the mixture of oxalic acid (H2C2O4) and water glass (WG). Water glass (Na2O·mSiO2) was industrial grade with the modulus “m” of 2.4. Sodium oleate (NaOL) was used as a collector. The pH of the solution was regulated using hydrochloric acid (HCl) and sodium hydroxide (NaOH). With the exception of water glass, all chemical reagents utilized were of analytical grade. Deionized water was employed throughout all experimental procedures.

2.2. Methods

2.2.1. Micro-Flotation Tests

The XFGC rack flotation machine (Weihai Haiwang Cyclone Co., Ltd., Weihai, China) was selected for the flotation tests, and the rotational speed of the flotation machine was set at 1680 r/min. Weigh the ore sample (pure minerals 2.0 g or artificially mixed samples 3.0 g) with a particle size of −150 + 38 μm and place it in a 40 mL flotation cell. Add 35 mL of deionized water and start stirring. Stir and adjust the slurry with NaOH or HCL for 3 min. Add the inhibitor and stir for 3 min. Add the collector and continue stirring for 3 min. Flotation time was 3 min. The various products obtained by flotation were filtered, dried, and weighed, respectively, and their recovery rates were calculated. Each sample was measured three times, and the average value was taken. The error bars represent the standard deviation.

2.2.2. Contact Angle Measurements

Weigh 2 g of fluorite or calcite sample and adopt the same slurry conditioning method as used in the flotation experiment, adding specific types and concentrations of reagents. After conditioning is completed, filter the slurry and wash the mineral three times with deionized water adjusted to the same pH value. The filtered product was vacuum-dried at 50 °C and then pressed into tablets. The interfacial contact angle of the pressed tablets was measured using a DSA25 contact angle measuring instrument (KRÜSS Scientific, Hamburg, Germany), with image capture taken 2–3 s after the droplet contacted the tablet surface.

2.2.3. Zeta Potential Tests

The Nano-ZS 90 Zeta potential analyzer (Malvern Instruments Ltd., Malvern, UK) was used to measure the zeta potential on the mineral surface. Each time, 50 mg of the mineral sample was weighed and placed in 35 mL of deionized water. On the magnetic stirrer, the slurry was adjusted, and chemicals were added in sequence under the same conditions as in the mineral flotation test. After the stirring was completed, the supernatant was injected into the sample cell for the measurement of the zeta potential on the mineral surface. Each sample was measured three times and the average value was taken as the final value. The error bars represented the standard deviation.

2.2.4. FT-IR Detection

FT-IR spectra were acquired using a Nicolet 740 Fourier (Thermo Fisher Scientific, Waltham, MA, USA) transform infrared spectrometer. For sample preparation, 2 g of pure mineral sample was weighed and transferred into a beaker, followed by the addition of 30 mL of deionized water. The pH was adjusted and flotation reagents were introduced sequentially in accordance with the procedure used in the flotation tests. Then, stir with a magnetic stirrer for 30 min. The pulp after stirring was filtered and then washed three times with water of the same pH value. The filter cake was then dried in a vacuum oven at 35 °C for 24 h. The dried samples were analyzed using an infrared analyzer to generate the corresponding infrared spectra of the samples. The spectral scanning range is 4000 cm−1 to 400 cm−1, and the measurement resolution is 2 cm−1.

2.2.5. X-Ray Photoelectron Spectroscopy Measurement

The XPS spectrum results were obtained by a scanning XPS microprobe system with the PHI 5000 Versa probe II model (ULVAC-PHI, Inc., Chigasaki, Japan). When preparing the sample, 2.0 g of single mineral with a particle size of −74 + 38 μm was placed in a flotation cell, and 35 mL of deionized water was added and stirred for 2 min. Then, flotation reagents were added in sequence. After the flotation process, except for the froth scraping, the pulp was left to stand for 10 min. It was rinsed three times with deionized water of the same pH as the pulp. The sample was then dried in a low-temperature oven (50 °C), and the dried sample was subjected to XPS detection.

3. Results and Discussion

3.1. Flotation Studies

Figure 2 shows the effect of pH value on the flotation recovery of fluorite and calcite using NaOL as the collector. It is evident from the figure that the flotation recoveries of both fluorite and calcite are very high (>80%) in the pH range of 6–12. The high recovery rate is mainly due to the chemical adsorption of NaOL on the mineral surface [20,21]. The recovery rates of fluorite and calcite change minimally with the variation in pH value. The results in Figure 2 indicate that it is difficult to separate fluorite from calcite without adding any inhibitor. As illustrated in Figure 3, the influence of NaOL dosage on the flotation recovery of fluorite and calcite was investigated at pH 6.5. The results indicate that the floatability of both minerals increases rapidly as the NaOL concentration rises. The recoveries of fluorite and calcite reach maximum values (92.5% and 90.3%, respectively) at a NaOL dosage of 1.5 × 10⁻⁴ mol/L.
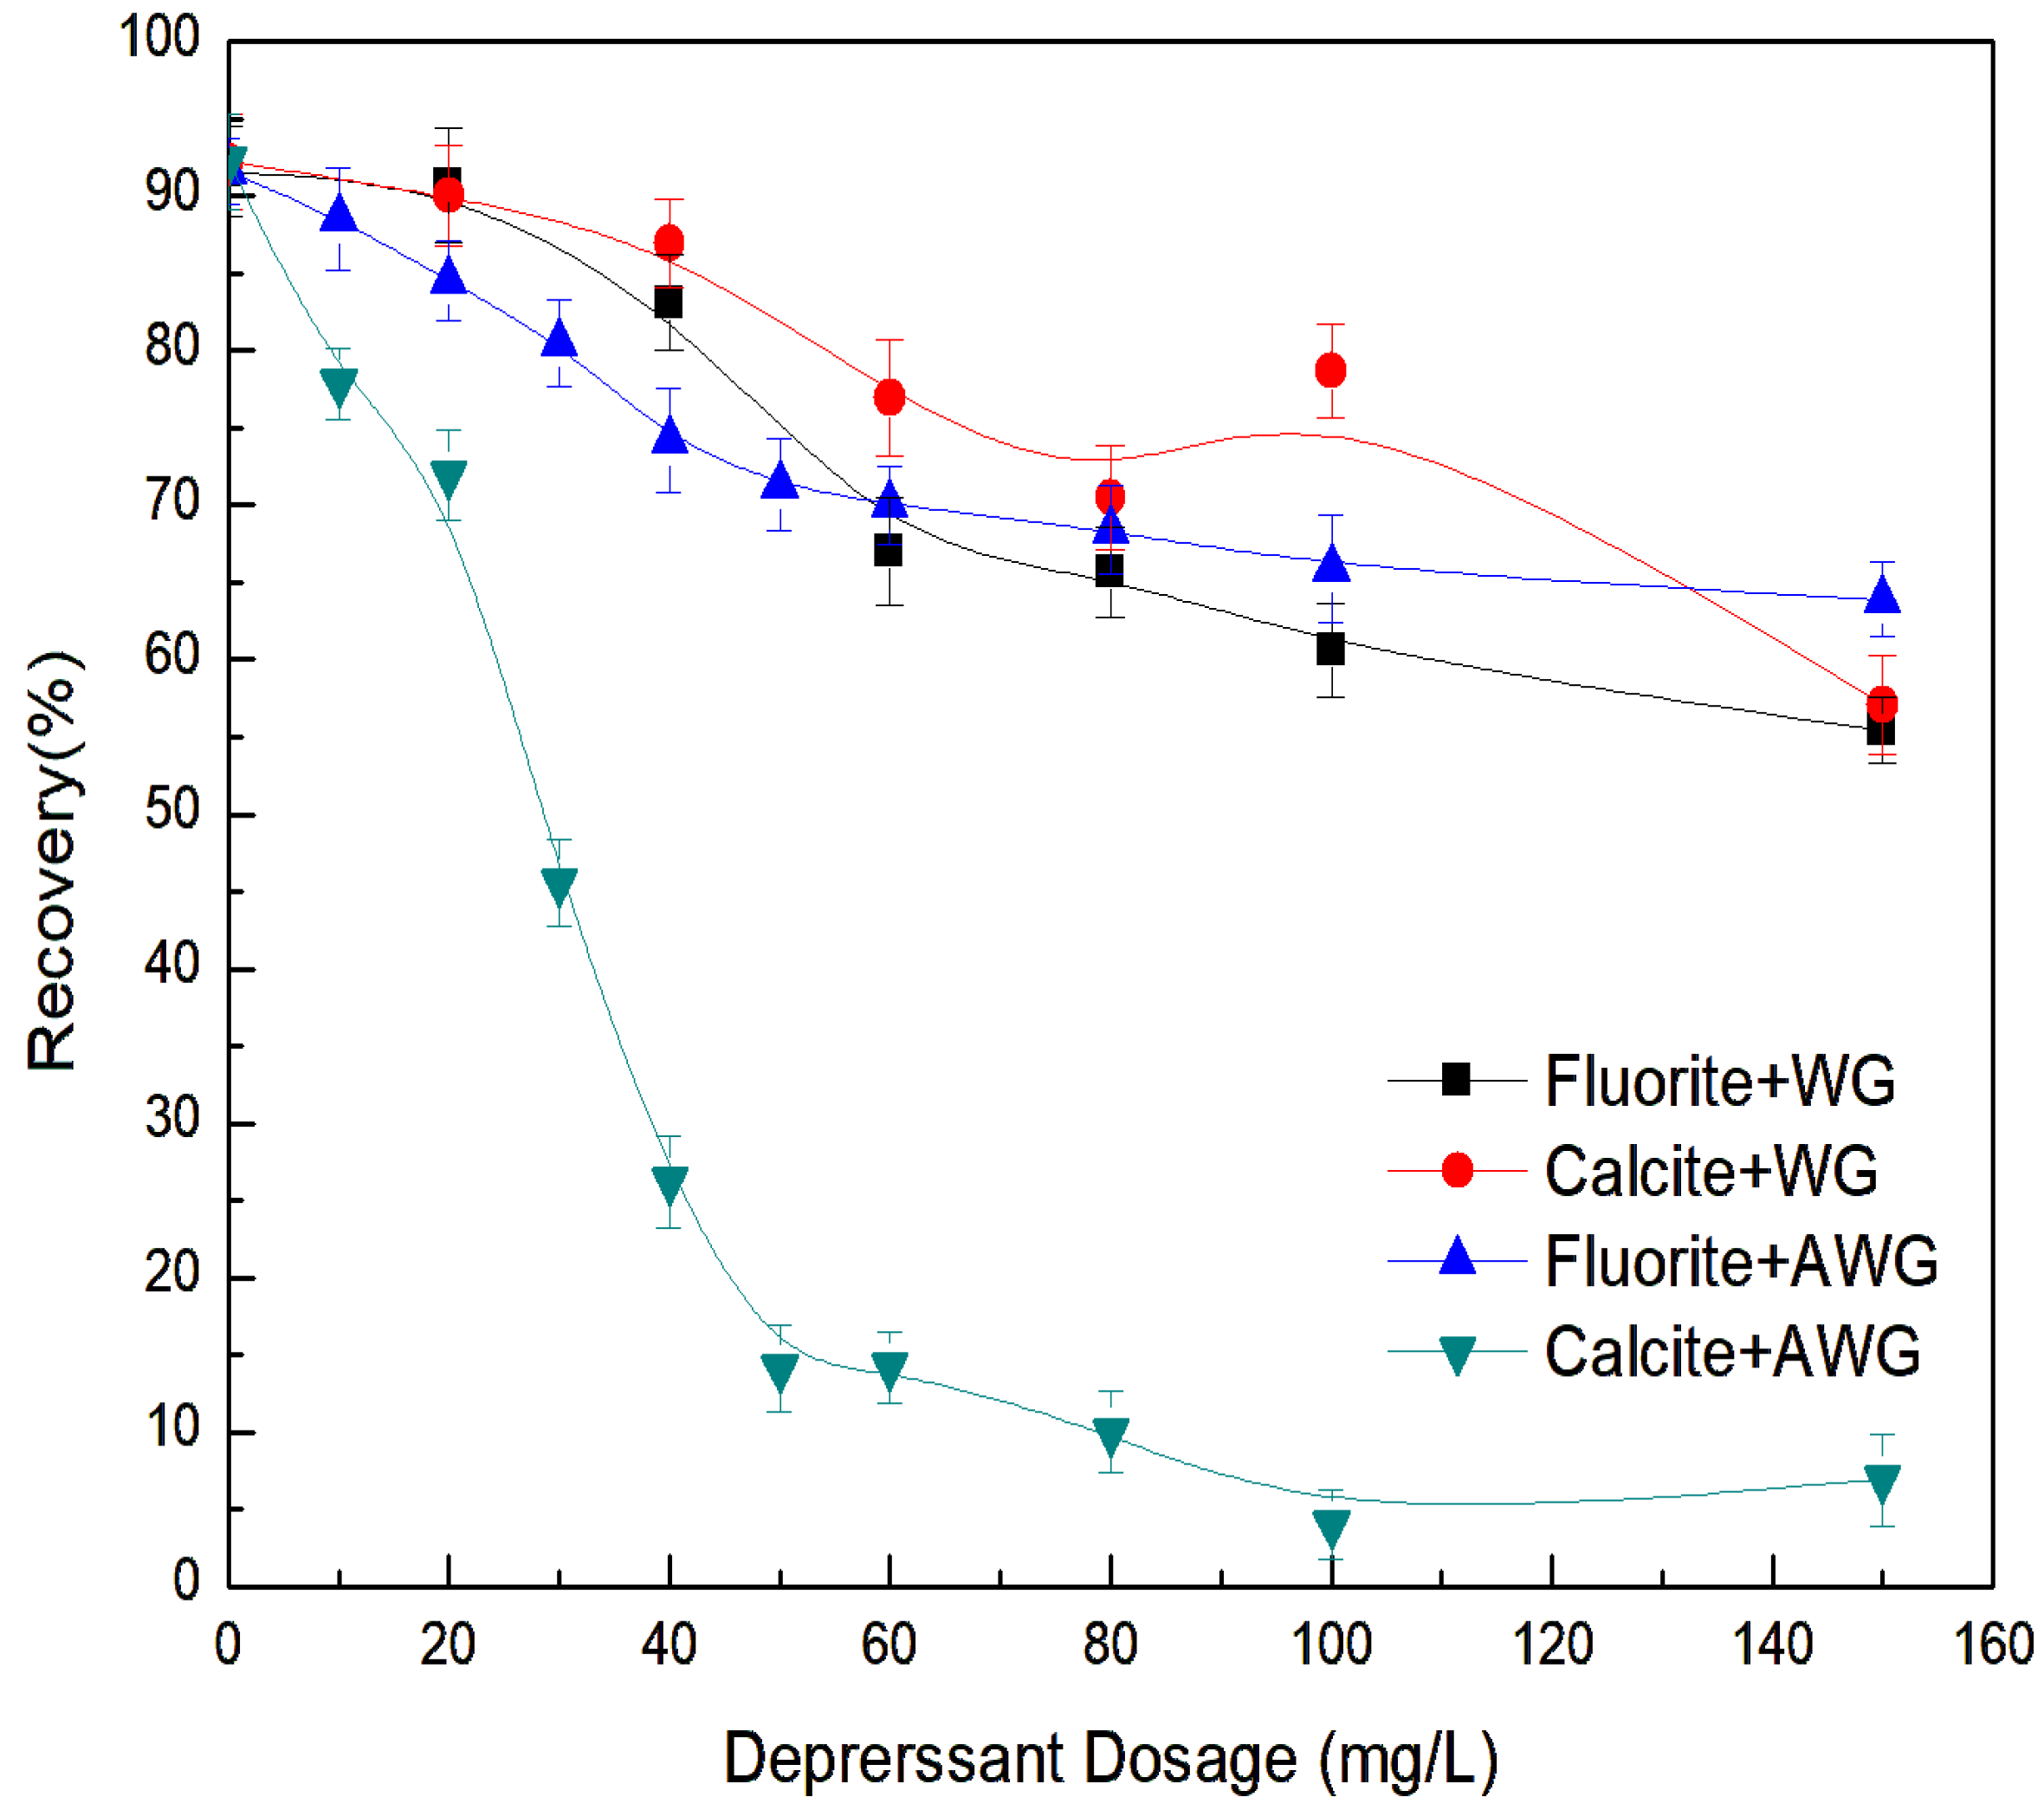
The above experiments show that NaOL has a strong collection ability for both fluorite and calcite, and the flotation separation of the two minerals cannot be achieved without the addition of the depressant. Figure 4 describes the effect of WG and AWG on the flotation behaviors of two minerals with the addition of NaOL (1.5 × 10⁻⁴ mol/L) as the collector. It can be seen from Figure 4 that fluorite and calcite recoveries decrease from about 90% to 55.4% and 57.1%, respectively, as the dosage of WG increases. WG has inhibitory effects on both fluorite and calcite, and its inhibitory effect on fluorite is even stronger than that on calcite. Effective separation of fluorite and calcite cannot be achieved using WG as an inhibitor. When using AWG as a depressant, fluorite recovery drops from 90% to 65.9% as the amount of AWG increases from 0 to 100 mg/L. Different from fluorite, AWG presents strong depression ability on calcite; the flotation recovery of calcite can be reduced from 90% to lower than 10% at the AWG concentration of 100 mg/L. Results demonstrate that AWG exhibits a selective depressing effect on calcite over fluorite, with an optimal dosage identified as 100 mg/L. Therefore, using AWG as an inhibitor is beneficial for the flotation separation of fluorite and calcite.
The flotation behaviors of fluorite and calcite, using AWG at different mass ratios of sodium silicate and oxalic acid were studied. The results are shown in Figure 5. It can be seen from Figure 5 that the optimum mass ratio of sodium silicate to oxalic acid is 3:1 to achieve the best separation effect between fluorite and calcite. Fluorite has a relatively good flotation recovery of 55.4%, while the recovery rate of calcite drops to about 9%. Compared with the results of mineral flotation behavior when sodium silicate is used as an inhibitor in Figure 4, the notable dissimilarity in the flotation behaviors of fluorite and calcite indicates that AWG at a mass ratio of 3:1 can improve the selective separation of two minerals.
The above-mentioned single-mineral flotation experiments have demonstrated that AWG exhibits distinct depression behaviors toward fluorite and calcite. It is expected that the use of AWG as a depressant can achieve the flotation separation of the two minerals. To verify this conclusion, artificial mixed ore flotation tests were conducted. The artificial mixed mineral sample was composed of fluorite and calcite in a mass ratio of 4:1, with a pH value of 6.5. NaOL and AWG were employed as the collector and depressant, respectively. The best experimental results are shown in Table 2. The original grades of fluorite and calcite are 75% and 25%, respectively. The results indicate that without adding AWG, the concentrate grades of fluorite and calcite are 81.9% and 18.1%, respectively, with little difference from those in the original mixed sample. So fluorite cannot be floated away from calcite without adding any depressant. As the amount of AWG increases from 0 mg/L to 150 mg/L, the concentrate grade of fluorite increases from 81.9% to 93.3%, and the recovery rate drops from 95.5% to 75.9%. The experimental results of calcite show different change trends. As the AWG dosage increased, the concentrate grade of calcite declined from 18.1% to 6.7%, and the recovery dropped from 93.4% to 23.2%. This confirms, in a mixed mineral system, that AWG acts as a selective depressant for calcite. Consequently, fluorite can be selectively floated away from calcite when using AWG.

3.2. Contact Angle Analysis

Firstly, contact angle experiments were conducted to understand the wettability of mineral surfaces, and the test results are shown in Table 3. From Table 3, it can be seen that in the absence of NaOL, the contact angles of fluorite and calcite are 39.17° and 26.54°, respectively. Both fluorite and calcite are naturally hydrophilic. As the concentration of NaOL increases, the contact angles of the two minerals gradually rise, indicating that the addition of NaOL changes the minerals surface from hydrophilic to hydrophobic. When the concentration of NaOL is 1.5 × 10⁻⁴ mol/L, the contact angles of fluorite and calcite are 97.01° and 84.92°, respectively, exhibiting strong hydrophobicity. As the concentration of NaOL increases further, the contact angles do not change significantly, indicating that a concentration of 1.5 × 10⁻⁴ mol/L is the optimal amount of NaOL. This result corresponds to the flotation results shown in Figure 3.

3.3. Computational Analysis of Solution Chemistry

At present, researchers usually modify WG with metal ions (Cu2+, Pb2+, Zn2+, Al3+) or acids (HCl, H2SO4, H2C2O4). These activators induce the decomposition of sodium silicate oligomers into highly reactive monomeric silicic acid. This generated species can then selectively adsorb onto the target mineral, forming a hydrophilic layer [22,23,24].
Water glass is an alkaline salt and undergoes severe hydrolysis in aqueous solution.
The reaction is as follows:
SiO2(s, amorphous) + 2H2O ⇄ Si(OH)4  logK1 = −2.7
Si(OH)4 ⇄ SiO(OH)3 + H+        logK2 = −9.43
SiO(OH)3 ⇄ SiO2 (OH)22− + H+      logK3 = −12.56
Figure 6 shows the distribution of dissolved components of WG in aqueous solution. As can be seen from Figure 6, there are three different silicon-containing components in the WG solution. According to the different pH values, the dominant components of the three silicon-containing components are different. When the pH of the solution is less than 9.4, the main hydrolyzed component in the WG solution is Si(OH)4; when the pH value of the solution is between 9.4 and 12.6, SiO(OH)3 is the dominant component in the WG solution; when the pH of the solution is greater than 12.6, SiO2(OH)22− is the main component in the solution. After mixing oxalic acid with WG, an increase in the concentration of free H+ will force the hydrolysis reactions (2) and (3) of the water glass to proceed to the left, thereby generating more effective Si(OH)4 for inhibiting the flotation of calcite [25,26]. As the content of Si(OH)4 increases, the contents of the effective components SiO(OH)3- and SiO2(OH)22− that inhibit fluorite decrease accordingly.

3.4. Zeta Potential Analysis

The above flotation test results indicate that the separation of fluorite and calcite can be achieved through flotation. To gain insight into the interaction mechanism of AWG with fluorite and calcite, zeta potential, FT-IR, and XPS analyses were conducted.
Figure 7 shows the zeta potentials of fluorite and calcite following pretreatment with 100 mg/L AWG and subsequent conditioning with 1.5 × 10⁻⁴ mol/L NaOL. As shown in Figure 7, the zeta potentials of fluorite and calcite drop with increasing pH value, and the isoelectric points of fluorite and calcite are around pH 7.5 and 9.0, respectively, which are similar to the previous research results [27,28]. It can be seen from Figure 7a, by adding NaOL, the zeta potential of fluorite decreases dramatically, illustrating NaOL can adsorb on the fluorite surface. When adding AWG before NaOL, the zeta potential of fluorite is similar to that of fluorite in the presence of NaOL. The results indicate that the interaction of AWG with the fluorite surface is weak and cannot prevent NaOL from adsorbing on the surface of fluorite. Figure 7b reveals that compared with the zeta potential of calcite, the zeta potential of calcite significantly reduces in the presence of NaOL. The results indicate NaOL can also adsorb on the surface of calcite. The zeta potential of calcite significantly reduces in the presence of AWG, suggesting that a strong interaction occurred between AWG and the calcite surface. However, after calcite is treated with AWG and NaOL in sequence, the zeta potential of calcite remains nearly unchanged compared with adding AWG alone, suggesting that the addition of AWG inhibits the interaction between NaOL and the calcite surface. It illustrates that adding AWG can prevent the adsorption of NaOL onto the calcite surface. The above zeta potential results are consistent with the flotation test results.

3.5. FT-IR Spectra Analysis

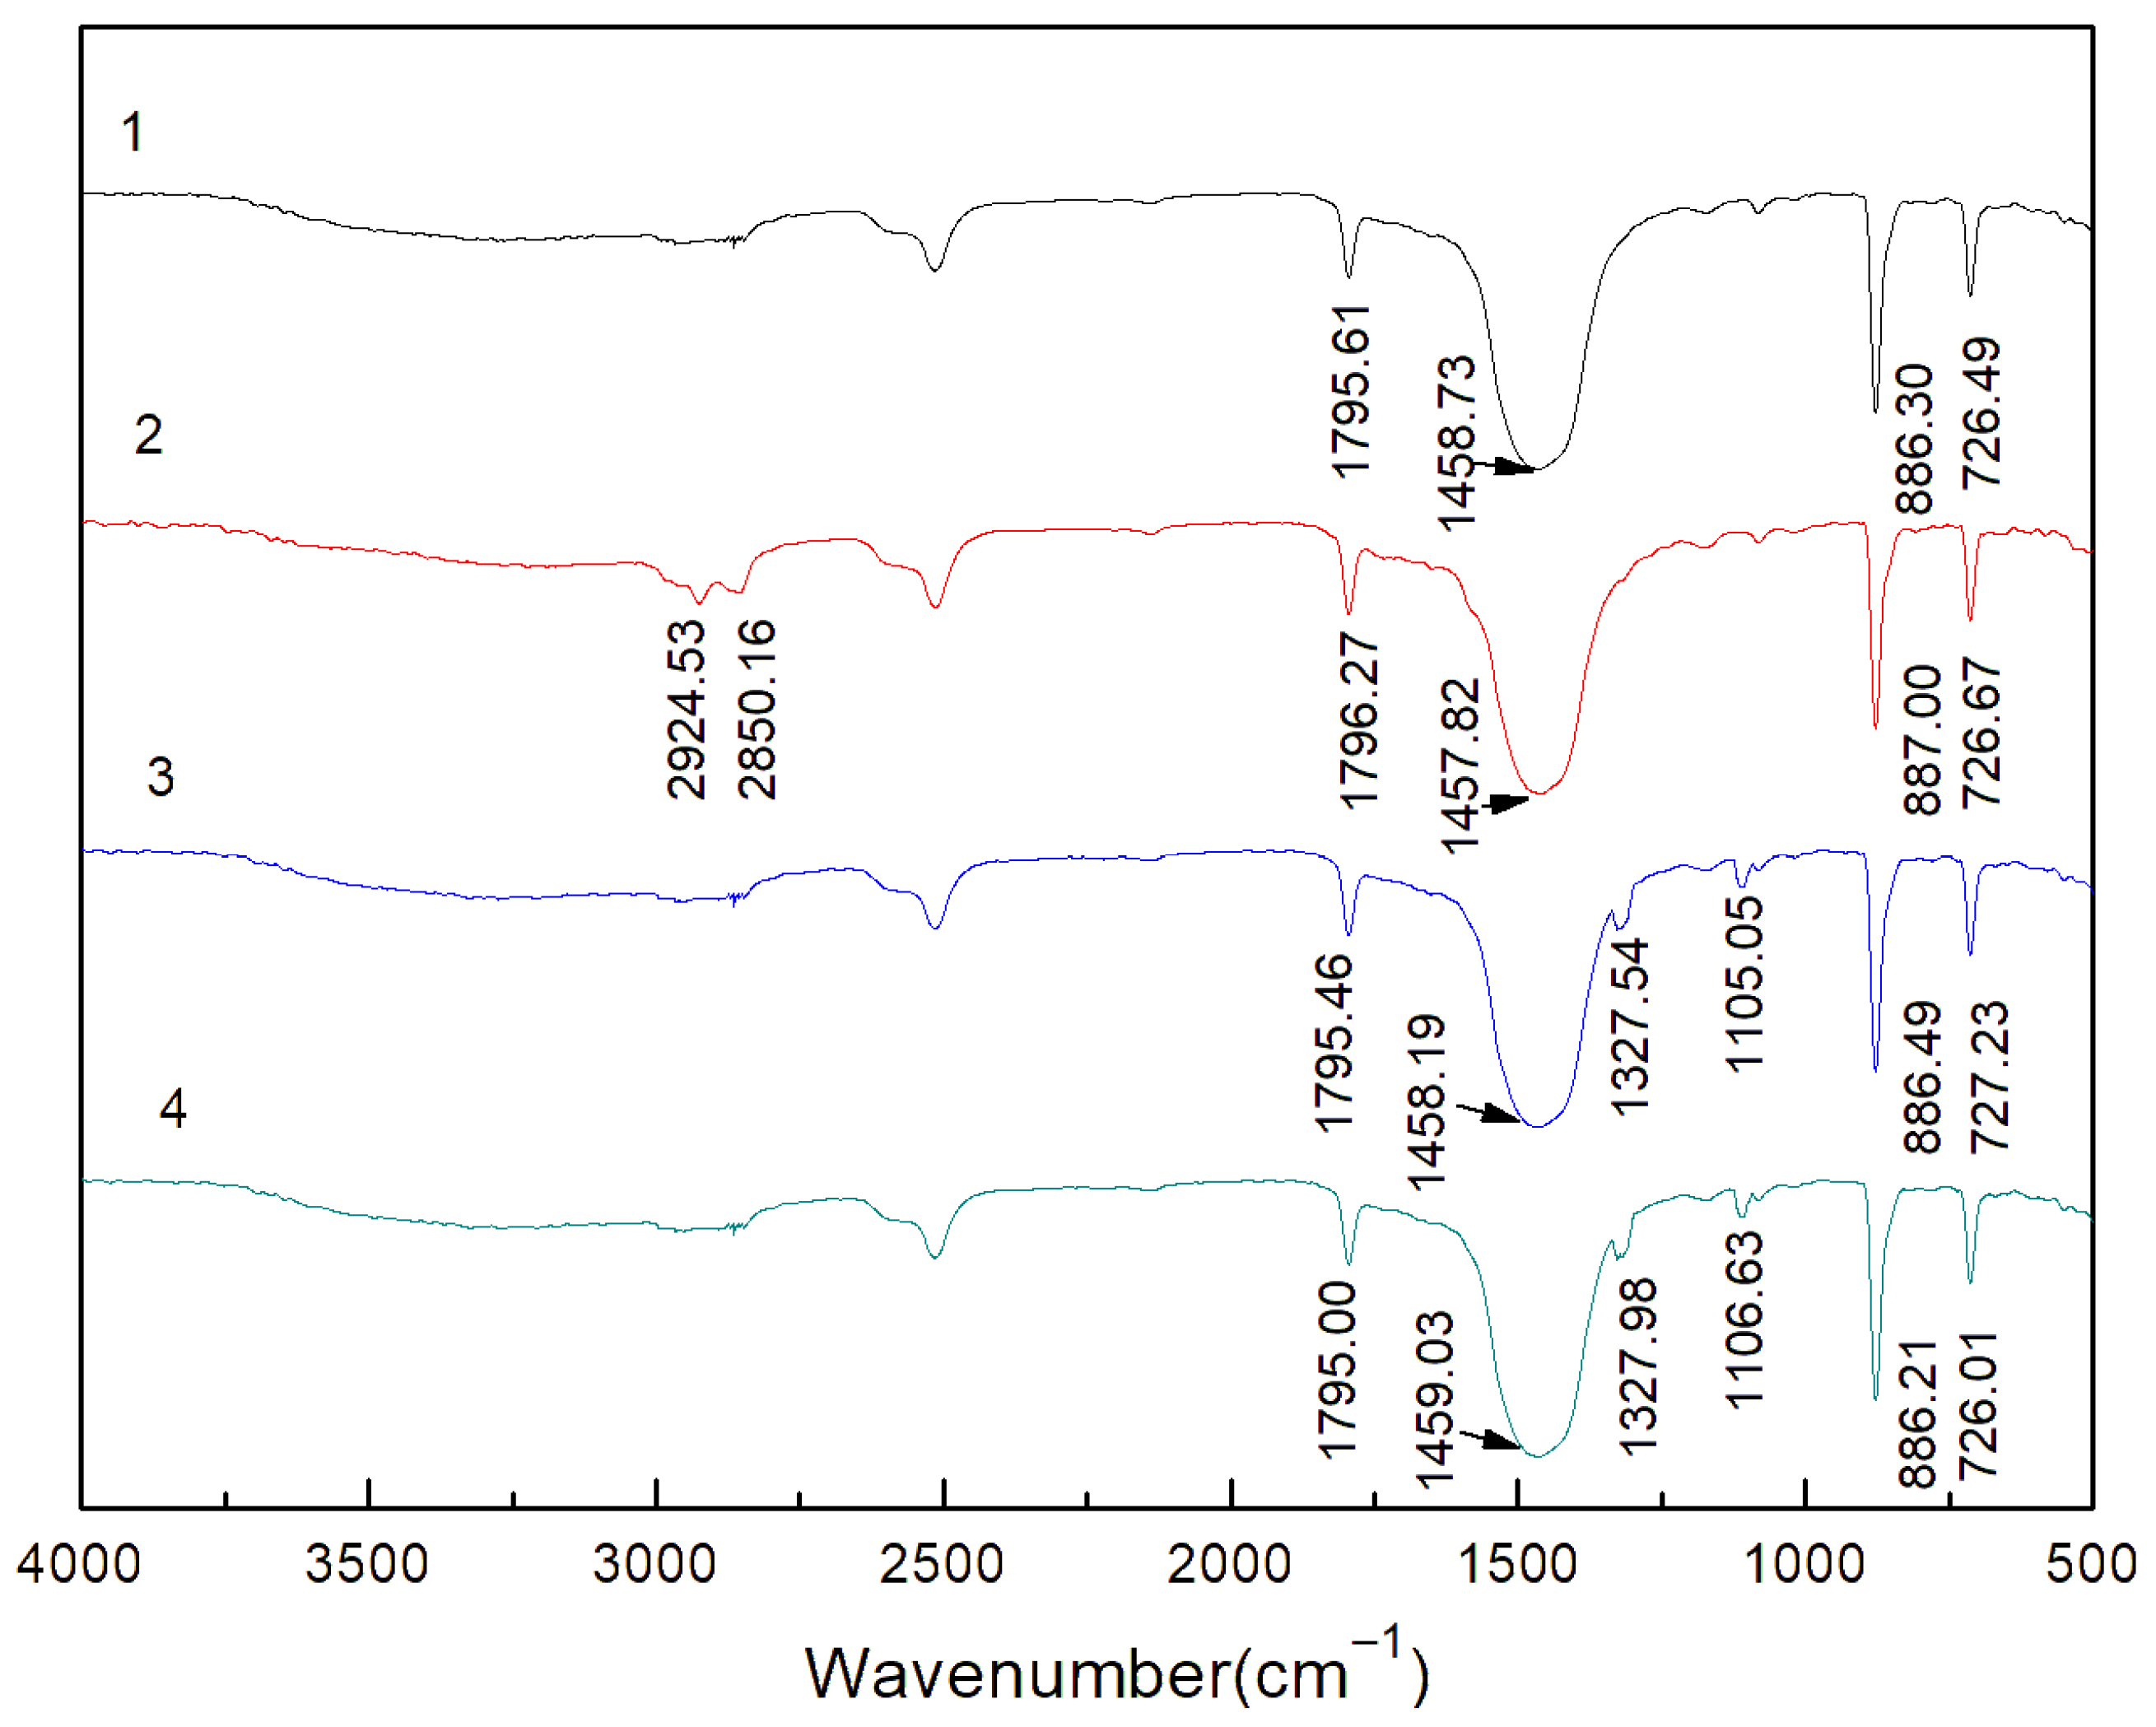
FTIR is commonly used to evaluate the absorption peaks of chemical agents on mineral surfaces [29]. To further study the mechanism of various reagents on the flotation behaviors of fluorite and calcite, FT-IR spectra analysis measurements were investigated. FT-IR spectra of fluorite and calcite before and after conditioning with AWG and NaOL are shown in Figure 8 and Figure 9, respectively.
The spectrum for raw fluorite is shown in Figure 8 (Line 1). Line 2 in Figure 8 presents the FT-IR spectra of fluorite after interacting with NaOL. Two new peaks are located at 2925.16 cm−1 and 2854.01 cm−1, corresponding to the stretching vibration peaks of –CH2– and –CH3 groups; another new peak at 1561.73 cm−1 is caused by the adsorption of the carbonyl mode (C=O) of NaOL, implying the adsorption of NaOL on the surface of fluorite [30,31,32]. Line 3 is the IR spectrum of fluorite treated with AWG, and there is no obvious new peak in Line 3. It means that AWG cannot adsorb on the surface of fluorite. The spectral changes in fluorite after treatment with AWG and NaOL are depicted in Line 4. Similar with Line 2, the characteristic peaks originating from NaOL are still present at 2925.93 cm−1, 2853.96 cm−1, and 1561.29 cm−1, but no new peaks representing the adsorption of AWG on fluorite surface. These results demonstrate that AWG has a minimal impact on the fluorite surface and does not inhibit the adsorption of NaOL.
The spectrum for raw calcite is shown in Figure 9 (Line 1). As depicted in Line 1, the peak tensile vibration of C-O in exposed calcite is located at 1396.29 cm−1, while the bending vibration peak is located at 886.3 cm−1 and 726.49 cm−1. The above three peaks are characteristic peaks of calcite [33]. The infrared spectrum of calcite after adding NaOL is shown in Line 2. The emergence of new bands at 2924.53 cm−1 and 2850.16 cm−1 in Line 2 is ascribed to the stretching vibrations of -CH2- and -CH3 groups. However, the characteristic NaOL absorption bands near 1560 cm−1 are obscured by the overlapping carbonate (CO32−) band. The new bands which are above-mentioned indicate that NaOL is chemisorbed on the calcite surface. Line 3 is the FTIR spectrum of calcite after interacting with AWG. Two new peaks locate near 1327.54 cm−1, 1105.05 cm−1. The peak at 1327.54 cm−1 is the asymmetric stretching vibration of the carbonyl of calcium oxalate monohydrate. The presence of the new peak at 1105.05 cm−1 indicates the characteristic absorption peak of Si-OH in Si(OH)4 [16,34]. These new peaks in Line 3 indicate that AWG can adsorb on the surface of calcite. Line 4, corresponding to calcite pre-treated with AWG followed by NaOL, exhibits the complete absence of characteristic NaOL bands. Instead, the emergence of new bands at 1327.98 and 1106.63 cm−1, attributable to AWG, is observed. The above results indicate that AWG, with its stronger competitive adsorption capacity and hydrophilicity, can prevent the adsorption of NaOL on the surface of calcite, thereby inhibiting calcite.

3.6. XPS Result Analysis

As a pivotal technique for surface characterization, XPS has been extensively employed to determine the chemical composition and elucidate the elemental states on mineral surfaces [35,36]. To further clarify the selective interaction mechanism of flotation reagents with the two minerals, XPS analysis was conducted to examine the chemical species present on fluorite and calcite surfaces before and after treatment with AWG.
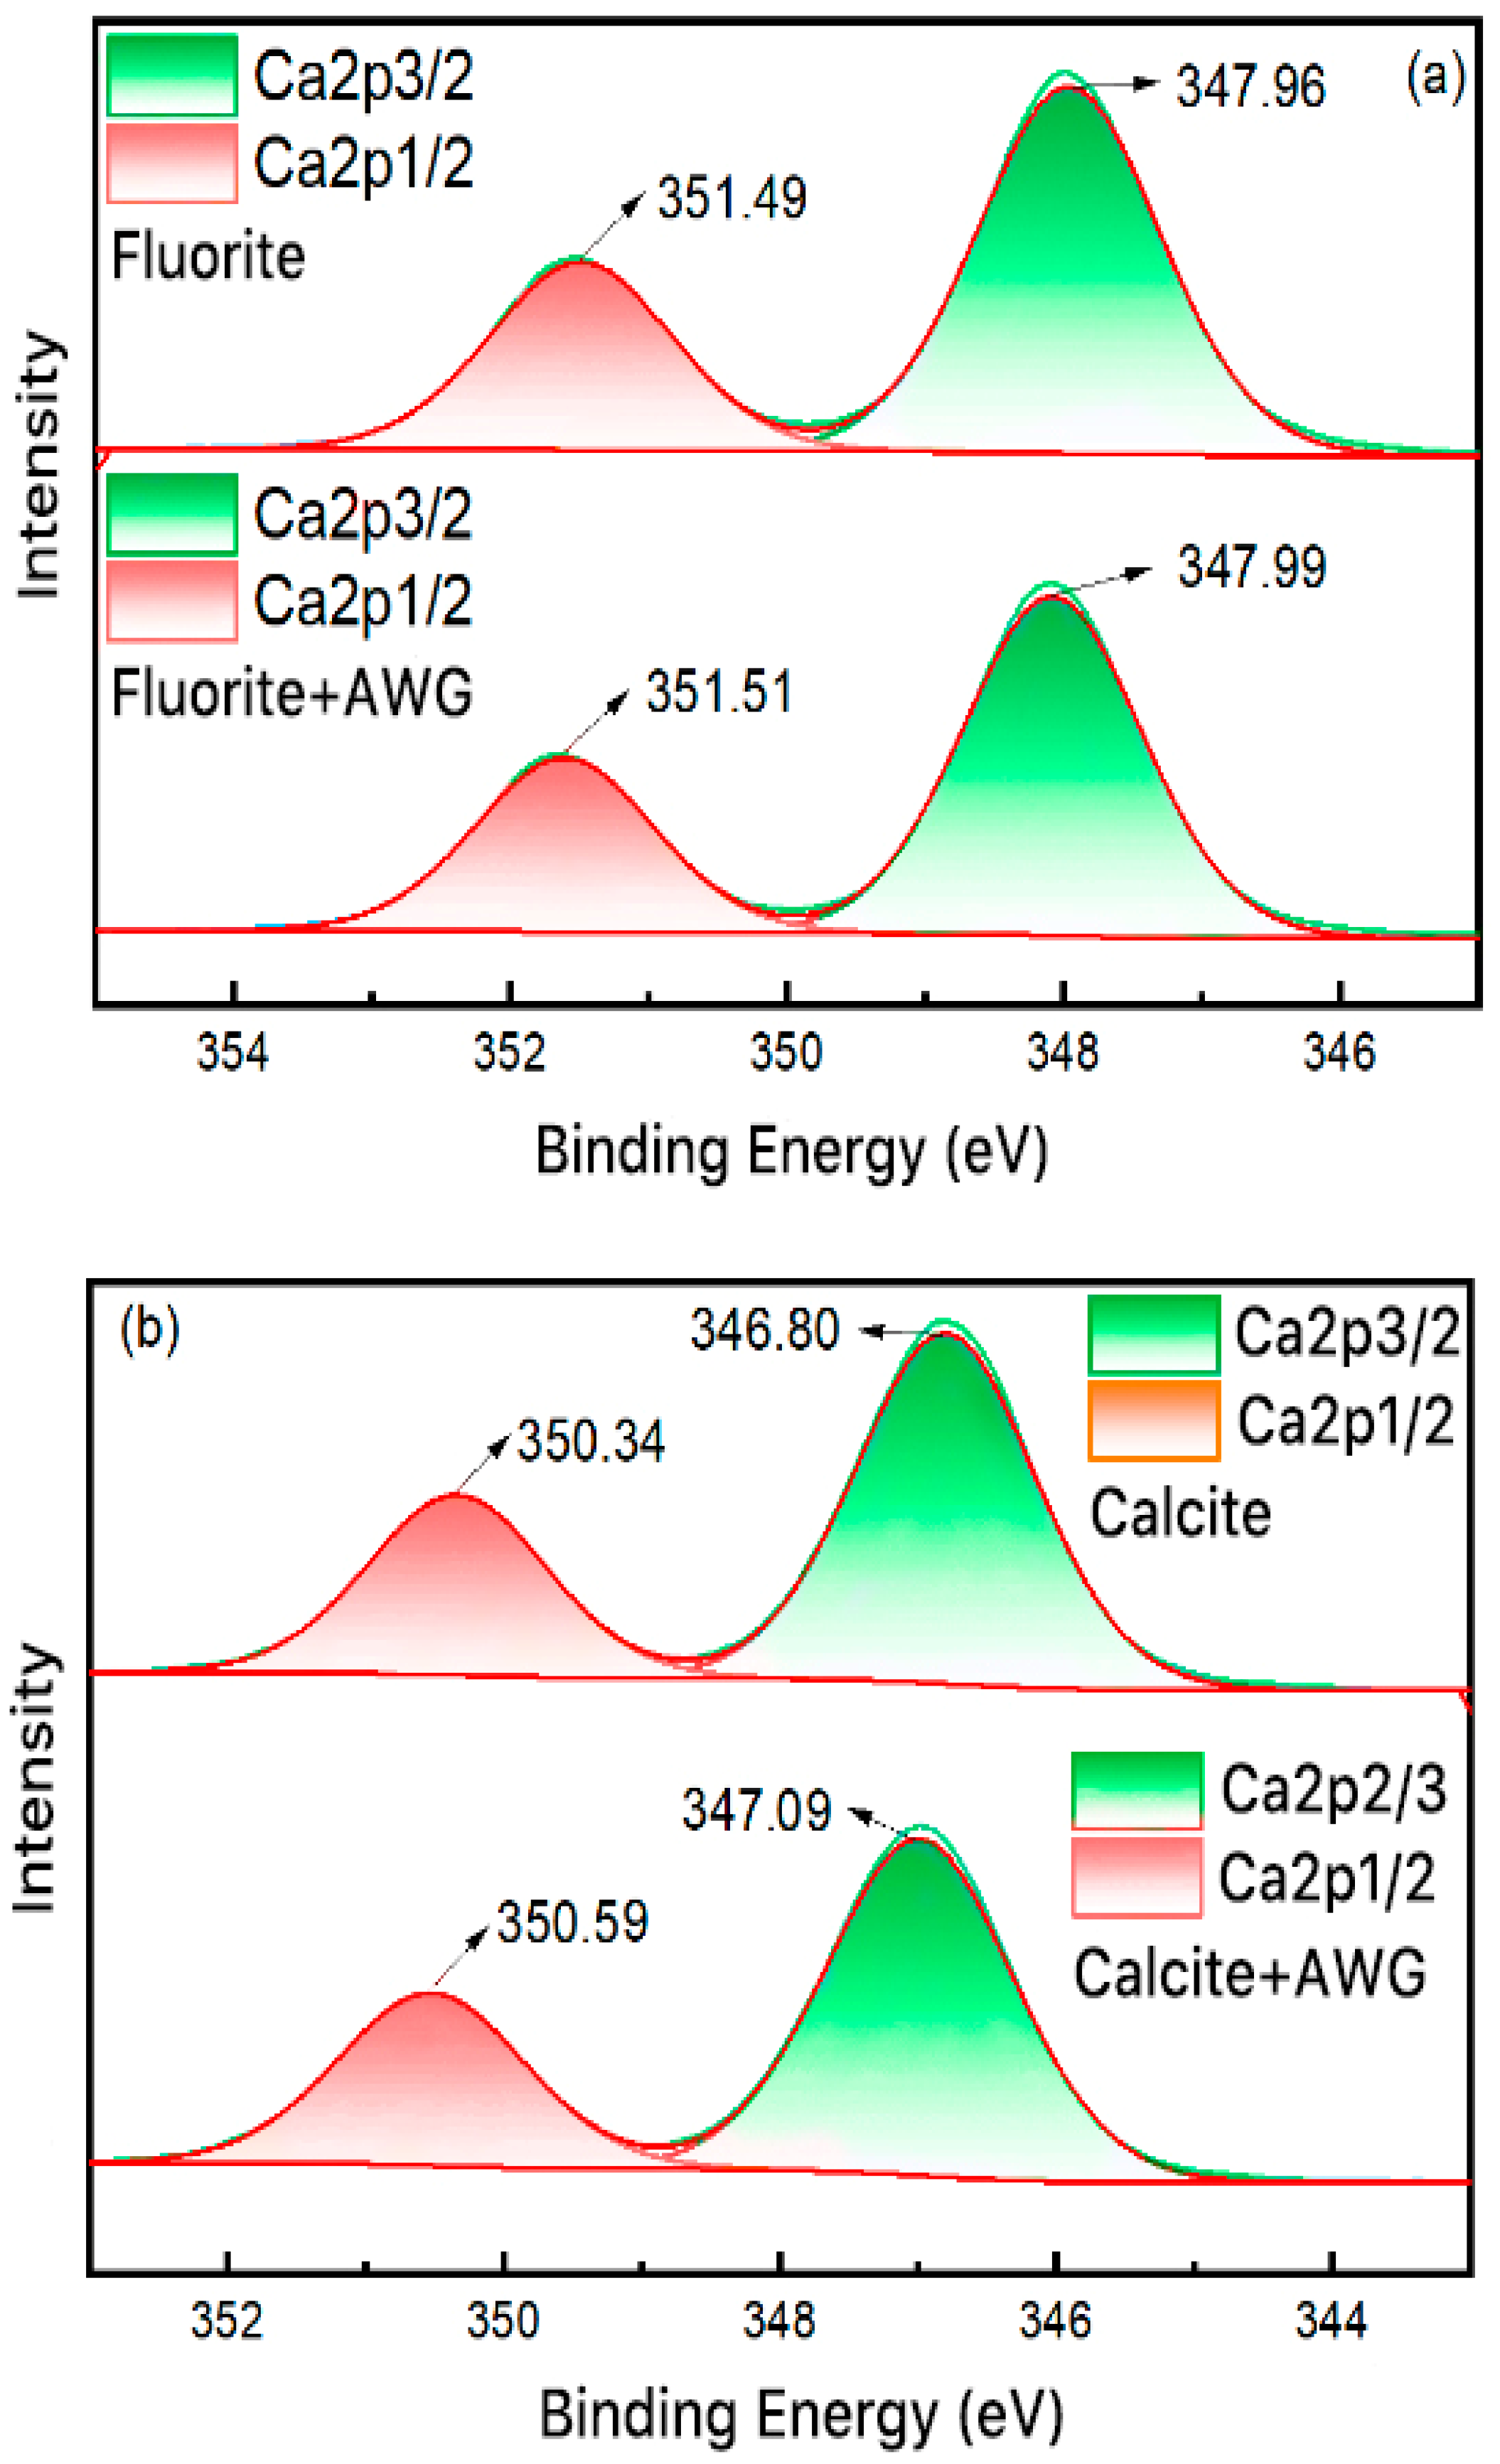
The XPS narrow spectra of the Ca 2p region on fluorite surface, as well as the Ca 2p and O 1s regions on calcite surface, were obtained before and after treatment with AWG. The corresponding results are shown in Figure 10.
From Figure 10a, it can be seen that due to spin–orbit coupling, the Ca 2p energy level of fluorite is divided into two peaks, namely Ca 2p1/2 (351.49 eV) and Ca 2p3/2 (347.96 eV) [37]. Following treatment with AWG, the binding energies of these peaks experienced minor shifts to 351.51 eV and 347.99 eV, corresponding to changes of 0.02 eV and 0.03 eV, respectively. These minimal changes indicate that there is no significant chemical reaction occurring between the Ca sites on the surface of fluorite and AWG. This means that AWG has almost no effect on the surface of fluorite.
Figure 10b shows the Ca 2p spectrum for the calcite sample. The characteristic peaks at 350.34 eV and 346.80 eV are attributed to the Ca 2p1/2 and Ca 2p3/2 states, respectively. After treatment with AWG, the two peaks shift to 350.59 eV and 347.09 eV. The offsets of the two peaks are 0.25 eV and 0.29 eV, respectively. This obvious deviation indicates that AWG undergoes strong chemical adsorption on the surface of calcite.
As shown in Figure 10c, the O 1s spectrum of natural calcite displays two fitted peaks at 531.33 eV and 532.75 eV, corresponding to C–O and Ca–O bonds, respectively. After interaction with AWG, these peaks shift to 531.34 eV and 533.09 eV, resulting in energy changes of 0.01 eV and 0.34 eV. The pronounced shift in the Ca–O-related peak suggests that AWG interacts preferentially with the Ca–O species on the calcite surface. Moreover, a new peak emerges at 529.85 eV, which is assigned to the Si–O species. This provides evidence for the chemisorption of Si(OH)4 onto the calcite surface mainly through a dehydrogenation mechanism between the –OH group of Si(OH)4 binding to Ca active sites.

4. Conclusions

In this work, without adding any inhibitor, the flotation separation of fluorite and calcite cannot be achieved. This is mainly because fluorite and calcite have good inherent floatability in the pulp solution. AWG is added as an inhibitor in the flotation slurry of fluorite and calcite. By controlling the pulp pH value at 6.5 and using NaOL as the collector and AWG as the depressant, the flotation separation efficiency of fluorite and calcite can be realized. The above flotation results indicate that AWG has a strong selective depression on calcite. By the analysis of contact angle measurements, flotation solution chemistry, zeta potential measurements, the infrared spectra, and XPS, it is concluded that AWG can adsorb on the surface of calcite to prevent the adsorption of NaOL onto the calcite surface. On the contrary, AWG cannot adsorb on the surface of fluorite, so NaOL can still adsorb on fluorite. This is why AWG has a good selective inhibitory effect in the flotation separation process of fluorite and calcite.
However, it is recognized that this research is conducted in a well-controlled pure mineral system, primarily elucidating the fundamental mechanism of the depressant combination. While this provides a clear physicochemical foundation for understanding its depressing behavior, the complexity of real ore systems may influence the performance of the depressants. Therefore, to validate the conclusions from the pure mineral experiments in a practical environment and to evaluate the industrial application potential of this synergistic scheme, subsequent research will crucially include flotation tests on real ores containing typical calcium-bearing gangue minerals with the aim of promoting its practical application in mineral processing.

Author Contributions

Investigation, data curation, formal analysis, visualization, writing—original draft, funding acquisition, N.L.; conceptualization, methodology, supervision, writing—review and editing, B.Y.; project administration, resources, X.L.; investigation, methodology, D.L. All authors have read and agreed to the published version of the manuscript.

Funding

This research was supported by the Natural Science Foundation of the Inner Mongolia Autonomous Region (2025YQ018).

Data Availability Statement

The original contributions presented in this study are included in the article. Further inquiries can be directed to the corresponding author.

Conflicts of Interest

The authors declare no conflicts of interest.

References

  1. Peng, W.J.; Zhang, L.Y.; Bai, L.L.; Qiu, Y.S. Flotation research of a fluorite ore. Appl. Mech. Mater. 2014, 539, 781–784. [Google Scholar] [CrossRef]
  2. Zhou, W.B.; Moreno, J.; Torres, R.; Valle, H.; Song, S.X. Flotation of fluorite from ores by using acidized water glass as depressant. Miner. Eng. 2013, 45, 142–145. [Google Scholar] [CrossRef]
  3. Liu, C.; Song, S.; Li, H. Selective flotation of fluorite from barite using trisodium phosphate as a depressant. Miner. Eng. 2019, 134, 390–393. [Google Scholar] [CrossRef]
  4. Li, C.; Gao, Z. Tune surface physicochemical property of fluorite particles by regulating the exposure degree of crystal surfaces. Miner. Eng. 2018, 128, 123–132. [Google Scholar] [CrossRef]
  5. Zhang, Y.; Song, S. Beneflciation of fluorite by flotation in a new chemical scheme. Miner. Eng. 2003, 16, 597–600. [Google Scholar] [CrossRef]
  6. Kienko, L.A.; Samatova, L.A.; Voronova, O.V.; Kondrat’ev, S.A. Lower temperature flotation of carbonate-fluorite ores. J. Min. Sci. 2010, 46, 317–323. [Google Scholar] [CrossRef]
  7. Aliaga, W.; Sampaio, C.H.; Brum, I.A.S.; Ferreira, K.R.S.; Batistella, M.A. Flotation of high-grade fluorite in a short column under negative bias regime. Miner. Eng. 2006, 19, 1393–1396. [Google Scholar] [CrossRef]
  8. Zheng, R.; Ren, Z.; Gao, H.; Chen, Z.; Qian, Y.; Li, Y.J. Effects of crystal chemistry on sodium oleate adsorption on fluorite surface investigated by molecular dynamics simulation. Miner. Eng. 2018, 124, 77–85. [Google Scholar] [CrossRef]
  9. Sun, R.F.; Liu, D.; Liu, Y.B.; Wang, D.Q.; Wen, S.M. Pb-water glass as a depressant in the flotation separation of fluorite from calcite. Miner. Eng. 2021, 628, 127447. [Google Scholar] [CrossRef]
  10. Deng, J.; Liu, C.; Yang, S.Y.; Li, H.Q.; Liu, Y. Flotation separation of barite from calcite using acidified water glass as the depressant. Colloid. Surf. A 2019, 579, 123605. [Google Scholar] [CrossRef]
  11. Zhou, Q.; Lu, S.J. Acidized sodium silicate—An effective modifier in fluorite flotation. Miner. Eng. 1992, 5, 435–444. [Google Scholar] [CrossRef]
  12. Ding, K.; Laskowski, J.S. Application of a modified water glass in a cationic flotation of calcite and dolomite. J. Can. Metall. Q. 2006, 45, 199–206. [Google Scholar] [CrossRef]
  13. Kupka, N.; Rudolph, M. Froth flotation of scheelite—A review. Int. J. Min. Sci. Technol. 2018, 28, 373–384. [Google Scholar] [CrossRef]
  14. Yao, W.; Li, M.; Zhang, M.; Cui, R.; Shi, J.; Ning, J. Effect of Zn2+ and its addition sequence on flotation separation of scheelite from calcite using water glass. Colloid. Surf. A 2020, 588, 124394. [Google Scholar] [CrossRef]
  15. Jin, S.Z.; Ou, L.M.; Ma, X.Q.; Zhou, H.; Zhang, Z.J. Activation mechanisms of sodium silicate-inhibited fluorite in flotation under neutral and slightly alkaline conditions. Miner. Eng. 2021, 161, 106738. [Google Scholar] [CrossRef]
  16. Feng, B.; Luo, X.P.; Wang, J.P.; Wang, P.C. The flotation separation of scheelite from calcite using acidified sodium silicate as depressant. Miner. Eng. 2015, 80, 45–49. [Google Scholar] [CrossRef]
  17. Tian, J.; Xu, L.; Sun, W.; Zeng, X.; Fang, S.; Han, H.; Hong, K.; Hu, Y. Use of Al2(SO4)3 and acidified water glass as mixture depressants in flotation separation of fluorite from calcite and celestite. Miner. Eng. 2019, 137, 160–170. [Google Scholar] [CrossRef]
  18. Cao, Z.; Cheng, Z.; Wang, J.L.; Cao, Y.D. Synergistic depression mechanism of Ca2+ ions and sodium silicate on bastnaesite flotation. J. Rare Earths 2022, 40, 988–995. [Google Scholar] [CrossRef]
  19. Deng, R.; Yang, X.; Hu, Y.; Ku, J.; Zuo, W.; Ma, Y. Effect of Fe(II) as assistant depressant on flotation separation of scheelite from calcite. Miner. Eng. 2018, 118, 133–140. [Google Scholar] [CrossRef]
  20. Rao, K.H.; Antti, B.M.; Forssberg, E. Mechanism of oleate interaction on salttype minerals, part II. Adsorption and electrokinetic studies of apatite in the presence of sodium oleate and sodium metasilicate. Int. J. Miner. Process. 1990, 28, 59–79. [Google Scholar] [CrossRef]
  21. Cui, Y.F.; Jiao, F.; Wei, Q.; Wang, X.; Dong, L.Y. Flotation separation of fluorite from calcite using sulfonated lignite as depressant. Sep. Purif. Technol. 2020, 242, 116698. [Google Scholar] [CrossRef]
  22. Dong, L.; Jiao, F.; Qin, W.; Zhu, H.; Jia, W. Effect of acidified water glass on the flotation separation of scheelite from calcite using mixed cationic/anionic collectors. Appl. Surf. Sci. 2018, 444, 747–756. [Google Scholar] [CrossRef]
  23. Wei, Z.; Hu, Y.; Han, H.; Sun, W.; Wang, R.; Wang, J. Selective flotation of scheelite from calcite using Al-Na2SiO3 polymer as depressant and Pb-BHA complexes as collector. Miner. Eng. 2018, 120, 29–34. [Google Scholar] [CrossRef]
  24. Qi, W.G.; Klauber, C.; Warren, L.J. Mechanism of action of sodium silicate in the flotation of apatite from hematite. Int. J. Miner. Process. 1993, 39, 3–4. [Google Scholar] [CrossRef]
  25. Wang, D.Z.; Hu, Y.H. Chemistry of Flotation Solution; Hunan Science and Technology Press: Changsha, China, 1988; pp. 336–337. (In Chinese) [Google Scholar]
  26. Foucaud, Y.; Badawi, M.; Filippov, L.O.; Barres, O.; Filippova, I.V.; Lebègue, S. Synergistic adsorption of Na2CO3 and Na2SiO3 on calcium minerals revealed by spectroscopic and ab initio molecular dynamics studies. Chem. Sci. 2019, 10, 9928–9940. [Google Scholar] [CrossRef]
  27. Yang, S.Y.; Xu, Y.L.; Liu, C. The anionic flotation of fluorite from barite using gelatinized starch as the depressant. Colloid. Surf. A 2020, 597, 124794. [Google Scholar] [CrossRef]
  28. Liu, C.; Zhu, Y.H.; Huang, K.H. Studies of benzyl hydroxamic acid/calcium lignosulphonate addition order in the flotation separation of smithsonite from calcite. Int. J. Min. Sci. Technol. 2021, 31, 1153–1158. [Google Scholar] [CrossRef]
  29. Shi, J.Y.; Lv, J.; Wang, J.L.; Cao, Z. Hydrolytic polymaleic acid: An environmentally friendly inhibitor for the flotation separation of parisite from calcite and fluorite. Appl. Surf. Sci. 2025, 680, 161396. [Google Scholar] [CrossRef]
  30. Luo, N.; Shi, J.Y.; Yan, B.B.; Wang, X.P. Flotation separation of magnesite from dolomite using sodium silicate modified with zinc sulfate as a selective depressant. Minerals 2024, 14, 355. [Google Scholar] [CrossRef]
  31. Liu, W.; Zhang, S.; Wang, W.; Zhang, J.; Yan, W.; Deng, J.; Feng, Q. The effects of Ca(II) and Mg(II) ions on the flotation of spodumene using NaOL. Miner. Eng. 2015, 79, 40–46. [Google Scholar] [CrossRef]
  32. Liu, C.; Feng, Q.; Zhang, G. Electrokinetic and flotation behaviors of hemimorphite in the presence of sodium oleate. Miner. Eng. 2015, 84, 74–76. [Google Scholar] [CrossRef]
  33. Chen, W.; Feng, Q.; Zhang, G.; Yang, Q.; Zhang, C. The effect of sodium alginate on the flotation separation of scheelite from calcite and fluorite. Miner. Eng. 2017, 113, 1–7. [Google Scholar] [CrossRef]
  34. He, J.; Chen, H.; Zhang, M.; Chen, L.; Yao, Q.; Dai, Y.; Zhu, L.; Liu, C. Combined inhibitors of Fe3+, Cu2+ or Al3+ and sodium silicate on the flotation of fluorite and quartz. Colloids Surf. Physicochem. Eng. Asp. 2022, 643, 128702. [Google Scholar] [CrossRef]
  35. Wei, Q.; Dong, L.; Jiao, F.; Qin, W. Selective flotation separation of fluorite from calcite by using sesbania gum as depressant. Miner. Eng. 2021, 174, 107239. [Google Scholar] [CrossRef]
  36. Zhu, L.; Liu, J.; Zhu, Y.; Gong, G.; Han, Y. Mechanism of HCA and CEPPA in flotation separation of cassiterite and fluorite. Miner. Eng. 2022, 187, 107773. [Google Scholar] [CrossRef]
  37. Wang, X.; Liu, J.; Zhu, Y.M.; Li, Y.J. Adsorption and depression mechanism of an eco-friendly depressant PBTCA on fluorite surface for the efficient separation of cassiterite from fluorite. Miner. Eng. 2021, 171, 107124. [Google Scholar] [CrossRef]
Figure 1. X-ray powder diffraction (XRD) patterns of samples: (a) fluorite; (b) calcite.
Minerals 15 01020 g001
Figure 2. The effect of pH value on floatability of fluorite and calcite (C(NaOL) = 1.5 × 10⁻⁴ mol/L).
Minerals 15 01020 g002
Figure 3. The effect of NaOL dosage on fluorite and calcite flotation at pH 6.5.
Minerals 15 01020 g003
Figure 4. Floatability of fluorite and calcite as a function of inhibitor concentration (C(NaOL) = 1.5 × 10⁻⁴ mol/L pH = 6.5).
Minerals 15 01020 g004
Figure 5. The effect of mass ratio of sodium silicate to oxalic acid on fluorite and calcite flotation (C(NaOL) = 1.5 × 10⁻⁴ mol/L; C(AWG) = 100 mg/L; pH = 6.5).
Minerals 15 01020 g005
Figure 6. The effect of pH value on the species distribution of WG.
Minerals 15 01020 g006
Figure 7. The zeta potentials of fluorite (a) and calcite (b) untreated or treated with different reagents.
Minerals 15 01020 g007aMinerals 15 01020 g007b
Figure 8. FT-IR spectra of fluorite conditioned with different reagents: 1—fluorite; 2—fluorite + NaOL; 3—fluorite + AWG; 4—fluorite + AWG + NaOL.
Minerals 15 01020 g008
Figure 9. FT-IR spectra of calcite conditioned with different reagents: 1—calcite; 2—calcite + NaOL; 3—calcite + AWG; 4—calcite + AWG + NaOL.
Minerals 15 01020 g009
Figure 10. XPS narrow spectra of Ca 2p on fluorite surface: (a), Ca 2p on calcite surface (b), and O 1s on calcite surface (c), before and after treatment of AWG.
Minerals 15 01020 g010aMinerals 15 01020 g010b
Table 1. Chemical composition of fluorite and calcite (wt%).
SamplesCaF2CaCO3SiO2OthersTotal
Fluorite99.100.250.320.33100
Calcite/98.300.511.19100
Table 2. Flotation separation results of fluorite–calcite mixture minerals using AWG as a depressant. (C(NaOL) = 1.5 × 10⁻⁴ mol/L; pH = 6.5; mass ratio of fluorite and calcite is 4:1).
AWG Dosage (mg/L)ProductProductivity (%)FluoriteCalcite
Grade (%)Recovery (%)Grade (%)Recovery (%)
0concentrate95.3381.8995.5318.1194.44
tailing4.6778.174.4721.835.56
raw ore10081.7210018.28100
100concentrate76.3490.1086.679.9036.62
tailing23.6644.7113.3355.2963.38
raw ore10079.3610020.64100
150concentrate65.8593.2775.936.7323.19
tailing34.1557.0224.0742.9876.81
raw ore10080.8910019.11100
Table 3. Contact angle measurement results (pH = 7 ± 0.5).
NaOL Concentration (×10−4 mol/L)Fluorite Contact AngleCalcite Contact Angle
039.17°26.54°
1.068.80°60.23°
1.597.01°84.92°
2.096.38°84.47°
Disclaimer/Publisher’s Note: The statements, opinions and data contained in all publications are solely those of the individual author(s) and contributor(s) and not of MDPI and/or the editor(s). MDPI and/or the editor(s) disclaim responsibility for any injury to people or property resulting from any ideas, methods, instructions or products referred to in the content.