Article

Effect of Manganese Oxide Mineralogy and Surface Mo Coverage on Mo Isotope Fractionation During the Adsorption Process

1
Division of Natural System, Graduate School of Natural Science, Kanazawa University, Kakuma, Kanazawa 920-1192, Ishikawa, Japan
2
Japan Agency for Marine-Earth Science and Technology (JAMSTEC), 2-15 Natsushimacho, Yokosuka 237-0061, Kanagawa, Japan
3
Atmosphere and Ocean Research Institute, The University of Tokyo, 5-1-5 Kashiwanoha, Kashiwa 277-8564, Chiba, Japan
4
Department of Earth and Planetary Science, Graduate School of Science, The University of Tokyo, 7-3-1 Hongo, Tokyo 113-0033, Bunkyo-ku, Japan
5
Institute of Nature and Environmental Technology, Kanazawa University, Kakuma, Kanazawa 920-1192, Ishikawa, Japan
*
Author to whom correspondence should be addressed.
Minerals 2025, 15(1), 79; https://doi.org/10.3390/min15010079
Submission received: 27 November 2024 / Revised: 2 January 2025 / Accepted: 14 January 2025 / Published: 16 January 2025
(This article belongs to the Section Environmental Mineralogy and Biogeochemistry)

Abstract

:
The large molybdenum (Mo) isotope fractionation from seawater is caused by the adsorption of Mo on manganese oxides. However, the effects of the manganese oxide mineralogy (crystal structure) and surface Mo coverage on Mo isotope fractionation have not been investigated. In this study, the isotope fractionation of Mo by adsorption on synthetic todorokite, birnessite, and δMnO2 was investigated under a wide range of surface Mo coverages. The Mo isotope fractionation changed from Δ98/95Mo = 2.18 ± 0.05‰ to 2.61 ± 0.06‰ for todorokite; from 1.25 ± 0.05‰ to 2.10 ± 0.05‰ for birnessite; and from 2.19 ± 0.07‰ to 2.73 ± 0.08‰ for δMnO2. The Mo isotope fractionations of the three manganese oxides were negatively correlated with surface coverage normalized to the specific surface area. The independence of the obtained correlation of the manganese oxide species indicates that the Mo isotope fractionation depends on the surface coverage but not on the mineralogy of the manganese oxides. The experimentally observed Mo isotope fractionation (<2.7‰) in manganese oxides generally underestimates the isotope fractionation in natural ferromanganese oxides (~3‰). According to the dependency of the Mo isotope fractionation on the surface coverage, the underestimation relative to previous experimental studies can be attributed to the lower Mo surface coverage of natural ferromanganese oxides.

1. Introduction

The molybdenum (Mo) isotope ratio in modern oxic seawater is very heavy with δ98/95Mo (+2.1‰) [1,2] because of the preferential adsorption of the lighter Mo isotope on ferromanganese oxides [1,2]. Laboratory studies have attempted to reproduce large Mo fractionation ([3,4,5]) using spectroscopic and theoretical considerations [6,7,8,9,10,11]. Although Mn and Fe oxides are major components in ferromanganese oxides, the fractionations caused by Fe oxides, except for hematite, are too small to account for the observed large fractionation in natural samples [5]. Spectroscopic analysis of ferromanganese oxides has revealed that the host phases of Mo are manganese oxides [7,8]. Wasylenki et al. [4] examined the Mo fractionation caused by the adsorption onto low-crystalline birnessite as a function of reaction time, pH, ionic strength, and temperature. They showed that low-crystalline birnessite produced an almost constant isotope fractionation (Δ98/95Mo = 2.4–2.9‰) and that the fractionation was slightly dependent on temperature but even less dependent on pH and ionic strength. The observed Mo isotope fractionation is comparable to that between natural seawater and ferromanganese nodules and crusts (Δ98/95Mo = ~3‰) [1,2], but it is slightly lower than that of natural samples.
Although previous studies investigated the Mo fractionation on low-crystalline birnessite [3,4], various manganese oxides with different crystal structures, such as layered birnessite, tubular todorokite, and low-crystalline vernadite (δMnO2), constitute ferromanganese oxides [12]. Mo isotope fractionation caused by iron oxides depends significantly on their crystal structure [5], but the effect of manganese oxide mineralogy on Mo isotope fractionation is not well understood. Furthermore, previous studies have not specifically focused on the effect of Mo coverage on the mineral surface [3,4], under the assumption that the surface adsorption site on the manganese oxide (and, therefore, the resulting Mo fractionation) does not change as a result of changes in surface coverage; however, this is not the case for some iron oxides [5,11]. In order to gain a robust understanding of the large Mo fractionation by ferromanganese oxides in the ocean, the effects of the crystallinity and crystal structure of the manganese oxides and the Mo surface coverage need to be understood. In this study, we experimentally investigated the effect of manganese oxide mineralogy (highly crystalline birnessite, todorokite, and δMnO2) and surface coverage on Mo isotope fractionation.

2. Materials and Methods

2.1. Manganese Oxide Synthesis and Characterization

Birnessite and todorokite were synthesized according to the method described by Min and Kim [13]. Birnessite was prepared by the oxidation of Mn(II). A 500 mL solution of 0.3 M MnCl2 was added to a 1000 mL solution of 0.6 M NaOH containing 3% hydrogen peroxide. Immediately after the addition, a blackish precipitate appeared in the vessel. The suspension was stirred for 1 h using a magnetic stirrer and then aged at room temperature for 24 h. It was then filtered on a 0.2 μm mixed cellulose ester membrane, and the solids remaining on the filter paper were washed with ultrapure water and freeze-dried.
Todorokite was prepared by replacing the interlayer ions of birnessite from Na to Mg and then heating the treated birnessite. Approximately 12 g of the prepared birnessite was dispersed in 1000 mL of 1 M MgCl2 solution and stirred for 24 h. After stirring, the suspension was vacuum-filtered through a 0.2 μm mixed cellulose ester membrane. This procedure was repeated three times to complete the ion exchange. After washing the solids on the filter paper with ultrapure water to remove excess Mg2+, they were placed in a sealed PFA container containing 120 mL of ultrapure water. The suspension was heated in an oven at 100 °C for 72 h; the product was then vacuum-filtered and freeze-dried.
δMnO2 was synthesized according to the method described by Foster et al. [14]. A 30 mM MnCl2 solution was mixed with an equal volume of 20 mM KMnO4 solution. The pH of the suspension was adjusted to 10 using KOH solutions. The suspension was then vacuum-filtered through a 0.2 μm mixed cellulose ester membrane, washed with ultrapure water, and air-dried.
The mineralogy of the synthesized manganese oxides was examined by using X-ray diffraction (XRD: Ultima IV, Rigaku, Tokyo, Japan). The redox state of Mn in the samples was measured by using Mn K-edge X-ray absorption near-edge structure (XANES: Photon Factory, BL-12C, KEK, Tsukuba, Japan). MnCO3 and βMnO2 (Nichika, Kyoto, Japan) were used as the reference for the Mn(II) and reference Mn(IV), respectively. The specific surface areas of the samples were measured by using the multi-points BET method (Belsorp mini II, MicrotracBEL, Osaka, Japan). Differential thermal analysis was performed on birnessite and todorokite in air at a heating rate of 10 K/min, using a Thermo plus TG8120 (Rigaku, Tokyo, Japan) with Al2O3 as the standard material.

2.2. Adsorption Experiments

A 0.1 M or 0.01 M MoO42− stock solution was prepared by dissolving Na2MoO4·2H2O (Wako, Osaka, Japan) in ultrapure water. Adsorption experiments were performed in 15 mL polystyrene vessels in a shaking bath at 25 °C and 120 rpm; 20 mg of the sample (todorokite, δMnO2, or birnessite) was added to 10 mL of the 0.1 M KNO3 solutions. The solid concentrations were 2 g/L. Prior to the addition of the Mo stock solution, the suspensions were stirred in the shaking bath for 4 h; the Mo stock solution was then added to the reaction vessels to adjust the initial MoO42− concentration from 12.5 to 300 μM. Either 0.1 M NaOH or an HNO3 solution were used to adjust and maintain the pH of the suspensions at 8.0 ± 0.2. After 48 h, the reacted solids and solutions were recovered by vacuum filtration through a 0.2 μm mixed cellulose ester membrane. The solids were rinsed with ultrapure water and dried in an oven at 60 °C. The solutions were directly diluted with 2% HNO3 and 0.5% HF; the Mo concentration was measured using a quadrupole inductively coupled plasma mass spectrometer (ICP-MS; NexION 350S, PerkinElmer, Shelton, Connecticut, USA) to determine the amount of adsorption.

2.3. Sample Preparation for Isotope Measurements

The Mo isotopes of both the solids and solutions were measured in this study. The Mo isotopes were measured according to Kashiwabara et al. [15]. Double-spike solutions of 97Mo–100Mo were added to the solid digested solution samples and the reacted solution sample to adjust the spike/sample ratio to 0.936, after which 2 mL of 68% HNO3, 0.5 mL of 20% HCl, 0.1 mL of 38% HF, and 5 mL of MQ water were added to the sample solutions; the mixture was heated at 100 °C overnight. The solutions were then completely dried at 90 °C. The dried samples were dissolved in 10 mL of 0.6 M HF–0.05 M H2O2 and stirred in an ultrasonic bath four times for 30 min at 30 min intervals. The solutions were then filtered through a 0.2 μm mixed cellulose ester membrane. The sample dissolution and subsequent ultrasonic treatment were performed less than 12 h before the column separation.
The column separation was performed by following the method of Kashiwabara et al. [15]. The resin was sequentially washed with 10 mL of 2 M HF–4 M HCl, 10 mL of 4 M HNO3, and 10 mL of MQ water, followed by 5 mL of 2 M HF for the conditioning. The 10 mL sample solutions were loaded onto the column in 2.5 mL increments, after which 15 mL of 1 M HCl–0.6% H2O2 and 7.5 mL of 4 M HCl were loaded into the column to remove the matrix elements. The Mo remaining in the resin was then recovered with 20 mL of 4-M HNO3. To remove the organic matter from the resin in the solution, 200 μL of HClO4 was added to the vessels and dried at 160 °C for 12 h. Then, 200 μL of HNO3 and 200 μL of HClO4 were added to the vessels and dried at 190 °C for 5 h. The sample was dissolved in 2% HNO3, heated at 100 °C overnight, and then used for the isotope measurements.

2.4. Mo Isotope Measurements

The isotope measurements were performed using a multi-collector ICP-MS (Neptune Plus, Thermo Fisher Scientific, Bremen, Germany) at the Japan Agency for Marine-Earth Science and Technology (JAMSTEC, Yokosuka, Japan). The RF power was set at 1200 W. Samples were introduced into the plasma using a self-aspirating PFA nebulizer connected to an Aridus II desolvation system (Teledyne CETAC Technologies, Omaha, Nebraska, USA) at an aspiration rate of approximately 100 μL/min. The flow rates of swept Ar gas and additional N2 gas were controlled to maximize the signal intensity of the Mo. On-peak background subtraction was performed using the beam intensity measured by introducing a blank solution of 2% HNO3 prior to the sample measurements.
A combination of an Ni normal sampler cone and an Ni X skimmer cone was used for the Mo isotope measurements. The masses of 92Mo, 94Mo, 95Mo, 96Mo, 97Mo, 98Mo, and 100Mo were collected in static mode with a Faraday cup with a 1011 Ω resistance amplifier. After each sample measurement, washout was performed with 1 M HNO3–0.5 M HF for 10 min, followed by 2% HNO3 for 20 min. Mass bias-corrected isotope ratios were obtained by iteratively solving the double-spike equation using the Newton–Raphson method, according to Rudge et al. [16]. The δ98/95Mo values were calculated relative to the NIST 3134 SRM standard solution (Lot No. 130418) as follows:
δ M o 98 / 95 = M o 98 M o 95 S a m p l e M o 98 M o 95 N I S T   3134 1 × 1000
Instrument calibration was performed by measuring the in-house spiked Spex standard solution (Lot No. 25-55MOY) using the NIST solution as a reference. The results of repeated measurements of these solutions over the course of the analysis session were δ98Mo = 0.00 ± 0.04‰ (2 SD, n = 40) for the NIST SRM 3134 and δ98Mo = −0.40 ± 0.05‰ (2 SD, n = 3) for the Spex solutions. The delta value for the MoO42− stock solution was δ98Mo = −0.24 ± 0.04‰.

3. Results

3.1. Mineralogical Characterization of Synthetic Manganese Oxides

The XRD patterns of birnessite, todorokite, and δMnO2 are shown in Figure 1a. All samples showed broad peaks at 2.4 Å and 1.4 Å, which originate from the MnO6 dodecahedral structure. Birnessite showed characteristic peaks at 7.2 Å and 3.6 Å; todorokite showed characteristic peaks at 9.6 Å and 4.8 Å, in agreement with Min and Kim [13]. No distinct peaks were observed for δMnO2, except for the broad peaks at 2.4 Å and 1.4 Å and a broad band at around 10 Å.
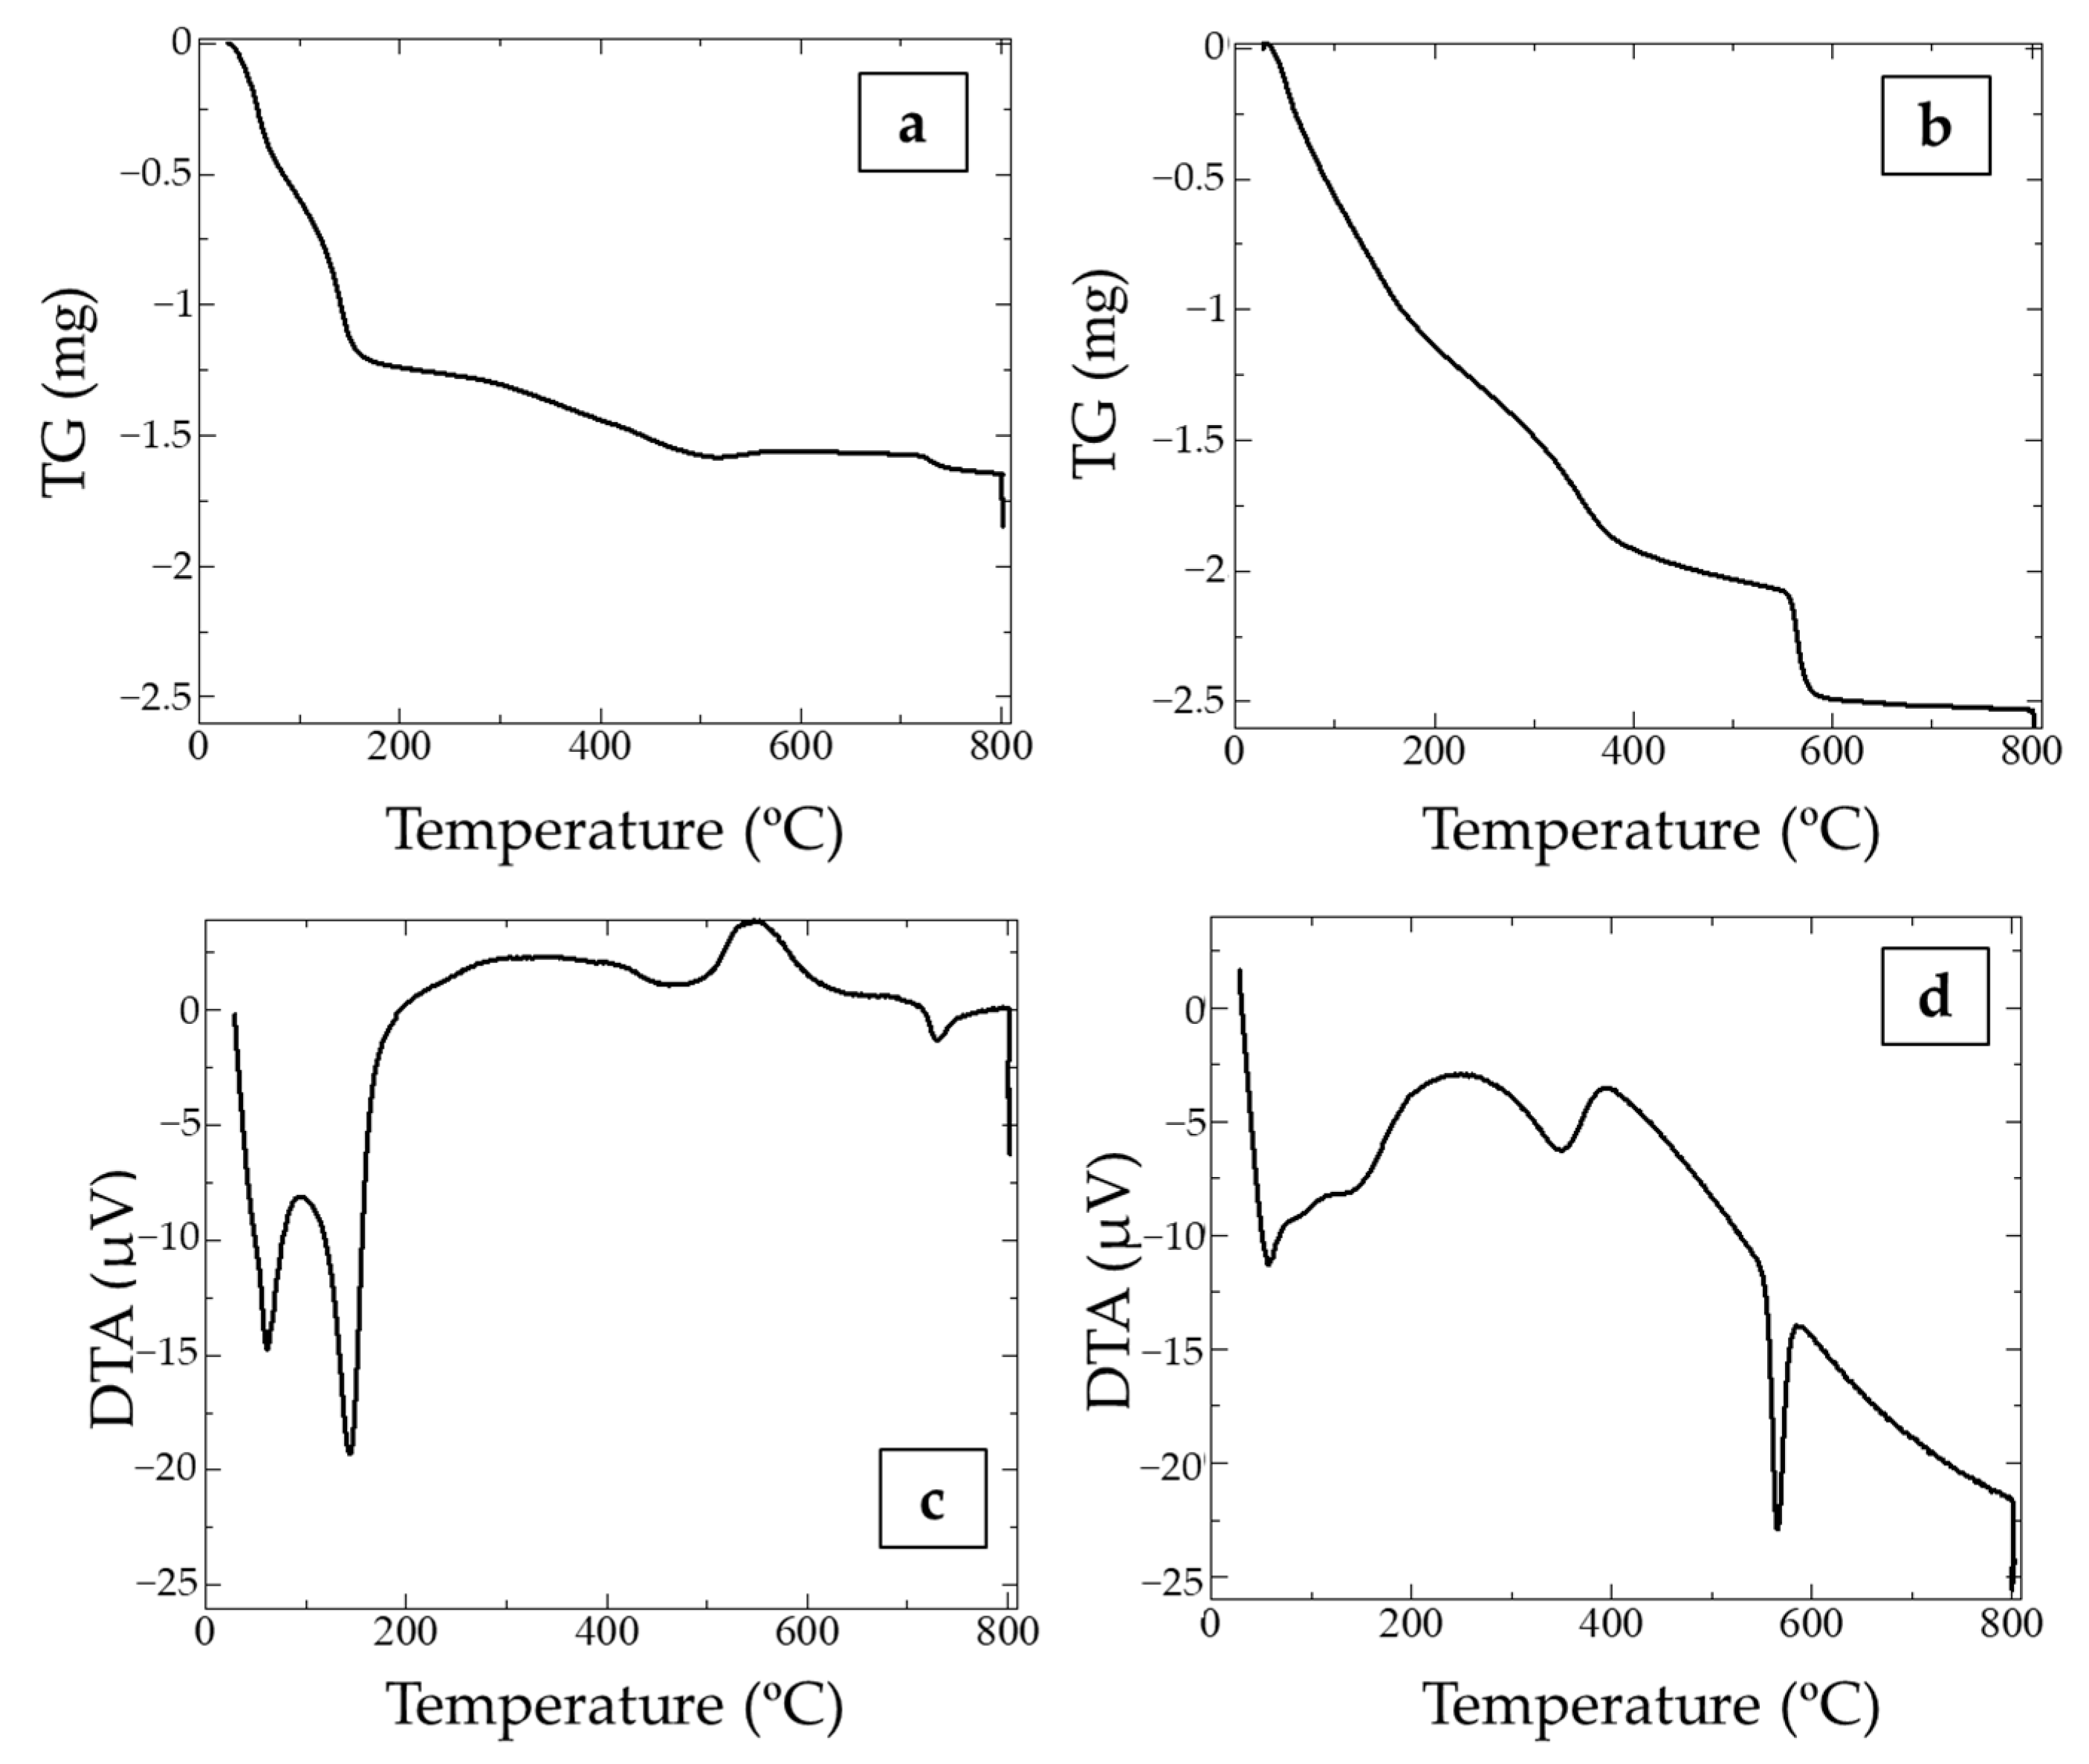
The Mn K-edge XANES spectra of the samples with the standard materials are shown in Figure 1b. All three samples exhibited a peak at 6556 eV, representing the tetravalent manganese. Differential thermal analysis also showed the characteristic features of todorokite and birnessite (Figure 2). Endothermic peaks accompanied by mass loss were observed at 56 °C, 350 °C, and 565 °C for todorokite. The mass loss at 56 °C corresponds to the dehydration of adsorbed water; that at 350 °C corresponds to the dehydration in the tunnel; and that at 565 °C corresponds to the release of oxygen [17]. The endothermic peaks observed in the birnessite sample were accompanied by mass loss at temperatures of 61 °C, 144 °C, 462 °C, and 730 °C. An exothermic peak was observed at approximately 547 °C. The mass loss at 61 °C is associated with the evaporation of adsorbed water, while that at 144 °C is associated with the dehydration of interlayer water. In addition, the mass losses at 462 °C, 547 °C, and 730 °C are associated with the transition from Mn(IV) to Mn(III) [18,19]. These results indicate that manganese oxides with different mineralogies were successfully synthesized without significant impurities. The specific surface areas were, as follows: 3.8 m2/g for birnessite; 115 m2/g for todorokite; and 22.9 m2/g for δMnO2.

3.2. Adsorption Behavior of Mo on Manganese Oxides

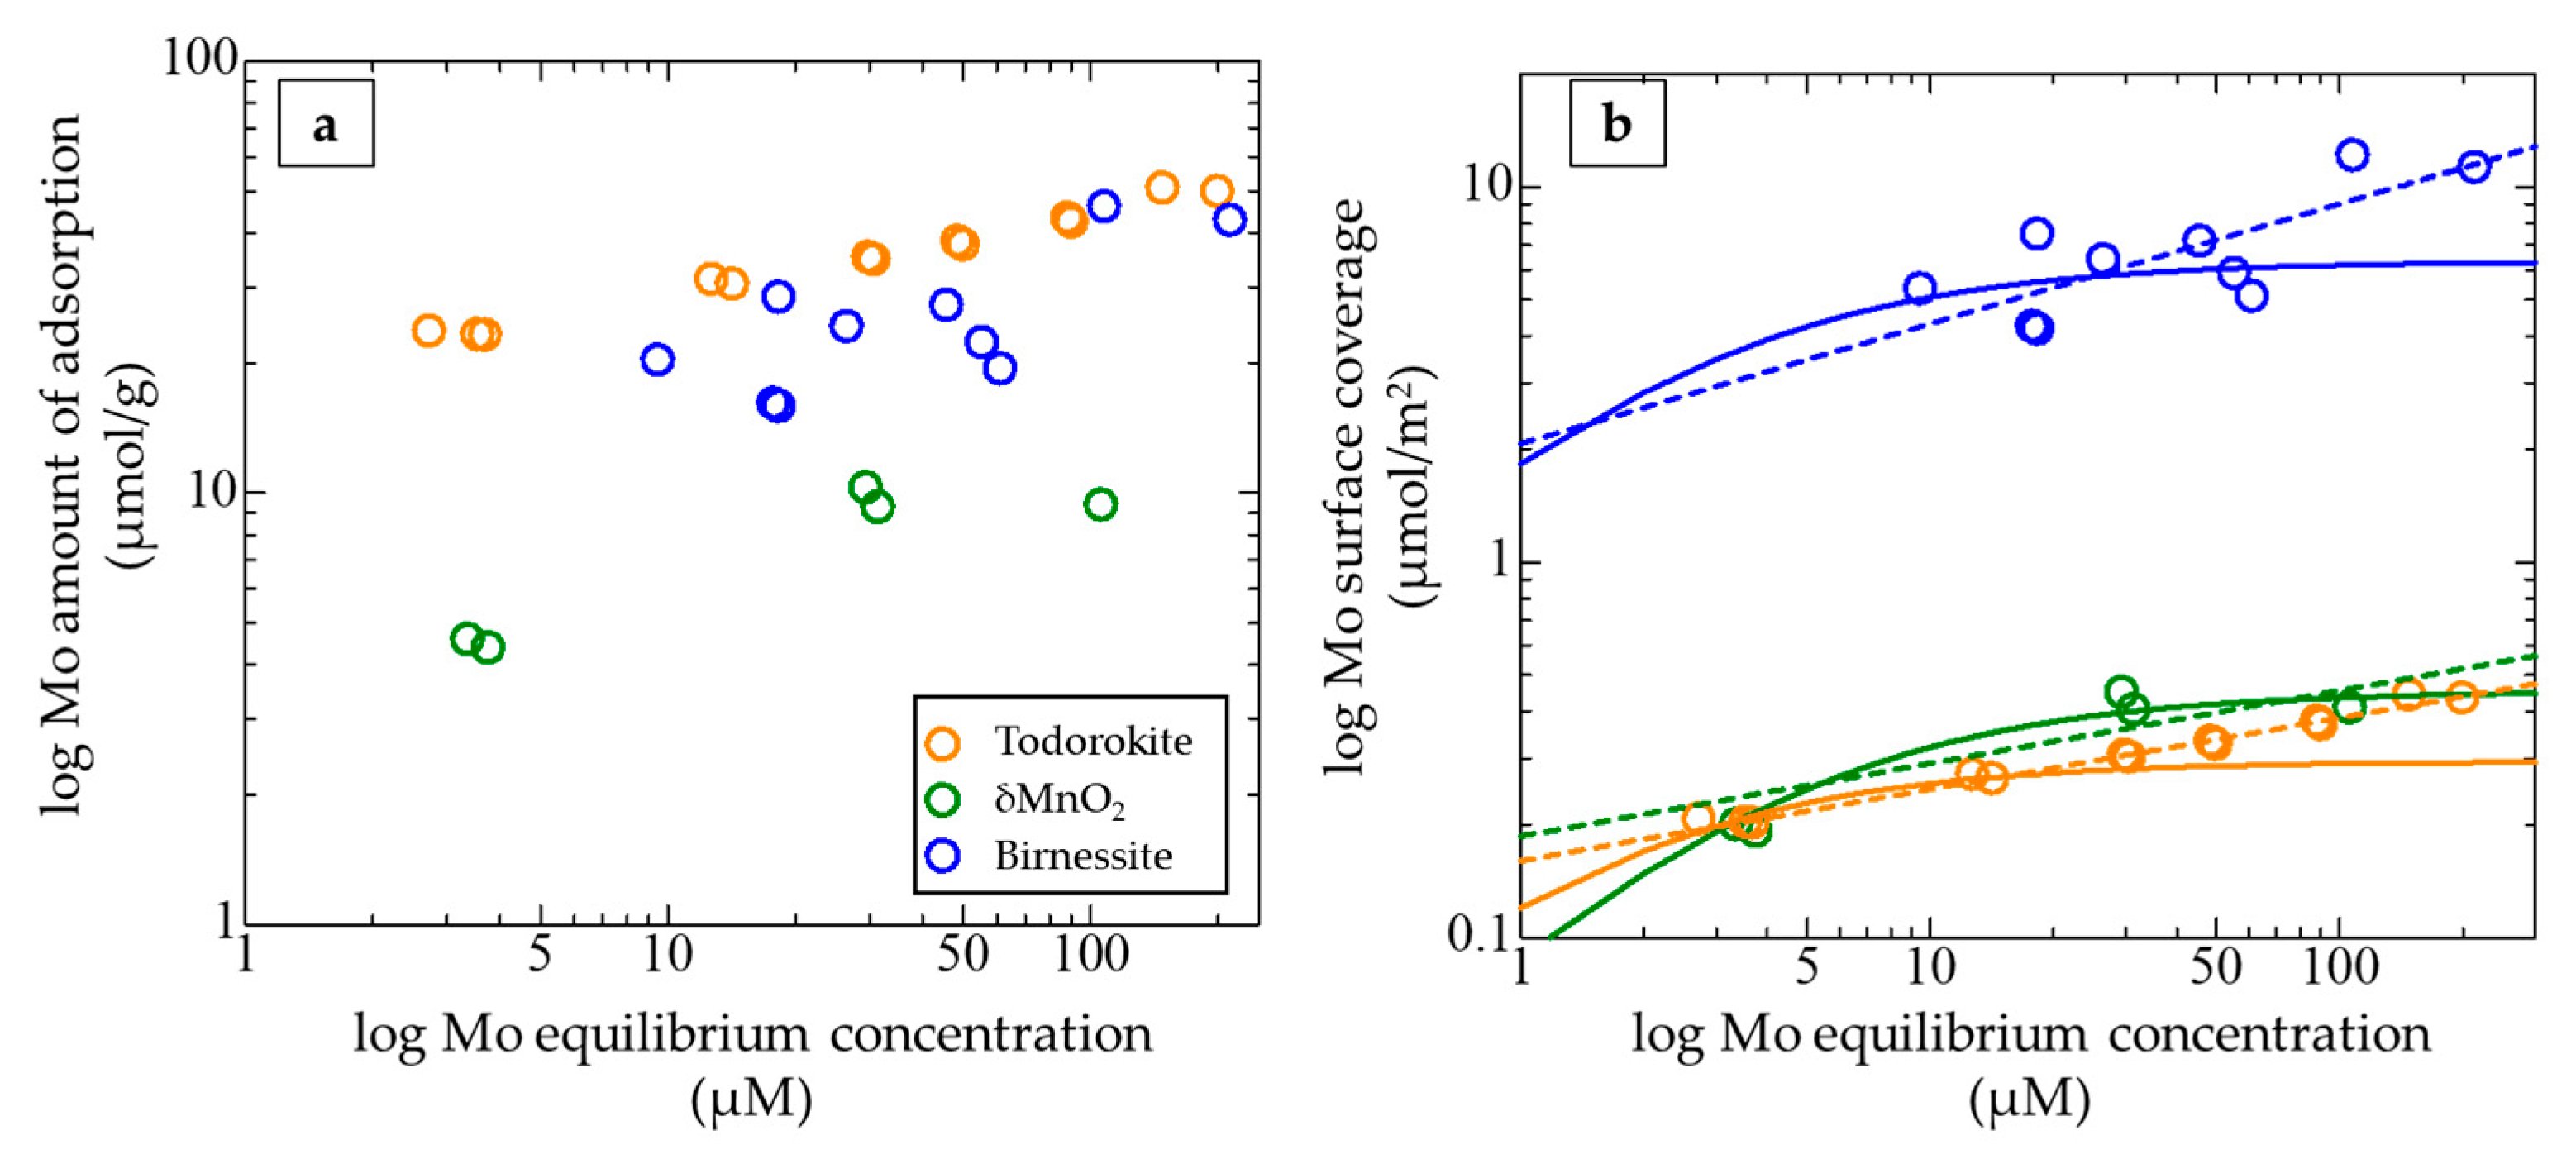
Figure 3a shows the amount of Mo adsorbed per unit weight of manganese oxides as a function of solution Mo concentrations after the adsorption experiments, which were conducted at constant solid concentrations (2 g/L), pH (pH = 8), and at a constant ionic strength (I = 0.1 M). Among the minerals studied, todorokite exhibited the highest Mo adsorption at the given solution Mo concentrations. The adsorption of Mo was slightly lower on birnessite than on todorokite; the adsorption of Mo on δMnO2 was the lowest among the samples. Figure 3b shows the amount of Mo adsorbed per unit surface area of manganese oxides as a function of the solution Mo concentration. The adsorption of Mo per unit surface area on δMnO2 was almost comparable to that on todorokite, while that on birnessite was more than an order of magnitude higher. The amounts of Mo adsorption on todorokite and birnessite increased with the solution Mo concentrations over the range studied, while that on δMnO2 reached a plateau above 30 μM solution of the Mo concentration. The adsorption isotherms were fitted with a Langmuir model and a Freundlich model (Text S1 in the Supporting Information) [20]. The goodness of fit (coefficient of determination (R2)) of both models (Table S1 in the Supporting Information) suggests that the adsorption behavior of todorokite and birnessite is reasonably well reproduced by a Freundlich isotherm model but not by a Langmuir model [20]; that of δMnO2 was well fitted by both the Freundlich and Langmuir models.

3.3. Isotope Measurements of Mo Adsorbed on Manganese Oxides

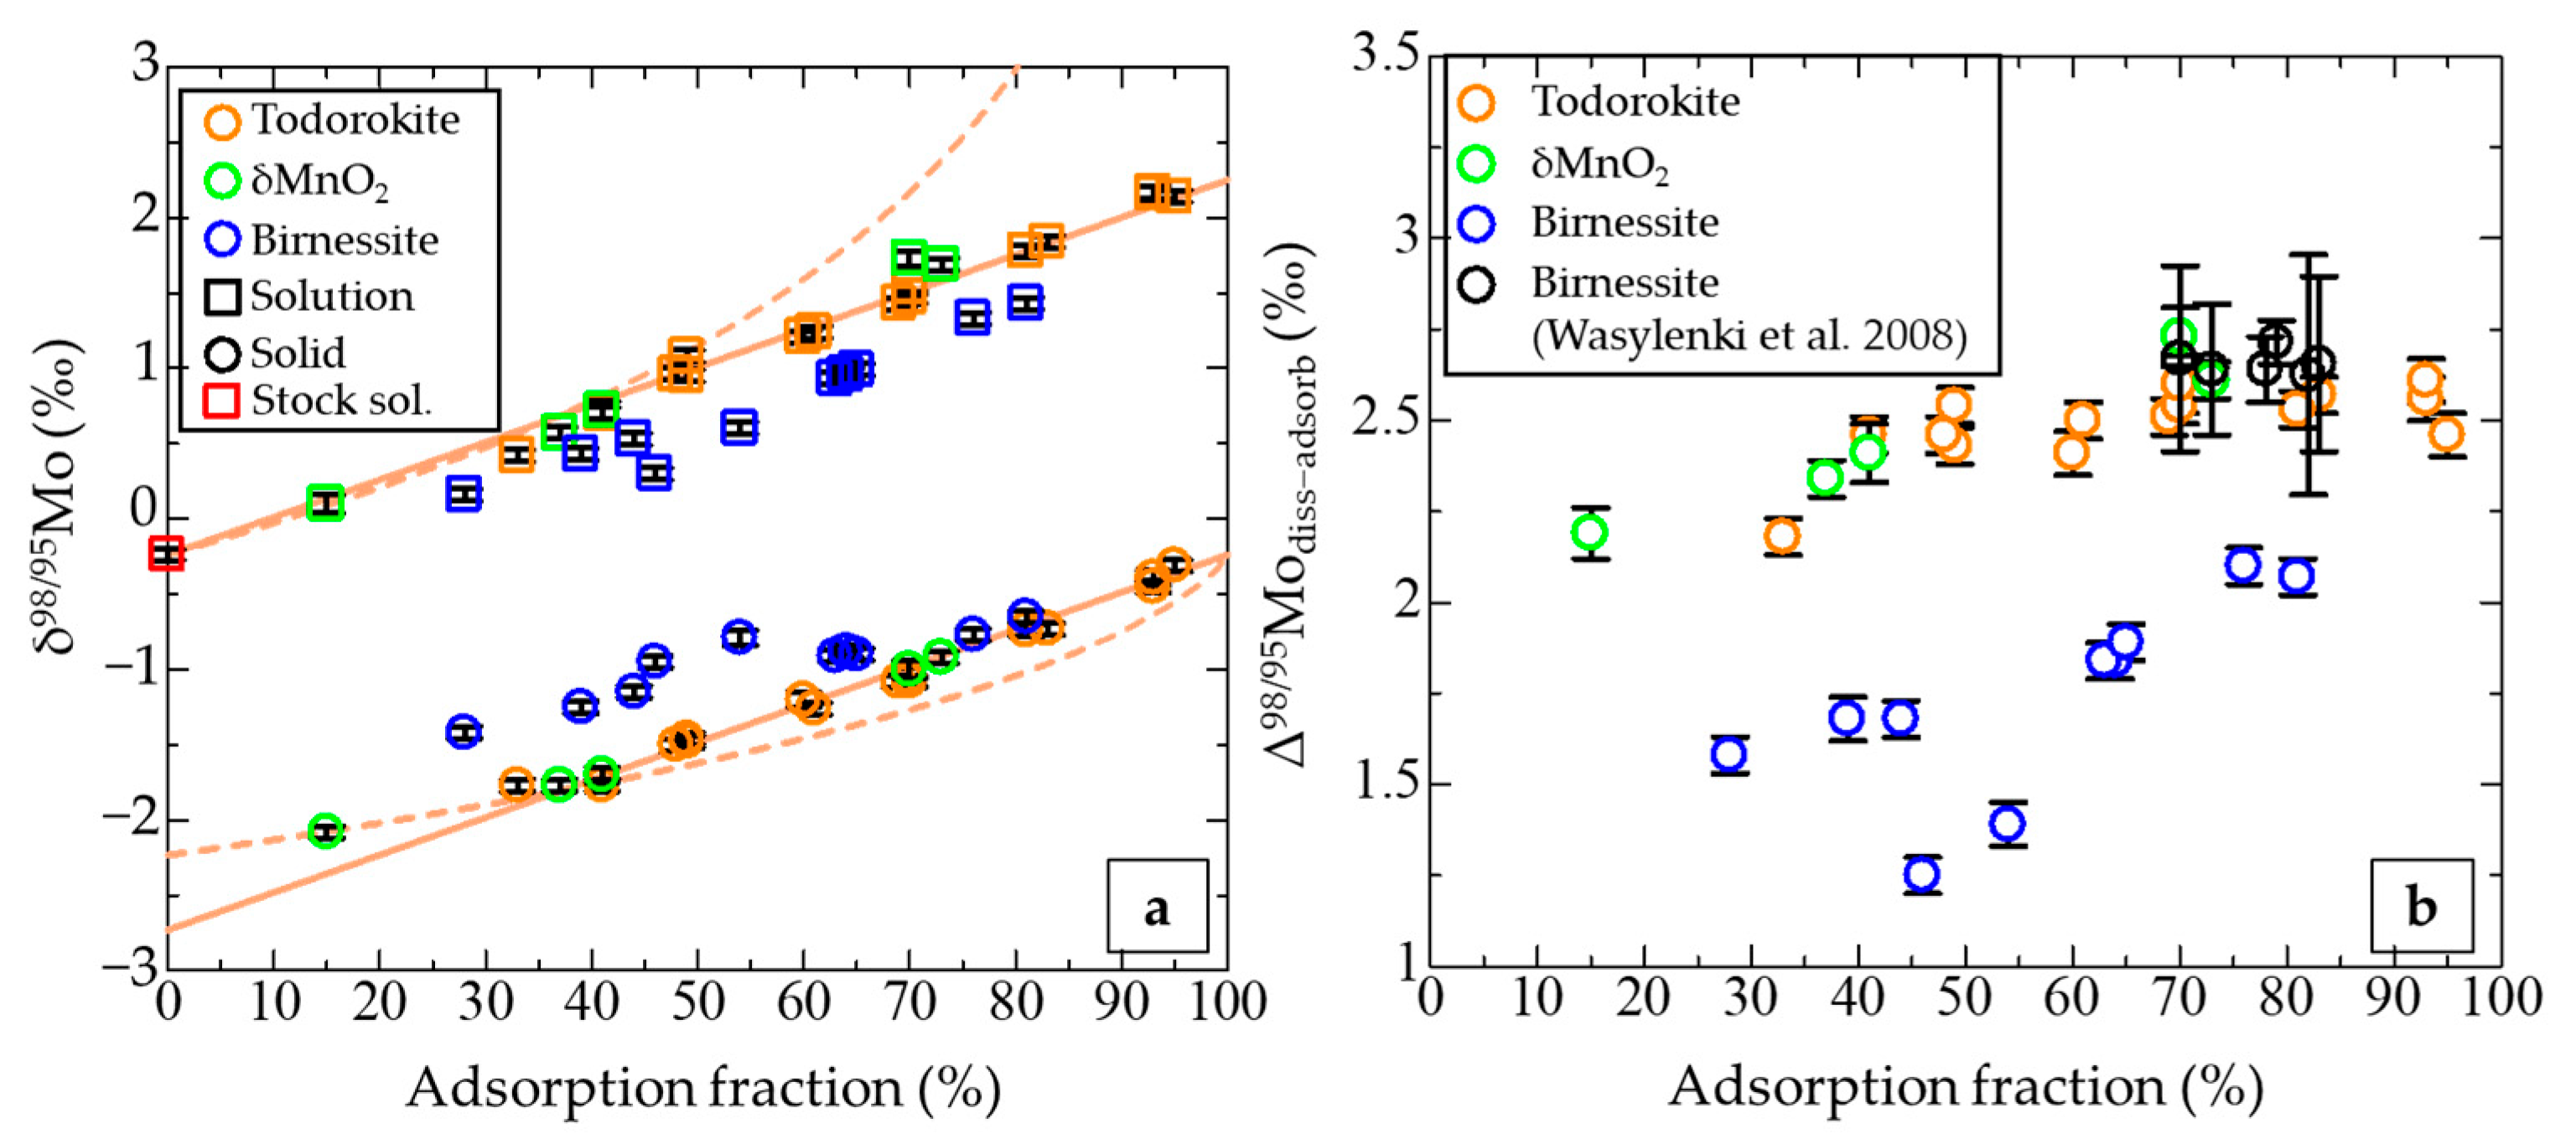
The results of the Mo adsorption and the isotope measurements are listed in Table 1. The percentage of adsorbed Mo covered from 28% to 81% for birnessite, from 33% to 93% for todorokite, and from 15% to 73% for δMnO2. The δ98/95Mo for the experiments with todorokite in both the liquid and solid phases increased linearly with the adsorption fraction (Figure 4a). The solid and dashed lines in Figure 4a represent the isotopic equilibrium model and the non-equilibrium Rayleigh model [21,22], respectively, for todorokite. The δ98/95Mo for both the liquid and solid from the todorokite experiments followed the isotopic equilibrium model, indicating an equilibrium isotope exchange process in a closed system [23]. The Mo fractionation between the liquid and solid Mo (Δ98/95Mo) from the todorokite experiments was nearly constant, at 2.5 ± 0.1‰, except for the lowest adsorption fraction (32%), which was 2.18 ± 0.05‰ (Figure 4b).
The δ98/95Mo values for the δMnO2 experiments were comparable to those for todorokite, although these were exceptionally higher than the trend in the solid under the lowest adsorption fraction (15%). The Δ98/95Mo from the experiments with δMnO2 at a higher adsorption fraction (70%–80%) took the highest values at 2.6‰–2.7‰ (Figure 4b); however, they systematically decreased with the decrease in the adsorption fraction. The Δ98/95Mo at the lowest adsorption fraction (15%) was 2.19 ± 0.07‰.
The δ98/95Mo values for the liquid phase from the birnessite experiments were significantly lower than those from the todorokite and δMnO2 experiments, while those for the solid phase were significantly higher than those from the todorokite and δMnO2 experiments (Figure 4a). The Δ98/95Mo from the birnessite experiments was from 1.25 ± 0.05 to 2.07 ± 0.05‰, systematically lower than those seen with todorokite and δMnO2 (Figure 4b). The Δ98/95Mo in the birnessite experiments was also dependent on the adsorption fraction and decreased with the decreasing adsorption fraction (Figure 4b).

4. Discussion

4.1. Dependence of Mo Isotope Fractionation on Surface Coverage

Previous experimental studies have demonstrated that the adsorption of Mo onto a manganese oxide shows an isotope fractionation of 2.4‰–2.9‰ of Δ98/95Mo between the solid and liquid phases [3,4]. The fractionation was less dependent on the solution pH or ionic strength, but it did show a slight systematic dependence on temperature [3,4]. This study showed that the Δ98/95Mo of todorokite and δMnO2 were comparable to those observed in previous studies [3,4] at ambient temperatures, except for a lower Mo adsorption fraction; however, that of birnessite (which had been used as the manganese oxide in the previous studies) was notably smaller (Figure 4b) [3,4,9]. A Welch’s t-test confirmed that the difference in the Δ98/95Mo of birnessite between that shown by Wasylenki et al. [4] (M (mean) = 2.66, SD (standard deviation) = 0.03, n = 6) and this study (M = 1.73, SD = 0.28, n = 10) is statistically significant. Therefore, the Mo isotope fractionation on birnessite observed in the present study is clearly inconsistent with previously reported values.
The Mo adsorption isotherms showed that the amount of the Mo adsorption based on the specific surface area of the birnessite, which has a lower Δ98/95Mo, is significantly higher than that of the todorokite and δMnO2, which have a higher Δ98/95Mo (Figure 3b and Figure 4b). Furthermore, even for todorokite and δMnO2, the Δ98/95Mo generally decreases with decreasing adsorption fractions (Figure 4b). The adsorption experiments were conducted at a constant solid concentration (2 g/L), which means that as the adsorption fraction decreased, the surface Mo coverage increased. There was a negative correlation between the Δ98/95Mo and the surface coverages of the three manganese oxides (Figure 5), indicating that the isotopic fractionation of Mn(VI) oxides decreases with the surface coverages but does not depend on the manganese oxide mineralogy. It should be noted that the negative correlation is still statistically valid only for the data of todorokite and δMnO2 (Text S2 and Figure S1).
The inconsistency in the results from the birnessite between the present study and those of previous studies is most likely due to the difference in the surface areas of the materials used in the experiments. The solid–liquid ratio and specific surface area are required to calculate surface coverage; however, these were not shown in the previous studies [3,4]. The birnessite used in the previous studies was prepared by reducing KMnO4 with HCl [3,4]. The samples obtained were never dried to preserve the low crystallinity [9]. In contrast, the birnessite used in this study was prepared by Mn(II) oxidation (see Section 2.1) and the specific surface area of the resulting birnessite in this study was rather low (3.8 m2/g). Although the specific surface area was not measured in the previous studies, it must have been much higher because of the higher crystallinity in those studies relative to that of the present study. If the birnessite had a higher surface area in the previous studies, the surface Mo coverage must have been lower than that of this study. Therefore, a lower Δ98/95Mo was to be expected in this study. The fact that the Δ98/95Mo values of todorokite and δMnO2 with lower surface coverages are consistent with that of the birnessite in the previous studies confirms that Mo isotope fractionation does not depend on the crystal structure (mineralogy) of the manganese oxides.
Goldberg et al. [5] measured the Mo fractionation on various iron oxides and showed that the degree of isotopic fractionation on hematite is comparable to that on manganese oxide. They also showed that the Δ98/95Mo on hematite depends on the surface coverage. The red plots in Figure 5. show the Δ98/95Mo on hematite as a function of surface coverage. The trend of fractionation changes in hematite as a function of surface coverage is consistent with those of the Mn(IV) oxides observed in this study.

4.2. Why Does Mo Fractionation on Manganese Oxides Decrease with Surface Coverage?

The mechanisms for Mo fractionation on manganese oxides have been investigated in molecular structure analyses and in the density functional (DFT) calculations of Mo adsorbed on manganese oxides [4,6,7,8,9,10]. In the Mo K-edge EXAFS analysis, the split Mo–O shells in the spectra show a highly distorted octahedral structure of Mo adsorbed on the manganese oxides [8,9]. On the other hand, the Mo in the solution is predominantly present as a tetrahedral structure (MoO42−), except under acidic conditions or at extremely high Mo concentrations ([Mo] > 0.2 M) [24]. The DFT studies suggest that the geometrical change in Mo from tetrahedral to octahedral is the cause of the large isotopic fractionation of Mo [4,6,10]. Since the aqueous Mo speciation must be invariant as MoO42− under the present experimental conditions, the decrease in Mo isotope fractionation with Mo surface coverage should reflect changes in the speciation of the surface-adsorbed Mo species.
Goldberg et al. [5] showed that Δ98/95Mo decreases in the order of δMnO2 > hematite > goethite > ferrihydrite > magnetite. Kashiwabara et al. [8] interpreted the differences in the dependence of Fe oxide adsorbents as the different contributions of the surface inner-sphere complexes relative to the outer-sphere complexes. The inner-sphere octahedral surface complex dominates in δMnO2 and hematite, while the outer-sphere tetrahedral complex, which is the same as the aqueous species (MoO42−), dominates in ferrihydrite and magnetite [8]. One of the possible explanations for the decrease in Δ98/95Mo with the surface coverage observed in this study is that the contribution of the outer-sphere complex increases with the surface coverage on manganese oxides. The higher surface coverages of birnessite compared to those of other manganese oxides also support different surface reactions.
Another possibility for the changing Δ98/95Mo is the formation of surface Mo oligomer species. Tanaka et al. [10] calculated Mo isotope fractionation with different surface Mo configurations on manganese oxide from DFT calculations. They predicted that the Mo isotope fractionation of the dimeric Mo species (Δ98/95Mo = 2.43‰) on the surface of manganese oxide is lower than that of the monomeric Mo species (Δ98/95Mo = 2.69‰). This most likely suggests that the polymerization of Mo species on manganese oxides leads to a decrease in Δ98/95Mo. The adsorption isotherms of Mo on both birnessite and todorokite did not show a noticeable plateau at higher Mo concentrations (Figure 4b). The adsorption behavior suggests that processes other than simple monomeric Mo adsorption occur on the mineral surface, especially at higher surface coverages. Davantes et al. [25] studied the surface speciation of Mo on hematite by using in situ attenuated total reflectance–Fourier transform infrared spectroscopy with DFT calculations. They observed the continuous changes in surface species with pH/Mo concentrations. At a higher pH and with the lowest Mo concentrations, the Mo adsorbs to the surface via monomeric inner-sphere species. Increasing the Mo concentration promotes the growth of a surface polymer, first in a two-dimensional oligomer and then in a three-dimensional polymer [25]. Although, at this point, it is difficult to conclude the cause of the decrease in Δ98/95Mo, dependence of the surface coverage could relate to the increase in surface species with smaller fractionation factors such as the outer-sphere complex and oligomer Mo species.
The amount of Mo adsorbed per unit surface area on birnessite was significantly higher than that on todorokite and δMnO2 (Figure 3b). The difference is most likely due to the differences in the dominant sorption modes of Mo among the minerals. The Mo adsorbed on todorokite and δMnO2, which have higher specific surface areas, is mainly a monomeric inner-sphere octahedral complex except for the highest surface coverages. On the other hand, the adsorption on birnessite, which has a lower specific surface area, dominates surface polymerization or outer-sphere complex formation. It should be noted that, in the case of birnessite, the degree of isotope fractionation has exhibited considerable variation (Figure 5). We consider that the latter processes (surface polymerization or outer-sphere complex formation) may provide the large error with the Δ98/95Mo, although we cannot specify the exact mechanism causing the larger variation.

4.3. Implications for the Mo Isotope Fractionation of Natural Ferromanganese Oxides

It has been well established that the Δ98/95Mo between ferromanganese oxides and seawater is comparable to that observed for Mo adsorption on manganese oxides and hematite [1,2,3,4,5]. However, the observed Mo isotope fractionation of natural ferromanganese oxides (~3‰) [1,2] was generally higher than the isotope fractionation ranges of manganese oxides (2.4‰–2.9‰) [4] and hematite (1.9‰–2.6‰) [5] observed in previous experimental studies. This study provides a possible explanation for the difference. A dependence of Mo isotope fractionation on surface coverage was observed even at low surface coverage ranges (0.2–0.5 μmol/m2) (Figure 5 and Figure S1). This suggests that this relationship may be valid even at lower levels of surface coverage, although Δ98/95Mo may reach a constant upper limit below a certain coverage level. In experimental studies, the Mo/Mn ratio can be reduced to lower the surface coverage; however, because the Mo concentration in the liquid phase becomes very low, it is very difficult to measure the Mo isotope fractionation under conditions of very low surface coverage. On the other hand, the Mo surface coverage of ferromanganese oxides in natural environments is very low (0.02–0.04 μmol/m2) [12]. Assuming that the linear relationship between the logarithmic form of surface coverage and Δ98/95Mo is valid for the coverage of natural ferromanganese oxides, Δ98/95Mo is predicted to be 3.2‰, which is consistent with the observed Mo isotope fractionation of natural ferromanganese oxides (Figure 5). The underestimation of the Δ98/95Mo on manganese oxides in experimental studies is, therefore, most likely due to the experimental limitations of measuring the Mo isotope under extremely low surface Mo coverages.

Supplementary Materials

The following supporting information can be downloaded at: https://www.mdpi.com/article/10.3390/min15010079/s1, Figure S1: The relationship between Mo surface coverage and Δ98/95Mo in this study on todorokite (orange) and δMnO2 (green); Table S1: Parameters of Langmuir and Freundlich models; Table S2: Correlation coefficient and p-value for Mo surface coverage and Δ98/95Mo; Text S1: Isothermal models; Text S2: The correlation coefficient and p-value for the correlation of the surface coverage and Δ98/95Mo.

Author Contributions

Conceptualization, K.F. and T.K.; methodology, K.F., T.K. and A.O.; software, T.K. and A.O.; validation, K.F., T.K., Y.T. and A.O.; formal analysis, A.O.; investigation, T.K., M.K and A.O.; resources, K.F., T.K., Y.T., M.K. and A.O.; data curation, A.O.; writing—original draft preparation, K.F. and A.O.; writing—review and editing, K.F., T.K., Y.T., M.K. and A.O.; visualization, A.O.; supervision, K.F.; project administration, K.F. and A.O.; funding acquisition, K.F. and A.O. All authors have read and agreed to the published version of the manuscript.

Funding

This research was funded by Grants-in-Aid for Scientific Research from the Japan Society for Promotion of Science (grant numbers 22KK0166 and 24H00268), the Cooperative Research Program of the Institute of Nature and Environmental Technology, Kanazawa University, Japan (grant numbers 21056 and 22024), and JST SPRING (grant number JPMJSP2135).

Data Availability Statement

Data will be made available on request.

Conflicts of Interest

The authors declare no conflicts of interest.

References

  1. Barling, J.; Arnold, G.L.; Anbar, A.D. Natural Mass-Dependent Variations in the Isotopic Composition of Molybdenum. Earth Planet. Sci. Lett. 2001, 193, 447–457. [Google Scholar] [CrossRef]
  2. Siebert, C.; Nägler, T.F.; von Blanckenburg, F.; Kramers, J.D. Molybdenum Isotope Records as a Potential New Proxy for Paleoceanography. Earth Planet. Sci. Lett. 2003, 211, 159–171. [Google Scholar] [CrossRef]
  3. Barling, J.; Anbar, A.D. Molybdenum Isotope Fractionation during Adsorption by Manganese Oxides. Earth Planet. Sci. Lett. 2004, 217, 315–329. [Google Scholar] [CrossRef]
  4. Wasylenki, L.E.; Rolfe, B.A.; Weeks, C.L.; Spiro, T.G.; Anbar, A.D. Experimental Investigation of the Effects of Temperature and Ionic Strength on Mo Isotope Fractionation during Adsorption to Manganese Oxides. Geochim. Cosmochim. Acta 2008, 72, 5997–6005. [Google Scholar] [CrossRef]
  5. Goldberg, T.; Archer, C.; Vance, D.; Poulton, S.W. Mo Isotope Fractionation during Adsorption to Fe (Oxyhydr)Oxides. Geochim. Cosmochim. Acta 2009, 73, 6502–6516. [Google Scholar] [CrossRef]
  6. Tossell, J.A. Calculating the Partitioning of the Isotopes of Mo between Oxidic and Sulfidic Species in Aqueous Solution. Geochim. Cosmochim. Acta 2005, 69, 2981–2993. [Google Scholar] [CrossRef]
  7. Kashiwabara, T.; Takahashi, Y.; Tanimizu, M. A XAFS Study on the Mechanism of Isotopic Fractionation of Molybdenum during Its Adsorption on Ferromanganese Oxides. Geochem. J. 2009, 43, e31–e36. [Google Scholar] [CrossRef]
  8. Kashiwabara, T.; Takahashi, Y.; Tanimizu, M.; Usui, A. Molecular-Scale Mechanisms of Distribution and Isotopic Fractionation of Molybdenum between Seawater and Ferromanganese Oxides. Geochim. Cosmochim. Acta 2011, 75, 5762–5784. [Google Scholar] [CrossRef]
  9. Wasylenki, L.E.; Weeks, C.L.; Bargar, J.R.; Spiro, T.G.; Hein, J.R.; Anbar, A.D. The Molecular Mechanism of Mo Isotope Fractionation during Adsorption to Birnessite. Geochim. Cosmochim. Acta 2011, 75, 5019–5031. [Google Scholar] [CrossRef]
  10. Tanaka, M.; Ariga, D.; Kashiwabara, T.; Takahashi, Y. Adsorption Mechanism of Molybdenum(VI) on Manganese Oxides Causing a Large Isotope Fractionation. ACS Earth Space Chem. 2018, 2, 1187–1195. [Google Scholar] [CrossRef]
  11. Wang, X.; Sherman, D.M. Molecular Speciation of Mo (VI) on Goethite and Its Implications for Molybdenum and Its Isotopic Cycle in Ocean. Geochim. Cosmochim. Acta 2021, 313, 116–132. [Google Scholar] [CrossRef]
  12. Hein, J.R.; Mizell, K.; Koschinsky, A.; Conrad, T.A. Deep-Ocean Mineral Deposits as a Source of Critical Metals for High- and Green-Technology Applications: Comparison with Land-Based Resources. Ore Geol. Rev. 2013, 51, 1–14. [Google Scholar] [CrossRef]
  13. Min, S.; Kim, Y. Physicochemical Characteristics of the Birnessite and Todorokite Synthesized Using Various Methods. Minerals 2020, 10, 884. [Google Scholar] [CrossRef]
  14. Foster, A.L.; Brown, G.E.; Parks, G.A. X-Ray Absorption Fine Structure Study of As(V) and Se(IV) Sorption Complexes on Hydrous Mn Oxides. Geochim. et Cosmochim. Acta 2003, 67, 1937–1953. [Google Scholar] [CrossRef]
  15. Kashiwabara, T.; Fukami, Y.; Kubo, S.; Watakabe, A.; Kurisu, M.; Tokeshi, S.; Iizuka, T.; Suzuki, K. High-Precision Stable Isotope Measurements of Tungsten and Molybdenum in Single Sample Aliquots Combined with Optimized Separation for Mixed Double Spikes. J. Anal. At. Spectrom. 2024, 39, 1759–1777. [Google Scholar] [CrossRef]
  16. Rudge, J.F.; Reynolds, B.C.; Bourdon, B. The Double Spike Toolbox. Chem. Geol. 2009, 265, 420–431. [Google Scholar] [CrossRef]
  17. Feng, Q.; Yanagisawa, K.; Yamasaki, N. Hydrothermal Soft Chemical Process for Synthesis of Manganese Oxides with Tunnel Structures; Springer: Berlin/Heidelberg, Germany, 1998; Volume 18. [Google Scholar]
  18. Feng, Q.; Kanoh, H.; Miyai, Y.; Ooi, K. Hydrothermal Synthesis of Lithium and Sodium Manganese Oxides and Their Metal Ion Extraction/Insertion Reactions; ACS Publications: Washington, DC, USA, 1995; Volume 7. [Google Scholar]
  19. Liu, L.; Feng, Q.; Yanagisawa, K.; Wang, Y. Characterization of Birnessite-Type Sodium Manganese Oxides Prepared by Hydrothermal Reaction Process. J. Mater. Sci. Lett. 2000, 19, 2047–2050. [Google Scholar] [CrossRef]
  20. Stumm, W. Chemistry of the Solid-Water Interface: Processes at the Mineral-Water and Particle-Water Interface in Natural Systems; Wiley: Hoboken, NJ, USA, 1992. [Google Scholar] [CrossRef]
  21. Rayleigh, L. L. Theoretical Considerations Respecting the Separation of Gases by Diffusion and Similar Processes. Lond. Edinb. Dublin Philos. Mag. J. Sci. 1896, 42, 493–498. [Google Scholar] [CrossRef]
  22. Hoefs, J. Stable Isotope Geochemistry: Sixth Edition; Springer: Berlin/Heidelberg, Germany, 2009; pp. 1–285. [Google Scholar] [CrossRef]
  23. Kashiwabara, T.; Kubo, S.; Tanaka, M.; Senda, R.; Iizuka, T.; Tanimizu, M.; Takahashi, Y. Stable Isotope Fractionation of Tungsten during Adsorption on Fe and Mn (Oxyhydr) Oxides. Geochim. Cosmochim. Acta 2017, 204, 52–67. [Google Scholar] [CrossRef]
  24. Noack, J.; Rosowski, F.; Schlögl, R.; Trunschke, A. Speciation of Molybdates under Hydrothermal Conditions. Z. Anorg. Allg. Chem. 2014, 640, 2730–2736. [Google Scholar] [CrossRef]
  25. Davantes, A.; Costa, D.; Sallman, B.; Rakshit, S.; Lefevre, G. Surface Polymerization of Mo(VI) and W(VI) Anions on Hematite Revealed by in Situ Infrared Spectroscopy and DFT+U Theoretical Study. J. Phys. Chem. C 2017, 121, 324–332. [Google Scholar] [CrossRef]
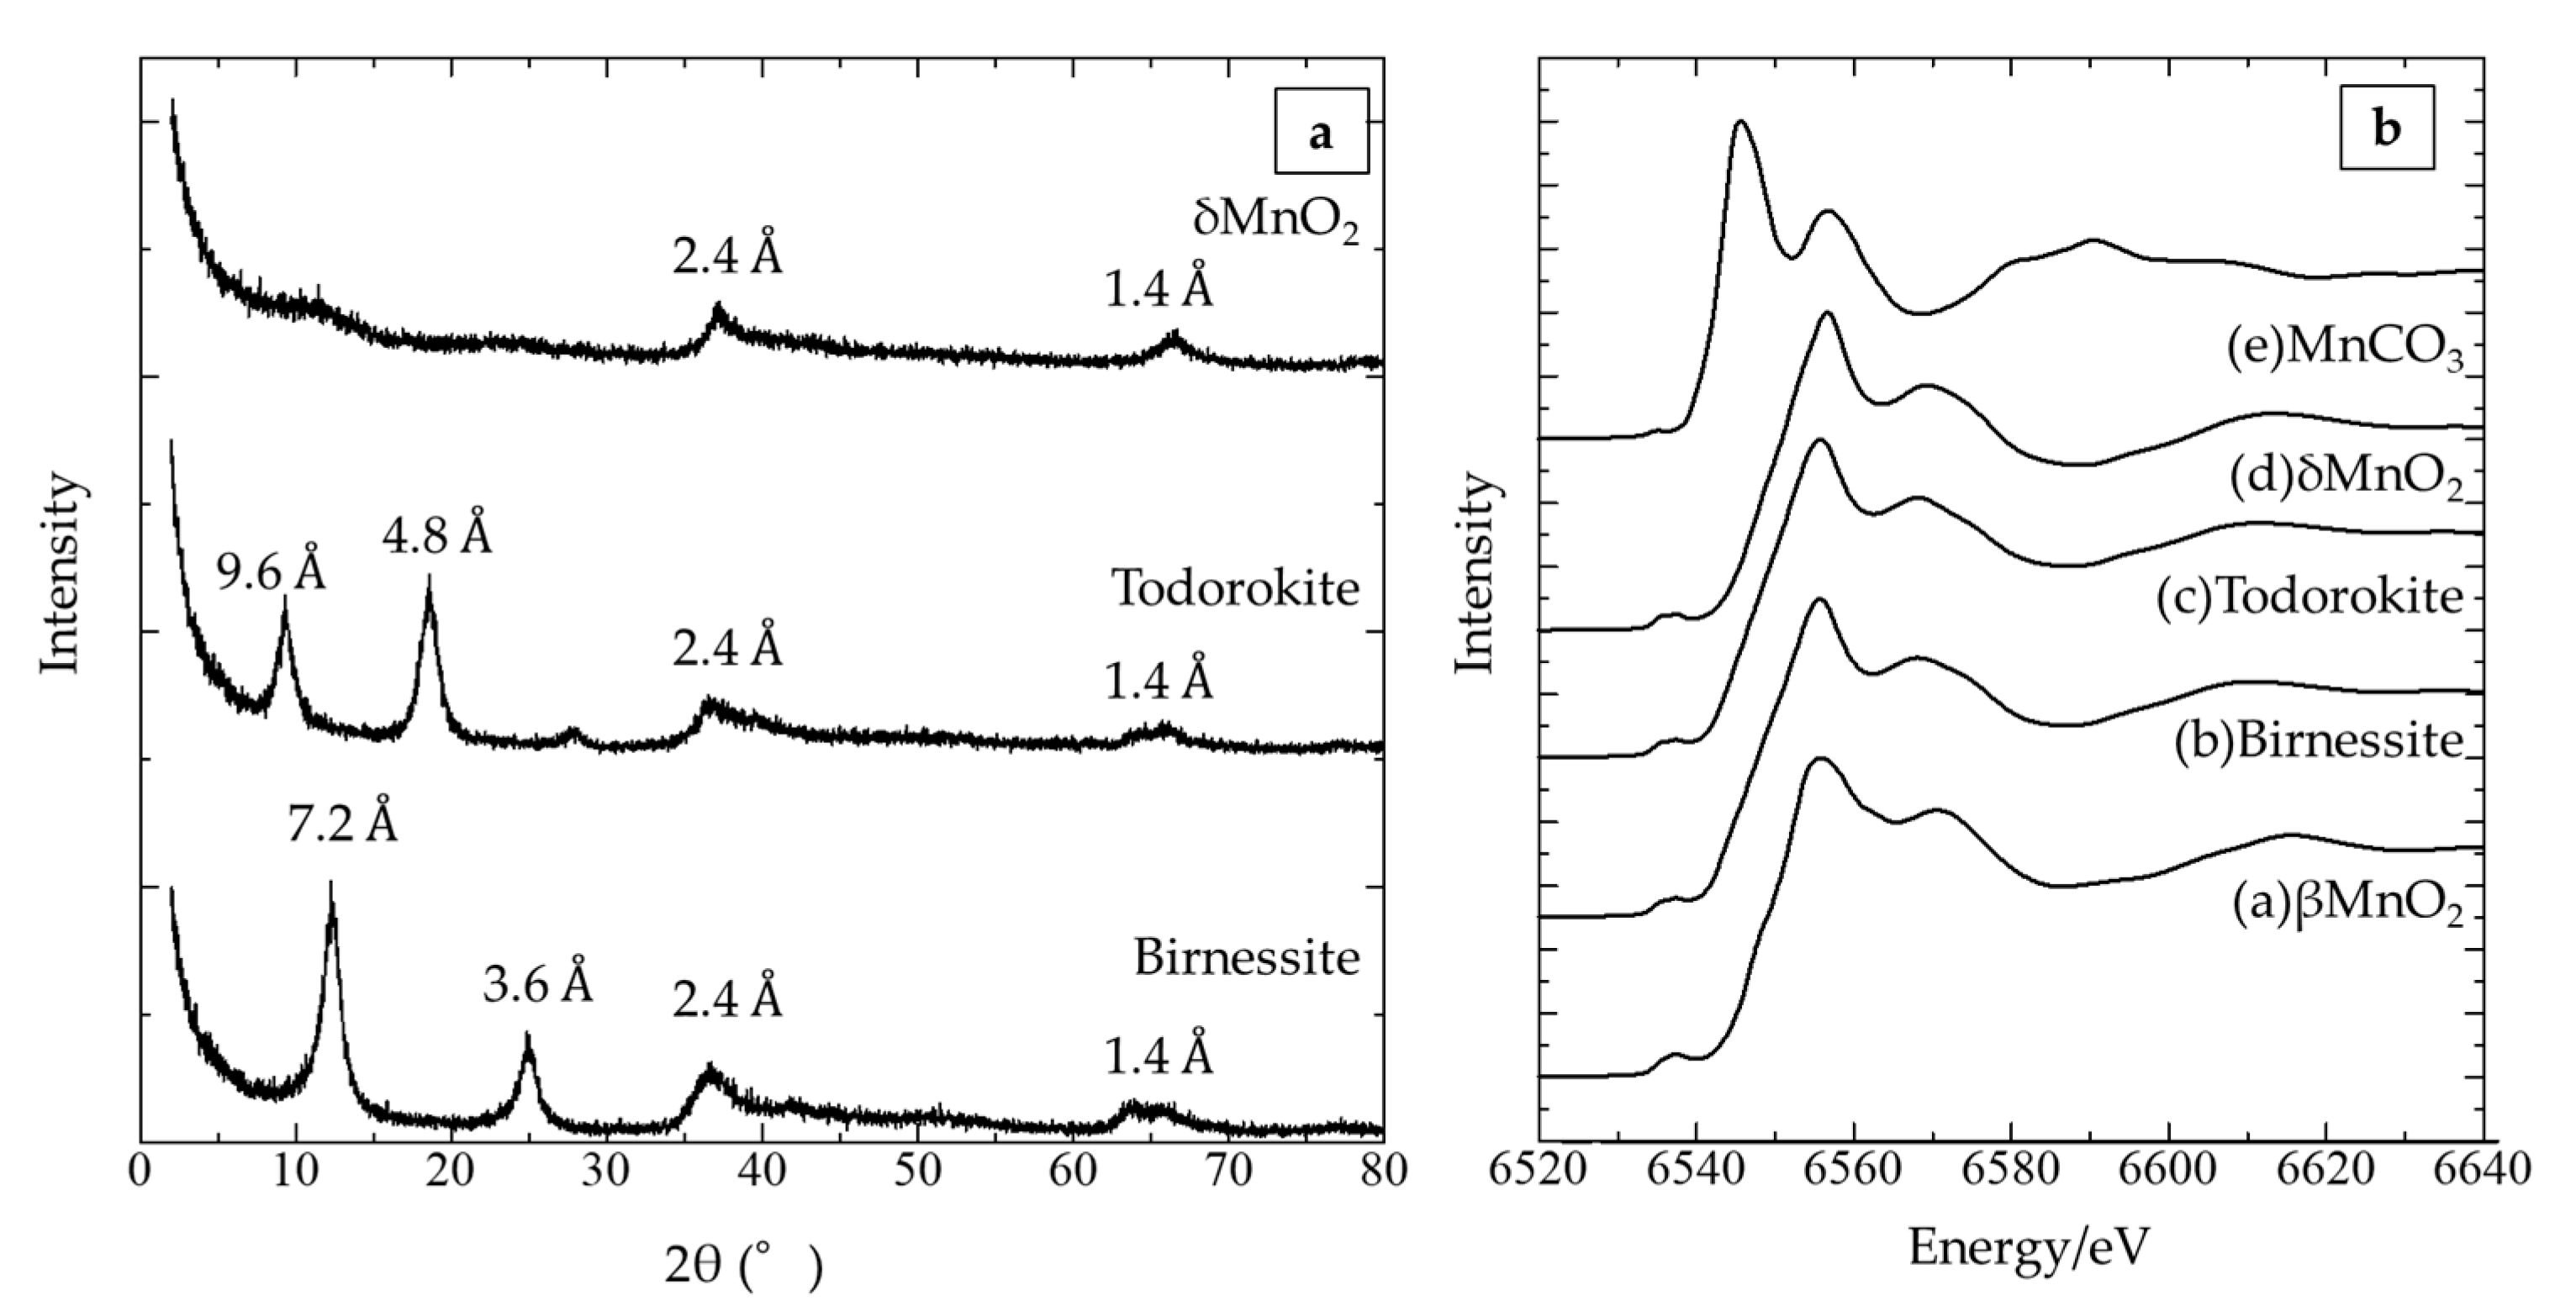
Figure 1. (a) XRD patterns; and (b) Mn K-edge XANES spectra of the manganese oxides used in the study.
Minerals 15 00079 g001
Figure 2. Birnessite: (a) TG; and (c) DTA results. Todorokite: (b) TG; and (d) DTA results.
Minerals 15 00079 g002
Figure 3. Amounts of Mo adsorption: (a) per unit mass of adsorbents; and (b) per unit surface area as a function of the solution of the Mo concentration. The solid and dashed lines represent the Langmuir and the Freundlich models, respectively. Todorokite (orange), δMnO2 (green), and birnessite (blue).
Minerals 15 00079 g003
Figure 4. (a) δ98/95Mo; and (b) the fractionation between liquid and solid phase Mo (Δ98/95Mo) as a function of the adsorption fraction on todorokite (orange), δMnO2 (green), and birnessite (blue). The solid and dashed lines in panel (a) are the isotopic equilibrium model (α = 1.00249) and the Rayleigh model (α = 1.00200) for todorokite, respectively [4]. In (a), the error bars represent 2σ of measurement error or NIST long-term error. The error bars in (b) represent propagation of the liquid phase and the solid phase errors.
Minerals 15 00079 g004
Figure 5. The relationship between Mo surface coverage and Δ98/95Mo in this study on todorokite (orange), birnessite (blue), and δMnO2 (green) and in the previous study on hematite (red) [5]. The dotted line is the regression line calculated from the results of this study (manganese oxides). The gray rectangle represents the ranges of Δ98/95Mo observed in natural ferromanganese oxides [1,2,12]. Error bars represent propagation of the liquid phase and the solid phase errors.
Minerals 15 00079 g005
Table 1. Results of the Mo adsorption experiments and isotope measurements.
MineralInitial Conc. (μM)Ads.
Fraction (%) *1
Amount of Adsorption (μmol/g)Coverage (μmol/m2)δ98/95Mo in
Reacted Solutions (‰)
2σ *2δ98/95Mo in Reacted Solids (‰)2σ *2Δ98/95Mo (‰)2σ *3
δMnO212.5734.560.201.690.04−0.920.042.610.05
12.5704.370.191.730.05−1.000.062.730.08
50379.240.400.570.04−1.770.042.340.05
504110.250.450.720.06−1.700.052.410.08
125159.350.410.100.06−2.080.042.190.07
Todorokite509323.220.202.170.04−0.390.052.560.06
509523.630.212.140.04−0.310.042.460.06
509323.150.202.160.05−0.450.042.610.06
758331.130.271.840.04−0.730.042.570.05
758130.380.261.780.04−0.740.042.530.05
1006934.610.301.430.04−1.080.042.510.05
1007034.970.301.470.04−1.080.042.540.05
1007035.050.301.540.05−1.050.062.600.08
1256037.460.331.210.04−1.200.052.410.06
1256138.170.331.240.04−1.260.042.500.05
1754943.230.380.950.04−1.480.042.430.05
1754842.260.370.960.04−1.500.042.460.05
1754942.960.371.080.04−1.460.042.540.05
2504150.700.440.700.04−1.770.042.460.05
3003349.760.430.420.04−1.770.042.180.05
Birnessite508120.255.331.430.04−0.650.042.070.05
506416.084.230.960.04−0.880.041.840.05
506315.824.160.930.04−0.910.041.840.05
757628.327.451.330.04−0.770.042.100.05
756524.216.370.990.04−0.900.041.890.05
1005427.127.140.600.04−0.790.051.390.06
1003919.335.090.430.04−1.250.041.680.06
1004422.245.850.530.04−1.150.041.680.05
2004645.9112.080.300.04−0.950.041.250.05
3002842.6611.230.160.04−1.420.041.580.05
*1 The adsorption fraction was calculated from the initial amount added and the solution concentration. *2 The larger of the measurement errors and the NIST long-term variation error were used to calculate the error. *3 The isotope fractionation error propagated the liquid phase and the solid phase error.
Disclaimer/Publisher’s Note: The statements, opinions and data contained in all publications are solely those of the individual author(s) and contributor(s) and not of MDPI and/or the editor(s). MDPI and/or the editor(s) disclaim responsibility for any injury to people or property resulting from any ideas, methods, instructions or products referred to in the content.