
Preconcentration of Gold from Mining Waste Samples Using the Solidified Floating Organic Drop Microextraction and Determination by Flow Injection–Flame Atomic Absorption Spectrometry


Abstract
1. Introduction
2. Materials and Methods
2.1. Reagents and Materials
2.2. Instrumentation
2.3. Preparation of Real Samples
2.4. Procedure
3. Results
3.1. Selection of Extraction Solvent
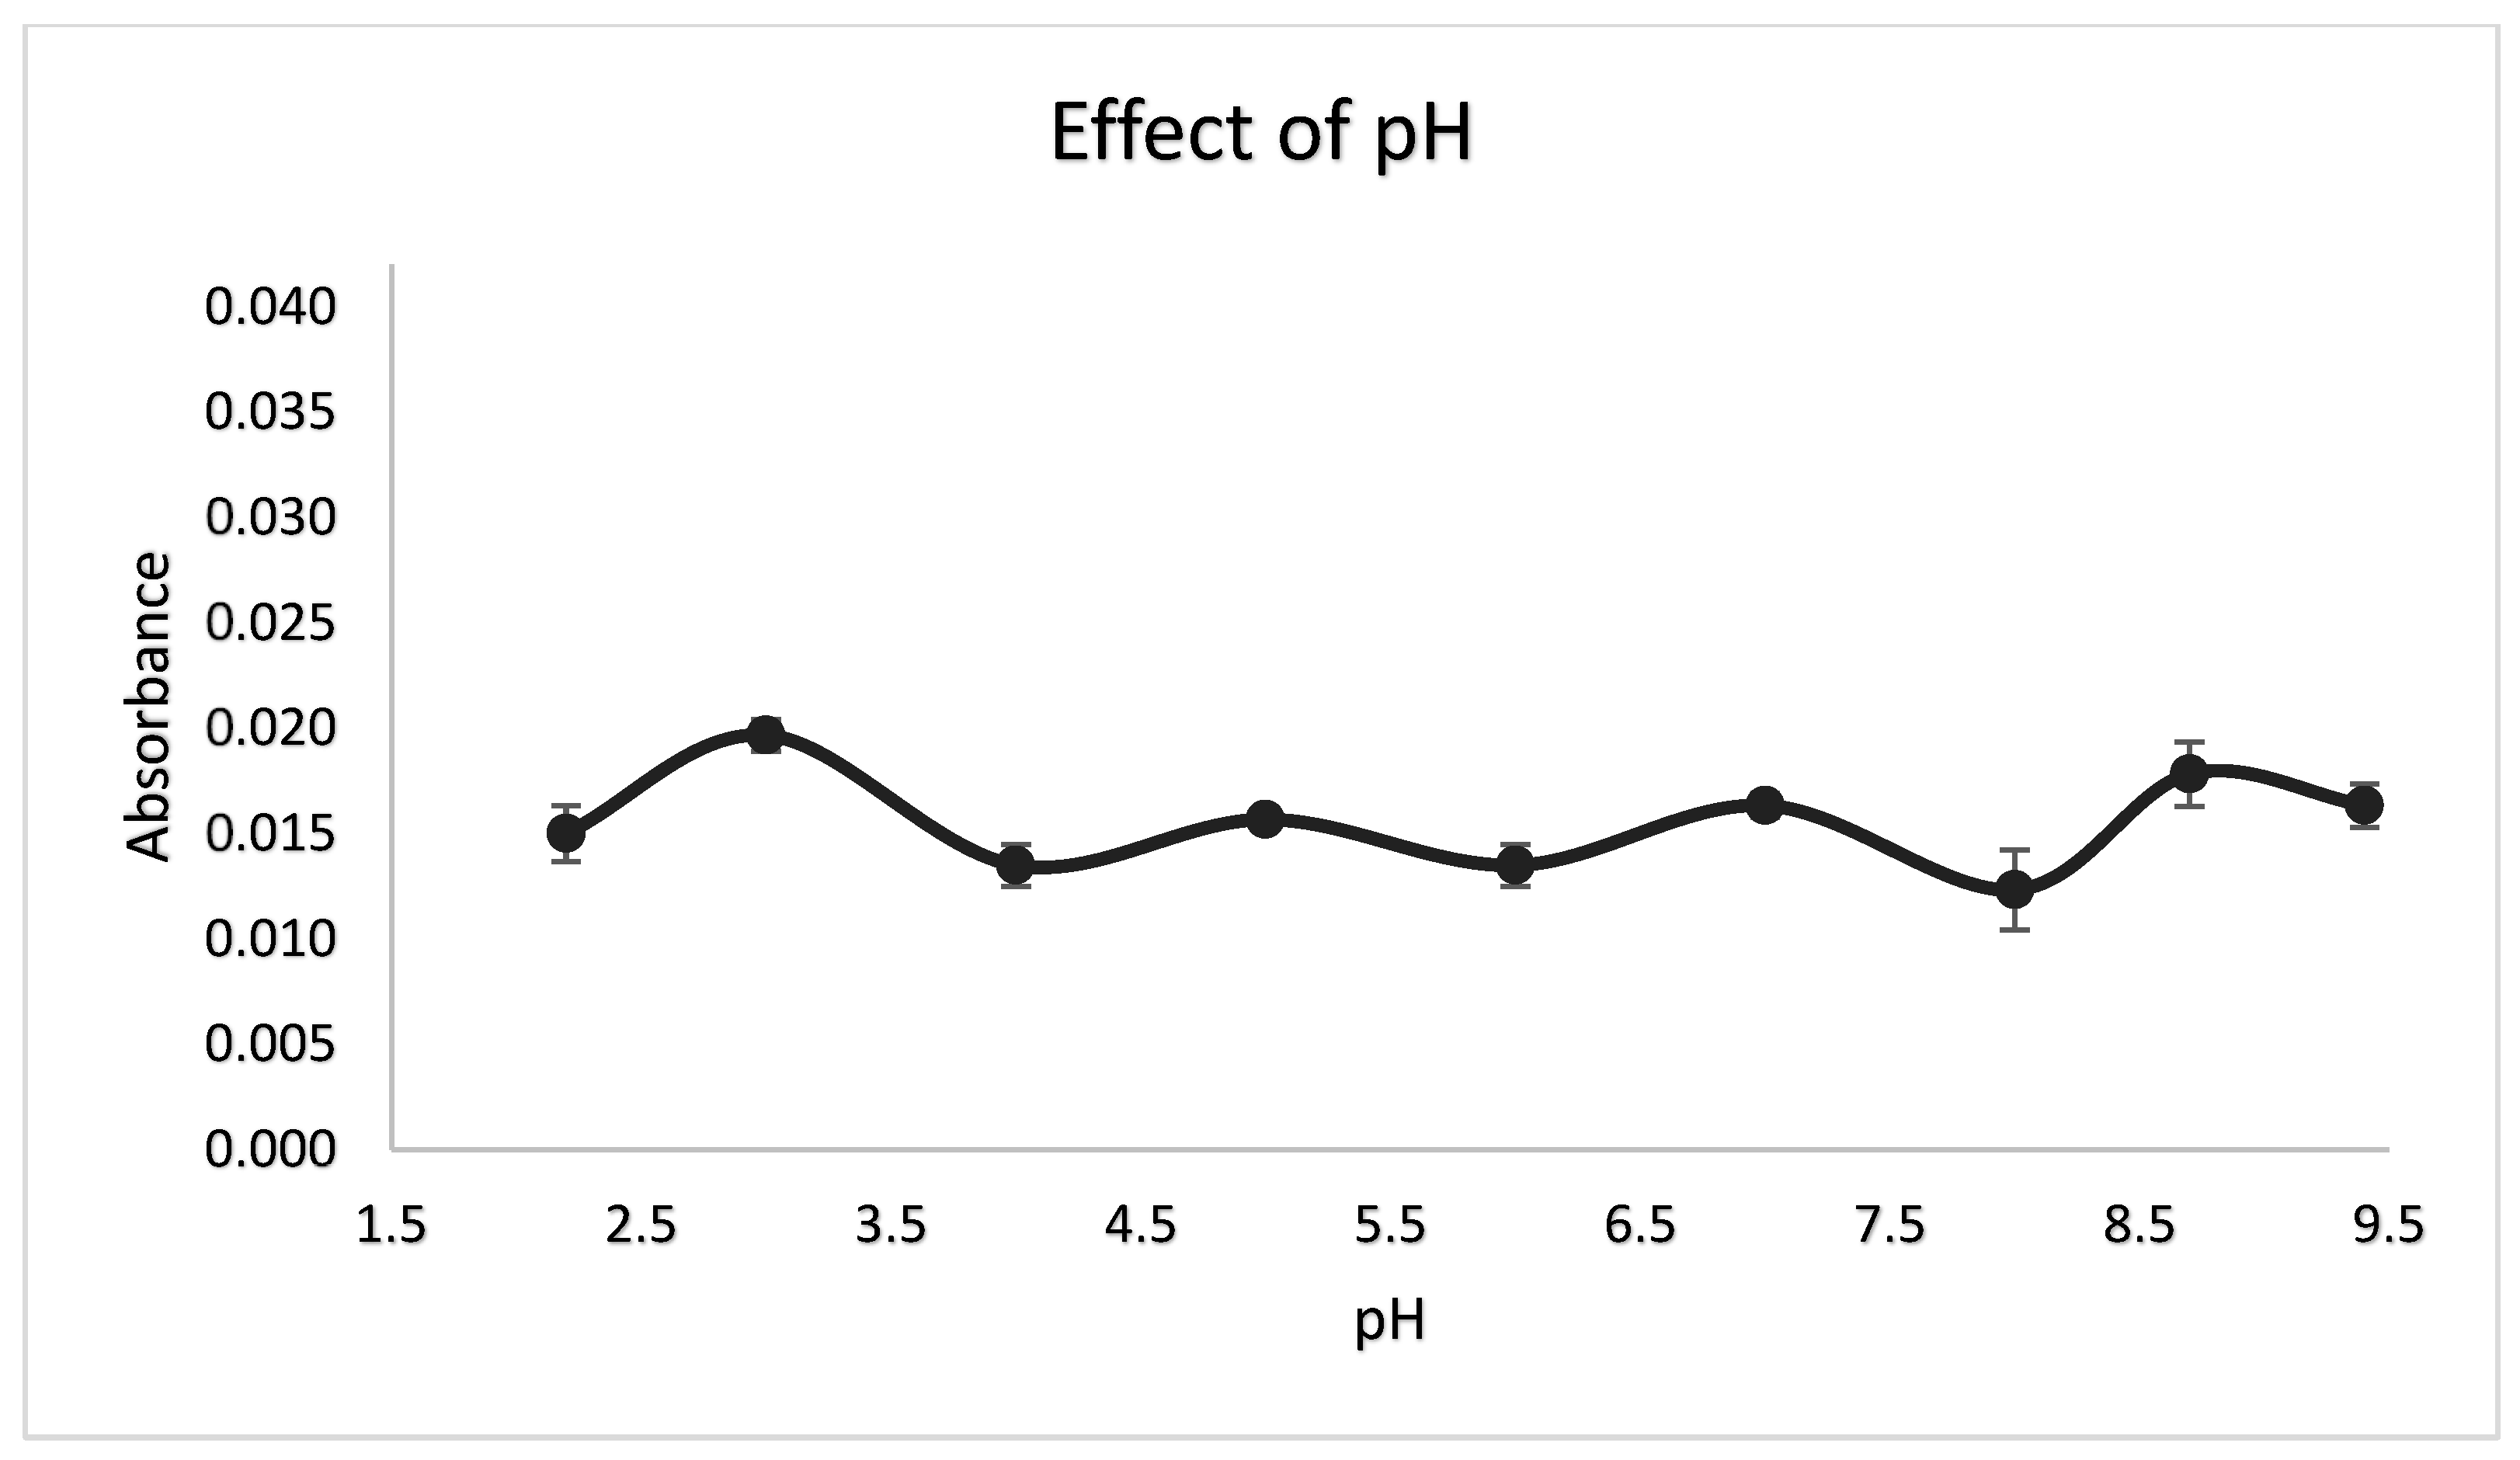
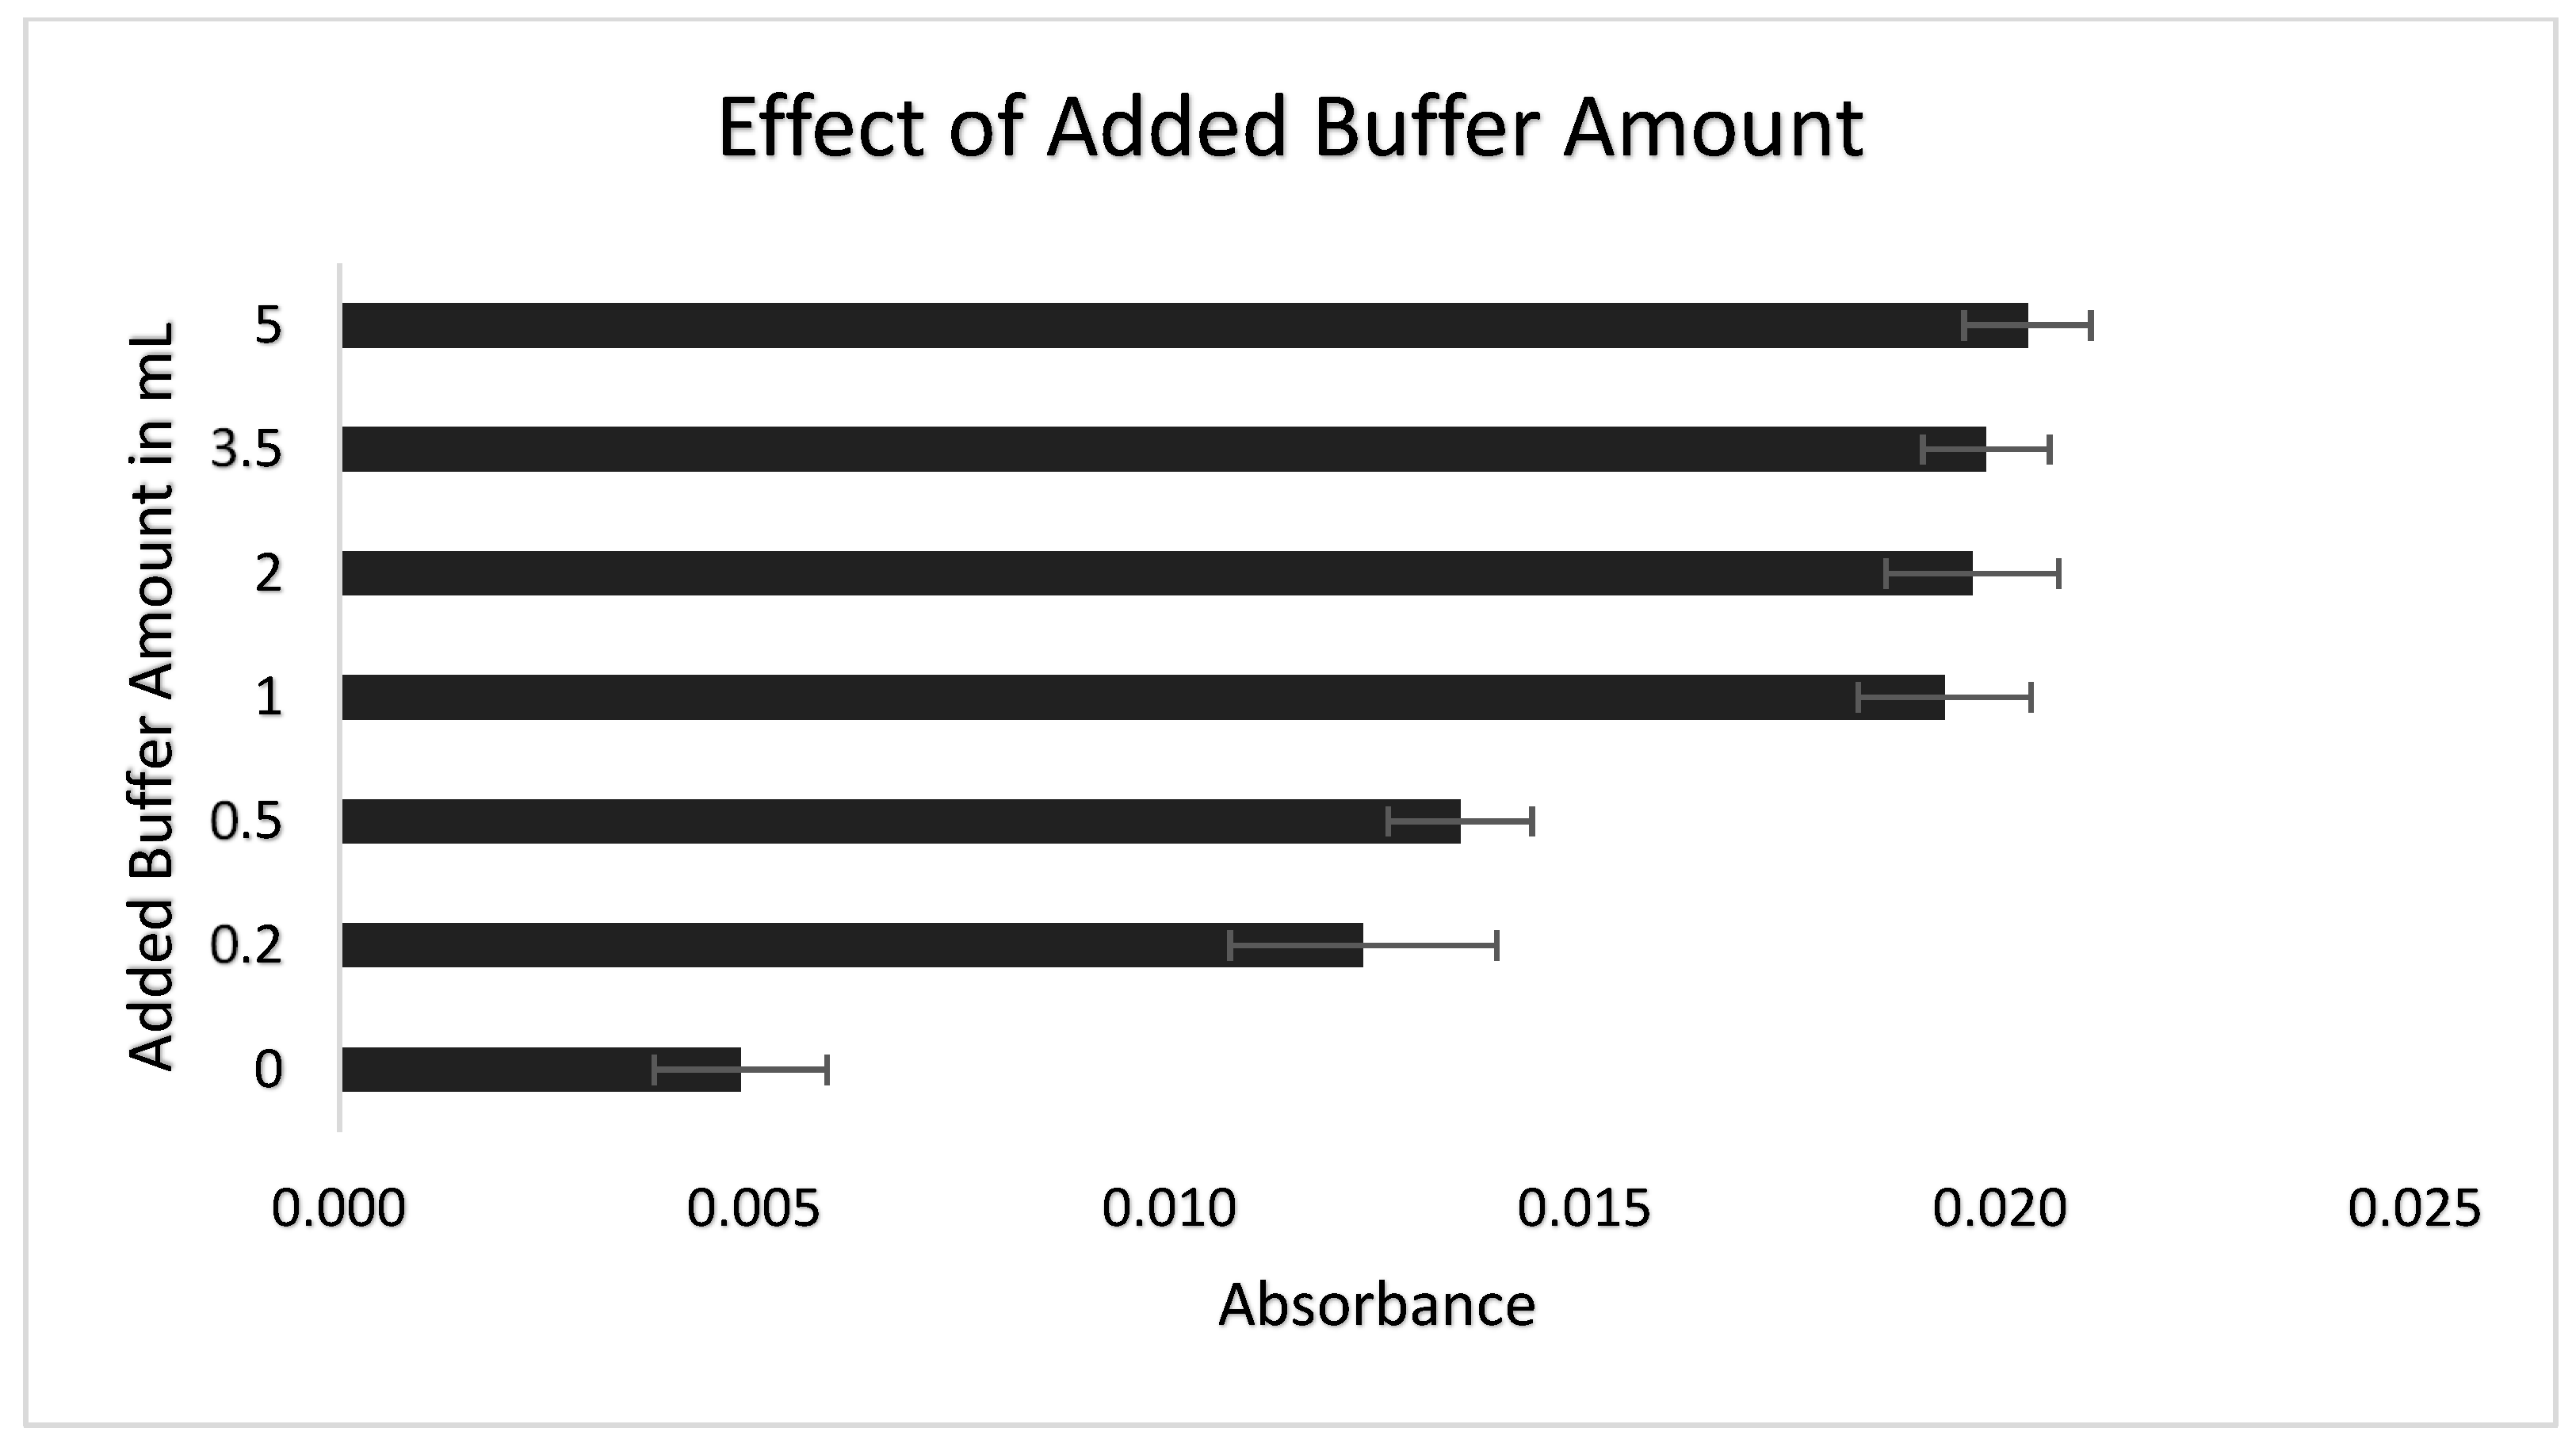
3.2. Selection of pH Buffer and Added Buffer Amount
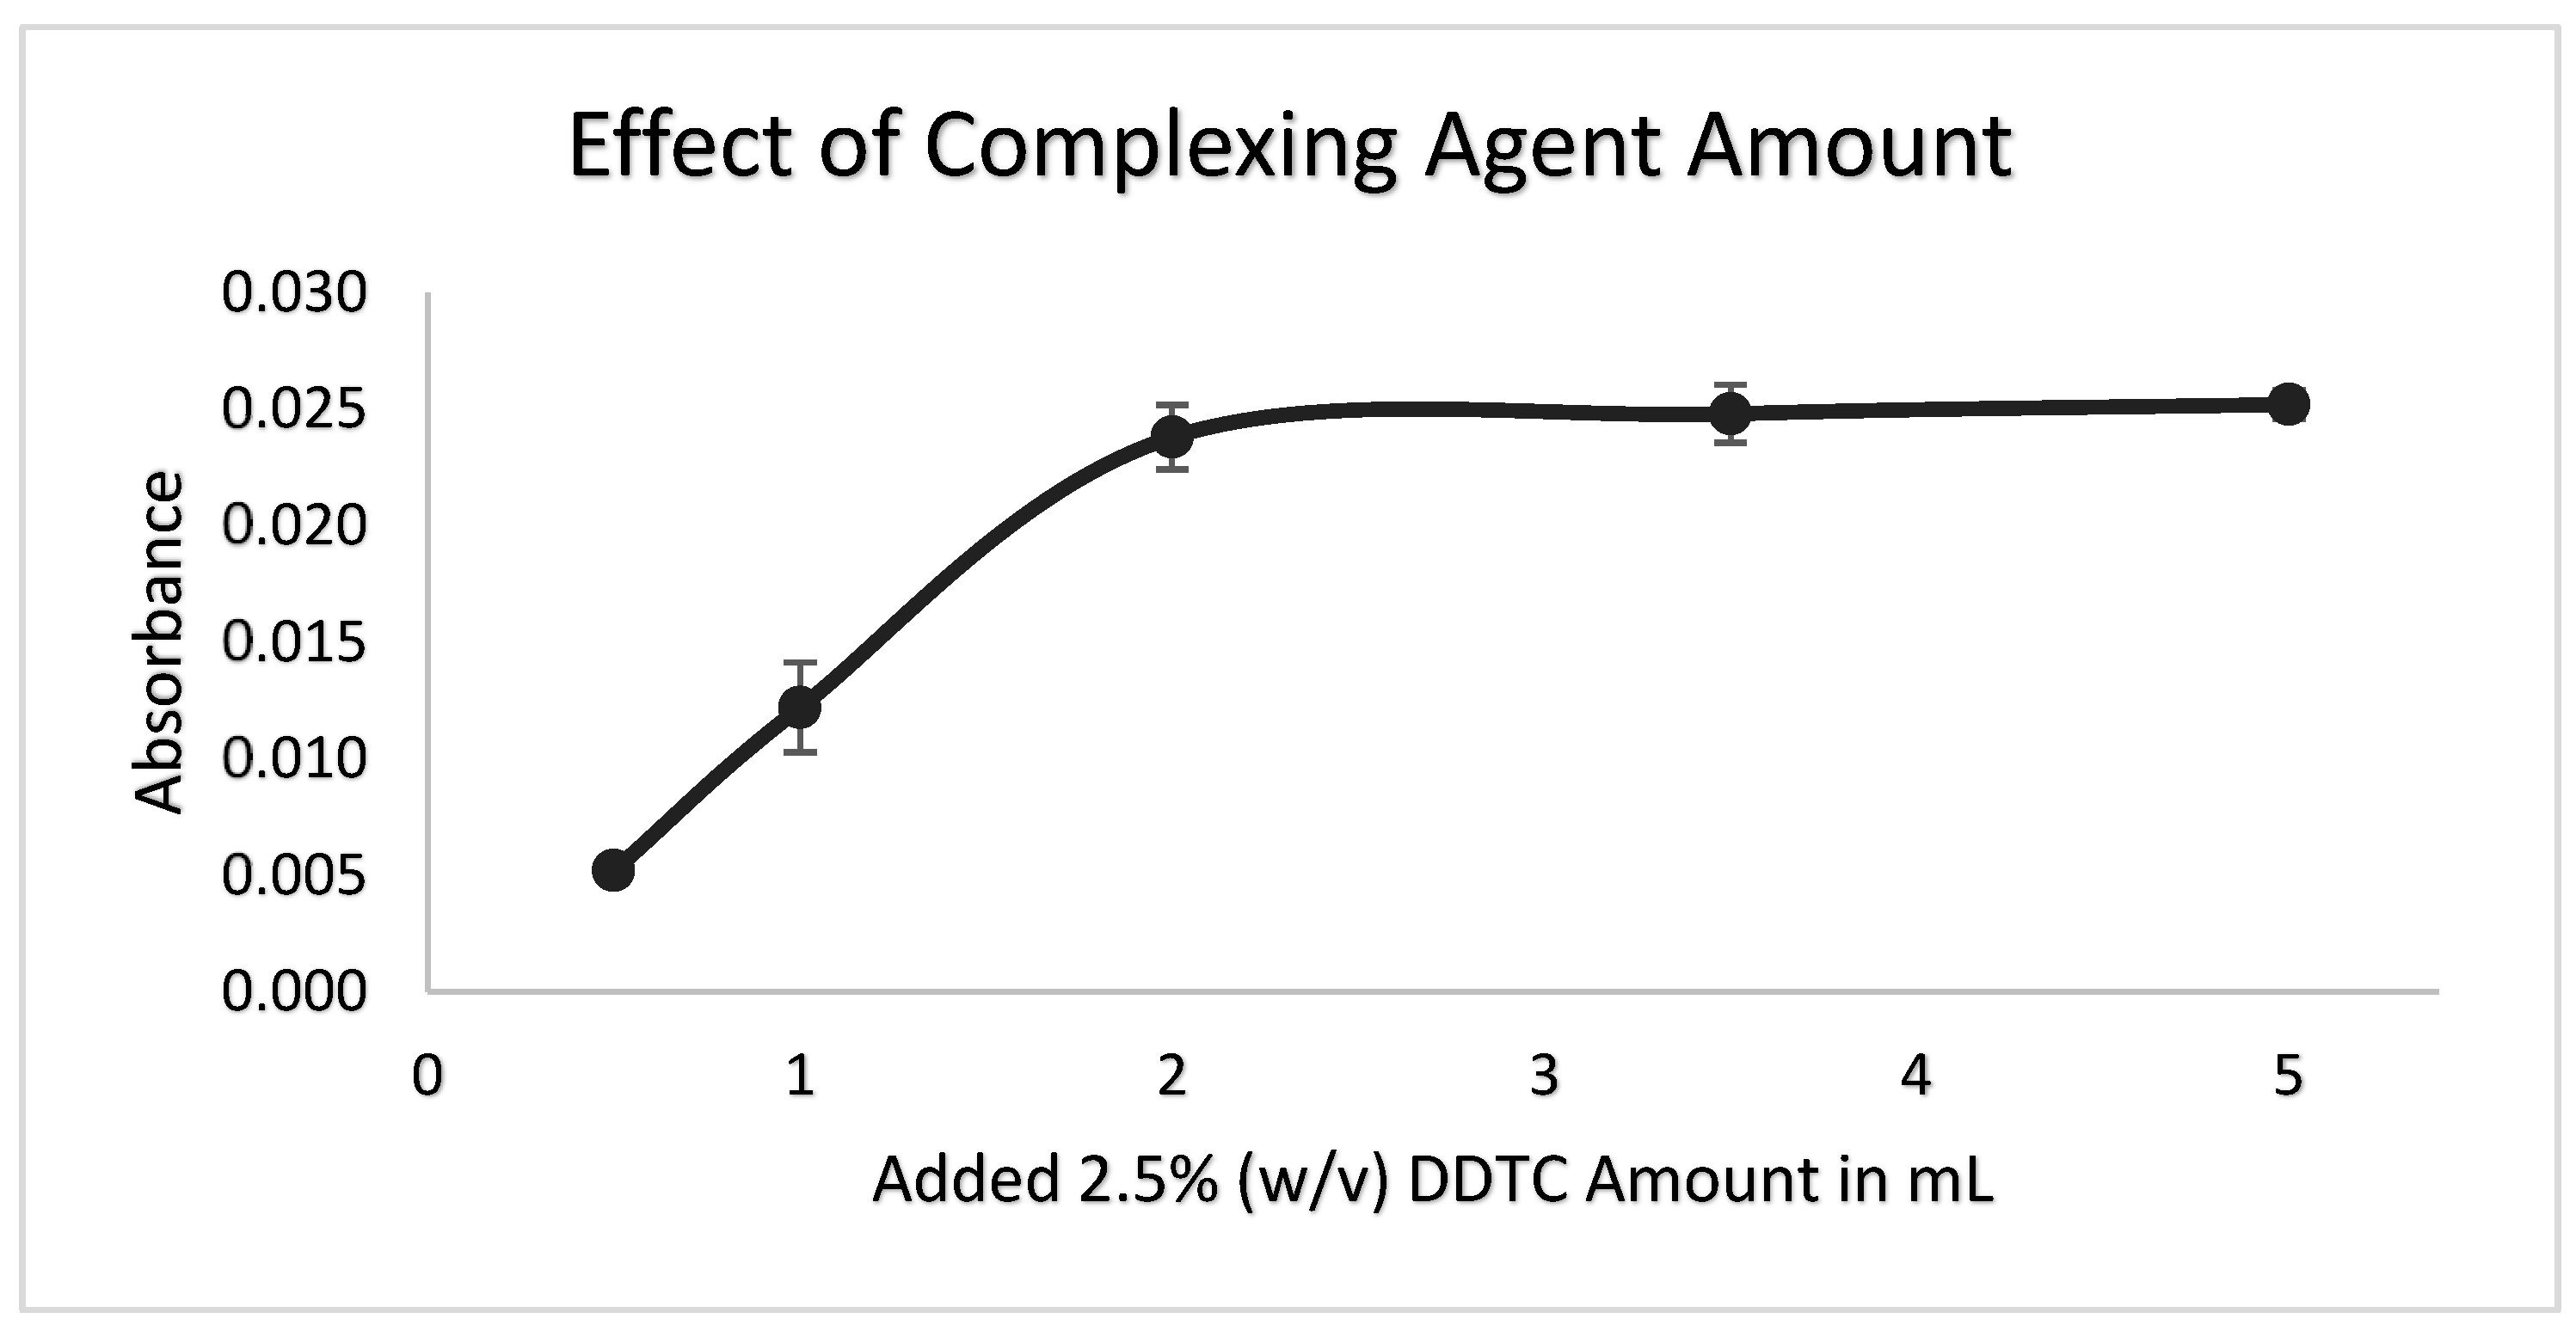
3.3. Added Complexing Agent Amount
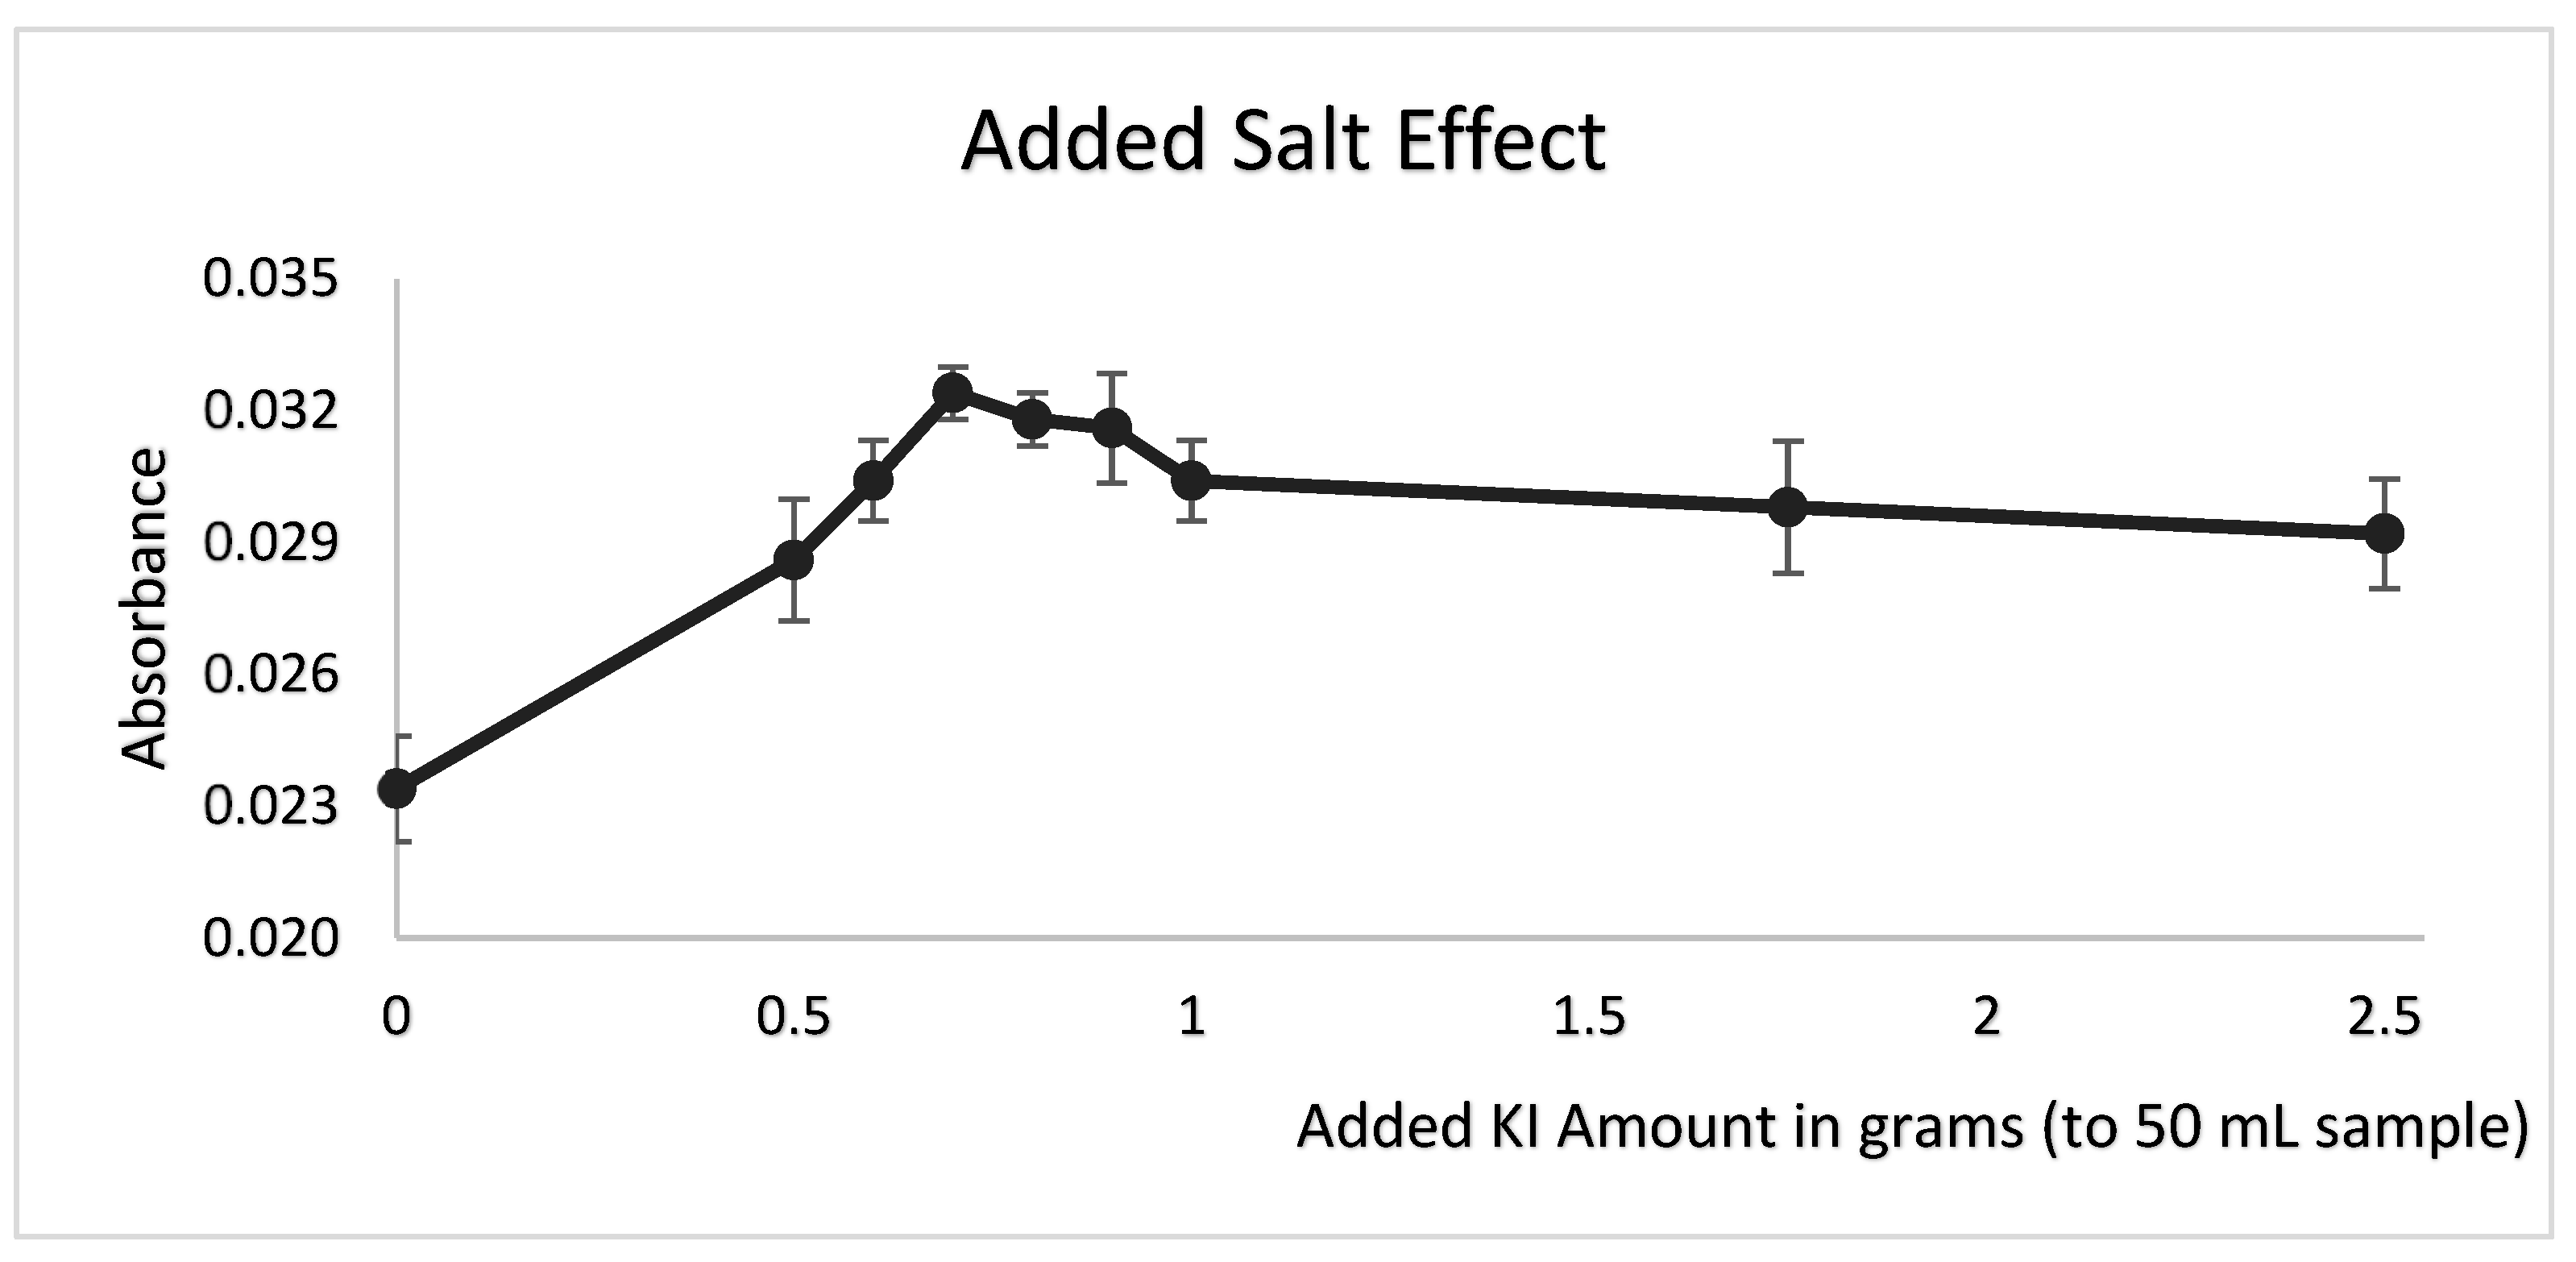
3.4. Effect of Salt
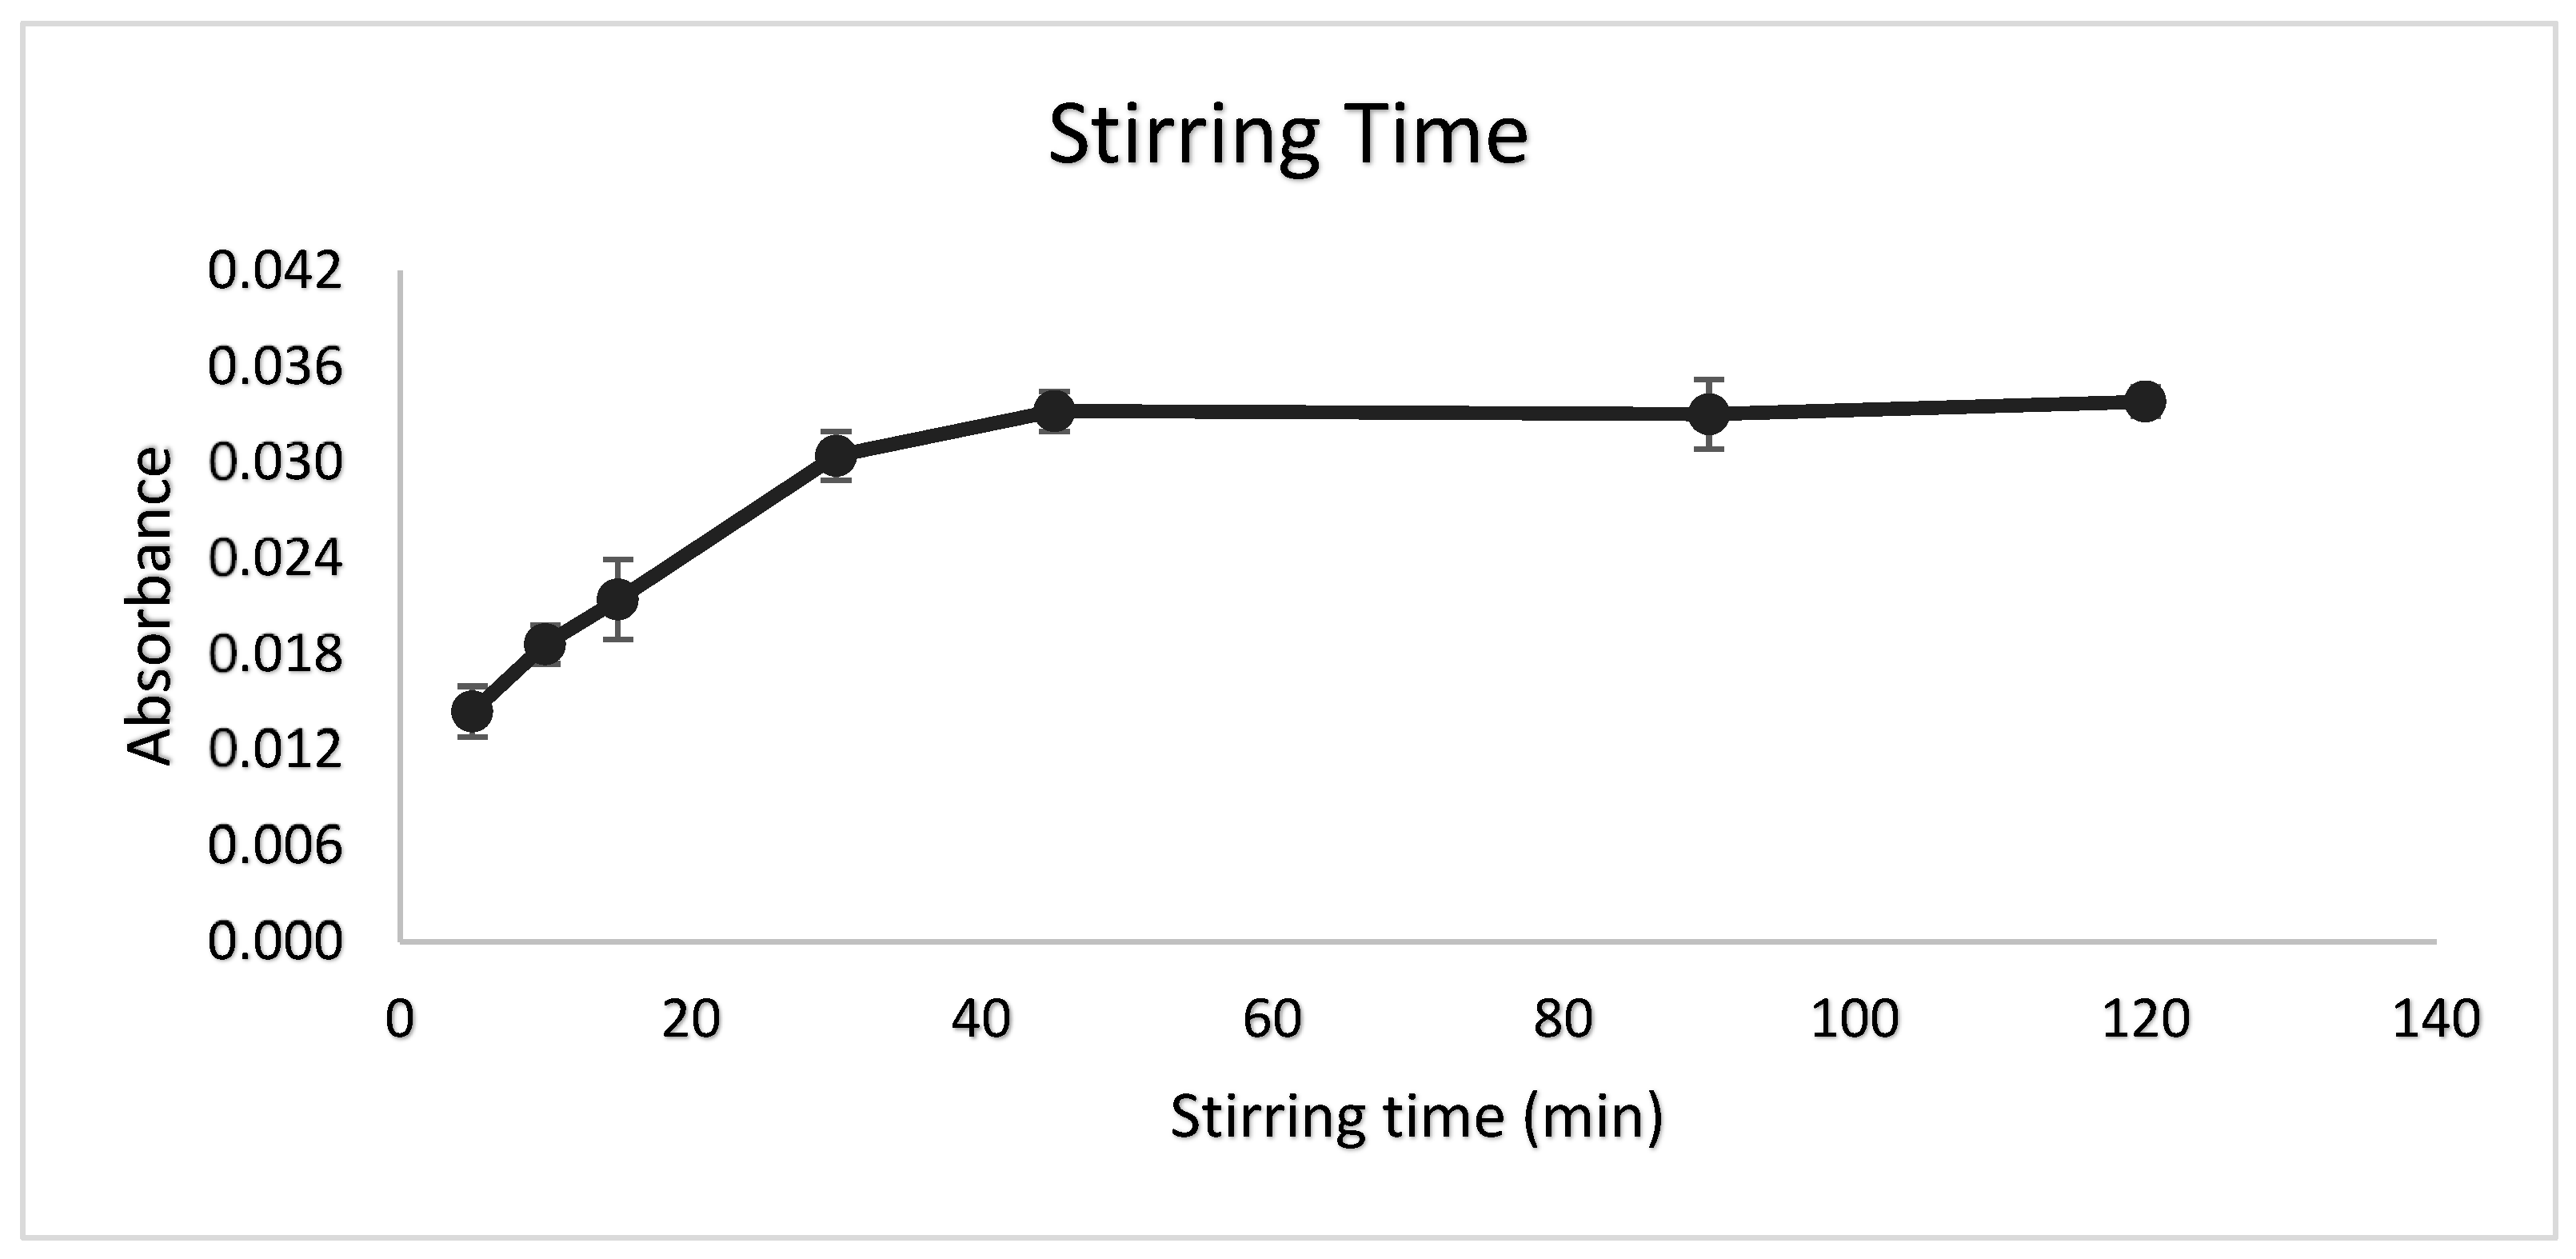
3.5. Stirring Time
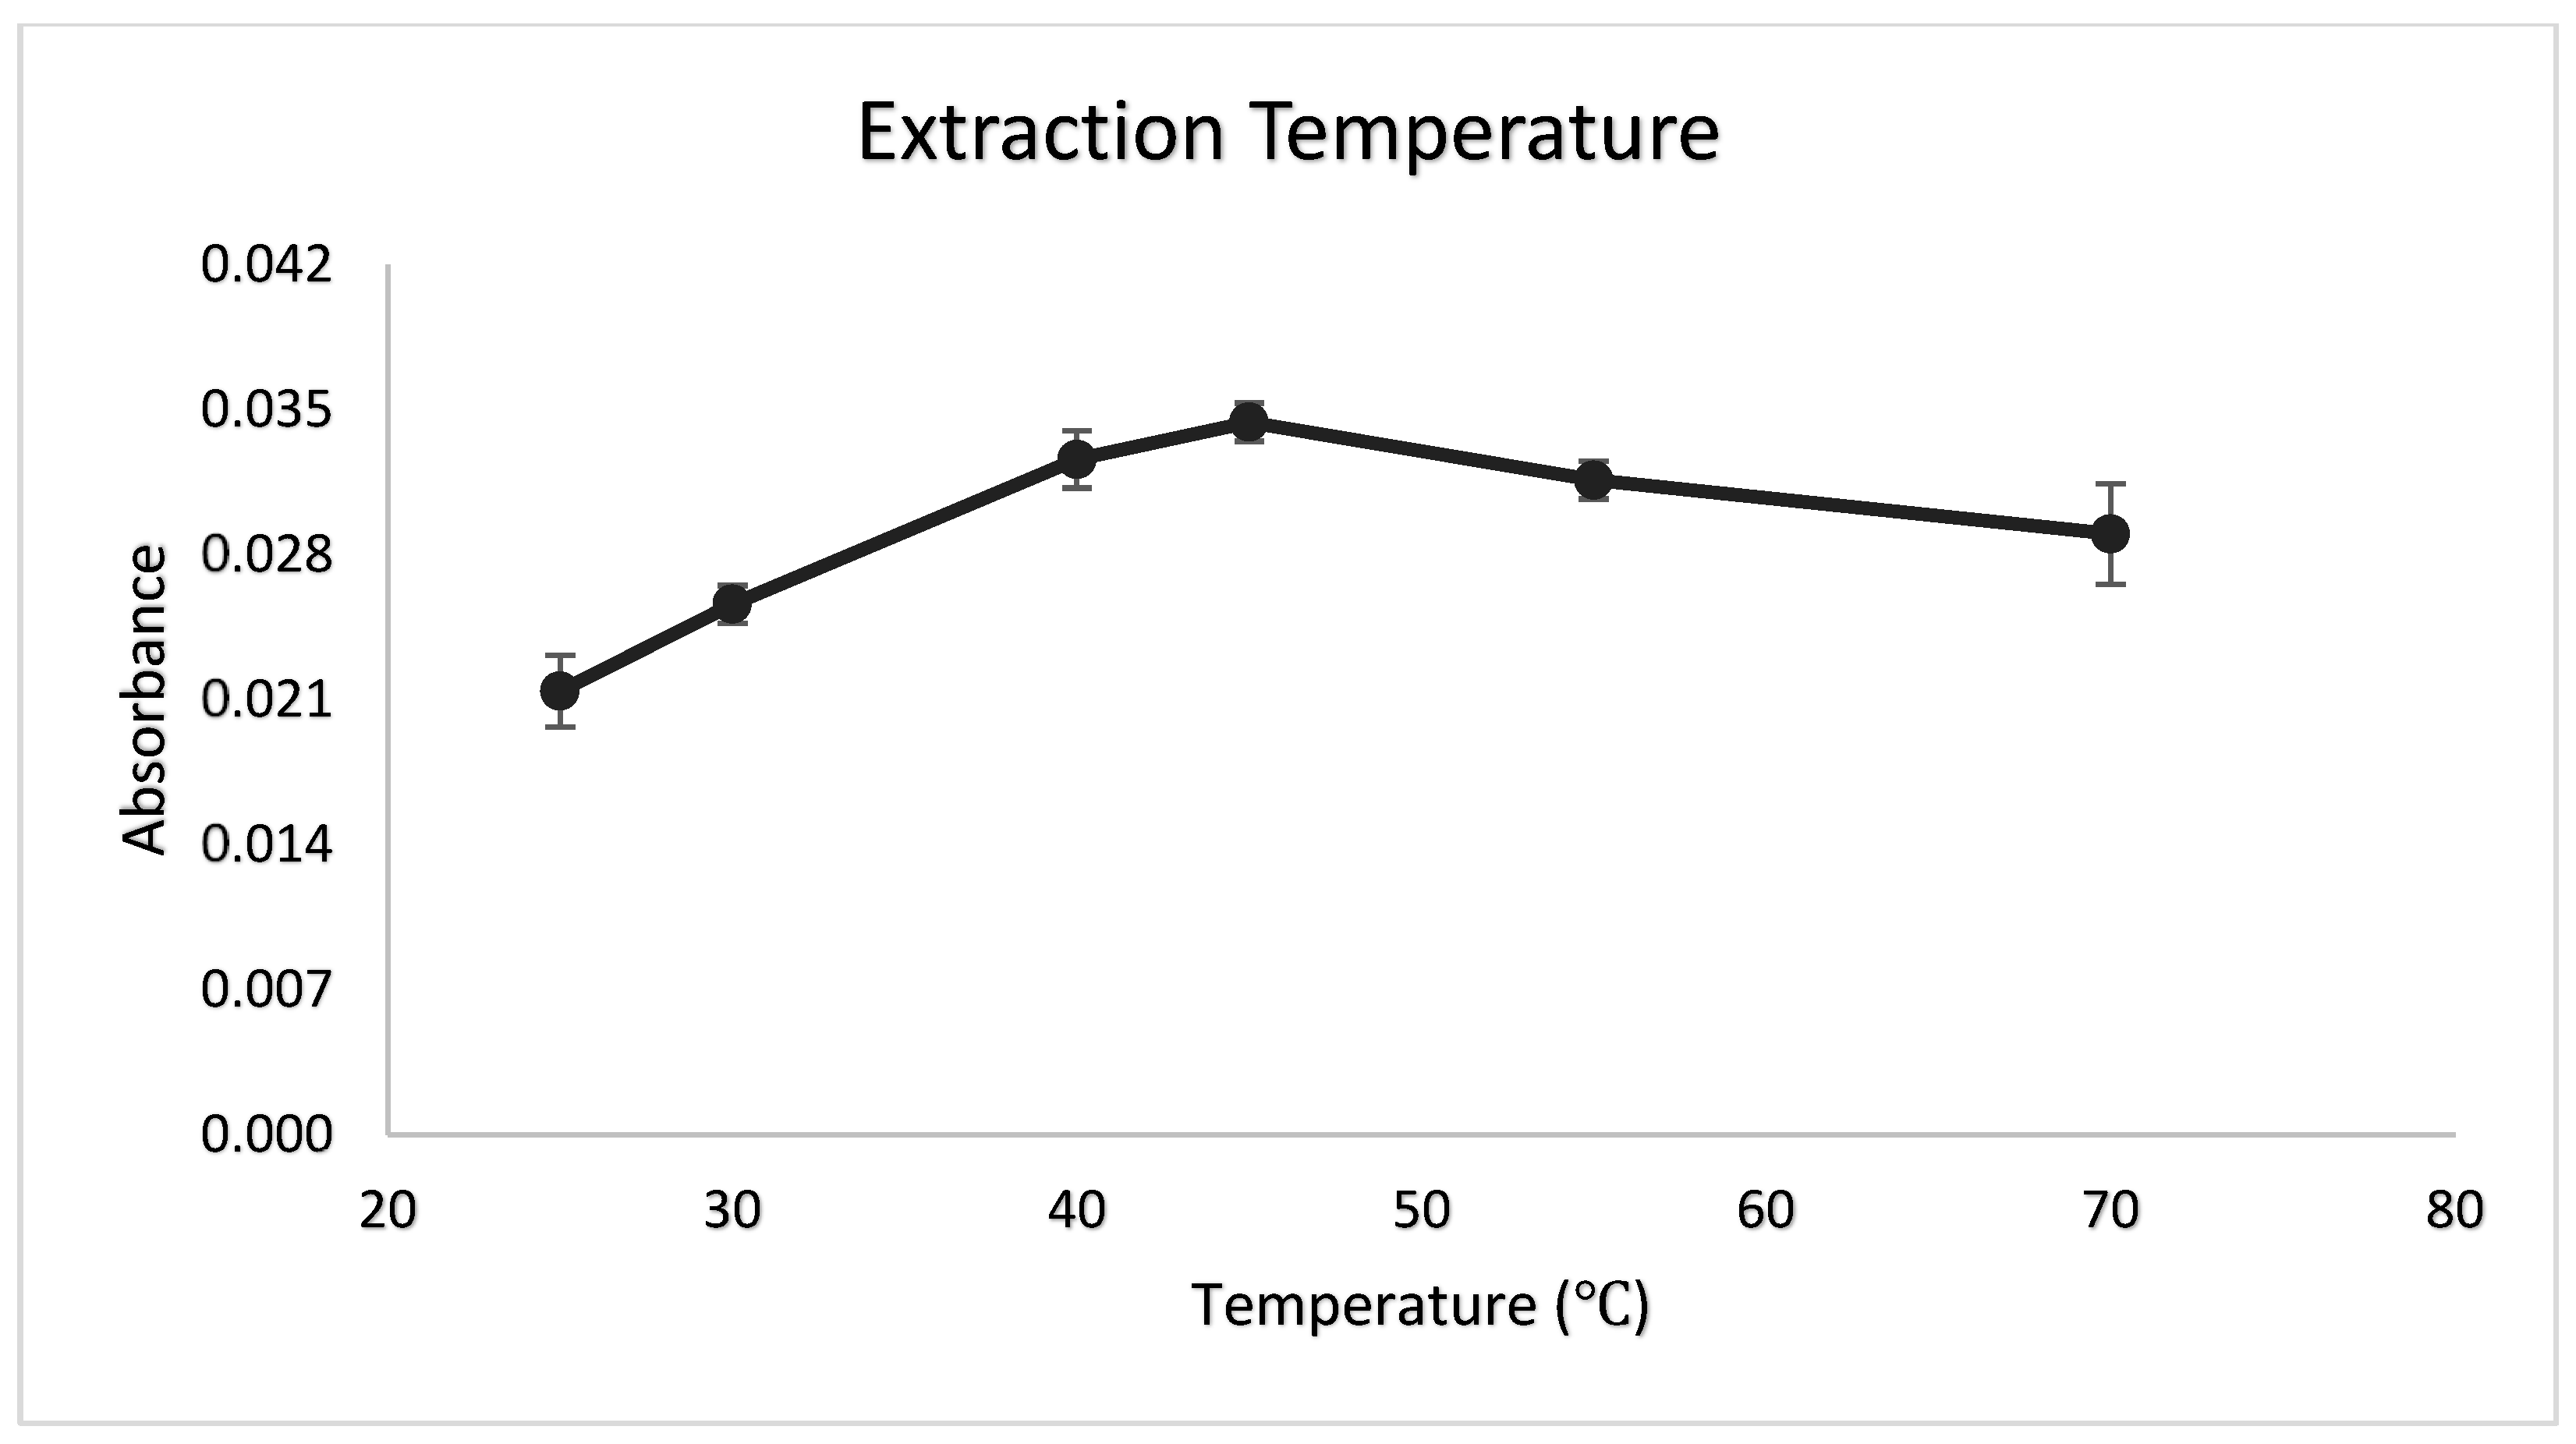
3.6. Extraction Temperature
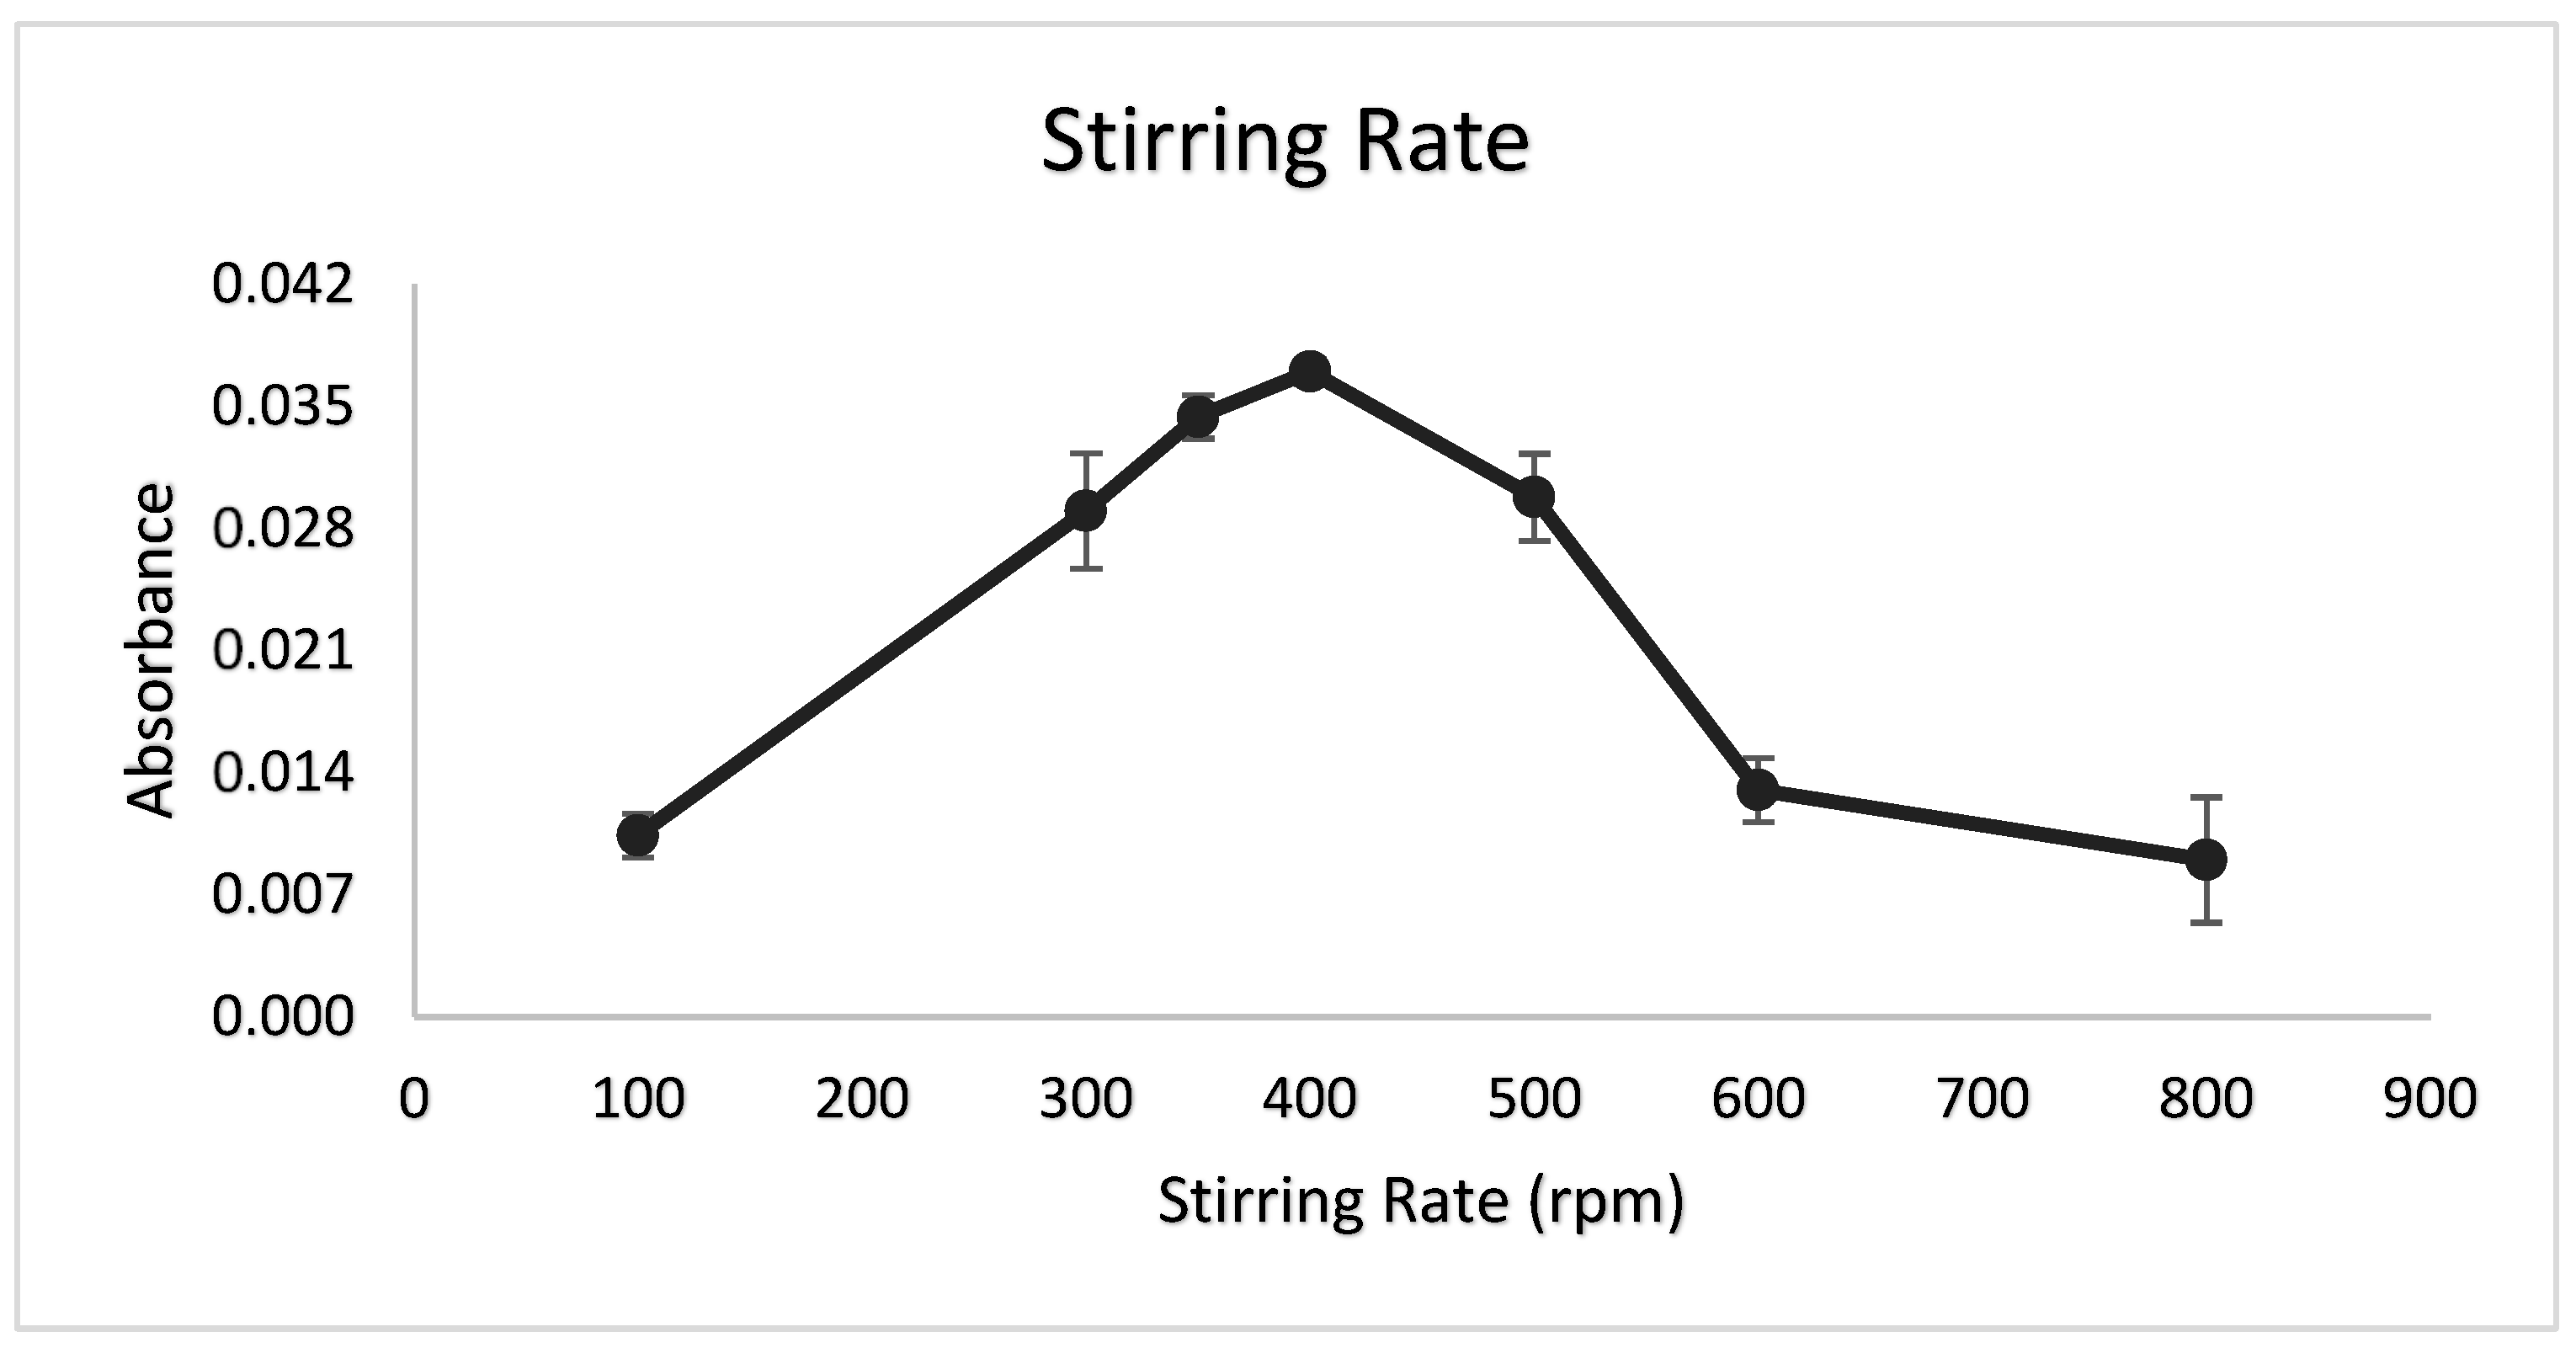
3.7. Stirring Rate
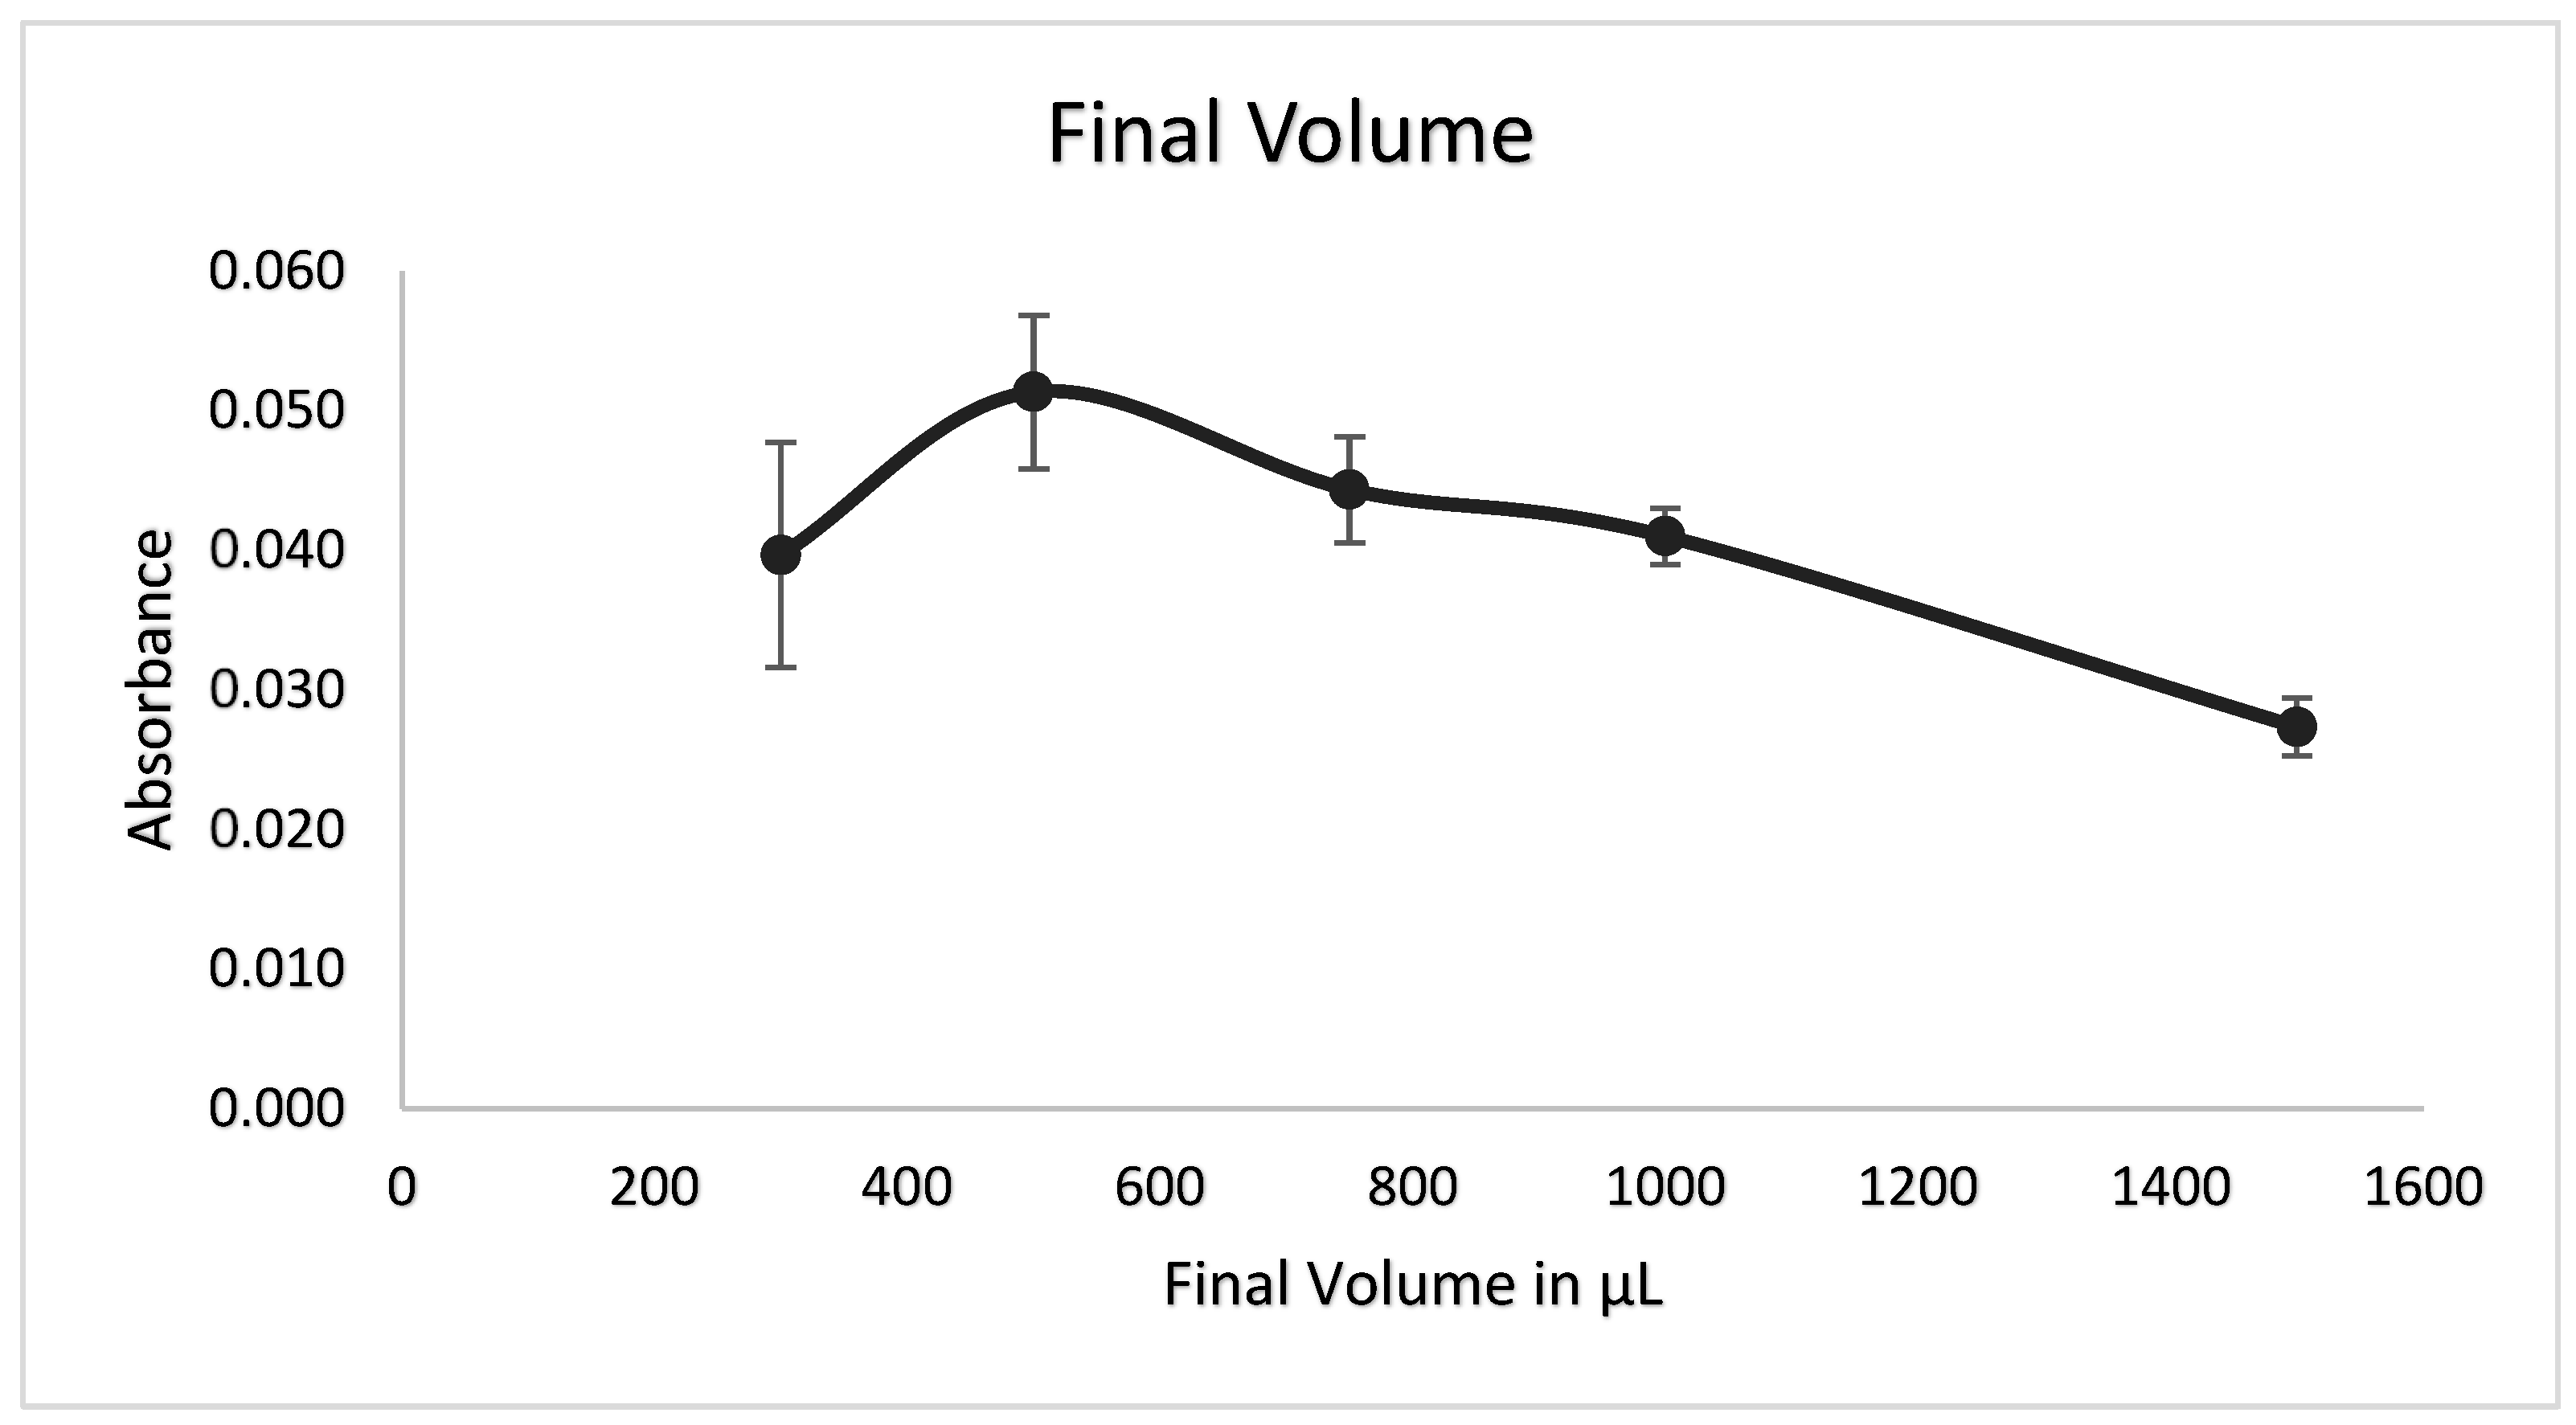
3.8. Final Volume
3.9. Effect of Interferences
3.10. Analytical Performance of Method
3.11. Analysis of Certified Material
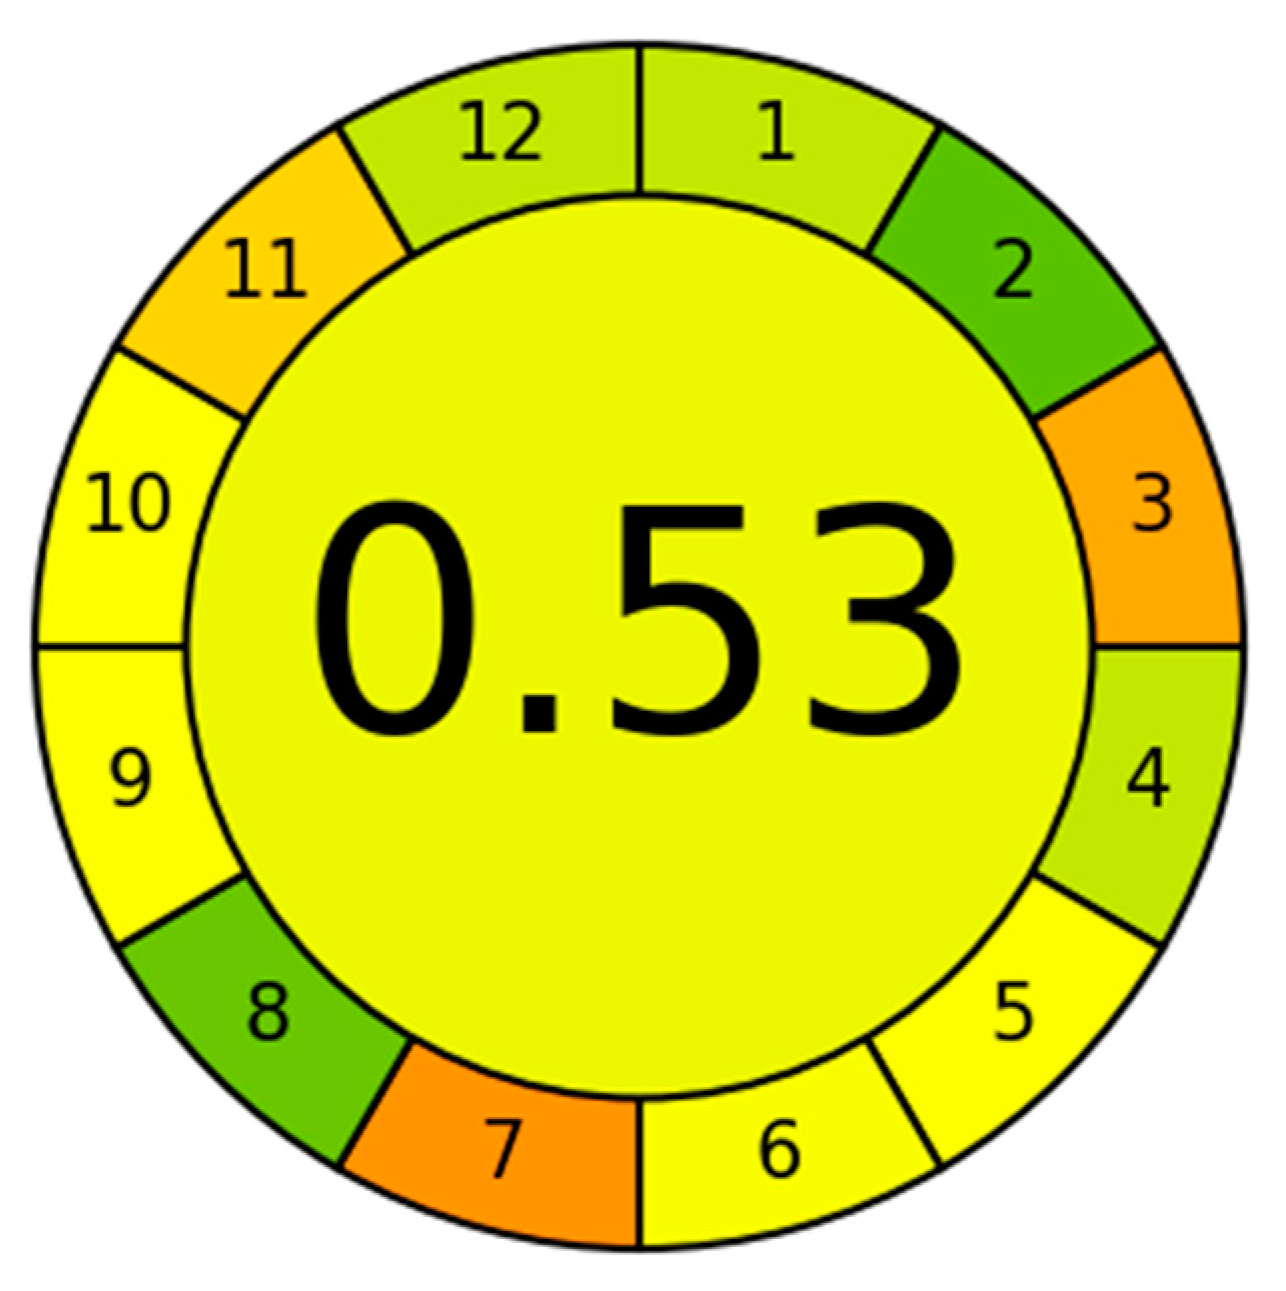
3.12. Analysis of Real Samples
4. Discussion
5. Conclusions
Author Contributions
Funding
Data Availability Statement
Acknowledgments
Conflicts of Interest
References
- Talbi, M.; Bedoui, R.; de Peretti, C.; Belkacem, L. Is the role of precious metals as precious as they are? A vine copula and BiVaR approaches. Resour. Policy 2021, 73, 102140. [Google Scholar] [CrossRef]
- Hassan, H.; Sharma, P.; Hasan, M.R.; Singh, S.; Thakur, D.; Narang, J. Gold nanomaterials–The golden approach from synthesis to applications. Mater. Sci. Energy Technol. 2022, 5, 375–390. [Google Scholar] [CrossRef]
- Nakhjiri, A.T.; Sanaeepur, H.; Amooghin, A.E.; Shirazi, M.M. Recovery of precious metals from industrial wastewater towards resource recovery and environmental sustainability: A critical review. Desalination 2022, 527, 115510. [Google Scholar] [CrossRef]
- Burlakovs, J.; Vincevica-Gaile, Z.; Krievans, M.; Jani, Y.; Horttanainen, M.; Pehme, K.-M.; Dace, E.; Setyobudi, R.H.; Pilecka, J.; Denafas, G.; et al. Platinum group elements in geosphere and anthroposphere: Interplay among the global reserves, urban ores, markets and circular economy. Minerals 2020, 10, 558. [Google Scholar] [CrossRef]
- Xolo, L.; Moleko-Boyce, P.; Makelane, H.; Faleni, N.; Tshentu, Z.R. Status of recovery of strategic metals from spent secondary products. Minerals 2021, 11, 673. [Google Scholar] [CrossRef]
- Neag, E.; Kovacs, E.; Dinca, Z.; Török, A.I.; Varaticeanu, C.; Levei, E.A. Hydrometallurgical recovery of gold from mining wastes. In Strategies of Sustainable Solid Waste Management; Intech: Houston, TX, USA, 2020. [Google Scholar]
- Araujo, F.S.; Taborda-Llano, I.; Nunes, E.B.; Santos, R.M. Recycling and reuse of mine tailings: A review of advancements and their implications. Geosciences 2022, 12, 319. [Google Scholar] [CrossRef]
- Wang, J.; Faraji, F.; Ramsay, J.; Ghahreman, A. A review of biocyanidation as a sustainable route for gold recovery from primary and secondary low-grade resources. J. Clean. Prod. 2021, 296, 126457. [Google Scholar] [CrossRef]
- He, Y.; Hosseinzadeh-Bandbafha, H.; Kiehbadroudinezhad, M.; Peng, W.; Tabatabaei, M.; Aghbashlo, M. Environmental footprint analysis of gold recycling from electronic waste: A comparative life cycle analysis. J. Clean. Prod. 2023, 432, 139675. [Google Scholar] [CrossRef]
- Peng, H.; Chen, H.; Sun, Y.; Zhang, X.; Abubakar, M. Environmental economics of green recovery in mineral extraction: Balancing production and conservation. Resour. Policy 2024, 96, 105202. [Google Scholar] [CrossRef]
- Medveď, J.; Bujdoš, M.; Matúš, P.; Kubová, J. Determination of trace amounts of gold in acid-attacked environmental samples by atomic absorption spectrometry with electrothermal atomization after preconcentration. Anal. Bioanal. Chem. 2004, 379, 60–65. [Google Scholar] [CrossRef] [PubMed]
- Kagaya, S.; Takata, D.; Yoshimori, T.; Kanbara, T.; Tohda, K. A sensitive and selective method for determination of gold (III) based on electrothermal atomic absorption spectrometry in combination with dispersive liquid–liquid microextraction using dicyclohexylamine. Talanta 2010, 80, 1364–1370. [Google Scholar] [CrossRef]
- Ashkenani, H.; Taher, M.A. Use of ionic liquid in simultaneous microextraction procedure for determination of gold and silver by ETAAS. Microchem. J. 2012, 103, 185–190. [Google Scholar] [CrossRef]
- Wang, Y.; Baker, L.A.; Brindle, I.D. Determination of gold and silver in geological samples by focused infrared digestion: A re-investigation of aqua regia digestion. Talanta 2016, 148, 419–426. [Google Scholar] [CrossRef] [PubMed]
- Tao, D.; Guo, W.; Xie, W.; Jin, L.; Guo, Q.; Hu, S. Rapid and accurate determination of gold in geological materials by an improved ICP-MS method. Microchem. J. 2017, 135, 221–225. [Google Scholar] [CrossRef]
- Borovicka, J.; Randa, Z.; Jelinek, E. Gold content of ectomycorrhizal and saprobic macrofungi from non-auriferous and unpolluted areas. Mycol. Res. 2005, 109, 951–955. [Google Scholar] [CrossRef]
- Nyarku, M.; Nyarko, B.J.B.; Serfor-Armah, Y.; Osae, S. Investigating concentration distributions of arsenic, gold and antimony in grain-size fractions of gold ore using instrumental neutron activation analysis. Appl. Radiat. Isot. 2010, 68, 378–383. [Google Scholar] [CrossRef] [PubMed]
- Shamspur, T.; Mostafavi, A. Application of modified multiwalled carbon nanotubes as a sorbent for simultaneous separation and preconcentration trace amounts of Au (III) and Mn (II). J. Hazard. Mater. 2009, 168, 1548–1553. [Google Scholar] [CrossRef]
- Ocaña-González, J.A.; Fernández-Torres, R.; Bello-López, M.Á.; Ramos-Payán, M. New developments in microextraction techniques in bioanalysis. A review. Anal. Chim. Acta 2016, 905, 8–23. [Google Scholar] [CrossRef]
- Rezaee, M.; Assadi, Y.; Hosseini MR, M.; Aghaee, E.; Ahmadi, F.; Berijani, S. Determination of organic compounds in water using dispersive liquid–liquid microextraction. J. Chromatogr. A 2006, 1116, 1–9. [Google Scholar] [CrossRef] [PubMed]
- Tajik, S.; Taher, M.A. New method for microextraction of ultra trace quantities of gold in real samples using ultrasound-assisted emulsification of solidified floating organic drops. Microchim. Acta 2011, 173, 249–257. [Google Scholar] [CrossRef]
- Hussein, A.R.; Gburi, M.S.; Muslim, N.M.; Azooz, E.A. A greenness evaluation and environmental aspects of solidified floating organic drop microextraction for metals: A review. Trends Environ. Anal. Chem. 2023, 37, e00194. [Google Scholar] [CrossRef]
- Bahadir, Z.; Bulut, V.N.; Bektaş, H.; Soylak, M. A sensitive method for the determination of gold and palladium based on dispersive liquid–liquid microextraction combined with flame atomic absorption spectrometric determination using N-(6-morpholin-4-ylpyridin-3-yl)-N′-phenylthiourea. RSC Adv. 2016, 6, 6896–6904. [Google Scholar] [CrossRef]
- Yilmaz, E.; Soylak, M. Supramolecular solvent microextraction of gold prior to its determination by microsample injection system coupled with flame atomic absorption spectrometry. RSC Adv. 2014, 4, 47396–47401. [Google Scholar] [CrossRef]
- Tong, S.; Jia, Q.; Song, N.; Zhou, W.; Duan, T.; Bao, C. Determination of gold (III) and palladium (II) in mine samples by cloud point extraction preconcentration coupled with flame atomic absorption spectrometry. Microchim. Acta 2011, 172, 95–102. [Google Scholar] [CrossRef]
- Sha, O.; Chen, J.; Chen, L.; Li, S. In situ ionic liquid dispersive liquid–liquid microextraction and determination of Au (III) by flame atomic absorption spectrometry. J. Iran. Chem. Soc. 2015, 12, 1391–1398. [Google Scholar] [CrossRef]
- Höl, A.; Arslan Kartal, A.; Akdogan, A.; Elçi, A.; Arslan, T.; Elçi, L. Ion pair-dispersive liquid-liquid microextraction coupled to microsample injection system-flame atomic absorption spectrometry for determination of gold at trace level in real samples. Acta Chim. Slov. 2015, 62, 196–203. [Google Scholar]
- Hassan, J.; Zari, N.; Tabar-Heydar, K.; Ahmadi, S.H. Ion-association dispersive liquid–liquid microextraction of ultra-trace amount of gold in water samples using Aliquat 336 prior to inductively coupled plasma atomic emission spectrometry determination. J. Anal. Sci. Technol. 2016, 7, 22. [Google Scholar] [CrossRef]
- Pena-Pereira, F.; Wojnowski, W.; Tobiszewski, M. AGREE—Analytical GREEnness metric approach and software. Anal. Chem. 2020, 92, 10076–10082. [Google Scholar] [CrossRef] [PubMed]


| 20-Fold | 50-Fold | >100-Fold | ||||
|---|---|---|---|---|---|---|
| Added Ion | Absorbance | Relative Error | Absorbance | Relative Error | Absorbance | Relative Error |
| Mn2+ | 0.0341 | −1.49 | 0.0326 | 3.12 | 0.0322 | 4.32 |
| (CO3)2− | 0.0333 | 0.89 | 0.0331 | 1.64 | 0.0321 | 4.46 |
| Fe3+ | 0.0329 | 2.08 | 0.0331 | 1.49 | 0.0325 | 3.42 |
| Mg2+ | 0.0327 | 2.83 | 0.0330 | 1.93 | 0.0324 | 3.57 |
| Ca2+ | 0.0339 | −0.89 | 0.0330 | 1.93 | 0.0322 | 4.32 |
| Rh3+ | 0.0329 | 2.23 | 0.0345 | −2.68 | 0.0328 | 2.38 |
| NO3− | 0.0329 | 2.08 | 0.0325 | 3.42 | 0.0322 | 4.17 |
| K+ | 0.0335 | 0.45 | 0.0331 | 1.49 | 0.0326 | 2.98 |
| Cr3+ | 0.0345 | −2.53 | 0.0336 | 0.15 | 0.0341 | −1.34 |
| Zn2+ | 0.0335 | 0.30 | 0.0335 | 0.45 | 0.0329 | 2.08 |
| Na+ | 0.0334 | 0.74 | 0.0325 | 3.42 | 0.0323 | 3.87 |
| Co2+ | 0.0321 | 4.46 | 0.0316 | 6.10 | ||
| Al3+ | 0.0326 | 2.98 | 0.0319 | 5.06 | ||
| Cd2+ | 0.0325 | 3.42 | 0.0317 | 5.65 | ||
| (SO4)2− | 0.0320 | 4.91 | 0.0316 | 6.10 | ||
| Mn2+ | 0.0327 | 2.83 | 0.0319 | 5.06 | ||
| Ag+ | 0.0315 | 6.40 | ||||
| Cu2+ | 0.0318 | 5.51 | ||||
| Pd2+ | 0.0314 | 6.70 | ||||
| Co2+ | 0.0315 | 6.40 | ||||
| Analytical Figures | ||
|---|---|---|
| Regression Equation | A = xC + y | 0.6258x + 0.0047 |
| Correlation Coefficient | 0.9988 | |
| Enhancement Factor | 42.57 | |
| Linear Range | µg/L | 20–450 |
| LOD | 3s (µg/L) | 5.03 |
| LOQ | 10s (µg/L) | 16.76 |
| Precision | RSD (%) [20 µg/L] n = 10 | 3.42 |
| Reference Sample | Certified Au Concentration (mg/L) | Found Au Concentration by the Proposed Method (mg/L) | Recovery (%) |
|---|---|---|---|
| Rocklabs CRM SE114 | 0.626 | 0.599 | 95.69 |
| OREAS CRM 61 f | 4.752 | 4.521 | 95.14 |
| OREAS CRM 231 | 0.504 | 0.486 | 96.43 |
| OREAS CRM 235 | 1.486 | 1.419 | 95.49 |
| Real Sample | Au Concentration (mg/L) |
|---|---|
| Mining Waste—1 | Below Detection Limit |
| Mining Waste—2 | 0.036 |
| Mining Waste—3 | 0.053 |
| Tailings Sample—1 | 0.437 |
| Tailings Sample—2 | 0.344 |
| Preconcentration Technique | Detection Instrument | Enhancement Factor | Limit of Detection (LOD) (ug/L) | Linear Range (µg/L) | Precision (RSD) (%) | Reference |
|---|---|---|---|---|---|---|
| DLLME | FAAS | 19.5 | 1.75 | 30–230 | 2.77 | [23] |
| SsLLME | FAAS | 51 | 1.5 | - | 4.20 | [24] |
| USAE–SFODME | FAAS | 34.8 | 0.45 | 1.5–400 | 1.68 | [21] |
| CPE | FAAS | 16 | 12.7 | 4–500 | 1.40 | [25] |
| IL–DLLME | FAAS | 23.7 | 0.13 | 0.9–400 | - | [26] |
| IL–DLLME | ETAAS | 50 | 0.0048 | 0.02–40 | 4.10 | [13] |
| IP–DLLME | FAAS | 40 | 1.8 | 8–100 | 3.20 | [27] |
| DLLME | ICP–OES | 149 | 0.09 | 0.3–100 | 6.00 | [28] |
| SFODME | FAAS | 42.6 | 5.03 | 20–450 | 3.42 | This work |
Disclaimer/Publisher’s Note: The statements, opinions and data contained in all publications are solely those of the individual author(s) and contributor(s) and not of MDPI and/or the editor(s). MDPI and/or the editor(s) disclaim responsibility for any injury to people or property resulting from any ideas, methods, instructions or products referred to in the content. |
© 2025 by the authors. Licensee MDPI, Basel, Switzerland. This article is an open access article distributed under the terms and conditions of the Creative Commons Attribution (CC BY) license (https://creativecommons.org/licenses/by/4.0/).
Share and Cite
Şakıyan Ateş, J.; Yıldız, B.; Durukan, İ. Preconcentration of Gold from Mining Waste Samples Using the Solidified Floating Organic Drop Microextraction and Determination by Flow Injection–Flame Atomic Absorption Spectrometry. Minerals 2025, 15, 60. https://doi.org/10.3390/min15010060
Şakıyan Ateş J, Yıldız B, Durukan İ. Preconcentration of Gold from Mining Waste Samples Using the Solidified Floating Organic Drop Microextraction and Determination by Flow Injection–Flame Atomic Absorption Spectrometry. Minerals. 2025; 15(1):60. https://doi.org/10.3390/min15010060
Chicago/Turabian StyleŞakıyan Ateş, Jale, Barış Yıldız, and İlknur Durukan. 2025. "Preconcentration of Gold from Mining Waste Samples Using the Solidified Floating Organic Drop Microextraction and Determination by Flow Injection–Flame Atomic Absorption Spectrometry" Minerals 15, no. 1: 60. https://doi.org/10.3390/min15010060
APA StyleŞakıyan Ateş, J., Yıldız, B., & Durukan, İ. (2025). Preconcentration of Gold from Mining Waste Samples Using the Solidified Floating Organic Drop Microextraction and Determination by Flow Injection–Flame Atomic Absorption Spectrometry. Minerals, 15(1), 60. https://doi.org/10.3390/min15010060