Article

The Study of Gold Mineralization at the Polymetallic Dapingzhang VMS-Type Copper–Gold Deposit, Yunnan Province, China

1
City College, Kunming University of Science and Technology, Kunming 650093, China
2
Faculty of Land Resources Engineering, Kunming University of Science and Technology, Kunming 650093, China
3
Yunnan Simao Shanshui Copper Co., Ltd., Puer 665000, China
*
Author to whom correspondence should be addressed.
Minerals 2025, 15(1), 54; https://doi.org/10.3390/min15010054
Submission received: 17 December 2024 / Revised: 27 December 2024 / Accepted: 29 December 2024 / Published: 7 January 2025
(This article belongs to the Section Mineral Deposits)

Abstract

:
The Dapingzhang Cu-polymetallic deposit in Yunnan is a volcanic massive sulfide (VMS) deposit, located on the western edge of the Lanping–Simao block. Recently, gold-rich polymetallic orebodies with significant economic value have been discovered. However, the occurrence and enrichment mechanisms of the gold remain unclear. This study investigates the massive sulfide orebodies (V1) through detailed geological surveys. Techniques such as optical microscopy, scanning electron microscopy (SEM), energy dispersive spectroscopy (EDS), and electron probe microanalysis (EPMA) were used to clarify the occurrence of gold, and to reveal the enrichment mechanisms. The genesis of the orebodies consists of three stages: (I) pyrite–quartz, (II) pyrite–chalcopyrite–sphalerite–galena–quartz, and (III) pyrite–chalcopyrite–sphalerite–galena–quartz–calcite. Gold precipitated during each of these mineralization stages, and it may be described as multiphase mineralization. Gold predominantly exists as invisible gold (≤0.1 μm), with minor visible gold as native gold and independent minerals (küstelite, electrum, calaverite). Invisible gold mainly occurs as gold microinclusions (Au+) in pyrite, chalcopyrite, and sphalerite. Combined with the previous research, comprehensive analysis determined that deep-circulating seawater, driven by a magmatic hydrothermal system, leaches and dissolves mineralizing materials from underlying volcanic rocks. The mineralizing fluid, mixed with magmatic fluid, migrates upward through volcanic conduits or is expelled to the seafloor. Changes in physicochemical conditions lead to the co-precipitation of gold and sulfides, forming a mineralization structure with lower channel facies and upper eruptive facies.

1. Introduction

Gold in major deposits, such as volcanogenic massive sulfide (VMS) deposits and orogenic deposits, occurs in various forms. These forms include inclusion gold and gold nanoparticles. And, Carlin-type gold deposits are known for containing invisible gold (gold inclusions and gold nanoparticulate). Gold can substitute into mineral lattices or adsorb onto surfaces through electrochemical processes. Most sulfides are Au-bearing minerals [1,2,3]. VMS deposits are a significant global source of copper, lead, zinc, and other metals [4,5,6]. The associated gold reserves account for approximately 5% of the world’s annual gold production [7,8]. However, research on the occurrence and enrichment mechanisms of gold in these deposits is limited [9,10].
The Dapingzhang copper–polymetallic deposit, located in the Paleozoic volcanic arc belt on the western margin of the Lanping–Simao block in Yunnan, is the only known VMS-type copper–gold polymetallic deposit from the pre-Tethys period in the Yunnan section of the Sanjiang metallogenic belt [9,10,11,12]. The deposit consists of layer-like, laminated, or lens-shaped ores within Paleozoic marine volcanic–sedimentary rock. Proven reserves include 470,000 tons of copper, 270,000 tons of zinc, and approximately 8 tons of gold, classifying it as a large-scale deposit [13,14,15]. Recently, new gold-rich massive sulfide copper orebodies were discovered in the area, with gold grades reaching up to 100 g/t [15]. However, the specific occurrence of gold and the enrichment mechanisms remain unclear.
This study focuses on the V1 gold-rich orebodies at Dapingzhang. Detailed field surveys and petrographic observations were conducted, followed by electron probe point and mapping analysis of pyrite, chalcopyrite, and sphalerite at various stages. This helped determine the occurrence of gold and investigate potential enrichment mechanisms. The results provide a case study for understanding precious metal mineralization in VMS-type deposits and may improve exploration efficiency and resource utilization.

2. Geological Setting

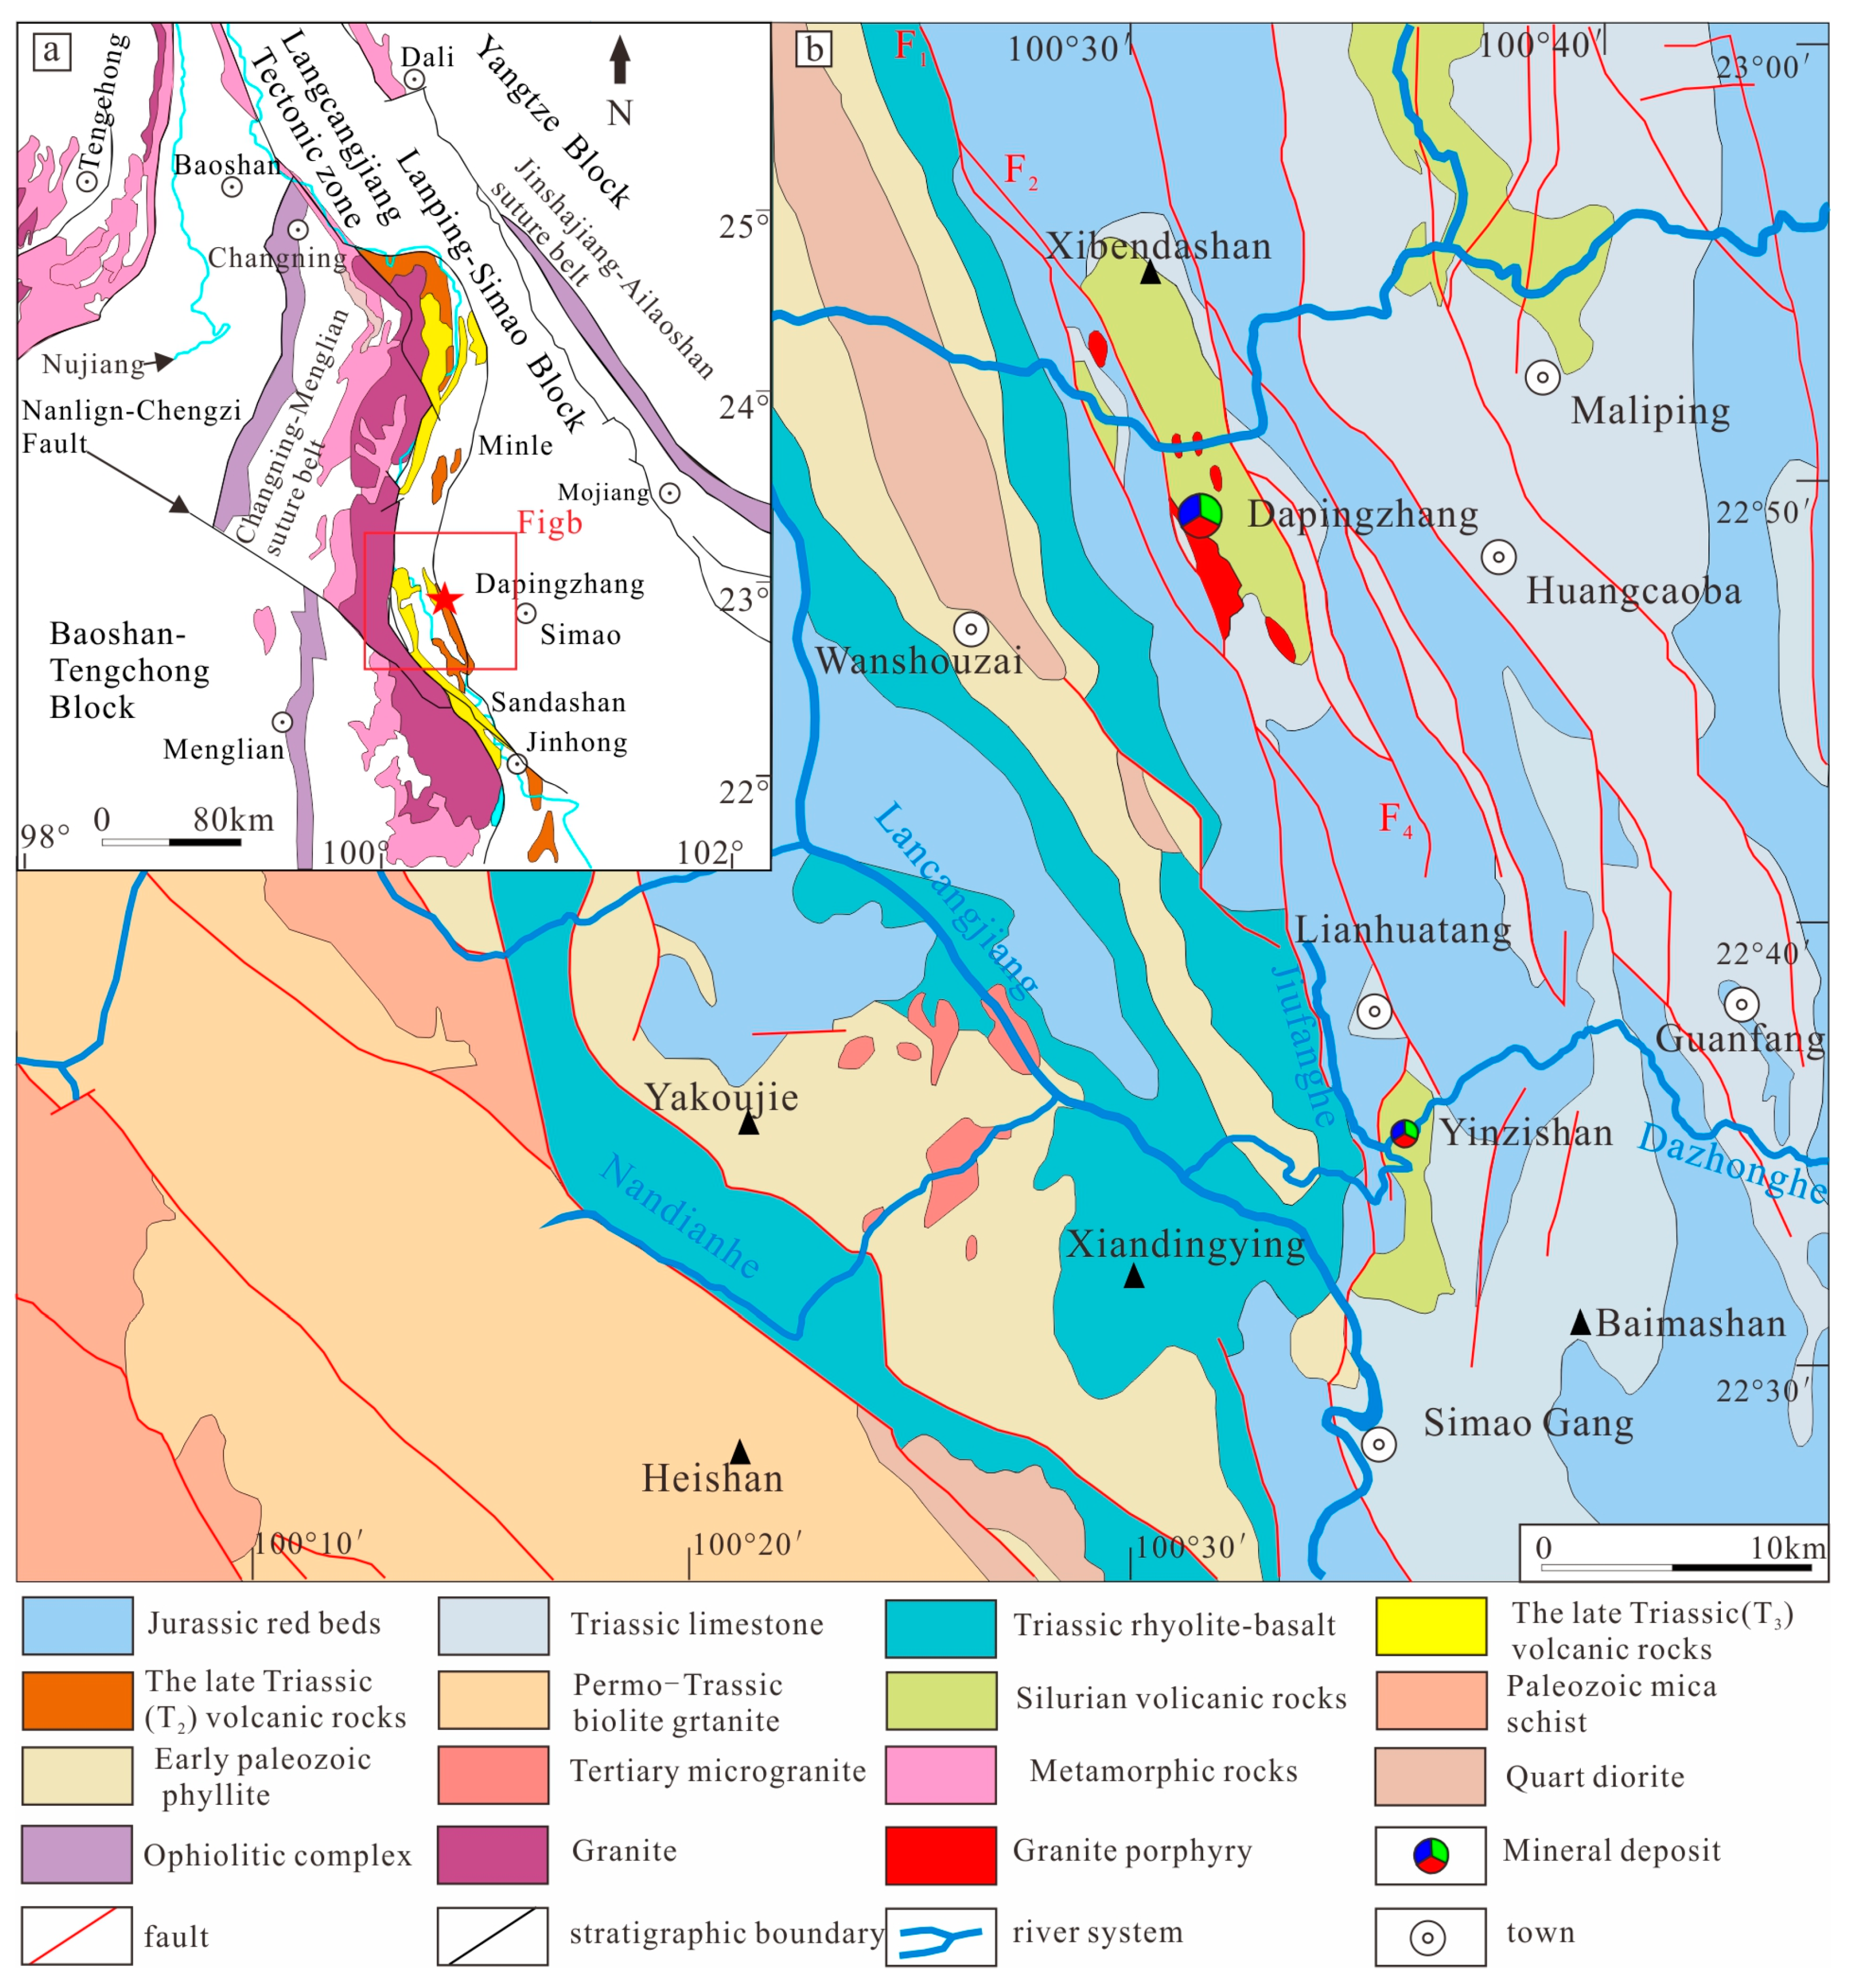
2.1. Regional Geology

The Dapingzhang copper–gold polymetallic deposit is located on the western edge of the Paleozoic volcanic belt in the Lanping–Simao block, within the southern section of the Lancangjiang fault and the Jinggu–Jinghong volcanic arc polymetallic belt (Figure 1a). The region mainly exposes Silurian, Permian, and Triassic strata. The regional structure is dominated by NW, SN, NE, and EW trending faults. The NNW-trending Jiufang fault (F1) and Lizishu fault (F4) divide the mining area into three blocks: east, central, and west (Figure 1b). The region shows prominent magmatic activity, with volcanic events mainly occurring during the Late Paleozoic and Mesozoic. The region hosts widespread intermediate-acidic volcanic rocks and mafic intrusions, strongly influenced by regional tectonics. This deposit is believed to result from post-arc rifting volcanic eruption sedimentary mineralization, linked to the eastward subduction of the Lancangjiang oceanic crust [10,16].

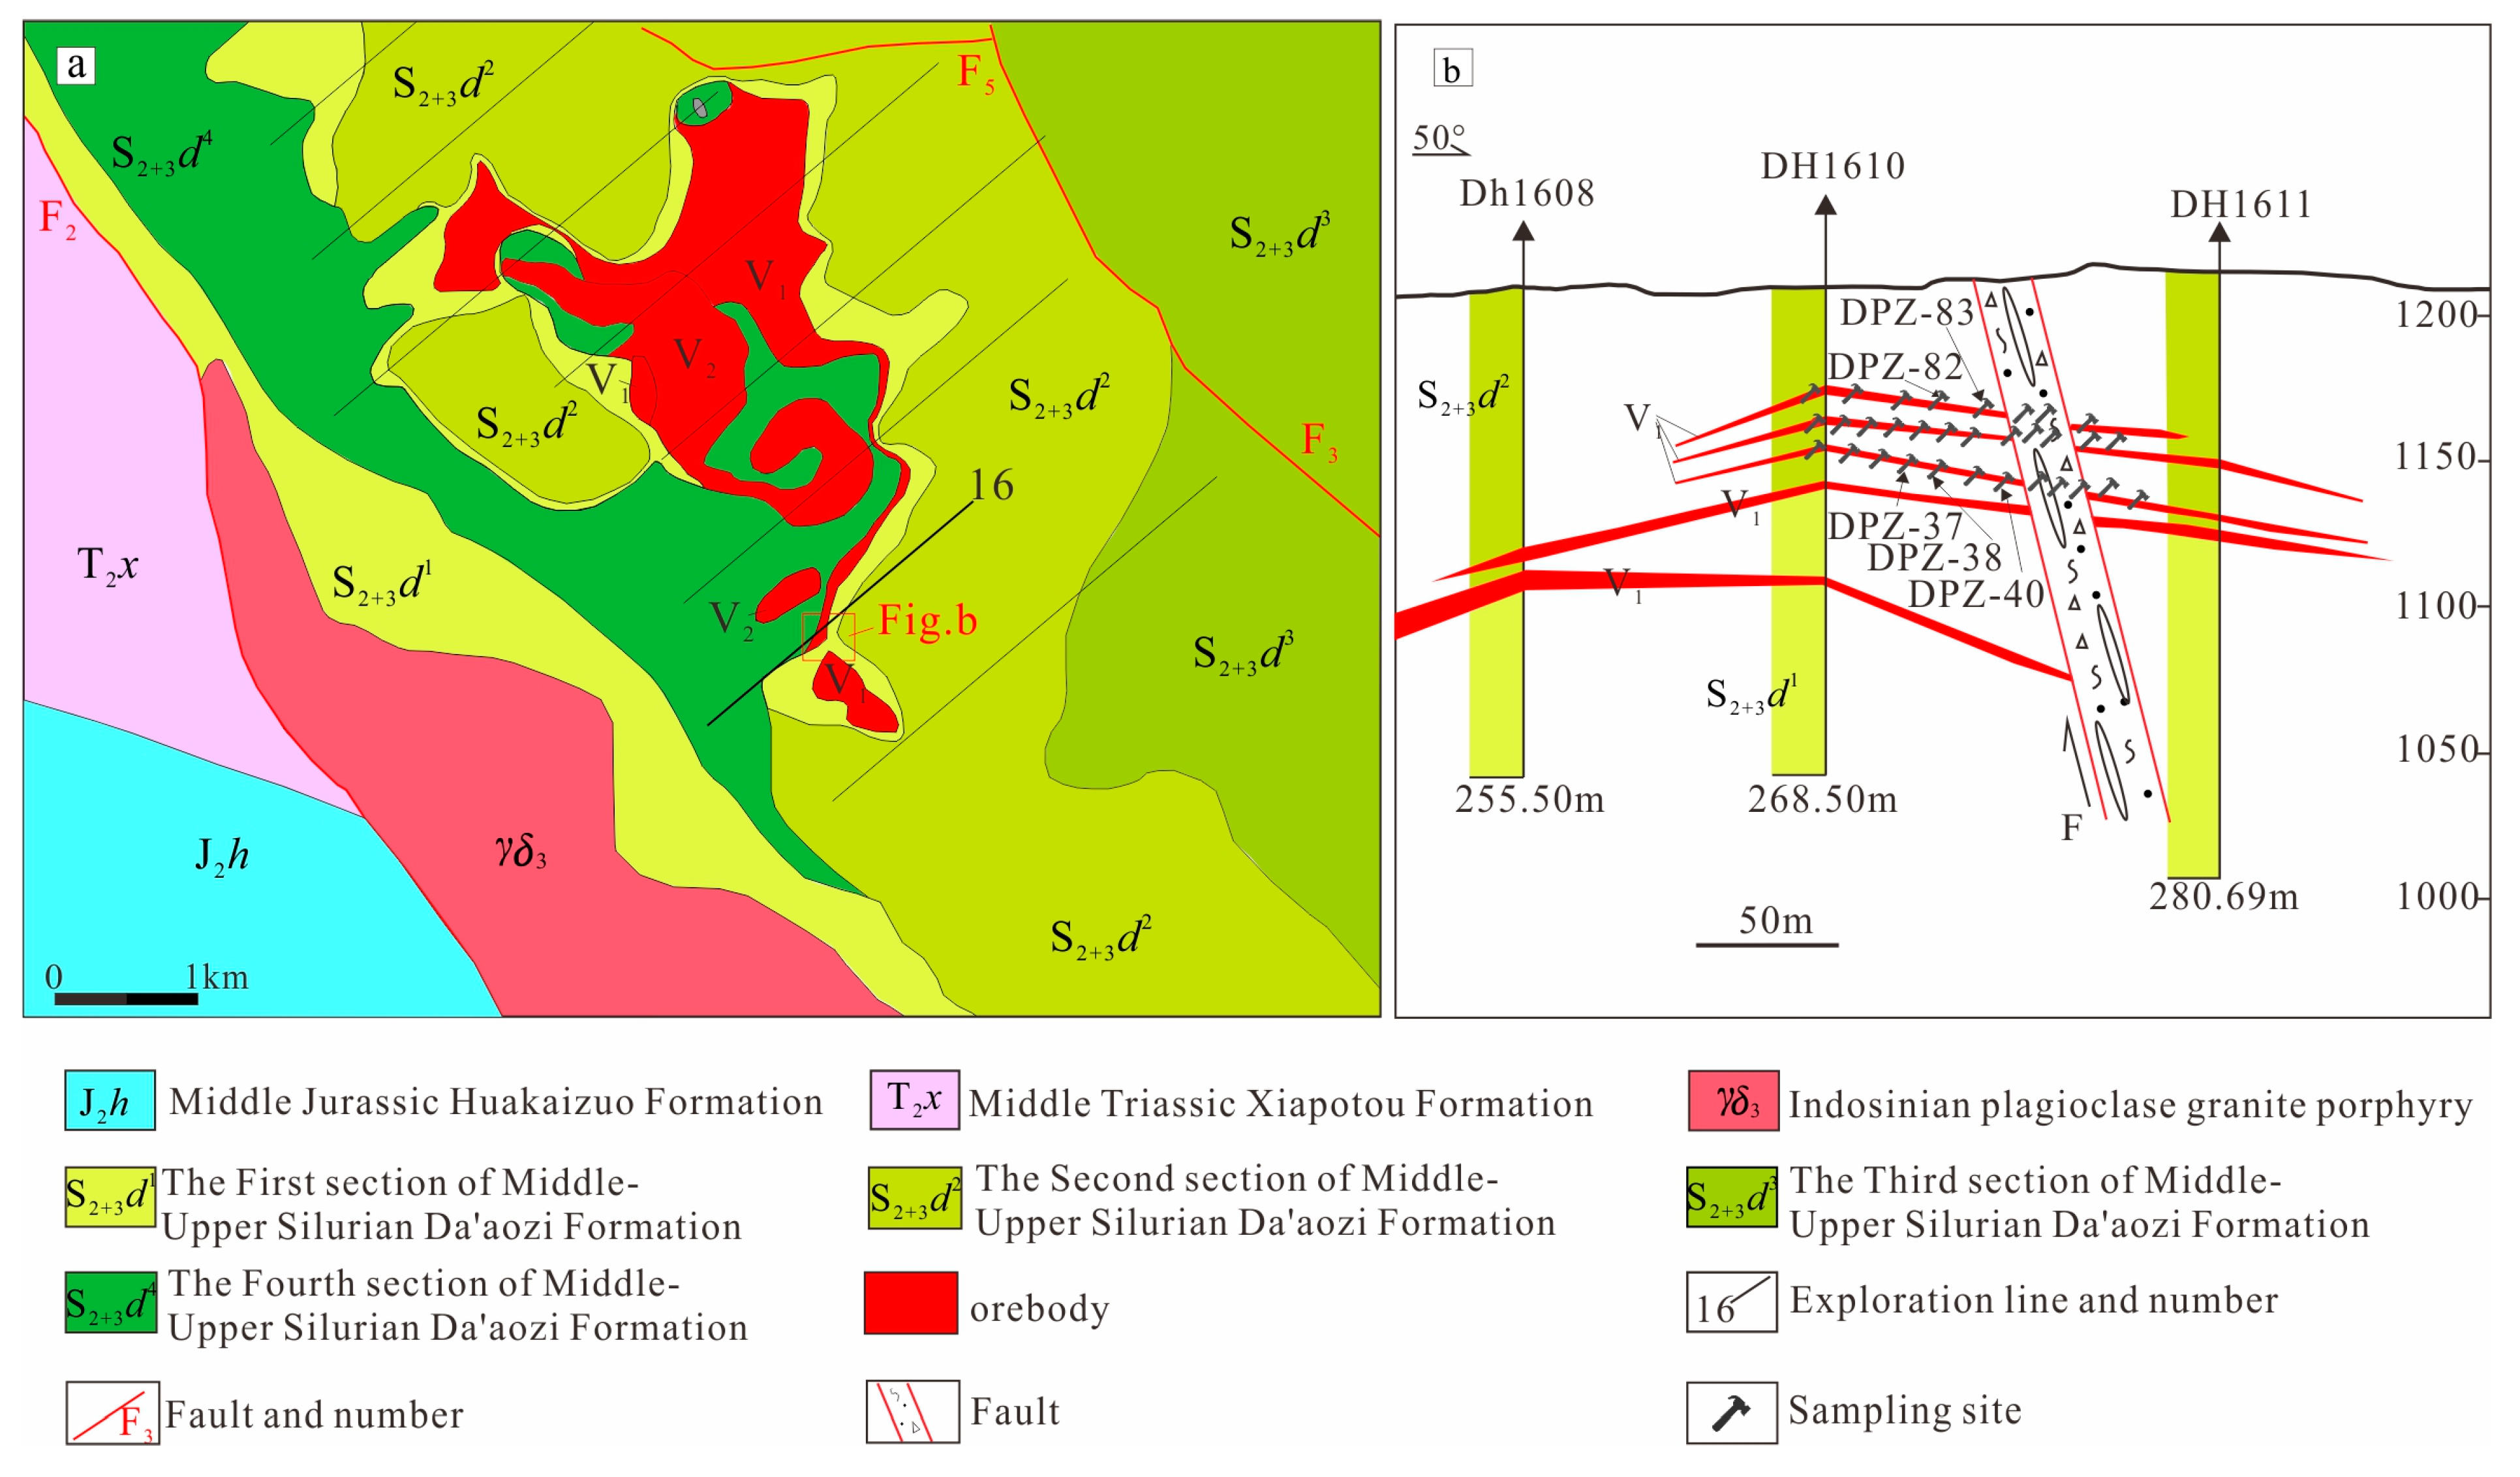
2.2. Deposit Geology

The main outcrop in the mining area includes the Daaozi Formation (S2+3d), as well as the Xiapotou Formation (T2x), Dashuijing Formation (T2d), Choushui Formation (T2c) and Huakaizuo Formation (J2h). The Daaozi Formation is a significant ore-bearing volcanic sequence, divided into four sections (Figure 2), listed from bottom to top: Section 1 (S2+3d1) consists of light gray to off-white quartz porphyry intercalated with light green fine tuff, topped by volcanic breccia, which represents the main ore-bearing horizon; Section 2 (S2+3d2) is composed of light gray to gray-green andesite, over 300 m thick, with common features such as corrosion structures, porosity, and almond-shaped textures. This section transitions into the ore-bearing horizon; Section 3 (S2+3d3) includes light gray rhyolite porphyry, fine tuff, gray-green volcanic breccia, and tuff, with a thickness of 500–520 m; Section 4 (S2+3d4) is composed of purple-gray porphyry, gray-green to yellow-gray volcanic breccia, and tuffaceous mudstone, with a thickness exceeding 500 m. The Xiapotou Formation (T2x) consists of interbedded gray-purple and gray-green lithic sandstone, siltstone, mudstone, and limestone, with a gravel bed at the base, ranging from 113 to 374 m thick. The Dashuijing Formation (T2d) is a shallow marine carbonate sequence, with a thickness ranging from 472 to 893 m. The Choushui Formation (T2c) consists of a shallow marine mixture of mudstone and carbonate rock, with a thickness ranging from 75.5 to 706.3 m. The Huakaizuo Formation (J2h) consists of red clastic rocks formed by marine-continental interaction, with a thickness ranging from 887 to 1465 m.
The main structural feature in the Dapingzhang area is a NNW-trending fault. The Jiufang Fault (F1), Baishajing Fault (F2), Dapingzhang Fault (F3), and Caichang Fault (F5) significantly influence the distribution of the orebodies. Faults F2 and F3 are branches of Fault F1, whereas Fault F5 trends NW and cuts vertically through the orebody, showing compressional deformation features. On the western side of the mining area, along the Baishajing Fault (F2), granite–diorite porphyry bodies are exposed. These intrude as plugs or dykes into the Daeozi Formation (S2+3d) volcanic rocks. Zircon LA-ICP-MS U–Pb dating yielded an age of 401.0 ± 1.7 Ma [17], corresponding to the Late Caledonian/Early Devonian.

2.3. Orebody

The Dapingzhang copper–gold polymetallic deposit contains 89 orebodies, which are layered, nearly layered, or lens-shaped. These orebodies extend northwest and have an average thickness of 0.3 to 65 m (Figure 2b). Based on mineralogical and stratigraphic studies, the orebodies are classified into two types: the upper massive sulfide orebodies (V1) and the lower fine vein-disseminated orebodies (V2). The V1 orebodies primarily consists of pyrite, sphalerite, chalcopyrite, and a small amount of galena, with massive, dense disseminated, and sparsely disseminated textures (Figure 3a–c). Pyrite occurs mainly as subhedral to euhedral crystals, with a grain size less than 0.5 mm (Figure 3d). Its fractures and voids are filled with chalcopyrite (Figure 4a,b,d,i). A small amount of pyrite and chalcopyrite also fill fine quartz veinlets (Figure 3i). Chalcopyrite typically occurs as anhedral crystals, with a grain size smaller than 0.1 mm. It often encloses pyrite and sphalerite (Figure 3d,f and Figure 4i), and may appear as immiscibility droplets within sphalerite (Figure 3e,f). Sphalerite typically occurs as anhedral crystals with a grain size smaller than 0.2 mm and forms co-genetic boundary structures with galena. Sphalerite typically occurs as anhedral crystals with a grain size smaller than 0.2 mm, forming co-genetic boundary structures with galena (Figure 3h). Galena is relatively scarce (Figure 3i), with a grain size of 0.1 to 0.5 mm. It is often found with sphalerite or filling sphalerite fractures.
In the V2 orebodies, the mineralization predominantly exhibits granular, inclusion, and replacement structures. Their composition is relatively simple, consisting mainly of pyrite and chalcopyrite. Compared to the V1, the pyrite content in V2 is lower. Pyrite occurs in various forms and coexists with chalcopyrite in the V2 orebodies. Chalcopyrite forms masses and irregular grains within pyrite and quartz fractures.

3. Sampling and Analytical Methods

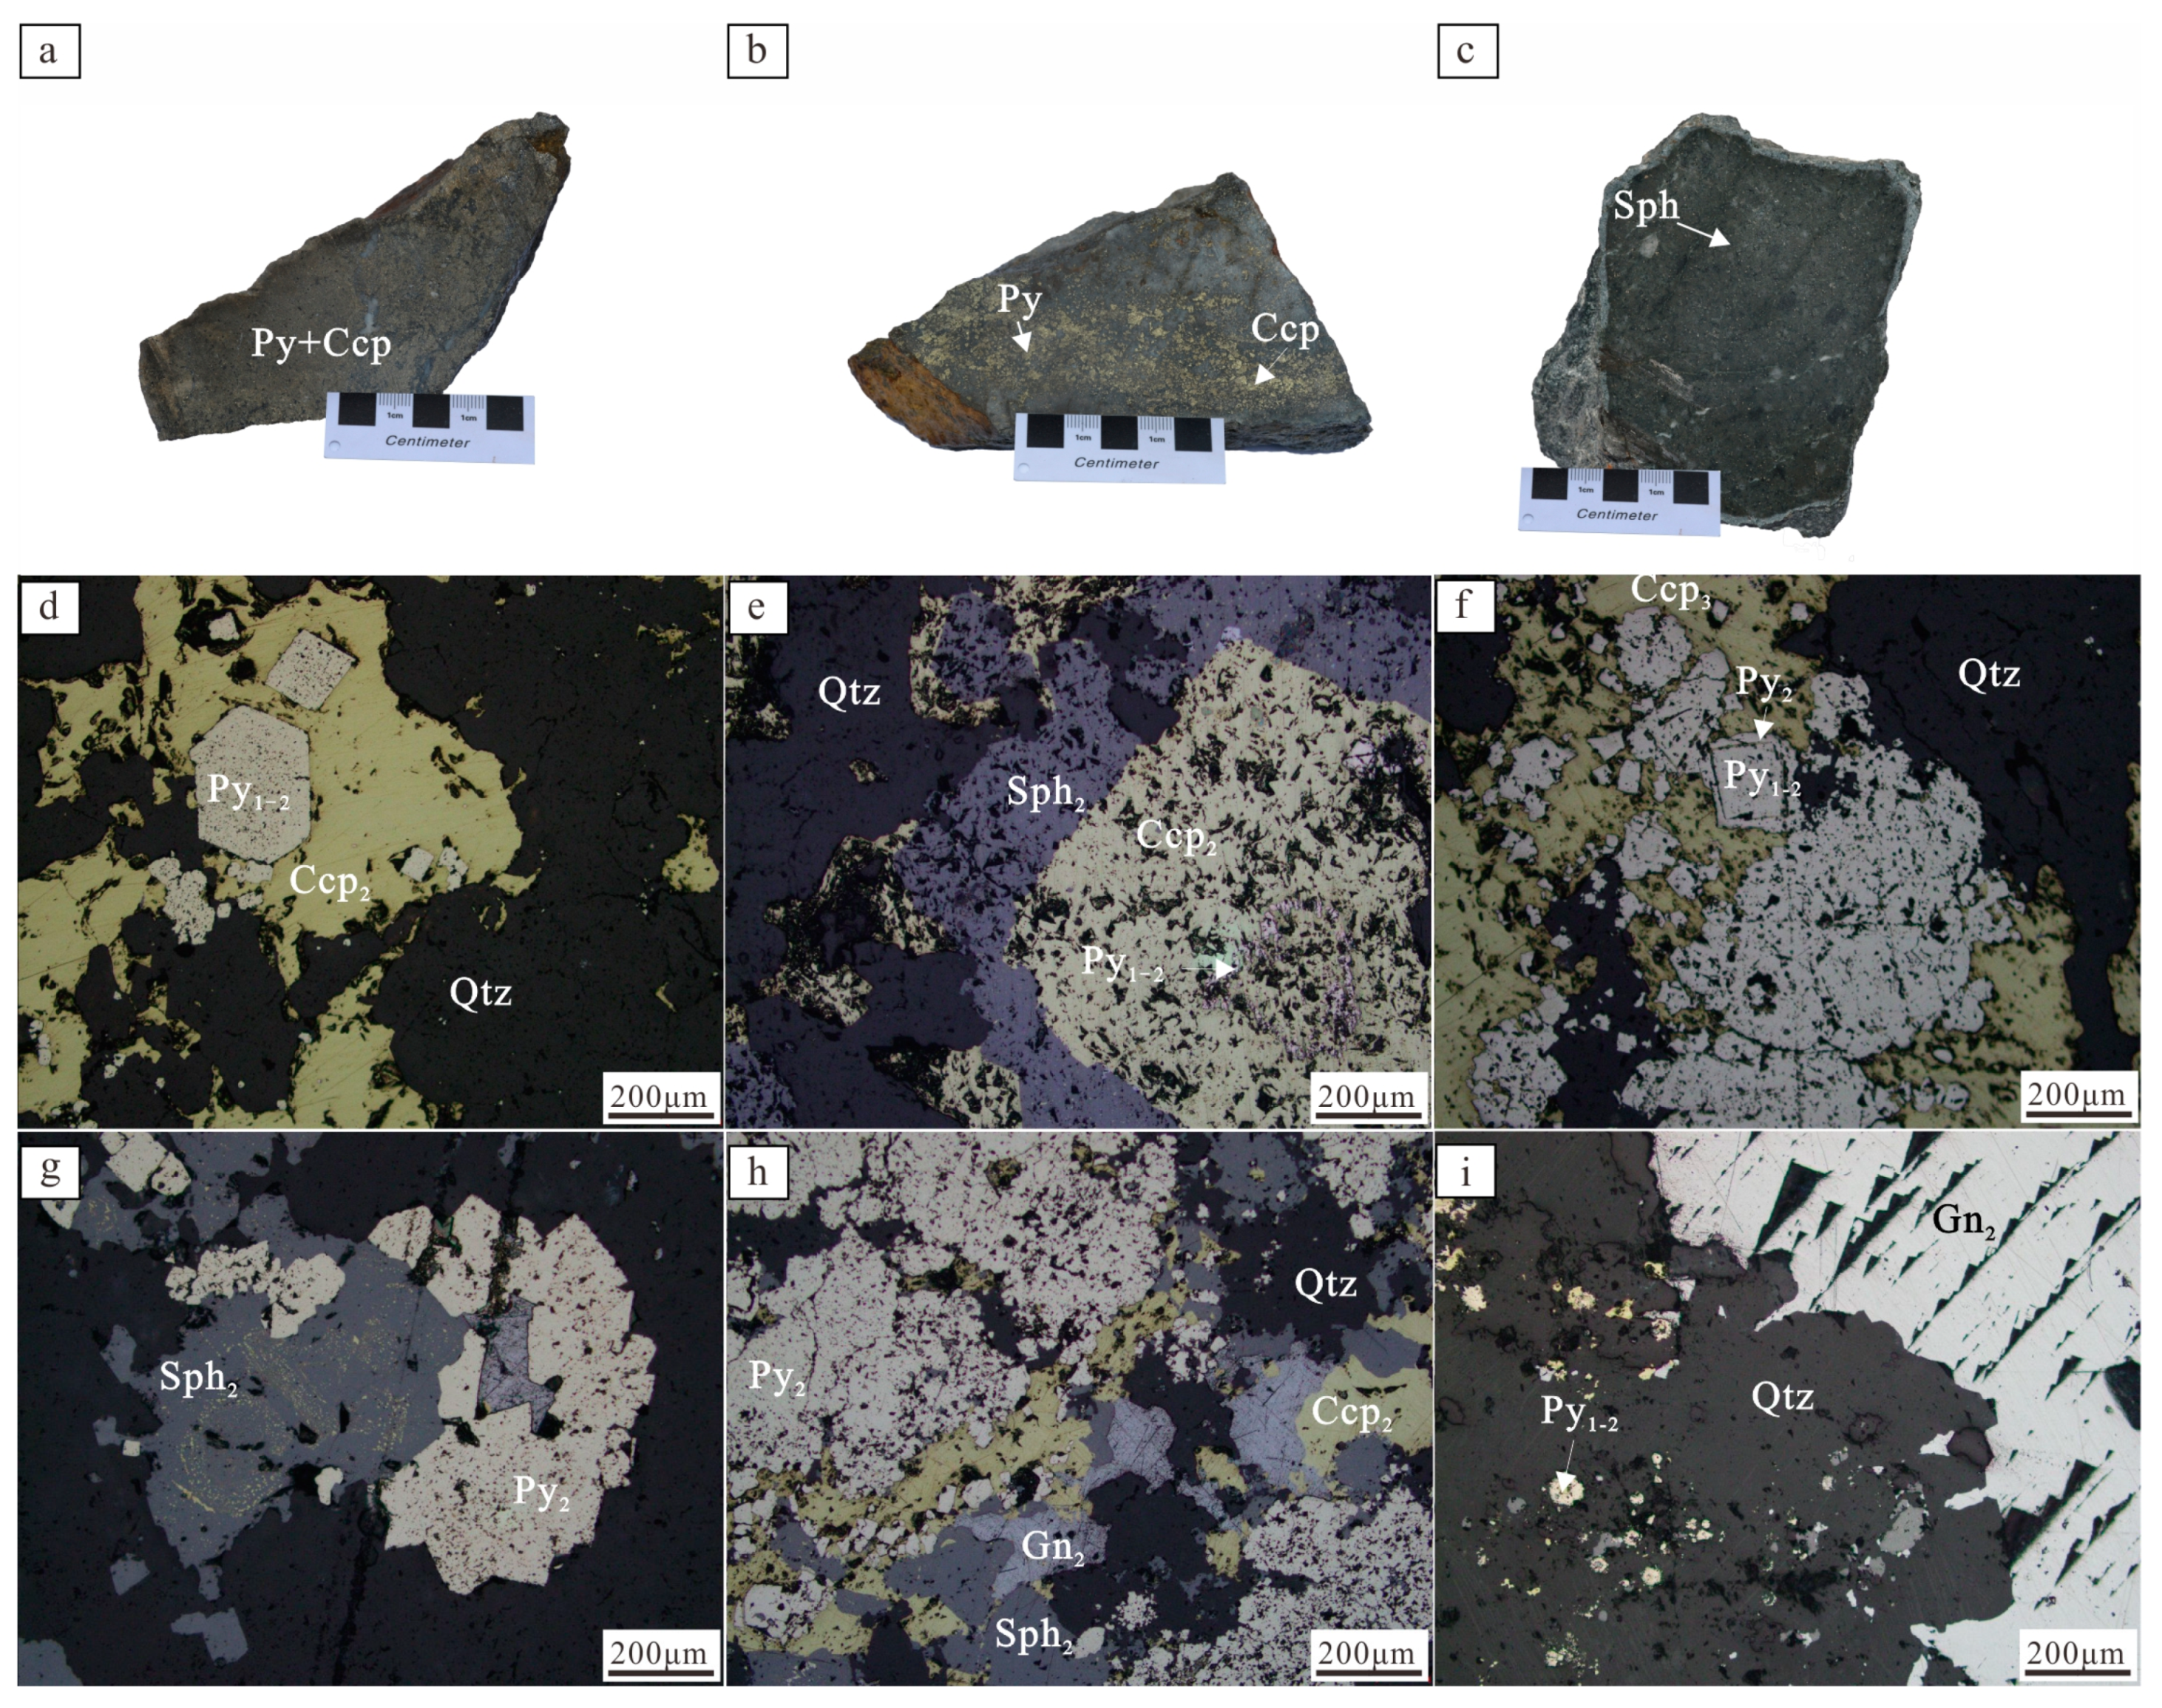
3.1. Mineralogy and Microstructure

The samples were collected from three sulfide ore veins at different elevations along the same profile, totaling 87 samples (Figure 2b). Given the low gold content in the fine vein-impregnated ores, the study focused on the petrographic and geochemical analysis of massive sulfide ores. The samples were prepared as thin sections and probe mounts for petrographic observation under an optical microscope, followed by experimental testing and analysis. After carbon coating, the samples were analyzed with a combined scanning electron microscope and energy dispersive spectrometer (ESEM/EDS). Detailed observations and image acquisition were performed with a Thermo Scientific Apreo 2S field emission scanning electron microscope (Thermo Fisher Scientific, Waltham, MA, USA) and a Bruker XFlash 6I30 energy dispersive spectrometer (Bruker, Billerica, MA, USA). The SEM acceleration voltage ranged from 0.5 to 30 kV, and magnification ranged from 50× to 800,000×. Petrographic identification and scanning electron microscopy were conducted at the National Key Laboratory of Kunming University of Science and Technology.

3.2. In Situ Main and Trace Element Analysis of Minerals

The main elements and trace amounts of sulfides were quantitatively analyzed in situ using an electron probe microanalyzer at Wuhan Sample Solution Analytical Technology Co., Ltd., Wuhan, China. The analysis was performed using the JEOL JXA-8230 (JEOL, Tokyo, Japan), with a voltage of 20 kV and a current of 10 × 10−8 nA. The peak analysis time for Au is 30 s, and the background analysis time is 15 s. The calibration standards for the main elements included 53 mineral standards, 44 element standards, and 15 rare earth element standards provided by SPI. The data correction method used was JEOL’s ZAF correction method. EPMA detection limits for elements: As (278 ppm), Fe (108 ppm), S (57 ppm), Au (296 ppm), Cu (160 ppm), Zn (181 ppm), Ag (202 ppm), Co (113 ppm), Ni (134 ppm), Pb (292 ppm), Cd (191 ppm), In (213 ppm), Te (199 ppm), Bi (286 ppm).

4. Results

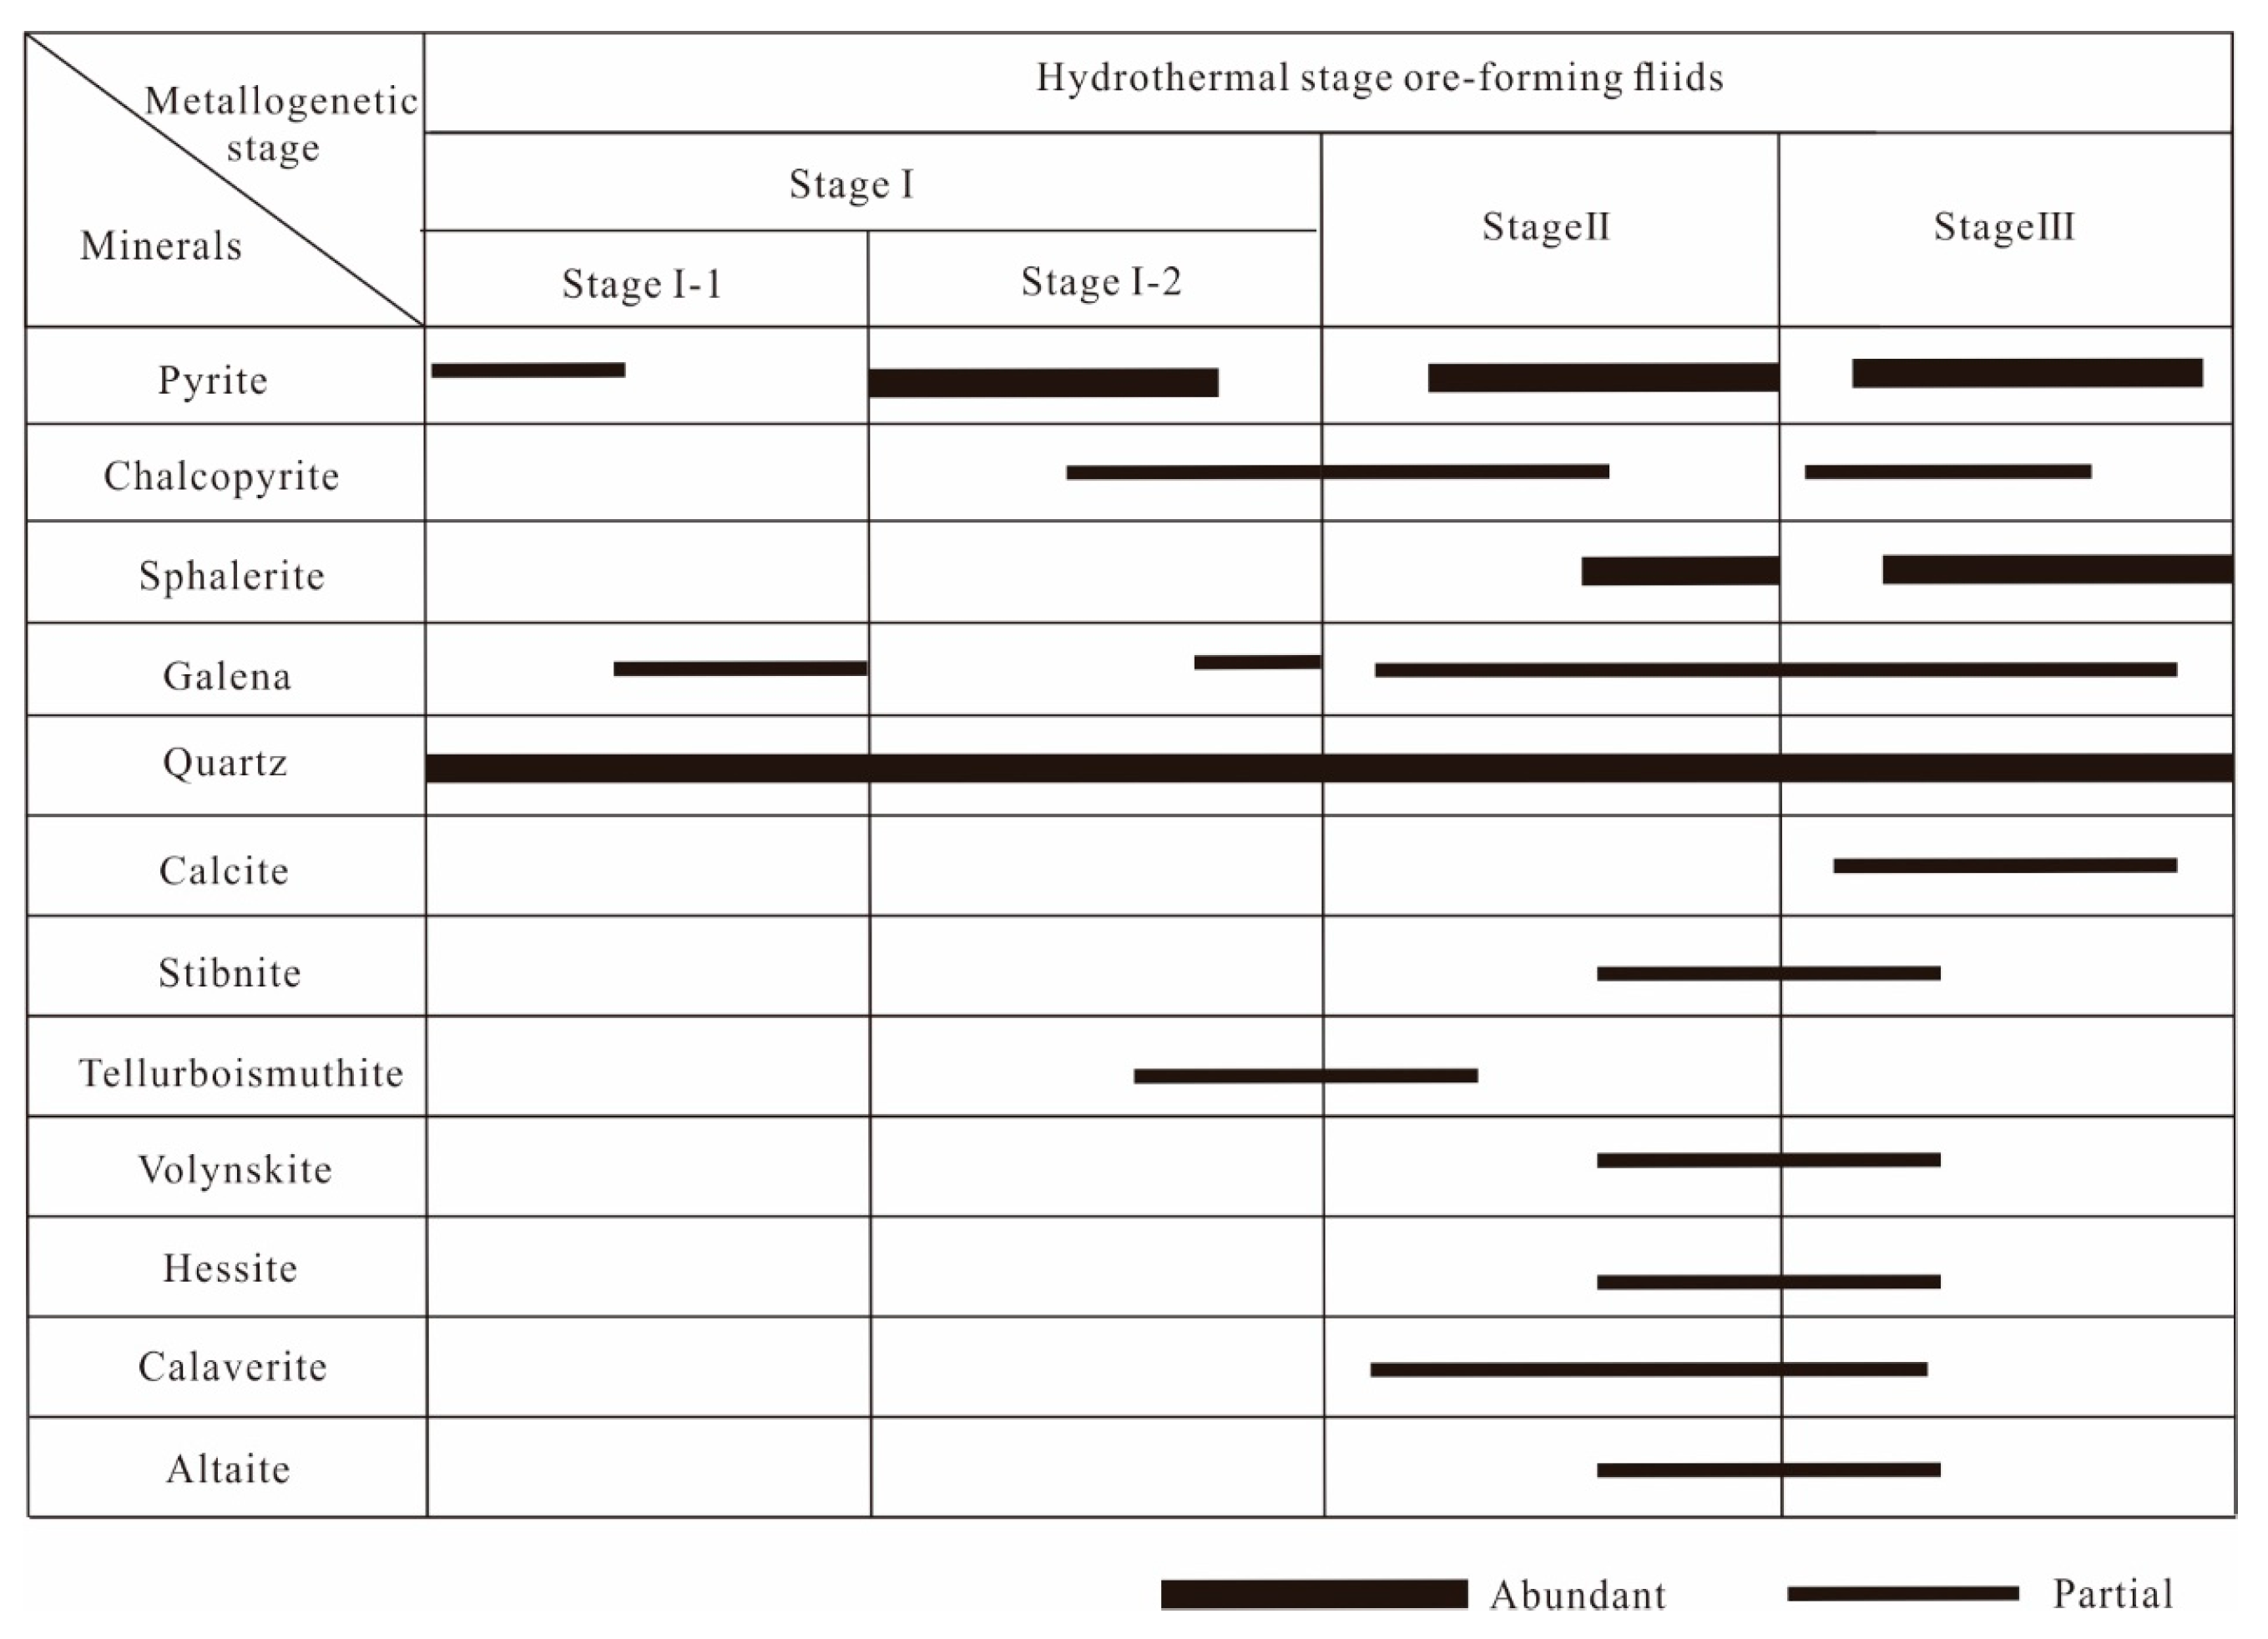
4.1. Mineral Microstructure and Sequence
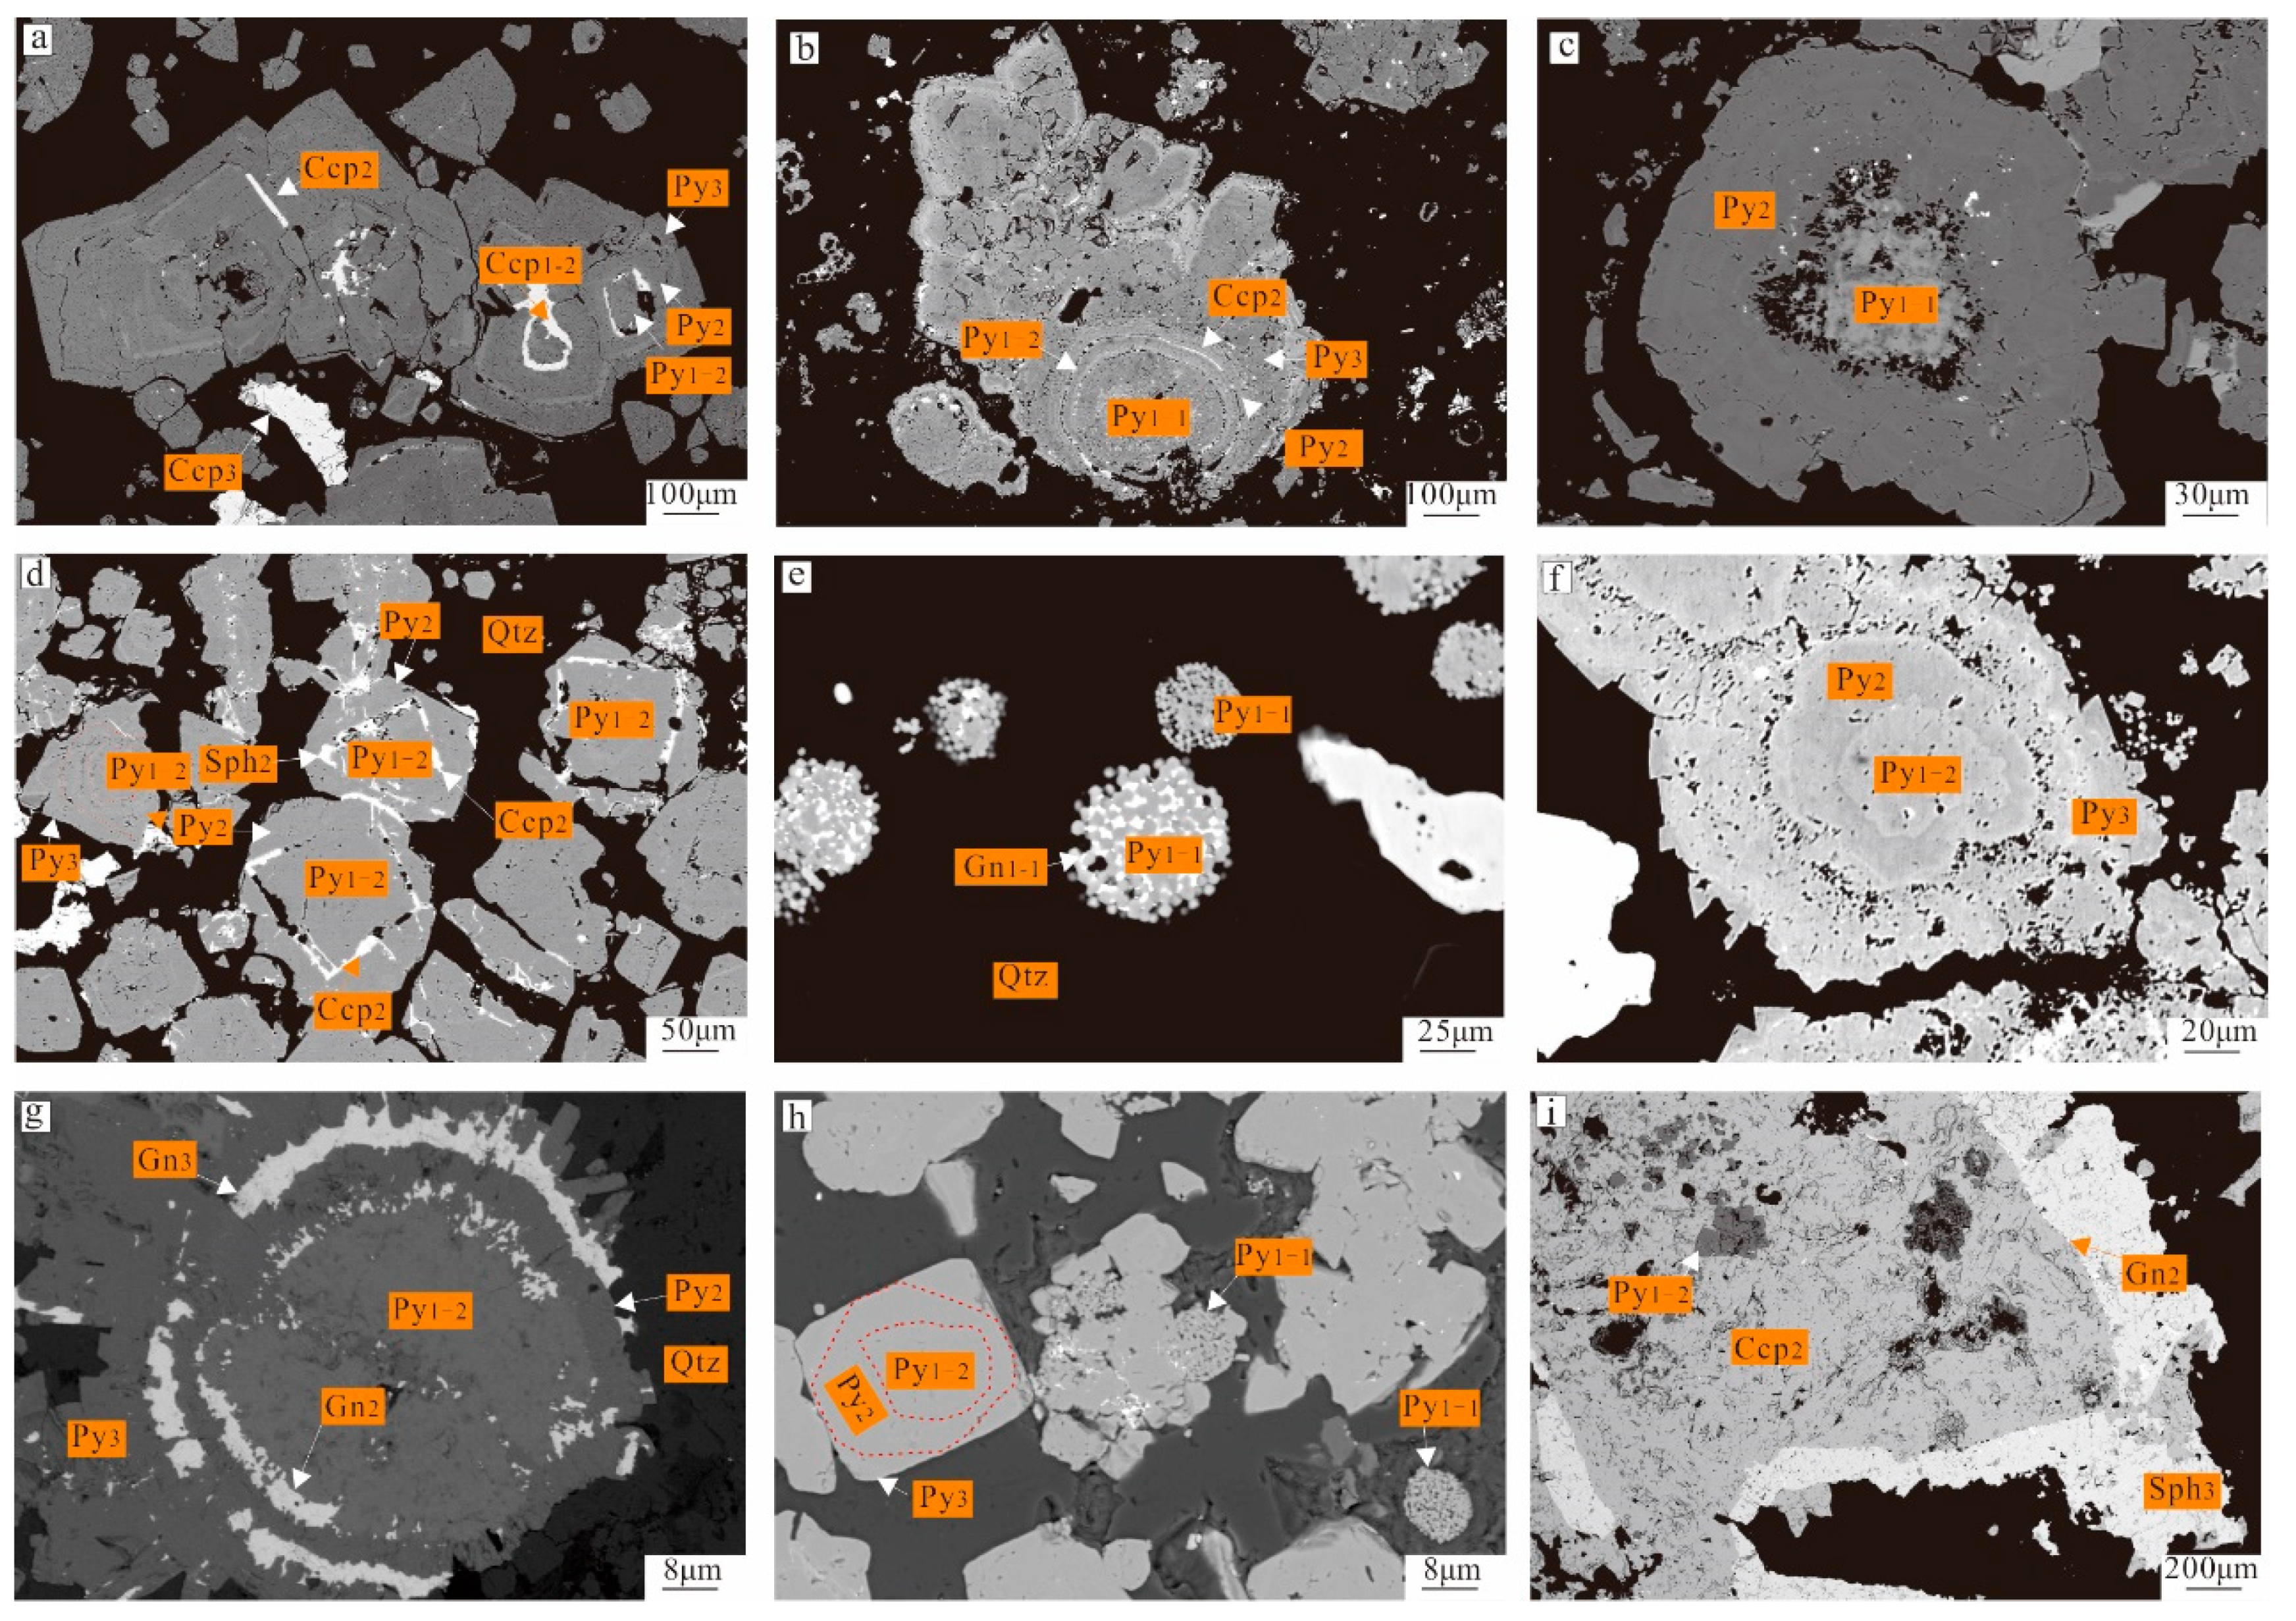
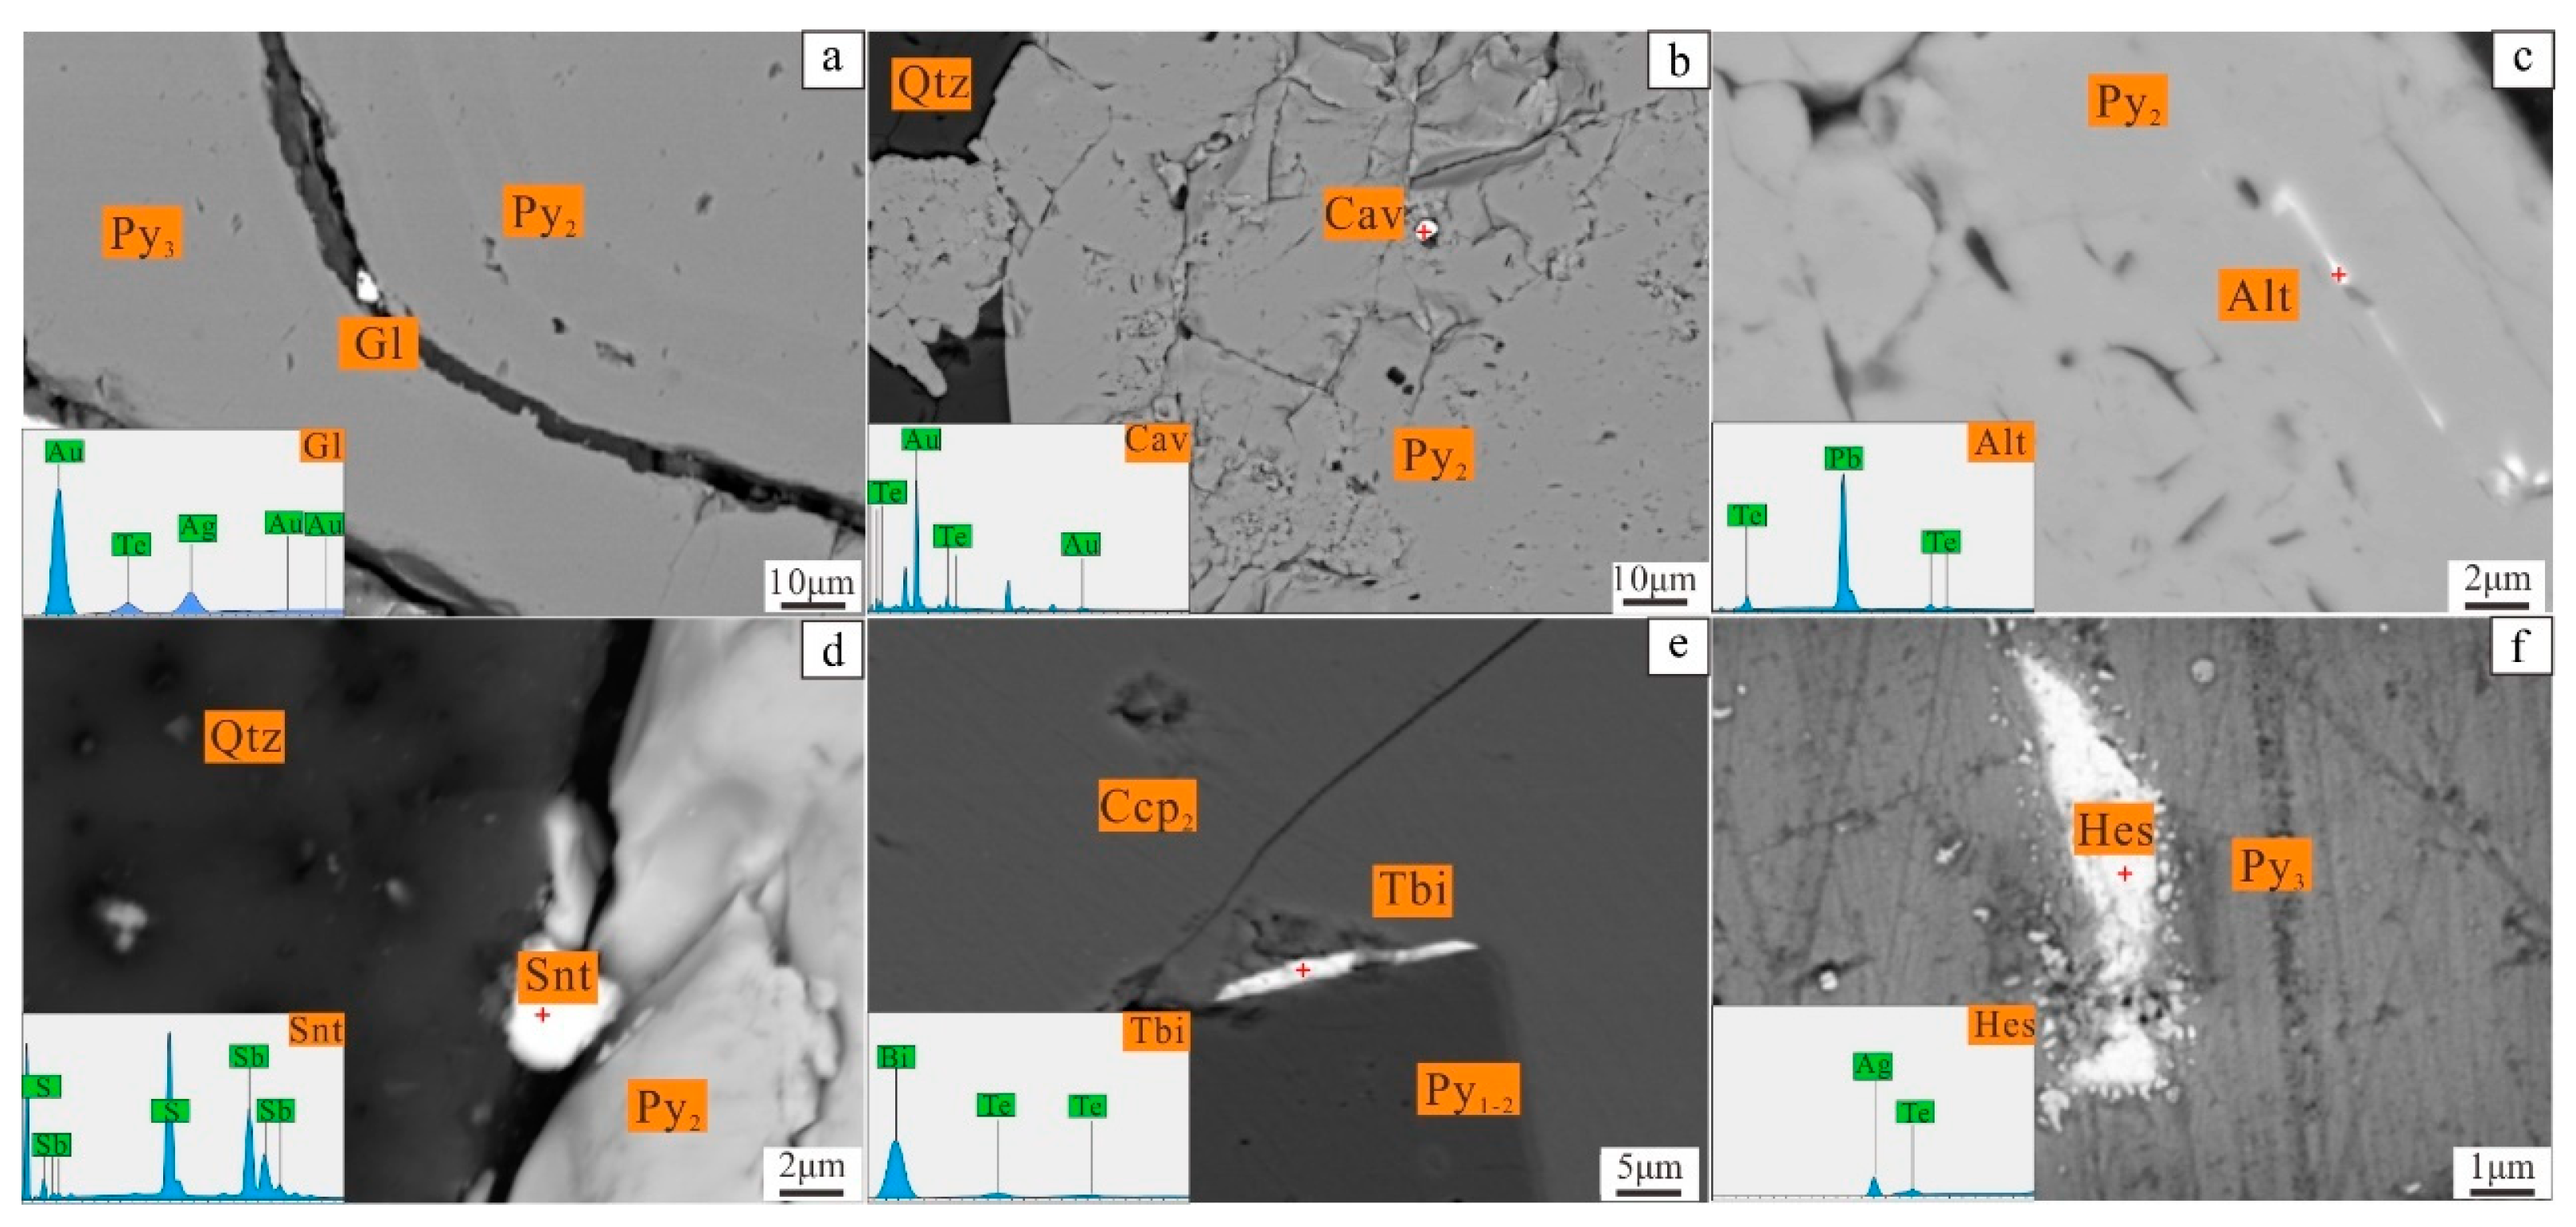
The ore minerals of the Dapingzhang copper–gold polymetallic deposit include pyrite, chalcopyrite, galena, and sphalerite. The gangue minerals primarily consist of quartz, with minor calcite. The secondary minerals are goethite, hematite, azurite, chalcocite, and malachite. The formation of metal sulfides in this gold-rich deposit is divided into four stages, based on ore structure, mineral intergrowths, and replacement relationships. These stages include four generations of pyrite (Py1-1, Py1-2, Py2, Py3), three generations of chalcopyrite (Ccp1-2, Ccp2, Ccp3), two generations of sphalerite (Sph2, Sph3), and multiple generations of galena (Figure 4 and Figure 5). Chalcopyrite, pyrite, and sphalerite are the primary gold-bearing minerals.
Py1-1 typically forms a boiling-like shape with well-preserved morphology and particle sizes ranging from 0.5 to 2 μm. Some boiling-shaped pyrite particles are cemented by later-stage Pb-bearing hydrothermal fluids (Figure 4b,c,e), though they rarely form the core of zoned pyrite. Py1-2 also shows a boiling-like structure, but most particles aggregate into other forms without cementation by galena (Figure 4d,f,h), usually presenting as euhedral or aneuhedral structures, and often occurring as the core of rim–core structures (Figure 4d,h), with localized occurrence of boiling structures (Figure 4f). Locally, it is enveloped by chalcopyrite, forming inclusion structures (Figure 4a,i), and often serves as the core of zoned pyrite. Py2 typically grows along the edge of Py1-2, retaining similar crystal forms (Figure 4d,f,h), and along the edge of Py1-1 (Figure 4b,c). Locally, Py1-2 can enclose galena (Gn2), forming inclusion structures (Figure 4g) and serving as a transitional zone in zoned pyrite. Py3 mainly grows along the edge of Py2 (Figure 4a,b,d,f), forming the outermost ring of zoned pyrite. Py3 commonly encapsulates Ccp2 (Figure 4a,b,d,f), and locally, galena (Gn3) is also enclosed by Py3 (Figure 4g). Pyrite with multi-stage zoned structures often exhibits corroded edges.
Chalcopyrite and sphalerite are important gold-bearing minerals in the deposit, often occurring in symbiosis with pyrite. Ccp1-2 and Ccp2 are replaced and enclosed by Py2 and Py3, while a significant amount of Ccp3 occurs independently, likely from the same mineralization stage as Py3. Sph3, which replaces and encloses Ccp2, is also observed as a gold-bearing mineral.

4.2. Result of BSE

Backscattered electron (BSE) imaging, coupled with energy-dispersive spectroscopy (EDS), identifies küstelite, calaverite, and petzite (Figure 6). Küstelite forms subhedral to anhedral crystals in the fractures and pores of chalcopyrite and pyrite (Figure 6a), with grain sizes between 1 and 10 μm. Calaverite forms droplet-shaped fillings in pyrite pores (Figure 6b), with grain sizes between 1 and 5 μm. These gold minerals are associated with hessite, altaite, tellurobismuthite, and stibnite. Hessite is commonly found in the pores, fractures, and grain boundaries of pyrite and chalcopyrite, with grain sizes ranging from 0.5 to 10 μm (Figure 6f). Altaite occurs in pyrite fractures (Figure 6c) or is enclosed within pyrite, with grain sizes between 0.5 and 10 μm. Tellurobismuthite forms anhedral grains at the boundaries, fractures, or pores of chalcopyrite, with grain sizes of approximately 3 μm. Stibnite forms anhedral crystals in pyrite fractures or between chalcopyrite and pyrite grains, with grain sizes between 2 and 15 μm.

4.3. Result of EPMA

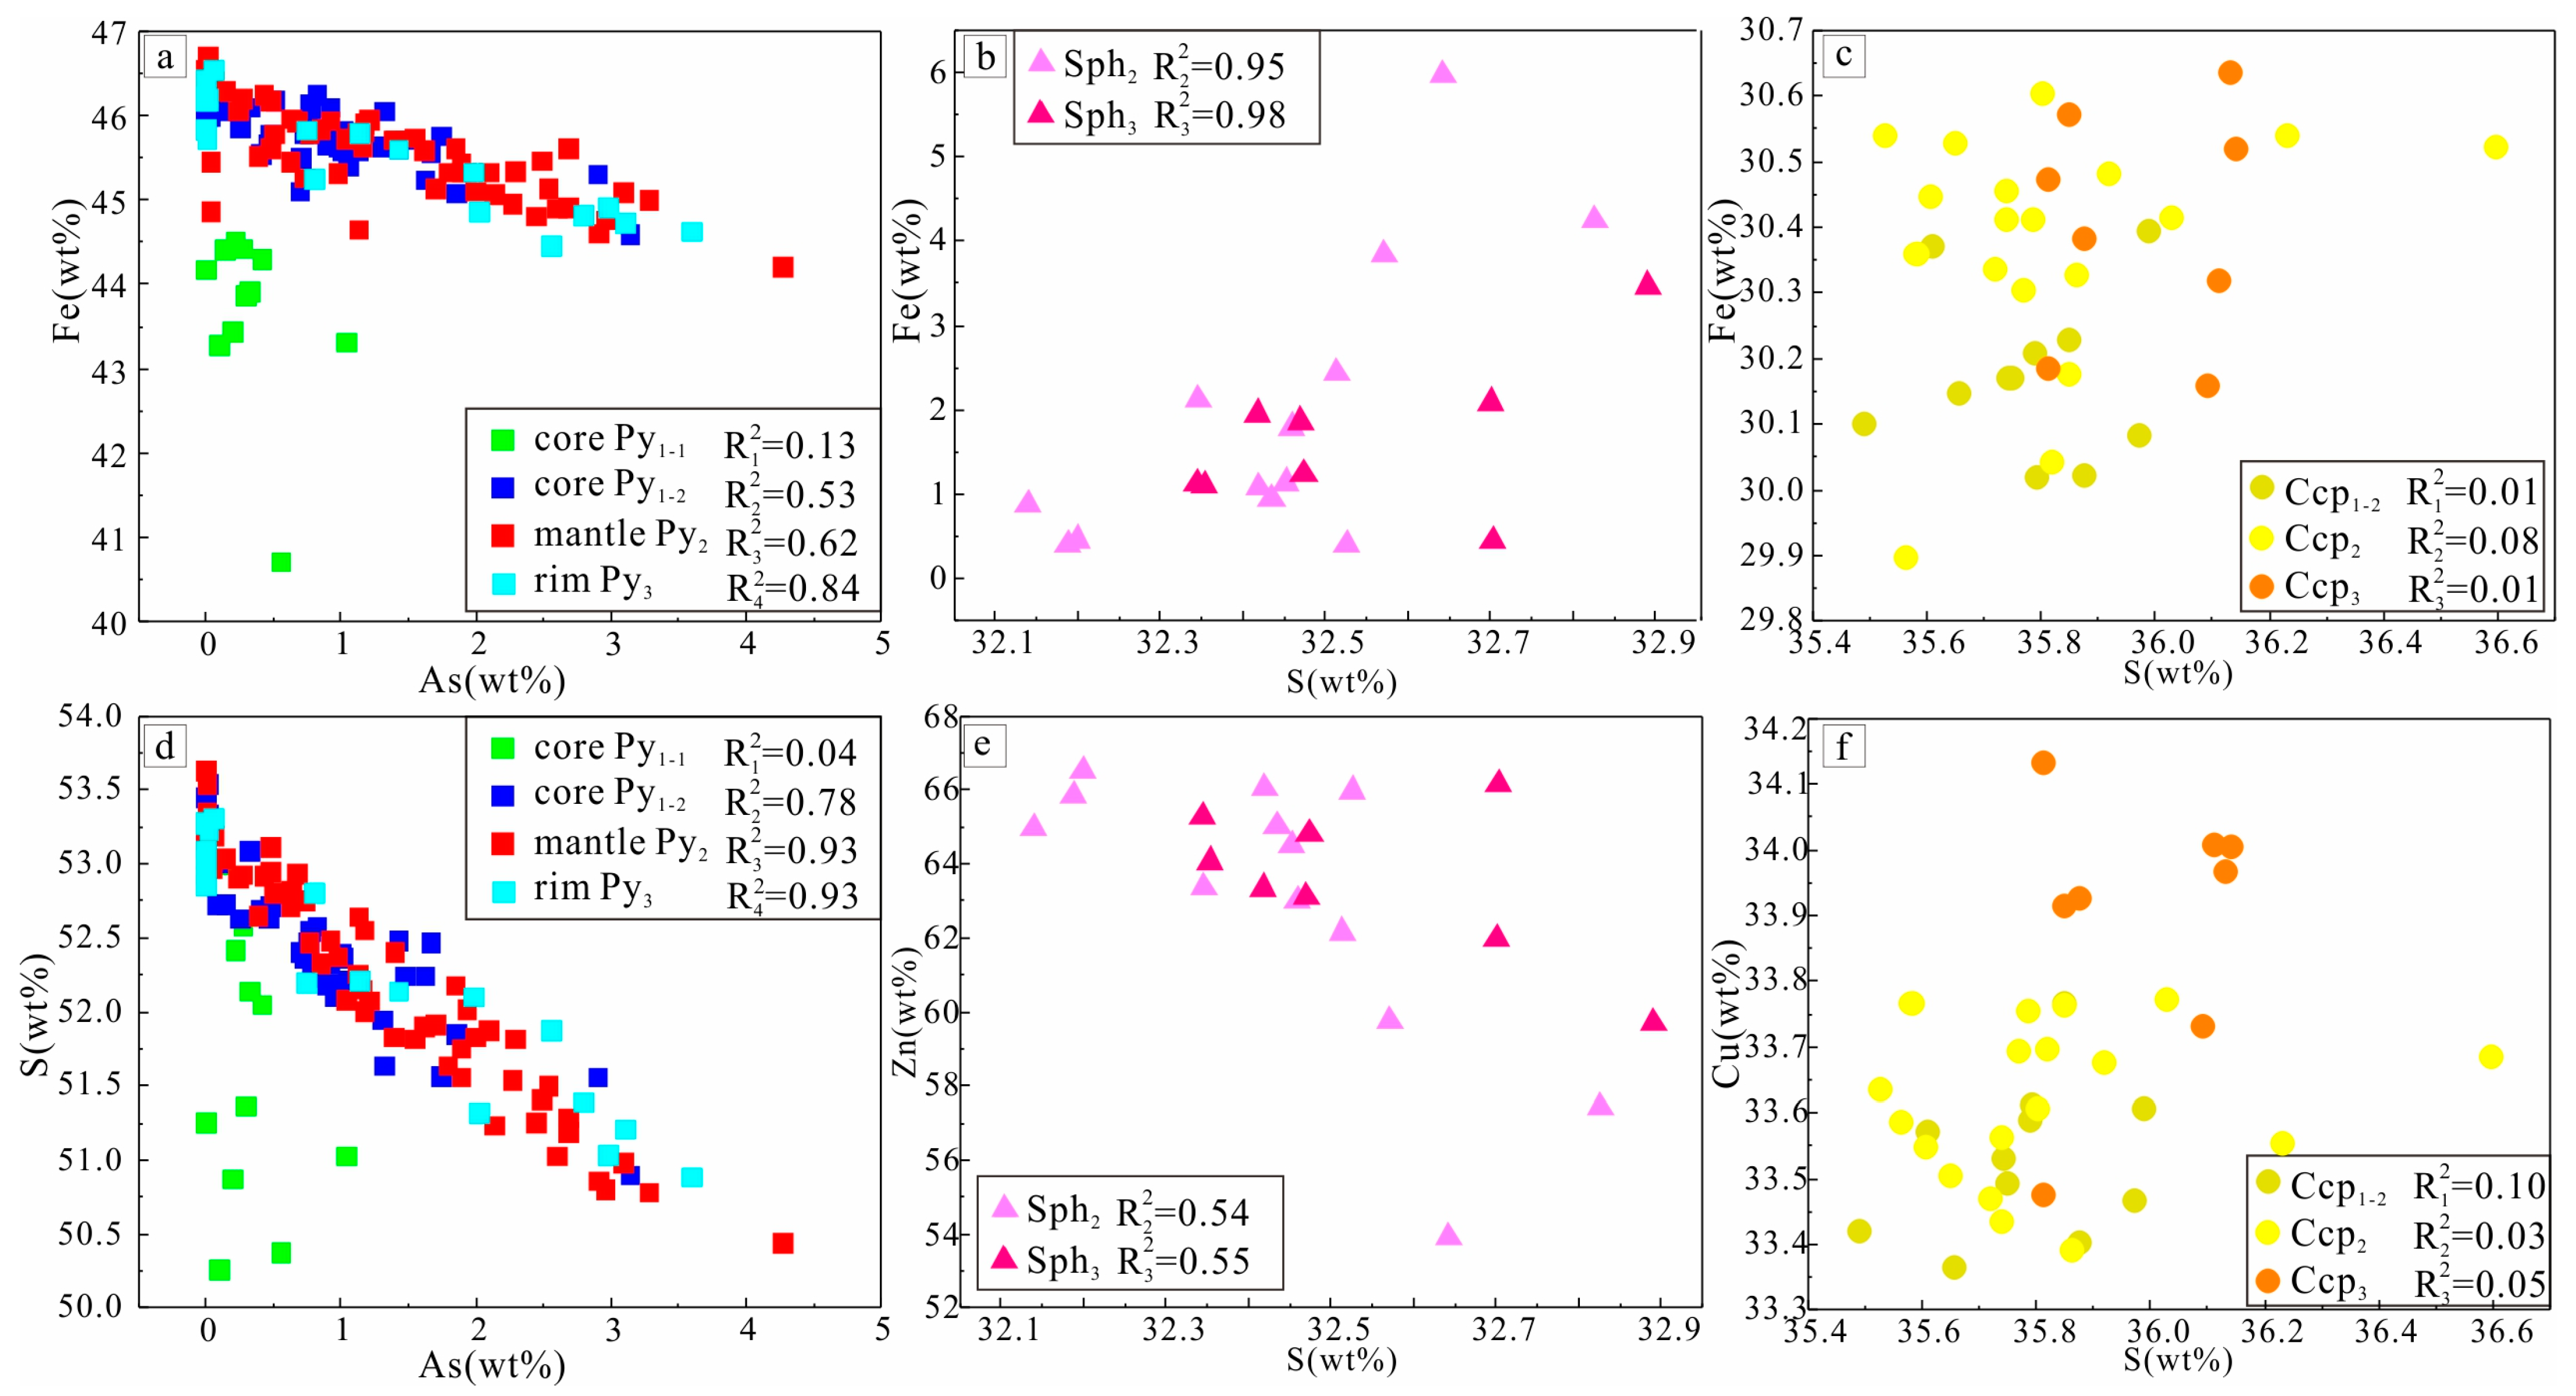
4.3.1. Main Element Content and Correlation of Au-Bearing Minerals

The EPMA analysis results of the main elements for pyrite, sphalerite, and chalcopyrite at various stages are presented in Table S1 and Figure 7. For Py1-1, Fe ranges from 40.705% to 44.500%, and S ranges from 50.255% to 52.987%, with average contents of 43.66% for Fe and 51.57% for S. Py1-2 contains Fe (44.585%–46.506%) and S (50.895%–53.445%), with average contents of 45.76% for Fe and 52.46% for S. Py2 contains Fe (44.205%–46.691%) and S (50.439%–53.533%), with average contents of 45.59% for Fe and 52.22% for S; Py3 contains Fe (44.456%–46.528%) and S (50.884%–53.303%), with average contents of 45.59% for Fe and 52.40% for S. The As content in pyrite for Py1-1, Py1-2, Py2, and Py3 ranges from 0.098% to 1.043% (average 0.36%), 0.016% to 3.142% (average 0.93%), 0.02% to 3.282% (average 1.43%), and 0.013% to 3.602% (average 1.55%), respectively. Except for Py1-1, As in Py1-2, Py2, and Py3 shows a clear negative correlation with both Fe and S (Figure 7a,d).
Sph2 contains Fe (0.408%–5.968%), Zn (53.914%–66.505%), and S (32.14%–32.862%), with average contents of 1.98% for Fe, 62.96% for Zn, and 32.44% for S. Sph3 contains Fe (0.442%–3.467%), Zn (59.7%–66.171%), and S (32.345%–32.891%), with average contents of 1.66% for Fe, 63.56% for Zn, and 32.55% for S. In sphalerite, Fe, Zn, and S are strongly correlated (Figure 7b,e).
Ccp1-2 contains Fe (30.02%–30.373%), Cu (33.404%–33.769%), and S (35.489%–35.988%), with average contents of 30.18% for Fe, 33.53% for Cu, and 35.77% for S. Ccp2 contains Fe (29.899%–30.606%), Cu (33.392%–33.772%), and S (35.563%–36.595%), with average contents of 30.38% for Fe, 33.62% for Cu, and 35.82% for S. Compared to Ccp1-2 and Ccp2, Ccp3 contains Fe (30.159%–30.637%), Cu (33.477%–34.134%), and S (35.811%–36.141%), with average contents of 30.41% for Fe, 33.90% for Cu, and 35.98% for S. In chalcopyrite, there is no correlation between Fe, Cu, and S (Figure 6c,f).

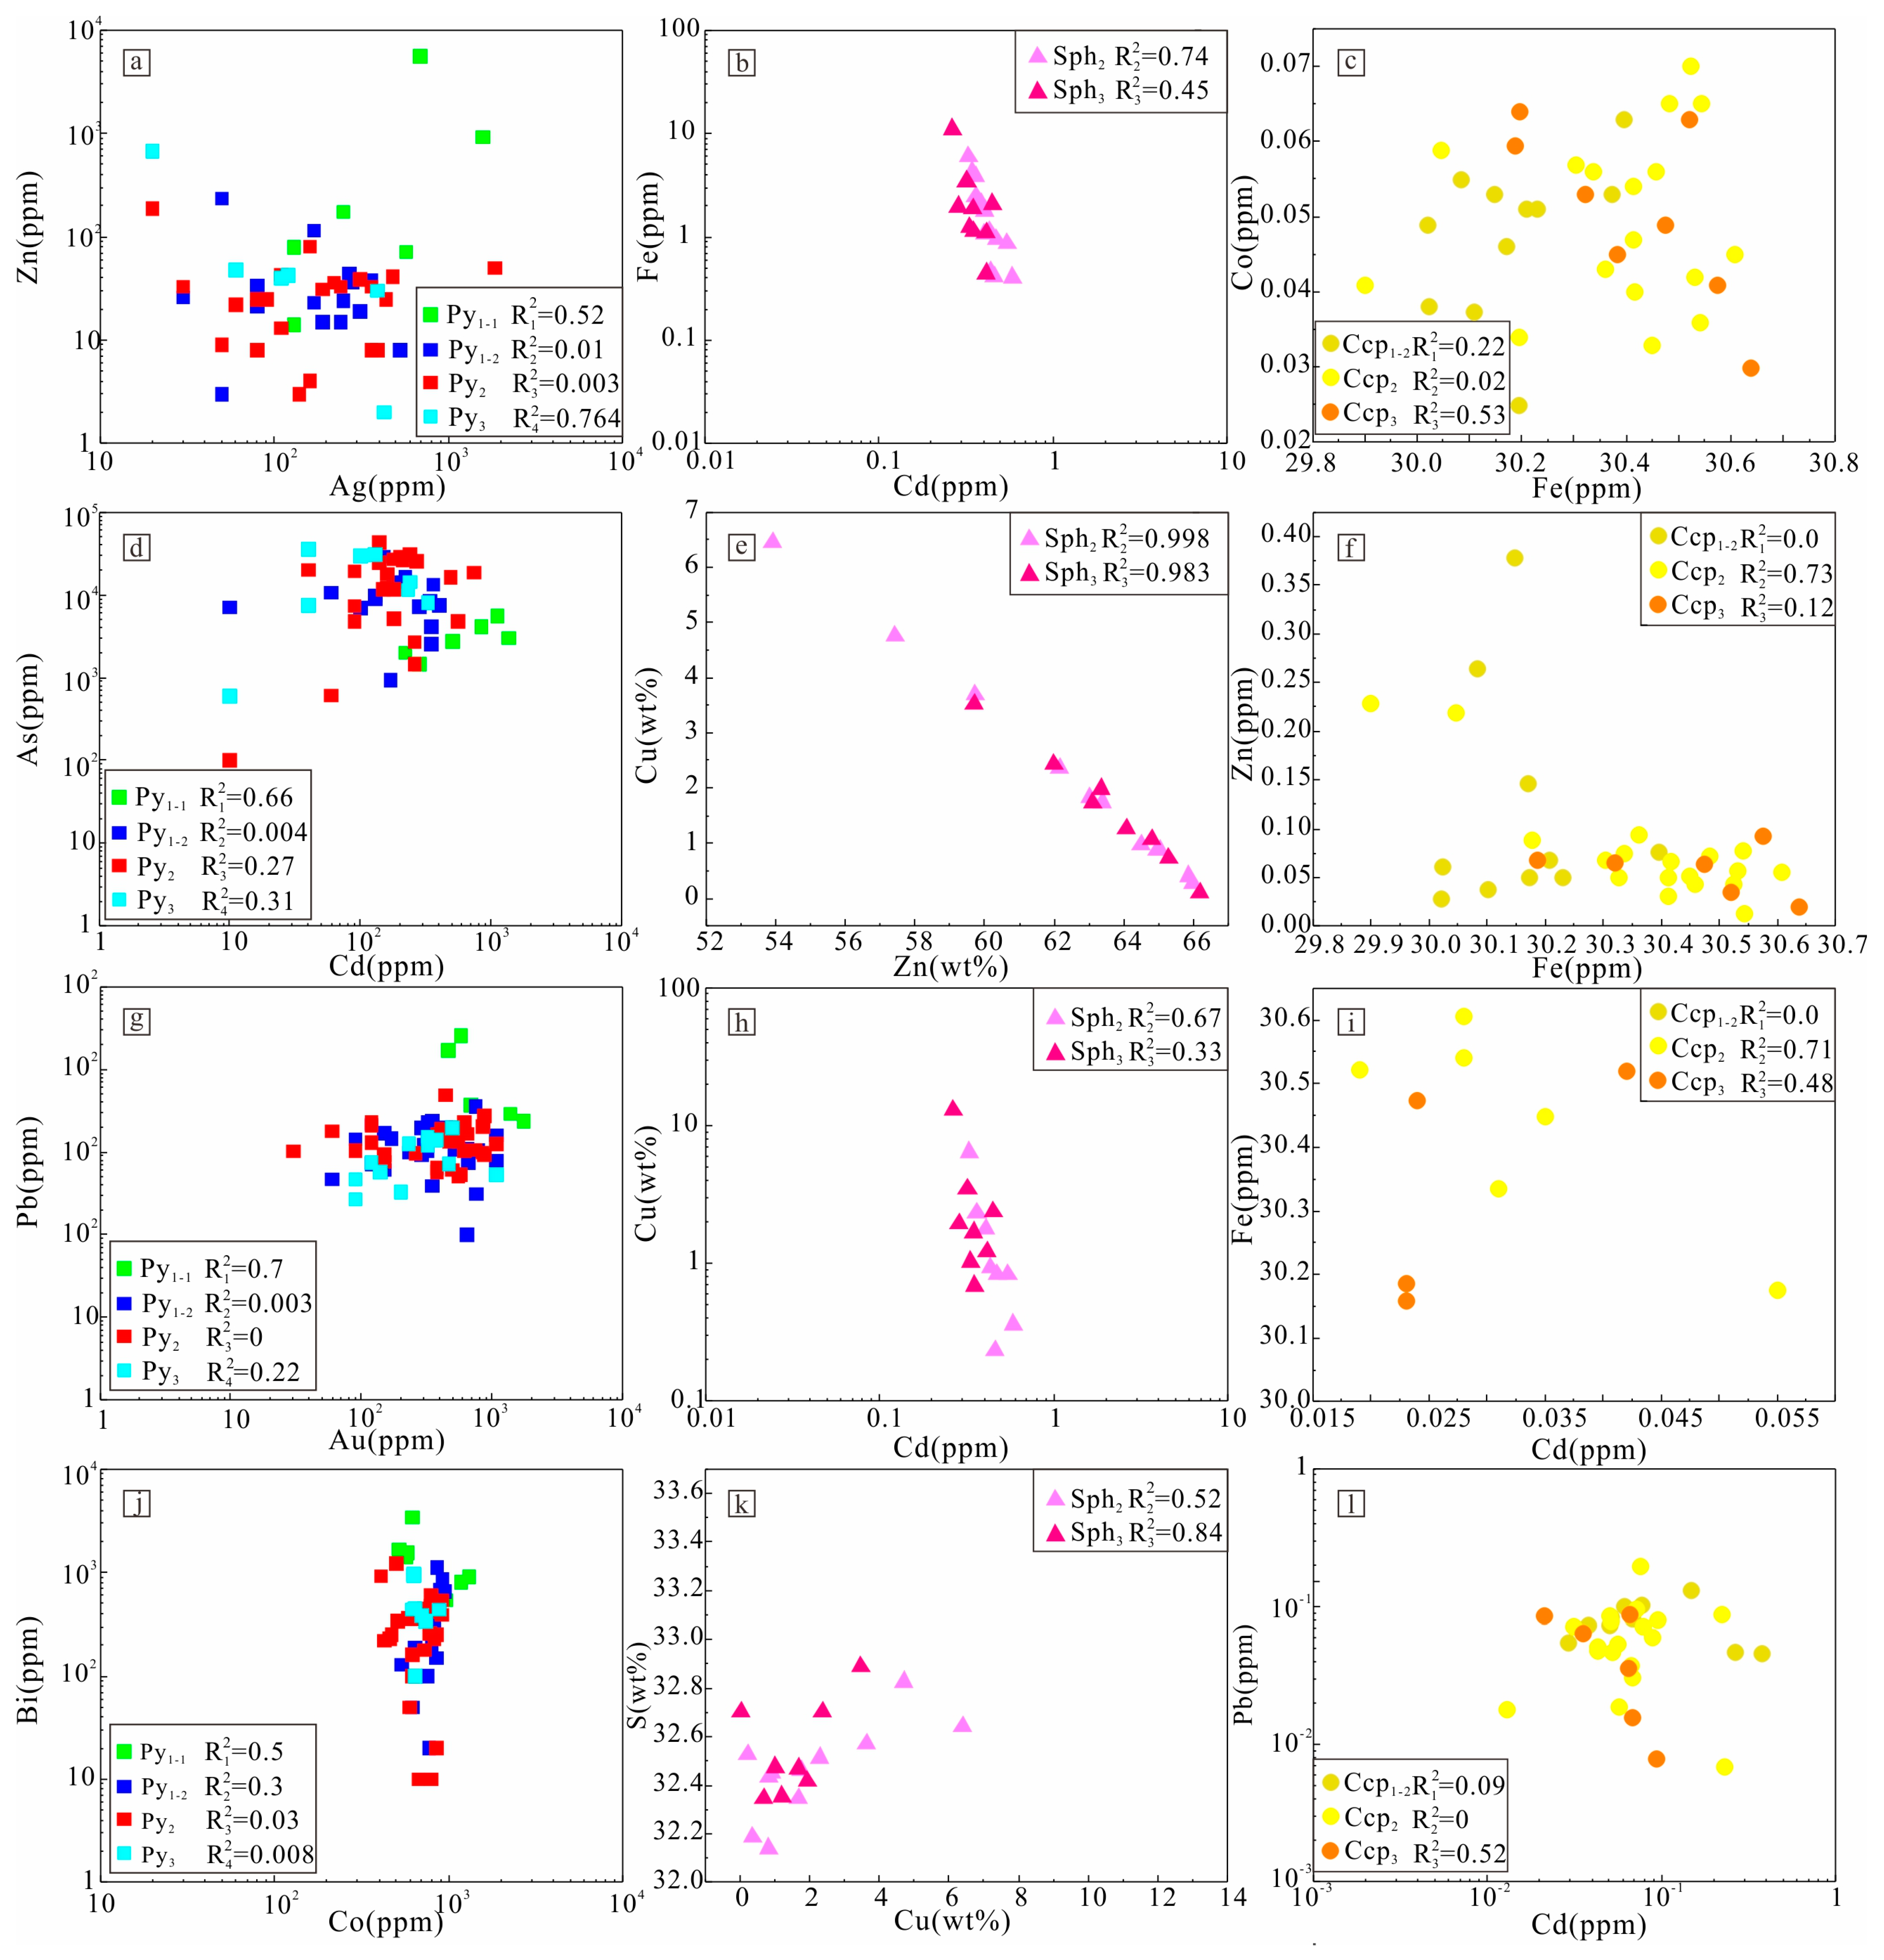
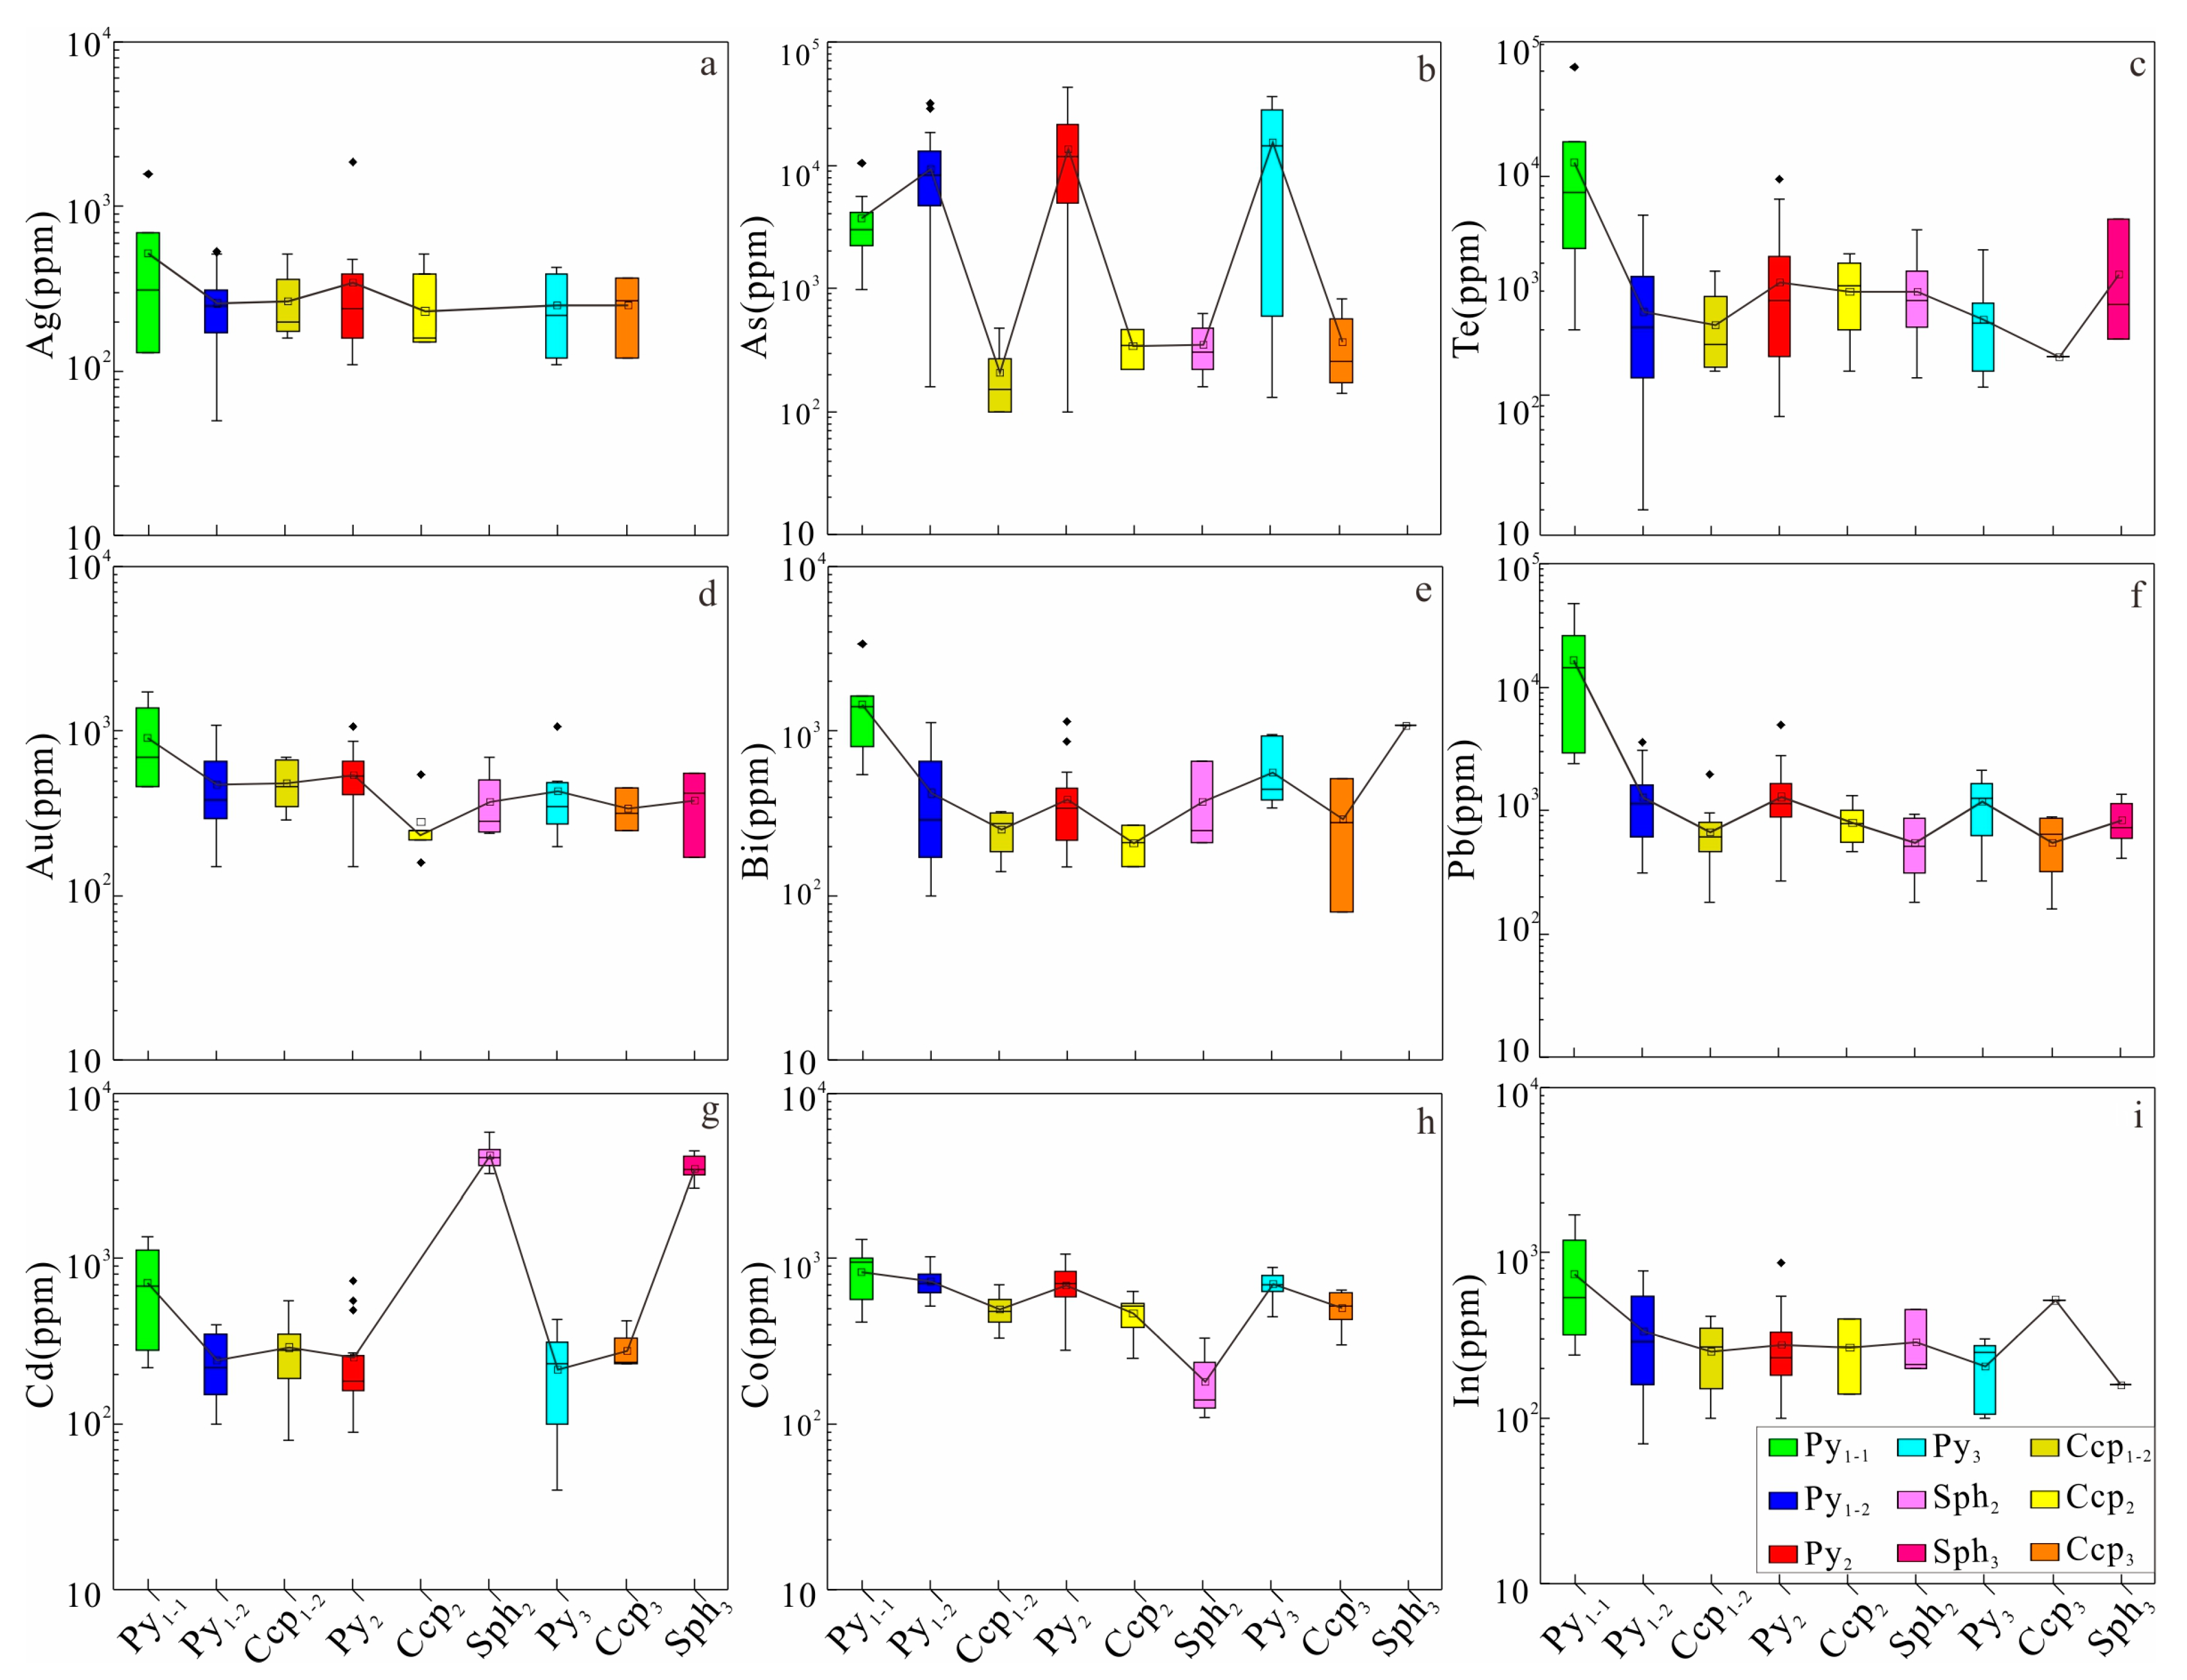
4.3.2. Trace Element Content and Correlation of Au-Bearing Minerals

In pyrite, Au concentrations exceed the detection limit in 62 of 141 points, ranging from 235 ppm to 23,800 ppm. In Py1-1, trace elements with higher concentrations include Pb (mean 16,557 ppm), Ag (521 ppm), Cd (721 ppm), In (750 ppm), Au (920 ppm), Bi (1466 ppm), Zn (8220 ppm), and Cu (5059 ppm). These elements are present in higher concentrations than in pyrite, chalcopyrite, and sphalerite from other ore-forming stages, particularly Pb, which ranges from 2390 to 47,080 ppm. Excluding data below the detection limit, the following element pairs show good correlations in Py1-1: Au-Co (R2 = 0.3), Au-In (R2 = 0.49), Au-Pb (R2 = 0.7), Cd-Bi (R2 = 0.42), Fe-Te (R2 = 0.42), S-Au (R2 = 0.35), S-Bi (R2 = 0.36), Te-Ni (R2 = 0.37), Ag-Zn (R2 = 0.52), Cd-As (R2 = 0.66), and Co-Bi (R2 = 0.5). Au-Co, Au-In, and Au-Pb exhibit negative correlations among these.
Trace element concentrations in Py1-2 have significantly decreased compared to Py1-1 (Figure 8). For example, Pb (560–3590 ppm, mean 16,557 ppm), Ag (265 ppm), Cd (243 ppm), In (374 ppm), Au (480 ppm), Bi (423 ppm), Zn (392 ppm), and Cu (572 ppm) all show notable decreases, while As concentration has significantly increased (mean 9322 ppm). In Py1-2, strong correlations are observed between the following element pairs: In-Au (R2 = 0.63), Ag-Cd (R2 = 0.32), Ag-In (R2 = 0.41), Ag-Ni (R2 = 0.36), Cd-Pb (R2 = 0.37), Co-Bi (R2 = 0.3), Cu-Ni (R2 = 0.39), Te-Bi (R2 = 0.43), and Te-Zn (R2 = 0.4). Notably, In-Au shows a positive correlation. Compared to Py1-2, trace elements in Py2 show increased concentrations of Pb (mean 13,014 ppm), Ag (349 ppm), Cd (261 ppm), Au, Bi, Zn, Cu, and As, while In, Ni, and Co decreased. Notably, Te-Ni (R2 = 0.31) shows a positive correlation. In Py3, Pb, Ag, Cd, Au, and Te concentrations are lower than those in Py1-2, while As has increased, and the following element pairs exhibit good correlations: Ag-Cu (R2 = 0.35), As-Co (R2 = 0.31), Au-Cd (R2 = 0.42), Au-Te (R2 = 0.45), Cd-As (R2 = 0.31), In-Bi (R2 = 0.36), Te-As (R2 = 0.45), Ag-Zn (R2 = 0.764), and Co-Ni (R2 = 0.71). Among these, Ag-Zn, Co-Ni, and Au-Te exhibit positive correlations, while Au-Cd exhibits a negative correlation.
In Sph2, trace elements include Te (mean 298 ppm), Cd (426 ppm), Zn (287 ppm), As (350 ppm), Ni (100 ppm), Co (180 ppm), Au (375 ppm), Pb (555 ppm), Bi (373 ppm), and Cu (21,566 ppm). Ag was not detected, but Au was found in 7 of 22 points, with concentrations ranging from 170 ppm to 560 ppm. The As content in Sph2 is significantly lower than in pyrite at various stages, while other trace elements (e.g., Te, In, Ni) are similar to those in Py2 and Py3. Cd content in Sph2 is significantly higher than in pyrite and chalcopyrite, ranging from 3620 to 4600 ppm, while in Sph3, it ranges from 3200 to 4140 ppm. In Sph2, Cd and Cu show strong positive correlations with Fe, S, and Zn. Cd–Fe (R2 = 0.74), Cd–S (R2 = 0.51), Zn–Cu (R2 = 0.998), and Cd–Cu (R2 = 0.67) show negative correlations, while Cd–Zn (R2 = 0.51), Cu–S (R2 = 0.52), and Cu–S (R2 = 0.98) show positive correlations (Figure 8b,e,h,k). Similar to Sph2, Ag was not detected in Sph3, and As was below detection limits. However, compared to Sph2, Sph3 shows higher levels of Te (360 ppm), Ni (194 ppm), Au (383 ppm), and Pb (836 ppm). Cd–Fe (R2 = 0.45), Cd–Cu (R2 = 0.33), and Zn–Cu (R2 = 0.983) show negative correlations, while Cu–Fe (R2 = 0.87) and Cu–Fe (R2 = 0.84) shows positive correlations (Figure 8b,e,h,k).
The Au content in chalcopyrite (17/37) ranges from 220 to 670 ppm, exceeding the detection limit. Ccp1-2 is rich in Zn (1063 ppm), but has lower levels of Pb, Ag, Te, Co, As, and Bi compared to different pyrite stages. Cd content in Ccp2 is below detection limits. Compared to Ccp1-2, Ccp2 shows a decrease in Ag, Au, and Bi, but an increase in Pb, Co, In, Te, and As. Cd–Fe (R2 = 0.71) and In–Co (R2 = 0.95) show strong positive correlations, while Fe–Zn (R2 = 0.73) and Cd–Co (R2 = 0.65) show strong negative correlations (Figure 8i,l). In Ccp3, the contents of As, Ag, Cd, In, Co, Au, and Bi are higher than in Ccp2, while Pb and Te have decreased. No Ni trace elements were detected in Ccp1-2, Ccp2, or Ccp3. Fe–Co (R2 = 0.53) and Zn–Pb (R2 = 0.52) show negative correlations (Figure 8c,f). Cd–Fe (R2 = 0.48) (Figure 8i), S–Pb (R2 = 0.84), and Zn–S (R2 = 0.53) show positive correlations.
The trace element concentrations of Ag, Au, Bi, Pb, Co, and In in different sulfides are consistent across the same mineralization stage (Figure 9a,d–f,h,i), with Ag and Au showing stable variations. In contrast, As shows significant variation across sulfides (Figure 9b), but continuously increases in pyrite across stages. Au, Cd, Ag, Pb, and Te in pyrite first decrease, then increase, then decrease again. Zn, Co, and Ni continuously decrease in pyrite.

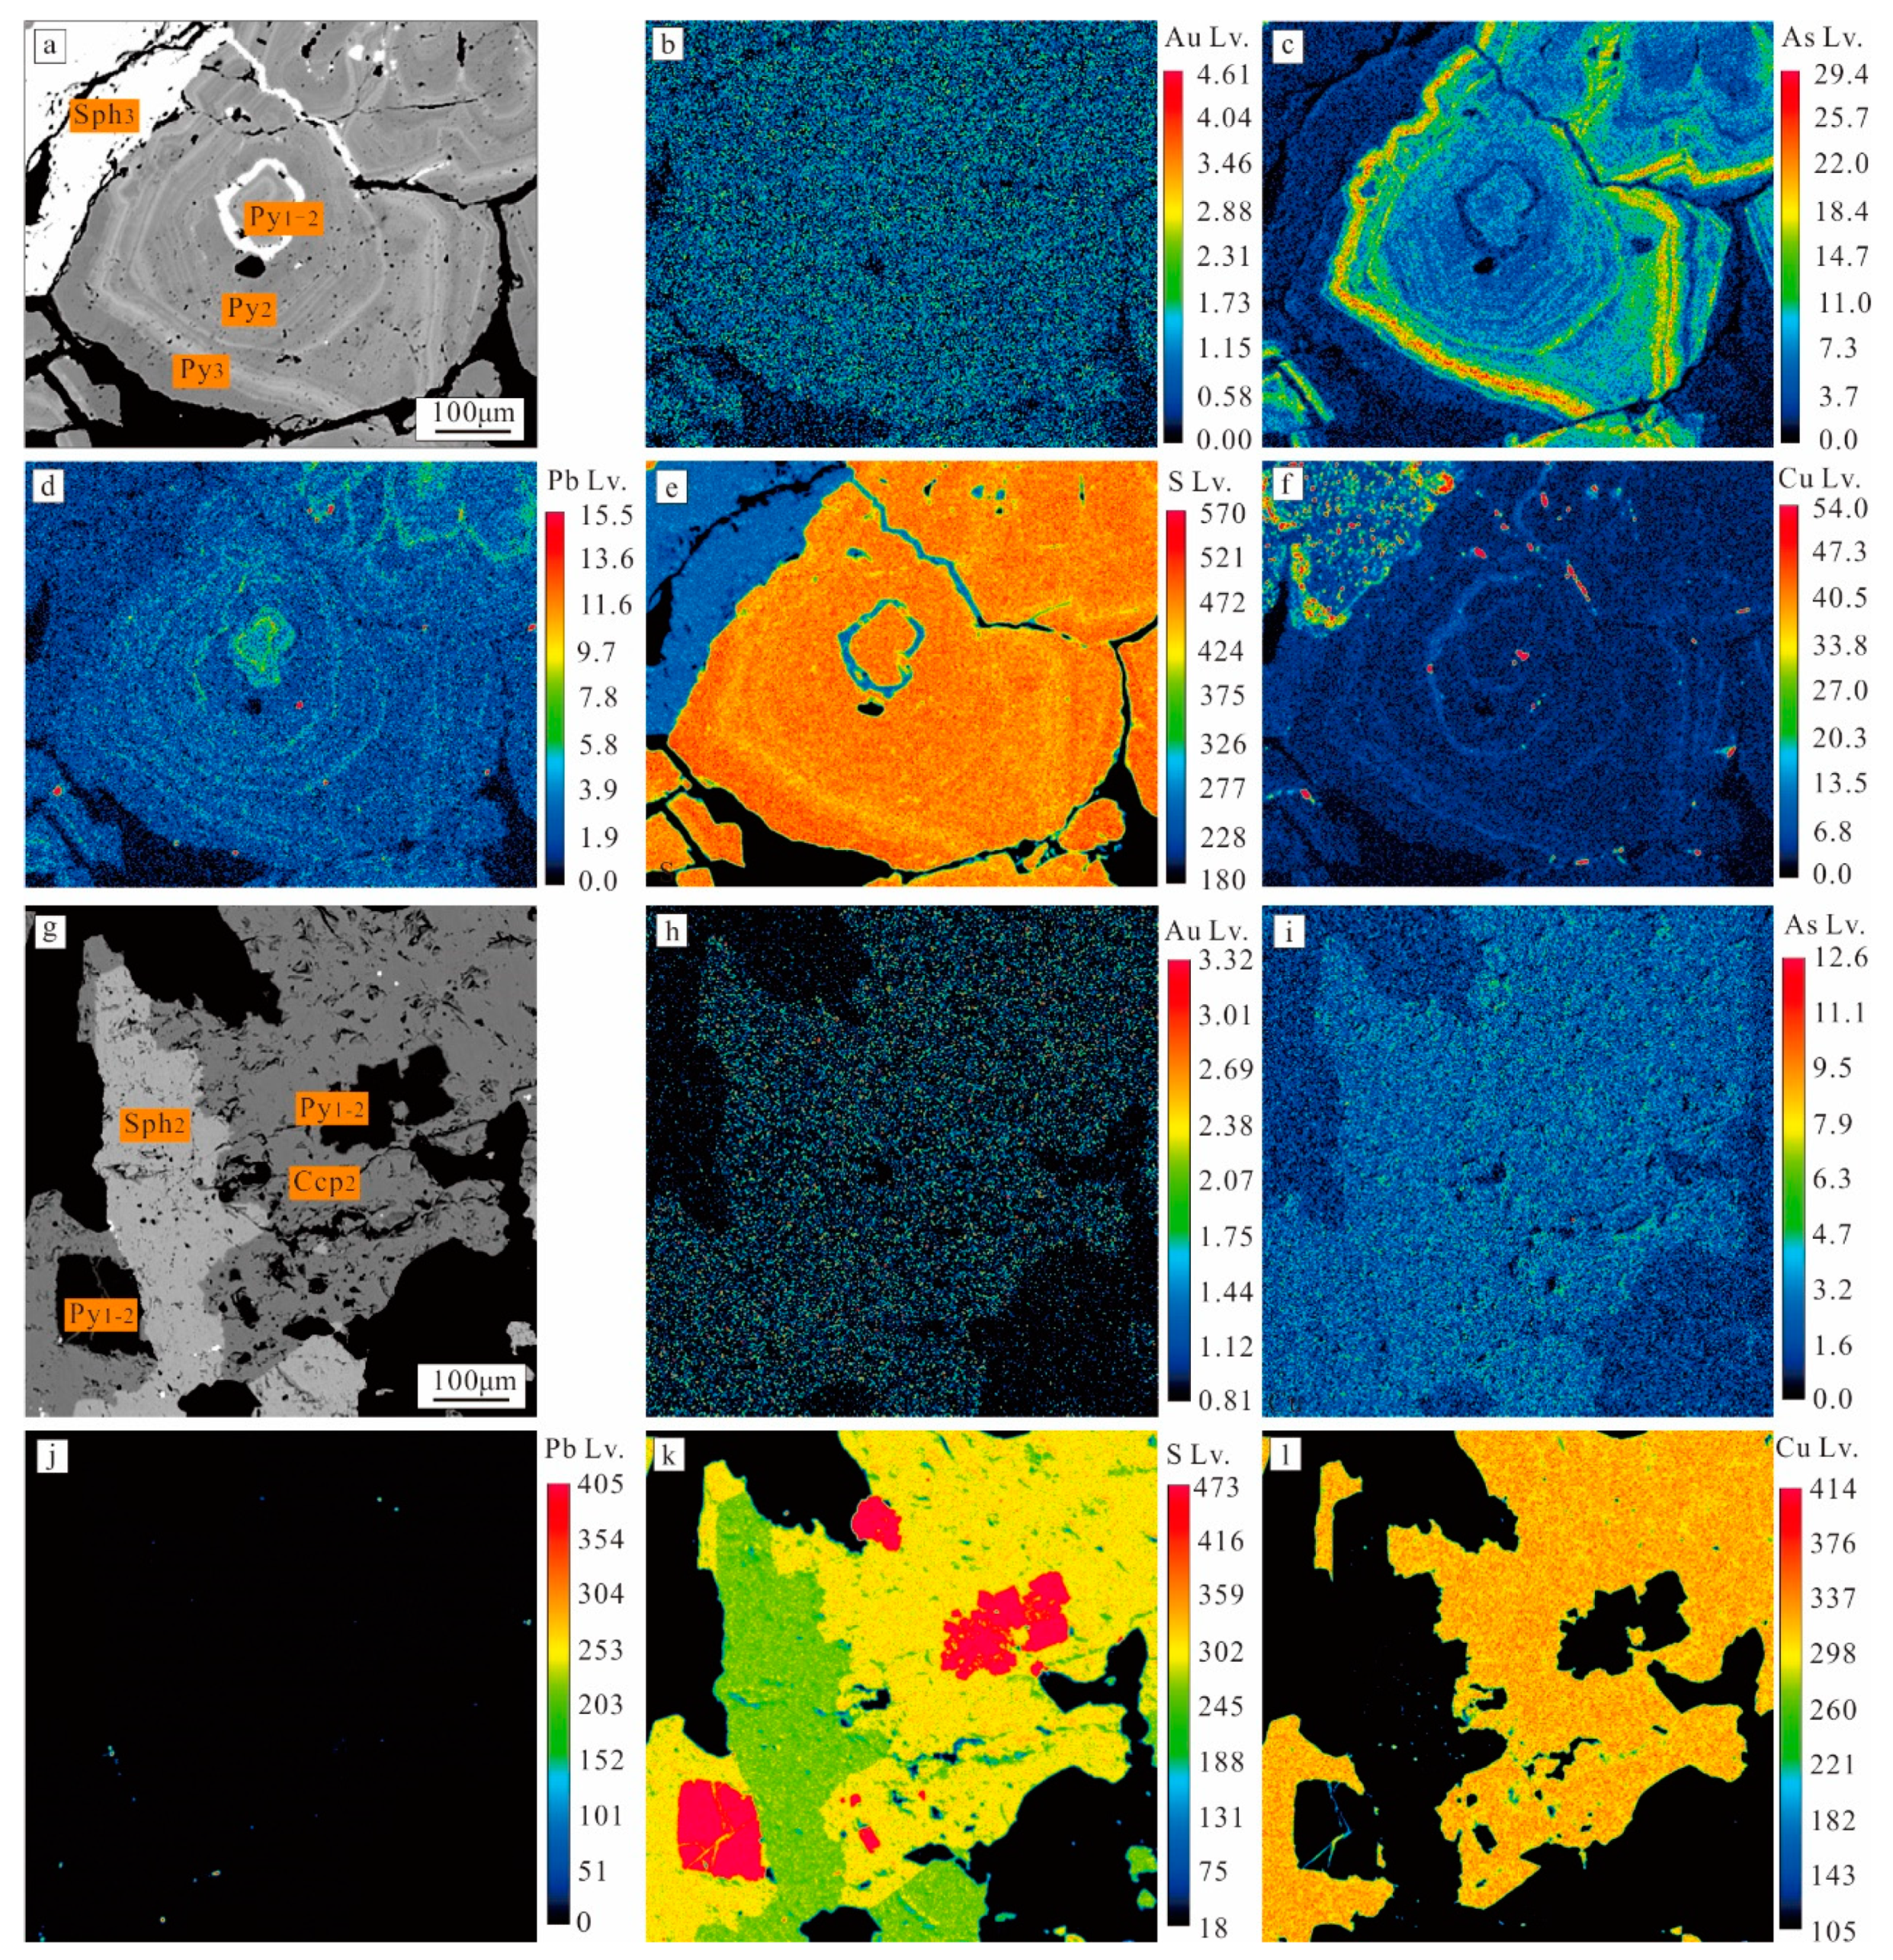
4.3.3. Result of EPMA Mapping

Gold (Au) is uniformly distributed in Py1-2, Py2, Py3, and Sph3 (Figure 10b). Py2 has higher Arsenic (As) than Py1-2, Py3, and Sph3, exhibiting a zonal distribution pattern (Figure 10c). Pb content is higher in Py1-2, with ring-like bright bands in Py2. Pb content decreases significantly in Py3 compared to Py1-2 and Py2. Zn content concentrates in zonal patterns during the later stages of Py1-2 formation, while Sph3 cuts through pyrite along fractures (Figure 10d,e). Cu is evenly distributed in Py1-2, Py2, and Py3 but relatively enriched in Sph3 (Figure 10f). Co is evenly distributed in Py1-2, Py2, Py3, and Sph3 (Figure 10i). Au, As, Pb, and Co are evenly distributed in Py1-2, Sph2, and Ccp2.

5. Discussion

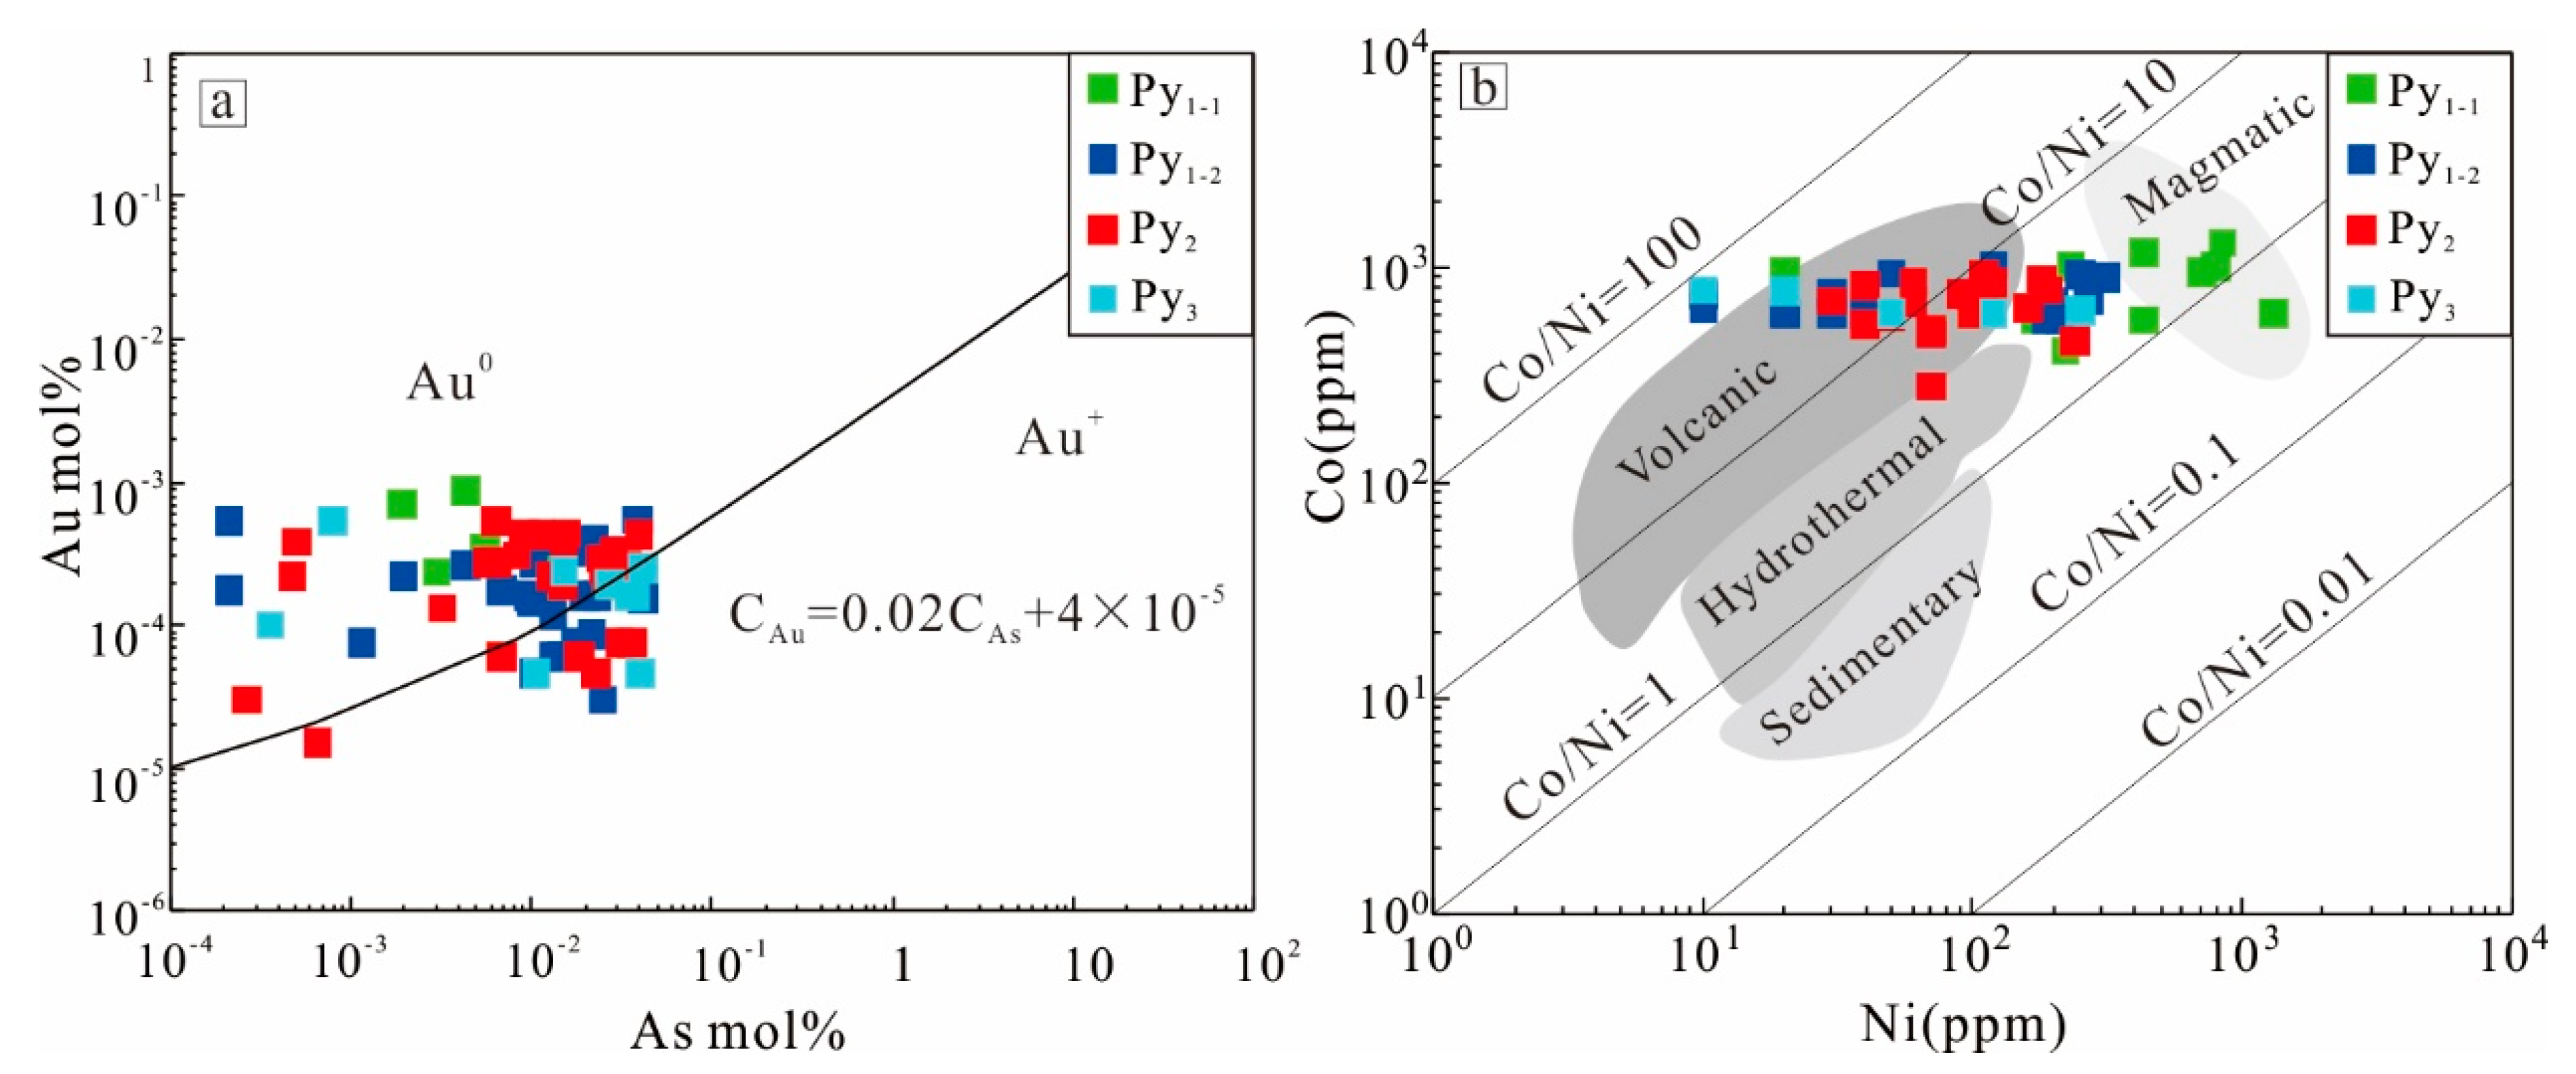
5.1. The Occurrence of Gold

Gold occurrence can be classified by particle size into visible gold (>0.1 μm) and invisible gold (≤0.1 μm) [18,19,20,21,22,23,24]; additionally, gold can occur in relation to host minerals as inclusion, fracture, interstitial, surface-adsorbed, or lattice gold [25]. In VMS deposits, gold mainly occurs as independent, adsorbed, or lattice gold [26].
This study employs SEM, EDS, and EPMA analyses of massive sulfides from the Dapingzhang VMS deposit. Visible gold mainly occurs in Stage II, followed by Stage III. EDS data reveal that visible gold is primarily native gold (Figure 6a). The independent mineral is mainly tellurium gold (Figure 6f). Visible gold primarily occurs as fracture and interstitial gold, found in particle fractures of Py2 and Py3 (Figure 6a,b) or in the intergranular spaces of chalcopyrite and pyrite. Previous studies analyzed trace elements As and Au in pyrite [20], suggesting that when the Au/As molar ratio exceeds 0.02, gold appears as micron-scale visible gold, whereas a ratio below 0.02 indicates that gold enters the pyrite crystal structure as Au+. In this study, statistical analysis of pyrite samples from different stages shows most data points fall below the solubility curve (Figure 11a), indicating that gold in pyrite is mainly lattice gold (Au+). No visible gold was observed in the BSE and EPMA point and surface analyses of gold-bearing minerals, such as chalcopyrite and sphalerite. It is inferred that gold in these minerals also occurs as lattice gold (Au+).
In conclusion, the Dapingzhang copper–gold polymetallic deposit primarily contains invisible gold, with a small amount of visible gold.

5.2. Correlation of Trace Element in Sulfides

Some researchers propose that solid-solution gold forms when Au+ replaces Fe2+ via incomplete isomorphous substitution [27,28]. Other studies suggest that Au+ (1.51 Å), being larger than Fe2+ (0.92 Å), is more likely to occupy vacancies or defects in the pyrite lattice rather than directly replacing Fe2+ [29,30,31]. No significant correlation between Fe and Au was observed in pyrite across the different mineralization stages of the Dapingzhang deposit. Thus, Fe2+ substitution by Au+ in the pyrite lattice is unlikely. Instead, Au+ is more likely to form by occupying defects in the pyrite lattice, including specific crystal edges or faces [20,32,33,34]. Pyrite shows a significant negative correlation between As and S at different stages. Due to their similar chemical properties, As3− often replaces S2− in the pyrite lattice under reducing conditions. This substitution, along with lattice distortions like twists and dislocations, facilitates Au+ ion entry into the pyrite lattice and defects [6,35,36]. Co2+ and Ni2+ ions commonly replace Fe2+ in pyrite. The concentrations of Co, Ni, and the Co/Ni ratio vary significantly across pyrites of different origins, making the Co/Ni ratio a useful indicator of pyrite formation conditions [21,37]. This ratio is crucial for determining the origin of pyrite. Data points for pyrite at different stages of the Dapingzhang deposit mainly fall within the volcanic and magmatic origin ranges (Figure 11b), indicating that pyrite formation at different stages is influenced by both volcanic and hydrothermal processes.
In Py1-1, the average concentrations of Co (830 ppm) and Au (920 ppm) are comparable. In contrast, Py1-2 shows a larger variation in Au (480 ppm) concentration than Co (730 ppm), suggesting that Co may not have fully crystallized in Py1-1 and could have participated in Py1-2 crystallization. In Py1-1 and Py1-2, In2+ can replace Fe2+ in the pyrite lattice via isomorphous substitution. Similarly, Co2+ can also replace Fe2+ in the pyrite lattice. This is supported by the strong negative correlation between In, Co, and Fe. Pb2+ has a larger ionic radius than Fe2+, making substitution difficult. However, Pb content is significantly higher in Py1-1, suggesting higher Pb concentrations in the mineralizing fluids during the early stages of ore formation. In Py3, a strong correlation between Au and Te exists, possibly related to the precipitation of telluride minerals [38].
Cd is a highly enriched trace element in sphalerite, where Cd2+ and Fe2+ directly substitute into the lattice [39,40,41,42]. In the Dapingzhang deposit, Cd in Sph2 and Sph3 shows a negative correlation with Fe and Zn (Figure 8b), indicating mutual inhibition of their incorporation into the lattice.
In contrast to sphalerite, chalcopyrite is not fully ionic. Its atomic bonds in the lattice are “effective” covalent, with Fe fluctuating between +2 and +3 oxidation states, and Cu between +1 and +2 [43,44,45]. Thus, the incorporation mechanisms of trace elements in chalcopyrite are more complex than in sphalerite [46]. In Ccp2 and Ccp3, Co, In, Cd, Fe, Pb, and Zn show clear correlations, suggesting their incorporation into chalcopyrite’s lattice involves not only substitution but also cationic coupling [46]. In Ccp2 and Ccp3, Co, In, Cd, Fe, Pb, and Zn show clear correlations, suggesting their incorporation into chalcopyrite’s lattice involves not only substitution but also cationic coupling. Additionally, the Cd content in chalcopyrite at Dapingzhang is much lower than in sphalerite and similar to that in chalcopyrite from other VMS deposits [39].

5.3. Possible Precipitation Enrichment Mechanism of Gold

Gold enrichment in gold-rich deposits is influenced by several factors, including the concentration and chemical state of gold in the mineralizing fluids, temperature, pressure, pH, oxygen fugacity, sulfur fugacity, and hydrothermal alteration processes [26,47,48,49]. Metal sulfides, such as pyrite, chalcopyrite, and sphalerite, are common gold-bearing minerals in VMS-type gold-rich deposits. Pyrite is particularly widespread and often exhibits multi-generational features. Its complex structure and variations in trace elements can reflect the occurrence and enrichment mechanisms of gold [39,48,50,51,52,53].
In VMS deposits, ore-forming materials originate from the deep crust or upper mantle, with sulfur mainly sourced from volcanic gas emissions or seawater. The mineralizing fluids mainly result from deep circulation of infiltrating seawater mixing with magmatic fluids. Associated alteration assemblages include silicification, pyritization, sericitization, chloritization, epidotization, and carbonation [10,11,17,54]. The Dapingzhang deposit results from volcanic vent-sedimentary mineralization in the back-arc rift zone. Fluid inclusion characteristics of the ore show that the mineralizing fluid is a low-to-moderate salinity, low-temperature Na+(K+)–Cl–(– SO 4 )–CO2–H2O system (with K+ > Na+) [11]. Au primarily migrates as AuHS0, Au (HS ) 2 , and Au(Cl ) 2 in hydrothermal gold deposits [55]. In VMS, gold migrates as Au(Cl ) 2 [49]. During mineralization, deep-circulating infiltrating seawater permeates and leaches ore-forming materials from volcanic rocks, mixing with magmatic fluids. This process transports Au, Te, and other elements from the upper mantle or lower crust, migrating upward along volcanic conduits driven by the magmatic hydrothermal system. When mineralizing hydrothermal fluids are discharged at the seafloor, changes in their physicochemical conditions, such as temperature decrease, lead to the precipitation of sulfides and gold.
Based on new data from this study, trends of Ag, Au, Bi, Pb, Co, and In in different sulfides are similar in the same stage (Figure 9a,d–f,h,i). This suggests that the mineralizing fluid may belong to different evolutionary stages, with varying concentrations of Au, As, Pb, Bi, Te, and other elements. The specific evolution is as follows: the initial mineralizing fluid of the Dapingzhang deposit is rich in Au+, As2−, Fe2+, Pb2+, and S2− ions, with Te2+, Zn2+, Cd2+, and Cu2+ present in lower concentrations. Consequently, boiling-shaped pyrite (mostly grown into autoclastic pyrite) crystallizes first as Py1-1, and locally, this pyrite is cemented by lead-bearing hydrothermal fluids. During crystallization, pyrite captures small amounts of Ag, Te, Au, Bi, Pb, Cd, Co, In, and other ions from the fluid. As the reaction progresses, it is speculated that the solvent is consumed. According to the dilution law [56,57,58,59], solute concentrations increase, and when Fe2+, Cu2+, and S2− concentrations reach supersaturation, Py1-2 and Ccp1-2 crystallize.
During the Py1-2 stage, solvent consumption increases the concentrations of Fe2+, As3−, Cu2+, S2−, and Zn2+ in the fluid, triggering the crystallization of As-rich Py2, Ccp2, and Sph2. Py2 forms concentric growth bands around Py1-2. Simultaneously, the metallogenic fluid contains high concentrations of Au, Te, Pb, and Bi (Figure 9c,d,f, and Table S1), reaching a critical point where crystallization starts. Due to its high affinity for tellurium, Au reacts with Te to form telluride minerals (e.g., telluride gold, tellurium-bismuth, and tellurium-lead minerals), depleting most of the Te in the fluid before crystallizing as native gold. Based on the maturation law and electrochemical mechanisms [60,61,62,63,64], fine-grained telluride gold and native gold crystallize and redeposit into the fractures and cavities of Py2 or adsorb onto sulfide surfaces. In metallogenic stage II, extensive solvent consumption further increases the concentrations of Fe2+, As3−, Cu2+, S2−, and Zn2+. Crystallization of Py3, Ccp3, and Sph3 begins, with Py3 forming concentric growth bands around Py2, and Py3, Ccp3, and Sph3 coexisting. In BSE images, oscillatory growth bands develop in Py1-2, Py2, and Py3 (Figure 4a,b,f,g, Figure 6a and Figure 9a). Bright bands indicate higher concentrations of Pb, Cu, and As (Figure 9c,d,f,h), with oscillatory bands reflecting pressure fluctuations and local fluid boiling during pyrite crystallization. At this stage, banding in Py2 and Py3 displays a pulsating, episodic mineralization pattern.

6. Conclusions

In the Dapingzhang copper–gold deposit appears as native gold and tellurides within the fractures and pores of chalcopyrite and pyrite. At different stages, gold in pyrite, chalcopyrite, and sphalerite mainly exists in an “invisible” form. Gold in pyrite is incorporated into the mineral lattice through substitution.
During mineralization, gold migrates in the form of Au (HS)2−. Deep-circulating seawater, driven by the magmatic hydrothermal system, percolates through and leaches ore-forming materials from the underlying volcanic strata. This fluid mixes with magmatic fluids to form ore-forming solutions, which migrate upward through volcanic conduits and discharge onto the seafloor in stages. The precipitation of sulfides and gold results from changes in physical–chemical conditions, such as a temperature decrease.

Supplementary Materials

The following supporting information can be downloaded at: https://www.mdpi.com/article/10.3390/min15010054/s1, Table S1: Summary of EPMA analyes of various pyrite,chalcopyrite and sphalerite generations from the Dapingzhang deposit; (All data in this paper are shown in Table S1).

Author Contributions

S.R.: Conceptualization, Methodology, Data curation, Writing—original draft, Writing—review and editing, Investigation, Formal analysis, Visualization, Funding acquisition, Project administration; G.L.: Conceptualization, Methodology, Investigation, Methodology, Writing—original draft, Writing—review and editing, Visualization, Supervision; C.X.: Writing—review and editing, Investigation, Formal analysis; F.L.: Writing—review & editing, Investigation, Formal analysis; S.Z.: Writing—review and editing, Investigation, Formal analysis; W.W.: Writing—review and editing, Investigation, Formal analysis. H.Z.: Writing—review and editing, Investigation, Formal analysis. All authors have read and agreed to the published version of the manuscript.

Funding

The authors declare that this study received funding from the Scientific Research Foundation of Yunnan Education Department (Grant no. 2023J0131) and the Provincial talent training program (Grant no. KKSY201556033). The first author (Shanshan Ru) is an applicant for the funding. The funder (Shanshan Ru) was involved in the study design, collection, analysis, interpretation of data, the writing of this article and the decision to submit it for publication.

Data Availability Statement

Data are contained within the Supplementary Materials.

Conflicts of Interest

The authors declare that they have no known competing financial interests or personal relationships that could have appeared to influence the work reported in this paper. Shunhong Zou is employee of Yunnan Simao Shanshui Copper Co., Ltd. The paper reflects the views of the scientists and not the company.

References

  1. Simon, G.; Kesler, S.E.; Chryssoulis, S. Geochemistry and textures of gold-bearing arsenian pyrite, Twin Creeks, Nevada: Implications for deposition of gold in carlin-type deposits. Econ. Geol. 1999, 94, 405–421. [Google Scholar] [CrossRef]
  2. Müller, D.; Franz, L.; Petersen, S.; Herzig, P.M.; Hannington, M.D. Comparison between magmatic activity and gold mineralization at Conical Seamount and Lihir Island, Papua New Guinea. Mineral. Petrol. 2003, 79, 259–283. [Google Scholar] [CrossRef]
  3. Petersen, S.; Herzig, P.M.; Kuhn, T.; Franz, L.; Hannington, M.D.; Monecke, T.; Gemmell, J.B. Shallow Drilling of Seafloor Hydrothermal Systems Using the BGS Rockdrill: Conical Seamount (New Ireland Fore-Arc) and PACMANUS (Eastern Manus Basin), Papua New Guinea. Mar. Georesour. Geotechnol. 2005, 23, 175–193. [Google Scholar] [CrossRef]
  4. Franklin, J.M.; Gibson, H.L.; Jonasson, I.R.; Galley, A.G. Volcanogenic massive sulfide deposits. Econ. Geol. 2005, 1, 523–560. [Google Scholar] [CrossRef]
  5. Galley, A.G.; Hannington, M.D.; Jonasson, I.R. Volcanogenic massive sulfide deposits, in Goodfellow, W.D., ed., Mineral deposits of Canada: A synthesis of major deposit types, district metallogeny, the evolution of geological provinces, and exploration methods: Geological Association Canada. Miner. Depos. Div. 2007, 3, 141–161. [Google Scholar] [CrossRef]
  6. Patrick, M.L.; Mark, D.H.; Benoît, D. The gold content of volcanogenic massive sulfide deposits. Min. Depos. 2011, 46, 509–539. [Google Scholar] [CrossRef]
  7. Vikentyev, I.V. Precious metal and telluride mineralogy of large volcanic-hosted massive sulfide deposits in the urals. Mineral. Petrol. 2006, 87, 305–326. [Google Scholar] [CrossRef]
  8. Zhang, Z.L.; Geng, X.X.; Yang, F.Q.; Zhang, Z.X.; Xu, Q.F. Gold enrichment and the Au–Te association in the Huangtan Au–Cu–Zn volcanogenic massive sulfide deposit, Kalatag, East Tianshan, China: An in-situ LA–ICP–MS analysis. Ore Geol. Rev. 2021, 138, 104407. [Google Scholar] [CrossRef]
  9. Zhu, W.G.; Zhong, H.; Yang, Y.J.; Ren, T. The origin of the Dapingzhang volcanogenic Cu–Pb–Zn ore deposit, Yunnan province, SW China: Constraints from host rock geochemistry and ore Os–Pb–S–C–O–H isotopes. Ore Geol. Rev. 2016, 75, 327–344. [Google Scholar] [CrossRef]
  10. Li, F.; Ru, S.S.; Wu, J. Regional tectonic and Cu-poly metallic metallogenic evolution in Lanping-Simao basin. J. Yunnan Univ. (Nat. Sci.) 2012, 2, 134–142. [Google Scholar]
  11. Ru, S.S. Mineralization Model for the Dapingzhang Cu Polymetallic Deposits in Simao Basin, China. Ph.D. Thesis, Kunming University of Science and Technology, Kunming, China, 2014; pp. 36–42. [Google Scholar]
  12. Ru, S.S.; Li, F.; Wu, J. Metallogenic characteristics and mineralization model of the Dapingzhang copper polymetallic deposit in Puer, Yunnan Province. Geol. Explor. 2014, 50, 48–57. [Google Scholar]
  13. Wang, X.Y.; Lü, Q.T.; Cao, D.H.; Guo, W.G.; Peng, R. Geochronology, geochemistry and zircon Hf-O isotopic composition of ore-bearing volcanic rocks at Dapingzhang VMS Cu-Zn deposit, SW China: Petrogenetic, metallogenic and tectonic implications. Ore Geol. Rev. 2021, 133, 104040. [Google Scholar] [CrossRef]
  14. Wang, X.Y. Tectonic Settings, Deep Geological Process and Metallogeny of VMS Deposit in Dapingzhang, Yunnan. Ph.D. Thesis, China University of Geosciences, Beijing, China, 2021; pp. 25–43. [Google Scholar]
  15. Ji, X.; Liu, S.S.; Wu, S.Y.; Luo, Z.X.; Zhang, Y.L.; Wang, G.; Yang, Y.F.; Leng, Q.F.; Wang, K.Y. Occurrence of gold in Dapingzhang copper-gold polymetallic deposit, Simao basin, Yunnan. Miner. Depos. 2024, 42, 170–191. [Google Scholar]
  16. Zhong, H.; Hu, R.Z.; Ye, Z.J. Sufer, lead, hydrogen and oxygen isotopic geochemistry of the Dapingzhang copper-polymetallic deposit, Yunnan Province. Geochimica 2000, 29, 136–142. [Google Scholar]
  17. Ru, S.S.; Li, F.; Wu, J.; Li, J.B.; Wang, D.W.; Huang, Y.C. Geochemistry and chronology of granodiorite porphyry in the Dapingzhang Cu polymetallic deposit. Acta Petrol. Mineral. 2012, 31, 531–540. [Google Scholar]
  18. Zhang, D.; Chen, Y.; Mao, Q.; Su, B.; Jia, L.H.; Guo, S. Progress and challenge of electron probe microanalysis technique. Acta Petrol. Sin. 2019, 35, 261–274. [Google Scholar]
  19. Cook, N.J.; Chryssoulis, S.L. Concentrations of “invisible gold” in the common sulfides. Can. Mineral. 1990, 28, 1–16. [Google Scholar]
  20. Reich, M.; Kesler, S.E.; Utsunomiya, S.; Palenik, C.S.; Ewing, R.C. Solubility of gold in arsenian pyrite. Geochim. Cosmochim. Acta 2005, 69, 2781–2796. [Google Scholar] [CrossRef]
  21. Bralia, A.; Sabatini, G.; Troja, F. A revaluation of the Co/Ni ratio in pyrite as geochemical tool in ore genesis problems. Miner. Depos. 1979, 14, 353–374. [Google Scholar] [CrossRef]
  22. Large, R.R.; Danyushevsky, L.; Hollit, C.; Maslennikov, V.; Meffre, S.; Gilbert, S.; Bull, S.; Scott, R.; Emso, P.; Thomas, H.; et al. Gold and trace element zonation in pyrite using a laser imaging technique: Implications for the timing of gold in orogenic and carlin-style sediment-hosted deposits. Econ. Geol. 2009, 104, 635–668. [Google Scholar] [CrossRef]
  23. Gopon, P.; Douglas, J.O.; Auger, M.A.; Hansen, L.; Wade, J.; Cline, J.S.; Robb, L.J.; Moddy, M.P. A nanoscale investigation of carlin-type gold deposits: An atom-scale elemental and isotopic perspective. Econ. Geol. 2019, 114, 1123–1133. [Google Scholar] [CrossRef]
  24. Fougerouse, D.; Reddy, S.M.; Saxey, D.W.; Rickard, W.D.A.; Riessen, A.; Micklethwaite, S. Nanoscale gold clusters in arsenopyrite controlled by growth rate not concentration: Evidence from atom probe microscopy. Am. Mineral. 2016, 101, 1916–1919. [Google Scholar] [CrossRef]
  25. Zhang, B.; Li, N.; Chen, Y.J. Occurrence state of gold in hydrothermal deposits and related research methods. Earth Sci. Front. 2018, 25, 251–265. [Google Scholar]
  26. Li, Y.; Deng, X.H.; Wu, Y.; Yue, S.; Lin, Z.; Yang, L.; Chen, X.; Xu, J. A study of the occurrences of gold and silver in the massive sulfide deposit in the Kalatag region, NW China. Earth Sci. Front. 2018, 25, 69–82. [Google Scholar]
  27. Friedl, J.; Wagner, F.E.; Wang, N. On the chemical state of combined gold in sulfidic ores: Conclusions from Mssbauer source experiments. Neues Jahrb. Mineral.-Abh. 1995, 169, 279–290. [Google Scholar]
  28. Simon, G.; Huang, H.; Penner-Hahn, J.E.; Kesler, S.E.; Kao, L.S. Oxidation state of gold and arsenic in gold-bearing arsenian pyrite. Am. Mineral. 1999, 84, 1071–1079. [Google Scholar] [CrossRef]
  29. Fleet, M.E.; Mumin, A.H. Gold-bearing arsenian pyrite and marcasite and arsenopyrite from carlin trend gold deposits and laboratory synthesis. Am. Mineral. 1997, 82, 182–193. [Google Scholar] [CrossRef]
  30. Ashley, P.M.; Creagh, C.J.; Ryan, C.G. Invisible gold in ore and mineral concentrates from the hill grove gold-antimony deposits, NSW, Australia. Miner. Depos. 2000, 35, 285–301. [Google Scholar] [CrossRef]
  31. Pals, D.W.; Spry, P.G.; Chryssoulis, S. Invisible gold and tellurium in arsenic-rich pyrite from the Emperor gold deposit, Fiji: Implications for gold distribution and deposition. Econ. Geol. 2003, 98, 479–493. [Google Scholar] [CrossRef]
  32. Keith, M.; Smith, D.J.; Doyle, K.; Holwell, D.A.; Jenkin, G.R.T.; Barry, T.L.; Becker, J.; Rampe, J. Pyrite chemistry: A new window into Au–Te ore-forming processes in alkaline epithermal districts, Cripple Creek, Colorado. Geochim. Cosmochim. Acta 2020, 274, 172–191. [Google Scholar] [CrossRef]
  33. Chen, L.; Ding, D.; Jian, W. Gold occurrence and pyrite trace elements in the Xiejiagou gold deposit, Jiaodong Peninsula, China: Implications for the mineralization process. J. Earth Syst. Sci. 2024, 133, 125. [Google Scholar] [CrossRef]
  34. Deditius, A.P.; Reich, M.; Kesler, S.E.; Utsunomiya, S.; Chryssoulis, S.L.; Walshe, J.; Ewing, R.C. The coupled geochemistry of Au and As in pyrite from hydrothermal ore deposits. Geochim. Cosmochim. Acta 2014, 140, 644–670. [Google Scholar] [CrossRef]
  35. Morishita, Y.; Shimada, N.; Shimada, K. Invisible gold in arsenian pyrite from the high-grade Hishikari gold deposit, Japan: Significance of variation and distribution of Au/As ratios in pyrite. Ore Geol. Rev. 2018, 95, 79–93. [Google Scholar] [CrossRef]
  36. Augustin, J.; Gaboury, D. Multi-stage and multi-sourced fluid and gold in the formation of orogenic gold deposits in the world class Mana district of Burkina Faso-Revealed by LA-ICP-MS analysis of pyrites and arsenopyrites. Ore Geol. Rev. 2019, 104, 495–521. [Google Scholar] [CrossRef]
  37. Bajwah, Z.U.; Seccombe, P.K.; Offier, R. Trace element distribution, Co/Ni ratios and genesis of the Big Cadia iron-copper deposit, New South Wales, Australia. Miner. Depos. 1987, 22, 292–300. [Google Scholar] [CrossRef]
  38. Stephanie, E.M.; Andrew, G.T.; Roberto, F.W.; Fan, H.R. Implications of pyrite geochemistry for gold mineralization and remobilization in the Jiaodong gold district, northeast China. Ore Geol. Rev. 2015, 71, 150–168. [Google Scholar]
  39. Lisard, T.; Diego, B.; Jean, V.; Laurent, O.; Ortiz-Benavente, B.A.; Chelle-Michou, C.; Proenza, J.A.; Fontboté, L. Trace element geochemistry of sphalerite and chalcopyrite in arc-hosted VMS deposits. J. Geochem. Explor. 2022, 232, 121–152. [Google Scholar] [CrossRef]
  40. Wei, C.; Ye, L.; Hu, Y.S.; Huang, Z.L.; Danyushevsky, L.; Wang, H.Y. LA-ICP-MS analyses of trace elements in base metal sulfides from carbonate-hosted Zn-Pb deposits, South China: A case study of the Maoping deposit. Ore Geol. Rev. 2021, 130, 145–178. [Google Scholar] [CrossRef]
  41. Yang, Q.; Zhang, X.J.; Ulrich, T.; Zhang, J.; Wang, J. Trace element compositions of sulfides from Pb-Zn deposits in the Northeast Yunnan and northwest Guizhou Provinces, SW China: Insights from LA-ICP-MS analyses of sphalerite and pyrite. Ore Geol. Rev. 2022, 141, 278–315. [Google Scholar] [CrossRef]
  42. Yuan, B.; Zhang, C.Q.; Yu, H.J.; Yang, Y.M.; Zhao, Y.X.; Zhu, C.C.; Ding, Q.F.; Zhou, Y.B.; Yang, J.C.; Xu, Y. Element enrichment characteristics: Insights from element geochemistry of sphalerite in Daliangzi Pb–Zn deposit, Sichuan, Southwest China. J. Geochem. Explor. 2018, 186, 187–201. [Google Scholar] [CrossRef]
  43. Donnay, G.; Corliss, L.M.; Donnay, J.D.H.; Elliott, N.; Hastings, J.M. Symmetry of magnetic structures: Magnetic structure of chalcopyrite. Phys. Rev. 1958, 112, 1917–1923. [Google Scholar] [CrossRef]
  44. Hall, S.R.; Stewart, J.M. The crystal structure refinement of chalcopyrite, CuFeS2. Acta Crystallogr. Sect. B 1973, 29, 579–585. [Google Scholar] [CrossRef]
  45. Li, Y.; Kawashima, N.; Li, J.; Chandra, A.P.; Gerson, A.R. A review of the structure, and fundamental mechanisms and kinetics of the leaching of chalcopyrite. Adv. Colloid Interface Sci. 2013, 197–198, 1–32. [Google Scholar] [CrossRef] [PubMed]
  46. George, L.L.; Cook, N.J.; Crowe, B.B.P. Trace elements in hydrothermal chalcopyrite. Mineral. Mag. 2018, 82, 59–88. [Google Scholar] [CrossRef]
  47. Moss, R.; Scott, S.D.; Binns, R.A. Gold content of eastern Manus basin volcanic rocks implications for enrichment in associated hydrothermal precipitates. Econ. Geol. 2001, 96, 91–107. [Google Scholar] [CrossRef]
  48. Gruen, G.; Weis, P.; Driesner, T.; Heinrich, C.A.; de Ronde, C.E.J. Hydrodynamic modeling of magmatic–hydrothermal activity at submarine arc volcanoes, with implications for ore formation. Earth Planet. Sci. Lett. 2014, 404, 307–318. [Google Scholar] [CrossRef]
  49. Martin, A.J.; Jamieson, J.W.; de Ronde, C.E.J.; Layne, G.D.; Piercey, G.; Brandl, P.A. Constraining temporal variations in metal and sulfur sources using high-resolution mineral-scale analysis of pyrite: Evidence from the Brothers volcano, Kermadec arc, New Zealand. Min. Depos. 2023, 58, 1237–1262. [Google Scholar] [CrossRef]
  50. Xiao, B.; Chen, H.Y.; Feng, Y.Z.; Pan, Y.M. Episodic magmatism contributes to sub-seafloor copper mineralization: Insights from textures and geochemistry of zoned pyrite in the Ashele VMS deposit. American Mineralogist. 2024, 9, 23–59. [Google Scholar] [CrossRef]
  51. Li, R.H.; Yang, L.Q.; Yun, M.H. Genetic Relationship between Micro-Deformation and Gold Enrichment of Gold-Bearing Pyrite in Jiaodong: Constraint from EBSD Fabrics and Geochemistry. Miner. Depos. 2019, 38, 303–318. [Google Scholar]
  52. Li, R.H.; Wang, X.Q.; Yang, L.Q.; Zhang, B.M.; Liu, Q.Q.; Liu, D.S. The Characteristic of Microstructural Deformation of Gold Bearing Pyrite in Jiaodong: The Links between Nanoscale Gold Enrichment and Crystal Distortion. Ore Geol. Rev. 2020, 122, 367–392. [Google Scholar] [CrossRef]
  53. Yang, M.Z.; Li, J.W.; Zhao, X.F. Electron Back-Scattered Diffraction and LA-ICP-MS Analysis of Pyrite from the DahuLode gold Deposit, Southern North China Craton: Insights into Geochemistry and Distribution of Trace Element Connection to Microstructure of Pyrite. Ore Geol. Rev. 2019, 115, 148–190. [Google Scholar] [CrossRef]
  54. Lehmann, B.; Zhao, X.F.; Zhou, M.F.; Du, A.D.; Mao, J.W.; Zeng, P.S.; Kunst, F.H.; Heppe, K. Mid-Silurian back-arc spreading at the northeastern margin of Gondwana: The Dapingzhang dacite-hosted massive sulfide deposit, Lancangjiang zone, southwestern Yunnan, China. Gondwana Res. 2013, 24, 648–663. [Google Scholar] [CrossRef]
  55. Huang, C.; Zhang, D.H. Mechanisms of Gold Transportation and Deposition in Hydrothermal Gold Deposits. Geol. Sci. Technol. Inf. 2013, 32, 162–170. [Google Scholar]
  56. Chung, S.Y.; Kim, Y.M.; Kim, J.G. Multiphase transformation and Ostwald’s rule of stages during crystallization of a metal phosphate. Nat. Phys. 2009, 5, 68–73. [Google Scholar] [CrossRef]
  57. Hadjittofis, E.; Vargas, S.M.; Litster, J.D. Exploring the role of crystal habit in the Ostwald rule of stages. Proceedings of the Royal Society A: Mathematical. Phys. Eng. Sci. 2022, 478, 22–58. [Google Scholar] [CrossRef]
  58. Schmelzer, J.W.P.; Abyzov, A.S. How Do Crystals Nucleate and Grow: Ostwald’s Rule of Stages and Beyond. How Do Crystals Nucleate and Grow: Ostwald’s Rule of Stages and Beyond. Therm. Phys. Therm. Anal. 2017, 11, 195–211. [Google Scholar]
  59. Li, J.J.; Deepak, F.L. In Situ Kinetic Observations on Crystal Nucleation and Growth. Chem. Rev. 2022, 122, 16911–16982. [Google Scholar] [CrossRef] [PubMed]
  60. Watanabe, K.; Kajimura, T. The hydrothermal mineralization at Suiyo Seamount. Izu-Ogasawara Arc Resour. Geol. 1994, 44, 133–140. [Google Scholar]
  61. Moss, R.; Scott, S.D. Geochemistry and mineralogy of gold-rich hydrothermal precipitates from the eastern Manus basin, Papua New Guinea. Can. Miner. 2001, 39, 957–978. [Google Scholar] [CrossRef]
  62. Hannington, M.D.; De Ronde, C.E.J.; Petersen, S. Sea-floor tectonics and submarine hydrothermal systems. Econ. Geol. 2005, 111–141. [Google Scholar] [CrossRef]
  63. Maslennikov, V.V.; Maslennikova, S.P.; Large, R.R.; Danyushevsky, L.V. Study of trace element zonation in vent chimneys from the Silurian Yaman-Kasy volcanic-hosted massive sulfide deposit (southern Urals, Russia) using laser ablation-inductively coupled plasma mass spectrometry (LA-ICPMS). Econ. Geol. 2009, 104, 1111–1141. [Google Scholar] [CrossRef]
  64. Christo, N. Thermodynamic and molecular-kinetic considerations of the initial growth of newly born crystals; crystal size distribution; Dissolution of small crystals during Ostwald ripening due to temperature changes. Prog. Cryst. Growth Charact. Mater. 2023, 69, 363–401. [Google Scholar] [CrossRef]
Figure 1. Schematic diagram of geotectonic diagram (a); schematic diagram of regional geology (b) [7,9].
Minerals 15 00054 g001
Figure 2. Geological map of the mining area (a); geological cross-section along the No.16 exploration line of Dapingzhang (b).
Minerals 15 00054 g002
Figure 3. Photographs showing the structure and mineral assemblages of the V1 orebodies. (a) Massive copper-rich sulfide ore body are mainly composed of pyrite and chalcopyrite; (b) dense disseminated sulfide ore specimen are mainly composed of pyrite and chalcopyrite; (c) sparsely disseminated sulfide ore specimens are mainly composed of chalcopyrite and sphalerite; (d) euhedral to subhedral pyrite (Py1-2) is surrounded chalcopyrite (Ccp1-2), (e) chalcopyrite (Ccp2) forms a boundary with sphalerite (Sph2), (f) pyrite from different stages is enclosed by chalcopyrite formed later; (g) pyrite forms droplet-like solid solution inclusions within sphalerite; (h) pyrite, chalcopyrite, sphalerite, and galena coexist; (i) galena is dissolved quartz.
Minerals 15 00054 g003
Figure 4. Microstructure of massive sulfides. (a) Pyrite displays concentric growth in multiple stages, with chalcopyrite enveloping, intergrowing, and cementing it at different stages, (b) pyrite forms a multi-stage concentric structure, with chalcopyrite (Ccp2) present locally, (c) Py1-1 is cemented by Pb-bearing hydrothermal fluid, with Py2 grows along its edge; (d) pyrite forms in concentric stages, with chalcopyrite and sphalerite present in the transitional zones between stages; (e) boiling-shaped pyrite, with some grains cemented by later Pb-bearing hydrothermal fluids; (f) pyrite forms a multi-stage concentric structure; (g) pyrite encapsulates galena in an inclusion structure; (h) pyrite forms concentric structures, with some Py1-1 aggregating into anomalous shapes; (i) pyrite is enveloped by chalcopyrite in an inclusion structure, with chalcopyrite, sphalerite, and galena occurring together. Abbreviation: Py1-1—pyrite early in stage 1; Py1-2—pyrite later in stage 1; Py2—pyrite in stage 2; Py3—pyrite in stage 3; Ccp2—chalcopyrite in stage 2; Ccp3—chalcopyrite in stage 3; Gn1-1—galena early in stage 1; Gn2—galena in stage 2; Gn3—galena in stage 3; Qtz—quartz.
Minerals 15 00054 g004
Figure 5. Sequence diagram of sulfide evolution in Dapingzhang deposit.
Minerals 15 00054 g005
Figure 6. Backscatter image and energy spectrum of massive sulfide under SEM. (a) Native gold occurs in the fractures of Py3 and Py2; (b) anhedral telluride crystals are present in the cavities of Py2; (c) altaite appears in irregular forms along Py2 voids; (d) anhedral hessite crystals are found in quartz and Py2 fractures; (e) tetradymite occurs in irregular forms between chalcopyrite and Py1-2 grains; (f) hessite is found in Py3. Abbreviations: Tbi—tetradymite; Cav—native gold; Alt—altaite; Hes—hessite; Snt—stibnite.
Minerals 15 00054 g006
Figure 7. Correlation of major elements of pyrite (a,d), chalcopyrite (b,e), and sphalerite (c,f) at different stages.
Minerals 15 00054 g007
Figure 8. Binary diagram of trace element quantities related to pyrite (a,d,g,j), sphalerite (b,e,h,k), and chalcopyrite (c,f,i,l) at different stages in the Dapingzhang.
Minerals 15 00054 g008
Figure 9. Box plots of trace element content of sulfide at different stages.
Minerals 15 00054 g009
Figure 10. EPMA mapping of trace element content of sulfide at different stages. The pyrite forms a concentric structure (a); Au zonation is absent in pyrite (b); The zonation of As, Pb, Cu and S is obvious in pyrite (cf); Pyrite is enveloped by chalcopyrite in an inclusion structure, with chalcopyrite, sphalerite occurring together (g);There is no difference in the content of Au, As and Pb in different minerals (hj); The content of S and Cu is different in different minerals (k,l).
Minerals 15 00054 g010
Figure 11. Relationship diagram of Au-As in pyrite at different stages [20] (a) and discriminant diagram of Co-Ni genesis [21] (b).
Minerals 15 00054 g011
Disclaimer/Publisher’s Note: The statements, opinions and data contained in all publications are solely those of the individual author(s) and contributor(s) and not of MDPI and/or the editor(s). MDPI and/or the editor(s) disclaim responsibility for any injury to people or property resulting from any ideas, methods, instructions or products referred to in the content.

