Article

The Adsorption Characteristics of Calcium Ions on Spodumene with Different Colors and Their Associated Activation Mechanism

1
Zhongyuan Critical Metals Laboratory, School of Materials Science and Engineering, Zhengzhou University, No. 100 Science Avenue, Zhengzhou 450001, China
2
School of Chemical Engineering, Zhengzhou University, No. 100 Science Avenue, Zhengzhou 450001, China
3
School of Materials Science and Engineering, Henan University of Science and Technology, No. 263 Kaiyuan Avenue, Luoyang 471023, China
*
Authors to whom correspondence should be addressed.
Minerals 2025, 15(1), 48; https://doi.org/10.3390/min15010048
Submission received: 27 November 2024 / Revised: 24 December 2024 / Accepted: 29 December 2024 / Published: 2 January 2025
(This article belongs to the Special Issue Industrial Minerals Flotation—Fundamentals and Applications)

Abstract

:
This study investigates the activation behavior and mechanism of calcium ions on the flotation of spodumene with different colors. Using NaOL as a collector, in descending order of flotation recoveries were purple, pink, and white spodumene, while in the presence of CaCl2, the flotation recoveries were increased and the order was pink, white, and purple spodumene. The zeta potential, adsorption amount, contact angle, and AFM measurements demonstrated that calcium ions adsorbed on the spodumene surface and promoted NaOL adsorption in alkaline conditions. Species distribution analysis showed that Ca2+, Ca(OH)+, and Ca(OH)2 were essential components that play an activation role at pH = 12. The adsorption capacity and XPS results illustrated that CaCl2 activated spodumene flotation in two ways. One possibility involves calcium ions and their hydroxyl compounds being adsorbed on the spodumene surface, where Ca and Al sites favored OL adsorption. The other possible way involves calcium ions and their hydroxyl compounds forming complexes with NaOL firstly in solution and then co-adsorbing on the spodumene surface. Quantum chemical calculations showed that the adsorption affinity on the spodumene surface in descending order was Ca2+, Ca(OH)2, and Ca(OH)+, and the pink spodumene was most preferably adsorbed, followed by the white spodumene, also consistent the flotation results.

Graphical Abstract

1. Introduction

Lithium is a strategically important metal that is extensively utilized in batteries, ceramics and glass, lubricants, and the nuclear and optoelectronic industries. With the rapid development of the lithium battery industry, there is rapid growth in lithium demand and consumption, and research suggests that lithium demand will see an average annual growth of 10% in the next ten years. Therefore, the safe supply of lithium is particularly important [1,2,3,4,5,6].
Spodumene is one of the main sources of lithium extraction [7]. During the flotation process, activators are commonly added to enhance the flotation efficiency of spodumene, thereby enhancing the flotation separation of spodumene from its associated gangue minerals such as feldspar, albite, quartz, lepidolite, and muscovite [8,9]. The calcium ion is a vital activator commonly used in spodumene flotation. The effects of calcium ions on spodumene flotation and its activation mechanism have been studied by many researchers. Filippov et al. [3] observed that the flotation recovery of spodumene improved to about 90% with the addition of CaCl2. Luo et al. [10] found that the primary active component that enhances the flotation separation of spodumene and albite is Ca(OH)+, whereas Ca(OH)2 is not favorable for flotation separation. Meng et al. [11] analyzed the effects of Fe3+, Mg2+, and Ca2+ on the flotation behavior of spodumene using NaOL as a collector. Their results showed that Fe3+, Mg2+, and Ca2+ had notable activation effects on spodumene at pH 6.5, 10.9, and 12.1, respectively, with Mg2+ and Ca2+ exhibiting better activation for spodumene than Fe3+. Zhang et al. [12] indicated that the poor adsorption of Ca2+ makes it difficult to activate spodumene at a neutral pH, and Ca(OH)+ effectively improved the adsorption strength of the collector, while Ca(OH)2 greatly inhibited the collector’s adsorption on Al sites. The species in pulp and adsorption form on the mineral surface are difficult to identify due to the limitations of detection means, and the mechanism by which calcium ions activate spodumene flotation remains controversial.
Spodumene has many colors, such as white, pink, purple, and green [13,14]. These colors are attributed to crystal imperfection, and some trace elements in particular, namely Fe, Mn, and Cr, are considered to be responsible for these colors. Rehman [15] and Rossman [16] found that spodumene contains many trace elements, while Fe and Mn are the major elements responsible for the differences in color. Ito et al. [17] observed that lilac coloration occurs when the Fe/Mn ratio is below 1. The Fe/Mn ratios were 0.35 for purple spodumene, 0.72 for pink spodumene, and 2.84 for white spodumene. The color of the mineral shifts from purple to pink and then to white with an increasing Fe/Mn ratio. There are differences in the flotability of spodumene with different colors in the same ore body. Sun [14,18] investigated the flotability of spodumene with three different colors, and the results indicated that the ratios of polyvalent metal cations to anions are the main reason for the difference in their natural flotability. Using sodium oleate as a collector, white spodumene had the best natural flotability, light green spodumene had the next best, and pink spodumene had the worst due to the fact that the white spodumene surface has the highest Fe3+ and Al3+ while the light green spodumene has lower O2− and higher Fe3+ than pink spodumene. Fe3+ had the strongest activation effect on pink spodumene, followed by light green spodumene and white spodumene, and this is because the pink spodumene surface has more O2− and is the most electronegative. The results indicate that Fe3+ shows different activation behaviors on the surface of spodumene with different colors, and also the trace metal elements on the mineral surface have a significant impact on mineral flotability.
In recent years, many studies have explored the adsorption behaviors of metal cations such as Fe3+, Mg2+, and Ca2+ on the spodumene surface and the influence mechanism on spodumene flotation, but there are few studies on the adsorption characteristics of metal cations on the surface of spodumene with different colors as well as their effects on flotation. Figuring out the activation mechanism of metal cations in different colored spodumene could enrich and develop the theory and technology of spodumene flotation. In this study, sodium oleate (NaOL), often employed in the industrial flotation of spodumene, was chosen as the collector [8,10,11,19], and the effects of calcium ions on the flotation of spodumene with white, pink, and purple were investigated using microflotation tests. The adsorption amount measurements, zeta potentials, contact angle, atomic force microscopy (AFM), X-ray photoelectron spectroscopy (XPS), and quantum chemical calculations were carried out to investigate the adsorption properties of calcium ions on the three spodumene surfaces as well as the influence mechanism of calcium ions on flotation.

2. Materials and Methods

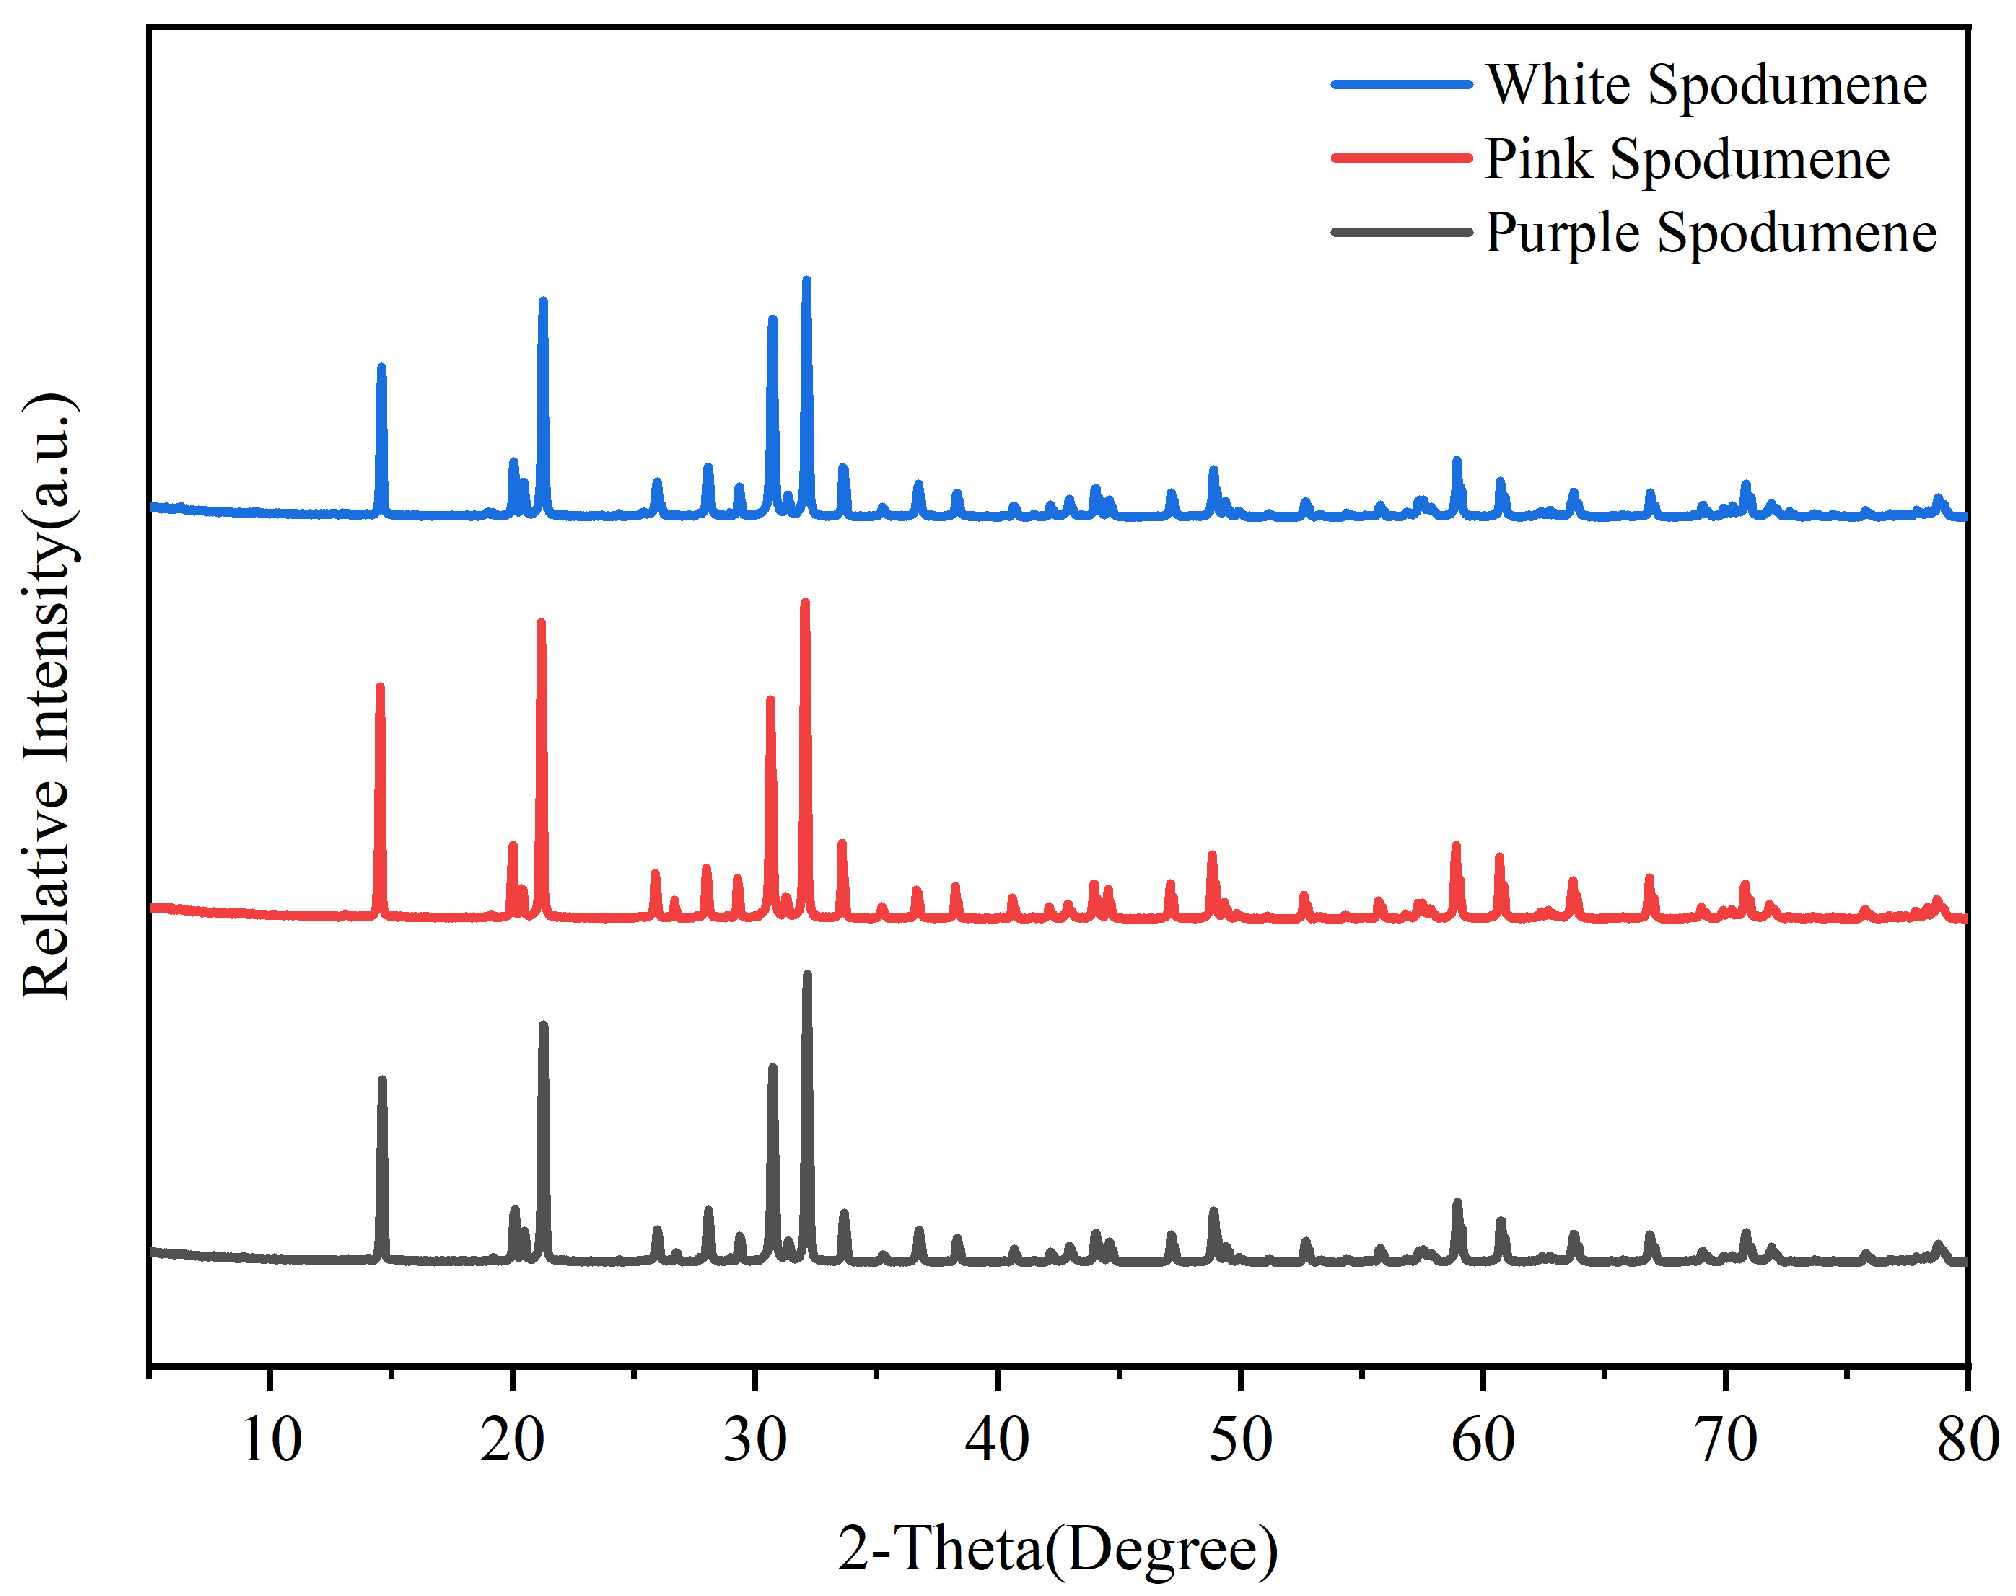
2.1. Materials and Reagents

Spodumene crystals with white, pink, and purple colors were acquired from Western Sahara, Morocco. Spodumene samples of high purity were prepared through careful selection, crushing, grinding, and sieving. As the best flotation particle size in the spodumene flotation practice is −74 + 38 μm [8,9], −74 + 38 μm size fraction samples were used for microflotation tests. The mineralogical composition and chemical composition of white, pink, and purple spodumene were analyzed using X-ray diffraction (XRD) (Figure 1) and X-ray fluorescence (XRF) (Table 1), respectively. The XRD results show that the diffraction peaks for spodumene of three colors match those of the standard card of spodumene. The samples are mainly composed of Li2O, SiO2, and Al2O3, and the purity reaches more than 98%, which indicates that the samples are of high purity and can meet the requirements for single-mineral specimens. The XRF results show that the Fe/Mn ratio of white spodumene is greater than 1, that of pink spodumene is closer to 1, and that of purple spodumene is less than 1, and this was consistent with the findings of Ito et al. [17]. Fe and Mn are the major impurities responsible for color differences, as reported previously [20,21].
The experiments utilized deionized water that had a specific resistance of 18.3 MΩ·cm. Sodium hydroxide (96 wt%, Shangyang Palace, Luoyang, China) and hydrochloric acid (36 wt%, Shangyang Palace) were used as pH regulators in flotation. Sodium oleate (98 wt%, Macklin, Shanghai, China) was applied as the collector. All of the chemicals were analytical grade.

2.2. Microflotation Tests

The microflotation tests were carried out using XFG II flotation equipment (Wuhan Prospecting Machinery Factory, Wuhan, China), with a flotation cell of 40 mL and a stirring rate of 1600 rpm. For every experiment, 2 g of the mineral and 38 mL of deionized water were placed in the flotation cell. After stirring for 2 min, the pulp pH was adjusted with HCl or NaOH and then the system was stabilized for 3 min. CaCl2 and NaOL were added sequentially and stirred for 2 min, respectively. Finally, the froth collection lasted for 5 min to obtain concentrates and tailings. The flotation products were filtrated, dried, and weighed separately, and flotation recoveries were calculated. Each condition was replicated three times and the results were averaged.

2.3. Zeta Potential Measurements

The zeta potential measurements were conducted using a Zetasizer Nano ZS90 Zeta potentiometer (Malvern Instruments, London, UK). The −38 μm size fraction was comminuted to −5 μm with an agate mortar for zeta potential measurements. Next, 20 mg samples and 38 mL of deionized water were added to a beaker and stirred for 2 min and then HCl or NaOH solution was added to adjust the slurry pH, followed by being stirred for another 5 min. Subsequently, CaCl2 and NaOL were added in turn and mixed for 5 min. The system then rested for 60 min. Finally, the supernatant was collected for zeta potential measurements. The results for each sample were obtained by conducting three measurements and then calculating the average.

2.4. The Adsorption Amount Measurements

This measurement was carried out with an Avio-500 Inductively Coupled Plasma Mass Spectrometer (ICP-MS) (PerkinElmer Company, Shelton, CT, USA). First, 1 g samples and an appropriate amount of deionized water were poured into a beaker and stirred for 2 min. The slurry pH was regulated with HCl or NaOH, and after being stirred for 2 min, an appropriate amount of CaCl2 was added, followed by being stirred for 40 min. Subsequently, the system was filtrated, and the filtrate was centrifuged with a high-speed centrifuge for 15 min at 9000 rpm. Then, the supernatant was taken and analyzed using ICP-MS to detect the metal ion content.
The amount of adsorption was measured as follows:
q e q = ( C 0 C e q ) × V m
P A P = C 0 C e q C 0 × 100 %
The Langmuir and Freundlich models were utilized to fit the nonlinear adsorption curves, aiming to better study the relationship between calcium ion adsorption capacity (qeq) and its equilibrium concentration (Ceq). Langmuir isotherm models assume that the solute interacts chemically or physically with the adsorption sites on the surface of the adsorbent. The Freundlich adsorption isotherm is an empirical model, which is based on the assumption that the adsorption sites on the adsorbent surface are heterogeneous and that adsorption is multilayered [22]. The expression is as follows:
q e q = q m a x b C e q 1 + b C e q
q e q = K F C e q 1 / n
where qeq is the proportion of metal ions adsorbed by spodumene per unit mass at the adsorption equilibrium (mg/g); C0 is the primary concentration (mg/L); Ceq is the balanced concentration (mg/L); V is the slurry volume (L); m is the weight (g) of spodumene; PAP is the precipitation adsorption percentage (%); b is the adsorption constant; qmax is the maximum adsorption capacity of metal ions (mg/g); and KF and n are the Freundlich empirical constants that characterize the adsorption capacity and adsorption strength, respectively.

2.5. Contact Angle Measurement

This measurement was carried out using a Theta Flow contact angle measuring instrument (Biolin, Goteborg, Sweden). The spodumene crystals of three colors were cut with a slicing machine to expose new surfaces, and then the crystals were stabilized in a block of epoxy resin with the surface exposed. The crystal surfaces were polished on an AutoMet 250Pro automatic grinding and polishing machine (Chicago, IL, USA) and then washed with deionized water and sequentially immersed in a fixed concentration of metal ions and/or NaOL solution for 40 min. Subsequently, the crystals were rinsed with deionized water and dried with nitrogen gas and then underwent contact angle measurements.

2.6. Atomic Force Microscopy (AFM) Imaging

The spodumene surface morphology in the presence of Ca2+ or NaOL was observed using the AFM-modeled JPK Nanowizard4 (JPK company, Berlin, Germany). The sample was prepared using the same procedure for the contact angle measurements.

2.7. X-Ray Photoelectron Spectroscopy (XPS) Analysis

The test was carried out using AXIS SUPRA XPS (Shimadzu Corporation, Kyoto, Japan). First, 0.5 g samples and an appropriate amount of deionized water were added to a beaker. After being stirred for 2 min, the suspension pH was stabilized using HCl or NaOH. After being stirred for 2 min, appropriate amounts of CaCl2 and NaOL solution were added sequentially, and the solution was mixed for 3 min each. Then, the suspension was filtered, and the solid samples were vacuum dried at 60 °C for 24 h.

2.8. Quantum Chemical Simulation

Quantum chemical calculations were performed using Materials Studio 2018 founded on the density functional theory (DFT). The spodumene unit cell model was constructed using lattice parameters obtained from the American Mineralogist Crystal Structure Database. The (110) face was cut from the unit cell in the CASTEP module and the 2 × 1 × 1 supercell model was created. Based on previous studies [20,21], Fe and Mn are the major impurities for the coloring of spodumene. Chemical composition analysis showed that the Fe/Mn ratio is greater than 1 in the white spodumene, while the Fe/Mn ratio is less than 1 in the purple spodumene and close to 1 in the pink spodumene. This conclusion is consistent with the literature [20,23,24,25]. The two metal cation sites M1 and M2 in the unit cell are aluminum ions and lithium ions, respectively [26,27]. The M1 position can be replaced by the transition metals Mn, Fe, Cr, etc., and M2 is mainly replaced by Na and K [7,28]. Thus, based on the chemical composition analysis, for white spodumene, the M1 position is replaced by two Fe3+ and one Mn2+; for pink spodumene, the M1 position is replaced by one Fe3+ and one Mn2+; and for purple spodumene, the M1 position is replaced by two Mn2+ and one Fe2+. The models of the spodumene surfaces of three colors are shown in Figure 2.
The geometrical optimization and surface energy of the three spodumene samples were calculated using the CASTEP model. The DMol3 module played a role in optimizing the molecular structure of the calcium hydroxides and calculating the energy of the molecules. The adsorption configurations of Ca2+, Ca(OH)+, and Ca(OH)2 on the surface of spodumene of three colors were constructed and the adsorption energies were calculated.
The adsorption energy was calculated as follows [29,30]:
Eads = Esurface+adsorbate − (Esurface + Eadsorbate)

3. Results

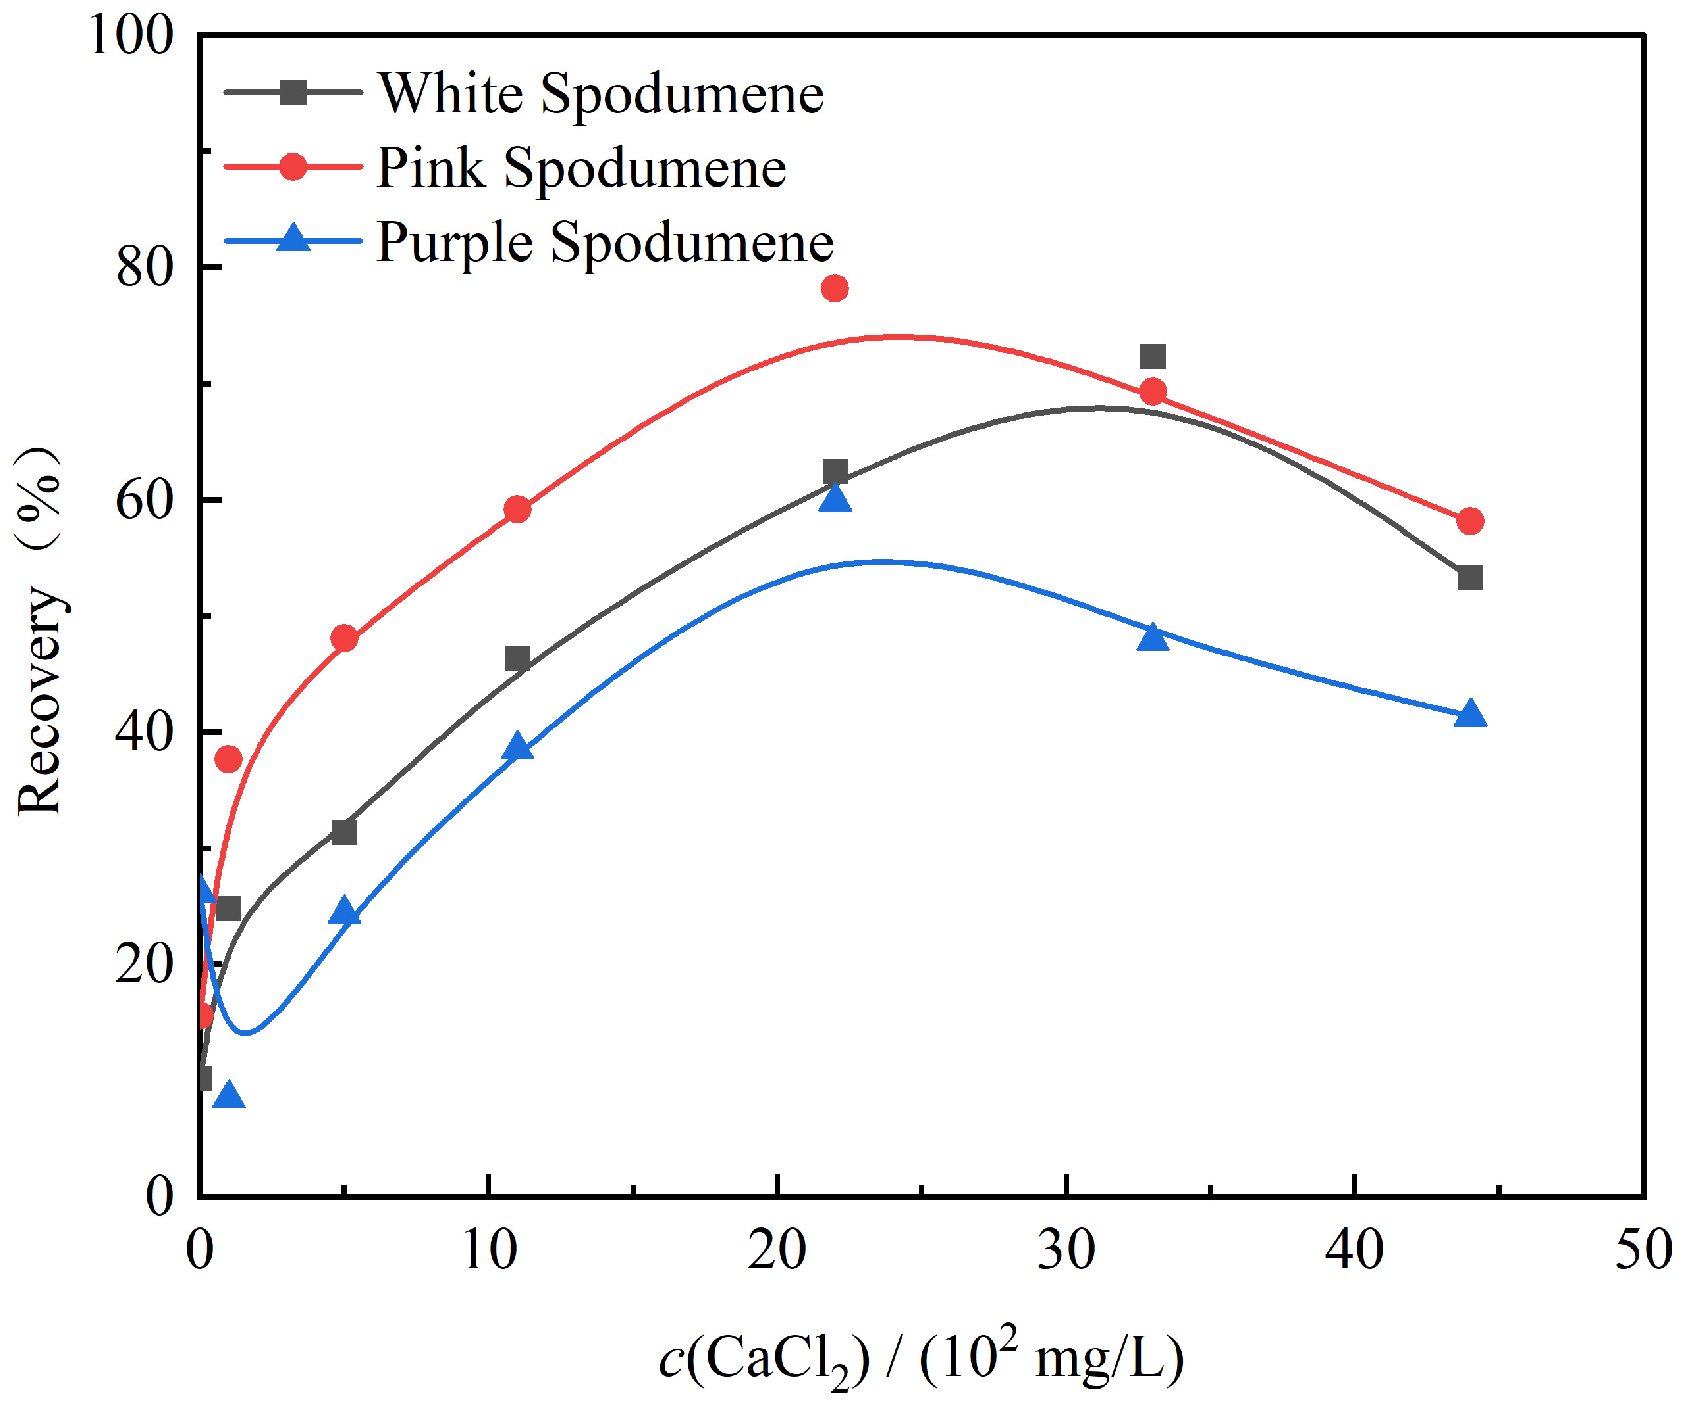
3.1. Microflotation Tests

The microflotation test was conducted using 200 mg/L NaOL as the collector, in the absence of an activator, and the effects of pH in the flotation recoveries of white, pink, and purple spodumene were studied, as shown in Figure 3. As can be seen in Figure 3, the recoveries all increase as the pH rises and peak at about pH = 7 and decrease with the pH rising further. However, it is obvious that there is a difference in the flotation behaviors of the three spodumene samples, and the flotation recoveries in descending order are purple spodumene, pink spodumene, and white spodumene. White spodumene has the lowest flotation recovery rate. As reported [14], the oleate adsorption on the spodumene surface is mainly dominated by the Al sites on the surface. This could be one of the reasons for the flotation differences.
The flotation recoveries of spodumene of three colors as a function of pH in the presence of 100 mg/L CaCl2 and 200 mg/L NaOL are shown in Figure 4. The flotation recoveries show an increasing trend with pH increasing and in descending order are pink, white, and purple spodumene. The recoveries are low when the pH is 6–11, whereas when the pH is increased to 12, the recoveries start to increase significantly, and the highest recovery is achieved at pH 13, with flotation recoveries of 35.97%, 59.06%, and 17.95% for white, pink, and purple spodumene, respectively. This shows that the optimal pH interval for Ca2+ activation is strong alkalinity. Considering industrial practice, the pulp pH is generally about 12, and therefore, at pH 12, the flotation recoveries of spodumene of three colors as a function of CaCl2 dosage in the presence of 200 mg/L NaOL were studied further. As illustrated in Figure 5, CaCl2 dosage has a significant role in spodumene flotation, and as the CaCl2 dosage increases, the flotation recoveries for the three spodumene samples first increase and then decrease. The optimal CaCl2 dosages for white, pink, and purple spodumene are 3.3 × 10² mg/L, 2.2 × 10² mg/L, and 2.2 × 10² mg/L, respectively. The highest recovery values of pink, white, and purple spodumene flotation are 74.19%, 72.33%, and 59.86%, respectively.

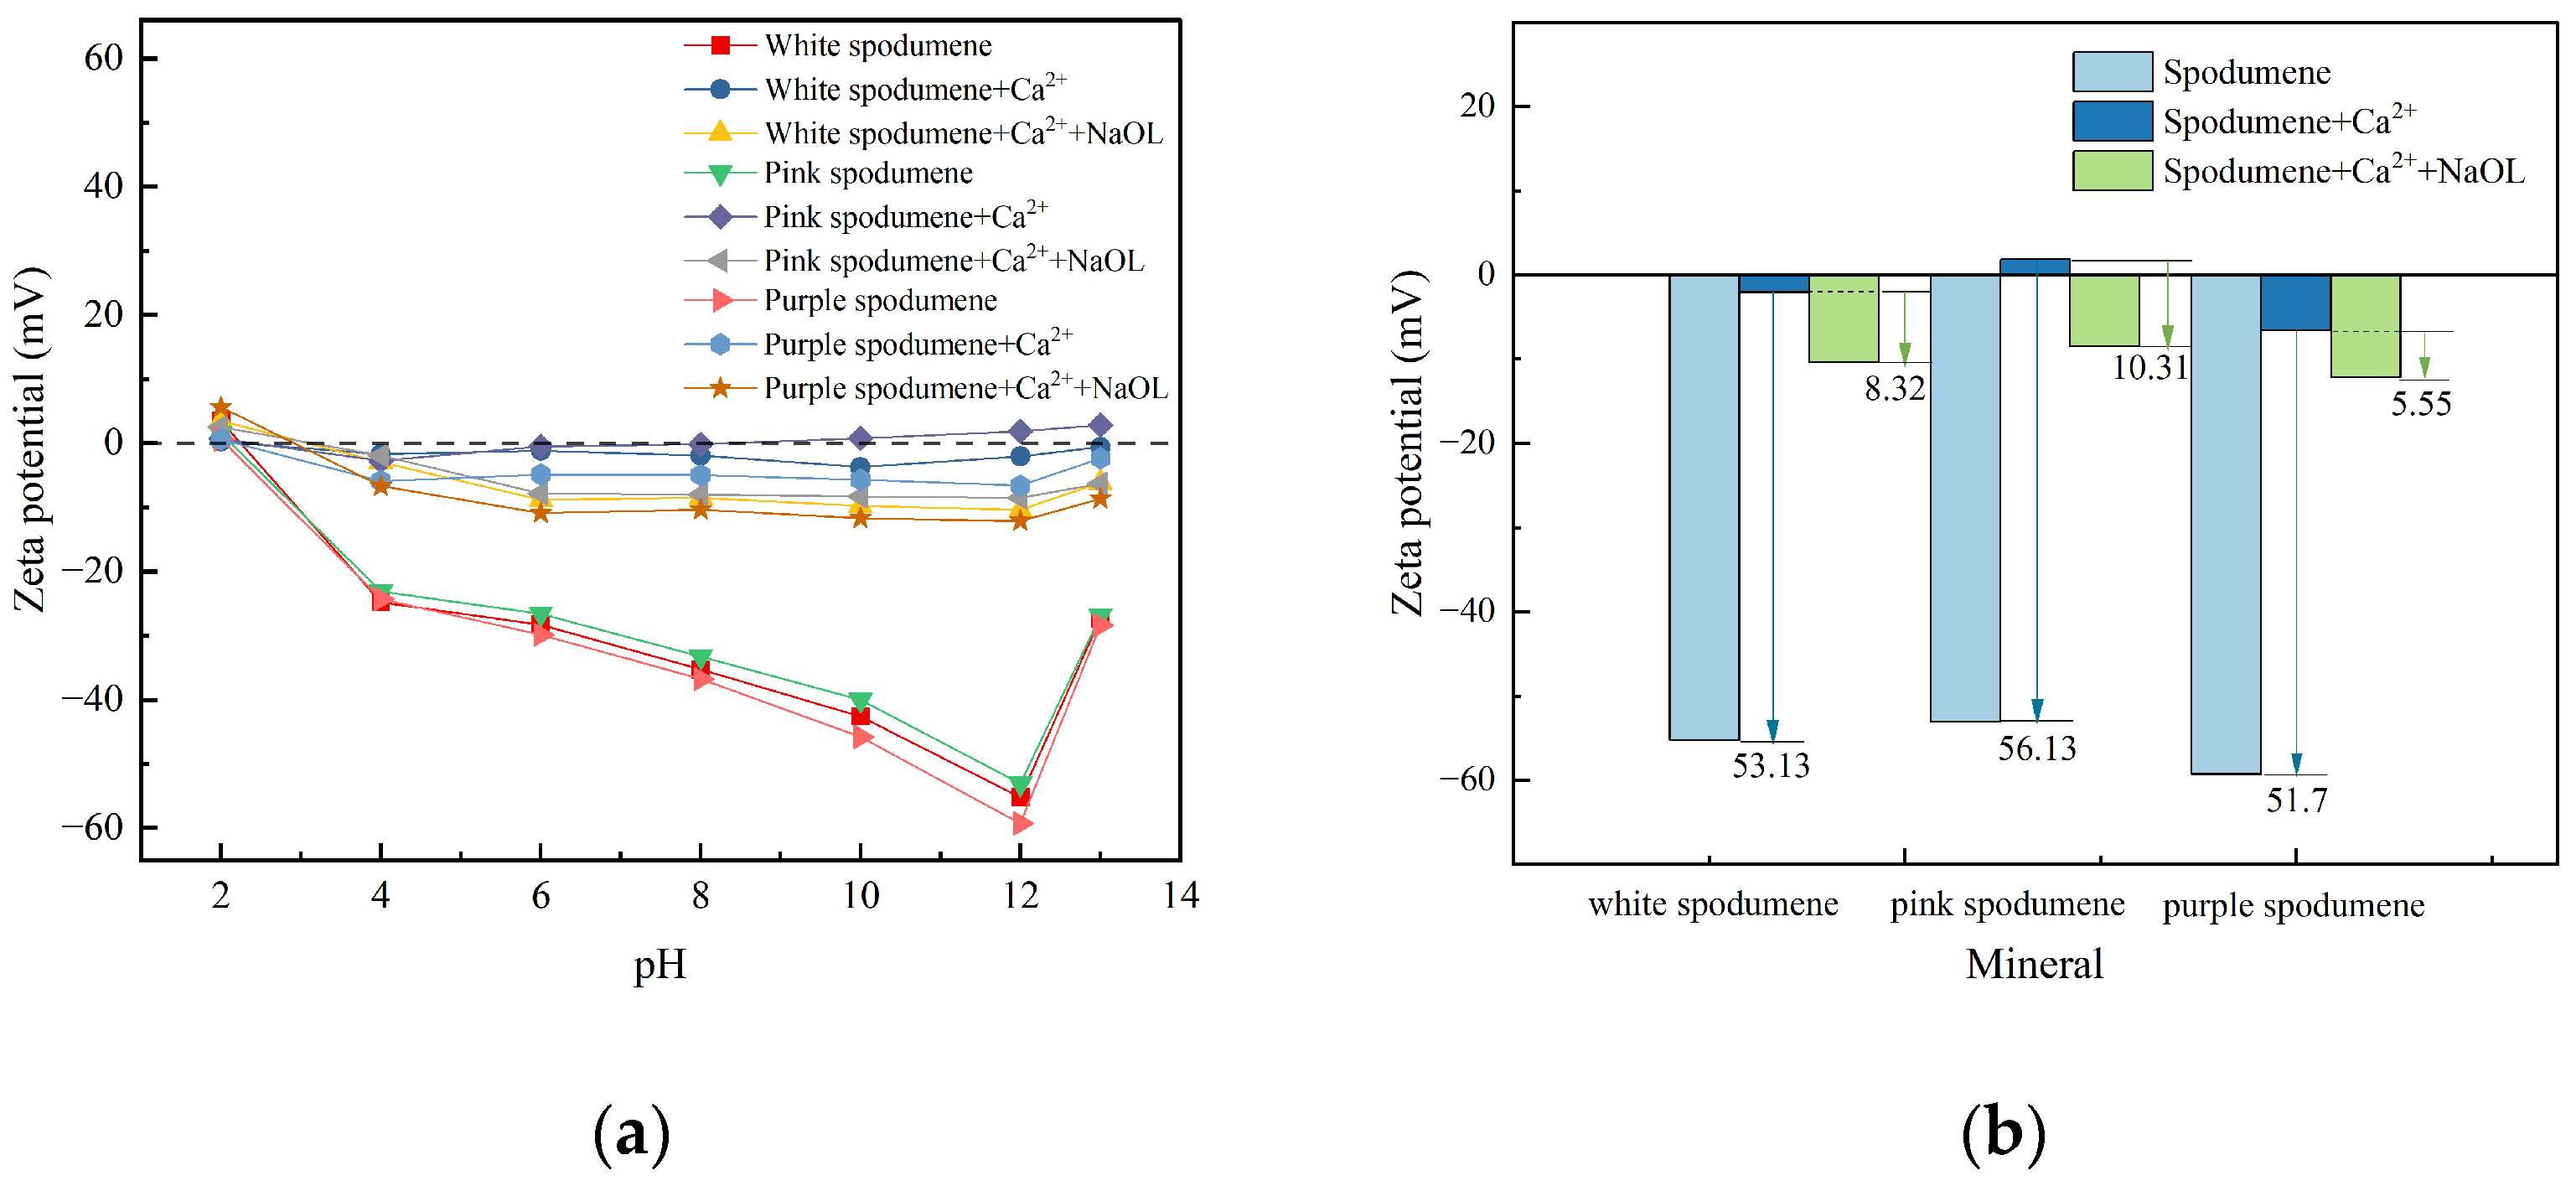
3.2. Zeta-Potential Analysis

Figure 6a shows, in the presence and absence of Ca(II) ions, the zeta-potentials of spodumene as a function of pH with or without NaOL. The points of zero charge (PZC) of white, pink, and purple pure spodumene occur at pH 2.10, 2.19, and 2.04, respectively. However, the PZC of spodumene is reported to be around 2.8 [31,32], and this may be due to the different origins of spodumene. The zeta potentials decrease with pH increasing and reach their most negative potential at pH 12, consistent with reports [33,34,35,36]. In the presence of Ca2+, the zeta potentials move positively as a whole, indicating that Ca2+ is adsorbed on the negatively charged surface due to electrostatic attraction. The zeta potentials of spodumene exhibit an overall negative shift in the presence of NaOL. This is due to the adsorption of anionic OL on the spodumene surface, which decreases the surface positive charge, thus lowering the zeta potential.
Figure 6b shows the difference in zeta potentials with and without NaOL and Ca2+ at pH 12. As can be seen, after the action of Ca2+, the potential difference values of the three spodumene samples in descending order are pink, white, and purple spodumene. After NaOL addition, the zeta potentials for the three spodumene become more negative, and the potential difference values in descending order are pink, white, and purple spodumene, consistent with the flotation results.

3.3. Species Distribution Analysis

In solution, metal ions undergo hydrolysis, resulting in various hydroxyl complexes and hydroxide precipitates [37,38,39]. The concentrations of the hydrolysis component of calcium ions as a function of pH were calculated and the results are shown in Figure 7. From Figure 7a, it can be seen that for a solution of calcium ions with a density of 2 × 10⁻² mol/L, Ca2+ is the main hydrolyzed component in the range of solution pH of 2–12.241. Ca(OH)+ and Ca(OH)2(aq) begin to appear in the solution at pH > 4.3 and pH > 8.4, respectively, and the concentrations rise with the pH increasing. At pH > 12.241, the calcium hydroxide precipitates Ca(OH)2(s) form, with Ca(OH)+ and Ca(OH)2(aq) as the main hydrolyzed components. For the calcium ion solution with a density of 3 × 10⁻² mol/L, the species distribution is similar to that of CT = 2 × 10⁻² mol/L, and Ca2+, Ca(OH)+, and Ca(OH)2(aq) are the main components at pH 12.

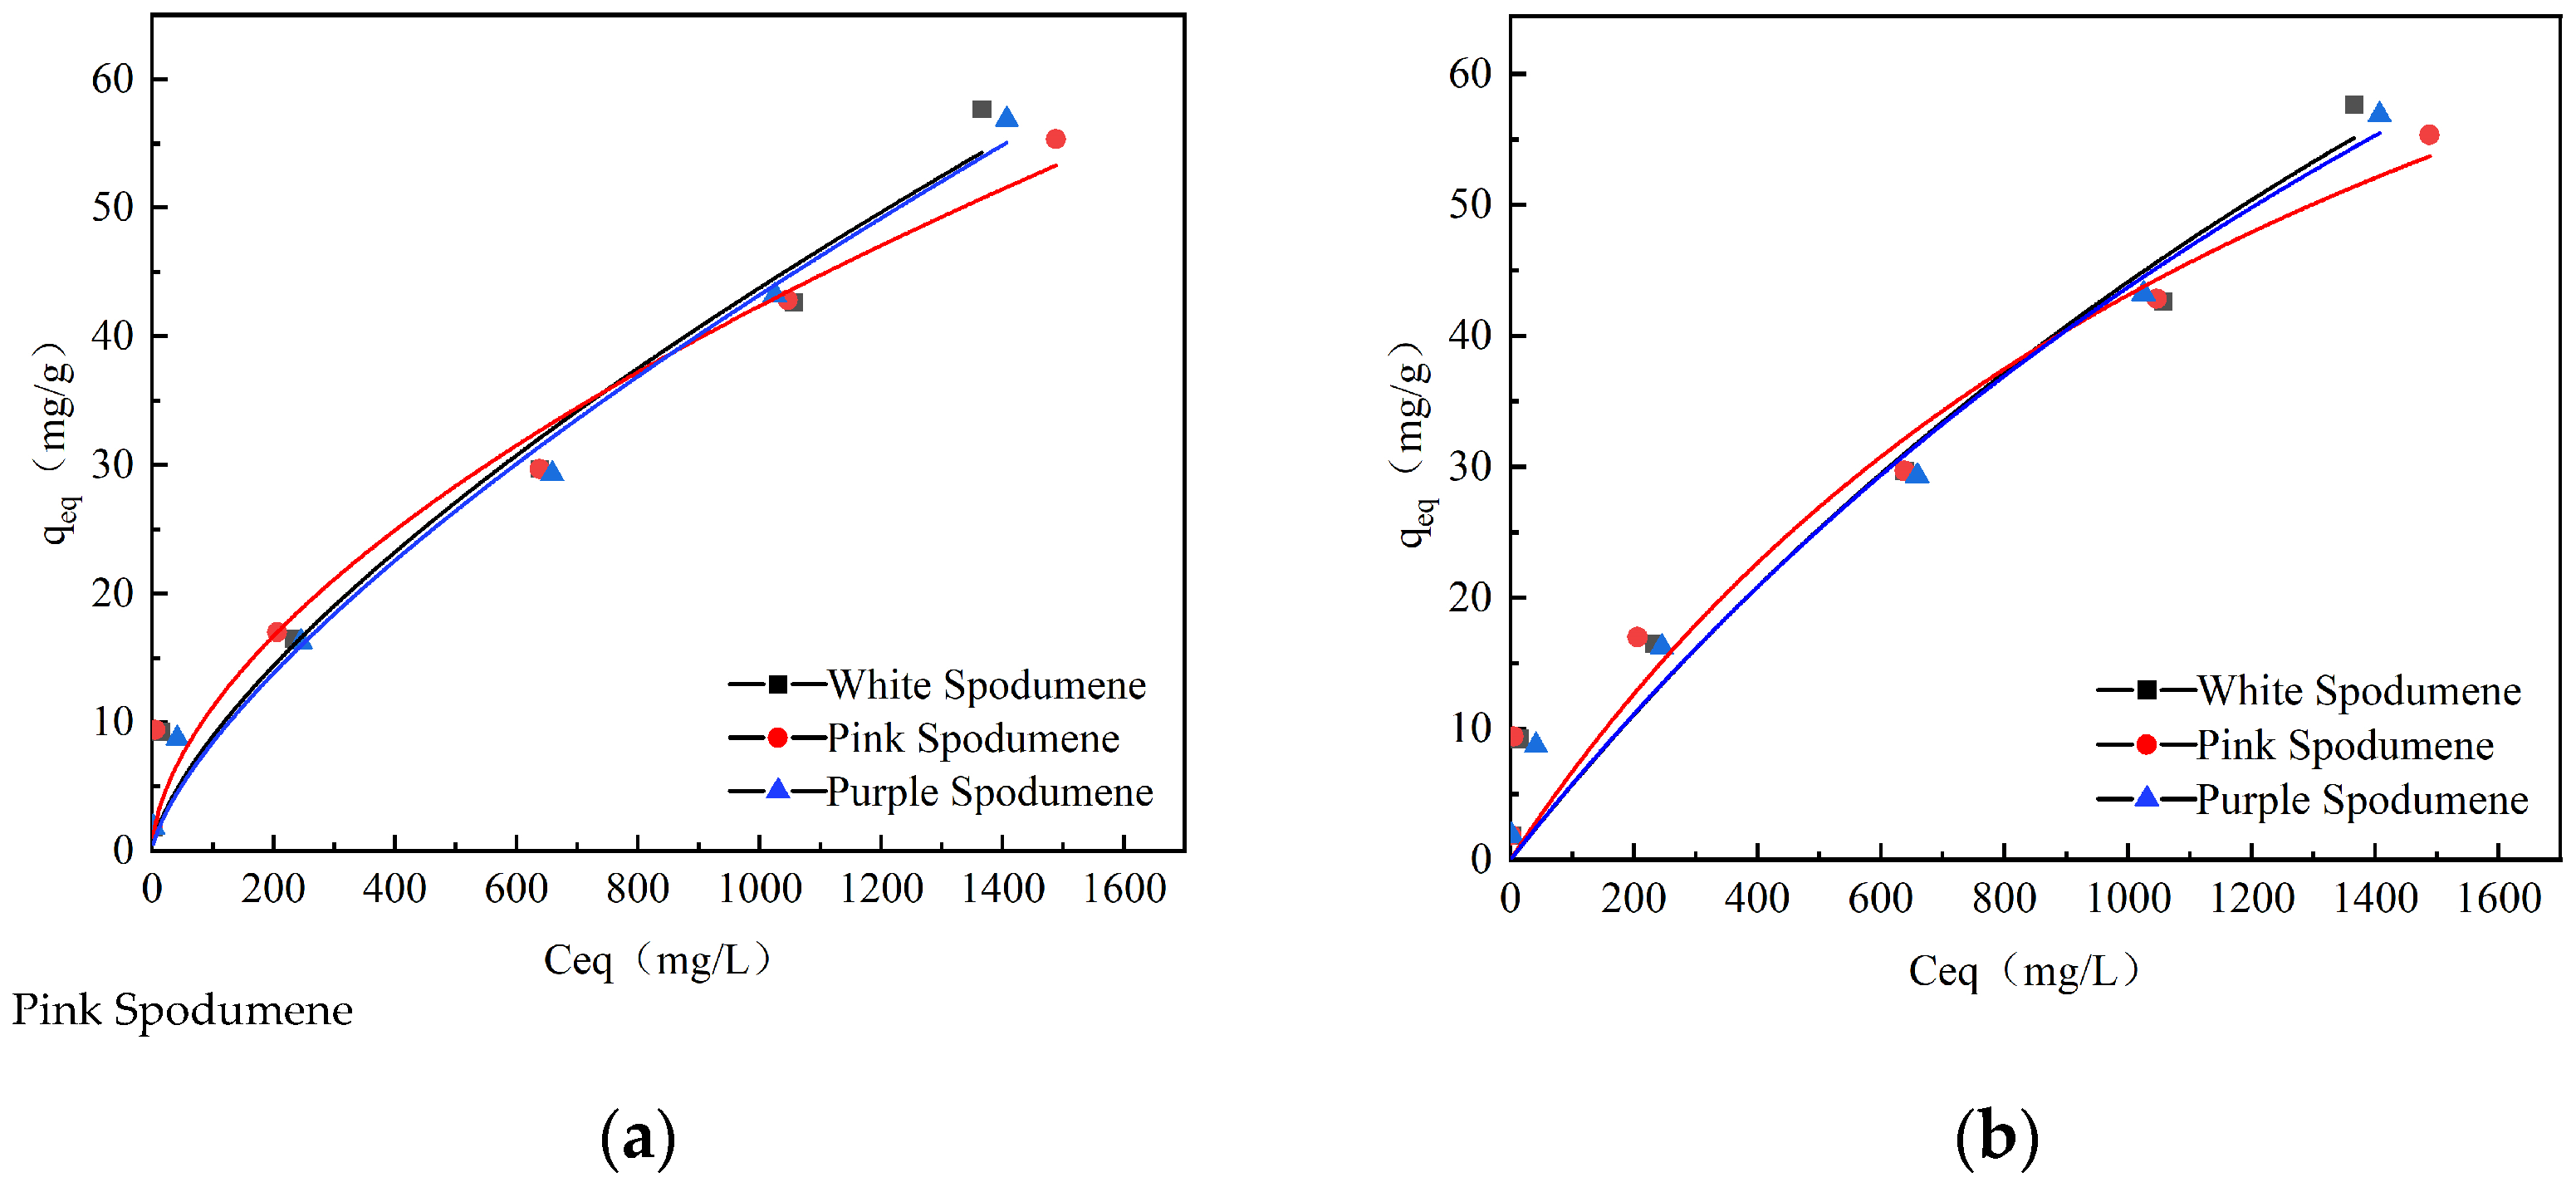
3.4. Adsorption Capacity Measurements

Ca2+ adsorption on the spodumene surfaces as a function of CaCl2 dosage at pH 12 is shown in Figure 8. The adsorption amount of Ca2+ increases with the CaCl2 dosage increasing. The fitting curves and related parameters of Freundlich and Langmuir obtained through fitting analysis are shown in Figure 9 and Table 2. The Freundlich fit variance R2 is generally higher than the Langmuir fit variance for the three spodumene samples, where R2 represents the degree to which the model fits the experimental data. This indicates that the experimental results are in better anastomosis with the Freundlich adsorption isothermal model. Based on the Freundlich model assumption, the adsorption behavior of calcium ions on the spodumene surface at pH 12 is not limited to monolayer adsorption. KF characterizes the adsorption capacity, and the KF values of white, pink, and purple spodumene are 0.37, 0.78, and 0.32, respectively, indicating that calcium ions have a stronger adsorption ability on the pink spodumene surface. Based on this, it was hypothesized that the flotation of pink spodumene would be better than the white and purple spodumene, which is consistent with the flotation results.

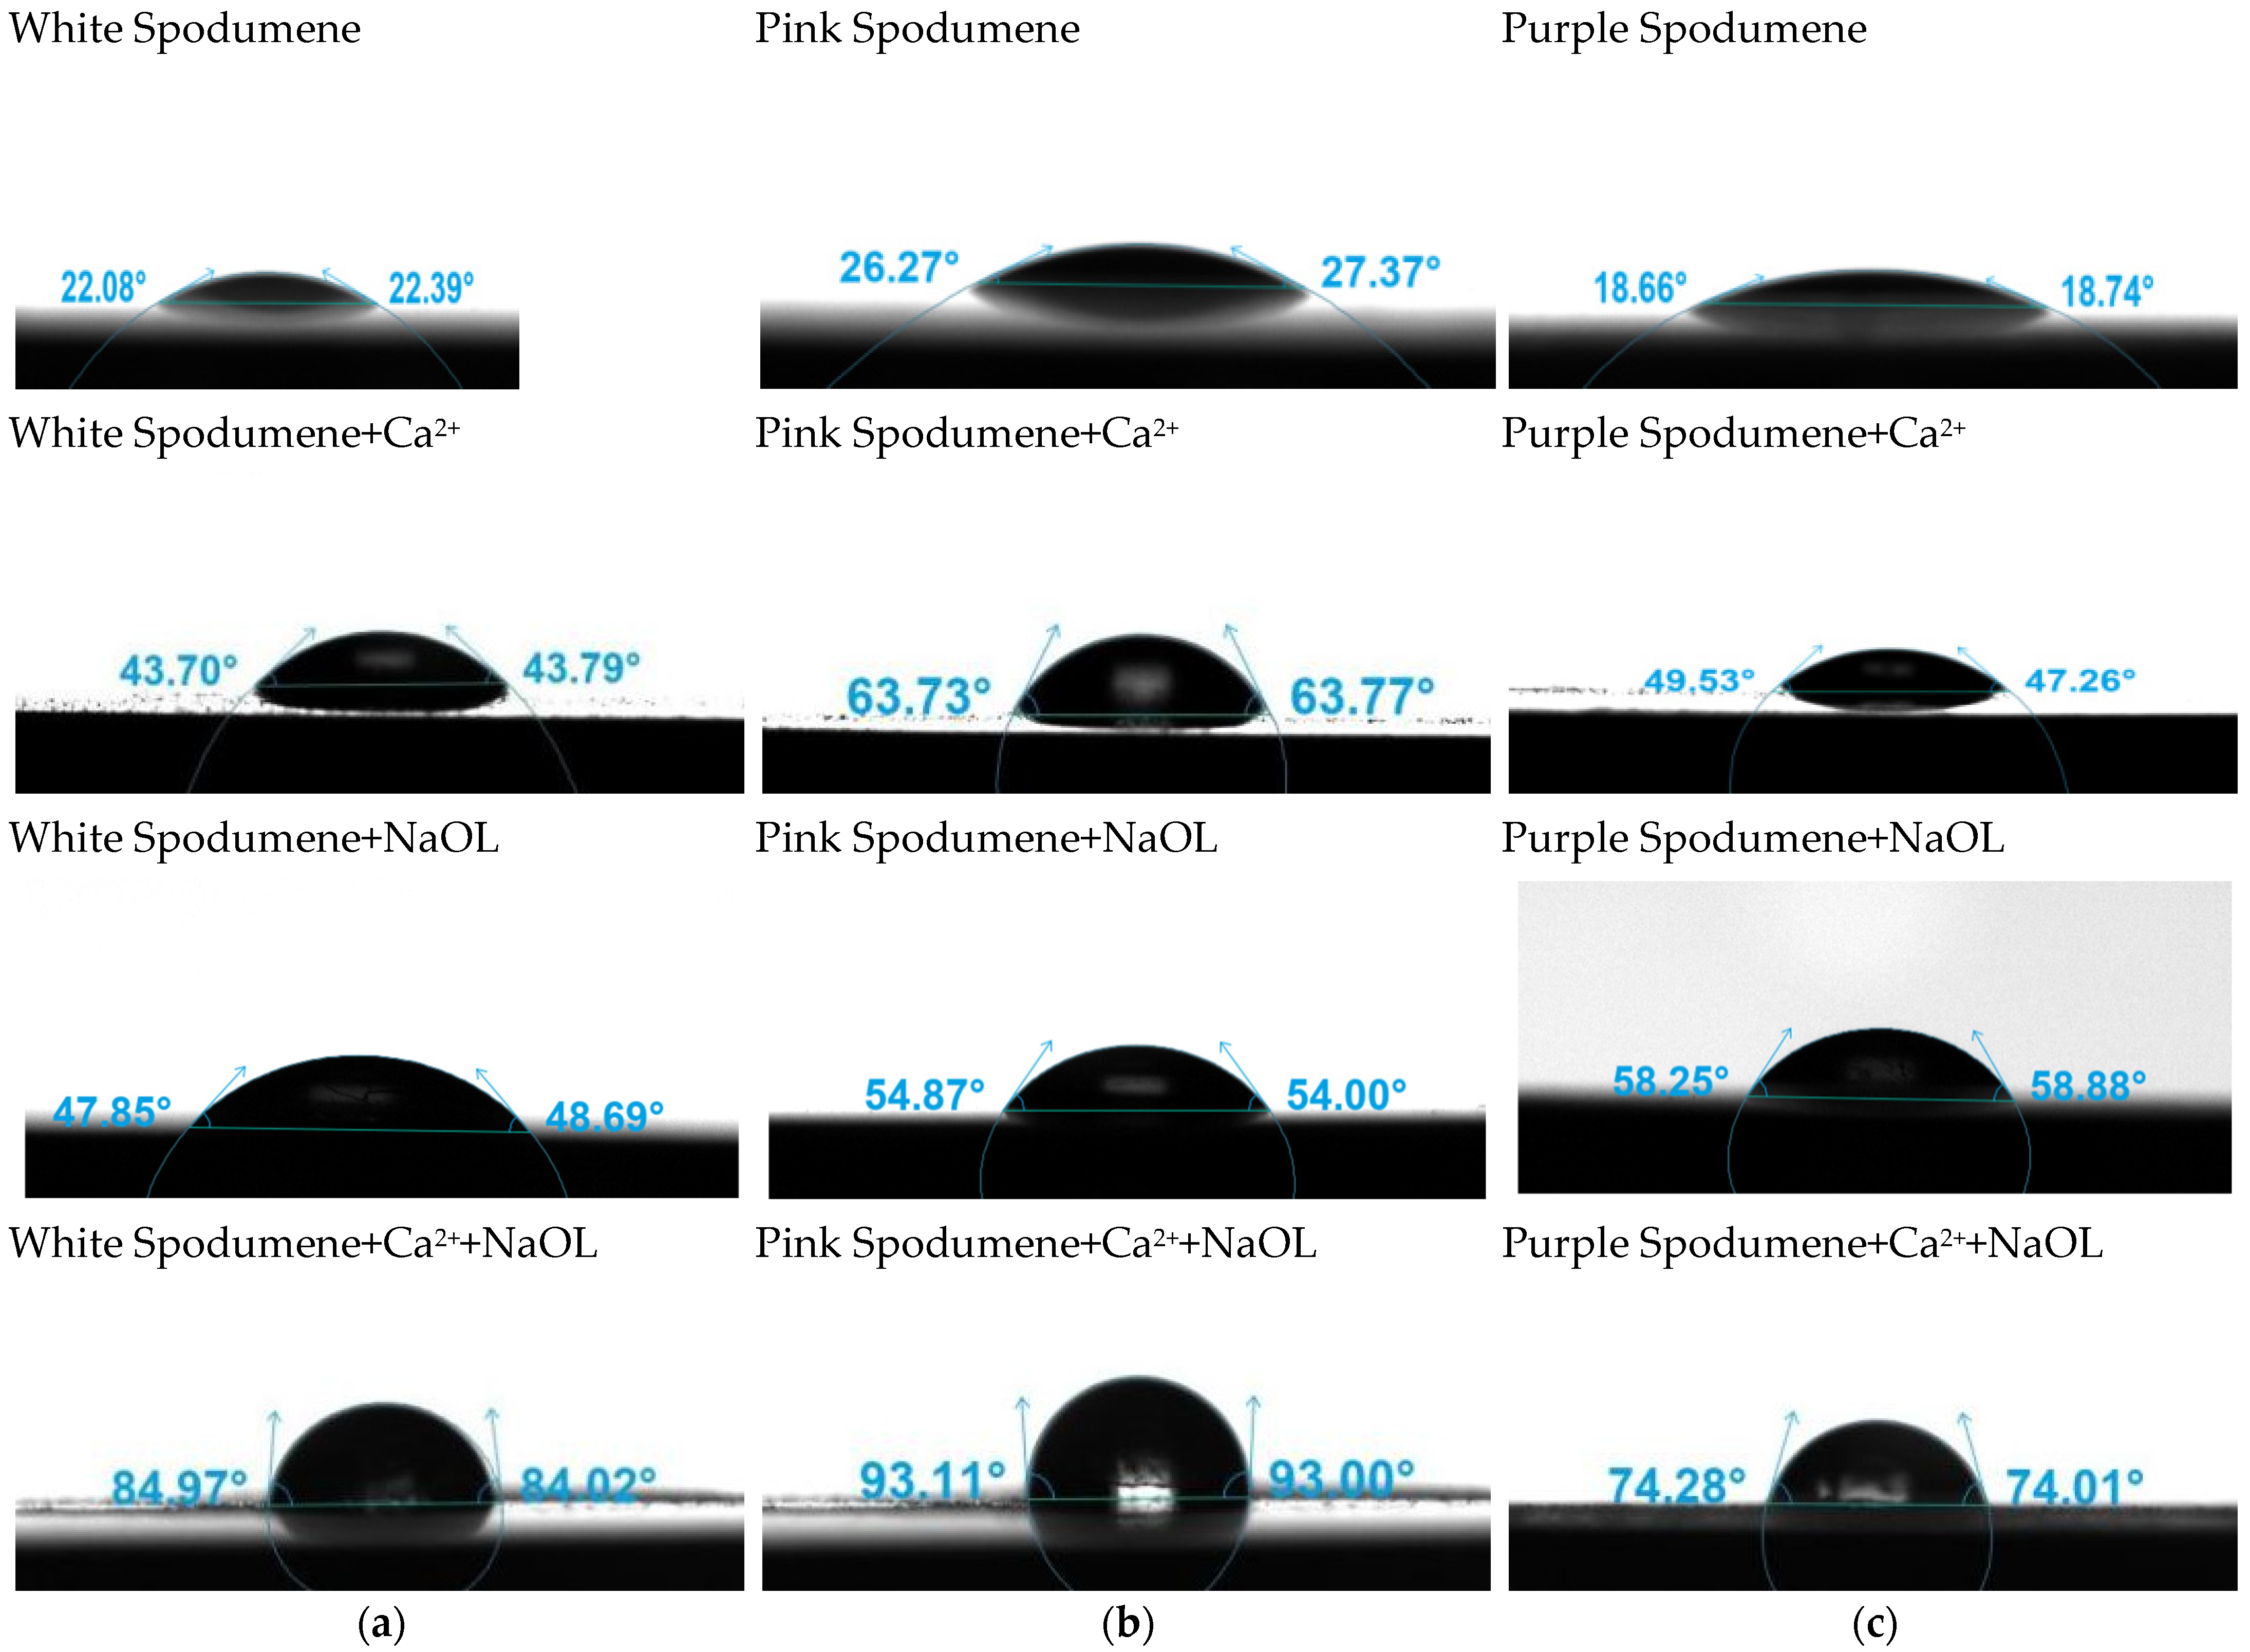
3.5. Contact Angle Analysis
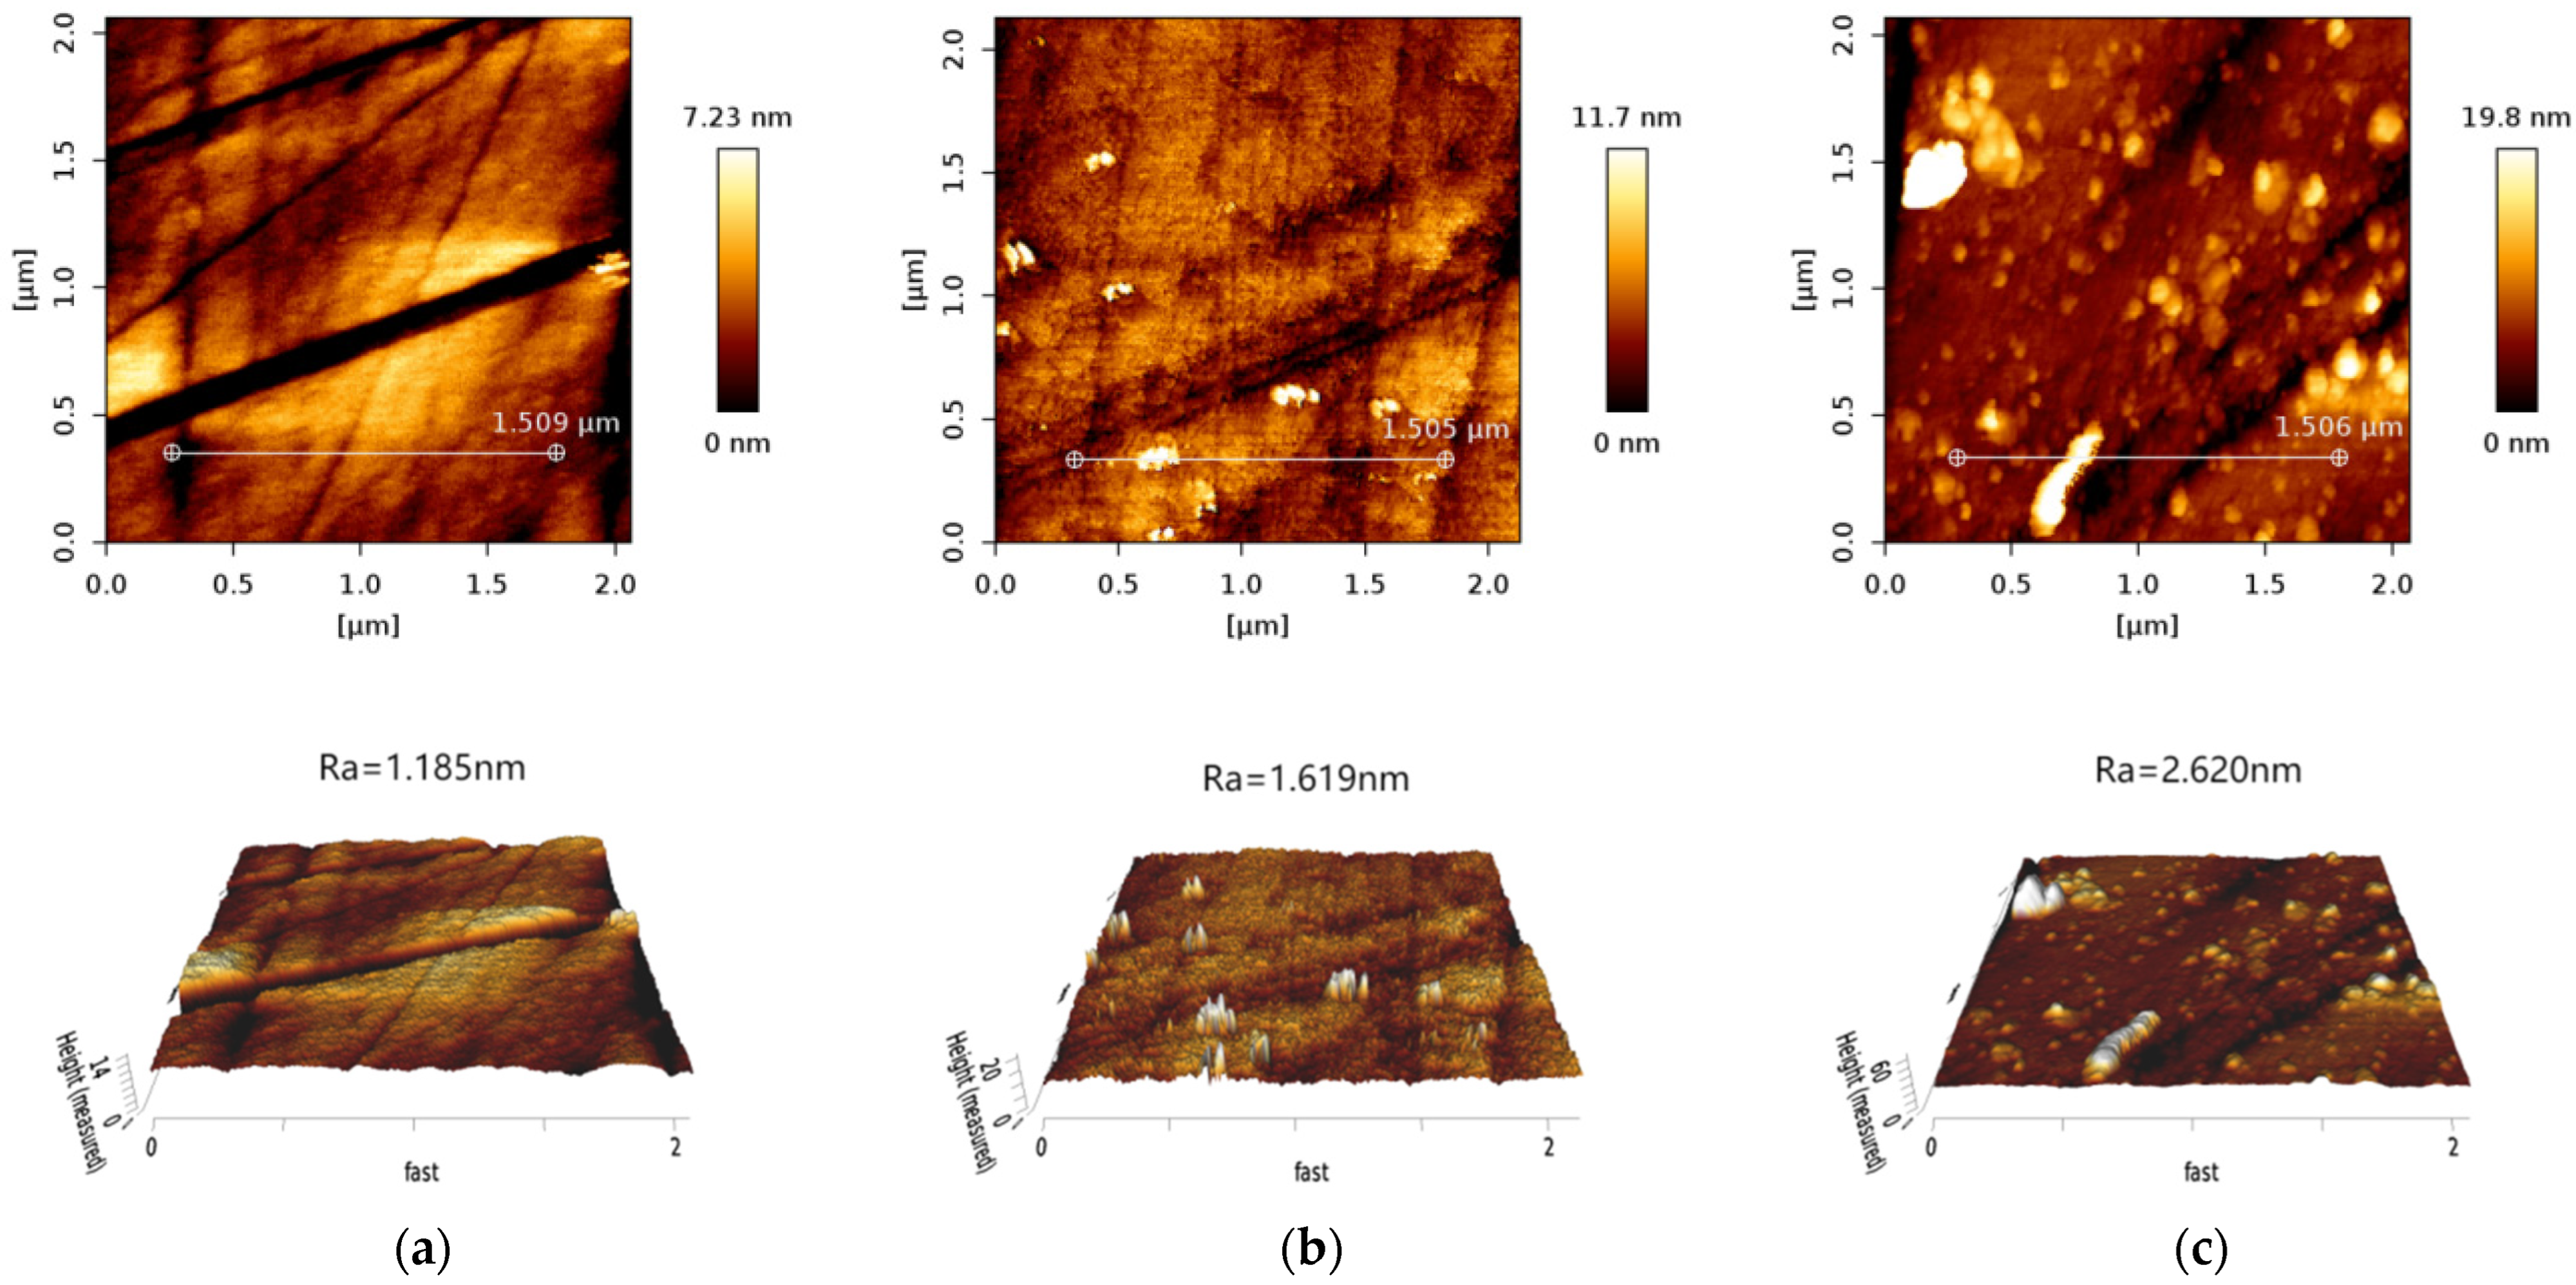
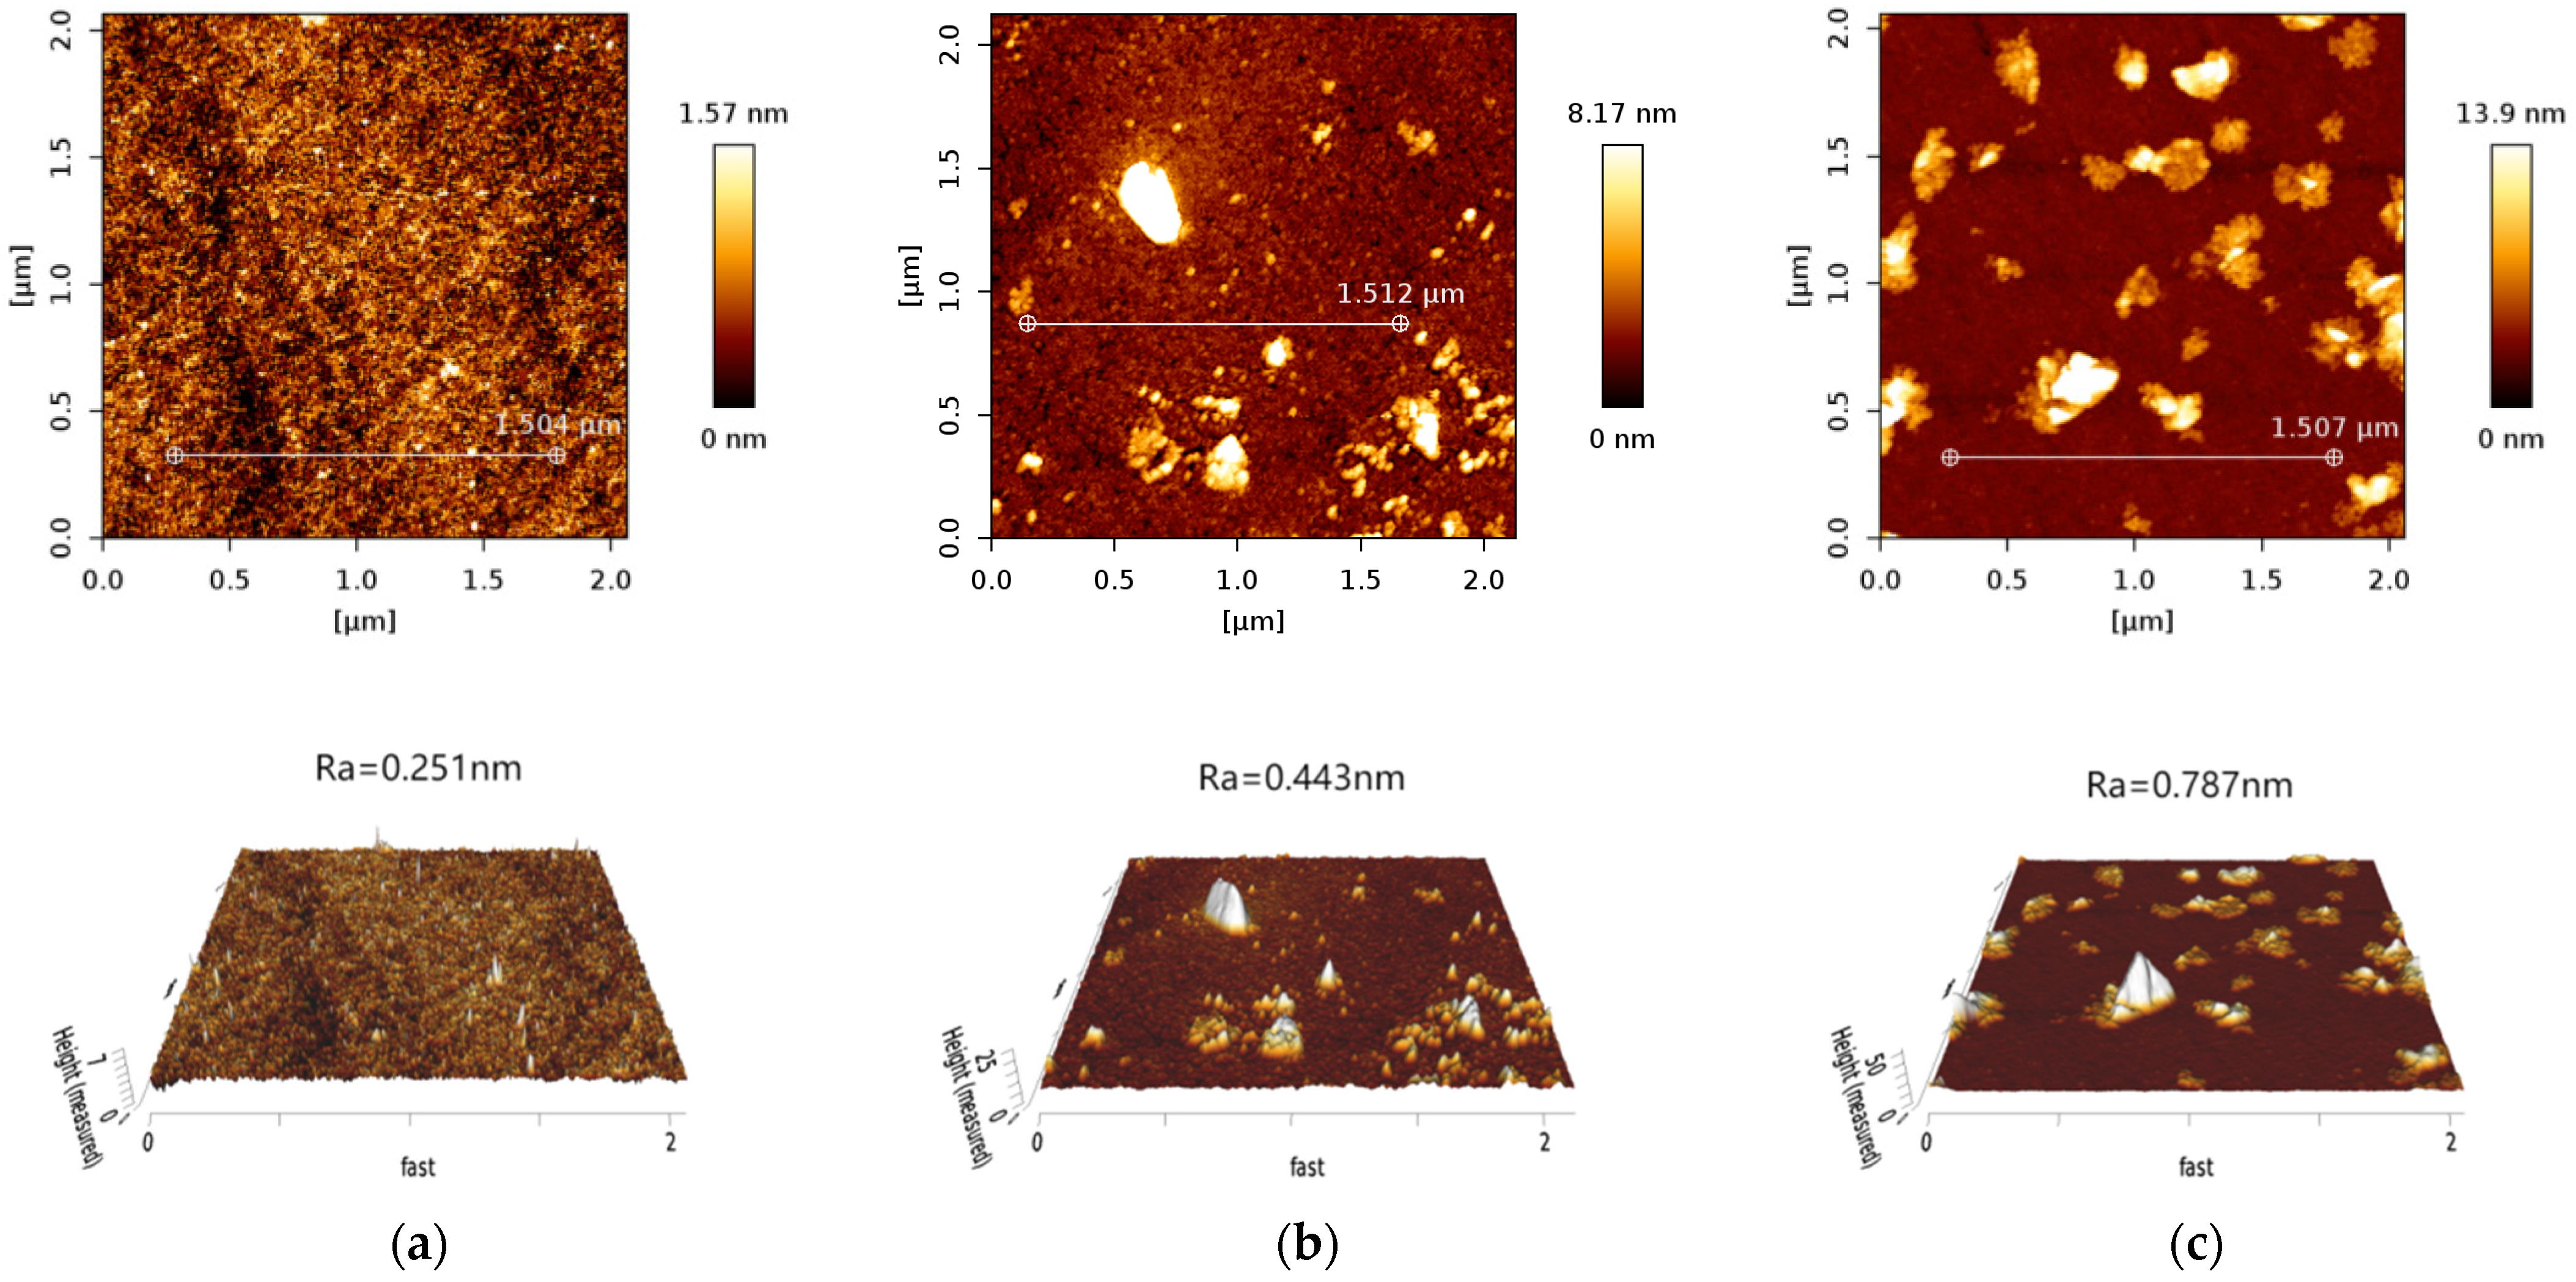
The contact angles are illustrated in Figure 10. The hydrophobicity of the three spodumene samples in descending order is pink, white, and purple. After the addition of Ca2+, the contact angle on the spodumene surface goes up. For white, pink, and purple spodumene, the average contact angles are 43.75°, 63.75°, and 48.40°, respectively. When treated with NaOL only, the average contact angles for white, pink, and purple spodumene surfaces are 48.27°, 54.43°, and 58.57°, respectively. After Ca2+ and NaOL treatment, the contact angles on the surface of all three spodumene samples reach more than 75°, and the surface contact angles for white, pink, and purple spodumene are 84.50°, 93.06°, and 74.15°, respectively. The contact angle on the surface of pink spodumene is larger, indicating that the pink spodumene has greater hydrophobicity, which is in agreement with the micro-flotation tests.

3.6. AFM Analysis

The surface morphology of the white, pink, and purple spodumene samples before and after the interaction with calcium ions and sodium oleate is shown in Figure 11a, Figure 12a and Figure 13a. The surface roughness of spodumene before and after the action of Ca2+ and NaOL is presented in Table 3. Before reagent addition, the maximum height and average roughness Ra on the surface of white, pink, and purple spodumene are 1.2 nm and 0.209 nm, 7.23 nm and 1.185 nm, and 1.57 nm and 0.251 nm, respectively, which indicates that the surfaces of the polished spodumene are relatively smooth, with only a few small bumpy grains. As shown in Figure 11b, Figure 12b and Figure 13b, in the presence of Ca2+, the surfaces of spodumene are very rough, indicative of Ca2+ adsorption. After the addition of NaOL, as shown in Figure 11c, Figure 12c and Figure 13c, the surface roughness increases, and there are little dots that spread evenly on the spodumene surface, illustrating that NaOL is uniformly adsorbed on the surface. The increase in roughness indicated NaOL adsorption, and the maximum height and average roughness on the surface of white, pink, and purple spodumene after NaOL treatment reached 15.2 nm and 0.910 nm, 19.8 nm and 2.620 nm, 13.9 nm and 0.787 nm, respectively, which indicates that there was NaOL adsorption on the three spodumene surfaces and that there may be more NaOL adsorption on the surface of the pink spodumene, consistent with the flotation results.

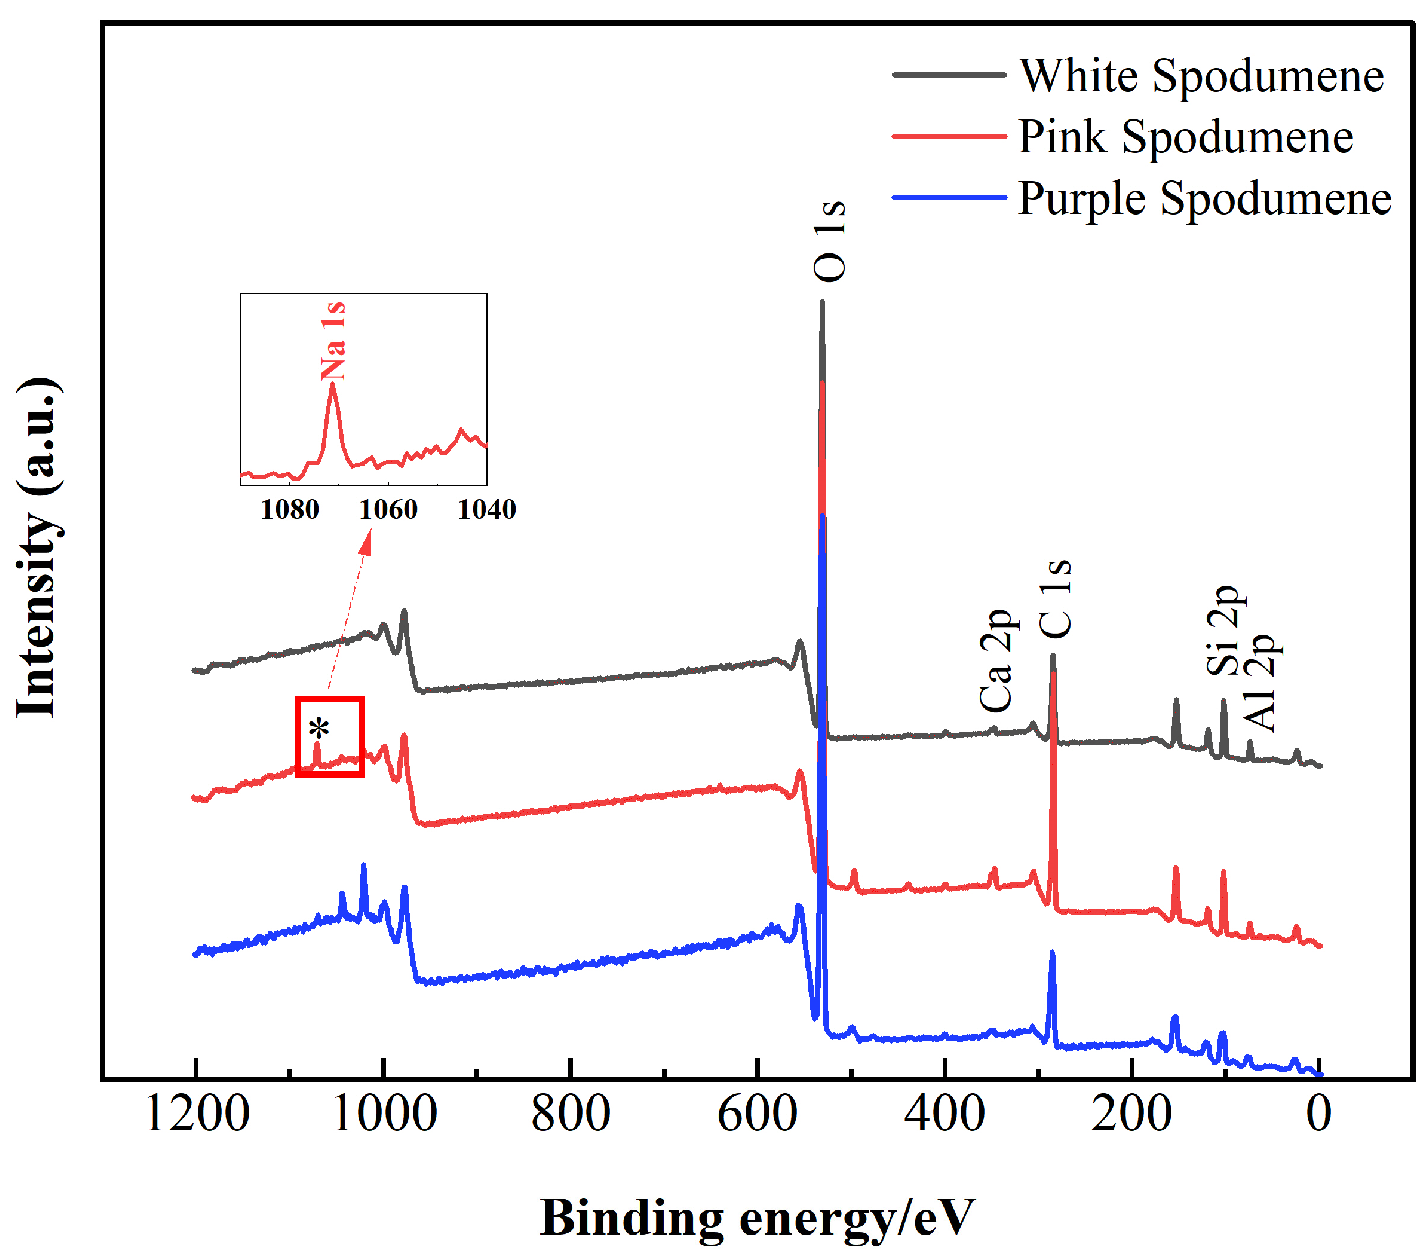
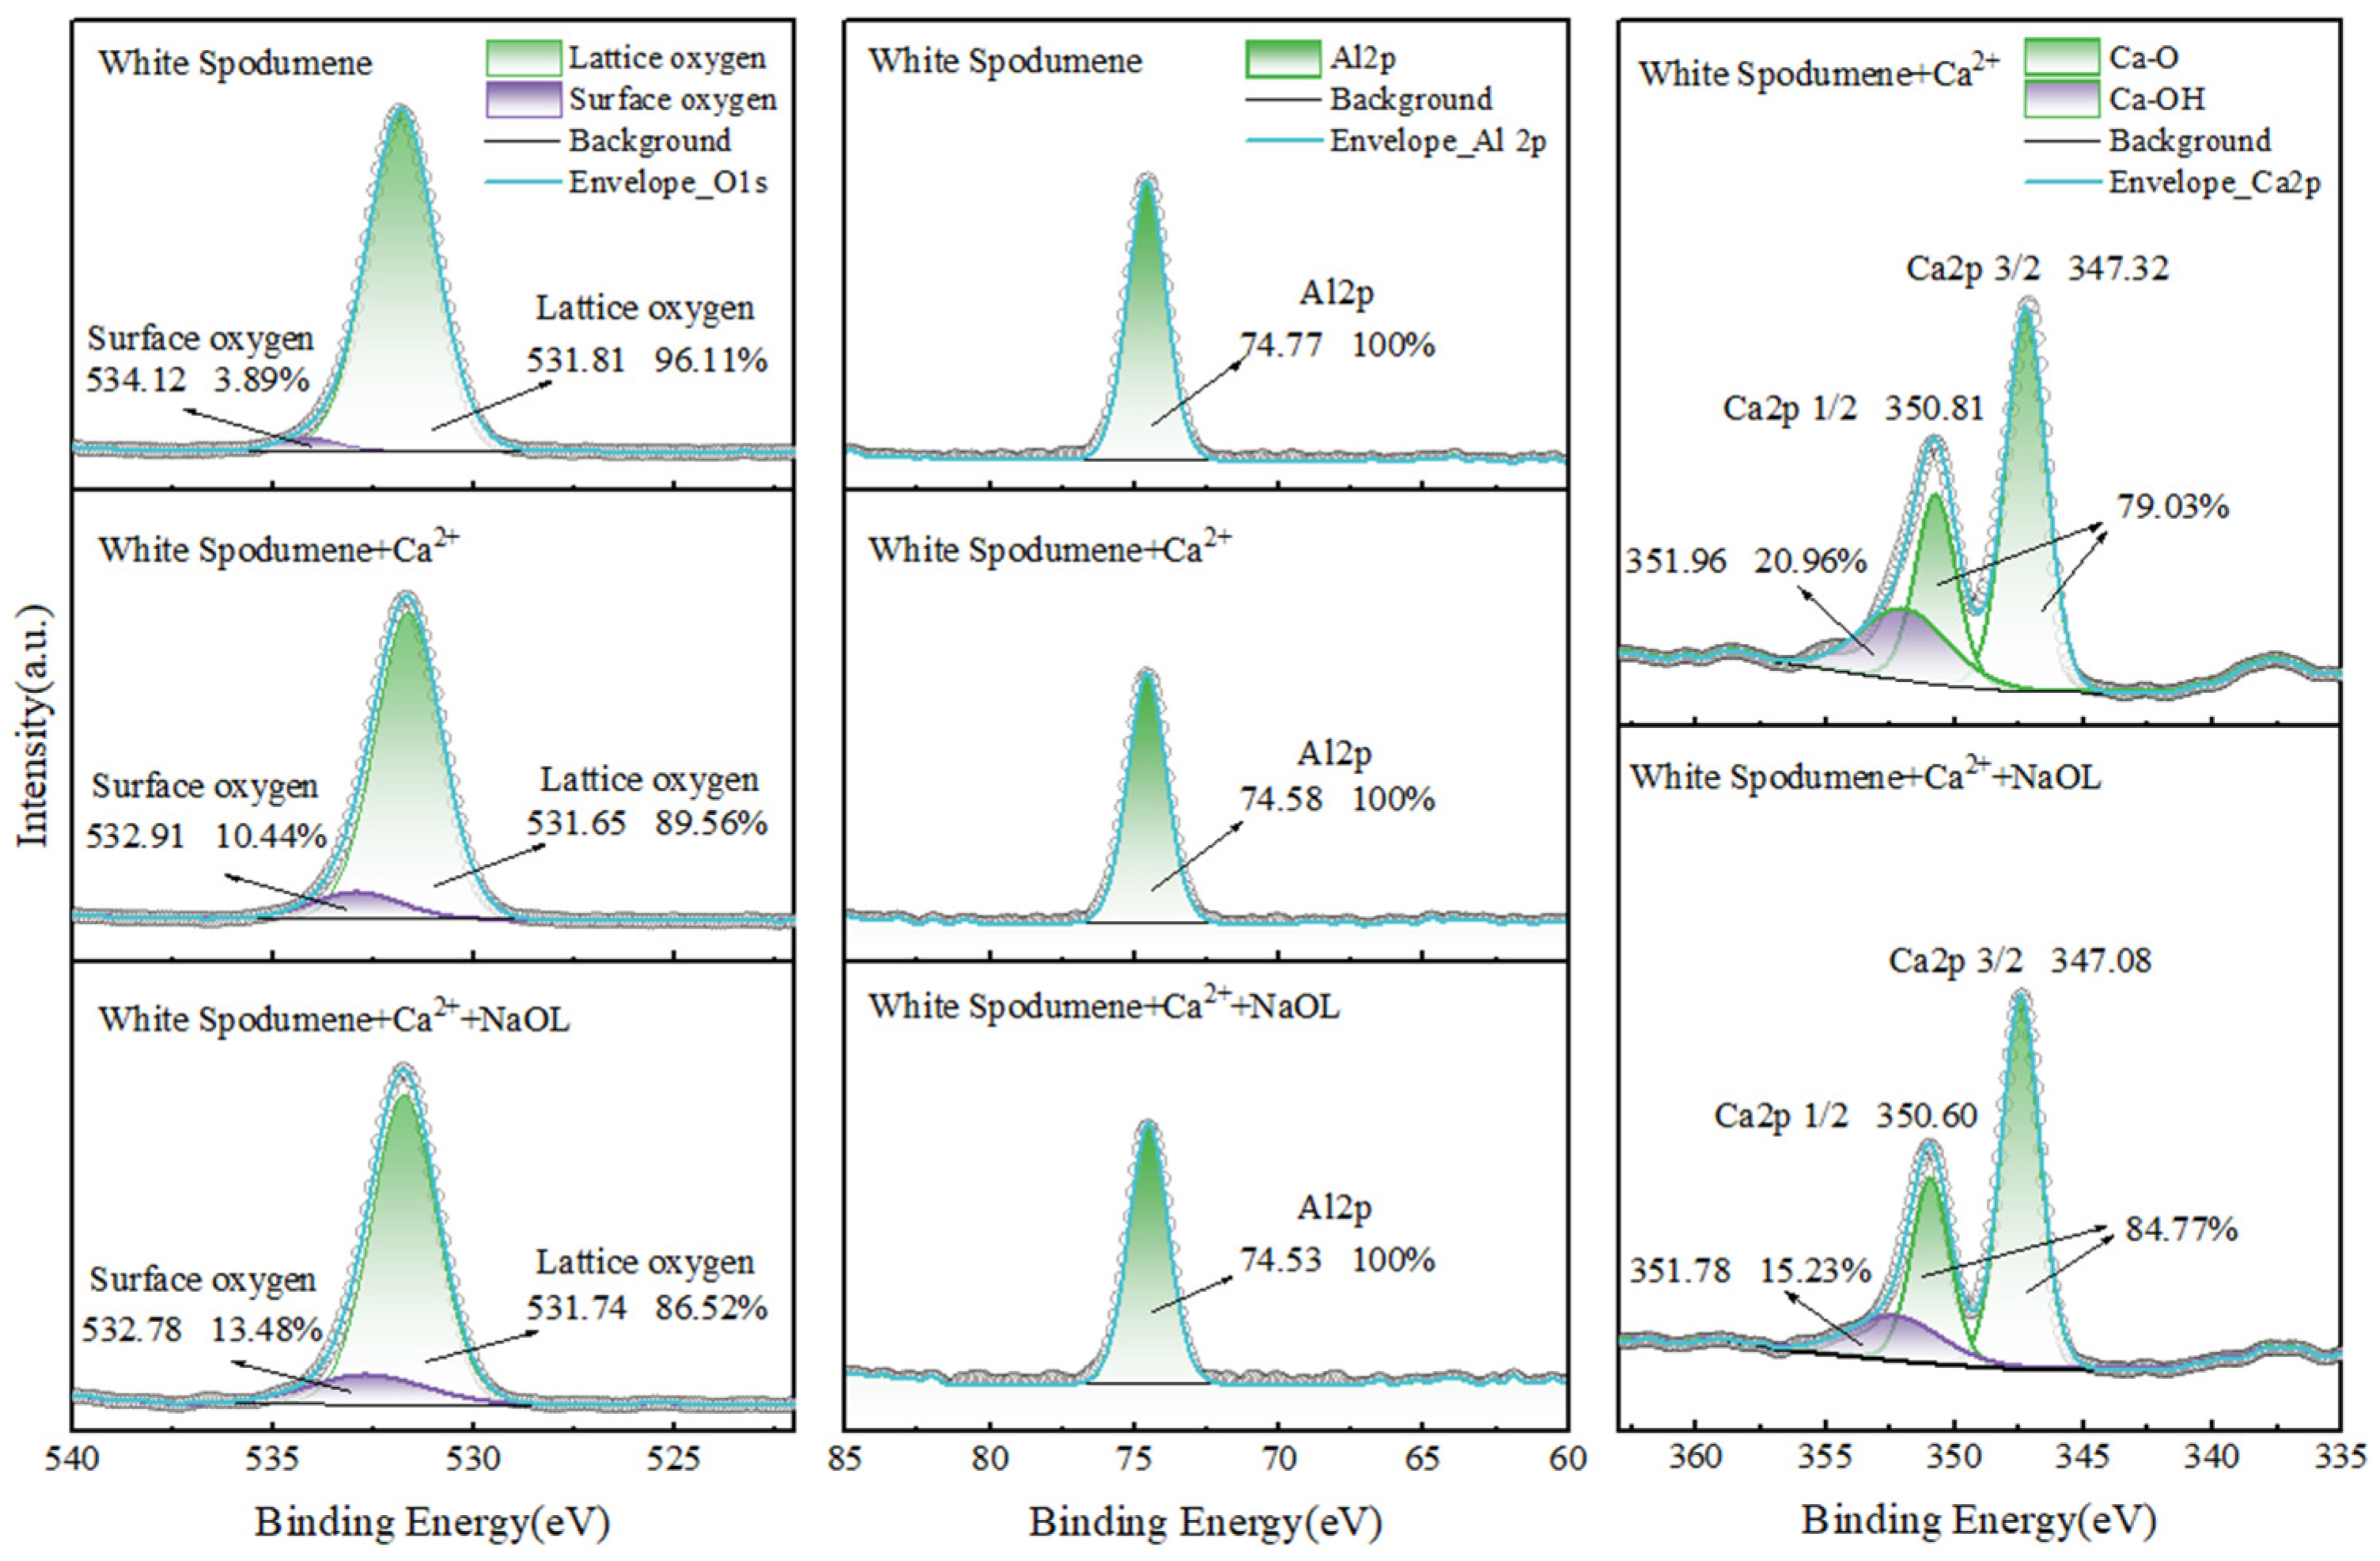
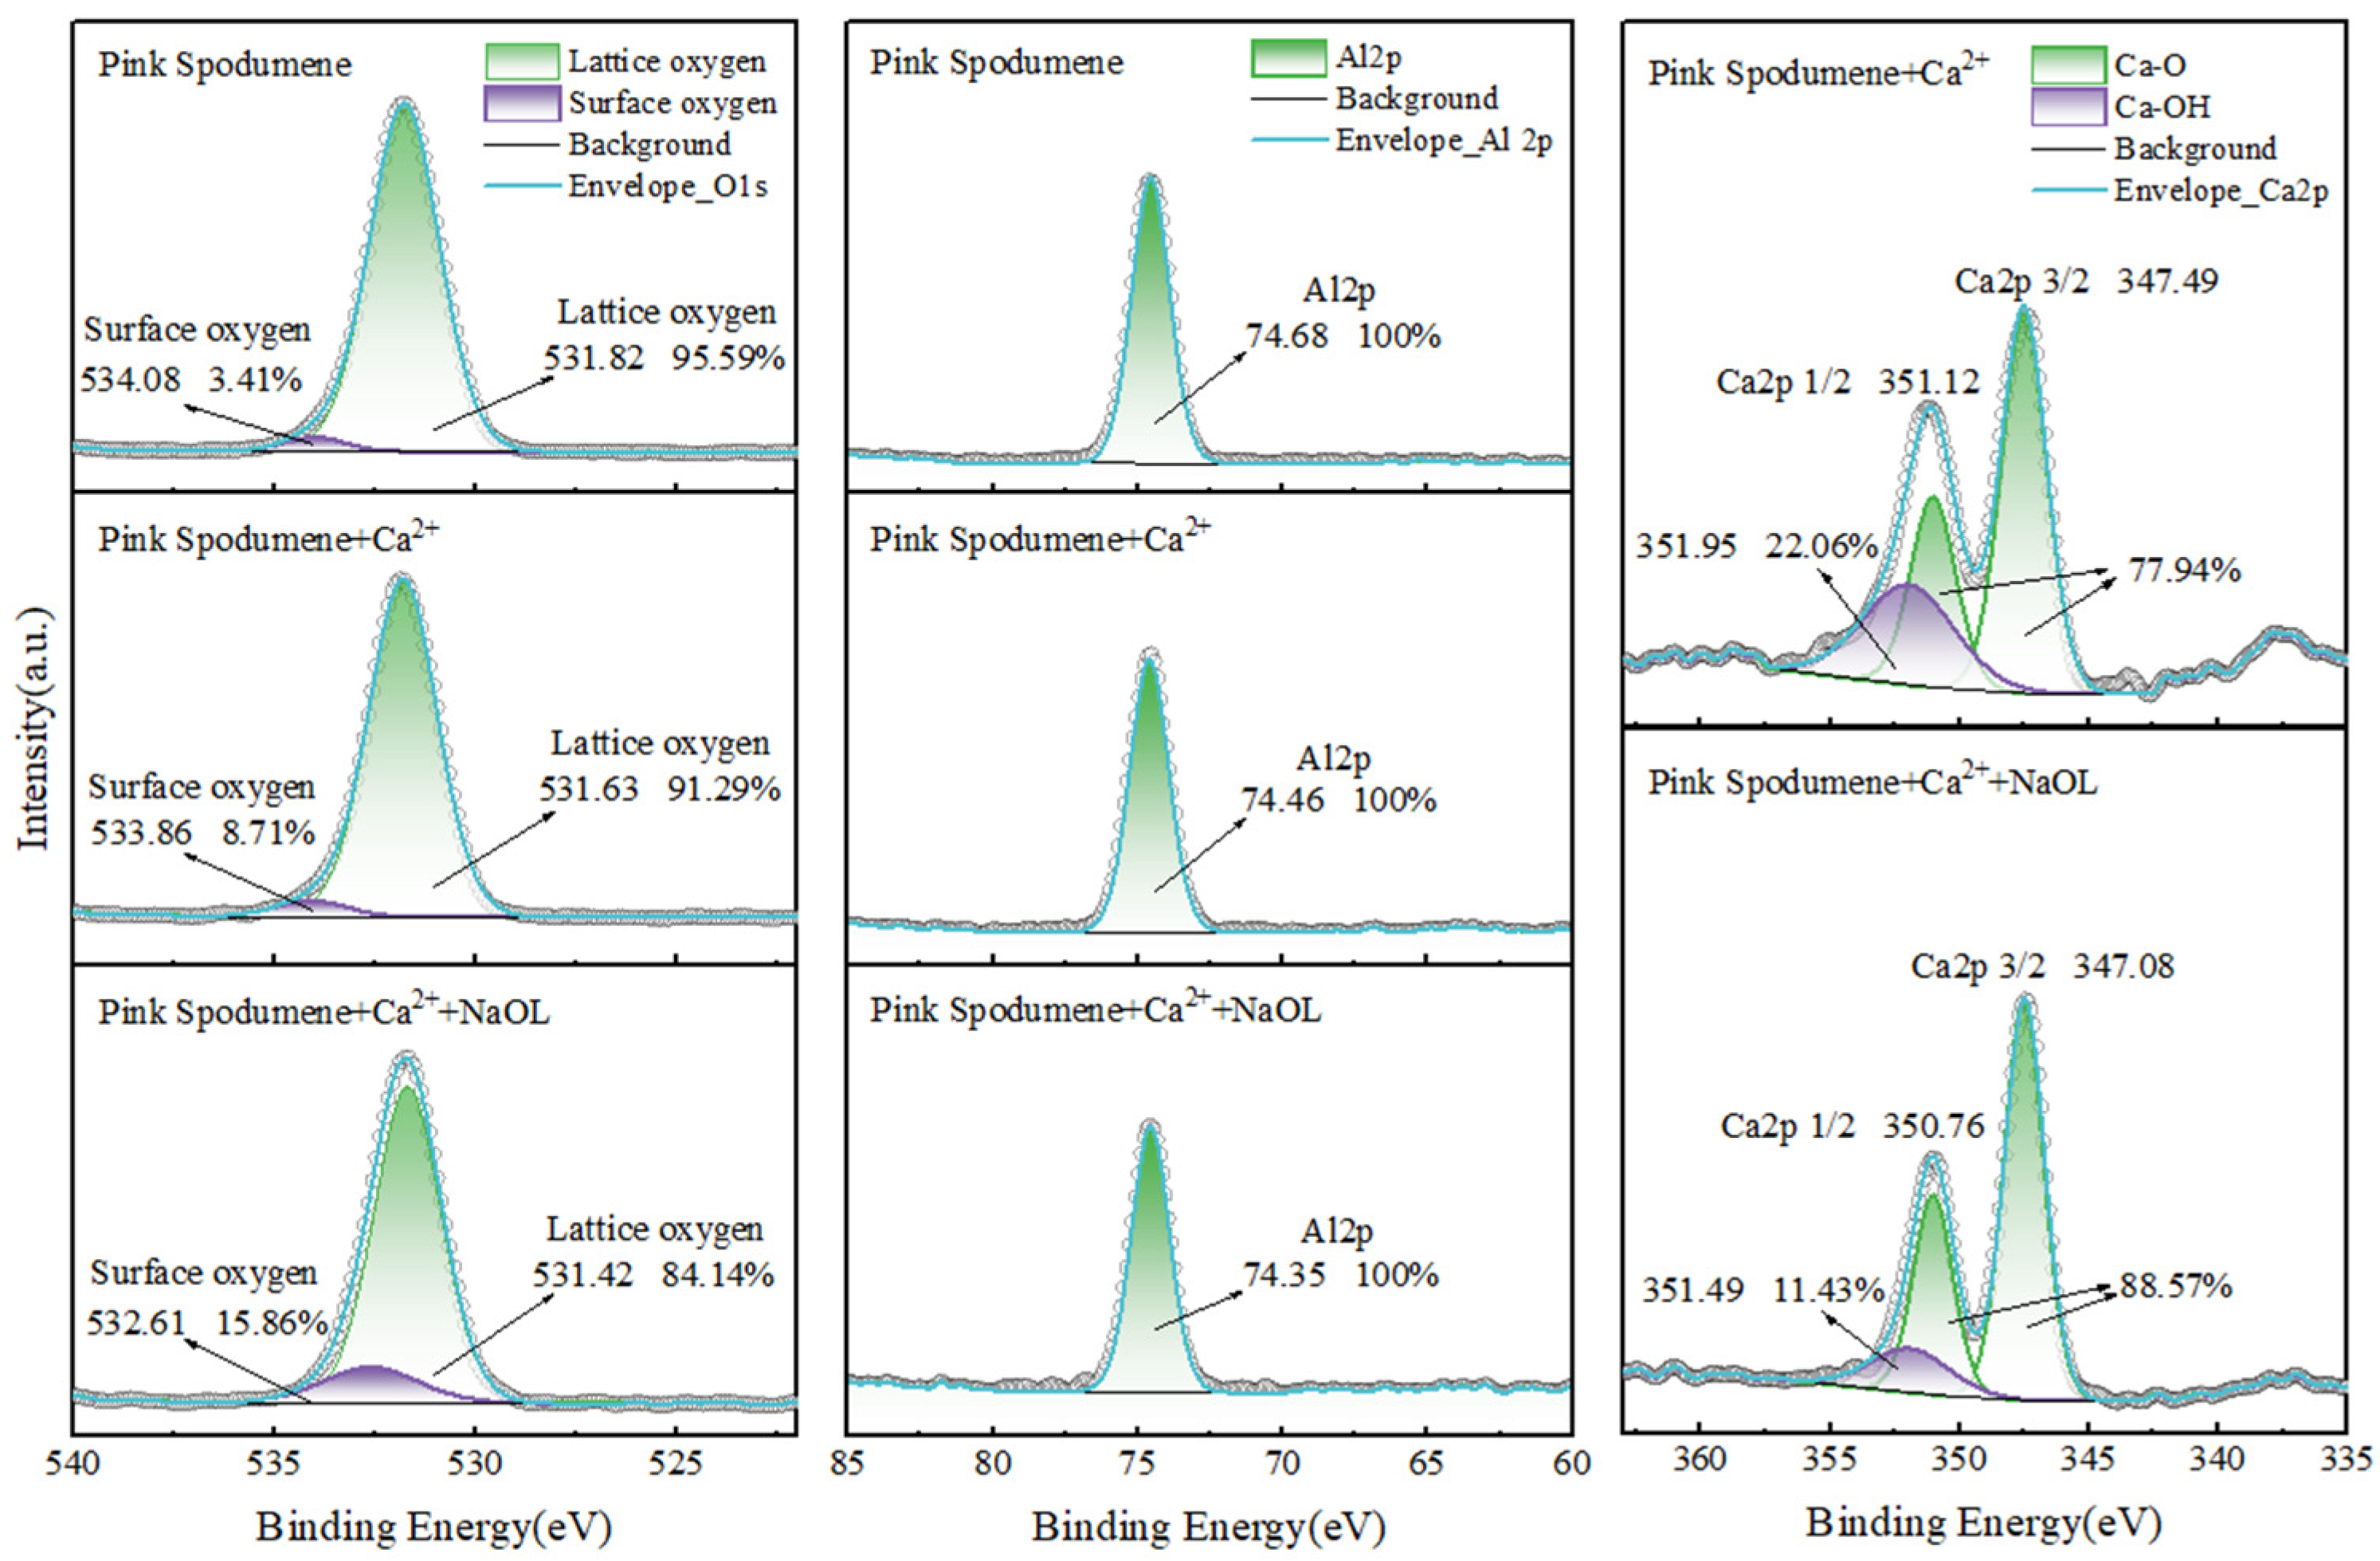
3.7. XPS and Calcium Ion Adsorption Analysis

Figure 14, Figure 15, Figure 16 and Figure 17 display the XPS spectra of the spodumene surface with and without Ca2+ and NaOL, and the elemental content on the spodumene surface is shown in Table 4. The adsorption of calcium ions before and after NaOL adsorption was studied and the results are illustrated in Figure 18. Table 4 shows that the white spodumene surface has the lowest Al content, which may be the reason why white spodumene has poor flotation performance. Besides, the Ca content on the surface of the three spodumene samples increases after calcium ion addition, indicating that calcium ions are adsorbed on the surface. After NaOL addition, the C content on the surfaces of spodumene with three colors notably rose, indicating that NaOL adsorbed on the surface. However, the Ca content is also relatively elevated, as shown in Figure 18. This may be due to OL chemically reacting with calcium ions and/or the hydroxyl compounds in the solution and then the complex co-adsorbing on the spodumene surface.
Figure 14 shows the full spectra of the three spodumene samples. There is no peak for Fe and Mn, attributed to the low level of Fe and Mn. As depicted in Figure 15, Figure 16 and Figure 17, the binding energy near 74.7 eV is attributed to Al 2p, the peaks near 534.1 eV and 531.7 eV are attributed to surface oxygen and lattice oxygen [40,41], and the peaks near 350.9 eV, 247.4 eV, and 351.9 eV are attributed to Ca 2p1/2, Ca 2p3/2, and Ca-OH, respectively. After the activation of Ca2+, the peak for surface oxygen undergoes an obvious chemical shift and the integral area becomes larger in percentage, indicating that Ca has bonded with O elements on the spodumene surface. The peaks of surface oxygen of white, pink, and purple spodumene were negatively shifted by 0.21 eV, 0.22 eV, and 0.13 eV, respectively, and the chemical shift of the peaks of surface oxygen of pink spodumene was obvious, which indicated that the surface of pink spodumene was better activated by Ca2+. The Ca 2p and Al 2p peaks were negatively shifted after NaOL treatment, suggesting that the chemical surroundings of Ca and Al on the spodumene surface have been altered and the chemisorption of NaOL at the Ca and Al sites occurs. The peaks at Al 2p, Ca 2p1/2, and Ca 2p3/2 of white, pink, and purple spodumene were negatively shifted by 0.05 eV, 0.21 eV, 0.24 eV; 0.11 eV, 0.36 eV, 0.41 eV; and 0.06 eV, 0.14 eV, 0.15 eV, respectively. The chemical shift of the separation peaks at Al 2p and Ca 2p of the pink spodumene surface is most significant, followed by white and purple spodumene, which is consistent with the flotation results.

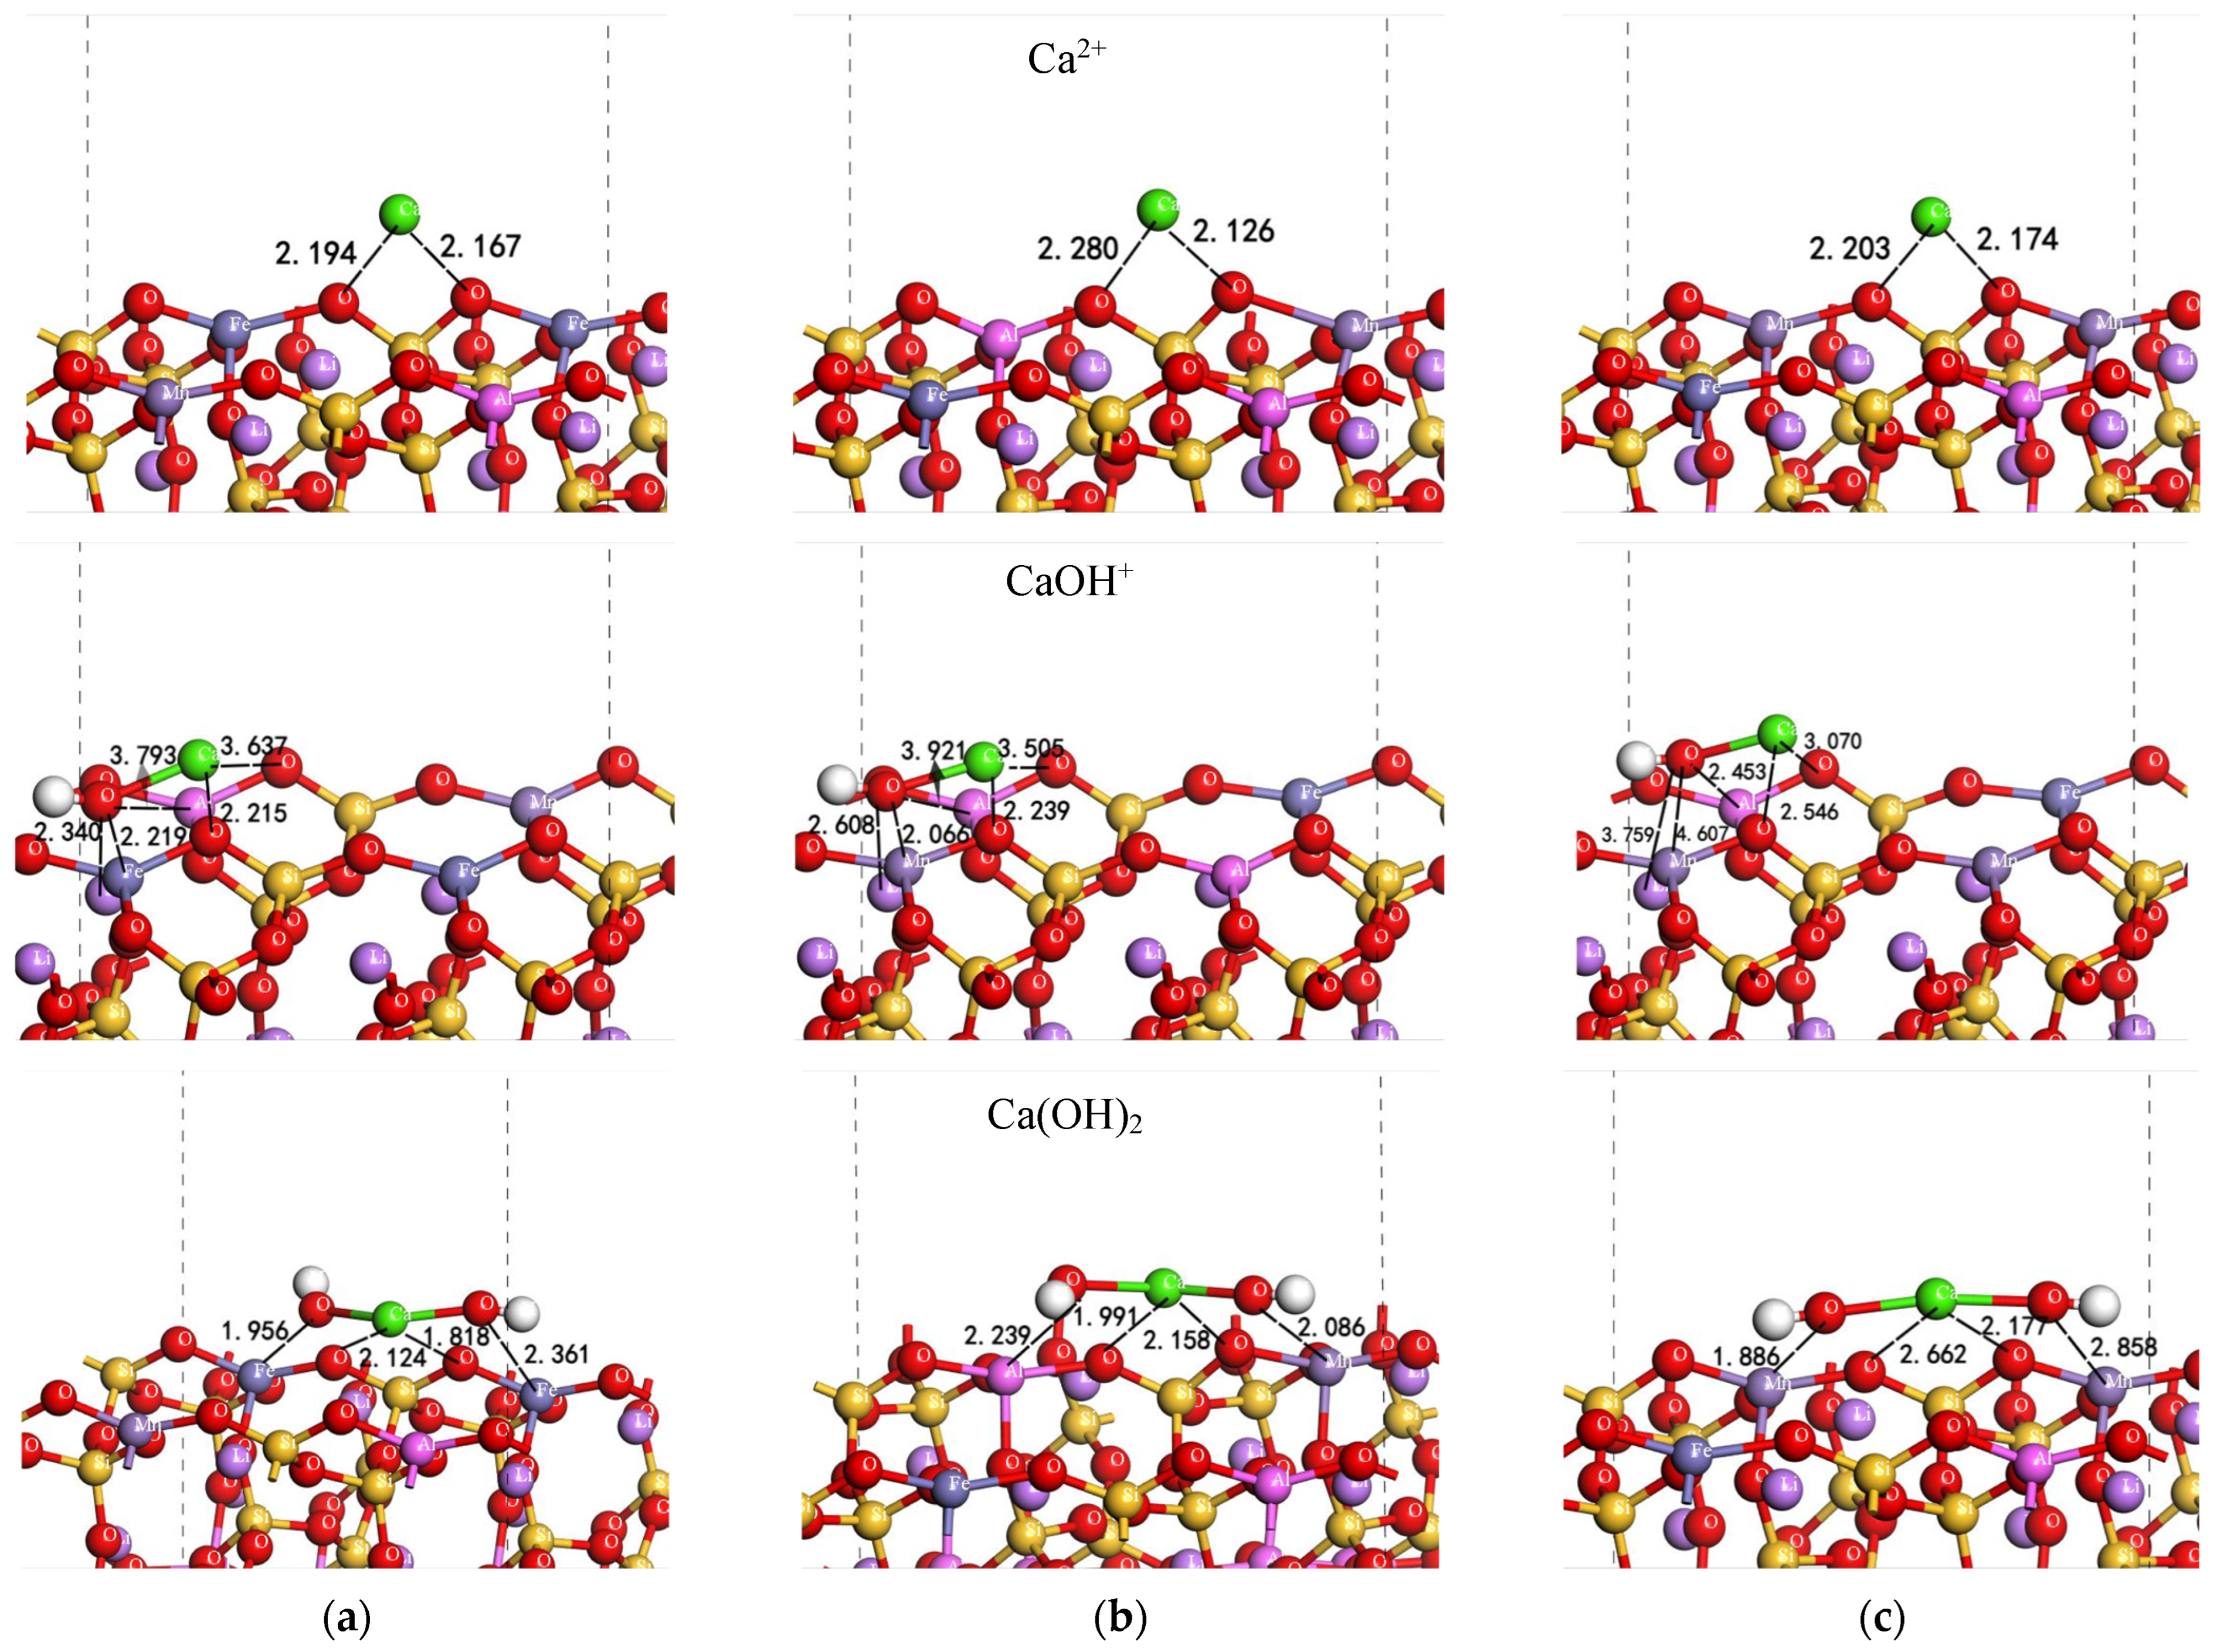
3.8. Quantum Chemical Simulation

The solution chemistry diagram of calcium ions shows that the major acting components of calcium ions in solution are Ca2+, Ca(OH)+, and Ca(OH)2 at pH 12. The concentrations of the three components from high to low are: Ca2+, Ca(OH)+, and Ca(OH)2. Therefore, the adsorption configurations of Ca2+, Ca(OH)+, and Ca(OH)2 on the spodumene surface of three colors were constructed and the adsorption energies were calculated, as shown in Figure 19 and Table 5, respectively. Dashed lines represent the bond lengths between Ca atoms and O atoms in calcium ions and their hydroxide compounds, and O atoms and metal atoms on different colored diopside surfaces, all of which are indicated in the image. The numbers represent bond lengths, with the unit being Å The results show that the adsorption energies for calcium ions and their hydrolysis products on the surfaces of all three spodumene samples are negative, and the absolute values in descending order are Ca2+, Ca(OH)2, and Ca(OH)+. The absolute values of adsorption energies for calcium ions and their hydrolysis compounds on the spodumene surface of three colors in descending order are pink, white, and purple spodumene, indicating that the adsorption of calcium ions and their hydrolysis compounds on the pink spodumene is better, followed by the white spodumene, which is in agreement with the microflotation results. As the pink spodumene has one Fe3+ and one Mn2+, compared to the white spodumene (two Fe3+ and one Mn2+) and purple spodumene (two Mn2+ and one Fe2+), the pink spodumene surface has fewer polyvalent metal ions, which will favors the adsorption of calcium ions and their hydroxylated compounds. The white spodumene has the most polyvalent metal ions, not conducive to calcium adsorption.

4. Conclusions

Using NaOL as a collector, our flotation test results show that calcium ions have the best activation effect on the pink spodumene, followed by white and purple spodumene. The contact angle, zeta potential, AFM analysis, and adsorption capacity measurements all indicate more Ca species and NaOL adsorption on the surface of the pink spodumene, followed by white and purple spodumene; this corresponds to the flotation test outcomes. Spodumenes of different colors show different flotabilities, and the relative amounts of metal elements like Fe and Mn on their surfaces are key factors.
The XPS and adsorption capacity measurement results illustrate two activation patterns of calcium ions on the spodumene surface. One mode involves calcium ions and their hydroxyl compounds being adsorbed on the spodumene surface, which is favorable for OL adsorption, where chemical adsorption occurs between OL and the Ca and Al sites. The other mode involves calcium ions and their hydroxyl compounds forming colloidal complexes with NaOL firstly in solution and then co-adsorbing on the spodumene surface.
Species distribution analysis and quantum chemical calculations show that Ca2+, Ca(OH)+, and Ca(OH)2 are the essential components that play an activation role at pH = 12, and the adsorption affinity on the spodumene surface in descending order was Ca2+, Ca(OH)2, and Ca(OH)+. The adsorption of calcium ions and their hydrolysis compounds on the pink spodumene is better, followed by the white spodumene, which further confirmed the microflotation results.
The activation mechanism of calcium ions on the flotation of spodumene with different colors enriches theoretical research on spodumene flotation. As the metal ions activate spodumene with different colors to different extents, color should be considered in spodumene flotation practice. In addition, the varieties, contents, valence state, and positions within the crystal structure and on the surface and their effect on spodumene flotation have significant theoretical significance for the design and synthesis of spodumene flotation reagents.

Author Contributions

Conceptualization, G.Z.; methodology, R.W.; software, Y.Z. (Yan Zheng); validation, X.Z. and Y.Z. (Yuzhe Zhang); formal analysis, R.W.; investigation, R.W.; resources, Y.C.; data curation, C.L.; writing—original draft preparation, R.W.; writing—review and editing, G.Z.; visualization, X.Z.; supervision, Y.C.; project administration, G.L. and Y.C.; funding acquisition, G.Z., C.L. and Y.C. All authors have read and agreed to the published version of the manuscript.

Funding

This research was funded by the Project of Zhongyuan Critical Metals Laboratory (Grant No. GJJSGFYQ202320 and GJJSGFZD202304), the National Natural Science Foundation of China (Grant No. 52204287), the Zhengzhou Key Project for Collaborative Innovation (Grant No. 21XTZX06027), the Key R & D and Promotion Program in Henan Province (Grant No. 242102321176), and the National Supercomputing Center in Zhengzhou.

Data Availability Statement

Data are contained within the article.

Conflicts of Interest

The authors declare no conflicts of interest.

References

  1. Liu, D.; Gao, X.; An, H.; Qi, Y.; Sun, X.; Wang, Z. Supply and demand response trends of lithium resources driven by the demand of emerging renewable energy technologies in China. Resour. Conserv. Recycl. 2019, 145, 311–321. [Google Scholar] [CrossRef]
  2. Guo, Z.F.; Tan, C.G.; Dai, D. Lithium-the new focus of the world’s mining development. Chin. Nucl. Ind. 2017, 9, 28–29. [Google Scholar]
  3. Filippov, L.; Farrokhpay, S.; Lyo, L.; Filippova, I. Spodumene Flotation Mechanism. Minerals 2019, 9, 6. [Google Scholar] [CrossRef]
  4. Burt, R.O.; Zhang, L. Denidae—A new type of low-iron spodumene. Miner. Prot. Util. 1989, 5, 52–55. [Google Scholar]
  5. James, S.B.; Barrett, H.C.; Pan, C.L. Flotation separation of spodumene and beryl. Min. Eng. 1963, 1, 28–33. [Google Scholar]
  6. Dessemond, C.; Lajoie-Leroux, F.; Soucy, G.; Laroche, N.; Magnan, J.F. Spodumene: The Lithium Market, Resources and Processes. Minerals 2019, 9, 6. [Google Scholar] [CrossRef]
  7. Zhu, G.; Cao, Y.; Wang, Y.; Wang, X.; Miller, J.D.; Lu, D. Surface chemistry features of spodumene with isomorphous substitution. Miner. Eng. 2020, 146, 5. [Google Scholar] [CrossRef]
  8. Yu, X. Mineralogical Characteristics and Geological Significance of Spodumene in Lijiagou Pegmatite Deposit in Sichuan. Ph.D. Thesis, Chengdu University of Technology, Chengdu, China, 2021. [Google Scholar]
  9. Qiu, C.Z. Study on the Mineralogical Characteristics of Spodumene in Altai Pegmatites in Xinjiang. Ph.D. Thesis, China University of Geosciences, Beijing, China, 2014. [Google Scholar]
  10. Luo, X.P.; Zhang, Y.B.; Zhou, H.P.; Xie, F.X.; Yang, Z.Z.; Zhang, B.Y. Flotation separation of spodumene and albite with activation of calcium ion hydrolysate components. Rare Metals 2022, 41, 3919–3931. [Google Scholar] [CrossRef]
  11. Meng, J.P.; Xu, L.H.; Wang, D.H.; Xue, K.; Luo, L.P.; Shi, X.Z. The activation mechanism of metal ions on spodumene flotation from the perspective of in situ ATR-FTIR and ToF-SIMS. Miner. Eng. 2022, 182, 107567. [Google Scholar] [CrossRef]
  12. Zhang, Y.b.; Zhou, H.p.; Cao, Y.J.; Luo, X.p.; Xie, F.X.; Zhang, B.Y.; Yang, S.Q. Activation mechanism of calcium hydrolysate on the spodumene surface and its effect on the adsorption of collector. Miner. Eng. 2021, 174, 107221. [Google Scholar]
  13. Li, L.C.; Su, J.; Lu, T.J.; Shen, M.D.; Zhang, J. Luminescence characteristics of green spodumene. In Proceedings of the 2013 China Jewelry Academic Exchange Conference, Beijing, China, 30 October 2013; pp. 94–97. (In Chinese). [Google Scholar]
  14. Sun, C.Y. Differences in the floatiness of different colors of spodumene and crystal chemical analysis. Nonferrous Metal. 2000, 4, 107–110+103. [Google Scholar]
  15. Rehman, H.U.; Martens, G.; Tsai, Y.L.; Chankhantha, C.; Kidkhunthod, P.; Shen, A.H. An X-ray Absorption Near-Edge Structure (XANES) Study on the Oxidation State of Chromophores in Natural Kunzite Samples from Nuristan, Afghanistan. Minerals 2020, 10, 5. [Google Scholar] [CrossRef]
  16. Rossman, G.R. The Geochemistry of Gems and Its Relevance to Gemology: Different Traces, Different Prices. Elements 2009, 5, 159–162. [Google Scholar] [CrossRef]
  17. Ito, A.S.; Isotani, S. Heating effects on the optical absorption spectra of irradiated, natural spodumene. Radiat. Eff. Defects Solids 1991, 116, 307–314. [Google Scholar] [CrossRef]
  18. Sun, C.Y. Analysis of the difference in planktony of spodumene and neonite in the same ore body. J. China Univ. Min. Technol. 2001, 6, 5–10. [Google Scholar]
  19. Zhou, H.P.; Xie, F.X.; Zhang, Y.B.; Zhang, B.Y.; Yang, S.Q.; Luo, X.P. Insights into the floatability between spodumene and albite from crystal chemistry standpoint. Int. J. Min. Sci. Technol. 2022, 32, 1329–1339. [Google Scholar] [CrossRef]
  20. Czaja, M.; Lisiecki, R.; Kadziolka-Gawel, M.; Winiarski, A. Some Complementary Data about the Spectroscopic Properties of Manganese Ions in Spodumene Crystals. Minerals 2020, 10, 554. [Google Scholar] [CrossRef]
  21. Han, B. Spectroscopic Analysis and Color Optimization of Kunzite in Endeavan. Ph.D. Thesis, China University of Geosciences, Wuhan, China, 2021. [Google Scholar]
  22. Iqbal, M.; Saeed, A.; Zafar, S.I. FTIR spectrophotometry, kinetics and adsorption isotherms modeling, ion exchange, and EDX analysis for understanding the mechanism of Cd2+ and Pb2+ removal by mango peel waste. J. Hazard. Mater. 2008, 164, 161–171. [Google Scholar] [CrossRef]
  23. Cui, L.; Guo, Y.; Tang, J.; Yang, Y. Spectroscopy Characteristics and Color-Influencing Factors of Green Iron-Bearing Elbaite. Crystals 2023, 13, 1461. [Google Scholar] [CrossRef]
  24. Pasetti, L.; Borromeo, L.; Bersani, D.; Andò, S.; Schnellrath, J.; Hennebois, U. Identification of Some Gem Quality Blue to Green Li-Tourmalines. Minerals 2024, 14, 44. [Google Scholar] [CrossRef]
  25. Wesełucha-Birczyńska, A.; Słowakiewicz, M.; Natkaniec-Nowak, L.; Proniewicz, L.M. Raman microspectroscopy of organic inclusions in spodumenes from Nilaw. Spectrochim. Acta Part A Mol. Biomol. Spectrosc. 2011, 79, 789–796. [Google Scholar] [CrossRef] [PubMed]
  26. Moon, K.S.; Fuerstenau, D.W. Surface crystal chemistry in selective flotation of spodumene (LiAl[SiO3]2) from other aluminosilicates. Int. J. Miner. Process. 2003, 72, 11–24. [Google Scholar] [CrossRef]
  27. Li, Y.L.; Wang, R.P.; Zhu, G.L.; Li, G.S.; Cao, Y.J. A DFT study on the effect of lattice defects on the electronic structures and floatability of spodumene. Phys. B Condens. Matter 2024, 676, 415657. [Google Scholar] [CrossRef]
  28. Isotani, S.; Watari, K.; Mizukami, A.; Bonventi, W.; Ito, A.S. UV optical absorption spectra analysis of spodumene crystals from Brazil. Phys. B Condens. Matter 2007, 391, 322–330. [Google Scholar] [CrossRef]
  29. Hu, Y. Effects of Organic Inhibitors in Different Collector Systems on the Flotation Behavior of Spodumene and Gangue Minerals. Ph.D. Thesis, Central South University, Changsha, China, 2023. [Google Scholar]
  30. Jiang, W. Kinetic Simulation of Spodumene Adsorbent Molecules. Ph.D. Thesis, Jiangxi University of Science and Technology, Ganzhou, China, 2015. [Google Scholar]
  31. Yu, F.S.; Yan, P.K.; Jiang, M.; Wang, J.L.; Li, J.; An, F.W. Genetic characteristics of spodumene and potassium feldspar minerals and their floatability. Met. Mines 2020, 06, 75–80. [Google Scholar]
  32. Yu, F.S.; Sun, Y.F.; Jiang, M.; Xu, G.D.; Wang, J.L.; Li, J. Activation behavior and mechanism of metal cations in spodumene flotation. Chin. J. Nonferrous Met. 2021, 31, 203–210. [Google Scholar]
  33. Li, S.Y.; Liu, J.; Han, Y.X.; Zhang, S.M. A review of pegmatite-type lithium and beryllium rare metal ores and their flotation separation in China. Met. Mines 2022, 558, 129–138. [Google Scholar] [CrossRef]
  34. Xie, R.Q.; Zhu, Y.M.; Liu, J.; Li, Y.J. Study on spodumene crystal structure and chemical gene characteristics of (110) surface surface based on density functional theory. Met. Mines 2020, 6, 68–74. [Google Scholar]
  35. Xu, L.H.; Dong, Q.F.; Liu, J.; Wang, Z.; Wang, J.M. Separation of surface crystal chemistry of diaspore monohydrate and kaolinite by anionic collector flotation. Miner. J. 2016, 36, 265–270. [Google Scholar]
  36. Zheng, H.T.; Wang, Y.H.; Zhao, Y.H.; Zhu, G.L.; Lu, D.F.; Zheng, X.Y. The influence of NaOH and mechanical stirring on the surface of spodumene and its flotation behavior. Nonferrous Metall. Eng. 2019, 9, 61–68. [Google Scholar]
  37. Xi, Y.; Dai, S.J.; Zhang, Z.J. Effect of Ca2+ on magnesite flotation behavior. Met. Mines 2019, 9, 98–101. [Google Scholar]
  38. Zhang, G.F.; Tang, P.H.; Zhu, Y.G.; Ding, P.; Feng, Y. Solution chemistry of flotation separation of apatite and quartz in Ca2+-Na2CO3 system. Ind. Miner. Process. 2011, 40, 1–4+19. [Google Scholar]
  39. Zeng, W.W.; Liu, X. Effect of calcium and magnesium ions on flotation of feldspar and epidote and its mechanism. Min. Metall. Eng. 2022, 42, 59–63. [Google Scholar]
  40. Liu, S.; Xie, L.; Liu, J.; Liu, G.Y.; Zhong, H.; Wang, Y.X.; Zeng, H.B. Probing the interactions of hydroxamic acid and mineral surfaces: Molecular mechanism underlying the selective separation. Chem. Eng. J. 2019, 374, 123–132. [Google Scholar] [CrossRef]
  41. Pirhashemi, M.; Habibi-Yangjeh, A. Ultrasonic-assisted preparation of plasmonic ZnO/Ag/Ag2WO4 nanocomposites with high visible-light photocatalytic performance for degradation of organic pollutants. J. Colloid Interface Sci. 2017, 491, 216–229. [Google Scholar] [CrossRef]
Figure 1. XRD patterns of spodumene samples with three colors.
Minerals 15 00048 g001
Figure 2. Surface models of spodumene of three colors: (a) white spodumene; (b) pink spodumene; (c) purple spodumene.
Minerals 15 00048 g002
Figure 3. Recovery of the three spodumene samples as a function of pH with a dosage of 200 mg/L NaOL.
Minerals 15 00048 g003
Figure 4. Recovery of the three spodumene samples as a function of pH with dosages of 100 mg/L CaCl2 and 200 mg/L NaOL.
Minerals 15 00048 g004
Figure 5. Recovery of the three spodumene samples as a function of CaCl2 dosage with 200 mg/L NaOL at pH 12.
Minerals 15 00048 g005
Figure 6. (a) Zeta potentials of spodumene as a function of pH and (b) histogram of the changes in the potential of spodumene before and after the action of Ca2+ and NaOL at pH 12.
Minerals 15 00048 g006
Figure 7. Species distribution diagrams of Ca(II) in solution as a function pH: (a) C(CaCl2) = 2 × 10⁻² mol/L and (b) C(CaCl2) = 3 × 10⁻² mol/L.
Minerals 15 00048 g007
Figure 8. Adsorption curves of spodumene of different colors as a function of CaCl2 dosage at pH 12.
Minerals 15 00048 g008
Figure 9. Fitting curves for Ca2+ adsorption of spodumene: (a) Freundlich and (b) Langmuir.
Minerals 15 00048 g009
Figure 10. Contact angles of spodumene before and after reagent treatment: (a) white spodumene; (b) pink spodumene; (c) purple spodumene.
Minerals 15 00048 g010
Figure 11. Two-dimensional and three-dimensional images of AFM before and after interaction between the white spodumene and the reagents: (a) white pure spodumene; (b) in the presence of Ca2+; (c) in the presence of Ca2+ and NaOL.
Minerals 15 00048 g011
Figure 12. Two-dimensional and three-dimensional images of AFM before and after interaction between pink spodumene and the reagents, (a) pink pure spodumene; (b) in the presence of Ca2+; (c) in the presence of Ca2+ and NaOL.
Minerals 15 00048 g012
Figure 13. Two-dimensional and three-dimensional images of AFM before and after the interaction between the purple spodumene and the reagents: (a) purple pure spodumene; (b) in the presence of Ca2+; (c) in the presence of Ca2+ and NaOL.
Minerals 15 00048 g013
Figure 14. XPS full spectrum of spodumene of three colors.
Minerals 15 00048 g014
Figure 15. XPS spectra of the white spodumene surface before and after reagent adsorption.
Minerals 15 00048 g015
Figure 16. XPS spectra of the pink spodumene surface before and after reagent adsorption.
Minerals 15 00048 g016
Figure 17. XPS spectra of the purple spodumene surface before and after reagent adsorption.
Minerals 15 00048 g017
Figure 18. Histogram of the percentage of calcium ion adsorption and precipitation in the presence and absence of NaOL.
Minerals 15 00048 g018
Figure 19. Adsorption configurations of calcium ions and their hydroxyl compounds on the surface of (a) white spodumene; (b) pink spodumene; and (c) purple spodumene.
Minerals 15 00048 g019
Table 1. Chemical composition of spodumene samples with three colors (%).
Chemical ElementLi2OSiO2Al2O3Na2OMnOCaOK2OP2O5MgOFe2O3TiO2Cr
White spodumene7.6263.8126.670.8040.1650.3180.0740.0600.0470.4680.0130.0005
Pink spodumene7.3763.7826.481.1740.1800.4840.1330.0810.2470.1300.0050.0003
Purple spodumene7.4363.5826.861.1400.179 0.6090.1220.0670.0330.0620.0140.0002
Table 2. The fitting parameters of Ca2+ adsorption isotherm curves on the three spodumene samples.
ColorsLangmuirFreundlich
qmax (mg/g)b (L/mg)R2KF1/nR2
White173.193.420.940.370.690.96
Pink108.156.630.930.780.580.96
Purple163.523.650.970.320.710.98
Table 3. The surface roughness of spodumene before and after reagent treatment, as determined using AFM.
MineralsRa (nm)
SpodumeneSpodumene + Ca2+Spodumene + Ca2+ + NaOL
White spodumene0.2090.4850.910
Pink spodumene1.1851.6192.620
Purple spodumene0.2510.4430.787
Table 4. Relative elemental content on the spodumene surface in the presence and absence of reagents.
SampleRelative Content (%)
COCaSiAl
White spodumene24.6350.260.6416.887.59
White spodumene + Ca2+28.6845.820.7216.208.58
White spodumene + Ca2+ + NaOL40.0838.390.9713.547.01
Pink spodumene33.9842.190.4215.517.91
Pink spodumene + Ca2+34.9641.370.7515.717.21
Pink spodumene + Ca2+ + NaOL51.7030.411.3911.125.38
Purple spodumene31.1545.310.3814.798.37
Purple spodumene + Ca2+32.2943.810.8815.127.90
Purple spodumene + Ca2+ + NaOL55.6528.431.119.425.39
Table 5. Adsorption energy of calcium ions and their hydroxyl compounds on the spodumene surfaces (eV).
Acting ComponentsMineral ColorEsurface+adsorbateEadsorbateEsurfaceEads
Ca2+White−24,113.77600−676.79725−23,436.70830−7.360
Pink−23,092.71119−676.79725−22,415.63322−7.639
Purple−24,001.04950−676.79725−23,323.99613−6.969
Ca(OH)+White −24,189.78006−752.956724−23,436.67971−3.908
Pink −23,168.77055−752.957945−22,415.65643−4.250
Purple−24,077.08097−752.989768−23,323.99575−2.598
Ca(OH)2White −24,265.84491−829.02002−23,436.67051−4.201
Pink −23,244.79134−829.01777−22,415.60910−4.476
Purple−24,153.13202−829.03372−23,323.99575−2.791
Disclaimer/Publisher’s Note: The statements, opinions and data contained in all publications are solely those of the individual author(s) and contributor(s) and not of MDPI and/or the editor(s). MDPI and/or the editor(s) disclaim responsibility for any injury to people or property resulting from any ideas, methods, instructions or products referred to in the content.

