Article

Geology, Petrology and Geochronology of the Late Cretaceous Klaza Epithermal Deposit: A Window into the Petrogenesis of an Emerging Porphyry Belt in the Dawson Range, Yukon, Canada

by
Well-Shen Lee
1,*,
Daniel J. Kontak
1,
Patrick J. Sack
2,*,
James L. Crowley
3 and
Robert A. Creaser
4
1
Harquail School of Earth Sciences, Sudbury, ON P3E 2E3, Canada
2
Yukon Geological Survey, 91807 Alaska Hwy, Whitehorse, YT Y1A 0R3, Canada
3
Department of Geosciences, Boise State University, 1295 University Drive, Boise, ID 83706, USA
4
Department of Earth and Atmospheric Sciences, University of Alberta, Edmonton, AB T6G 2E3, Canada
*
Authors to whom correspondence should be addressed.
Minerals 2025, 15(1), 38; https://doi.org/10.3390/min15010038
Submission received: 10 November 2024 / Revised: 19 December 2024 / Accepted: 27 December 2024 / Published: 31 December 2024

Abstract

:
Geologic understanding of the richly mineralized Dawson Range gold belt (DRGB) in the central Yukon, Canada is hindered by: (1) limited outcrop exposure due to thick soil cover; and (2) low resolution age-constraints despite a long history of porphyry Cu–Au–Mo deposit (PCD) exploration. Here, the well-preserved Klaza Au–Ag–Pb–Zn porphyry–epithermal deposit is used as a type-example of Late Cretaceous magmatic–hydrothermal mineralization to address the complex metallogeny of the DRGB. U–Pb zircon dating defines four magmatic pulses of Late Triassic to Late Cretaceous ages with the latter consisting of the Casino (80–72 Ma) and Prospector Mt. (72–65 Ma) suites. The Casino suite has five phases of intermediate-to-felsic calc-alkaline composition, correspond with older (77 Ma) porphyry mineralization, and displays evidence of magma mingling. The intermediate-to-mafic, slightly alkalic Prospector Mt. suite shows evidence of mingling with the youngest Casino suite phases, correlates with younger (71 Ma), intermediate-sulfidation epithermal and porphyry-type mineralization, and shoshonitic basalts of the Carmacks Group. Zircon trace element data suggest a common melt source for these suites; however, the younger suite records features (e.g., high La/Yb) that indicate a higher pressure melt source. The results from this study highlight the Prospector Mt. suite as a historically overlooked causative magma event linked to Au-rich PCDs in the DRGB and extends the temporal window of PCD prospectivity in this area. The transition from mid-Cretaceous Whitehorse suite magmas to Late Cretaceous Casino-Prospector Mt. suite magmas is proposed to reflect a transition from subduction to localized extension, which is becoming more recognized as a common characteristic of productive porphyry belts globally.

1. Introduction

The North American Cordillera represents a long-lived orogen, active since the Neoproterozoic, which involved many episodes of accretion, rifting and varied magmatism with a variety of spatially- and temporally-related hydrothermal mineralization types [1,2,3]. Consequently, the area is well known for a wide spectrum of ore-deposit types that include porphyry, epithermal, both volcanogenic- and sedimentary-rock-hosted massive sulfide deposits, MVT and orogenic gold deposits [1,2]. Numerous studies have documented the nature and origin of these ore deposit types at various scales which collectively have contributed to furthering the understanding of metallogeny of this and analogous settings [4,5,6,7,8,9,10,11,12]. As expected, however, details of processes relevant at more refined scales for different districts require more concentrated and focused studies. This is the case for the Late Cretaceous evolution of the Yukon segment of the Canadian Cordillera [1,2,3].
The Late Cretaceous Klaza Au–Ag–Pb–Zn–(Cu) epithermal deposit has a current indicated resource of 4.457 Mt containing 686,000 oz Au, 14,071,000 oz Ag, 73,268,000 lbs Pb and 92,107,000 lbs Zn at grades of 4.8 g/t Au and 98 g/t Ag, 0.7% Pb, and 0.9% Zn [13] and a positive Preliminary Economic Assessment indicates its likely future mining potential [14]. Although porphyry-type targets, and thus potentially more significant mineral resources, have long been speculated to be present on the Klaza property [14,15,16,17,18], compelling evidence for such mineralization has not been presented prior to this study, which is based on the work of Lee (2021). This paper uses an extensive database provided by recent (2011–2020) exploration to propose a revised tectonic and petrogenetic model for the Klaza system. The present study is based on new field constraints derived from logging 12,000 m of core, related regional surface mapping, and follow-up work. The latter work comprised petrographic studies, whole rock lithogeochemistry, geochronology (U–Pb zircon, Re–Os molybdenite, Ar–Ar muscovite) and in situ (LA–ICP–MS) zircon dating, high-precision zircon dating (CA–TIMS), and geochemistry. In addition, an extensive company dataset of metal assays allowed for the examination of metal zonation at the deposit scale. This information is collectively used to improve the metallogenic model in an emerging porphyry Cu–Au district in Yukon.

2. Regional Geology and Mineralizing Events

The DRGB stretches from the Yukon–Alaska border to within 50 km of Carmacks in Yukon, Canada ([1]; Figure 1A). However, the known porphyry Cu–Au deposits (PCDs), prospects, and occurrences are at present restricted to the mid-to-southern Dawson Range area (Figure 1B). This preferential distribution of porphyry and epithermal systems could be a function of varying exhumation extents (and thus preservation potential; see discussion section) or accessibility for exploration activities in the DRGB.
Basement rocks underlying most magmatic–hydrothermal systems in this area comprise Devonian and older metamorphosed volcaniclastic and sedimentary rocks of the parautochthonous Yukon–Tanana terrane (YTT; Figure 1B). The YTT re-accreted to the Laurentian margin between the Late Permian and Early Triassic during west-dipping subduction on its eastern flank [2], now represented by the Slide Mt. Terrane and the Whitewater Fault [19]. However, when subduction polarity switched in the Late Triassic, it resulted in the east-dipping subduction of the Kula plate on the western flank of the YTT [2]. Consequently, intermediate calc-alkalic Minto (ca. 204–195 Ma) and Long Lake (ca. 188–183 Ma; [20]) suite plutonic bodies of granodiorite to monzonite composition intrude the contact between the YTT and the Stikine terrane. These rocks host rafts of the migmatized Late Triassic porphyry Cu–Au–Ag systems (Minto, Carmacks Copper) in the Minto Copper Belt [21]. This Late Triassic to Early Jurassic magmatic pulse coincides with the well-known and significant porphyry Cu–Au–Mo endowment further south in British Columbia [22].
The westward migration at ca. 120 Ma of the aforementioned volcanic arc gave rise to intermediate to felsic, metaluminous, calc-alkaline Whitehorse suite (ca. 120–98 Ma) granodioritic bodies that intrude the contact between the Minto-Long Lake suites and the YTT (Figure 1B). The Mt. Nansen Group (ca. 115 Ma) andesites, which form a coeval extrusive counterpart to the Whitehorse suite rocks, are documented to overlie and are in-turn intruded by younger phases of the Whitehorse magmatic pulse [23]. Mineralization correlated with the extensive Whitehorse suite magmatism in the DRGB includes the Pattinson, Idaho Creek, and Antoniuk prospects [1].
East-dipping subduction continued in the Late Cretaceous and resulted in the emplacement of the intermediate calc-alkaline Casino suite rock (ca. 80–72 Ma; [1]) with the same magmatic locus as the Whitehorse suite rocks (Figure 1B). This Late Cretaceous intrusive suite is significantly less voluminous than the earlier plutonic suites and importantly was emplaced as high-level porphyry dikes, plugs, and breccias; they are inferred to be the causative magmas for several porphyry–epithermal systems in the southern DRGB [1]. The more significant centres of mineralization related to this magmatism include (see Figure 1B): (1) Casino with the resource of 1057 Mt at 0.2% Cu, 0.23 g/t Au and 0.022% Mo [1]; (2) nucleus with an indicated resource of 31 Mt at 0.65 g.t Au, 0.07% Cu, and 0.70% Ag [24]; and (3) revenue with an indicated resource of 11.4 Mt at 0.38 g/t Au, 0.12% Cu, 2.4 g/t Ag, 0.016% Mo, and 0.008% W [24]. Many PCDs in the DRGB host significant Cu–Au–Mo resources and occur with genetically associated epithermal extensions [25,26].
The youngest magmatism of 72–67 Ma [1], termed the Prospector Mt. suite, consists of intermediate, subalkaline intrusive rocks that are coeval with the Mg-rich shoshonitic Carmacks Group (ca. 70 Ma) basalts [27]. Some Ag-rich polymetallic veins with intermediate sulfidation (IS) epithermal characteristics are associated with these intrusions (e.g., Prospector Mt., Sixtymile River: [1,28]). Several tectonic models were proposed to address this magmatic pulse: (1) plume-related magmatism [29]; (2) lithospheric delamination [30]; and (3) slab break-off [31].
Metallogenic epochs in the DRGB are defined by varying timeframes in the literature (as discussed above). In this contribution, we use new age constraints to modify the original groupings from Allan et al. (2013) and redefine three metallogenic epochs correlating with magmatism and mineralization in the DRGB as: (1) mid-Cretaceous Whitehorse (120–90 Ma); (2) early-Late Cretaceous Casino (80–72 Ma); and (3) late-Late Cretaceous Prospector Mt. (72–65 Ma).

2.1. The Mount Nansen Gold Corridor (MNGC)

The Mount Nansen Gold Corridor (MNGC; Figure 1C) comprises approximately thirty mineral occurrences with the overall geological setting interpreted as an NW-trending horst structure [16]. Most of the mineral occurrences are hosted in steeply dipping NW-trending fault structures within Whitehorse suite granodiorite host rocks, Casino suite porphyritic dikes, Minto suite foliated granitoids, or YTT metasedimentary rocks; all of which form the basement to the area. NE-trending sinistral faults, which appear to post-date and offset NW-trending structures, are proposed to likely be syn-kinematic with the NW-trending dextral faults [1]. These NE-trending sinistral faults were likely active in the latest Late Cretaceous [1], with the normal component conducive to forming epithermal-type veins. This hypothesis is supported by recent U–Pb calcite data [32], which present Prospector Mt. age (ca. 72 Ma) calcite veins hosted in hydrothermal veins and faults from the Freegold Mt. district (FMGD; Figure 1B).
The MNGC comprises two clusters of gold-rich polymetallic veins: (1) the Klaza cluster (NW; Figure 1C); and (2) the past-producing Brown-McDade cluster (SE; Figure 1C). Both clusters form the intermediate sulfidation epithermal extensions of a central porphyry complex [16]. The central porphyry complex located south of Klaza comprises the Kelly, Cyprus, and Rusk drilled prospects (Figure 1C). Selby et al. [33,34] proposed a 72–67 Ma age of formation for the MNGC systems (Cyprus/Rusk) based on the dating of molybdenite (Re–Os) and hydrothermal K-feldspar (Ar–Ar). Mortensen et al. [17] proposed a post-77 Ma age of formation for the Klaza system and a ca. 115 Ma age for the Brown-McDade system, both based on co-spatial relationships with porphyritic dikes and their corresponding in situ U–Pb zircon ages.
Figure 1. Regional- and local-scale geological maps of the study area. (A) Inset map showing the location of the Klaza deposit and the Dawson Range Gold Belt relative to cities in the Yukon. (B) Simplified geologic map of the southern Dawson Range redrawn and modified from Yukon Geological Survey [35]. The locations of the Mt. Nansen Gold Corridor (MNGC) and Freegold Mt. District (FGMD) are indicated. All mineral occurrences displayed in this map are either porphyry or epithermal systems. (C) Geologic map of the Mt. Nansen Gold Corridor modified from Sack et al. [36] and Lee et al. [37]. The locations of the Klaza deposit and past-producing Brown-McDade mine are indicated. A cross-section of (A,A′) matching the colour scheme of this map is provided. UTM Zone 08, Datum: NAD 83.
Minerals 15 00038 g001

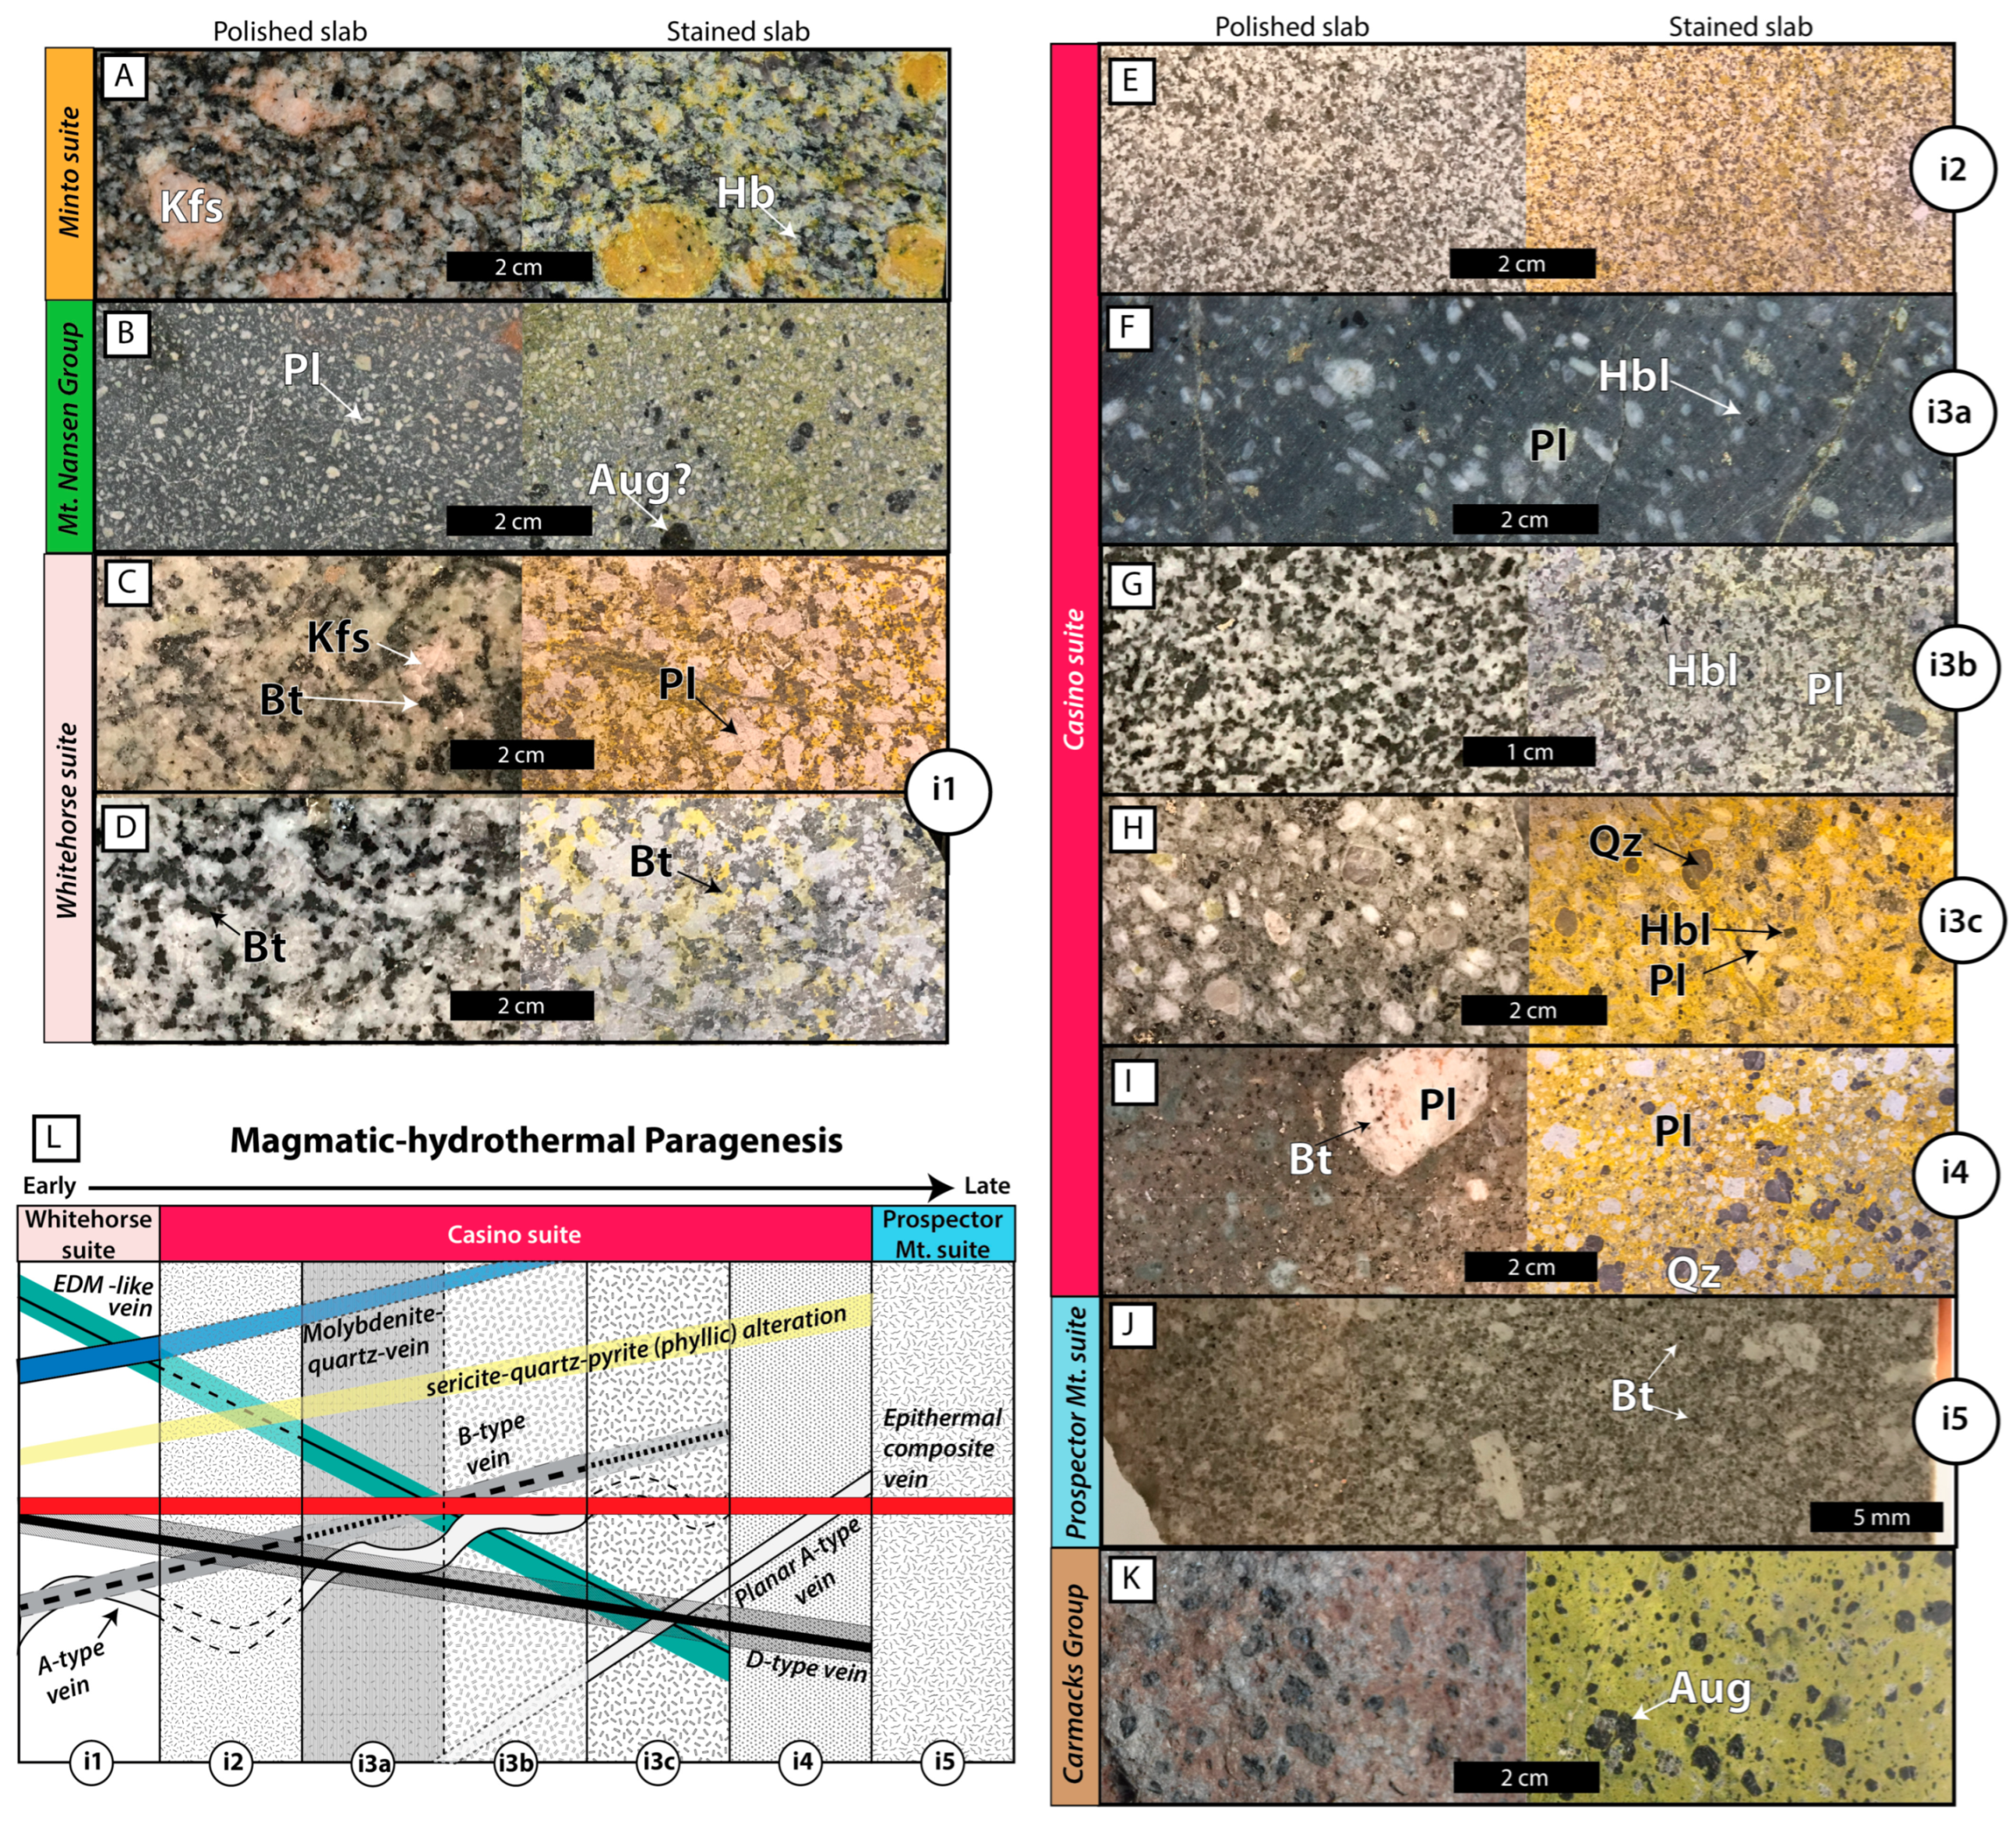
2.2. Magmatic–Hydrothermal Paragenesis and Alteration

A detailed description of the mineralogical, textural, and geochemical characteristics of the intrusive suites best seen in the Klaza deposit area is presented by Lee et al. [25] whereas its detailed hydrothermal history was summarized by Lee, W.-S., et al. [37]. This information is summarized in chronological order to form a framework for the analytical results presented herein. A shorthand nomenclature (i1 to i5) is used to simplify referencing of intrusive phases, as documented in the drill core, in paragenetic order, whereas stages (1 to 4) are used to define the hydrothermal events. Furthermore, a shorthand prefix of “p” and “v” (e.g., p-Pro and v-Pro) is used to indicate porphyry-related and epithermal vein-related alteration assemblages, respectively.
Four intrusive magmatic suites are present in the MNGC: (1) early Triassic Minto (Figure 2A); (2) mid-Cretaceous Whitehorse (120–90 Ma; Figure 2C,D); (3) Late Cretaceous Casino (80–72 Ma; Figure 2E–I); and (4) Late Cretaceous Prospector Mt. (72–65 Ma; Figure 2J). Geochemical fingerprinting of these suites using lithogeochemistry indicates they are all characterized by intermediate-to-evolved, calc-alkaline compositions and have a common lower-crust melt source [25].
The Minto suite intrusive rocks are medium-to-coarse-grained porphyritic foliated hornblende-granodiorite with K-feldspar phenocrysts. This suite is observed in outcrop NNE of the Klaza deposit where they unconformably underly Mt. Nansen Group volcanic rocks and are intruded by Whitehorse suite plutonic rocks [36]. Mt. Nansen Group andesitic rocks (Figure 2B) post-date the Minto suite, flank the Klaza deposit area (Figure 1C), and are intruded by the Whitehorse intrusive suite (i1; oldest intrusive suite documented in drill core) which is multiphase and consists of biotite granodiorite (Figure 2C) to biotite tonalite (Figure 2D). This unit is common at depth in the Klaza deposit and in the Kelly zone. The i1 phase is cut by subsequent magmatic units (i.e., dikes) and forms a primary host for hydrothermal (epithermal and porphyry) mineralization. The Casino suite consists of at least five phases (i2 to i4; Figure 2E–I) spanning hornblende diorite to biotite granodiorite compositions with porphyritic to equigranular textures, whereas currently only one phase is identified for the Prospector Mt. suite (described below as i5; Figure 2J). The Carmacks Group basalts (Figure 2K) do not occur in the deposit area but overlie the previously described lithologies in exposures ~ 10 km east of the Klaza deposit [36]. A summary of crosscutting relationships between the various intrusive phases and vein types is provided in Figure 2L.
The Casino suite phases (i2 to i3c), which are confined to the Kelly zone, display evidence of magma mingling as evidenced by gradational contacts (Figure 3A), cross-cutting relationships (Figure 3B–D), embayed quartz (Figure 3E), and sieve-textured plagioclase (Figure 3F,G). These phases also host porphyry-type mineralization (see below). In contrast, the i4 phase (Figure 2I) is a plagioclase porphyritic granodiorite that occurs as 10 cm to 3 m-wide dikes hosted in NW-trending structures throughout the deposit area. Mineral modes for each intrusive phase are provided in Table 1.
Porphyry-type mineralization and alteration (Stage 1): Four vein types localized to the Kelly zone are grouped together and these define the stage 1 event (Figure 2L). Intrusive phases observed at Klaza (i1 to i5) are described in their chronological order of formation based on cross cutting relationships; representative examples are shown in Figure 3. As the veins have features typical of high-temperature magmatic–hydrothermal events and generally conform to those described in typical calc-alkaline porphyry deposit settings, the nomenclature of Seedorff et al. [38] and Sillitoe [39] is herein adopted and used to describe them.
Figure 2. Polished (left) and stained (right; sodium cobaltinitrite) samples of important igneous rocks at Klaza. Note the unit name is provided on the left side of images. (A) Minto suite granodiorite with subhedral K-feldspar phenocrysts (surface sample). (B) Mt. Nansen Group andesite from adjacent to deposit area (surface sample). (C) Whitehorse suite (WS) hornblende-biotite granodiorite having a light propylitic overprint (Eastern BRX zone: KL-17-374; 75 m). (D) WS biotite-hornblende tonalite (KL-15-286; 93 m). (E) Casino suite (CS) monzogranite to granite (Kelly zone: KL-16-314; 117 m). (F) CS plagioclase(-biotite) phyric diorite (i3a phase). (G) CS hornblende diorite (Kelly zone: KL-16-314; 331 m). (H) CS plagioclase-quartz-biotite phyric granodiorite (Kelly zone: KL-16-314; 358 m). (I) Plagioclase-quartz(-biotite) phyric granodiorite (Kelly zone: KL-16-314; 453 m). (J) Prospector Mt. suite plagioclase phyric biotite diorite (Kl-14-193; 248 m). (K) Carmacks Group basalt (surface sample). (L) Timeline with crosscutting relationships among various intrusive phases and high- to low-temperature vein types at the Klaza deposit and Kelly prospect. Mineral abbreviations in accordance with Whitney and Evans [40].
Minerals 15 00038 g002
Figure 3. Images of drill core and polished thin sections (pts) in crossed nicols of various units in the Klaza deposit setting. (A) Gradational contact between i3a and i3b phases (Kelly zone: KL-16-314; 358.2 m depth). (B) Clast of i3a phase within i3b (Kelly zone: KL-16-314; 370.2 m depth). (C) Dike of i3a cutting i3b phase (Kelly zone: KL-16-314; 352.65 m depth). (D) Clast of i3b phase in the i3c phase (Kelly zone: KL-16-314; 358.8 m depth). (E) Pts image of embayed quartz grains in i4 phase dike. Note that the matrix is mostly sericite and biotite (surface sample). (F) Pts image of a relict sieve-textured plagioclase grain in a sericite-altered groundmass in i4 phase dike (Kelly zone: KL-16-314; 446.5 m). (G) Pts image of sieve-textured plagioclase grain intergrown with biotite and hornblende in i3b phase (Kelly zone: KL-16-314; 332.2m). (H) EDM-type vein overprinted by propylitic alteration with later fractures lined by pyrite and chalcopyrite (Kelly zone: KL-16-314; 442.3 m depth). (I) EDM-type vein cored by an A-type vein (Kelly zone: KL-16-314; 358 m depth). (J) A-type vein overprinted by phyllic alteration (Kelly zone: KL-16-314; 379.19 m depth). (K) B-type vein with pyrite overprinted by phyllic alteration (Kelly zone: KL-16-314; 114 m depth). (L) Quartz–molybdenite vein cut by epithermal-type pyrite and carbonate veins (Kelly zone: KL-16-314; 431 m depth). (M) D-type vein boarded by phyllic alteration (Central Klaza zone: KL-15-240; 146 m depth). (N) Tourmaline–quartz–muscovite–pyrite vein with associated phyllic alteration (Central Klaza zone: KL-12-133; 327.75 m depth). Mineral abbreviations in accordance with Whitney and Evans [40].
Minerals 15 00038 g003
The earliest veins are considered to equate to the early dark micaceous-(EDM) type as they are characterized by their dark biotite–muscovite nature (Figure 3H,I). They are 4 to 10 cm in width, are replaced by chlorite during subsequent propylitic overprinting (Figure 3H), and are commonly lined by quartz-pyrite ± chalcopyrite due to later reopening coincident with formation of later A- (Figure 3J) and D- (Figure 3M) type veins [41]. A less common variant of these veins is an earlier biotite (EB) vein type which has a K-feldspar selvage [37].
Sinuous A-type veins (Figure 3I,J) are uncommon relative to EDM veins. They are comprised of cloudy, granular quartz, are ~1 cm wide with pyrite–muscovite selvages, and rarely have chalcopyrite. A weak Fe-carbonate overprint on these veins is attributed to a later epithermal event (see below). B-type veins (Figure 3K) comprise centre-line pyrite–quartz stockwork veins and these are seen throughout the Kelly zone, but are most commonly hosted in the i2 phase of this zone. Potassic alteration is observed deep in the Central Klaza zone as a rare, magnetite–biotite ± K-feldspar alteration (see below). Although the A- and B-type veins are typically associated with potassic alteration in porphyry settings [38,39], these veins are commonly overprinted by phyllic (p-Phy) and propylitic (p-Pro) alteration in the Kelly zone (Figure 3J,K).
Quartz molybdenite veins (Figure 3L) are 3 to 10 cm wide, are hosted in the i1 phase, and are commonly cut by pyrite–arsenopyrite–carbonate veinlets associated with the later epithermal stages; consequently, these veins have a combination of phyllic (p-Phy and v-Phy) alteration haloes. The D-type veins (quartz–muscovite–pyrite; Figure 3M) are narrow (i.e., hairline-width) but have well-developed phyllic (p-Phy) alteration haloes of cm-scale. These veins have several variations, including a quartz–muscovite–pyrite–tourmaline ± rhodochrosite, which can form as breccia zones in the Central Klaza zone (Figure 3N).
Propylitic (p-Pro) alteration contains an assemblage of chlorite–hematite ± epidote ± pyrite. Chlorite replacing magmatic hornblende and biotite is the dominant alteration mineral, whereas trace hematite occurs in magmatic K-feldspar which can lend it a red to orange appearance. The assemblage is extensive on the deposit scale with a minor overprint even seen on the least altered samples. This assemblage occurs syn-to-post D-type vein formation, and, therefore, overprints stage 1 veins and p-Phy alteration.
Prospector Mt. suite: A Prospector Mt.-age dike (ca. 72 Ma) was first reported by Mortensen et al. [17] amongst other Casino-age dikes; importantly this age has since been reproduced in this study (see below). This previously unrecognized intrusive phase (i5) is highly altered and only pseudomorphs of primary feldspar minerals are preserved amongst remnant primary biotite, secondary illite and calcite (Figure 2J). The i5 phase, which has a slightly alkalic nature [18], is seen as biotite–plagioclase-bearing dioritic dike rocks which occur co-spatially with the i4 phase; however, this phase is less voluminous than the i4 phase. It differs from the i4 phase in its lack of resorbed quartz phenocrysts and displays an overall lower silica content; however, it also displays features of magma mingling with the i4 phase (Figure 4A). The i5 phase is cut (Figure 4B,C) and brecciated (Figure 4D) by Stage 2b (see below) epithermal mineralization, therefore, it forms an upper time constraint to the mineralization.
Epithermal-type mineralization and alteration (Stage 2): The stage 2 veins constitute the main-ore stage at Klaza and comprises three sub-stages (Figure 4) with the mineralogy zoned laterally (on the deposit scale) with respect to the inferred heat source, thus from hotter (SE) to colder (NW). Detailed petrographic observations and supporting micro-analytical data for these hydrothermal stages are beyond the scope of this study and are instead discussed elsewhere [42].
Stage 2a veins are massive pyrite ± arsenopyrite veins that are cut by later white, cloudy (due to abundant fluid inclusions) quartz ± chalcopyrite ± enargite veins (Figure 4E,F). The abundance of arsenopyrite increases towards the NW, away from the heat source (Figure 4F), whereas the abundance of both chalcopyrite and enargite increases toward the heat source (SE). Stage 2b veins are banded arsenopyrite–sphalerite–pyrite-bearing smoky quartz veins, their textures indicating repeated dilation and fill of these antitaxial-like veins (Figure 4E,G). Petrographic and LA-ICP-MS analysis indicate that Au occurs as electrum inclusions and also as a refractory phase (i.e., invisible Au) in arsenopyrite and pyrite from both Stage 2a and Stage 2b [42]. Stage 2c veins comprise quartz–galena–sphalerite–sulfosalt ± chalcopyrite fill (Figure 4G,H). These veins cut Stage 2a veins and locally form jigsaw breccias. Quartz occurs as euhedral crystals occluding space following semi-massive infill by galena and sphalerite. Intergrown sulfosalts include several Ag-bearing phases such as tetrahedrite, pyrargyrite, and argentite (now acanthite). Galena is also argentiferous and contains intergrowths of boulangerite, argentite, and Ag–tetrahedrite (Figure 4I,J). The sulfosalts are zoned laterally and vertically, thus Ag- and Pb-rich phases occur in the Western Klaza zone (NW), whereas the Ag-content of tetrahedrite decreases with depth. In addition, chalcopyrite abundance increases with depth.
Epithermal carbonate veins (Stage 3): Sulfides hosted in carbonate veins are minor contributors to the overall Ag–Pb–Zn budget of the ore system. This vein stage cuts stage 1 and stage 2 assemblages and occurs as breccia (Figure 4D) or narrow veins (Figure 3L and Figure 4C,H) and vein swarms. The carbonate type varies and includes ankerite, dolomite, calcite, and rhodochrosite with dolomite being the most abundant phase. Clasts of Pb–Zn sulfide phases are commonly observed in this stage (Figure 4H); however, primary galena and sphalerite are observed to be intergrown with bladed barite phases (Figure 4K), colloform, and moss-textured carbonate (Figure 4L). The bladed barite and colloform ± moss-textured carbonate phases, features commonly attributed to fluid boiling [43], are observed at shallow depths (75–125 m) and generally post-date the deposition of the precious- and base metals seen in Stage 2.
Cataclasis (Stage 4): Stage 4 is syn- to post-stage 3 and occurs in the form of extensive shearing and cataclasis along the composite-vein-hosting fault structure. Vein-hosting faults display evidence of post-mineral movement, such as clay-altered fault gouges on the margin of mineralized quartz veins (Figure 4M). This cataclasis is seen as polymictic breccias with sub-rounded clasts of earlier vein material of all stages, the various intrusive phases (i1, i4, and i5), silicified breccias (Figure 4N), and rock flour.
The epithermal event forms wide, complex, composite veins due to their strong structural controls. The noted textural relationships between substages and vein stages described above are summarized in Figure 4O. Alteration associated with the epithermal stages is described below.
A transect depicting the typical changes in alteration mineralogy from wall rock to mineralized veins that relates to the epithermal type mineralization is shown in Figure 5A–C and summarized graphically in Figure 5D. Stage 2 veins are associated with a proximal, phyllic (v-Phy; muscovite–illite–quartz–pyrite ± sphalerite ± galena) alteration halo. This assemblage occurs in very narrow (cm-scale) intervals beside composite epithermal veins (Figure 5A,C). This halo is bleached white because of extensive muscovite alteration resulting from acid-alteration near the fluid-infiltrating structure. Fine-grained sphalerite and galena are observed in addition to pyrite and hairline D-type quartz–pyrite–muscovite veins.
The epithermal veins are also associated with a distal, propylitic (v-Pro) alteration halo. This assemblage mainly consists of chlorite–epidote–Fe–Mg–carbonate–rutile and illite–muscovite intergrowths. It is characterised by a 1–2 cm wide chlorite–leucoxene (rutile) band on its outer margin and the limit of mafic minerals (hornblende–biotite–magnetite). Importantly, the lack of magnetite in this alteration allows related vein and alteration zones to be modeled using magnetic susceptibility measurements. Its width (4 m to several m) varies according to degree of brecciation of the host, which is a function of structural preparation. The Fe–Mg–carbonate is more extensive and is observed up to 8 m from the sulfide veins. This footprint is best seen in oxidized drill-core (Figure 6) due to carbonate oxidation (bright orange; Figure 6C,E) or using carbonate staining protocols [44].

3. Methodology

A detailed magmatic–hydrothermal paragenesis is used to provide geologic context for all analytical techniques discussed below. The methodologies are elaborated in detail in Supplementary Text S1 (Ar–Ar muscovite and Re–Os molybdenite geochronology), Supplementary Text S2 (CA-TIMS zircon geochronology), and Supplementary Text S3 (and LA-ICP-MS U–Pb zircon geochronology and trace element analysis).

3.1. Field Work and Paragenesis

Sampling and field work totalling four months were conducted at Klaza in the 2017 and 2019 field seasons. The paragenesis of magmatic and hydrothermal events was established through a combination of drill-core logging, which provided crosscutting relationships, detailed petrography (transmitted and reflected light complemented with scanning electron microscopy and energy dispersive spectroscopy (SEM-EDS)), whole-rock lithogeochemistry, and geochronology (U–Pb zircon (CA-TIMS and LA ICP-MS), Re–Os molybdenite, and 40Ar/39Ar muscovite). A list of samples and their locations is provided in Supplementary Table S7.

3.2. Geochronology

40Ar/39Ar in muscovite: Three representative samples of phyllic- (muscovite–pyrite–quartz) altered rocks from the Klaza deposit were collected and made into thin sections to verify the presence of muscovite. Subsequently, samples were irradiated at the Oregon State TRIGA Reactor, Corvallis, Oregon, USA, and analysed by the furnace step-wise heating method at the Nevada Isotope Geochronology Laboratory at the University of Nevada Las Vegas (UNLV), USA, following the procedures outlined in Zamora-Vega et al. [45].
Re–Os in molybdenite: Two samples of molybdenite-bearing hydrothermal veins were collected from drillcore at the Kelly zone (Klaza) and from the Flex zone (Brown-McDade) in 2020 were submitted to the Re–Os Crustal Geochronology Laboratory at the University of Alberta with the employed methods for Re–Os analysis described in detail by Selby and Creaser [46].
U–Pb in zircon (zircon separation): Twelve samples of feldspar porphyritic intrusive dikes from the Klaza deposit were collected and sent to Overburden Drilling Management Laboratories in Ottawa, Canada, where they underwent mineral separation using electric-pulse disaggregation. Zircon grains were extracted through the use of a shaking table and micropanning the table concentrate followed by hand-picking of the pan concentrate at Laurentian University.
U–Pb zircon (CA-TIMS): Four samples were sent to the Isotope Geology Laboratory at Boise State University, USA, in 2018 for CL imaging and LA-ICP-MS analysis. Subsets of zircons from each sample were then selected from the LA-ICP-MS-analysed zircons and dated by chemical abrasion isotope dilution thermal ionization mass spectrometry (CA-TIMS; [47]).
U–Pb zircon (LA-ICP-MS): Ten samples were sent to the Isotope Geology Laboratory at the University of Alberta, Canada, in 2018for CL imaging and LA-ICP-MS analysis following the methods of Simonetti et al. [48]. Each analytical run includes periodic analysis of a primary reference material interspersed through the analytical session, to which the raw data for unknown samples were normalized to correct for instrumental bias and within-run drift. Secondary reference materials were also analysed, and the results are in agreement with standard values (Supplementary Table S5).

3.3. Zircon Trace Element Analysis

Zircon trace element analyses were conducted at the Mineral Exploration Research Centre Isotope Geochemistry Lab (MERC-IGL), at Laurentian University, Sudbury, Canada. The zircons analysed were those used for dating (see above) and the analysis overlapped pre-existing laser ablation spots (40 µm). Reference materials were analysed multiple times at the beginning and end of each session, and once every ten unknowns throughout the session. Three seconds at the beginning and two second at end of the ablation period were excluded from the spectra in order to minimize potential fractionation effects. Iolite v3.6 [49,50] was used for data reduction.

4. Results

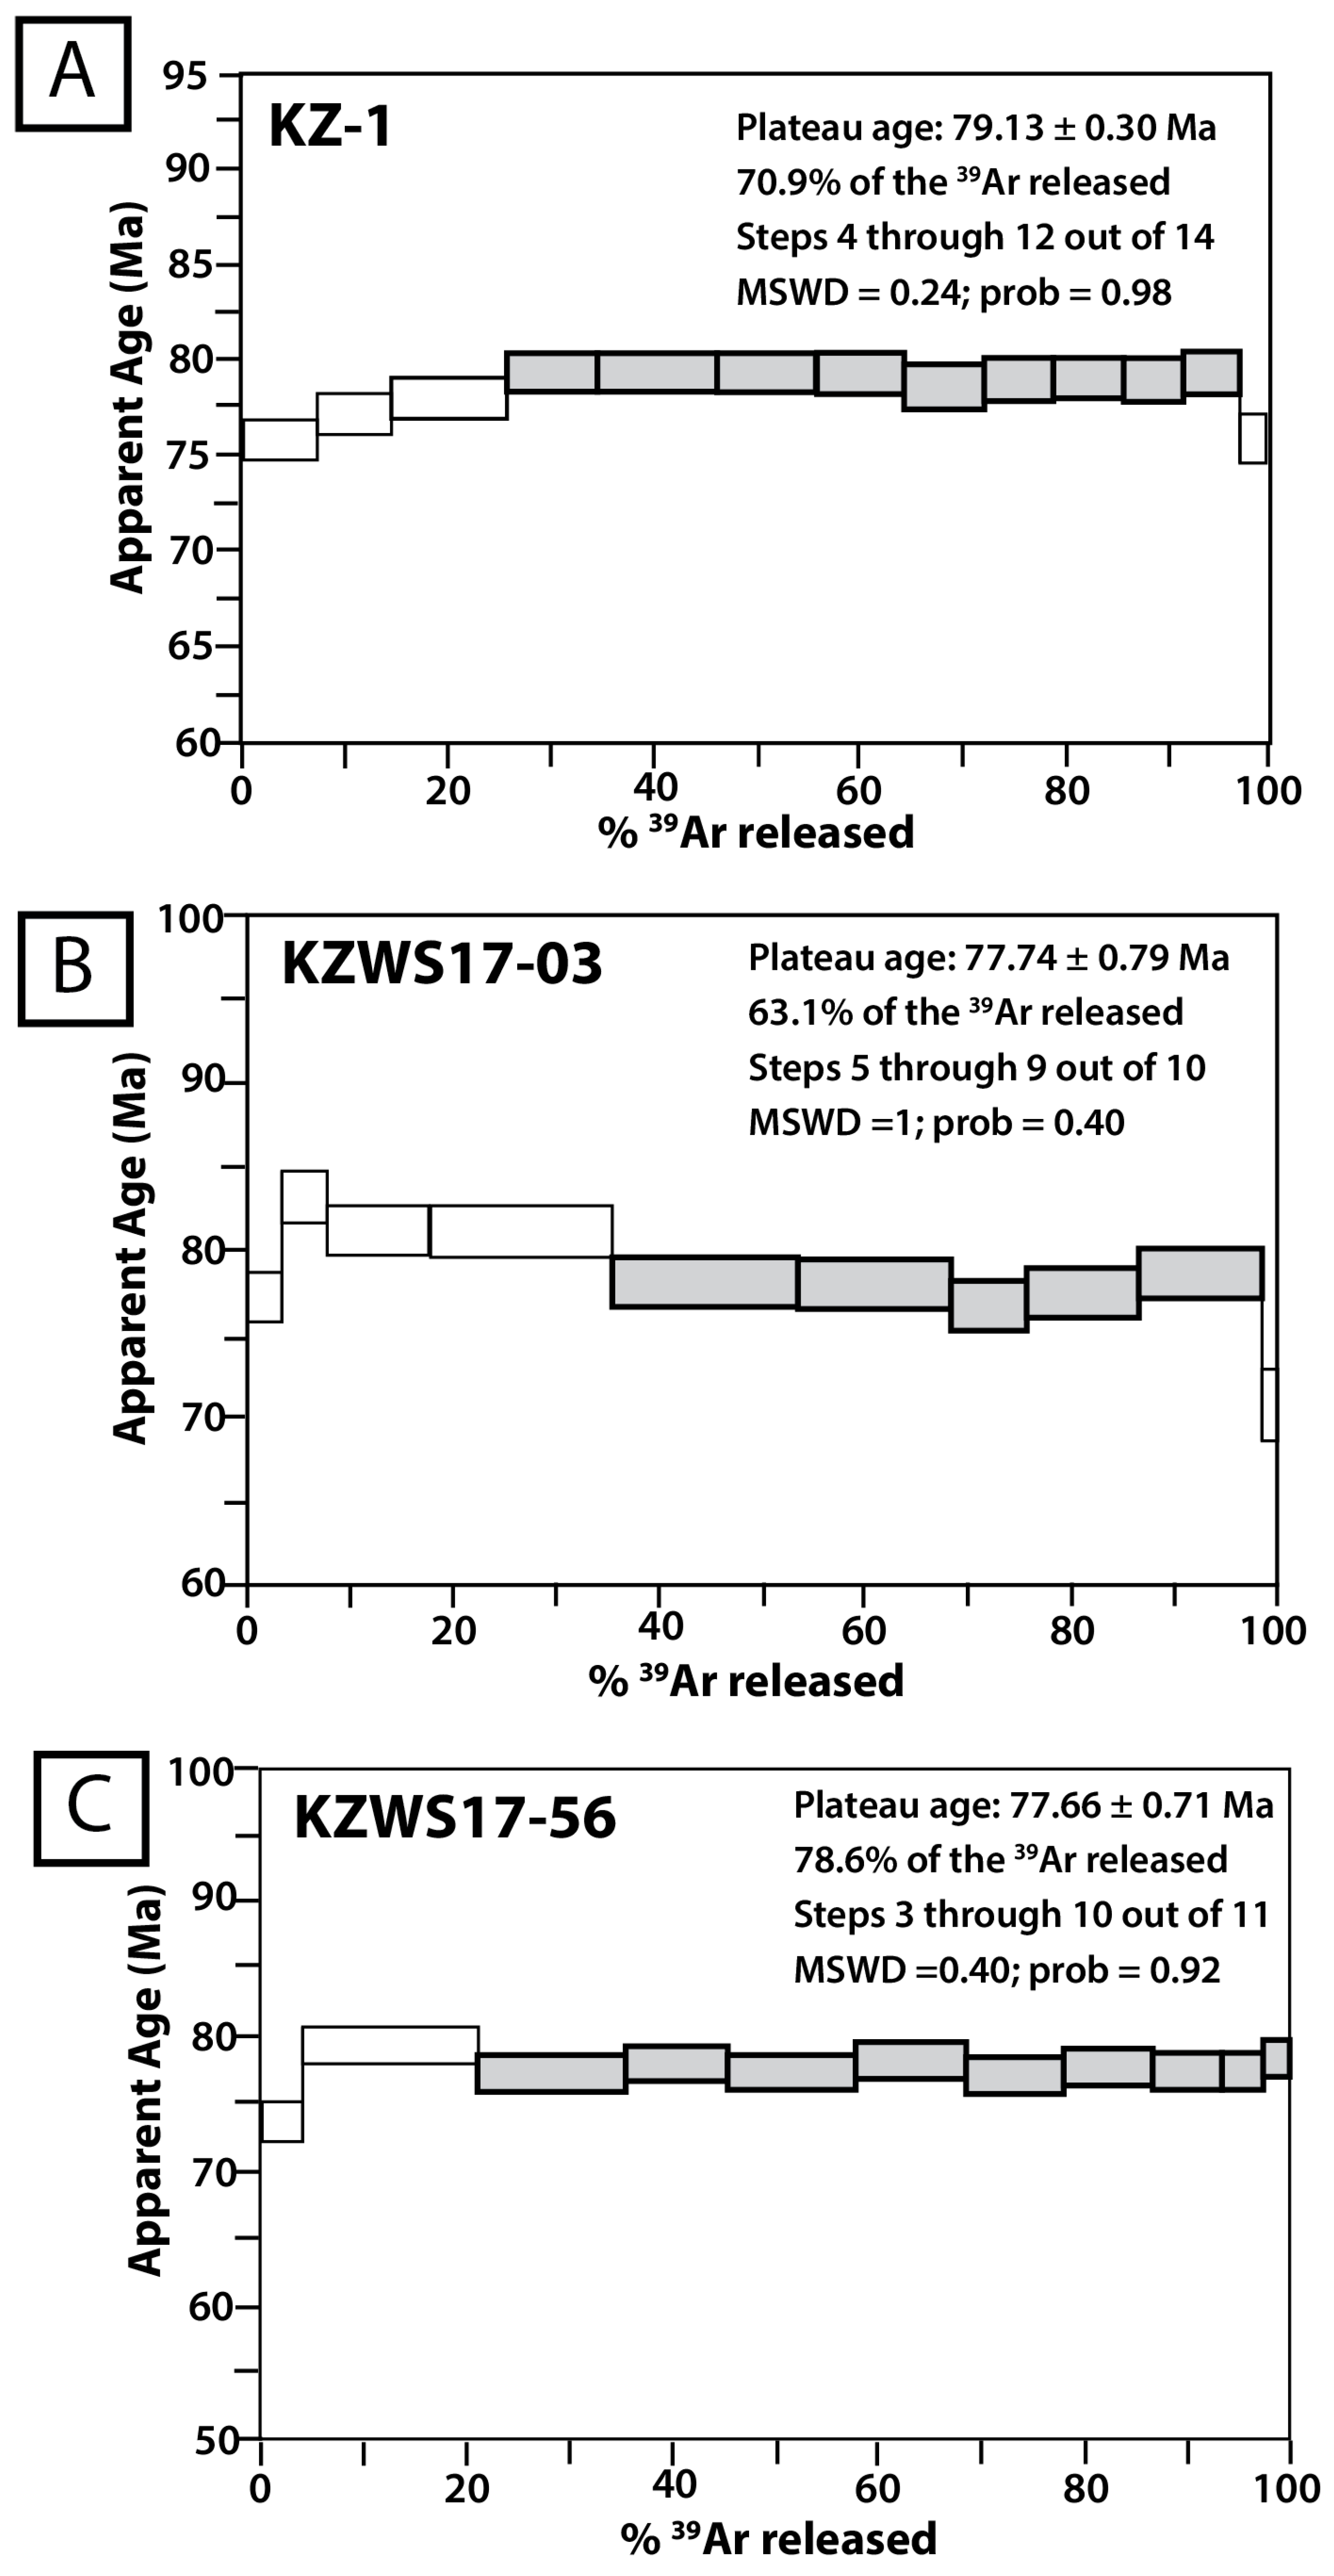
4.1. 40Ar/39Ar Muscovite Geochronology

Three samples of Whitehorse suite granodiorite with secondary muscovite were analysed using the 40Ar/39Ar stepwise heating method to determine the timing of phyllic (p-Phy) alteration. The full results are provided in Supplementary Table S1, whereas age spectra are summarized in Figure 7. The plateau ages given follow the criteria of Fleck et al. [51].
Sample KZ-1 is a stage 1 muscovite–pyrite–quartz D-vein (ddh KL-12-133, 441 m depth) from the Central Klaza zone. It yielded a plateau age of 79.13 ± 0.30 Ma (Figure 7A; MSWD = 0.24) based on 70.9% of the gas released. The low-temperature gas fraction reflects a slight thermal overprint at <76 Ma.
Sample KZWS17-03 is a muscovite–pyrite–quartz alteration halo (Figure 3M) associated with a stage 1 D-vein from the Central Klaza zone (ddh KL-15-240, 146 m depth). It yielded a plateau age of 77.74 ± 0.79 Ma (Figure 7B; MSWD = 1) based on 63.1% of the gas released.
Sample KZWS17-56 is a stage 1 (early) muscovite–tourmaline–quartz–pyrite vein/breccia from the Central Klaza zone (ddh KL-12-133, 93 m depth). It yielded a plateau age of 77.66 ± 0.71 Ma (Figure 7C; MSWD = 0.4) based on 78.6% of the gas released.

4.2. Re–Os Molybdenite Geochronology

The results for the two samples analysed are tabulated in Table 2. A sample of white quartz vein with pyrite and molybdenite mineralization was taken from the Flex zone (DDH260B-160) of the Brown-McDade cluster (Figure 1C). This sample yielded an age of 108.5 ± 0.5 Ma. Replicate analyses showed similar, reproducible Re–Os dates with no significant difference.
A sample from the Kelly zone (KL-481, 387.1m; Figure 1C) contained blebby-to-disseminated molybdenite in a sinuous (A-type?) quartz vein, which is cut by a planar quartz vein. This sample yielded a Re–Os age of 76.3 ± 0.4 Ma.

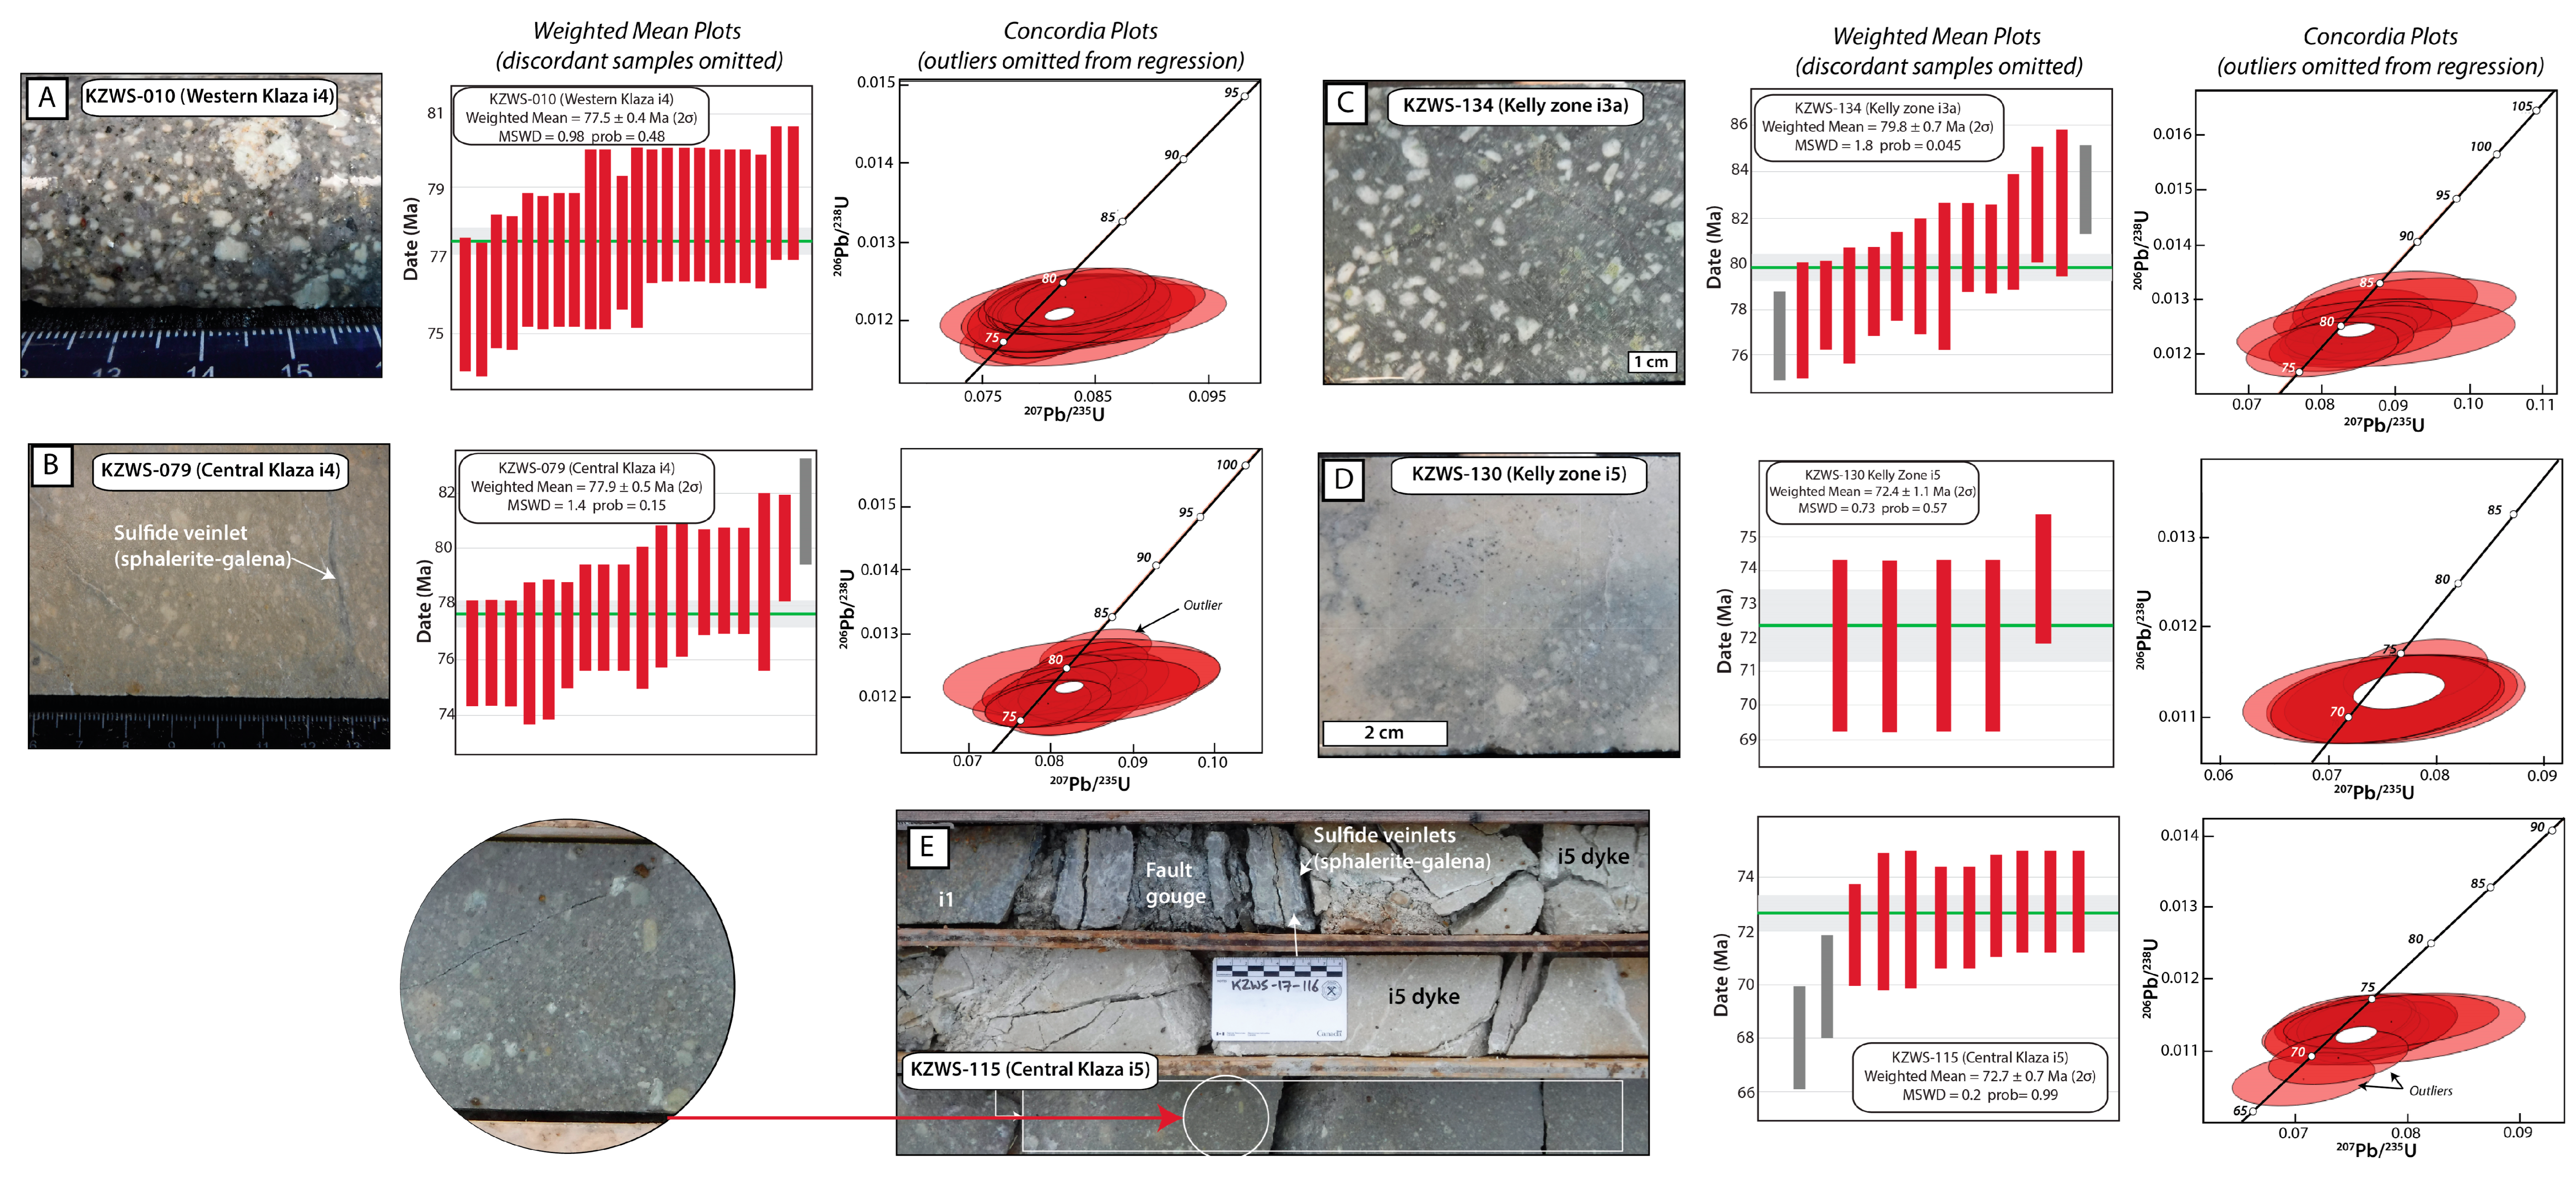
4.3. U–Pb Geochronology

Representative samples of the intrusive phases were processed for CA-TIMS (four samples) and LA-ICP-MS (five samples) U–Pb zircon geochronology. The results are tabulated in Supplementary Tables S2 and S5, respectively, whereas images of the dated samples and relevant plots of the age data are presented in Figure 8 and Figure 9. We use the term “date” for analytical results, whereas “age” refers to the interpretation.
CA-TIMS analysis:
Twenty-five zircon grains from KY-19-17 (i2 phase of Casino suite; Figure 8A) from the Kelly zone yielded LA-ICP-MS dates of 100.5 ± 6.1 to 67.2 ± 5.7 Ma. Five grains were analysed by CA-TIMS, with the four youngest dates yielding a weighted mean of 77.97 ± 0.02 Ma (Mean Square of Weighted Deviation (MSWD) = 2.2, probability of fit = 0.09) which is the interpreted igneous crystallization age. The single grain with a date of 78.05 ± 0.07 is interpreted as containing an inherited component.
Sixty-two zircon grains from KY-19-09 (i3a phase of Casino suite; Figure 8B) from the Kelly zone yielded LA-ICP-MS dates of 79.4 ± 2.4 to 67.4 ± 4.4 Ma. Six grains were analysed by CA-TIMS, with the five youngest dates yielding a weighted mean of 77.57 ± 0.02 Ma (MSWD = 0.72, probability of fit = 0.58) which is interpreted as the igneous crystallization age. The other grain with a date of 77.73 ± 0.06 Ma is interpreted as containing an inherited component.
Sample KZWS-009 is a plagioclase–quartz–hornblende–biotite–phyric granodiorite dike (i4 phase of Casino suite; Figure 8C) from the Western Klaza zone. Twenty-one grains were analysed by LA-ICP-MS and yielded dates of 83.3 ± 3.2 to 73.0 ± 2.5 Ma whereas 15 grains yielded equivalent dates with a weighted mean of 76.8 ± 1.4 Ma (MSWD = 1.4, probability of fit = 0.14). CA-TIMS on six grains yielded equivalent dates with a weighted mean of 76.57 ± 0.02 Ma (MSWD = 2.2, probability of fit = 0.06) which is interpreted as the igneous crystallization age.
Sample KZWS-045 is a plagioclase–biotite–phyric diorite dike (i5 phase of the Prospector Mt. suite; Figure 8D) sampled from the Central Klaza zone. Twenty-six grains analysed by LA-ICP-MS yielded dates of 81.3 ± 5.0 to 67.0 ± 2.0 Ma, whereas nineteen grains yielded equivalent dates with a weighted mean of 72.2 ± 1.3 Ma (MSWD = 1.6, probability of fit = 0.05). CA-TIMS was performed on six grains, the five youngest of which yielded equivalent dates with a weighted mean of 71.37 ± 0.02 Ma (MSWD = 1.5, probability of fit = 0.19) which is interpreted as the igneous crystallization age. The other date of 71.48 ± 0.05 is from a grain that is interpreted as having an inherited component.
LA-ICP-MS analysis: For these samples, the results are all summarized in Figure 9 where data are presented in both weighted mean and Concordia plots. In all samples, the former age (where applicable) based on the youngest zircon(s) dates is interpreted to represent the best estimate of the time (i.e., age) of crystallization for the host samples.
KZWS-010 is an i4 phase plagioclase quartz–porphyritic biotite–phyric dike from the Western Klaza zone. Twenty-two of the thirty analyses yielded concordant dates between 75 ± 2 and 79 ± 2 Ma (Figure 9A). A weighted mean date of 77.5 ± 0.4 Ma (MSWD = 0.98) is yielded for all concordant dates in the sample.
KZWS-079 is an i4 phase plagioclase–quartz porphyritic dike from the Central Klaza zone. Of the 25 zircons analysed, 18 were concordant with dates between 76 ± 2 and 81 ± 2 Ma (Figure 9B). The oldest date is interpreted to be from an inherited zircon (xenocryst) and treated as an outlier. The weighted mean date of 77.9 ± 0.5 Ma (MSWD = 1.4) is yielded for all concordant dates in the sample.
KZWS-134 is a porphyritic plagioclase phyric dike (i3a phase) from the Kelly zone. The 14 (out of 25 analysed zircons) concordant dates range between 77 ± 2 and 84 ± 2 Ma (Figure 9C). Two concordant dates are flagged as outliers and are interpreted to be: (a) antecrystic (older date) and a potentially younger autocryst at 77± 2 Ma, which overlaps in age with CA-TIMs dates from sample KY-19-09; or (b) a result of Pb loss. Although the weighted mean date (79.8 ± 0.7 Ma; MSWD = 1.8) for all concordant zircons (excluding the two outliers) is a plausible crystallization age of the sample, the crystallization age for the i3a phase is likely to be slightly younger at ~77.5 Ma as resolved by CA-TIMS dating.
KZWS-130 is an i5 plagioclase phyric diorite dike from the Kelly zone (Figure 9D). The analysis of 13 zircons yielded three clusters of dates: (1) three between 90 ± 2 and 115 ± 2 Ma which equate to the Whitehorse plutonic suite; (2) five between 74 ± 2 and 78 ± 2 Ma which equate to Casino suite magmatism; and (3) five with similar dates of 71 ± 2 and 72 ± 2 Ma for which only the youngest dates are concordant. The crystallization age of this sample is interpreted to be the weighted mean age calculated from the five concordant dates at 72.4 ± 1.1 Ma (MSWD = 0.7).
Sample KZWS-115 is from an i5 phase diorite dike which is cut by 1 cm-wide sulfide veins (sphalerite–galena) and is in contact with a 10 cm-wide fault gouge that contains clasts of sulfides and vein material. The dike contains argillic alteration up to 2 m from the fault gouge (Figure 9E). The 27 analysed zircons yielded a range of dates: (1) five discordant zircons with mid-Cretaceous dates between 90 ± 2 and 115 ± 2 Ma which equate to the Whitehorse plutonic suite; (2) three to four discordant zircons between 82 ± 2 and 88 ± 2 Ma that do not equate to known pulses of magmatism in the region and which may, therefore, reflect Pb loss; and (3) the 11 remaining zircons range from 75 ± 2 to 68 ± 2 Ma with the majority of these concordant and yielding a date of ca. 72 Ma with the youngest at 68 ± 2 Ma. Among these 11 concordant zircons, the two with the youngest dates are flagged as outliers and could be the youngest autocrysts in this intrusive phase but are not included in the weighted mean age of 72.7 ± 0.7 Ma (MSWD = 0.2). As the dike is cut by sulfide veins, it provides a maximum age for epithermal mineralization.

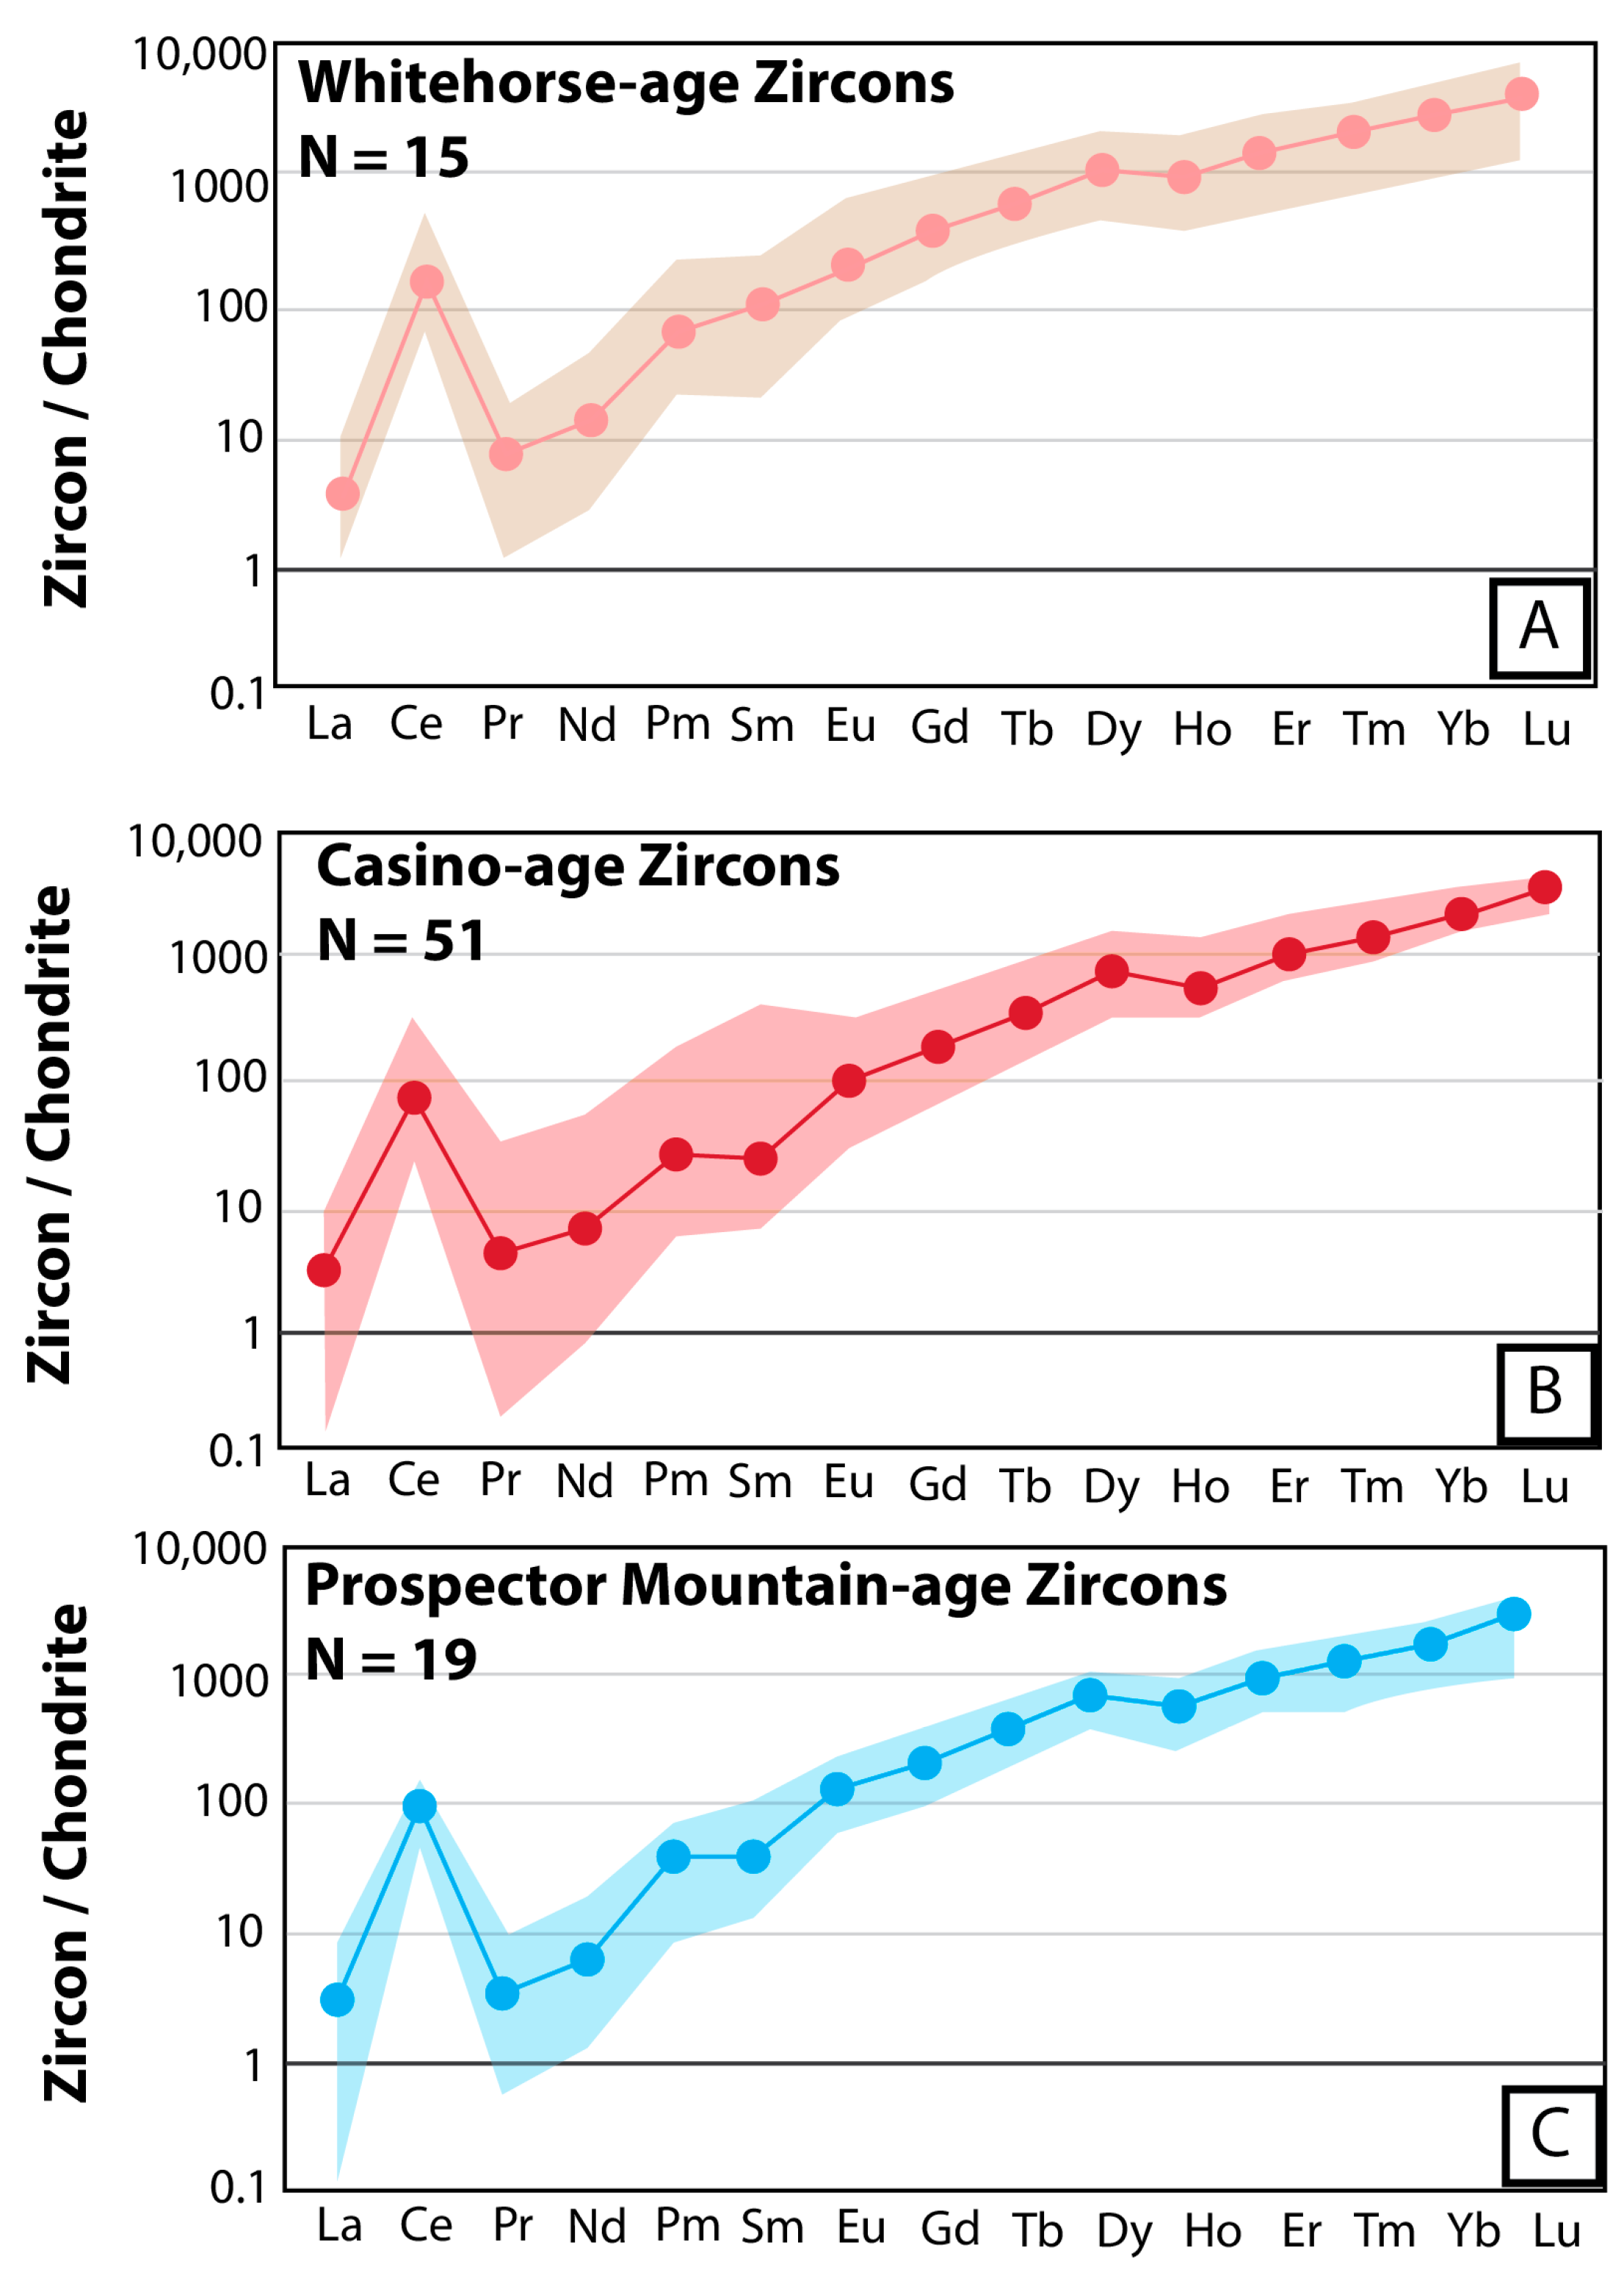
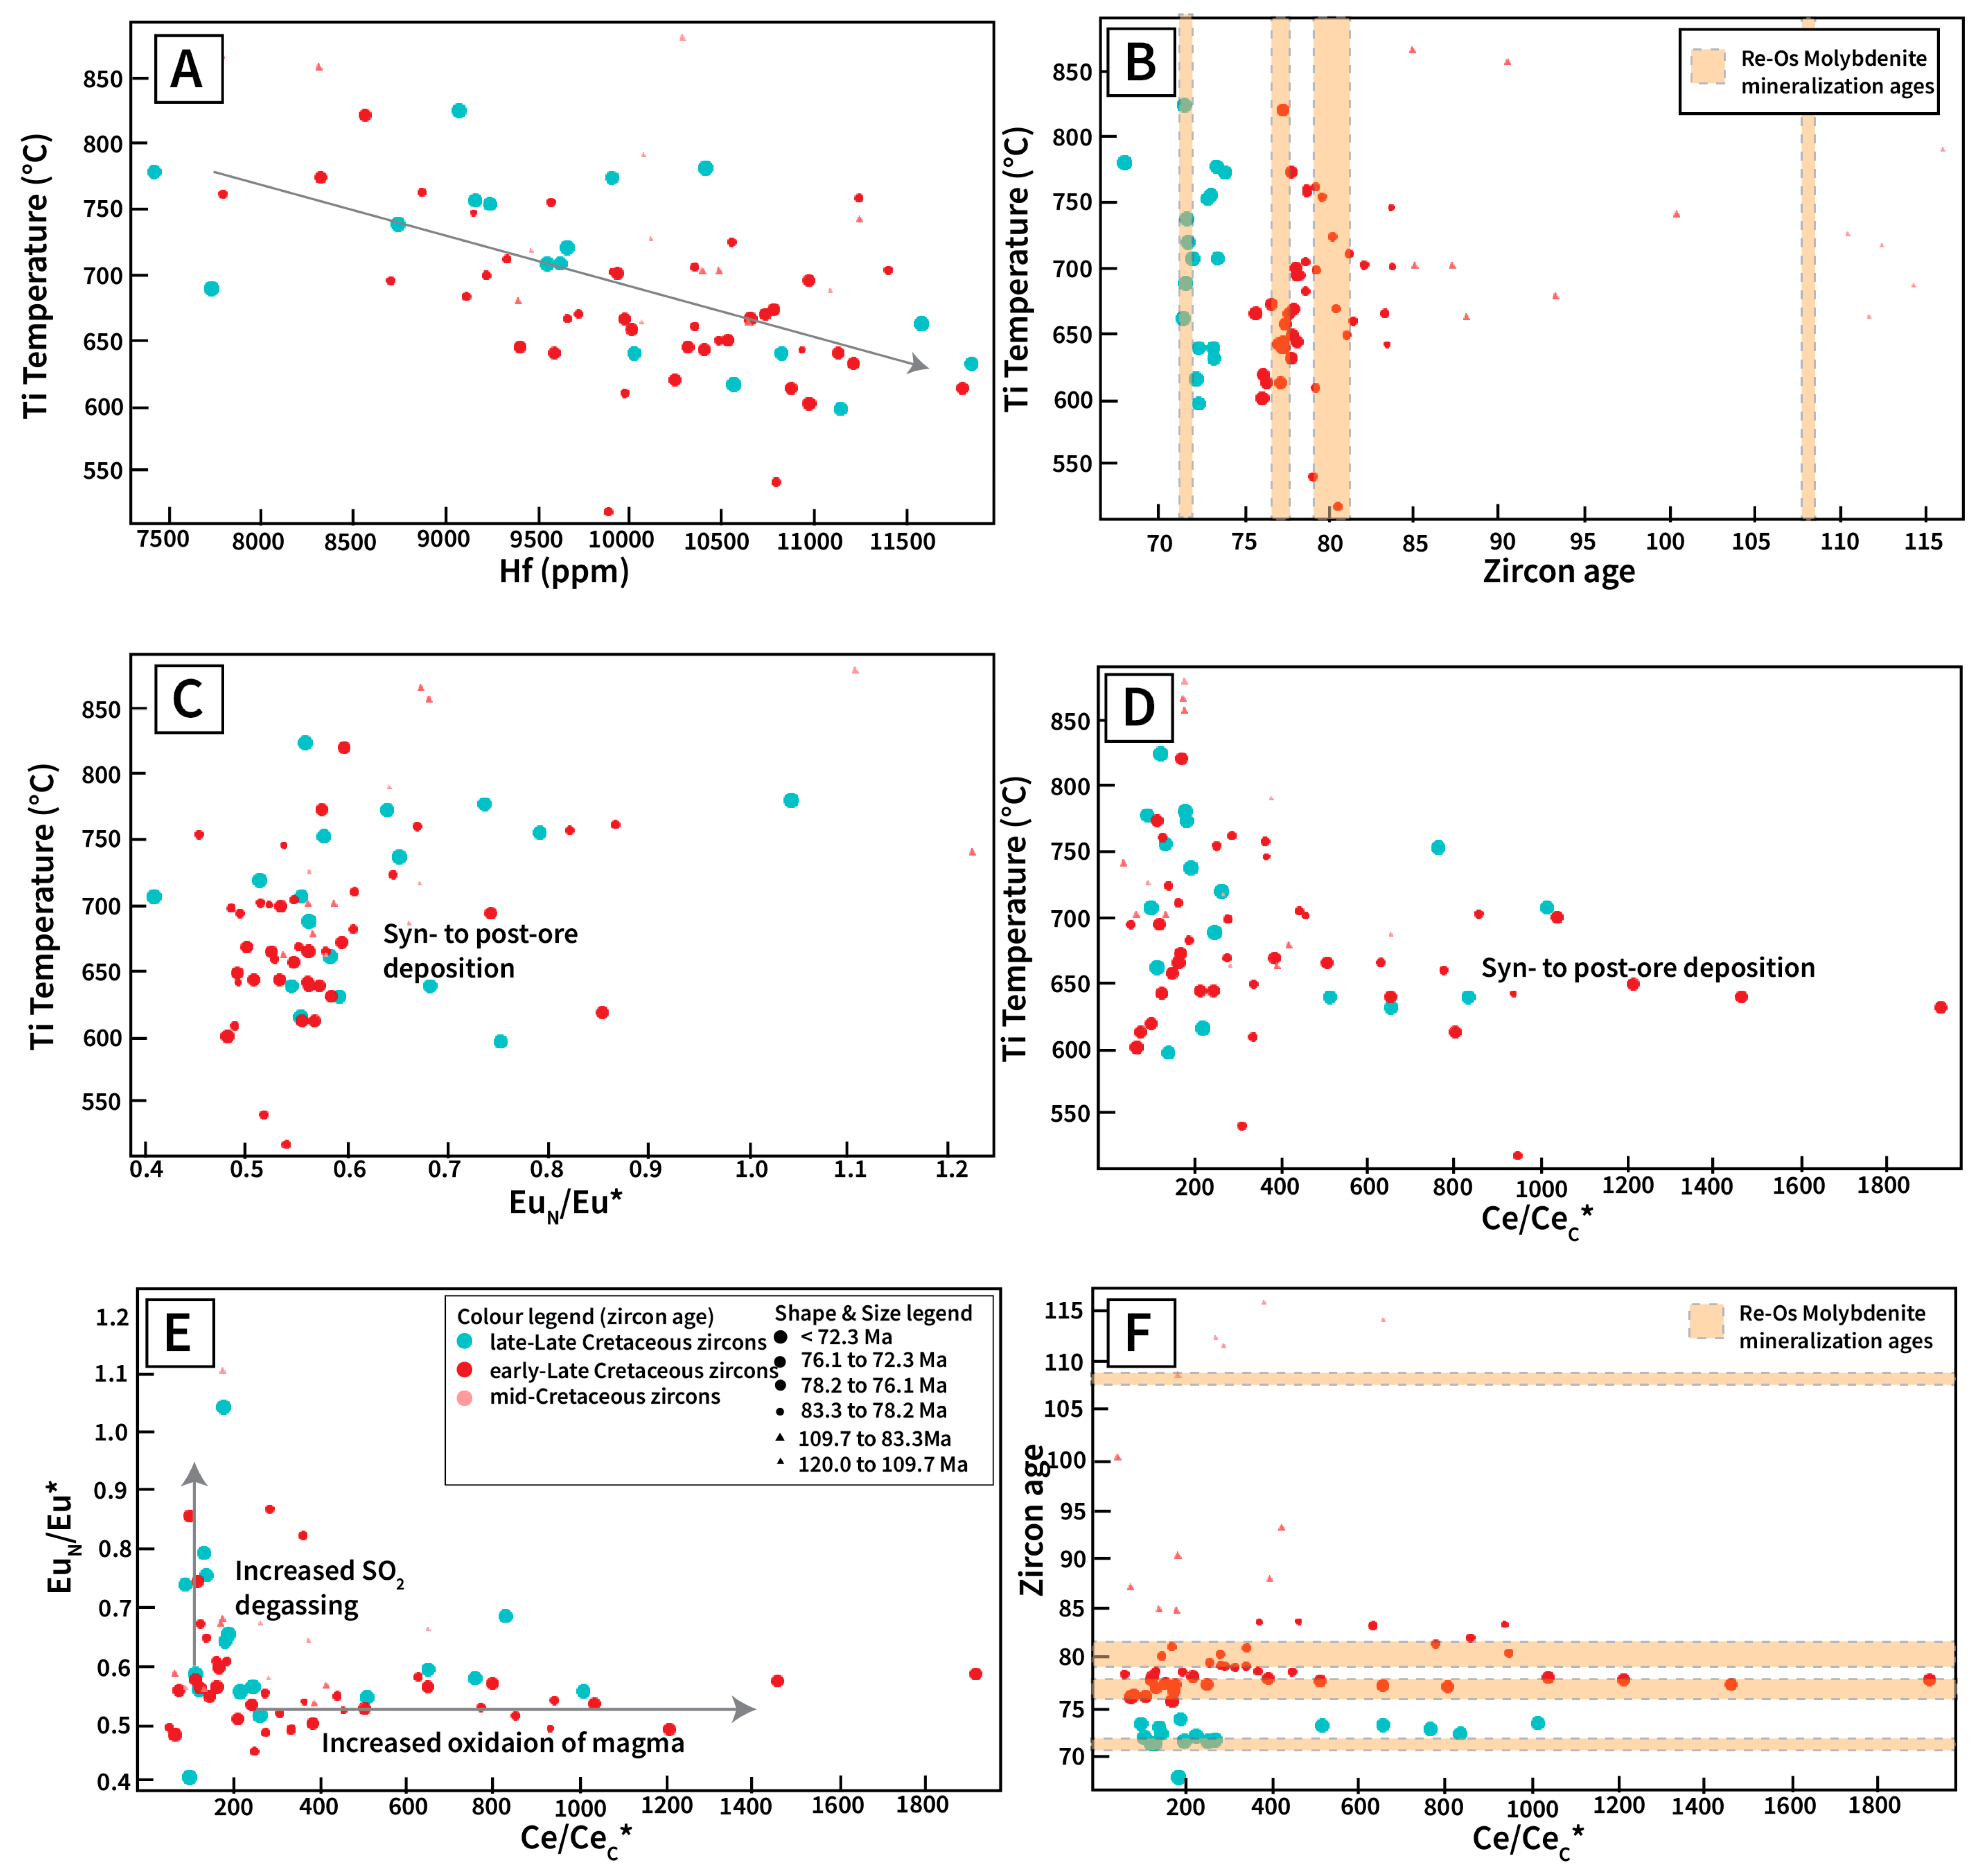
4.4. Zircon Trace Element Geochemistry

Zircon grains used for in situ dating were also analysed for trace elements which included REE. As with dating, the points selected for analysis were based on CL imaging to selected areas of magmatic growth and to avoid xenocrystic areas or where post-crystallization alteration may have occurred [52,53]. Based on the results of U–Pb dating, samples are grouped according to their ages and hence intrusive suites rather than simply by samples or host due to the issue of inheritance. A summary of igneous zircon provenance is provided in Figure 10, whereby the inheritance of both xenocrystic and antecrystic zircons is illustrated.
Screening of data: The zircon analyses (N = 128; see Supplementary Table S6, Sheet A) were filtered to remove anomalous data based on the criteria of Lu et al. [54], which includes: (1) apatite contamination (La > 2.5 ppm; N = 29); and (2) titanium contamination from titanite (Ti > 50 ppm; N = 12). Of the remaining zircon data (N = 87), 19 are Prospector Mt. age, 51 are Casino age, seven are Whitehorse suite age (112–110 Ma), and eight are a younger pulse of Whitehorse suite rock (100 to 88 Ma). It is noted here that the dates for individual zircon U–Pb analyses have uncertainties of ± 2–3 Ma, therefore, the distinction between Casino- and Prospector Mt.-age zircons may be limited in extent.
At current detection limits, the chondrite-normalized REE profiles of zircons from each intrusive suite appear relatively similar (i.e., distinct Ce anomalies, enriched HREEs, and slight Sm anomalies in Late Cretaceous-aged zircons; Figure 11). However, trace element plots (Figure 12 and Figure 13) show distinct differences in zircon types that can be grouped by their age. Thus, in the following discussion, three groups of zircon ages are frequently referenced (Figure 12F): (1) older Casino age (CAZ-1; 84–77 Ma); (2) younger Casino age (CAZ-2; 76–74 Ma); and (3) Prospector Mt. age (PMZ; 72–68 Ma).
Fractionation trends: The progressive fractionation in each suite is tracked via the change in trace elements in zircon using several proxies, these being Hf, Y, U, Th and REE. Thus, progressive differentiation is reflected by an increase in Hf [55,56,57] or decreasing Th/U ratio [56,57,58,59]. In addition, the crystallization of amphibole removes Y from the melt and thereby the Hf/Y ratio increases [59,60,61]. In this regard, all three zircon groups show chemical signatures indicative of amphibole crystallization (Figure 12A), as supported by the presence of amphibole in both Casino and Prospector Mt. suite rocks.
The CAZ-1 is less evolved relative to the CAZ-2 based on Hf/Y and Yb/Gdn versus Th/U plots (Figure 12A,B), which is further supported by the diorite (i3a) versus granodioritic (i3c and i4) compositions of these suites, respectively; the PMZ is intermediate compared to these suites. The Yb/Gdn ratios of zircons from all three groups are low (<8; Figure 12C) and, as noted by Richards et al. [61], such values suggest a role of garnet fractionation in the melt history (i.e., high-pressure), but the PMZ is clearly more enriched in Gdn for a given Ybn value (Figure 12D). CAZ-1, CAZ-2, and PMZ display similar ranges of Sm/Cen (Figure 12C); however, CAZ-2 displays elevated Yb/Gd ratios relative to PMZ for a given Sm/Cen.
Figure 11. Plots of chondrite-normalized REE values for each group of zircons showing the range in grey and averages marked by dots. The diagrams are arranged in the order of Whitehorse suite (A), Casino suite (B) and Prospector Mountain suite (C). Chondrite data from Sun and McDonough [62].
Minerals 15 00038 g011
Figure 12. Summary of the trace element chemistry of zircons from different phases at the Klaza setting. (A) Binary plot comparing Hf/Y with Th/U. (B) Binary plot comparing Yb/Gd with Th/U. (C) Binary plot comparing Yb/Gd with Sm/Ce. (D) Binary plot comparing Gd with Yb. (E) Binary plot comparing Nb/Ta with Th/U. (F) Binary plot comparing calculated zircon U–Pb ages with Th/U.
Minerals 15 00038 g012
Figure 13. Summary of age, inferred temperatures of formation, and geochemical data for zircons from the different phases in the Klaza study area. (AD) Binary plots comparing the calculated temperature based on Ti in zircon to Hf (A), calculated age (B), Eu/Eu* (C), and Ce/Ce*C (D). (E) Binary plot comparing Eu/Eu* with Ce/Ce*C. (F) Binary plot comparing calculated U–Pb ages with Ce/Ce*C.
Minerals 15 00038 g013
Nb/Ta ratio: The Nb/Ta ratio is commonly used to assess the extent of fractionation of magmas whereby lower Nb/Ta ratios are correlated with more evolved rocks due to the partitioning of Nb and Ta commensurate with rutile and amphibole crystallization [63,64]. The results show a clear separation of the PMZ data which have higher (i.e., less evolved) Nb/Ta ratios (3 to 6) relative to CAZ-1 and CAZ-2 (Figure 12E). The data also show a diversity in magmatic evolution among the Whitehorse suite zircons.
Titanium-in-zircon thermometer: Ti-in-zircon thermometry [65] yielded temperature estimates that range from 900 ± 60 to 600 ± 40 °C (Figure 13A and Supplementary Table S6, Sheet B). As expected, there is a negative trend between temperature and degree of fractionation with the fields for CAZ-1 and CAZ-2 overlapping (Figure 13A) and there is no relationship with zircon age (Figure 13B).
Ce and Eu content: The Ce and Eu contents of zircons are used as proxies for estimating fO2 conditions of magmas [54,66,67], with various methods used to calculate this parameter. For example, Zhong et al. (2019) discuss the disadvantages of using Cen/Ce* based on Ce* = √Lan x Prn) versus Ce* = Ndn2/Smn) (cf., Loader et al., 2017). Here, the approach of Zhong et al. (2019) was evaluated and the results (Supplementary Table S6, Sheet C and Supplementary Text S4) show the Cen/Ce*C values are significantly higher compared with the values using the Loader et al. (2017) approach. The results based on Zhong et al. [68] are considered to be the best estimate of Ce anomalies since they address problems of overestimation in Cen/Ce* using the method of Loader et al. [69] and, in addition, it avoids complications due to detection limits on La and Pr measurements in zircon. The Eun/Eu* values were calculated with the standard approach of Eu* = √Smn × Gdn.
The results for PMZ and CAZ-1 show a range in Eun/Eu* values between 0.4 and 1.1, whereas CAZ-2 data cluster between 0.45 and 0.6 and there is no apparent linear relationship with temperature (Figure 13C). However, the large spikes in Eun/Eu* values between 725 and 775 °C in some PMZ and CAZ-1 zircons are noted and thus indicate that the process (or processes) acted to change this value in some of the melts.
The calculated Cen/Ce*C values of the zircons are also evaluated in regard to temperature (Figure 13D) and Eun/Eu* values (Figure 13E). Two trends are noted in the data: (1) increasing Ce/Ce*C at generally lower temperatures, which may plausibly reflect the role of volatiles; and (2) increasing Ce/Ce*C at lower EuN/Eu* values. In addition, the change in the calculated Ce/Ce*C parameter as a function of age (Figure 13F) indicates that the largest range, and highest values, are for the younger Casino and Prospector Mt. suites with values for the older Whitehorse suite samples much lower. The range Cen/Ce*C values, therefore, reflect the relevant process (or processes) that appear to be time-dependent in regard to the nature of magmatism.

5. Discussion

Magmatism and hydrothermal mineralization at Klaza straddle the boundary between two of the most productive magmatic suites (by Cu–Au–Ag resource; Figure 14) in the DRGB. In addition, the Klaza-Brown-McDade system and the Freegold Mt. District (FGMD; Figure 1B) show characteristics of superimposed porphyry systems, thus harbouring increased potential for enriched Cu–Au–Mo ore zones [25].
Our observational (i.e., field and petrography), geochemical-, and geochronological-based paragenetic reconstructions are now used to discuss the petrogenesis and evolution of the Klaza Igneous Complex (KIC) and the genesis of the Klaza superimposed porphyry–epithermal system. The KIC spans a highly protracted history of periodic magmatic activity (Late Triassic to Late Cretaceous) for a trans-crustal magmatic system. Magma mingling and a change in tectonic regime over time are suggested to have been responsible for the overall chemical evolution of these magmas, the implications of which are discussed below.

5.1. Three Superimposed Magmatic–Hydrothermal Systems

Hart and Langdon [16] and Mortensen et al. [17] discussed the similarities in hydrothermal mineralogy, NW-trending structures (Figure 1C), and deposit styles between the Klaza and Brown-McDade systems, and suggested linkages between the two systems, despite cross-cutting relationships between hydrothermal mineralization and dikes of mid-Cretaceous and Late Cretaceous ages differing between the two systems [17].
Geochronologic results (Re–Os in molybdenite ages) from this study (Table 2) provide definitive evidence to demonstrate that the Flex hydrothermal system (part of Brown-McDade) is of mid-Cretaceous age. Combined with Re–Os molybdenite ages from Lee et al. [25], the data support the superposition of three magmatic–hydrothermal events (Figure 15): (1) mid-Cretaceous Brown-McDade (Whitehorse suite); (2) Late Cretaceous Kelly (Casino suite); and (3) Late Cretaceous Cyprus-Klaza (Prospector Mt. suite).
Evidence of said superposition can be observed in the field where mid-Cretaceous-age dikes [17] spatially coincide with ca. 76–78 Ma phyllic alteration related to the alteration footprint of the Kelly porphyry system (this study). The stockwork quartz–chalcopyrite–molybdenite veins of the Kelly system are in turn overprinted by phyllic alteration inferred to be from the Klaza–Cyprus epithermal–porphyry system. The Klaza veins cut Prospector Mountain suite-aged dikes (ca. 71 Ma; this study) whereas the Cyprus porphyry yields a molybdenite age of ca. 71 Ma [25].

5.2. Petrogenesis of the Klaza Igneous Complex

The rocks from the Klaza deposit display effects of alteration overprint even in the least altered samples. Potassium and Na were demonstrated to be highly mobile and susceptible to the effects of alteration through grant isocons in Lee [18]. Because of this, K and Na in TAS (total alkali silica) diagrams were unsuitable to be used as the only discriminator of rock compositions. Niobium is a known indicator of tectonic setting due to its behaviour as an incompatible element, with significant enrichment in alkalic melts derived from plume-related magmas. Lithogeochemical data presented by Lee et al. [25] show a progressive increase in Nb content within the intrusive rocks from mid-Cretaceous to Late Cretaceous. This progressive increase in Nb, which is used as a proxy for alkalinity, was attributed to changes in the tectonic environment with the magma source remaining the same. The protracted interval of hydrothermal productivity from mid-Cretaceous to Late Cretaceous demonstrated in this study (Figure 15) supports the above interpretation.
The Late Cretaceous magmas display several key features indicative of productive porphyry Cu systems: (1) a highly protracted magmatic history; (2) evidence for magma mingling; and (3) dynamic changes in magmatic composition with time. Protracted magmatic history: Geochronological constraints of Late Cretaceous magmatism are reflected in an apparent ~10 myr U–Pb zircon record from 80 to 70 Ma. A histogram of the relevant age data depicts a bimodal spread (Figure 14), with peaks corresponding to times of Casino (77–79 Ma) and Prospector Mt. (~72 Ma) age magmatic pulses. Productive porphyry deposits globally display evidence of protracted magmatic–hydrothermal activity [38,39,61,72,73,74], as seen in the regional setting of the study area. The unusually prolonged period of magmatic activity in mineralized porphyry settings, and more specifically at Klaza, provides opportunities for magma mingling (see below), compositional evolution (i.e., fractionation), and at multiple porphyry-related mineralizing events (Re–Os molybdenite; Figure 15 and [25]).
Magma chamber dynamics: Lee et al. [25] proposed a tectonic model whereby the KIC formed as a result of multiple emplacement events in a trans-crustal magmatic system [75] during the Late Cretaceous. This model addresses the similar whole rock geochemical footprint (REE and trace elements) of the Casino and Prospector Mt. suites in the KIC, with a suggested common deep crustal (MASH; melting–assimilation–storage–homogenization) source [73,75]. Magma mingling is documented as gradational contacts between Casino suite phases (i3a and i3b) in drill core samples (Figure 3A), whereas magma mingling is documented in drill core between the youngest phases of the Casino suite (ca. 73 Ma) and older phases (ca. 72 Ma) of Prospector Mt. suite magmas (Figure 4A).
Zircon trace element data for the Casino and Prospector Mt. suites show strong similarities, with the main differences lying in the MREE and HREE content of the magmas (Figure 11B,C). Since CAZ-1 and PMZ are temporally distinct, the similarities in trace element content and fractionation behaviour may reflect magma mingling and/or partial melting from a common deep reservoir. The trace element data (Hf/Y versus Th/U) also indicate the Casino and Prospector Mt. suites display characteristics of amphibole fractionation (Figure 12A); however, the low Yb/Gd values in CAZ-1, CAZ-2, and PMZ suggest a role of garnet fractionation in the melt history (Figure 12B) due to a deep source (see [73] for discussion). The observed variations in the geochemical compositions of the zircons in each suite (Figure 12) suggest an evolution related to the time and depth of partial melting.
The Ti-in zircon data or temperature and fluctuations in the Eu and Ce anomalies (Figure 13) are attributed to variations of temperature and oxidation states in the magma related to the recharging of the magmatic reservoir and fluid discharge events. Thus, the recorded variation in zircon temperature is interpreted to reflect the periodic influx of juvenile magma with commensurate higher temperatures [76,77], whereas the decrease in temperature likely records fractionation and/or possible loss of heat during magma degassing related to ore deposition events. Regarding the latter, the noted changes in Eun/Eu* values mostly occur in PMZ and CAZ-1 zircons between 725 and 775 °C, as was noted in zircons elsewhere and attributed to SO2 degassing of the magma [78] or reduced water content related to ore deposition [79]. Furthermore, that all zircons in the sample suites have Eun/Eu* values above 0.4 suggests that SO2 degassing and fluid content may be the dominant process impacting Eu distribution in the Klaza intrusive rocks; this has strong implications for ore deposition as volatile-rich magmas are documented around the world to be associated with productive ore systems ([73] and examples cited within). We further note that although Green and Pearson [80] proposed that strong positive Eu anomalies (Eun/Eu* > 1) can be caused by plagioclase accumulation in the rock or fractionation of hornblende, Lee, R.G., et al. [79] proposed that higher Eun/Eu* values may be the result of increasing volatile content in the melt or magma mingling. Evidence for the latter hypothesis is observable in the drill core where intrusive phases are in gradational contact (Figure 3A).
Although increased Ce anomalies in zircon are generally correlated to increased oxygen fugacity in the magma [66], the increase in Cen/CeC* values of the Casino and Prospector Mt. suite rocks cannot be attributed to oxygen fugacity changes alone, since they correspond to lower Eun/Eu* values (Figure 13E). Lee, R.G., et al. [79] propose zircon with these geochemical characteristics either formed from volatile-rich, crystal-poor magmas [81], or formed in a magma chamber that experienced high-temperature melt influx from a source that had yet to crystalize zircon and titanite. Such an event would enrich these zircons in Ce (and its Cen/CeC*) and other trace elements. In regard to the present study, both hypotheses are likely since these suites are biotite–amphibole-bearing and display textural evidence of a dynamic magma chamber. Importantly, this implies the observed spikes in Ce/CeC* values that correlate with porphyry mineralization events (Figure 13F) may be coincident with magma influx/recharge events.
Magmatic evolution: Lithogeochemical data for the various intrusive suites presented in Lee et al. [25] display a large compositional range for the Whitehorse, Casino and Prospector Mt. suites. The Whitehorse and Casino suite rocks generally have intermediate-to-felsic, calc-alkaline compositions (andesite to granodiorite), whereas the Prospector Mt. suite rocks record intermediate to slightly mafic and alkalic compositions (andesite to diorite). This apparent trend of increasing alkalinity and mafic composition in the evolution of these magmas is posited to reflect a change from subduction-derived magmas in the mid-Cretaceous to possibly extensional, non-subduction-related magmatism in the Late Cretaceous. This change in magmatism is recorded in other porphyry settings globally (e.g., Cripple Creek, Colorado, [82]; Northern Luzon, Philippines, [83]; Northern Chile, [84]; Western Tethyan Belt, [85]).
Based on whole-rock geochemical data, the Whitehorse and Minto suites display plagioclase fractionation-controlled negative Eu anomaly, whereas the Casino and Prospector Mt. suites (also plagioclase-bearing) have EuN/Eu* values near unity. This feature is commonly interpreted, in particular for the causative magmas in mineralized porphyry settings, to be an artifact of highly oxidized magmas such that Eu is present as Eu3+ which precludes the development of a negative Eu anomaly [61,86]. Furthermore, both of the Late Cretaceous suites plot in the field of adakite-like rocks (ALR; La/Yb versus Yb plot), supporting zircon trace element results that suggest garnet was present in the melt source and whereby both the Casino and Prospector Mt. suites were likely sourced at greater depths [87] than the Whitehorse and Minto suite rocks.
Magma mingling and compositional changes are also suspected to contribute to the variety of zircon ages in each sample. The terminology for zircon provenance, as defined in Olierook et al. [88], is applied below. A significant amount of inherited zircon (i.e., xenocrystic) was identified in this study (Figure 15), as was also noted by Mortensen et al. [17]. As described by [89], the provenance of minerals in a trans-crustal magmatic system can be challenging to decipher since crystals can include phenocrysts that grew in the latter stage of magma evolution (autocrysts), antecrysts from earlier stages involving crystal cycling and related pulses, and/or xenocrysts from previous, unrelated magma (or the wallrock/basement). In addition, all the aforementioned types can be remobilized multiple times.
Zircons displaying mid-Cretaceous ages (Figure 15) are interpreted as xenocrysts sourced from the Whitehorse suite granodiorite which hosts these dikes whereas zircons with Late Triassic and Permian ages are interpreted as originating from the Minto suite and the metamorphosed basement, respectively. The distinction between antecrystic and autocrystic zircons is challenging, as it is in any study [88,89,90], particularly when fluctuations in the composition of the Late Cretaceous magmas can enhance or reduce zircon saturation and thus its consequent growth or dissolution. Zircon morphology (Supplementary Figures) displays a combination of bright and dark anhedral cores that are rimmed by dark oscillatory zones. As such, the youngest concordant zircons in each sample are interpreted as autocrystic. The remaining zircons in each sample are termed antecrystic and reflect crystallization in the same magma chamber but at an earlier time in its evolution.
The change in magma composition (towards more mafic, alkalic compositions) with time could explain the larger proportion of antecrystic zircons relative to the youngest concordant autocrystic zircons (Figure 10). Additionally, this could also explain the apparent historic sampling bias of Casino-age zircons by previous workers (Figure 15).

5.3. Assembly of the Klaza Igneous Complex and Superimposed Porphyry System

Herein we combine the tectonic and genetic model with the results from Lee et al. [25] with new data from this study to reconstruct the formation of the KIC and MNGC. We propose a subduction-initiated arc setting from 204 to 80 Ma (Figure 16A) with a steepening of the subducting slab (Kula plate) through westward rollback in the Late Cretaceous (80 to 70 Ma), following on the earlier work of Nelson et al. [2] at a more regional scale for the Northern Canadian Cordillera. The emplacement of the Minto and Whitehorse suite rocks is discussed here in addition to the KIC to provide tectonic context for the discussion.
Late Triassic to mid-Cretaceous (90 Ma): Arc-related subduction initiates partial melting of the hydrated mantle to form a MASH zone at the base of the crust. The Minto suite rocks were emplaced into the Yukon Tanana Terrane between 204 and 195 Ma at ~25 km depth (hornblende thermobarometry; [93]; Figure 16C). The Whitehorse suite is emplaced utilizing the same structures as the Minto suite to form a composite batholith in the MNGC (Figure 16D). The Brown-McDade epithermal system formed at shallow levels in the MNGC during this mid-Cretaceous magmatism at ca. 108 Ma.
A change in tectonic setting in the Late Cretaceous (80 Ma) led to the emplacement of the less voluminous Casino suite rocks (i.e., dikes and small bodies). Note that both the Minto and Whitehorse suites contain compositional variations and are themselves multiphase batholiths [1,20]. However, the complexities of these intrusive bodies are not discussed here or reflected in Figure 16 since insufficient zircon data were collected in the study area. The reader is referred to Sack et al. [20] for a regional compilation of whole rock and zircon data for Triassic–Jurassic intrusions in Yukon.
Late Cretaceous (80 to 72 Ma): The Casino suite magmas are bimodal in composition (felsic and mafic phases) and are inferred to have mingled at depth; they were emplaced as small pulses over a period of 8 myr (Figure 16E). As these suites are geochemically similar to the Whitehorse and Minto suites, it is posited that they were sourced from recycled MASH material. A dynamic magma chamber with frequent mafic influx events contributed to changing magma compositions. Mafic, amphibole- and plagioclase-rich phases (i3a, i3b) and felsic (i2) to intermediate phases (i3c) are emplaced in the Kelly zone, whereas intermediate to felsic dikes were emplaced at Klaza (see Figure 1C). Two pulses of molybdenite-bearing porphyry (Cu–Au–Mo) mineralization occur at 80 and 77 Ma, respectively, correlating to the emplacement of the Kelly porphyry.
The hydrothermal fluids associated with the Kelly porphyry formed a large, ca. 79 Ma phyllic footprint which overprints some of the currently intersected porphyry mineralization (Figure 3J,K). This footprint is reflected in the histogram of Ar–Ar muscovite dates in Figure 14, with a peak ranging from 77 to 80 Ma. This phyllic halo is interpreted to be an overprinting event coinciding with the collapsing thermal cell of the porphyry system.
Late Cretaceous (72 to 65 Ma): Current resolutions in geochronology data depict a continuous transition from Casino to Prospector Mt. suite magmatism (Figure 17), with the change in magma composition occurring gradually between 80 and 65 Ma ([25]; this study). This compositional change is hypothesized to reflect the gradual change from a subduction setting to a local extensional setting, as documented in other metallogenic settings and related to asthenospheric upwelling and re-melting of the pre-existing MASH zone [61,83,85,94]. The Prospector Mt. suite magma, which has a chemistry (e.g., depleted HREE signature) that reflects melt generation in a garnet-stable zone (i.e., deep), comprises a more mafic, slightly alkaline composition that mingled with the remnant, younger Casino suite magmas to generate a mixed magmatic signature (Figure 16E). The resulting hybrid Prospector Mt. suite magmas were emplaced at shallower, epizonal depths as narrow diorite dikes between 72 and 65 Ma.
Regionally, the Late Cretaceous (~80 Ma to 65 Ma) is described to be a time of tectonic change, with: (1) documented early signs of movement of the Tintina fault [92]; and (2) a transition point from a dominantly compressional setting with crustal thickening and mountain building activity towards a dominantly strike–slip setting [91].
Locally, this Late Cretaceous magmatic event is accompanied by porphyry mineralization as established from ca. 71 Ma Re–Os molybdenite ages [25,33] at Rusk and Cyprus, respectively. Although the footprint of Prospector Mt. related alteration is less significant in comparison to the Casino-age footprint, it cannot be dismissed since thermal overprints of this age are suggested in the low-temperature part of the Ar–Ar age-spectra (Figure 14) and Re–Os molybdenite ages (Figure 15). The Prospector Mt.-age alteration is also recorded in Ar–Ar K-feldspar [34] and K–Ar biotite [71] ages (Figure 15).
Lee et al. [25] proposed the above tectono-magmatic setting is conducive to forming alkalic-type epithermal Au and porphyry Cu–Au systems. Thus, the Cyprus and Rusk porphyry systems were emplaced within the MNGC with the possibility of overlapping with pre-existing Kelly porphyry-related mineralization at depth. The Klaza and Brown-McDade intermediate sulfidation epithermal veins were emplaced distally to the Cyprus–Rusk porphyry complex at NW and SE locations, respectively (Figure 1C). Based on the information presented here, we now know that the Brown-McDade system was emplaced in the mid-Cretaceous, whereas the Klaza system was emplaced as the Late Cretaceous, distal equivalent to the Cyprus–Rusk porphyry complex, with the magmatic and hydrothermal components of the system occupying the same NW trending structures that hosted mid-Cretaceous dikes and mineralization.
Figure 17. (A) Simplified geological map of the Dawson Range including the Sixtymile area. Only igneous rocks comprising ages discussed in this contribution are displayed. (B) Compilation of geochronologic data for other Late Cretaceous porphyry–epithermal occurrences in the Dawson Range Gold Belt. Regional geochronology data sourced from Allan et al. [1], Mortensen et al. [17], Mottram et al. [32], Selby and Creaser [33], Selby et al. [34], Stevens et al. [71], Bineli-Betsi et al. [95], Bineli-Betsi and Bennette [96], Friend [97], Bennett et al. [98], and Godwin [99].
Minerals 15 00038 g017

6. Exploration Implications

(1)
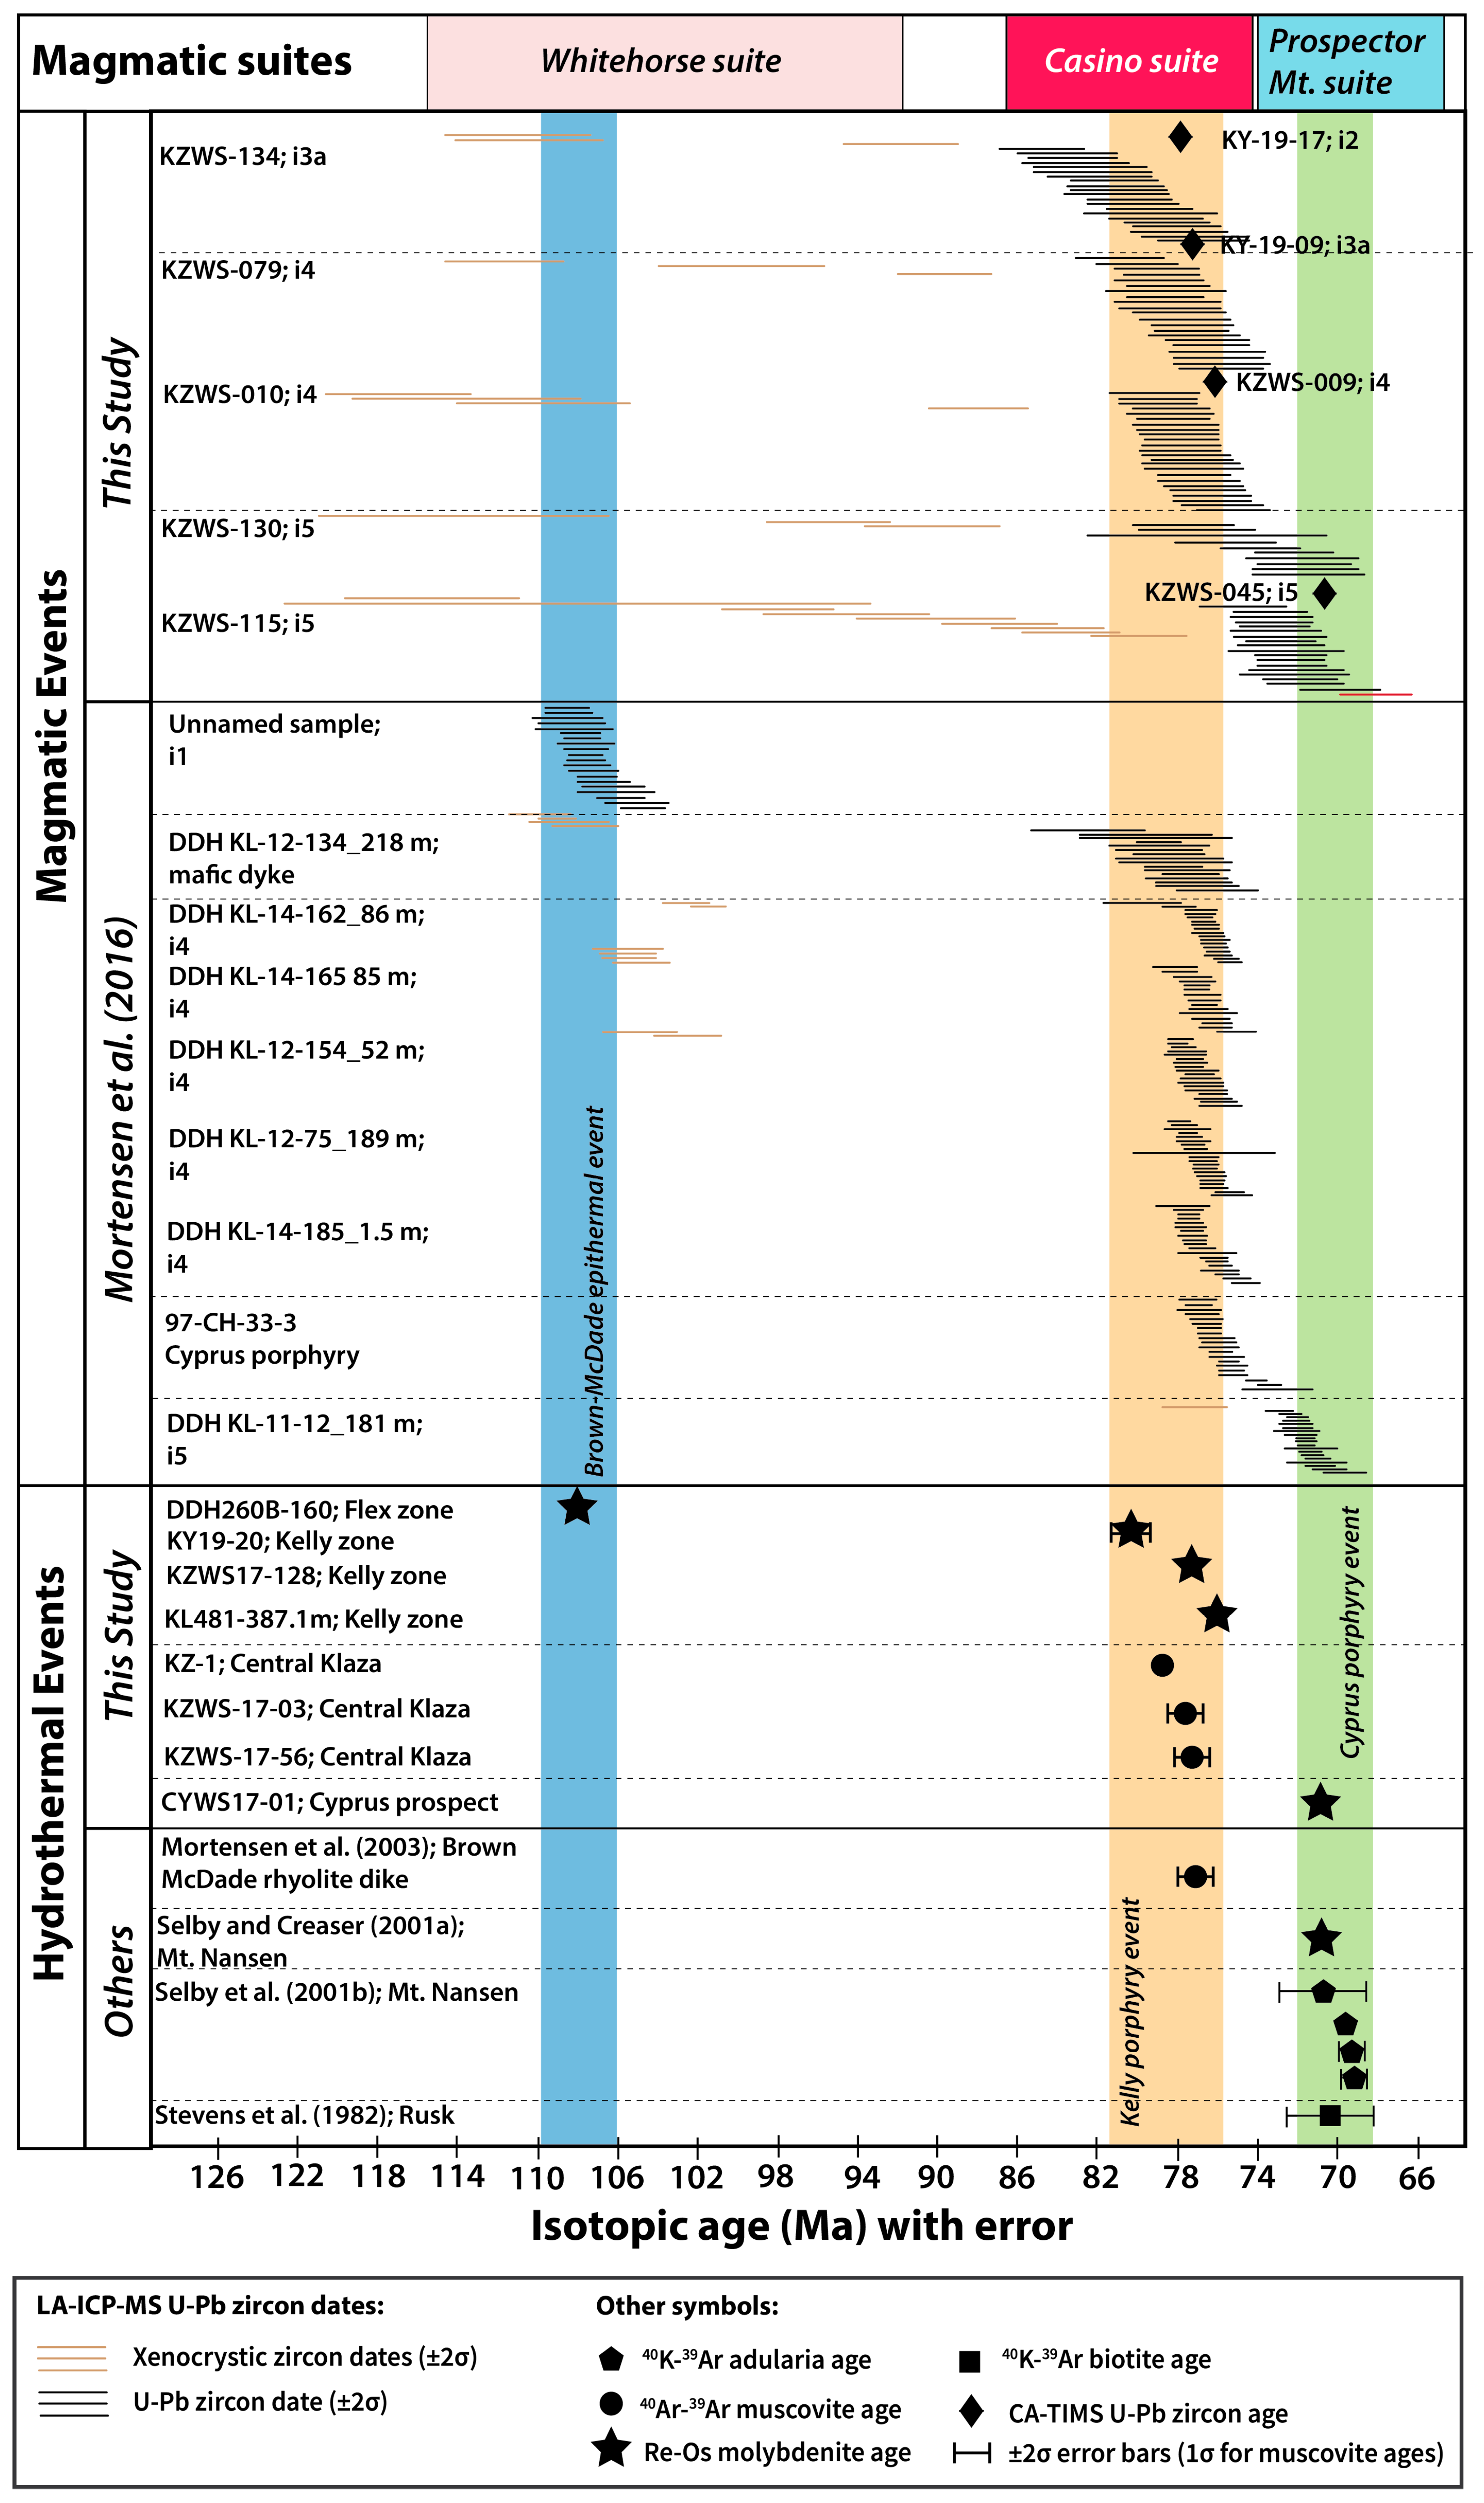
The high-precision ages assigned to each intrusive phase (Figure 8) match the paragenetic order prescribed to each phase (i2 to i5), demonstrating that a consistent, paragenetically relevant logging scheme can be built for the Klaza deposit, which will likely improve grade-control models in the future.
(2)
Complexities in the petrogenesis of the Casino and Prospector Mt. suite rocks have resulted in unequal distributions of zircon populations and produced a geochronologic record biased towards Casino (80–72 Ma) suite ages (Figure 14).
(3)
Hydrothermal ages documenting Prospector Mt.-age alteration (see Figure 14) are present in the older (pre-2010) literature; however, many of these dates were interpreted as outlier values or minerals that were thermally reset due to emplacement of the Carmacks Group basalts [1,17].
(4)
Evidence of Prospector Mt.-age porphyry mineralization (Re–Os molybdenite; [25,33]) from the Cyprus prospect (MNGC) provides strong support for the validity of the hydrothermal dates yielded from biotite, hydrothermal K-feldspar, and muscovite from other localities in the DRGB (Figure 17B).
(5)
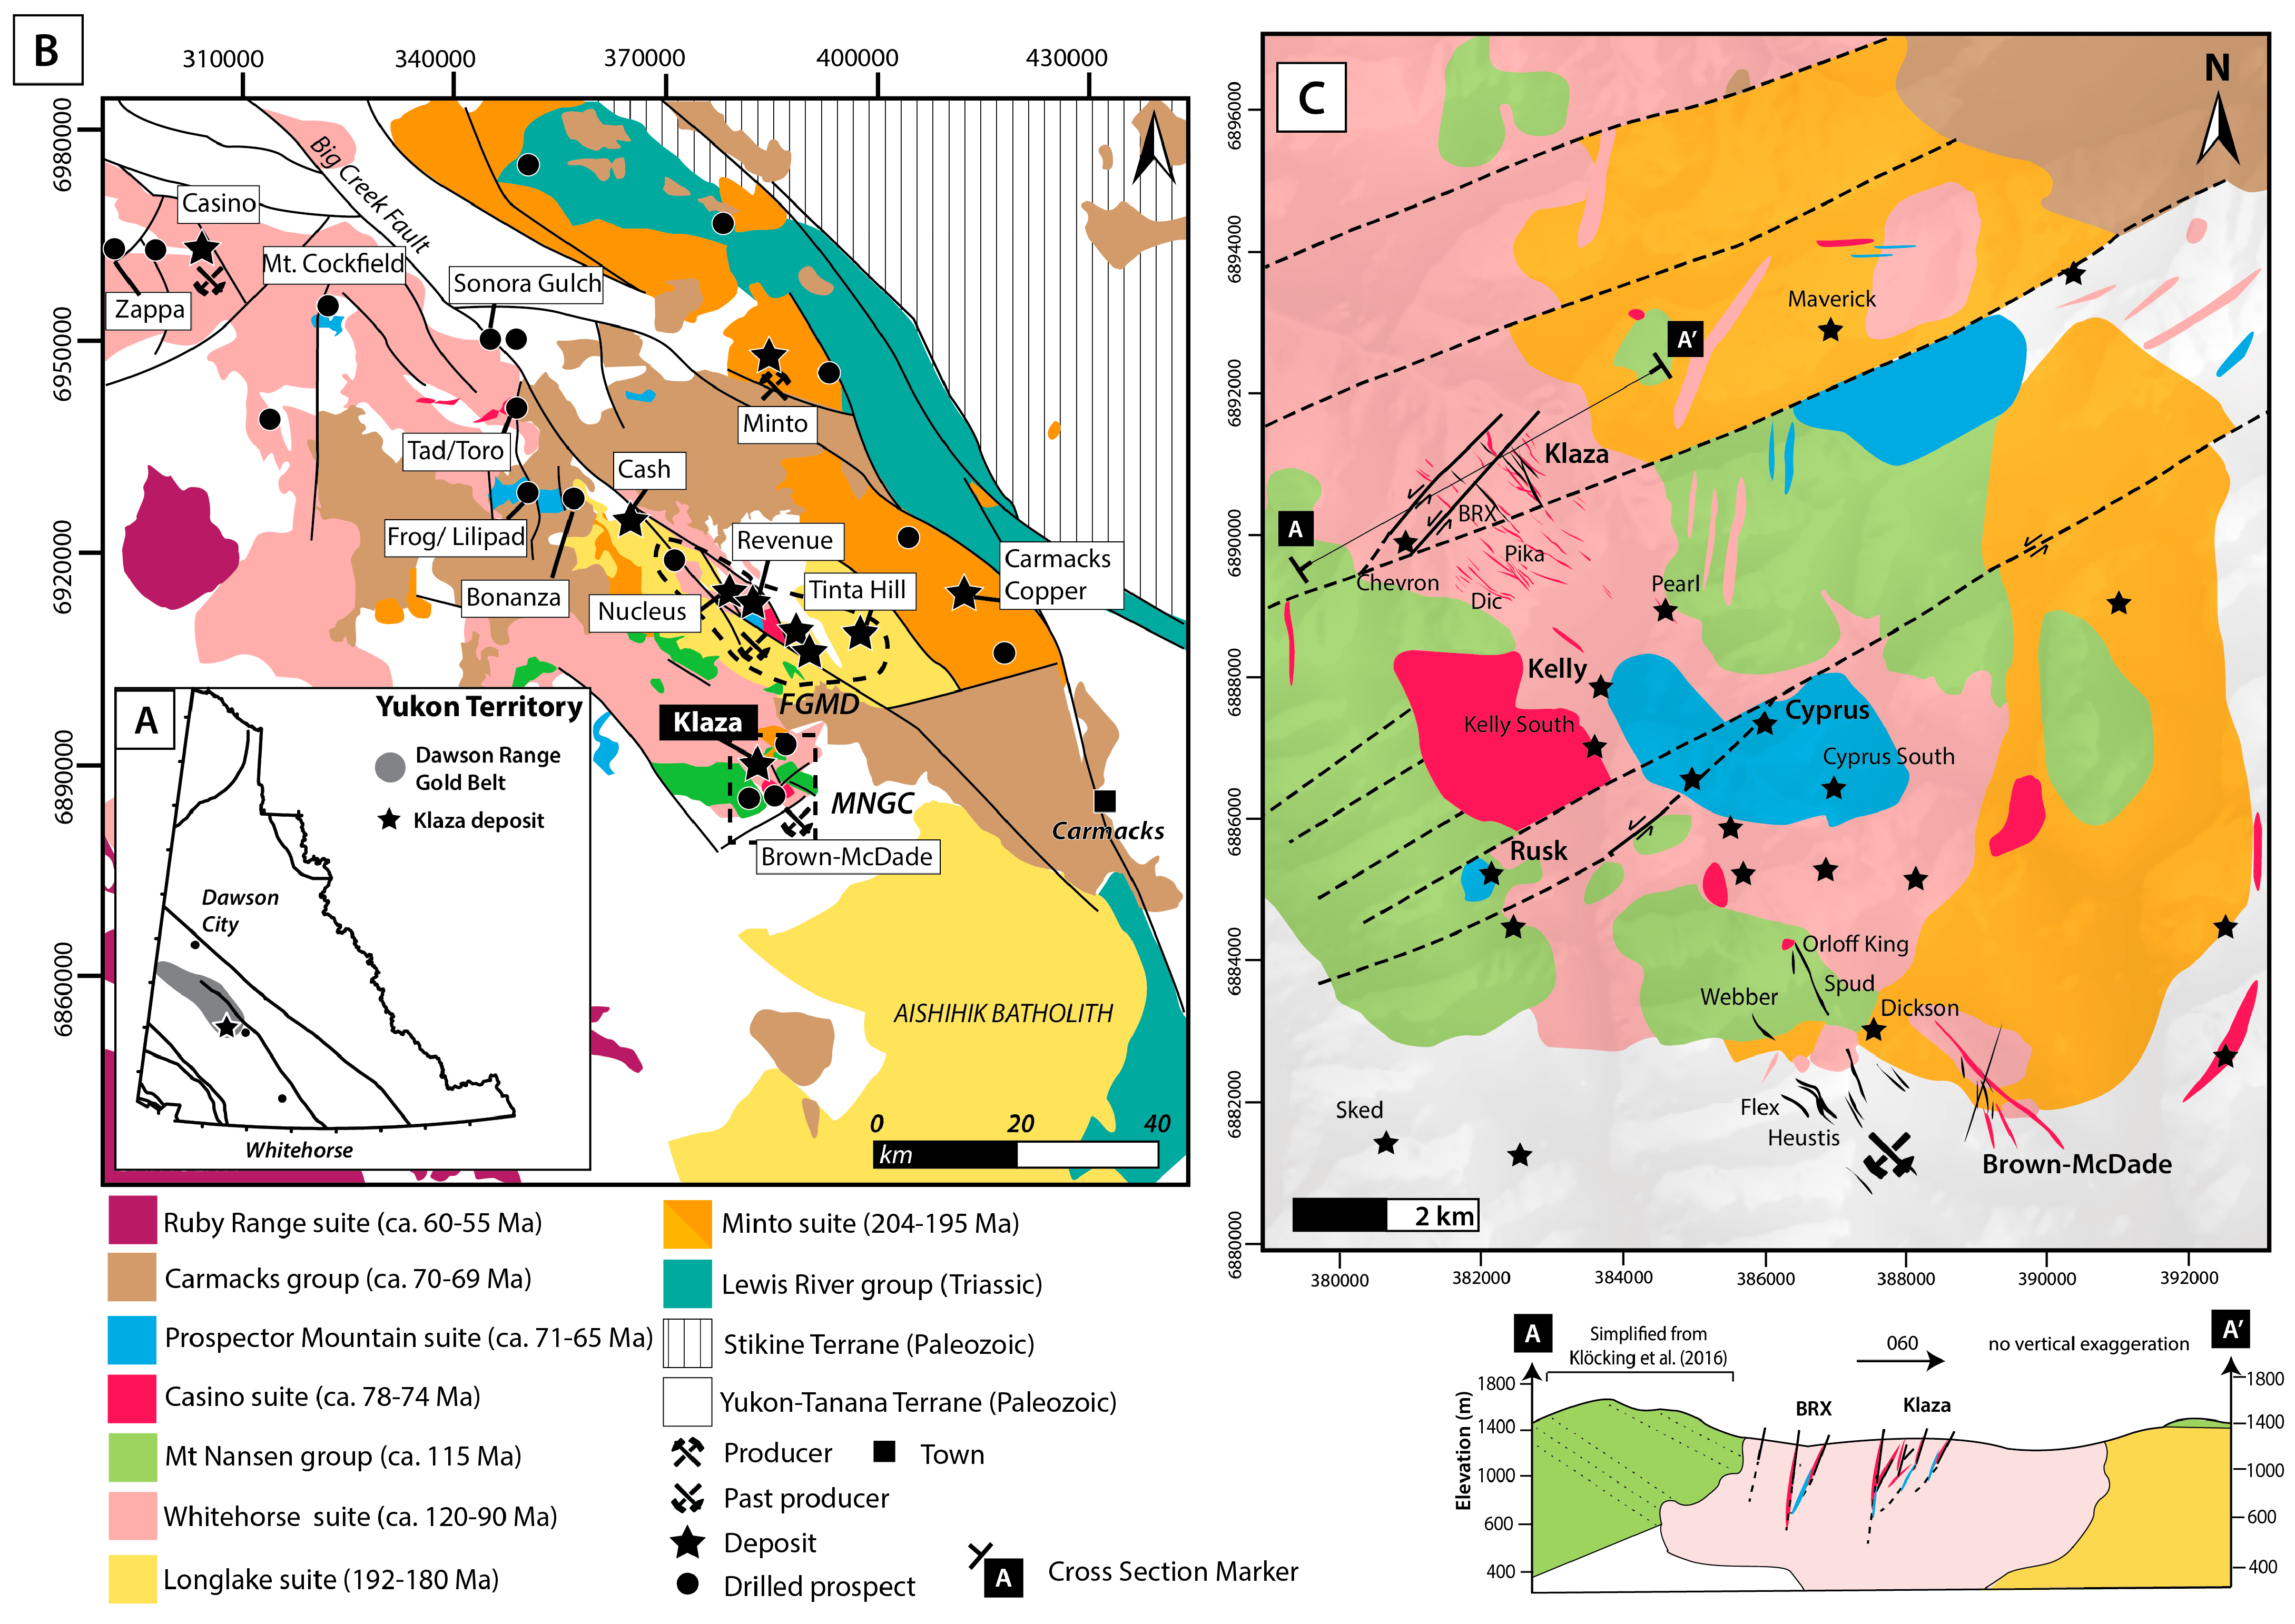
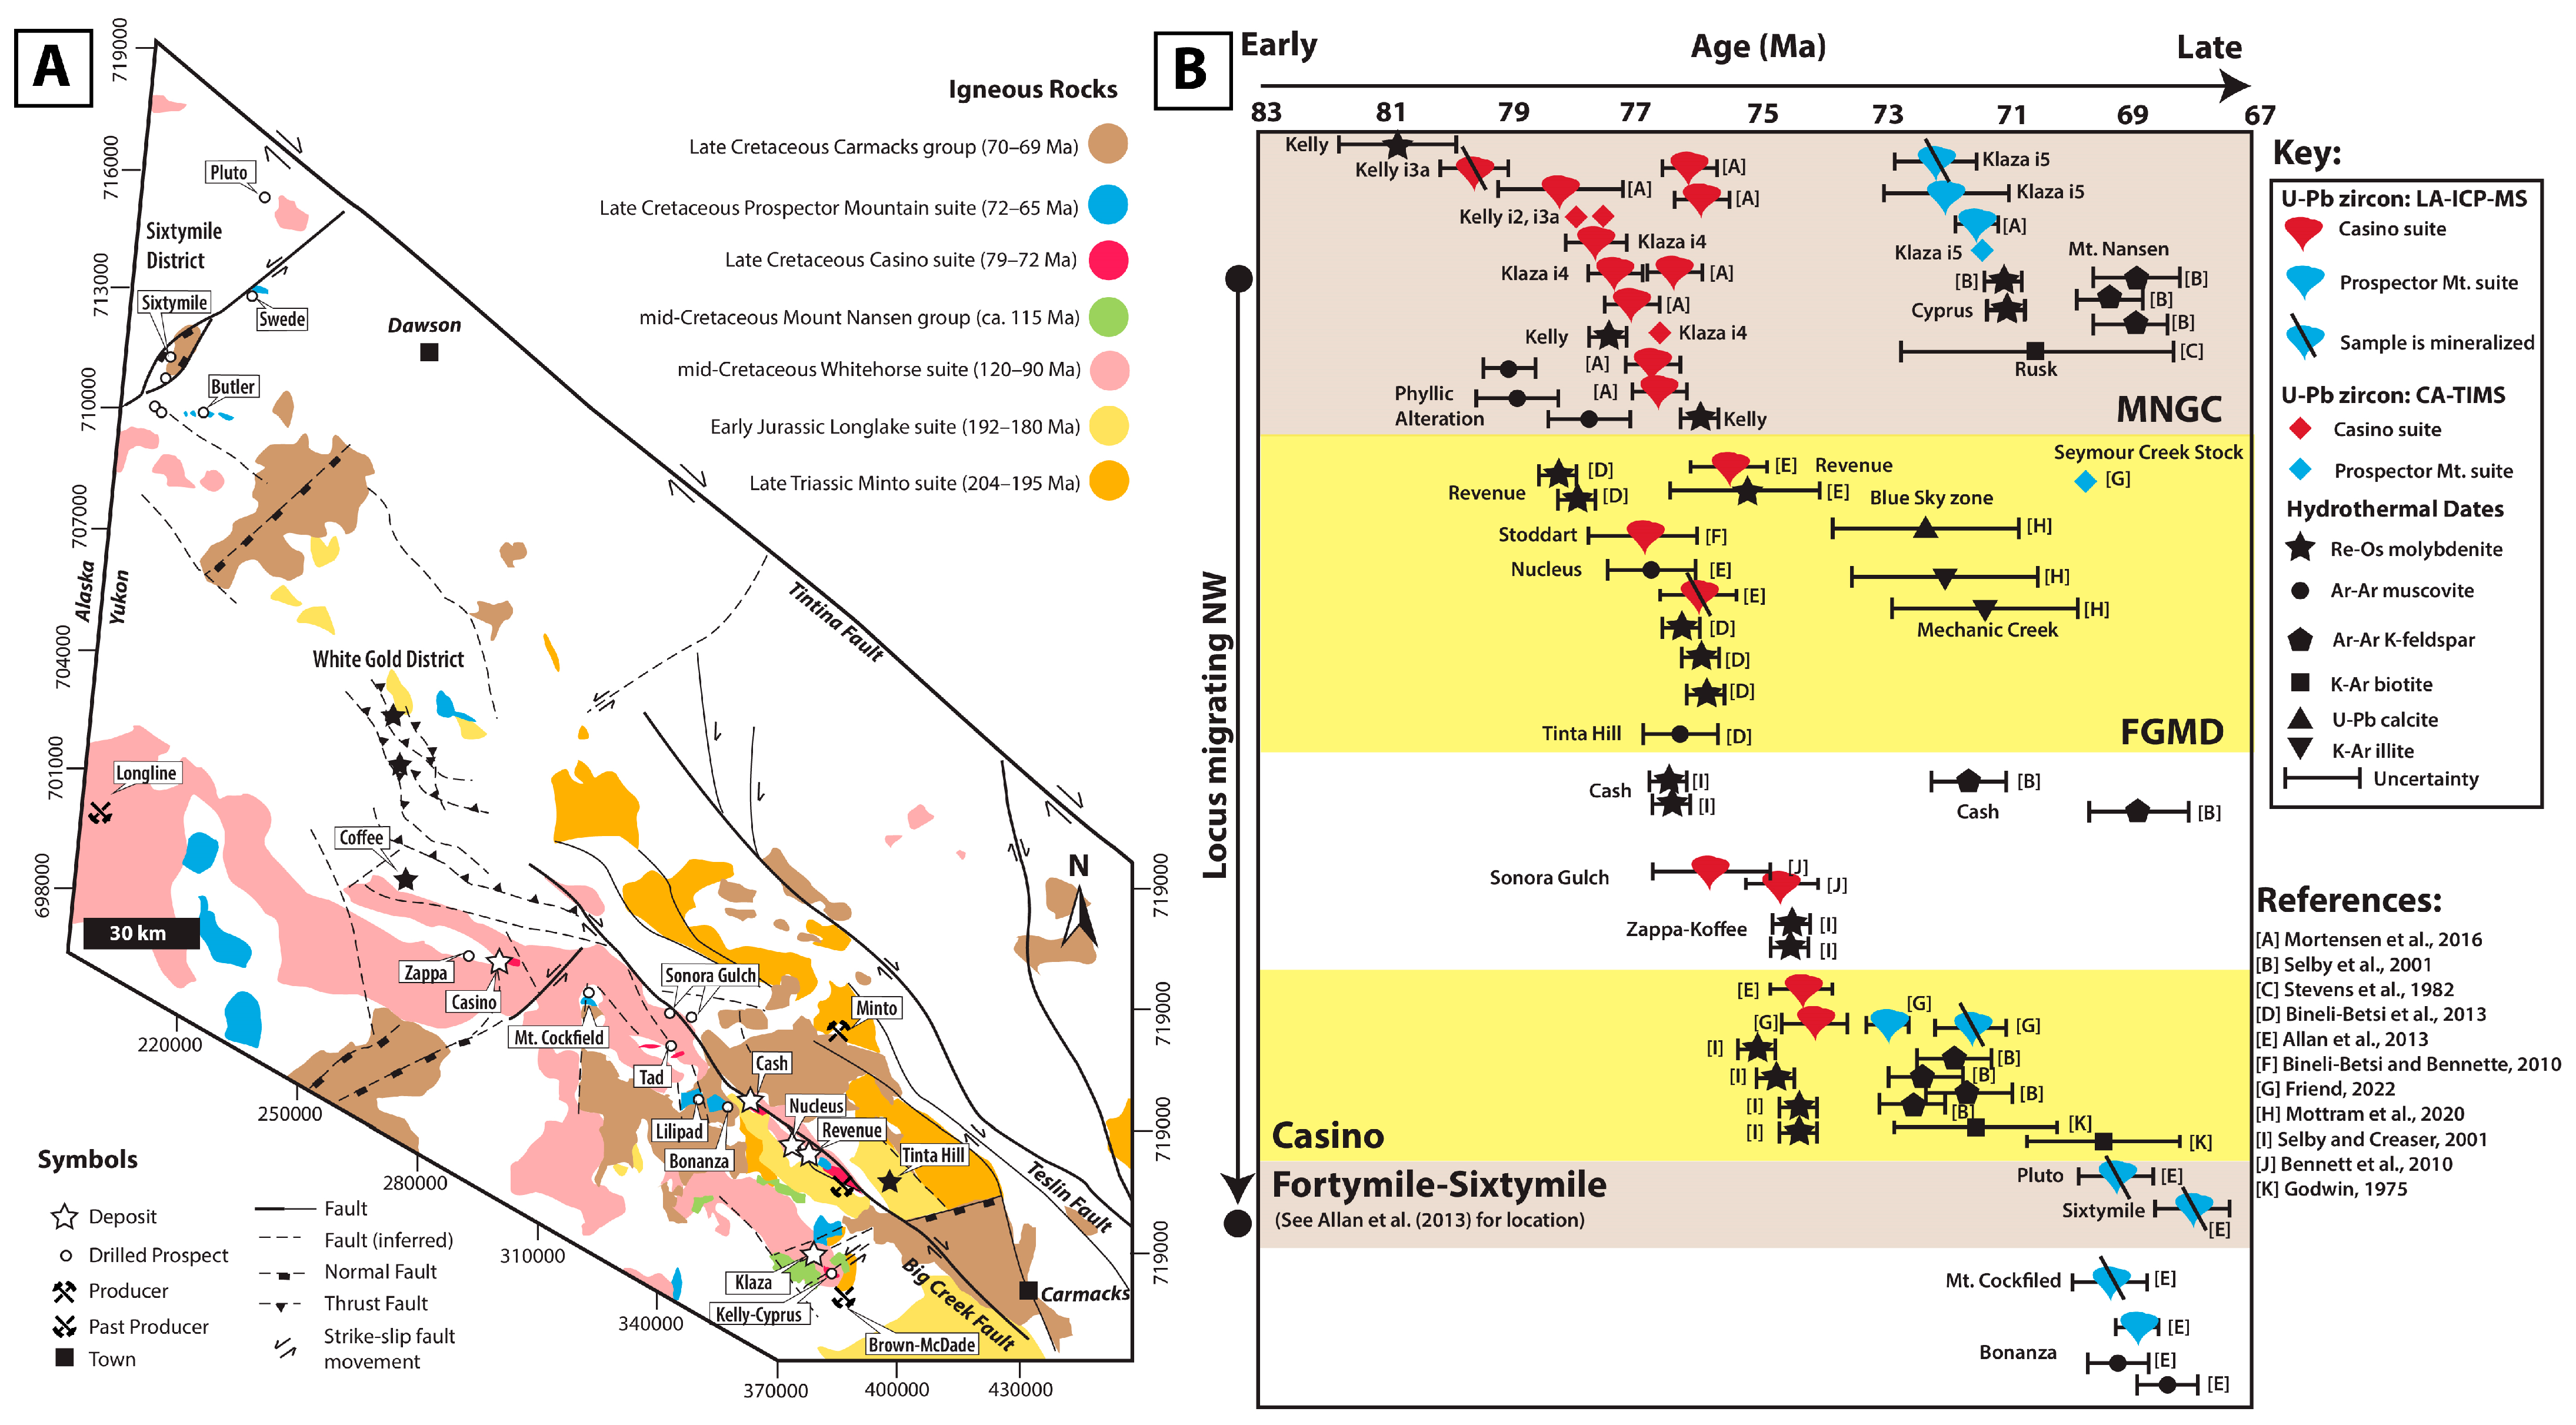
Current regional maps do not document the presence of the Carmacks Group basalts near localities where Prospector Mt.-age alteration is recorded (Figure 1B). Thermochronological studies [100,101] also demonstrate that it is highly unlikely that the Carmacks Group basalts underwent significant erosion since their emplacement at 70 Ma.
(6)
Geochronology data from other porphyry occurrences in the DRGB (Figure 17B) suggests: (i) regional magmatism in the DRGB occurs nearly continuously between 80 and 67 Ma; (ii) the boundary between Casino and Prospector Mt. suite rocks cannot be easily distinguished on the basis of geochronology alone; (iii) the locus of Casino suite magmatism and hydrothermal mineralization appears to migrate along the Big Creek Fault from the MNGC in the SE towards the Casino deposit in the NW; and (iv) the transition into Prospector Mt. suite magmatism occurs at the Casino deposit, and then proceeds further NW into the Sixtymile district and Fortymile district (Pluto), prior to being emplaced as isolated plugs in the MNGC, the FGMD, at Mt. Cockfield, and at Bonanza. Mineralization and magmatism correlated with the Prospector Mt. suite is also documented in eastern Alaska [1,102].
(7)
The new geochronological results presented in this study and Lee et al. [25] enable the temporal window for PCD prospectivity in the DRGB to be extended by 7 myr, encompassing Prospector Mt. suite rocks, currently identified to be sourced from environments conducive for forming PCDs.
(8)
Geochronological data combined with whole rock and zircon geochemical results also indicate strong similarities between the Casino and Prospector Mt. suites, with hybridized signatures varied by temporal factors. The results from this study suggest that these suites may be one-and-the-same, with the youngest a slightly evolved counterpart of the same magma source.
(9)
The geochronological data from the DRGB, when viewed together from a regional perspective (Figure 17), depicts a large (~200 km-long), protracted magmatic–hydrothermal event stretching from the town of Carmacks (Yukon) into eastern Alaska. This long-lived magmatic–hydrothermal system produced oxidized, hydrous magmas, and is strongly correlated with regional, orogen-parallel, transcrustal strike–slip structures (Big Creek Fault), hence containing significant tectonomagmatic building blocks [75] required to form porphyry Cu–Au districts.
(10)
The scale of this Late Cretaceous porphyry activity in the DRGB (~200 km-long) is comparable to the metallogenic belt of northern Chile. When overlain, the DRGB would encompass the Escondida district [103], Chuquicamata-El Abra [104], and Quebrada Blanca (note also that Late Cretaceous magmatism and mineralization also extends ~600 km further south into British Columbia and northeast into Alaska). Therefore, it is important for regional explorers to adopt a belt-scale approach to exploration in the DRGB as a metallogenic corridor.
(11)
Findings from this study can be further applied to other porphyry-productive metallogenic districts globally (e.g., Western Tethyan Belt, Turkey, Northern Luzon, Philippines, Northern Chile) in the search for superimposed hypogene ore shells.
(12)
Should sampling biases similar to that discussed for the DRGB be identified, previously overlooked intrusive suites can be revaluated for prospectivity, thus potentially increasing the number of prospective mineral targets in established districts.

7. Conclusions

This study area experienced two changes in regard to broad-scale geotectonics in the mid-Cretaceous and Late Cretaceous which translated into varied arc-type magmatism and related mineralization. The nature and subsequent evolution of these magmas combined with their high-level crustal setting generated favourable fertile causative intermediate to felsic, oxidized, hydrous magmas which culminated in the formation of porphyry–epithermal mineralization at three times: (1) high-to-intermediate sulphidation epithermal deposit formation at Brown-McDade at ca. 108 Ma; (2) typical calc-alkaline arc-type Casino suite magmas at 80–72 Ma that gave rise to forming porphyry Cu–Au–Mo deposits; and (3) a subsequent back-arc extensional environment at ca. 72 Ma that formed an environment conducive to forming intermediate-sulfidation Au–Ag–Pb–Zn epithermal systems related to the Prospector Mt. magmas.
The Casino and Prospector Mt. suite magmas show evidence of magma mingling and mafic magma influx corresponding with mineralization events (Re–Os molybdenite). Both magmas show hybridized signatures indicative of a common source. The overall structural controls in the DRGB increase the likelihood of the superposition of the two aforementioned metallogenic events to form mineral deposits with enriched ore shells. The same structural controls benefited the Klaza system by allowing the focusing of hydrothermal fluids through long-lived crustal-scale structures to form wide, Au-rich vein intersections.
Findings from this study can be used to inform regional explorers in the DRGB and in other porphyry belts globally. Petrogenic and geochronologic constraints on causative and non-prospective intrusive suites in these districts should be revaluated so that opportunities for new discoveries are not missed due to human bias.

Supplementary Materials

The following supporting information can be downloaded at: https://www.mdpi.com/article/10.3390/min15010038/s1, Figures: Zircon Morphology; Table S1: Ar-Ar Muscovite Results; Table S2: CA-TIMS U-Pb results; Table S3: Boise University LA-ICP-MS data; Table S4: Zircon Trace Element Chemistry machine configuration; Table S5: University of Alberta LA-ICP-MS data; Table S6: Zircon Trace Element Data; Table S7: Sample locations; Table S8: Regional Geochronology Compilation; Text S1: Ar-Ar and Re-Os Geochronology; Text S2: Zircon Analytical Methods; Text S3: Zircon Analytical Methods Part 2; Text S4: Ce Comparison Plots.

Author Contributions

Conceptualization, W.-S.L.; methodology, W.-S.L., J.L.C. and R.A.C.; validation, W.-S.L., J.L.C. and R.A.C.; formal analysis, W.-S.L., J.L.C. and R.A.C.; investigation, W.-S.L.; resources, D.J.K. and P.J.S.; data curation, W.-S.L., J.L.C. and R.A.C.; writing—original draft preparation, W.-S.L.; writing—review and editing, W.-S.L., D.J.K. and P.J.S.; visualization, W.-S.L.; supervision, D.J.K. and P.J.S.; project administration, D.J.K.; funding acquisition, W.-S.L. and P.J.S. All authors have read and agreed to the published version of the manuscript.

Funding

The authors are grateful for in-kind financial and logistical support from the Yukon Geological Survey (YGS) to conduct fieldwork at the Klaza property in 2019. We also thank Rockhaven Resources Ltd. (RK) for in-kind financial and logistical support to visit and sample at the Klaza property in 2017 and 2019. We acknowledge financial support from the Targeted Geoscience Initiative (TGI 5) for the early phase of this study.

Data Availability Statement

Data are contained within the article and Supplementary Materials.

Acknowledgments

The work presented in this paper is a result of the lead author’s PhD thesis at Laurentian University. Jeff Marsh is thanked for his contributions in zircon trace element chemical analysis at Laurentian University. Andy DuFrane is thanked for his contributions in LA-ICP-MS U–Pb zircon analysis at the University of Alberta. Four anonymous reviewers are thanked for their time and feedback, which greatly improved this manuscript. This is Yukon Geological Survey contribution #070.

Conflicts of Interest

W.-S.L. is currently employed by Galore Creek Mining Corporation (GCMC). The paper reflects the views of the authors and not GCMC. We declare that the research was conducted in the absence of any commercial or financial relationships with GCMC that could be construed as a potential conflict of interest.

References

  1. Allan, M.M.; Mortensen, J.K.; Hart, C.J.; Bailey, L.A.; Sánchez, M.G.; Ciolkiewicz, W.; McKenzie, G.G.; Creaser, R.A. Magmatic and metallogenic framework of west-central Yukon and eastern Alaska. In Tectonics, Metallogeny, and Discovery: The North American Cordillera and Similar Accretionary Settings; Society of Economic Geologists: Littleton, CO, USA, 2013; Volume 17, pp. 111–168. [Google Scholar]
  2. Nelson, J.L.; Colpron, M.; Israel, S. Tectonics and Metallogeny of the Northern Cordillera of British Columbia, Yukon and Alaska. In Tectonics, Metallogeny, and Discovery: The North American Cordillera and Similar Accretionary Settings; Society of Economic Geologists: Littleton, CO, USA, 2013; Volume 17, pp. 53–110. [Google Scholar]
  3. Colpron, M.; Crowley, J.L.; Gehrels, G.; Long, D.G.F.; Murphy, D.C.; Beranek, L.; Bickerton, L. Birth of the northern Cordilleran orogen, as recorded by detrital zircons in Jurassic synorogenic strata and regional exhumation in Yukon. Lithosphere 2015, 7, 541–562. [Google Scholar] [CrossRef]
  4. Corriveau, L. Iron oxide copper-gold deposits: A Canadian perspective. In Mineral Deposits of Canada: A Synthesis of Major Deposit-types, District Metallogeny, the Evolution of Geological Provinces, and Exploration Methods; Geological Association of Canada, Mineral Deposits Division, Special Publication: St. Johns, NL, Canada, 2007; Volume 5, pp. 307–328. [Google Scholar]
  5. Dubé, B.; Gosselin, P.; Mercier-Langevin, P.; Hannington, M.; Galley, A. Gold-rich volcanogenic massive sulphide deposits. In Mineral Deposits of Canada: A Synthesis of Major Deposit-Types, District Metallogeny, the Evolution of Geological Provinces, and Exploration Methods; Geological Association of Canada, Mineral Deposits Division, Special Publication: St. Johns, NL, Canada, 2007; Volume 5, pp. 75–94. [Google Scholar]
  6. Galley, A.G.; Hannington, M.; Jonasson, I. Volcanogenic massive sulfide deposits. In Mineral Deposits of Canada: A Synthesis of Major Deposit-Types, District Metallogeny, the Evolution of Geological Provinces, and Exploration Methods; Geological Association of Canada, Mineral Deposits Division, Special Publication: St. Johns, NL, Canada, 2007; Volume 5, pp. 141–161. [Google Scholar]
  7. Goodfellow, W.D.; Lydon, J.W. Sedimentary-exhalative (SEDEX) deposits. In Mineral Deposits of Canada: A Synthesis of Major Deposit-Types, District Metallogeny, the Evolution of Geological Provinces, and Exploration Methods; Geological Association of Canada, Mineral Deposits Division, Special Publication: St. Johns, NL, Canada, 2007; Volume 5, pp. 163–183. [Google Scholar]
  8. Hart, C.J.R. Reduced intrusion-related gold systems. In Mineral Deposits of Canada: A Synthesis of Major Deposit-Types, District Metallogeny, the Evolution of Geological Provinces, and Exploration Methods; Geological Association of Canada, Mineral Deposits Division, Special Publication: St. Johns, NL, Canada, 2007; Volume 5, pp. 95–112. [Google Scholar]
  9. Paradis, S.; Hannigan, P.; Dewing, K. Mississippi Valley-type lead-zinc deposits. In Mineral Deposits of Canada: A Synthesis of Major Deposit-Types, District Metallogeny, the Evolution of Geological Provinces, and Exploration Methods; Geological Association of Canada, Mineral Deposits Division, Special Publication: St. Johns, NL, Canada, 2007; Volume 5, pp. 185–203. [Google Scholar]
  10. Peter, J.M.; Layton-Matthews, D.; Piercey, S.; Bradshaw, G.; Paradis, S.; Boulton, A. Volcanic-hosted massive sulphide deposits of the Finlayson Lake District, Yukon. In Mineral Deposits of Canada: A Synthesis of Major Deposit-Types, District Metallogeny, the Evolution of Geological Provinces, and Exploration Methods; Geological Association of Canada, Mineral Deposits Division, Special Publication: St. Johns, NL, Canada, 2007; Volume 5, pp. 471–508. [Google Scholar]
  11. Sinclair, W.D. Porphyry Deposits. In Mineral Deposits of Canada: A Synthesis of Major Deposit-Types, District Metallogeny, the Evolution of Geological Provinces, and Exploration Methods; Geological Association of Canada, Mineral Deposits Division, Special Publication: St. Johns, NL, Canada, 2007; Volume 5, pp. 223–243. [Google Scholar]
  12. Taylor, B.E. Epithermal gold deposits. In Mineral Deposits of Canada: A Synthesis of Major Deposit-Types, District Metallogeny, the Evolution of Geological Provinces, and Exploration Methods; Geological Association of Canada, Mineral Deposits Division, Special Publication: St. Johns, NL, Canada, 2007; Volume 5, pp. 113–139. [Google Scholar]
  13. Ross, A.A.; Kirchner, I.; Martin, C.J.; Dumala, M.R.; Methven, G. Technical Report Describing Updated Diamond Drilling, Metallurgical Testing and Mineral Resources on the Klaza Property, Yukon, Canada; NI-43-101 Technical Report; Rockhaven Resources Ltd.: Vancouver, BC, Canada, 2018. [Google Scholar]
  14. Ross, A.A.; Kirchner, I.; Martin, C.J.; Dumala, M.R.; Methven, G.; Molavi, M.; Warren, D.; Borntraeger, B. Technical Report Describing Updated Diamond Drilling, Metallurgical Testing and Mineral Resources on the Klaza Property, Yukon, Canada; NI-43-101 Technical Report; Rockhaven Resources Ltd.: Vancouver, BC, Canada, 2020; 263p. [Google Scholar]
  15. Lamb, J. The Geology and Mineralogy of the Brown McDade Mine. Master’s Thesis, University of British Columbia, Vancouver, BC, Canada, 1947; 65p. [Google Scholar]
  16. Hart, C.J.R.; Langdon, D.M. Geology and mineral deposits of the Mount Nansen camp, Yukon. In Yukon Exploration and Geology 1997; Government of Yukon: Whitehorse, YT, Canada, 1997; pp. 129–138. [Google Scholar]
  17. Mortensen, J.K.; Hart, C.J.R.; Tarswell, J.; Allan, M.M. U-Pb zircon age and Pb isotopic constraints on the age and origin of porphyry and epithermal vein mineralization in the eastern Dawson Range, Yukon. In Yukon Exploration Geology 2015; Yukon Geological Survey: Whitehorse, YT, Canada, 2016; pp. 165–185. [Google Scholar]
  18. Lee, W.-S. Metallogeny and Characterization of late Cretaceous Superimposed Porphyry Cu-Au-Mo and Epithermal Au-Ag Systems in the Dawson Range, Yukon, Canada: Case Study on the Klaza Deposit. Ph.D. Thesis, Laurentian University, Sudbury, ON, Canada, 2021; 272p. Available online: https://zone.biblio.laurentian.ca/handle/10219/3667 (accessed on 1 December 2022).
  19. Klepacki, D.W.; Wheeler, J.O. Stratigraphic and Structural Relations of the Milford, Kaslo and Slocan Groups, Goat Range, Lardeau and Nelson Map Areas, British Columbia; Geological Survey of Canada, Paper, 85-1A; Geological Survey of Canada: Ottawa, ON, Cananda, 1985; pp. 277–286. [Google Scholar]
  20. Sack, P.J.; Colpron, M.; Crowley, J.L.; Ryan, J.J.; Allan, M.M.; Beranek, L.P.; Joyce, N.L. Atlas of Late Triassic to Juras-sic plutons in the Intermontane terranes of Yukon. In Yukon Geological Survey Open File 2020-1; Yukon Geological Survey: Whitehorse, YT, Canada, 2020; 365p. [Google Scholar]
  21. Kovacs, N.; Allan, M.M.; Crowley, J.L.; Colpron, M.; Hart, C.J.R.; Zagorevski, A.; Creaser, R.A. Carmacks Copper Cu-Au-Ag Deposit: Mineralization and Post ore Migmatization of a Stikine Arc Porphyry Copper System in Yukon, Canada. Econ. Geol. 2020, 115, 1413–1442. [Google Scholar] [CrossRef]
  22. Logan, J.M.; Mihalynuk, M.G. Tectonic controls on early Mesozoic paired alkaline porphyry deposit belts (Cu-Au + Ag-Pt-Pd-Mo) within the Canadian Cordillera. Econ. Geol. 2014, 109, 827–858. [Google Scholar] [CrossRef]
  23. Klöcking, M.; Mills, L.; Mortensen, J.; Roots, C. Geology of mid-Cretaceous volcanic rocks at Mount Nansen, central Yukon, and their relationship to the Dawson Range batholith. In Yukon Geological Survey Open File 2016-25; Yukon Geological Survey: Whitehorse, YT, Canada, 2016; 37p. [Google Scholar]
  24. Sim, R.C.; Davis, B. Freegold Mt. Project; NI-43-101 Technical Report; Premium Nickel Resources Ltd.: Toronto, ON, Canada, 2020; 193p. [Google Scholar]
  25. Lee, W.-S.; Kontak, D.J.; Richards, J.P.; Barresi, T.; Creaser, R.A. Superimposed Porphyry systems in the Dawson Range, Yukon. In Tectonomagmatic Influences on Metallogeny and Hydrothermal Ore Deposits: A Tribute to Jeremy P. Richards; Society of Economic Geologists: Littleton, CO, USA, 2021; Volume 1, pp. 21–48. [Google Scholar]
  26. Mottram, C.M.; Kellett, D.A.; Barresi, T.; Chapman, G.G.; Halle, J. Tracking the porphyry-epithermal mineralization transition using U-Pb carbonate dating. Geology 2024, 52, 723–728. [Google Scholar] [CrossRef]
  27. Smuk, K. Metallogeny of Epithermal Gold and Base Metal Veins of the Southern Dawson Range, Yukon. Master’s Thesis, McGill University, Montreal, QC, Canada, 1998; p. 155. [Google Scholar]
  28. Glasmacher, U.; Freidrich, G. Volcanic-hosted epithermal gold-sulfide mineralization and associated enrichment processes, Sixtymile River area, Yukon Territory, Canada. In Yukon Geology; Government of Yukon: Whitehorse, YT, Canada, 1992; Volume 3, pp. 271–291. [Google Scholar]
  29. Johnston, S.T.; Wynne, P.J.; Francis, D.; Hart, C.J.R.; Enkin, R.J.; Engebretson, D.C. Yellowstone in Yukon: The Late Cretaceous Carmacks Group. Geology 1996, 24, 997–1000. [Google Scholar] [CrossRef]
  30. Mortensen, J.K.; Hart, C.J.R. Late and postaccretionary Mesozoic magmatism and metallogeny in the northern Cordillera, Yukon and east-central Alaska. In Geological Society of America Abstracts with Program; The Geological Society of America: Boulder, CO, USA, 2010; Volume 42, p. 676. [Google Scholar]
  31. Ciolkiewicz, W.; Mortensen, J.; Ryan, J.; Hart, C. Space-time composition patterns of the Late Cretaceous magmatism in west-central Yukon and east-central Alaska: Insights into the tectonic evolution of the northern Cordillera. In Proceedings of the Cordilleran Tectonics Workshop, Victoria, BC, Canada, 24–26 February 2012; Schedule and Abstracts. p. 15. [Google Scholar]
  32. Mottram, C.M.; Kellett, D.A.; Barresi, T.; Zwingmann, H.; Friend, M.; Todd, A.; Percival, J.B. Syncing fault rock clocks: Direct comparison of U-Pb carbonate and K-Ar illite fault dating methods. Geology 2020, 48, 1179–1183. [Google Scholar] [CrossRef]
  33. Selby, D.; Creaser, R.A. Late and mid-Cretaceous mineralization in the Northern Canadian Cordillera: Constraints from Re-Os molybdenite dates. Econ. Geol. 2001, 96, 1461–1467. [Google Scholar] [CrossRef]
  34. Selby, D.; Nesbitt, B.E.; Creaser, R.A.; Reynolds, P.H.; Muehlenbachs, K. Evidence for a nonmagmatic component in potassic hydrothermal fluids of porphyry Cu-Au-Mo systems, Yukon, Canada. Geochim. Cosmochim. Acta 2001, 65, 571–587. [Google Scholar] [CrossRef]
  35. Yukon Geological Survey. Yukon Digital Bedrock Geology. Available online: http://www.geology.gov.yk.ca/update_yukon_bedrock_geology_map.html (accessed on 20 August 2019).
  36. Sack, P.J.; Eriks, N.; van Loon, S. Revised geological map of Mount Nansen area (NTS 115/I3 and part of 115I/2). In Yukon Geological Survey, Open File; 2 Sheets: Sheet 1 Scale 1:50 000 and Sheet 2 Scale 1:20 000; Yukon Geological Survey: Whitehorse, YT, Canada, 2022. [Google Scholar]
  37. Lee, W.-S.; Kontak, D.J.; Richards, J.P.; Sack, P. Updated geology and porphyry copper potential of the Klaza deposit, Mount Nansen district (Yukon MINFILE 115I 067). In Yukon Exploration and Geology 2019; Yukon Geological Survey: Whitehorse, YT, Canada, 2020; pp. 75–97. [Google Scholar]
  38. Seedorff, E.; Dilles, J.H.; Proffett, J.M.; Einaudi, M.T.; Zurcher, L.; Stavast, W.J.; Johnson, D.A.; Barton, M.D. Porphyry Deposits: Characteristics and Origin of Hypogene Features. In Economic Geology 100th Anniversary Volume; Society of Economic Geologists: Littleton, CO, USA, 2005; pp. 251–298. [Google Scholar]
  39. Sillitoe, R.H. Porphyry Copper Systems. Econ. Geol. 2010, 105, 3–41. [Google Scholar] [CrossRef]
  40. Whitney, D.L.; Evans, B.W. Abbreviations for names of rock-forming minerals. Am. Mineral. 2010, 95, 185–187. [Google Scholar] [CrossRef]
  41. Monecke, T.; Monecke, J.; Reynolds, T.J. The influence of CO2 on the solubility of quartz in single-phase hydrothermal fluids: Implications for the formation of stockwork veins in porphyry copper deposits. Econ. Geol. 2019, 114, 1195–1206. [Google Scholar] [CrossRef]
  42. Lee, W.-S.; Kontak, D.J.; Petts, D.C.; Jackson, S.E. Mineral chemistry-driven protocol to unravel the complex paragenesis of the Klaza (Yukon, Canada) superimposed porphyry epithermal system. Ore Geol. Rev. 2022, 143, 27. [Google Scholar] [CrossRef]
  43. Moncada, D.; Mutchler, S.; Neito, A.; Reynolds, T.J.; Rimstidt, J.D.; Bodnar, R.J. Mineral textures and fluid inclusion petrography of the epithermal Ag–Au deposits at Guanajuato, Mexico: Application to exploration. J. Geochem. Explor. 2012, 114, 20–35. [Google Scholar] [CrossRef]
  44. Hitzman, M.W. Routine staining of drill core to determine carbonate mineralogy and distinguish carbonate alteration textures. Miner. Depos. 1999, 39, 794–798. [Google Scholar] [CrossRef]
  45. Zamora-Vega, O.; Richards, J.P.; Spell, T.; Dufrane, S.A.; Williamson, J. Multiple mineralization events in the Zacatecas Ag-Pb-Zn-Cu-Au district, and their relationship to the tectonomagmatic evolution of the Mesa Central, Mexico. Ore Ge-Ology Rev. 2018, 102, 519–561. [Google Scholar] [CrossRef]
  46. Selby, D.; Creaser, R.A. Macroscale NTIMS and microscale LA-MC-ICP-MS Re-Os isotopic analysis of molybdenite: Testing spatial restrictions for reliable Re-Os age determinations, and implications for the decoupling of Re and Os within molybdenite. Geochim. Cosmochim. Acta 2004, 68, 3897–3908. [Google Scholar] [CrossRef]
  47. Mattinson, J.M. Zircon U-Pb chemical abrasion (“CA-TIMS”) method: Combined annealing and multi-step partial dis-solution analysis for improved precision and accuracy of zircon ages. Chem. Geol. 2005, 220, 47–66. [Google Scholar] [CrossRef]
  48. Simonetti, A.; Heaman, L.M.; Chacko, T.; Banerjee, N.R. In situ petrographic thin section U-Pb dating of zircon, monazite, and titanite using laser ablation-MC-ICP-MS. Int. J. Mass Spectrom. 2006, 253, 87–97. [Google Scholar] [CrossRef]
  49. Patton, C.; Woodhead, J.D.; Hellstrom, J.C.; Hergt, J.M.; Greig, A.; Mass, R. Improved laser ablation U-Pb zircon geochronology through robust downhole fractionation correction. Geochem. Geophys. Geosyst. 2010, 11, 36. [Google Scholar] [CrossRef]
  50. Patton, C.; Hellstrom, J.; Paul, B.; Woodhead, J.; Hergt, J. Iolite: Freeware for the visualisation and processing of mass spectrometric data. J. Anal. At. Spectrom. 2011, 26, 2508–2518. [Google Scholar] [CrossRef]
  51. Fleck, R.J.; Sutter, J.F.; Elliot, D.H. Interpretation of discordant 40Ar/39Ar age spectra of mesozoic tholeiites from antarctica. Geochim. Cosmochim. Acta 1977, 41, 15–32. [Google Scholar] [CrossRef]
  52. Bellousova, E.A.; Griffin, W.L.; O’Reilly, S.Y. Zircon Crystal Morphology, Trace Element Signatures and Hf Isotope Composition as a Tool for Petrogenetic Modelling: Examples From Eastern Australian Granitoids. J. Petrol. 2006, 47, 329–353. [Google Scholar] [CrossRef]
  53. Corfu, F.; Hanchar, J.H.; Hoskin, P.W.O.; Kinny, P. Atlas of Zircon Textures. Rev. Mineral. Geochem. 2003, 53, 469–500. [Google Scholar] [CrossRef]
  54. Lu, Y.; Loucks, R.R.; Fiorentini, M. Zircon compositions as a pathfinder for porphyry Cu ± Mo ± Au deposits. In Tectonics and Metallogeny of the Tethyan Orogenic Belt; Economic Geology Special Publication 19; Society of Economic Geologists: Littleton, CO, USA, 2016; pp. 329–347. [Google Scholar]
  55. Watson, E.B.; Wark, D.A.; Thomas, J.B. Crystallization thermometers for zircon and rutile. Contrib. Mineral. Petrol. 2006, 151, 413–433. [Google Scholar] [CrossRef]
  56. Wooden, J.L.; Mazdab, F.K.; Barth, A.P. Temperatures (Ti) and compositional characteristics of zircon: Early observations using high mass resolution on the USGS Stanford SHRIMP-RG. Geochim. Cosmochim. Acta 2006, 70, 707. [Google Scholar] [CrossRef]
  57. Clairborne, L.L.; Miller, C.F.; Wooden, J.L. Trace element composition of igneous zircon: A thermal and compositional record of the accumulation and evolution of a large silicic batholith, Spirit Mt., Nevada. Contrib. Mineral. Petrol. 2010, 160, 511–531. [Google Scholar] [CrossRef]
  58. Clairborne, L.L.; Miller, C.F.; Walker, B.A. Tracking magmatic processes through Zr/Hf ratios in rocks and Hf and Ti zoning in zircons: An example from the Spirit Mt. batholith, Nevada batholith, Nevada. Mineral Mag. 2006, 70, 517–543. [Google Scholar]
  59. Gagnevin, D.; Daly, J.S.; Kronz, A. Zircon texture and chemical composition as a guide to magmatic processes and mixing in a granitic environment and coeval volcanic system. Contrib. Mineral. Petrol. 2010, 159, 579–596. [Google Scholar] [CrossRef]
  60. Moore, C.M.; Carmichael, I.S.E. The hydrous phase equilibria (to 3 kbar) of an andesite and basaltic andesite from west-ern Mexico: Constraints on water content and conditions of phenocryst growth. Contrib. Mineral. Petrol. 1998, 130, 304–319. [Google Scholar] [CrossRef]
  61. Richards, J.P.; Spell, T.; Rameh, E.; Razique, A.; Feltcher, T. High Sr/Y Magmas Reflect Arc Maturity, High Mag-matic Water Content, and Porphyry Cu ± Mo ± Au Potential: Examples from the Tethyan Arcs of Central and Eastern Iran and Western Pakistan. Econ. Geol. 2012, 107, 295–332. [Google Scholar] [CrossRef]
  62. Sun, W.; McDonough, W.F. Chemical and isotopic systematics of oceanic basalts: Implications for mantle composition and processes. Geol. Soc. Lond. Spec. Publ. 1989, 42, 313–345. [Google Scholar] [CrossRef]
  63. Tang, M.; Lee, C.A.; Chen, K.; Erdman, M.; Costin, G.; Jiang, H. Nb/Ta systematics in arc magma differentiation and the role of arclogites in continent formation. Nat. Commun. 2019, 10, 235. [Google Scholar] [CrossRef] [PubMed]
  64. Li, L.; Xiong, X.L.; Liu, X.C. Nb/Ta Fractionation by Amphibole in Hydrous Basaltic Systems: Implications for Arc Magma Evolution and Continental Crust Formation. J. Petrol. 2017, 58, 3–28. [Google Scholar] [CrossRef]
  65. Ferry, J.M.; Watson, E.B. New thermodynamic models and revised calibrations for the Ti-in-zircon and Zr-in-rutile thermometers. Contrib Mineral Petrol. 2007, 154, 429–437. [Google Scholar] [CrossRef]
  66. Ballard, J.R.; Palin, J.M.; Campbell, I.H. Relative oxidation states of magmas inferred from Ce“IV”/Ce“III” in zircon: Ap-plication to porphyry copper deposits of northern Chile. Contrib. Mineral. Petrol. 2002, 144, 347–364. [Google Scholar] [CrossRef]
  67. Shen, P.; Hattori, K.; Pan, H. Oxidation condition and metal fertility of granitic magmas: Zircon trace-element data from porphyry Cu deposits in the central Asian orogenic belt. Econ. Geol. 2015, 110, 1861–1878. [Google Scholar] [CrossRef]
  68. Zhong, S.; Seltmann, R.; Qu, H.; Song, Y. Characterization of the zircon Ce anomaly for estimation of oxidation state of magmas: A revised Ce/Ce* method. Mineral. Petrol. 2019, 113, 755–763. [Google Scholar] [CrossRef]
  69. Loader, M.A.; Wilkinson, J.J.; Armstrong, R.N. The effect of titanite crystallisation on Eu and Ce anomalies in zircon and its implications for the assessment of porphyry Cu deposit fertility. Earth Planet. Sci. Lett. 2017, 472, 107–119. [Google Scholar] [CrossRef]
  70. Mortensen, J.K.; Appel, V.L.; Hart, C.J.R. Geological and U-Pb age constraints on base and precious metal vein systems in the Mount Nansen area, eastern Dawson Range, Yukon. In Yukon Exploration and Geology 2002; Exploration and Geological Services Division, Yukon Region, Indian and Northern Affairs Canada: Whitehorse, YT, Canada, 2003; pp. 165–174. [Google Scholar]
  71. Stevens, R.D.; Delabio, R.N.; Lachance, G.R. Age Determinations and Geological Studies, K-Ar Isotopic Ages; Geological Survey of Canada, Paper 82-2; Geological Survey of Canada: Ottawa, ON, Cananda, 1982; 52p. [Google Scholar]
  72. Lund, K.; Aleinikoff, J.N.; Kunk, M.J.; Unruh, D.M.; Zeihen, G.D.; Hodges, W.C.; Du Bray, E.A.; O’Neill, J.M. SHRIMP U-Pb and 40Ar/39Ar Age Constraints for Relating Plutonism and Mineralization in the Boulder Batholith Region, Montana. Econ. Geol. 2002, 97, 241–267. [Google Scholar] [CrossRef]
  73. Richards, J.P. High Sr/Y Arc Magmas and Porphyry Cu ± Mo ± Au Deposits: Just Add Water. Econ. Geol. 2011, 106, 1075–1081. [Google Scholar] [CrossRef]
  74. Correa, K.J.; Rabbia, O.M.; Hernandez, L.B.; Selby, D.; Astengio, M. The Timing of Magmatism and Ore Formation in the El Abra Porphyry Copper Deposit, Northern Chile: Implications for Long-Lived Multiple-Event Magmatic-Hydrothermal Porphyry Systems. Econ. Geol. 2016, 111, 1–28. [Google Scholar] [CrossRef]
  75. Richards, J.P. Tectono-Magmatic Precursors for Porphyry Cu-(Mo-Au) Deposit Formation. Econ. Geol. 2003, 98, 1515–1533. [Google Scholar] [CrossRef]
  76. Harrison, M.T.; Watson, B.E.; Aikman, A.B. Temperature spectra of zircon crystallization in plutonic rocks. Geology 2007, 35, 635–638. [Google Scholar] [CrossRef]
  77. Tapster, S.; Condon, D.J.; Naden, J.; Noble, S.R.; Petterson, M.G.; Roberts, N.M.W.; Saunders, A.D.; Smith, D.J. Rap-id thermal rejuvenation of high-crystallinity magma linked to porphyry copper deposit formation; evidence from the Koloula Porphyry Prospect, Solomon Islands. Earth Planet. Sci. Lett. 2016, 442, 206–217. [Google Scholar] [CrossRef]
  78. Dilles, J.H.; Kent, A.J.R.; Wooden, J.L. Zircon compositional evidence for sulfur degassing from ore-forming arc magmas. Econ. Geol. 2015, 110, 241–251. [Google Scholar] [CrossRef]
  79. Lee, R.G.; Byrne, K.; D’Angelo, M.; Hart, C.J.R.; Hollings, P.; Gleeson, S.A.; Alfaro, M. Using zircon trace element composition to assess porphyry copper potential of the Guichon Creek batholith and Highland Valley Copper deposit, south-central British Columbia. Miner. Depos. 2020, 56, 215–238. [Google Scholar] [CrossRef]
  80. Green, T.H.; Pearson, N.J. Experimental determination of REE partition coefficients between amphibole and basaltic to andesitic liquids at high pressure. Geochim. Cosmochim. Acta 1985, 49, 1465–1468. [Google Scholar] [CrossRef]
  81. Erdmann, S.; Wodicka, N.; Jackson, S.E.; Corrigan, D. Zircon textures and composition: Refractory recorders of magmatic volatile evolution? Contrib. Mineral. Petrol. 2013, 165, 45–71. [Google Scholar] [CrossRef]
  82. Kelley, K.D.; Ludington, S. Cripple Creek and other alkaline-related gold deposits in the southern Rocky Mountains, USA: Influence of regional tectonics. Miner. Depos. 2002, 37, 38–60. [Google Scholar] [CrossRef]
  83. Hollings, P.; Wolfe, R.; Cooke, D.R.; Waters, P.J. Geochemistry of Tertiary Igneous Rocks of Northern Luzon, Philippines: Evidence for a Back-Arc Setting for Alkalic Porphyry Copper-Gold Deposits and a Case for Slab Roll-Back? Econ. Geol. 2011, 106, 1257–1277. [Google Scholar] [CrossRef]
  84. Richards, J.P.; Lopez, G.P.; Zhu, J.-J.; Creaser, R.A.; Locock, A.J.; Mumin, A.H. Contrasting Tectonic Settings and Sulfur Contents of Magmas Associated with Cretaceous Porphyry Cu ± Mo ± Au and Intrusion-Related Iron Oxide Cu-Au De-posits in Northern Chile. Econ. Geol. 2016, 112, 295–318. [Google Scholar] [CrossRef]
  85. Rabayrol, F.; Hart, C.J.R.; Thorkelson, D.J. Temporal, spatial and geochemical evolution of late Cenozoic post-subduction magmatism in central and eastern Anatolia, Turkey. Lithos 2019, 336, 67–96. [Google Scholar] [CrossRef]
  86. Frey, F.A.; Green, D.H.; Roy, S.D. Integrated Models of Basalt Petrogenesis: A Study of Quartz Tholeiites to Olivine Melilitites from South Eastern Australia Utilizing Geochemical and Experimental Petrological Data. J. Petrol. 1978, 19, 463–513. [Google Scholar] [CrossRef]
  87. Richards, J.P.; Kerrich, R. Special Paper: Adakite-Like Rocks: Their Diverse Origins and Questionable Role in Metallogenesis. Econ. Geol. 2007, 102, 537–576. [Google Scholar] [CrossRef]
  88. Olierook, H.K.H.; Kirkland, C.L.; Szilas, K.; Hollis, J.A.; Gardiner, N.J.; Steenfelt, A.; Jiang, Q.; Yakymchuk, C.; Evans, N.J.; McDonald, B.J. Differentiating between inherited and autocrystic zircon in granitoids. J. Petrol. 2020, 61, egaa081. [Google Scholar] [CrossRef]
  89. Gilmer, A.K.; Sparks, R.S.J.; Blundy, J.D.; Rust, A.C.; Hauff, F.; Hoernle, K.; Spencer, C.J.; Tapster, S. Petrogenesis and Assembly of the Don Manuel Igneous Complex, Miocene–Pliocene Porphyry Copper Belt, Central Chile. J. Petrol. 2018, 59, 1067–1108. [Google Scholar] [CrossRef]
  90. Bickerton, L.; Kontak, D.J.; Murphy, J.B.; Kellett, D.A.; Samson, I.A.; Marsh, J.H.; Dunning, G.; Stern, R. The age and origin of the South Mountain Batholith (Nova Scotia, Canada) as constrained by zircon U–Pb geochronology, geochemistry, and O–Hf isotopes. Can. J. Earth Sci. 2022, 59, 418–454. [Google Scholar] [CrossRef]
  91. Monger, J.W.H.; Gibson, H.D. Mesozoic-Cenozoic deformation in the Canadian Cordillera: The record of a “Conti-nental Bulldozer”? Tectonophysics 2019, 757, 153–169. [Google Scholar] [CrossRef]
  92. Gabrielse, H.; Murphy, D.C.; Mortensen, J.K. Cretaceous and Cenozoic dextral orogen-parallel displacements, magmatism, and paleogeography, north-central Canadian Cordillera. In Paleogeography of the North American Cordillera: Evidence For and Against Large-Scale Displacements; Special Paper 46; Geological Association of Canada: St. John’s, NL, Canada, 2006; pp. 255–276. [Google Scholar]
  93. Topham, M.J.; Allan, M.M.; Mortensen, J.K.; Hart, C.J.R.; Colpron, M.; Sack, P.J. Crustal depth of emplacement of the Early Jurassic Aishihik and Tatchun batholiths, west central Yukon. In Yukon Exploration and Geology 2015; Yukon Geological Survey: Whitehorse, YT, Canada, 2016; pp. 233–251. [Google Scholar]
  94. Richards, J.P. Postsubduction porphyry Cu-Au and epithermal Au deposits: Products of remelting of subduction-modified lithosphere. Geology 2009, 37, 247–250. [Google Scholar] [CrossRef]
  95. Bineli Betsi, T.; Lentz, D.; Chiaradia, M.; Kyser, K.; Creaser, R.A. Genesis of the Au-Bi-Cu-As, Cu-Mo ± W, and base-metal Au-Ag mineralization at the Mt. Freegold (Yukon, Canada): Constraints from Ar-Ar and Re-Os geochronology and Pb and stable isotope compositions. Miner. Depos. 2013, 48, 991–1017. [Google Scholar] [CrossRef]
  96. Bineli Betsi, T.; Bennett, V. New U-Pb age constraints at Freegold Mt.: Evidence for multiple phases of polymetallic mid- to Late Cretaceous mineralization. In Yukon Exploration and Geology 2009; Government of Yukon: Whitehorse, YT, Canada, 2010; pp. 57–84. [Google Scholar]
  97. Friend, M.A. Tectonomagmatic Framework for Late Cretaceous Post-Subduction Metallogeny in the Dawson Range, West-Central Yukon. Master’s Thesis, University of British Columbia, Vancouver, BC, Canada, 2022. [Google Scholar]
  98. Bennett, V.; Schulze, C.; Ouellette, D.; Pollries, B. Deconstructing complex Au-Ag Cu mineralization, Sonora Gulch project, Dawson Range: A Late Cretaceous evolution to the epithermal environment. In Yukon Exploration and Geology 2009; Government of Yukon: Whitehorse, YT, Canada, 2010; pp. 23–45. [Google Scholar]
  99. Godwin, C.I. Geology of the Casino Porphyry Copper-Molybdenum Deposit, Dawson Range, Y.T. Ph.D. Thesis, University of British Columbia, Vancouver, BC, Canada, 1975; 274p. [Google Scholar]
  100. Bineli-Betsi, T.; Lentz, D.; Mcinnes, B.; Evans, N. Emplacement ages and exhumation rates for intrusion-hosted Cu-Mo-Sb-Au mineral systems at Freegold Mt. (Yukon, Canada): Assessment from U-Pb, Ar-Ar, and (U-Th)/He geochronometers. Can. J. Earth Sci. 2012, 49, 653–670. [Google Scholar] [CrossRef]
  101. Moher, M. (U-Th)/He Thermochronology of the Aishihik Batholith, Central Yukon: Evidence for Stable Crust in the Cretaceous. Master’s Thesis, University of Ottawa, Ottawa, ON, Canada, 2018; 83p. [Google Scholar]
  102. Kreiner, D.C.; Holm-Denoma, C.; Pianowski, L.; Flood, Z.; Stevenson, D.; Graham, G.E.; Vazquez, J.; Creaser, R.A. Geochronology and Mapping Constraints on the Time-Space Evolution of the Igneous and Hydrothermal Systems in the Taurus Cu-Mo District, Eastern Alaska. Econ. Geol. 2023, 118, 745–778. [Google Scholar] [CrossRef]
  103. Richards, J.P.; Boyce, A.J.; Pringle, M.S. Geologic Evolution of the Escondida Area, Northern Chile: A Model for Spatial and Temporal Localization of Porphyry Cu Mineralization. Econ. Geol. 2001, 96, 271–305. [Google Scholar] [CrossRef]
  104. Campbell, I.H.; Ballard, J.R.; Palin, J.M.; Allen, C.; Faunes, A. U-Pb Zircon Geochronology of Granitic Rocks from the Chuquicamata-El Abra Porphyry Copper Belt of Northern Chile: Excimer Laser Ablation ICP-MS Analysis. Econ. Geol. 2006, 101, 1327–1344. [Google Scholar] [CrossRef]
Figure 4. Rock slabs and backscatter electron (BSE) images of rock type and veins at Klaza along with a schematic diagram summarizing the evolution of the setting. (A) Anhedral i4 dike clast within i5 dike (Kelly zone: KL-16-309; 395.66 m depth). (B) Stage 2b vein cutting i5 dike (Central Klaza zone: KL-11-12; 195.8 m depth). (C) Stage 2b and stage 3 vein at the contact between an i5 dike and i1 granodiorite (Central Klaza zone: KL-11-12; 176.5 m depth). (D) Prospector Mt. suite dike (i5) brecciated and cemented by Stage 2c (Western Klaza zone: KL-14-178; 96.5 m depth). (E) Stage 2a massive pyrite cut by Stage 2b cloudy quartz–pyrite–sphalerite–arsenopyrite vein and Stage 2c galena–sphalerite–tetrahedrite (Central BRX zone: KL-14-428; 57 m depth). (F) Stage 2a massive arsenopyrite and prismatic Stage 2a quartz (Western BRX zone: KL-17-398; 123 m depth). (G) Stage 2b banded arsenopyrite–pyrite–sphalerite–quartz vein with a centre-fill Stage 2c galena–sphalerite–tetrahedrite–quartz vein (Central Klaza zone: KL-14-193; 271.86 m depth). (H) Stage 3 rhodochrosite vein with sphalerite cutting Stage 2c galena–sphalerite–tetrahedrite–quartz (Western BRX zone: KL-17-398; 123.5 m depth). (I) BSE image of Stage 2c galena with tetrahedrite inclusions (Central Klaza zone: KL-11-12; 221.19 m). (J) SEM X-ray map of (I) showing the Ag-rich nature of tetrahedrite. (K) Bladed barite hosted in quartz-carbonate alongside banded ankerite veins from stage 3 (Central Klaza zone: KL-11-18; 181.90 m). (L) Colloform- and moss-textured quartz-carbonate vein from stage 3 (Central Klaza zone: KL-12-133; 148.65 m depth). (M) Fault gouge containing milled vein and wallrock material (Western BRX zone: KL-17-401; 82 m depth). (N) Silicified breccia in i1 granodiorite (Central Klaza zone: KL-12-133; 352.20 m depth). (O) A schematic diagram of the Klaza composite vein substages and their relationship to magmatic and high-T vein phases. Mineral abbreviations in accordance with Whitney and Evans [40].
Minerals 15 00038 g004
Figure 5. Summary of veins and alteration at the Klaza deposit setting. (A) Representative slab of unit i3b (i.e., a hornblende diorite) showing example of alteration types present in the vicinity of composite epithermal veins. (B) Close up view of porphyry-related propylitic (p-Pro) and epithermal vein-related propylitic (v-Pro) alteration. The boundary between these alteration types is defined by the alteration of biotite and amphibole to rutile and leucoxene. (C) Close up view of epithermal vein-related phyllic (v-Phy) and v-Pro alteration. (D) Schematic diagram depicting the transitional mineral stabilities of primary magmatic phases among the different alteration types. Mineral abbreviations in accordance with Whitney and Evans [40].
Minerals 15 00038 g005
Figure 6. Comparison of drillhole KL-12-114 (110 to 121.5 m depth) from the Klaza setting as seen in 2012 (A) versus in 2019 (B) to highlight the orange staining from the oxidation of the Fe-carbonate alteration. (C) Close-up view of the Fe-stained carbonate. (D,E) Comparison of carbonate colour in the same piece of core from 2012 (D) and 2019 (E).
Minerals 15 00038 g006
Figure 7. Summary of Ar–Ar age spectra for muscovite obtained from step-wise heating of pure mineral separates. Note that the grey denotes the steps used in the plateau age calculations. (A) KZ-1 (KL-12-133; 442 m). (B) KZWS17-03 (KL-15-240; 146 m). (C) KZWS17-56 (KL-12-133; 93 m depth).
Minerals 15 00038 g007
Figure 8. Summary of results for CA-TIMS U–Pb zircon geochronology for intrusive phases i2 (A), i3a (B), i4 (C), and i5 (D). The diagrams on the left are Concordia plots. Middle diagrams are weighted mean plots, and images on the right show pieces of representative material from the drillhole sample interval that was submitted for dating. Red ellipses in the Concordia plots and red bars in weighted mean plots denote the data for the youngest crystalizing zircons in the sample (autocrysts). The grey zone in the weighted mean plots represents the 2σ uncertainty limits whereas the green line represents the weighted mean. Images are also shown of the dated phases.
Minerals 15 00038 g008
Figure 9. Summary of results from in situ LA-ICP-MS U–Pb dating of zircon for various intrusive rocks (AE) in the Klaza setting shown in both weighted mean plots and Concordia diagrams. Red bars in the weighted mean plots denote data used for calculating the weighted mean age constraints. The grey zone in the weighted mean plots represents the 2σ uncertainty limits whereas the green line represents the weighted mean. Images are also shown of the dated phases.
Minerals 15 00038 g009
Figure 10. Schematic diagram depicting the provenance of igneous zircon in the different magmatic phases of the Klaza setting. This diagram illustrates the complexities of the magmatic environment of the Klaza system, where the Whitehorse suite, Casino suite, and Prospector Mountain suite share a common reservoir, resulting in the inheritance issues described above. Care must be taken by the geochronologist to ensure that only autocrysts are used in constraining the crystallization age of the intrusive phase.
Minerals 15 00038 g010
Figure 14. Histogram and relative probability plots for the various geochronological data (U–Pb zircon and Ar–Ar muscovite) from this study.
Minerals 15 00038 g014
Figure 15. Compilation of geochronological data relevant to the Klaza study area based on this study and data from previous workers. Cited geochronological data are from Mortensen et al. [17,70], Selby and Creaser [33], Selby et al. [34], and Stevens et al. [71].
Minerals 15 00038 g015
Figure 16. (A) Schematic tectonic model from the Late Triassic to the mid-Cretaceous (90 Ma), based on models proposed by Monger and Gibson [91]. (B) Schematic tectonic model for the Late Cretaceous (80–65 Ma) supported by the model proposed by Gabrielse et al. [92]. (CE) Schematic petrogenetic evolution of the district from the Late Triassic to the latest Cretaceous. Note the inset key in the upper right for various magmatic events.
Minerals 15 00038 g016
Table 1. Mineral modes for major intrusive phases based on field and petrographic observations of least altered samples.
Intrusive Phase% Quartz% Plagioclase% K-Feldspar% Biotite% Hornblende% Sericite *
i125–4030–450–2010–151–85–15
i23040?0–10–520–30
i3a0–530–4000–55–105–10
i3b0–545–50020–25305–10
i3c25–3030–40?7–102–530–50
i415–2025–30?5–100–130–50
i50–5??5–100–550–65
Sericite * = secondary, alteration-related mineral phase consisting of muscovite and illite inferred to be replacing K-feldspar and lesser plagioclase. ? = no primary K-feldspar preserved, hence unable to estimate modal abundance.
Table 2. Compilation of Re–Os molybdenite geochronology results.
Sample IDRe
(ppm)
±2σ187Re
(ppm)
±2σ187Os
(ppb)
±2σModel Age (Ma)±2σ (Ma)
DDH260B-160 FLEX10853681.81.91233.40.3108.50.5
DDH260B-160 FLEX RPT 111393715.62.01302.10.1109.10.5
DDH260B-160 FLEX-MAG 235.080.1022.050.0640.190.08109.30.5
KL481-387.1m6.4520.0184.0560.0115.1610.01476.30.4
1 Replicate analysis. 2 Analysis of magnetic mineral separate with 5% molybdenite.
Disclaimer/Publisher’s Note: The statements, opinions and data contained in all publications are solely those of the individual author(s) and contributor(s) and not of MDPI and/or the editor(s). MDPI and/or the editor(s) disclaim responsibility for any injury to people or property resulting from any ideas, methods, instructions or products referred to in the content.

