Article

Experimental and Theoretical Study of Sc2O3 Nanoparticles Under High Pressure

by
André Luis de Jesus Pereira
1,2,*,
Juan Angel Sans
1,
Rosario Vilaplana
3,
Sudeshna Ray
4,
Prachi Tadge
4,
Armstrong Godoy, Jr.
2,
Isabela M. Horta
2,
Argemiro S. da Silva-Sobrinho
2,
Plácida Rodríguez-Hernández
5,
Alfonso Muñoz
5,
Catalin Popescu
6 and
Francisco J. Manjón
1,*
1
Instituto de Diseño para la Fabricación y Producción Automatizada, MALTA Consolider Team, Universitat Politècnica de València, 46022 València, Spain
2
Laboratório de Plasmas e Processos—LPP, Instituto Tecnológico de Aeronáutica—ITA, São José dos Campos 12228-900, Brazil
3
Centro de Tecnologías Físicas, MALTA Consolider Team, Universitat Politècnica de València, 46022 València, Spain
4
Advanced Materials Research Centre, Faculty of Science, Rabindranath Tagore University, Bhopal 460993, India
5
Departamento de Física, MALTA Consolider Team, Universidad de La Laguna, 38207 San Cristóbal de La Laguna, Spain
6
ALBA-CELLS, MALTA Consolider Team, 08290 Barcelona, Spain
*
Authors to whom correspondence should be addressed.
Minerals 2025, 15(1), 21; https://doi.org/10.3390/min15010021
Submission received: 26 October 2024 / Revised: 9 December 2024 / Accepted: 24 December 2024 / Published: 27 December 2024

Abstract

:
This study investigates the high-pressure structural and vibrational properties of nano-Sc2O3 using a combination of X-ray diffraction, Raman spectroscopy, and theoretical calculations. Nano-Sc2O3 maintains its cubic bixbyite structure up to 26.4 GPa, without evidence of phase transitions, contrasting with bulk Sc2O3, which transitions to a monoclinic phase around 25–28 GPa. Raman spectroscopy reveals a pressure-induced blue shift in the vibrational modes, indicating lattice compression, and the absence of new modes confirms the retention of the cubic symmetry. Theoretical predictions using density functional theory (DFT) closely match the experimental data, validating the computational approach we use to model the pressure-dependent vibrational behavior of nano-Sc2O3. Comparisons with previous studies seem to show that the nanoscale material exhibits enhanced structural stability compared to its bulk counterpart, likely due to size effects and surface energy contributions. These findings provide new insights into the behavior of nanomaterials under extreme conditions and highlight the potential applications of nano-Sc2O3 in high-pressure environments.

Graphical Abstract

1. Introduction

Scandium oxide (Sc2O3), also known as Scandia, has various technological applications due to its optical, thermal, and electronic properties. One of its primary uses is in optical coatings, such as in lenses and high-power laser systems, where it excels due to its high transmittance (Eg ~ 6 eV), thermal stability, and resistance to damage. Additionally, Sc2O3 is widely employed as a catalyst in several processes, such as hydrocarbon reforming and gas-to-liquid conversion, owing to its high thermal stability and corrosion resistance. In the field of electronics, scandium oxide is used in semiconductor and optoelectronic devices, where its wide band gap makes it ideal for systems operating at high voltages and in environments with ultraviolet radiation. Sc2O3 also plays a significant role in the production of advanced ceramics, which are used in components exposed to extreme temperatures, especially in the aerospace and nuclear industries.
At ambient conditions, Sc2O3 crystallizes into a bixbyite-type (C-type) structure (Figure 1), which is a cubic crystal structure with space group Ia 3 ¯ (No. 206). In this configuration, the scandium ions (Sc³⁺) are octahedrally coordinated by oxygen atoms (O2−) located at the Wyckoff 48e site, with fractional coordinates (0.1543(7), 0.6168(7), 0.1103(7)). The Sc1 atoms are in the Wyckoff 8b site, with fractional coordinates (0.25, 0.25, 0.25). Each Sc1 atom is coordinated by six oxygen atoms, forming an undistorted octahedron. On the other hand, the Sc2 atoms are in the Wyckoff 24d site, with fractional coordinates (0.4664(2), 0, 0.25), are coordinated by six oxygen atoms and form a distorted octahedron (distortion index of 0.012).
Sc2O3 exhibits complex structural and vibrational behaviors when subjected to high-pressure (HP) conditions, with significant insights provided by both experimental and theoretical studies. Liu et al. observed a phase transition from C-type to a monoclinic structure (B-type, C2/m) at around 36 GPa using synchrotron X-ray diffraction (XRD) and Raman spectroscopy (RS) and found that the transformation was irreversible upon decompression, indicating a kinetic barrier that prevents the material from returning to the cubic phase once the transition occurs [1]. These observations were confirmed by Ovsyannikov et al., who performed a detailed investigation into the structural and vibrational properties of Sc2O3 single crystals at HP. They confirmed that, as pressure increases, the cubic phase of Sc2O3 undergoes a structural phase transition to the monoclinic phase at approximately 25 GPa [2]. However, no phase transition was observed in XRD measurements up to 30 GPa [3].
The C-B transition involves a substantial volume collapse (approximately 3%–7%), as well as an increase in the coordination number, where scandium atoms shift to six- and seven-fold coordination sites [1,2]. The transition is considered first-order, involving significant atomic rearrangements that lead to changes in the material’s vibrational and mechanical properties. Raman spectroscopy also reveals that vibrational modes characteristic of the cubic structure vanish at the transition pressure, while new peaks associated with the monoclinic phase emerge. These changes highlight the significant modifications in the local bonding environment.
Further insights into the HP behavior of Sc2O3 were provided by Yusa et al., who identified a phase transition to a B-type structure at 10 GPa and a subsequent transition to a Gd2S3-type structure (Pnma) at pressures above 19 GPa and high-temperature conditions (laser heating) [4]. Yusa’s study demonstrated that this Gd2S3 structure is characterized by scandium atoms occupying seven- and eightfold coordination sites, resulting in a highly dense structure with a large volume collapse compared to the B-type phase [4]. The transition to the Gd2S3 phase results in an even larger density increase than the transition to the B-type rare earth sesquioxide (RES) phase, marking a significant shift in the material’s structural and mechanical properties at high pressures [4].
Theoretical studies at HP have complemented experimental studies and have discussed the elastic behavior of scandia [3] and searched for possible HP phases, further increasing the coordination number of scandium atoms [1,5,6]. Wu et al. studied the transition from the monoclinic B-type phase to the hexagonal (P3m1) A-type phase in RES [6] and predicted this transition in Sc2O3 to be at approximately 76 GPa. Liu et al. [1] predicted that Sc2O3 would undergo a C-type phase to B-type phase transition around 15 GPa and from the B-type structure to the A-type structure around 77 GPa. Finally, calculations by Zhang et al. [5] also predicted the C-B phase transition around 15 GPa and the B-A phase transition at approximately 72 GPa; however, they suggested the possibility that the B-A phase transition could not be experimentally observed because of the transformation of the B-type phase into the Gd2S3-type phase above 18 GPa. Theoretical models also suggest that Sc2O3 could exhibit a semiconductor-to-metal transition at pressures above 270 GPa, driven by changes in its electronic structure and softening of its elastic constants [5]. While this transition has yet to be observed experimentally, it provides a valuable prediction for future HP research. In any case, the observation of the C-B phase transition near 30 GPa (predicted at 15 GPa) and the lack of observations of the B-type to Gd2S3-type phase transition in bulk Sc2O3 at room temperature even up to 46 GPa (predicted at 18 GPa) [1] suggests that the deviation of experimental vs. theoretical phase transition pressures seems to increase with the decrease in the ionic size of the rare-earth ion, as recently reviewed [7], likely due to kinetic barriers that are overcome only at high temperatures [4].
When we talk about HP behavior, nanoparticle (NP) materials exhibit unique phase behavior at HP, primarily due to their size and shape, which influence their physical and chemical properties [8]. HP conditions can induce phase transitions in both the atomic and mesoscale structures of NPs, leading to novel configurations and properties that are not achievable under ambient conditions. For instance, as pressure is applied, nanoparticles can undergo crystallographic changes, such as transitions from wurtzite to rock-salt structures, as observed in CdSe NPs, which often show a size-dependent increase in the transition pressure. Additionally, pressure can reduce interparticle distances, enhance NP coupling, and even cause NP coalescence, leading to the formation of new nanostructures. These pressure-induced behaviors open up opportunities for creating materials with enhanced mechanical, optical, and electronic properties, offering potential applications in areas such as sensors, memory storage, and advanced nanomaterials fabrication.
Yadav et al. explored the behavior of nanocrystalline Sc2O3 (31 nm) at HP [9]. Their findings indicate that nanocrystalline Sc2O3 (with an average size of 31 nm) retains its cubic structure up to pressures as high as 35.4 GPa without undergoing any phase transition. The high structural stability of the nanocrystalline material, attributed to its reduced defect density, is notable when compared to bulk Sc2O3, which transitions to the monoclinic phase between 25 and 36 GPa, according to reported studies [1,2].
As can be seen from the brief literature review presented so far, although there is much information already published about the properties of Sc2O3 under extreme pressure conditions, there are still points to be clarified since, to our knowledge, there is only one work reported for scandia nanocrystals under compression. In this context, this work aims to explore the behavior of Sc2O3 nanoparticles at HP. In this study, X-ray diffraction (XRD) and Raman scattering (RS) measurements have been carried out in Sc2O3 nanoparticles under compression, and the results of both measurements and those already published have been interpreted in the light of ab initio calculations based on density functional theory (DFT) for bulk Sc2O3. The results from these calculations have allowed a detailed analysis of the structural and vibrational behavior of bulk and nanocrystalline Sc2O3, clarifying points that have not yet been properly discussed.

2. Materials and Methods

2.1. Synthesis of Nano-Sc2O3

  • Materials
The high-purity powders of scandium oxide (Sc2O3) [Sigma Aldrich, 99%], triethanolamine (TEA) [Sigma Aldrich, 99%] (Sigma Aldrich, St. Louis, MO, USA), and nitric acid (HNO3) [Rankem] (Avantor, Inc., Radnor, PA, USA) were procured.
  • Method
Sc2O3 nanoparticles have been synthesized by a “complex-based precursor solution method” using TEA as a complexing agent. To synthesize 0.5 M of scandium nitrate as a stock solution for scandium, the following synthesis route was adopted. A similar synthesis procedure was previously used to synthesize Y2O3 nanoparticles of different sizes [10,11].
The dissolution of Sc2O3 in double distilled water and HNO3 mixture was carried out by the prolonged heat treatment (about 24 h) of a required amount of Sc2O3 in double-distilled water along with 10 mL of concentrated HNO3 at 80 °C under constant stirring conditions.
In the synthesis, the required amount of Sc(NO3)3 solution was placed in a 250 mL beaker. After that, a requisite amount of TEA was added into the beaker by maintaining the molar ratio of scandium ions to TEA at 1:4. At the initial stage, TEA formed a precipitate with scandium ions due to the formation of scandium hydroxide [Sc(OH)3]. To obtain a clear solution, the precipitate was then dissolved by the dropwise addition of concentrated HNO3 into the solution. For the dissolution, the pH of the solution was maintained at pH ~ 3. Importantly, at a smaller pH, Sc(OH)3 decomposes and a homogenous solution is formed and TEA can form scandium–TEA complexes. The ‘clear’ solution of ‘TEA-complexed’ scandium–nitrate was ‘evaporated’ on a hot plate by continuous heating at 150–200 °C under constant stirring conditions, which led to ‘foaming’ and ‘puffing’. During ‘evaporation’, the nitrate ions provide an ‘in situ oxidizing environment’ for TEA, which partially converts the hydroxyl groups of TEA into carboxylic acids. Upon ‘complete dehydration’, the nitrates themselves decomposed with the ‘evolution of brown fumes’ of nitrogen dioxide, leaving behind a ‘voluminous’, ‘organic-based’, black, ‘fluffy’ powder, i.e., the ‘precursor’ powder. The complete ‘evaporation’ of the precursor solution resulted in a ‘highly branched polymeric’ structure, with the scandium ions homogeneously lodged in its matrix and thus preventing the segregation of nanoparticles. The precursor mass was then calcined and annealed at 550 °C for 2 h to obtain ‘nano-Sc2O3′ particles.

2.2. Experimental Procedure

To characterize the nanoparticles at ambient conditions, field emission scanning electron microscopy (FESEM), XRD, and RS measurements were performed. The FESEM (Mira 3 Tescan) (TESCAN, Brno, Czech Republic) was performed with a magnification of 100 kx; beam intensity of 10 eV, and with secondary electrons mode detector. The XRD measurement (PANalytical Empyrean) (Malvern Panalytical, Rockville, UK) was performed using a Cu Kα (1.5405 Å for Kα1) as an incident radiation source using 40 kV and 45 mA. The measurements were performed in the range from 10° to 90° using the capillary configuration, using step size and time per step of 0.013° and 18 s/step, respectively. The mean crystallite size was calculated using the Scherrer equation [12]. Unpolarized RS measurements excited with a 532 nm laser with a power of less than 10 mW were obtained through backscattering geometry using a Horiba Jobin Yvon LabRAM HR UV microspectrometer (HORIBA, Kyoto, Japan) equipped with a thermoelectrically cooled multichannel charge-coupled device detector and a 1200 grooves/mm grating that allows a spectral resolution of better than 3 cm−1. These measurements have allowed us to determine the main features of the nanoparticles to be studied at HP to be able to understand their behavior under compression in comparison with bulk material.
Powder angle-dispersive HP-XRD measurements were performed at room temperature at the BL04-MSPD beamline of the ALBA-CELLS synchrotron [13] using a monochromatic X-ray beam with λ = 0.4246 Å. The sample was loaded in a Merrill–Bassett-type diamond anvil cell (DAC) with diamond culets of 400 μm in diameter together with a 16:3:1 methanol–ethanol–water mixture as a pressure-transmitting medium (PTM) [14], and pressure was estimated from the equation of state (EoS) of copper [15]. The Dioptas software v0.6.1 [16] was used to integrate 2D diffraction images. Finally, structural analysis through Rietveld and Le Bail refinements were performed using GSAS-II [17] program packages.
HP-RS measurements were performed in the same instrument described in ambient pressure measurement. To perform the HP experiments, the sample was loaded in a membrane-type DAC with a 16:3:1 methanol–ethanol–water mixture and pressure was determined by the ruby luminescence method [18]. Raman peaks were analyzed with a Voigt profile fixing the Gaussian linewidth (2.4 cm−1) to the experimental setup resolution. In all experiments, DAC loading was performed to avoid sample bridging between the diamonds [19].

2.3. Simulations Details

Ab initio total-energy calculations at 0 K for the bixbyite Sc2O3 were performed within the density functional theory (DFT) [20] framework with the Vienna Ab initio Simulation Package (VASP) version 6.3.1 [21,22]. The pseudopotential method and the projector augmented wave (PAW) scheme [23,24] were used with the plane–wave basis set extended up to an energy cutoff of 520 eV. The generalized gradient approximation (GGA), with the Perdew–Burke–Ernzerhof parametrization extended for solids (PBEsol) [25], was used to describe the exchange and correlation energy. The Brillouin zones of these structures were sampled with the dense Monkhorst–Pack meshes [26] of special k-points (6 × 6 × 6). This method ensures a high convergence of 0.002 meV per formula unit in the total energy and an accurate calculation of the forces on atoms. For this studied phase, the structures were fully relaxed to the optimized configuration, at sets of selected volumes, through the calculation of the forces on atoms and the stress tensor. In particular, we calculated 44 relaxed volumes for the cubic bixbyite phase and 22 volumes for the monoclinic phase (those points are not plottedwith symbols since we mostly use lines for theoretical calculations and symbols for experimental data long the paper). Two optimization criteria were used: (i) forces on the atoms should be lower than 0.005 eV/Å and (ii) deviations of the stress tensor from the diagonal hydrostatic form should be lower than 0.1 GPa. The directforce constant approach [27] was used to obtain the lattice–dynamical properties, frequency, and symmetry of the phonon modes at the Γ point of the Brillouin zone.

3. Results

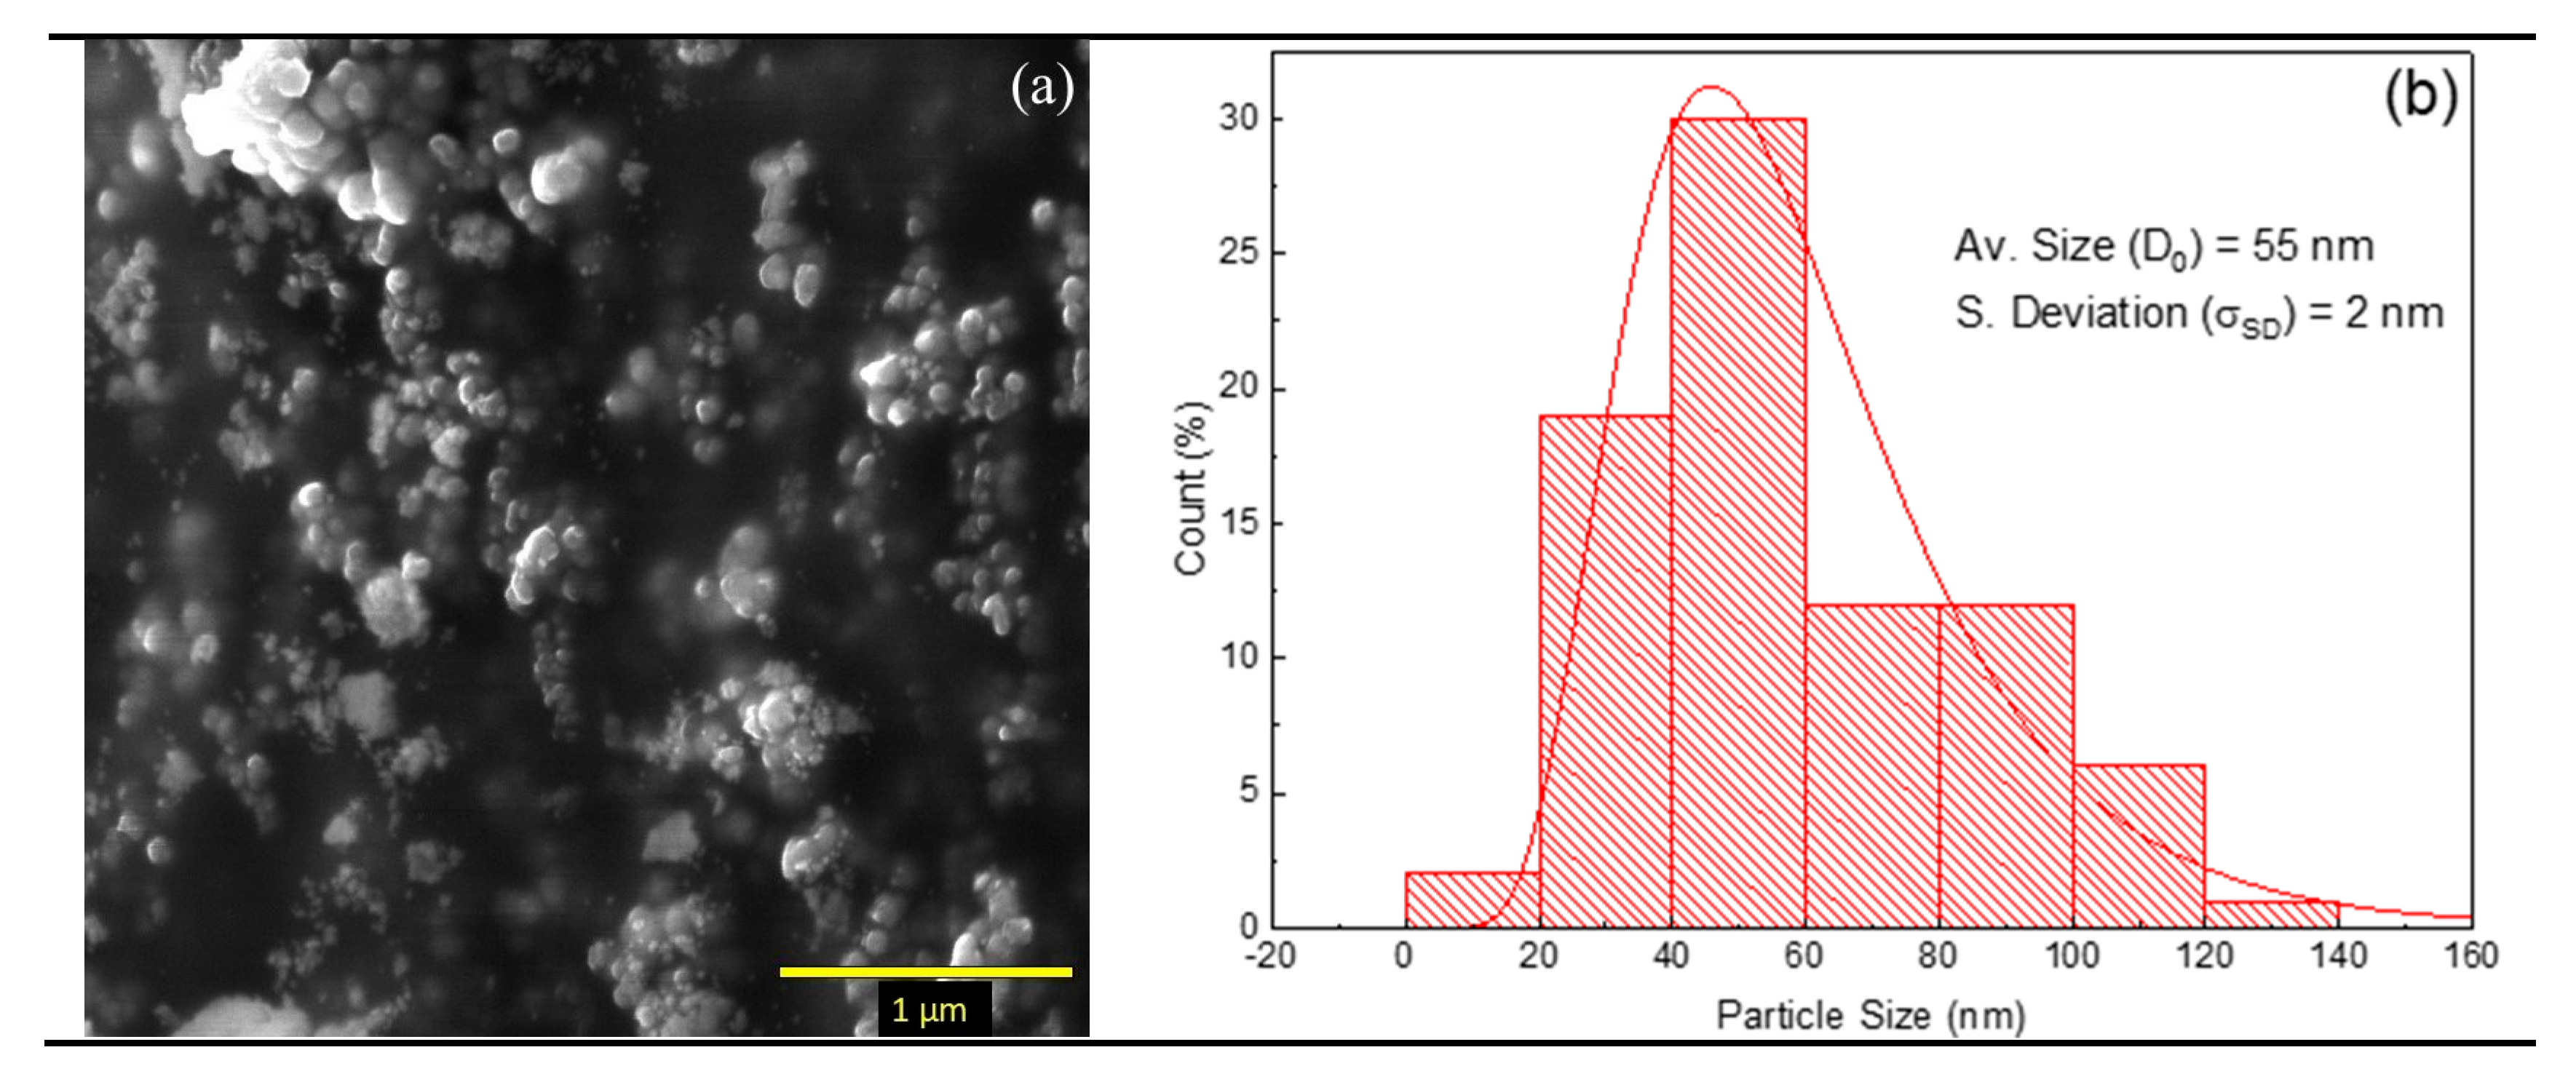
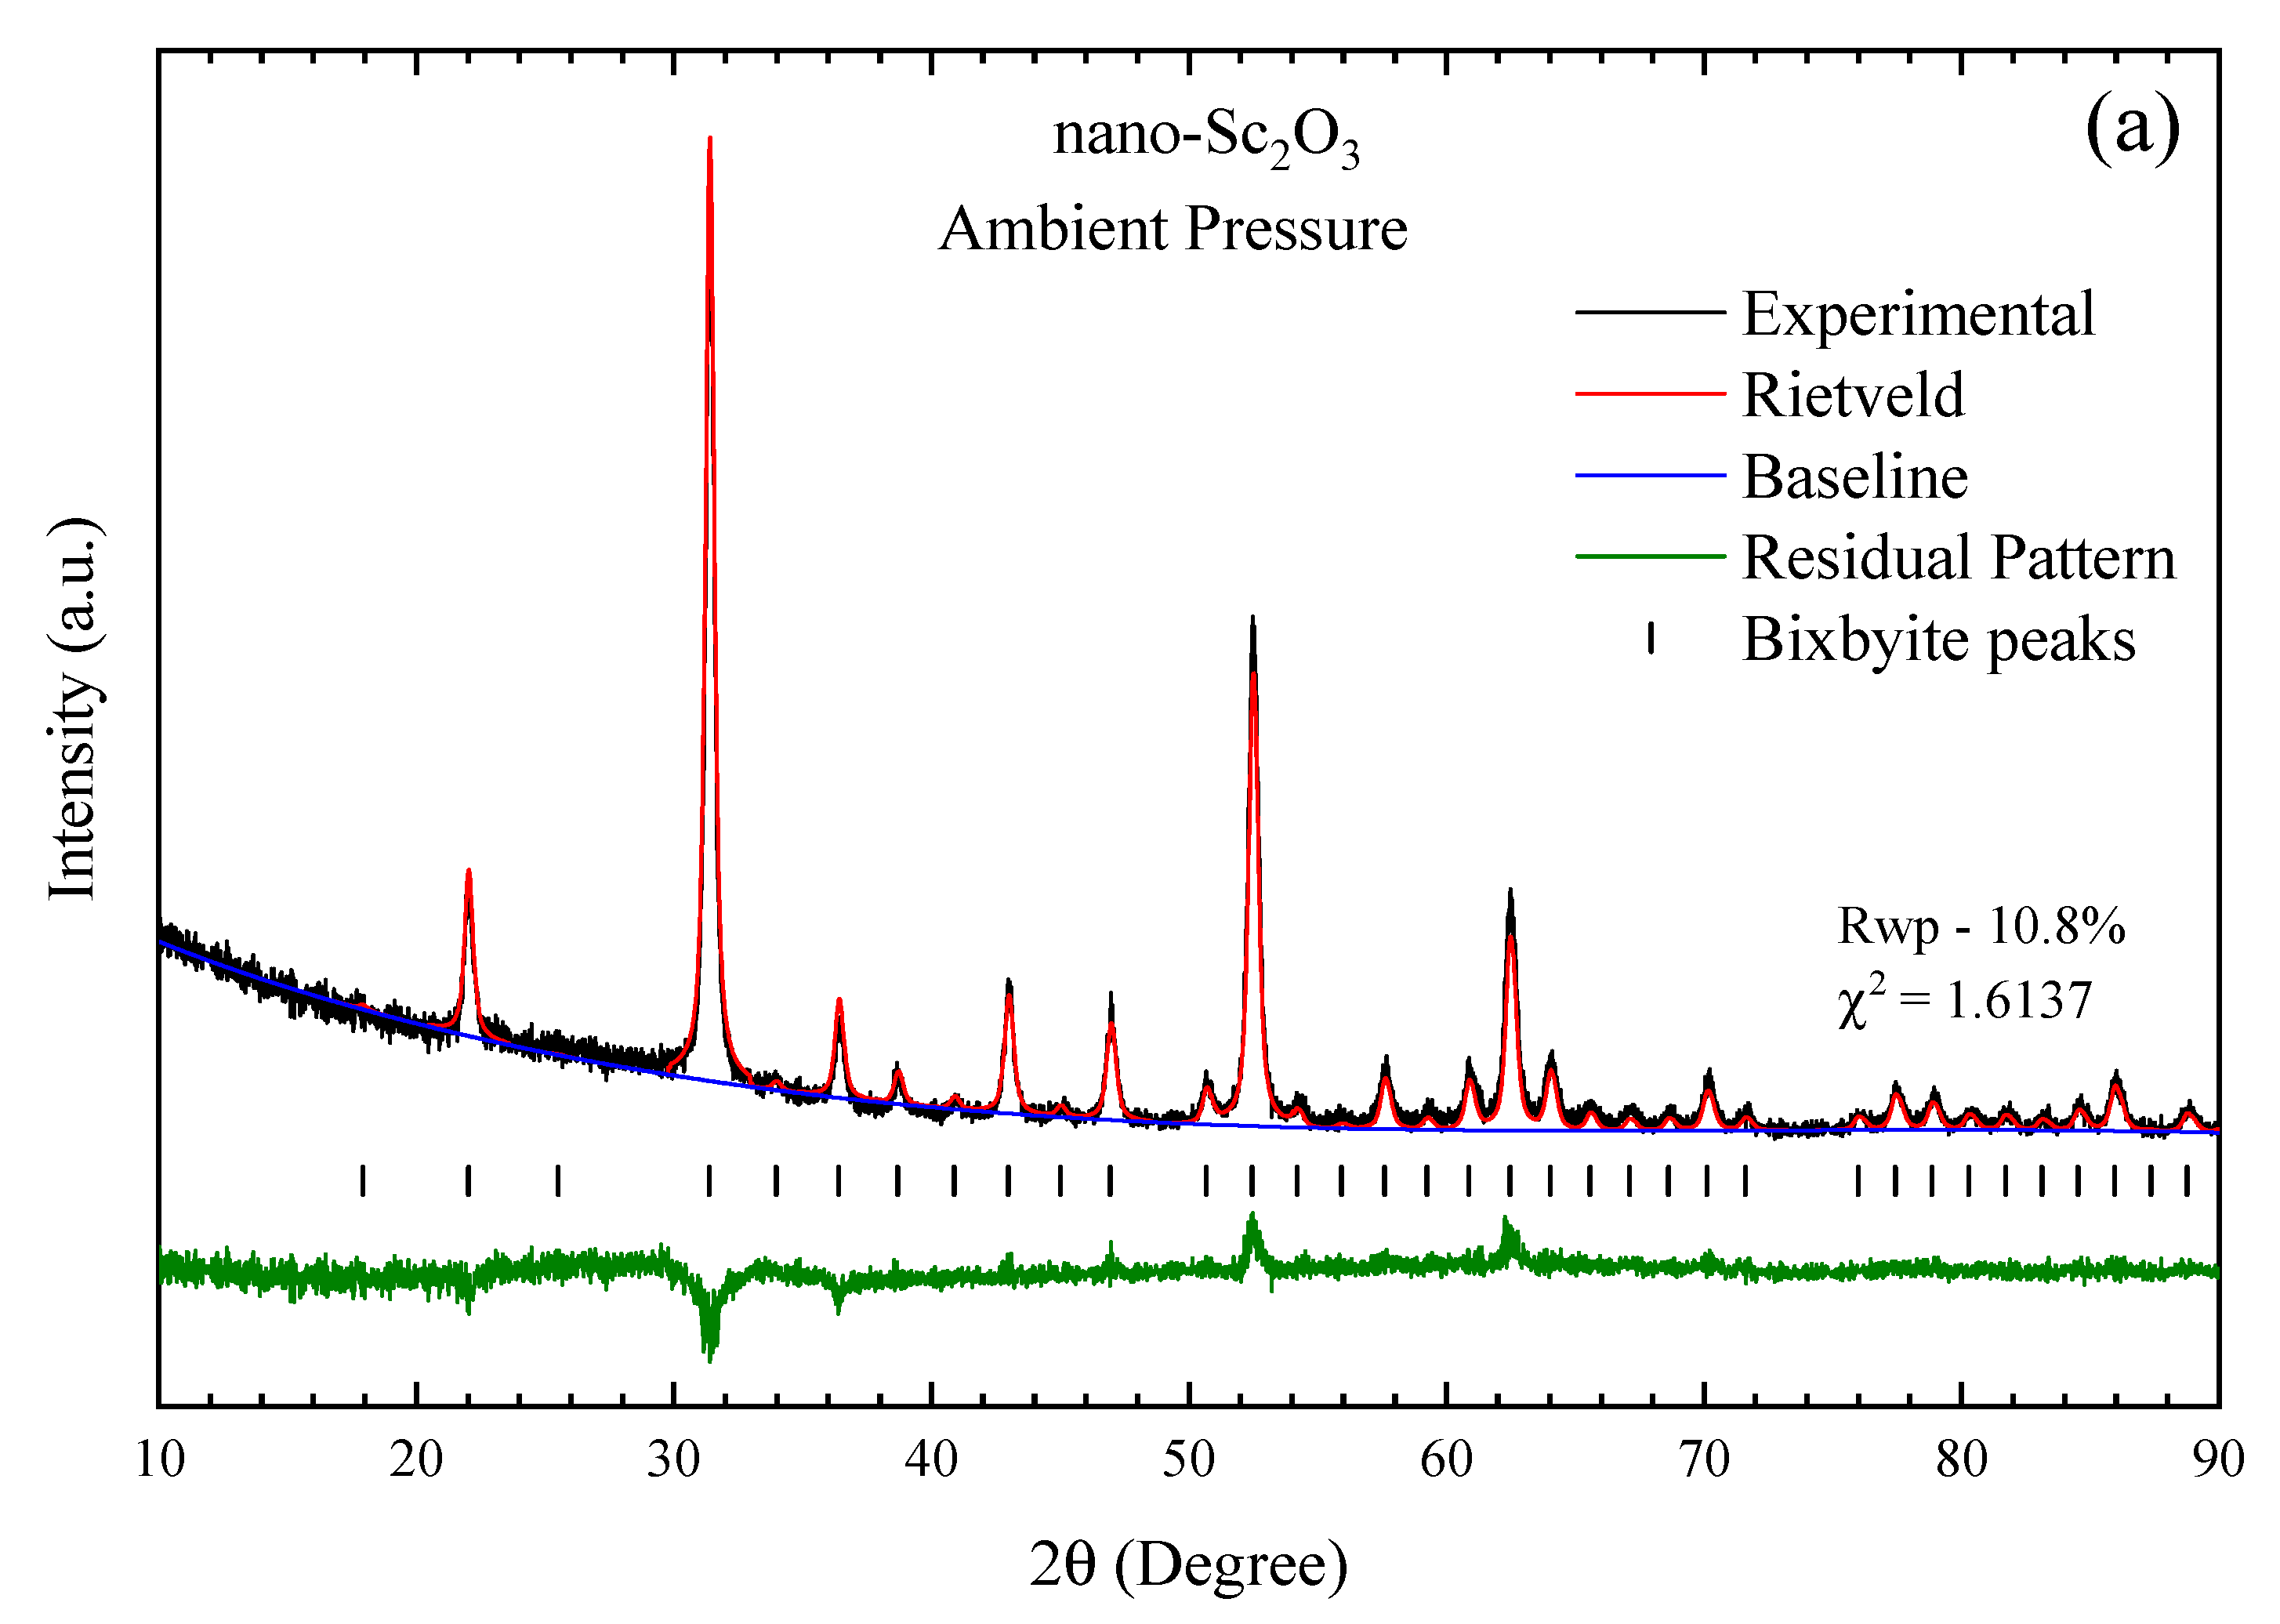
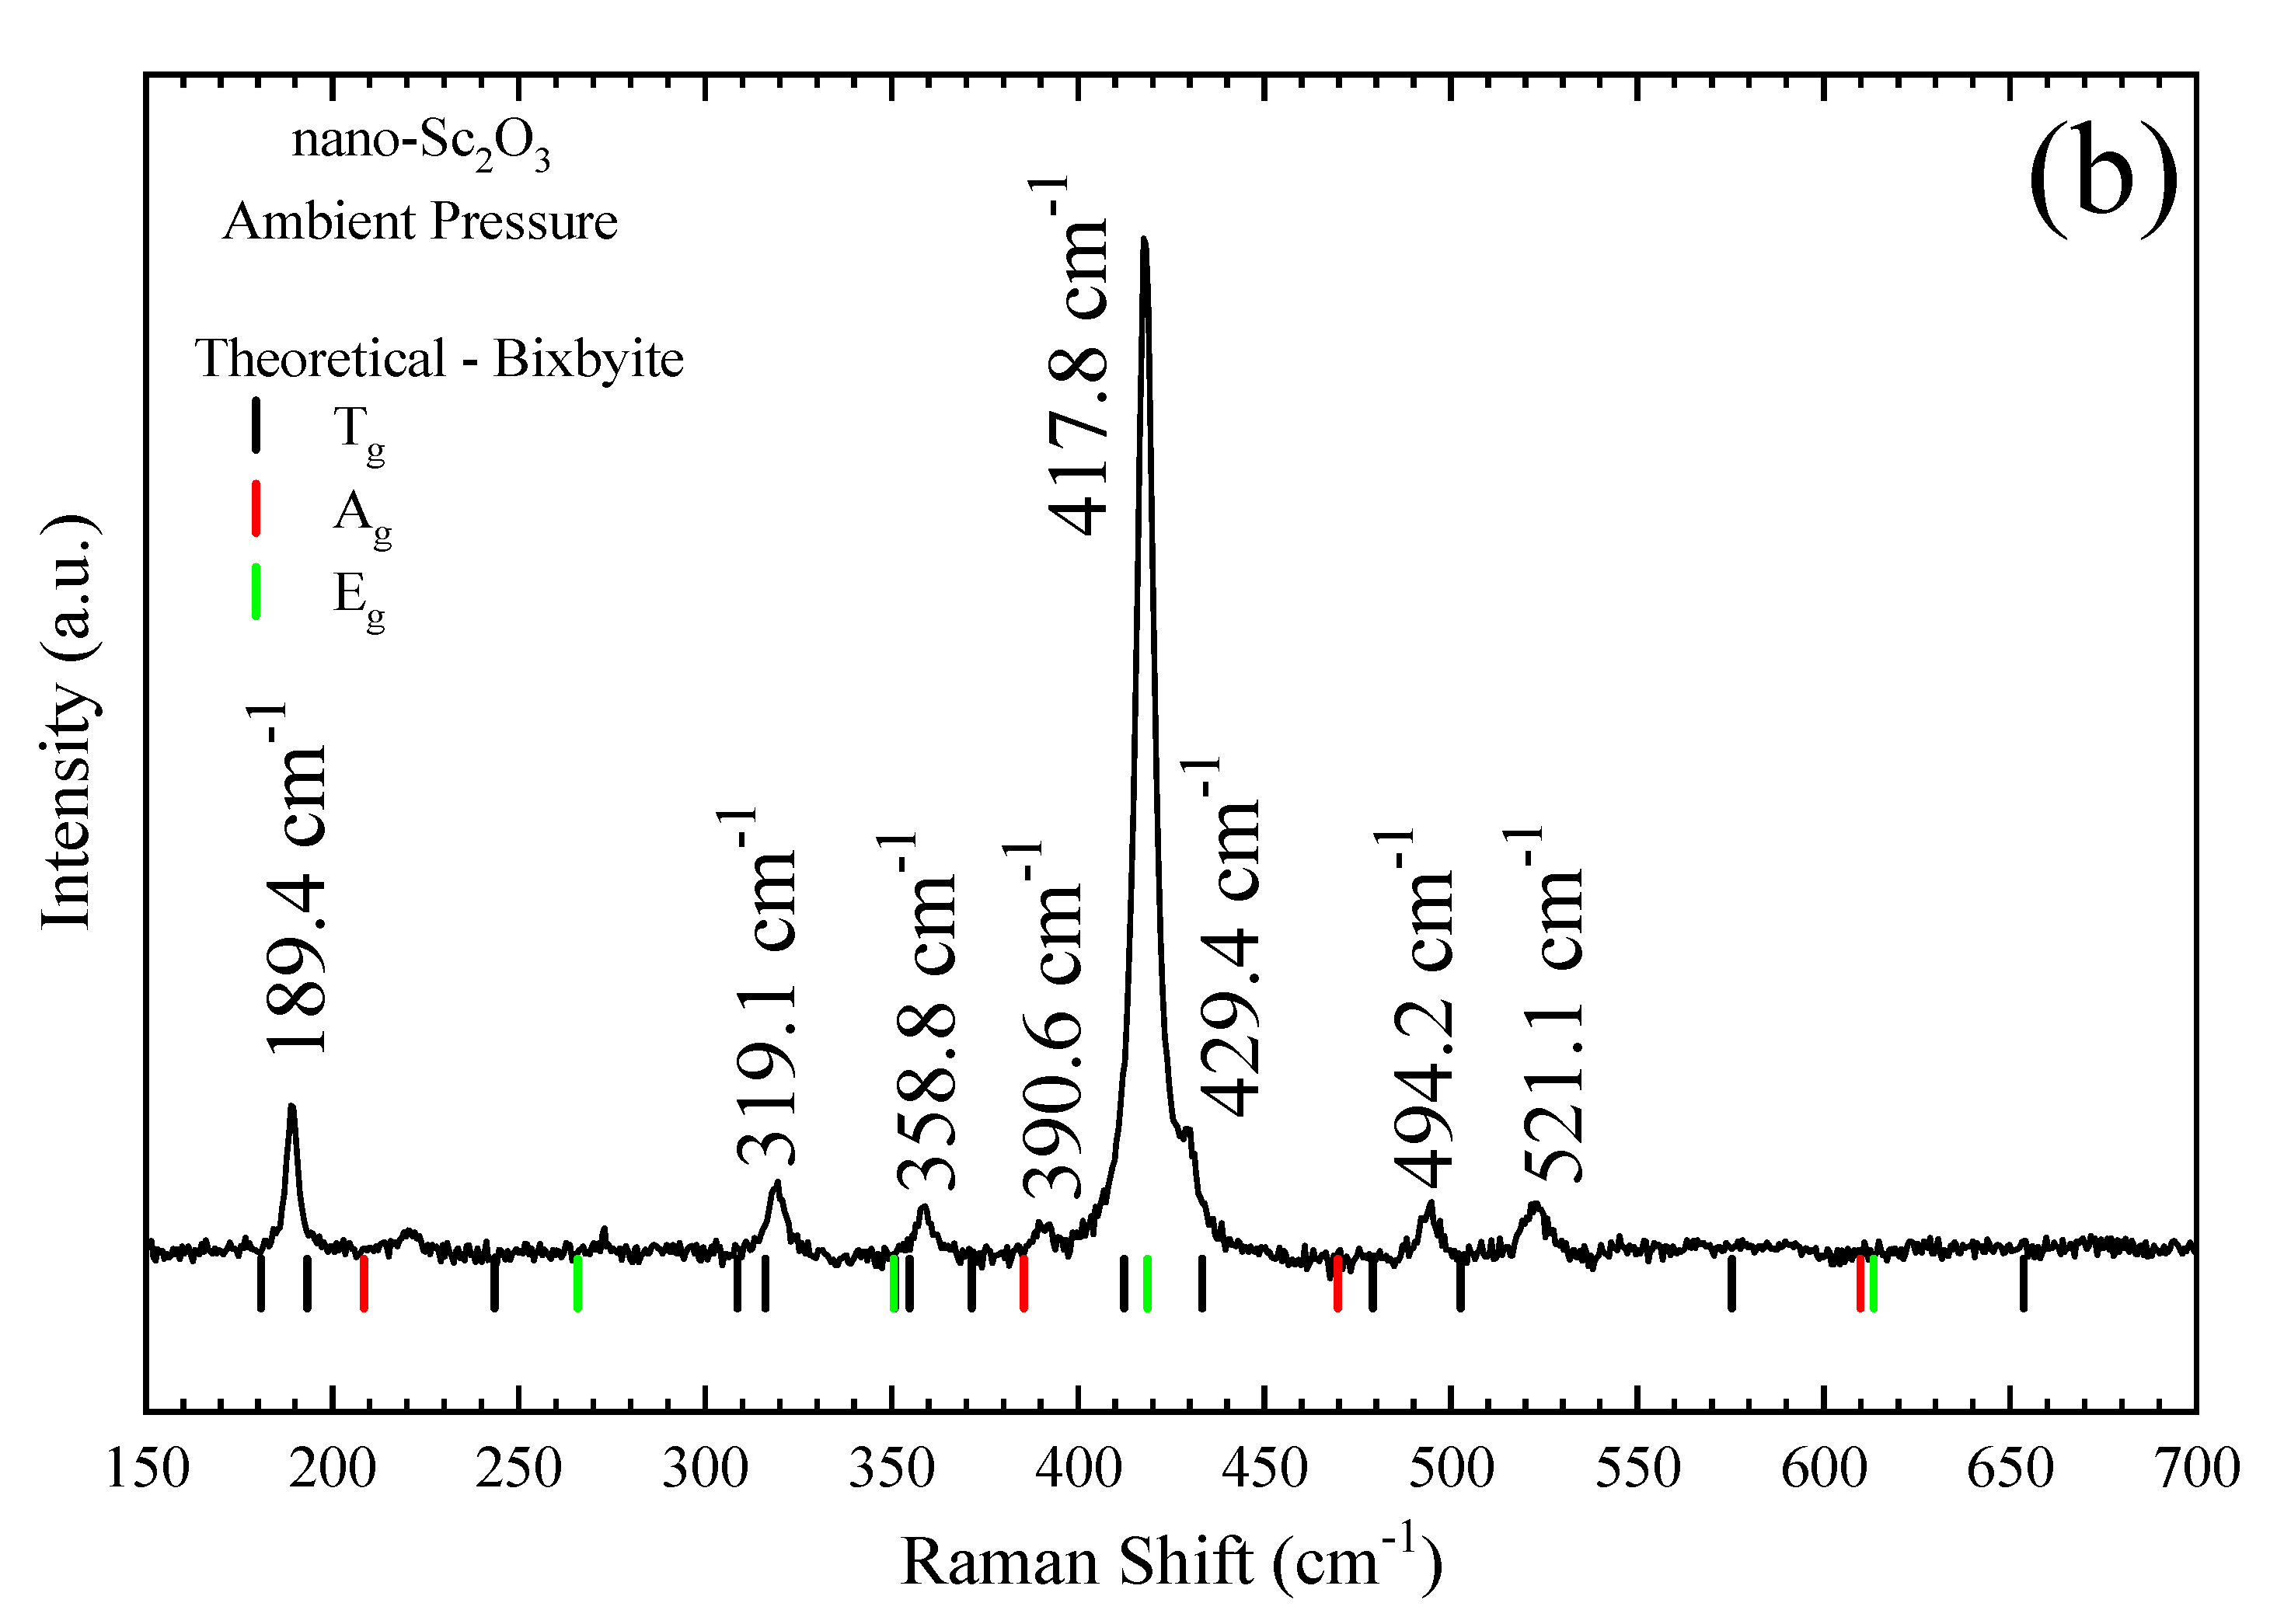
3.1. Ambient Pressure Characterization

Figure 2a shows a FESEM image of the studied Sc2O3 nanoparticles. In general, nanoparticles exhibit a spherical morphology with a non-uniform particle size distribution, and these are mainly found forming clusters. The average size of the nanoparticle for each sample has been estimated by fitting the particle size distribution histogram to the log-normal distribution function, which is represented as
f D = 1 2 π σ D exp ln 2 D D 0 2 σ 2
where D corresponds to the average particle size and σD is the standard deviation [28]. Figure 2b shows the histogram with the size distribution of the nano-Sc2O3 sample and the fit to the log normal distribution function. The fit provided an average particle size of D = 55 nm with a standard deviation of σD = 2 nm.
Figure 3a shows the XRD of the Sc2O3 nanoparticles at ambient pressure. As can be seen, the diffractogram only presents peaks related to the bixbyite phase of Sc2O3, as already reported in the literature [29], and it is not possible to identify peaks related to other phases or impurities. The quality of the diffractogram allowed us to perform the Rietveld refinement of the lattice parameters, the free atomic coordinates, and the instrumental profile parameters using only the bixbyite (Ia 3 ¯ ) structure, resulting in a relatively good fit, with an Rwp of 10.8% (χ2 = 1.6137). The lattice parameter refined within this space group was a = 9.8453(5) Å and the volume is V0 = 954.3 Å3 (V0/Z = 59.6 Å3, Z = 16). Furthermore, the free atomic coordinates also were refined, resulting in Sc2 (0.4663(2), 0.0, 0.25) and O1 (0.3897(6), 0.1545(5), 0.3833(7)). The refinement resulted in an average crystallite size of 35 ± 5 nm, relatively close to that observed by FESEM imaging (Figure 2).
Figure 3b shows the RS spectrum of the Sc2O3 nanoparticles under ambient conditions. According to group theory, the C-type structure has 120 vibrational modes at the Γ-point with the mechanical representation: Γ120 = 4Ag + 5Au + 4Eg + 5Eu + 14Tg + 17Tu [30,31]. This means that C-type Sc2O3 should have 22 Raman-active modes (4Ag + 4Eg + 14Tg), 16 IR-active modes (16Tu), and 10 IR-silent modes (5Au + 5Eu), in addition to the three degenerate acoustic modes (Tu). As can be seen in Figure 3, the main peaks observed in nano-Sc2O3 correspond to the bixbyite-type structure of Sc2O3 and agree with the peaks observed for bulk [1] and single crystal [2] samples. We can observe in nano-Sc2O3 only 7 of the 22 theoretically predicted Raman-active modes. This result contrasts with that obtained in bulk material, in which up to 15 [2] and 19 [19] Raman-active modes have been observed. The atomic vibrations of some of the most important Raman-active modes are commented on in Refs. [32,33,34]. In particular, the most intense Raman peak at ~418 cm−1 has been attributed to the symmetric stretching mode of the ScO6 octahedral unit. This mode is observed at 379 cm−1 in Y2O3 [32] due to the larger atomic mass of Y than Sc. Since these are nanoparticles, the spectrum presents relatively broad and poorly defined peaks, typical of nanometric structures, which makes it difficult to identify low-intensity peaks. A comparison of our experimental and theoretical calculations has allowed us to tentatively identify the symmetry of each observed vibrational mode, as will be discussed later.

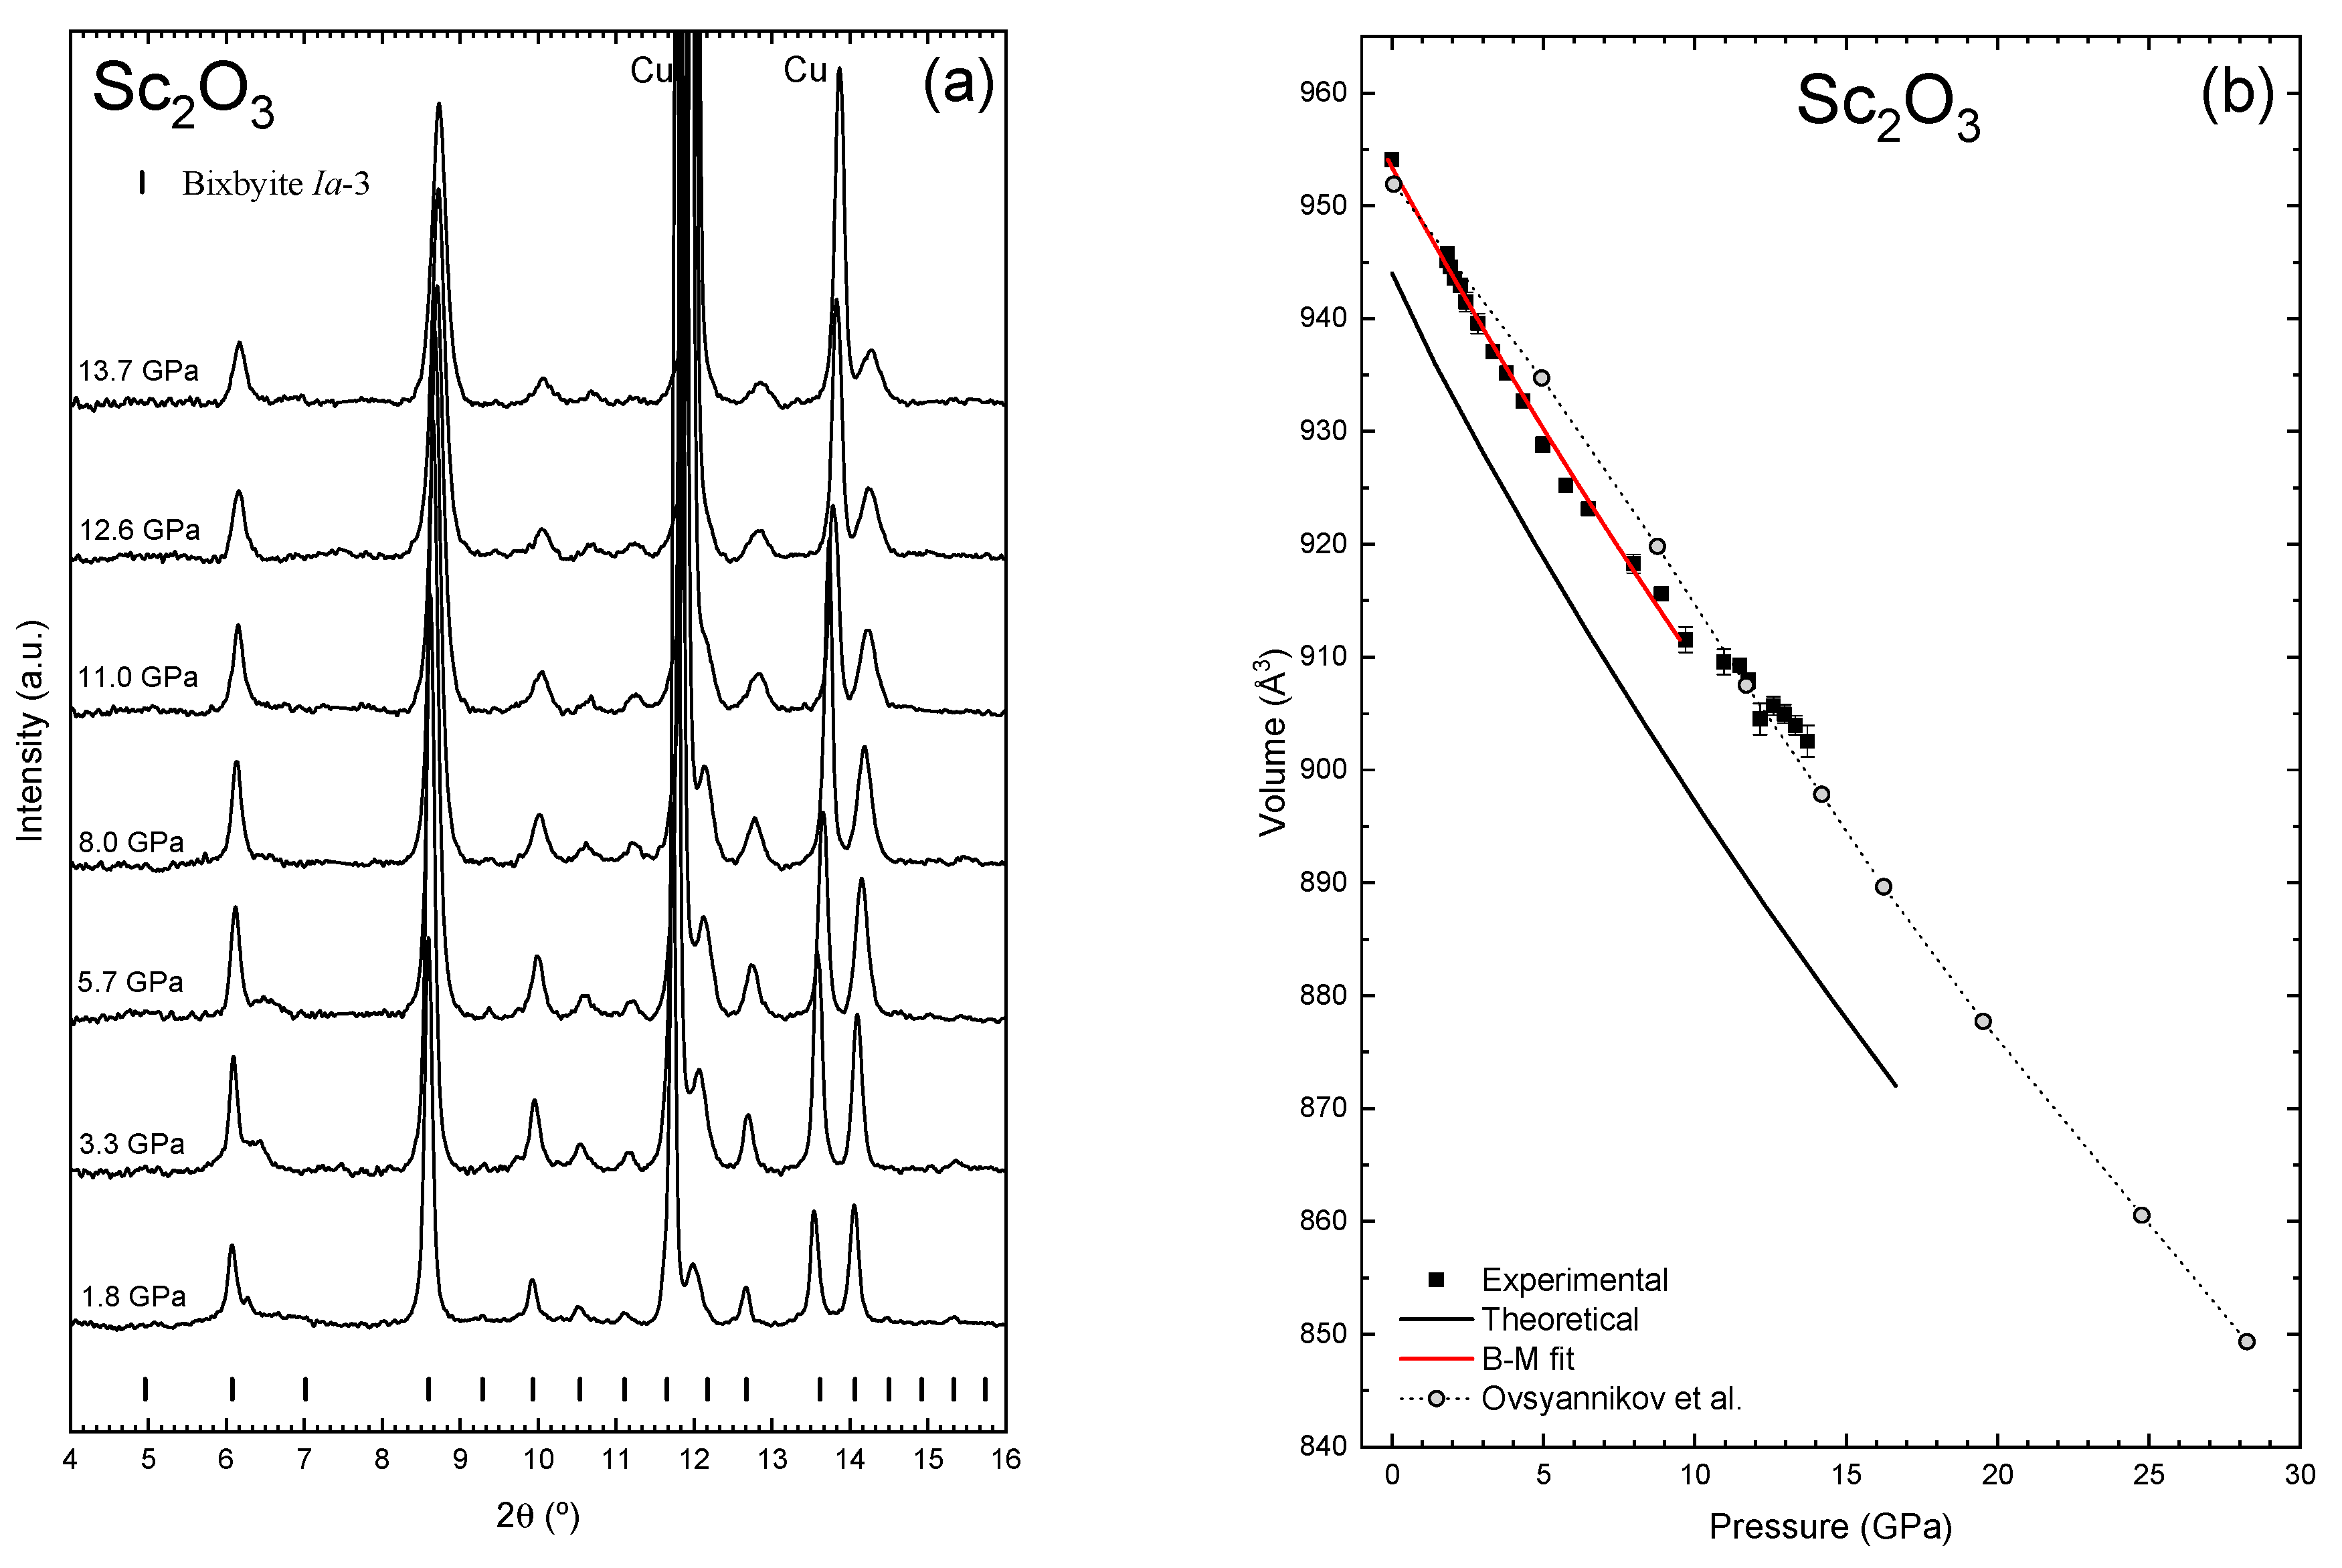
3.2. High-Pressure Characterization

To undertake the structural characterization of the nano-Sc2O3, we performed synchrotron-based HP-XRD measurements up to 13.7 GPa (Figure 4a). As pressure increases, the peaks of the C-type phase of Sc2O3 tend to shift to higher angles, indicating a decrease in the unit cell volume. Up to the maximum pressure that we reached (13.7 GPa), we did not observe any indications of phase change. Our results compare well with previous HP-XRD measurements in bulk-Sc2O3 [1,2,3] and nano-Sc2O3 [9] since they evidence a very similar behavior in all the samples. Therefore, our results indicate that nanoparticles with an average size of ~55 nm show a similar behavior to that of previously studied 31 nm nanoparticles and bulk material.
Given the quality of the diffractograms obtained at HP, the Sc2O3 nanoparticles XRD data were analyzed with a LeBail whole pattern fitting, where we could refine the lattice parameters and the instrumental profile parameters (the atomic coordinates were kept fixed and equal to those obtained at ambient pressure). These refinements allowed us to obtain the pressure dependence of the unit cell volume (see Figure 4b). As can be observed, there is a good agreement between the experimental and theoretical (bulk) pressure dependence of the unit cell volume in our 55 nm nanoparticles and the experimental and theoretical pressure dependence for the bulk material [2] at least up to 10 GPa. Above this pressure, the experimental data for nanocrystals tend to deviate from the behavior expected in the bulk material likely due to the existence of non-hydrostatic conditions. Furthermore, as can be seen in Figure 4b, our results also show good agreement with the results reported for the monocrystalline sample [2]. The third-order BM-EoS fit for Sc2O3 up to ~10 GPa with fixed B0′ results in the following: V0 = 953.4(5) Å3, B0 = 194(4) GPa, and B0′ = 4. Our value for B0 shows a good agreement with both our and previous [6] theoretical calculations for bulk-Sc2O3 and with the experimental results reported in the literature for bulk-Sc2O3 (see Table 1). Moreover, it agrees with the estimated value obtained from the comparison of experimental and theoretical results [35]. The biggest discrepancy occurs when we compare our B0 value with that presented by Yadav et al. [9], which may be related to the fact that their B0′ value is excessively high for a 3D solid material (see Table 1). It can be observed that a value of B0′ around 9 or more is typical of molecular solids, such as arsenolite (α-As2O3) or senarmontite (α-Sb2O3) [36,37]. We consider that the large value of the bulk modulus previously obtained for 31 nm nanocrystals [9] is likely due to the fit of the EoS along the whole pressure range till 35 GPa without considering non-hydrostatic conditions present above 10 GPa in those measurements. Using the experimental data of Yadav et al. [9] and the fit of the third-order BM-EoS up to ~8 GPa, we obtained the values of V0 = 950(2) Å3, B0 = 195(15) GPa, and B0′ = 4 (fixed), which is comparable with the values presented in this work and others already reported (see Table 1). Thus, our result reinforces the idea that the fact that the nanoparticles have an average size of ~55 nm does not interfere in the structural properties of Sc2O3 at HP when compared to bulk samples.
Although it was not possible to perform the Rietveld refinement on our experimental data, the good agreement between our theoretical and experimental results allows us to use the theoretical simulations to access other structural information for Sc2O3 at HP, such as the free Wyckoff position of Sc2(x) and O1, the average <Sc-O> bond length, the octahedral volume, and the distortion index of the Sc2 octahedra. All these theoretical results are presented in Figure 5 and were compared with the experimental results of single-crystal Sc2O3 reported by Ovsyannikov et al. [2].
Figure 5a,b shows the pressure dependence of the free Wyckoff position of the Sc2 (x coordinate) and O1 (x, y, z coordinates) atoms in the 24d and 48e Wyckoff sites, respectively. As pressure increases, the positions of the atoms present a smooth variation in all directions, reflecting the compressibility of the structure. The theoretical results (solid line) are in good agreement with the experimental data (symbols), indicating that the calculated pressure-induced changes are accurate for describing the structural evolution of Sc2O3, thus confirming the goodness of our theoretical calculations.
Figure 5c,d presents the average <Sc-O> bond lengths for both Sc1 and Sc2 sites and the volume of the octahedra formed by the Sc1 and Sc2 atoms as a function of pressure, respectively. As can be observed, the Sc-O bonds decrease slightly in length and the volume of both octahedra decreases as pressure increases, with the Sc2 octahedron being more compressed than the Sc1 octahedron in the same pressure range. This difference in compressibility highlights the asymmetry in the local coordination environments of the two types of scandium atoms. The theoretical data matches closely with the experimental values from Ovsyannikov et al. [2], further validating the robustness of the theoretical model in predicting bond-length compression at HP. Consequently, as shown in the inset in Figure 5d, we can predict that the distortion index of the Sc2 octahedra increases slightly with pressure, indicating that the Sc2 octahedra become more distorted as the structure is compressed.
Figure 6 illustrates the Raman spectra of nano-Sc2O3 measured at room temperature at selected pressures, up to 26.4 GPa. As pressure increases, all peaks related to the bixbyite Sc2O3 structure shift toward higher wavenumbers, which indicates the gradual compression of the crystal lattice. This shift in the Raman peaks is a direct consequence of the reduction in bond lengths as the material undergoes compression, leading to an increase in the force constants associated with the vibrational modes. Furthermore, the broadening of the peaks with increasing pressure reflects the growing structural disorder or the onset of slight distortions in the local coordination environments of the scandium and oxygen atoms. Up to 26.4 GPa, we did not observe any new peaks, suggesting that this pressure is not sufficient to promote the phase transitions observed in the bulk sample [1,2]. These results support the high structural stability of the nano-Sc2O3 in comparison to its bulk counterpart, in good agreement with the study of 31 nm nano-Sc2O3 [9].
Figure 7 shows the pressure dependence of the frequencies of the experimental Raman-active modes of nano-Sc2O3. For the sake of completeness, Figure 8 presents the pressure evolution of the IR-active modes obtained by our theoretical calculations. Table 2 summarizes the zero-pressure wavenumbers and its pressure coefficients for the experimental and theoretical Raman-active modes of nano-Sc2O3, and Table 3 summarizes the zero-pressure wavenumbers and its pressure coefficients for the theoretical IR-active modes. All Raman and IR modes of different symmetries have been added a superscript number in order of increasing wavenumber in Table 2 and Table 3. Our experimental results on nano-Sc2O3 are compared to the experimental [2] and theoretical Raman-active modes found in bulk Sc2O3. As observed in Figure 7, there is a good agreement between our experimental results on nano-Sc2O3 and the experimental [2] and theoretical results for bulk Sc2O3, once again confirming the goodness of our simulations. In particular, we observed the evolution of seven Raman-active modes under pressure in nano-Sc2O3 and six of themshow a similar pressure dependence of the wavenumbers than in the bulk. However, the Raman-active mode with the lowest wavenumber, the Tg1 mode initially at ~182 cm–1, shows a slightly different behavior. As can be observed in Figure 9a, the Tg1 mode in nano-Sc2O3 exhibits a positive pressure coefficient in the whole pressure range measured; however, according to our theoretical calculations, this mode first presents a tendency of increasing wavenumber with pressure and a tendency to soften above ~10 GPa. Above this pressure, the wavenumber of this vibrational mode tends to decrease at a rate of −0.32(1) cm–1/GPa, likely indicating the onset of the instability of the bixbyite structure of Sc2O3. The change in pressure coefficient of this mode below and above 10 GPa is in excellent agreement with the experimental results reported by Ovsynnikov et al. [2] for single-crystalline Sc2O3 (red symbols in Figure 9a). A similar behavior is observed in the Tu2 IR-active mode (Figure 9b). We consider that the lack of the redshift of the Tg1 mode above 10 GPa in nano-Sc2O3 likely indicates greater structural stability of nanocrystalline samples with respect to bulk Sc2O3. Regarding the possible instability of C-type Sc2O3, it must be mentioned that a previous study reported that a laser annealed bulk cubic Sc2O3 sample at ~10 GPa to about 1700 K led to a transition to the B-Res phase [4]. Therefore, we consider that the softening observed of this mode above 10 GPa is likely related to the dynamical instability of this vibrational mode that must be in turn related to the C-B phase transition. This seems to be confirmed by theoretical calculations that consider that the C-B phase transition is around 15 GPa [2]. Still comparing our results with those reported for single crystals, Ovsyannikov et al. [2] reported a peak at 709 cm–1 that becomes undetectable at ~4 GPa and that, according to our theoretical results, does not seem to belong to any first-order Raman-active mode of Sc2O3.

4. Conclusions

This work presents a thorough investigation into the structural and vibrational properties of nano-Sc2O3 (~55 nm) under high-pressure conditions, integrating experimental techniques such as X-ray diffraction and Raman spectroscopy with theoretical calculations. The results reveal that nano-Sc2O3 exhibits remarkable structural stability, maintaining its cubic bixbyite structure up to 26.4 GPa, without any phase transition, unlike bulk Sc2O3, which transitions to a monoclinic phase at approximately 25–28 GPa as reported in an earlier study [2].
The X-ray diffraction results confirm the retention of the cubic structure under increasing pressure, with no evidence of structural phase transitions within the examined pressure range. These findings are further supported by the Raman spectroscopy data, which show a consistent blue-shifting of the main vibrational modes, indicative of lattice compression. The absence of new Raman-active modes suggests that the material’s fundamental symmetry is preserved under pressure, contrasting with the behavior of bulk Sc2O3 where phase transitions have been observed.
Theoretical calculations accurately predict the observed vibrational behavior, with excellent agreement between the experimental and theoretical pressure-dependent Raman shifts. This alignment validates the reliability of the theoretical model in describing the pressure-induced changes in the material’s vibrational dynamics.
Comparison with previously published works, including studies by Ovsyannikov et al. [2], Zhang et al. [5], and Yusa et al. [4], highlights the distinct behavior of nano-Sc2O3 under pressure. While bulk Sc2O3 transitions to a monoclinic or Gd2S3-type phase at high pressures, the nano-scale material exhibits enhanced structural stability, potentially due to size effects and surface energy contributions. These results demonstrate that nanoscale materials can behave quite differently from their bulk counterparts under extreme conditions, offering valuable insights for future applications in high-pressure environments.
Finally, this study not only confirms the high structural stability of nano-Sc2O3 under pressure but also provides a robust experimental and theoretical framework for understanding the behavior of nanomaterials under extreme conditions. These findings could have significant implications for the design and development of high-pressure-resistant materials, with potential applications in various technological fields. Future studies could explore higher pressure regimes and investigate the limits of the stability of nano-Sc2O3, as well as its behavior in other extreme temperature environments.

Author Contributions

Conceptualization, F.J.M.; methodology, A.L.d.J.P., J.A.S., S.R., A.M., C.P. and F.J.M.; formal analysis, J.A.S., P.T., A.G.J., I.M.H., A.S.d.S.-S., P.R.-H., A.M. and F.J.M.; investigation, A.L.d.J.P., J.A.S., R.V., P.R.-H., A.M. and C.P.; resources, A.L.d.J.P., C.P. and F.J.M.; writing—original draft preparation, A.L.d.J.P.; writing—review and editing, A.L.d.J.P., J.A.S. and F.J.M.; supervision, F.J.M.; funding acquisition, A.L.d.J.P., J.A.S. and F.J.M. All authors have read and agreed to the published version of the manuscript.

Funding

This publication is part of the project MALTA Consolider Team Network (RED2022-134388-T) and was financed by the Spanish Ministry of Science and Research MCIN/AEI/10.13039/501100011033 through I+D+i projects PID2021-125927NB-C21, PGC2021-125518NB-I00 (cofinanced by EU FEDER funds), and PID2022-138076NB-C42/C44; by Generalitat Valenciana, through projects CIPROM/2021/075 (GREENMAT) and CIAICO/2021/241, São Paulo Research Foundation (FAPESP), grants no 2022/02994-2; and by the Brazilian National Council for Scientific and Technological Development (CNPq), grant no 310778/2021-2, 405522/2022-3 and 407805/2023-0. This study forms part of the Advanced Materials program and was supported by MCIN with funding from European Union NextGenerationEU (PRTR-C17.I1) and by the Generalitat Valenciana through projects MFA/2022/007 and MFA/2022/025. We also thank DIAMOND and ALBA synchrotron light sources for funded experiments EE6073 and 2012100398 at the I15 and MSPD-BL04 beamlines, respectively. We also thank ALBA synchrotron light source for funding the experiment 2017022088 at the MSPD-BL04 beamline.

Data Availability Statement

The original contributions presented in this study are included in the article. Further inquiries can be directed to the corresponding authors.

Acknowledgments

We would like to thank the National Institute for Space Research (INPE-Brazil) and Alejandra Soriano, from the “Instituto de Ciencia Molecular” of the University of Valencia (ICMol), for the ability to carry out the ambient pressure FESEM and XRD measurements, respectively. A.M. and P.R.-H. acknowledge computing time provided by the Red Española de Supercomputación (RES) and MALTA-Cluster.

Conflicts of Interest

The authors declare no conflicts of interest.

References

  1. Liu, D.; Lei, W.; Li, Y.; Ma, Y.; Hao, J.; Chen, X.; Jin, Y.; Liu, D.; Yu, S.; Cui, Q.; et al. High-pressure structural transitions of Sc2O3 by X-ray diffraction, raman spectra, and Ab initio calculations. Inorg. Chem. 2009, 48, 8251–8256. [Google Scholar] [CrossRef] [PubMed]
  2. Ovsyannikov, S.V.; Bykova, E.; Bykov, M.; Wenz, M.D.; Pakhomova, A.S.; Glazyrin, K.; Liermann, H.-P.; Dubrovinsky, L. Structural and vibrational properties of single crystals of Scandia, Sc2O3 under high pressure. J. Appl. Phys. 2015, 118, 165901. [Google Scholar] [CrossRef]
  3. Barzilai, S.; Halevy, I.; Yeheskel, O. Bulk modulus of Sc2O3: Ab initio calculations and experimental results. J. Appl. Phys. 2011, 110, 043532. [Google Scholar] [CrossRef]
  4. Yusa, H.; Tsuchiya, T.; Sata, N.; Ohishi, Y. High-pressure phase transition to the Gd2S3 Structure in Sc2O3: A new trend in dense structures in sesquioxides. Inorg. Chem. 2009, 48, 7537–7543. [Google Scholar] [CrossRef]
  5. Zhang, Q.; Yang, J.; Wu, X.; Qin, S. Phase stability and elasticity of Sc2O3 at high pressure. Eur. Phys. J. B 2011, 84, 11–16. [Google Scholar] [CrossRef]
  6. Wu, B.; Zinkevich, M.; Aldinger, F.; Wen, D.; Chen, L. Ab initio study on structure and phase transition of A- and B-type rare-earth sesquioxides Ln2O3 (Ln=La-Lu, Y, and Sc) based on density function theory. J. Solid State Chem. 2007, 180, 3280–3287. [Google Scholar] [CrossRef]
  7. Manjón, F.J.; Tresserras, J.A.S.; Ibáñez, J.; Pereira, A.L.J. Pressure-induced phase transitions in sesquioxides. Crystals 2019, 9, 630. [Google Scholar] [CrossRef]
  8. Bai, F.; Bian, K.; Huang, X.; Wang, Z.; Fan, H. Pressure Induced Nanoparticle Phase Behavior, Property, and Applications. Chem. Rev. 2019, 119, 7673–7717. [Google Scholar] [CrossRef]
  9. Yadav, D.; Bura, N.; Bhoriya, A.; Singh, J.; Srihari, V.; Poswal, H.K.; Sharma, N.D. Crystallographic structural variations in nano-crystalline Sc2O3 under pressure. Phys. Scr. 2023, 98, 045707. [Google Scholar] [CrossRef]
  10. Ray, S.; León-Luis, S.F.; Manjón, F.J.; Mollar, M.A.; Gomis, Ó.; Rodríguez-Mendoza, U.R.; Agouram, S.; Muñoz, A.; Lavín, V. Broadband, site selective and time resolved photoluminescence spectroscopic studies of finely size-modulated Y2O3:Eu3+ phosphors synthesized by a complex based precursor solution method. Curr. Appl. Phys. 2014, 14, 72–81. [Google Scholar] [CrossRef]
  11. de Jesus Pereira, A.L.; Sans, J.Á.; Gomis, Ó.; Santamaría-Pérez, D.; Ray, S.; Godoy, A.; da Silva-Sobrinho, A.S.; Rodríguez-Hernández, P.; Muñoz, A.; Popescu, C.; et al. Size-Dependent High-Pressure Behavior of Pure and Eu3+-Doped Y2O3 Nanoparticles: Insights from Experimental and Theoretical Investigations. Nanomaterials 2024, 14, 721. [Google Scholar] [CrossRef] [PubMed]
  12. Patterson, A.L. The Scherrer Formula for X-Ray Particle Size Determination. Phys. Rev. 1939, 56, 978–982. [Google Scholar] [CrossRef]
  13. Fauth, F.; Peral, I.; Popescu, C.; Knapp, M. The new Material Science Powder Diffraction beamline at ALBA Synchrotron. Powder Diffr. 2013, 28, S360–S370. [Google Scholar] [CrossRef]
  14. Merrill, L.; Bassett, W.A. Miniature diamond anvil pressure cell for single crystal X-ray diffraction studies. Rev. Sci. Instrum. 1974, 45, 290–294. [Google Scholar] [CrossRef]
  15. Dewaele, A.; Loubeyre, P.; Mezouar, M. Equations of state of six metals above 94 GPa. Phys. Rev. B Condens. Matter Mater. Phys. 2004, 70, 094112. [Google Scholar] [CrossRef]
  16. Prescher, C.; Prakapenka, V.B. DIOPTAS: A program for reduction of two-dimensional X-ray diffraction data and data exploration. High Press. Res. 2015, 35, 223–230. [Google Scholar] [CrossRef]
  17. Toby, B.H.; Von Dreele, R.B. GSAS-II: The genesis of a modern open-source all purpose crystallography software package. J. Appl. Crystallogr. 2013, 46, 544–549. [Google Scholar] [CrossRef]
  18. Mao, H.K.; Xu, J.; Bell, P.M. Calibration of the ruby pressure gauge to 800 kbar under quasi-hydrostatic conditions. J. Geophys. Res. 1986, 91, 4673–4676. [Google Scholar] [CrossRef]
  19. Errandonea, D.; Muñoz, A.; Gonzalez-Platas, J. Comment on High-pressure x-ray diffraction study of YBO3/Eu3+, GdBO3, and EuBO3: Pressure-induced amorphization in GdBO3. J. Appl. Phys. 2014, 115, 113–116. [Google Scholar] [CrossRef]
  20. Hohenberg, P.; Kohn, W. Inhomogeneous Electron Gas. Phys. Rev. 1964, 136, B864–B871. [Google Scholar] [CrossRef]
  21. Kresse, G.; Furthmüller, J. Efficiency of ab-initio total energy calculations for metals and semiconductors using a plane-wave basis set. Comput. Mater. Sci. 1996, 6, 15–50. [Google Scholar] [CrossRef]
  22. Kresse, G.; Furthmüller, J. Efficient iterative schemes for ab initio total-energy calculations using a plane-wave basis set. Phys. Rev. B 1996, 54, 11169–11186. [Google Scholar] [CrossRef] [PubMed]
  23. Blöchl, P.E. Projector augmented-wave method. Phys. Rev. B 1994, 50, 17953–17979. [Google Scholar] [CrossRef] [PubMed]
  24. Kresse, G.; Joubert, D. From ultrasoft pseudopotentials to the projector augmented-wave method. Phys. Rev. B Condens. Matter Mater. Phys. 1999, 59, 1758–1775. [Google Scholar] [CrossRef]
  25. Perdew, J.P.; Ruzsinszky, A.; Csonka, G.I.; Vydrov, O.A.; Scuseria, G.E.; Constantin, L.A.; Zhou, X.; Burke, K. Restoring the Density-Gradient Expansion for Exchange in Solids and Surfaces. Phys. Rev. Lett. 2008, 100, 136406. [Google Scholar] [CrossRef]
  26. Monkhorst, H.J.; Pack, J.D. Special points for Brillouin-zone integrations. Phys. Rev. B 1976, 13, 5188–5192. [Google Scholar] [CrossRef]
  27. Parlinski, K.; Li, Z.Q.; Kawazoe, Y. First-Principles Determination of the Soft Mode in Cubic ZrO2. Phys. Rev. Lett. 1997, 78, 4063–4066. [Google Scholar] [CrossRef]
  28. Paswan, S.K.; Kumari, S.; Kar, M.; Singh, A.; Pathak, H.; Borah, J.P.; Kumar, L. Optimization of structure-property relationships in nickel ferrite nanoparticles annealed at different temperature. J. Phys. Chem. Solids 2021, 151, 109928. [Google Scholar] [CrossRef]
  29. Permin, D.A.; Gavrishchuk, E.M.; Klyusik, O.N.; Egorov, S.V.; Sorokin, A.A. Self-propagating high-temperature synthesis of Sc2O3 nanopowders using different precursors. Adv. Powder Technol. 2016, 27, 2457–2461. [Google Scholar] [CrossRef]
  30. Todorov, N.D.; Abrashev, M.V.; Marinova, V.; Kadiyski, M.; Dimowa, L.; Faulques, E. Raman spectroscopy and lattice dynamical calculations of Sc2O3 single crystals. Phys. Rev. B Condens. Matter Mater. Phys. 2013, 87, 2–6. [Google Scholar] [CrossRef]
  31. Abrashev, M.V.; Todorov, N.D.; Geshev, J. Raman spectra of R2O3 (R—Rare earth) sesquioxides with C-type bixbyite crystal structure: A comparative study. J. Appl. Phys. 2014, 116, 103508. [Google Scholar] [CrossRef]
  32. Schaack, G.; Koningstein, J.A. Phonon and Electronic Raman Spectra of Cubic Rare-Earth Oxides and Isomorphous Yttrium Oxide. J. Opt. Soc. Am. 1970, 60, 1110–1115. [Google Scholar] [CrossRef]
  33. Repelin, Y.; Proust, C.; Husson, E.; Beny, J.M. Vibrational Spectroscopy of the C-Form of Yttrium Sesquioxide. J. Solid State Chem. 1995, 118, 163–169. [Google Scholar] [CrossRef]
  34. Ubaldini, A.; Carnasciali, M.M. Raman characterisation of powder of cubic RE2O3 (RE=Nd, Gd, Dy, Tm, and Lu), Sc2O3 and Y2O3. J. Alloys Compd. 2008, 454, 374–378. [Google Scholar] [CrossRef]
  35. Ibáñez, J.; Sans, J.Á.; Cuenca-Gotor, V.; Oliva, R.; Gomis, Ó.; Rodríguez-Hernández, P.; Munõz, A.; Rodríguez-Mendoza, U.; Velázquez, M.; Veber, P.; et al. Structural and Lattice-Dynamical Properties of Tb2O3 under Compression: A Comparative Study with Rare Earth and Related Sesquioxides. Inorg. Chem. 2020, 59, 9648–9666. [Google Scholar] [CrossRef]
  36. Sans, J.A.; Manjón, F.J.; Popescu, C.; Cuenca-Gotor, V.P.; Gomis, O.; Muñoz, A.; Rodríguez-Hernández, P.; Contreras-García, J.; Pellicer-Porres, J.; Pereira, A.L.J.; et al. Ordered helium trapping and bonding in compressed arsenolite: Synthesis of As4O6·2He. Phys. Rev. B 2016, 93, 054102. [Google Scholar] [CrossRef]
  37. Pereira, A.L.J.; Gracia, L.; Santamaría-Pérez, D.; Vilaplana, R.; Manjón, F.J.; Errandonea, D.; Nalin, M.; Beltrán, A. Structural and vibrational study of cubic Sb2O3 under high pressure. Phys. Rev. B Condens. Matter Mater. Phys. 2012, 85, 174108. [Google Scholar] [CrossRef]
Figure 1. Crystal structure and Sc-O bond distance of the Sc2O3 bixbyite-type (C-type) structure. The Sc1, Sc2, and O atoms are represented by light blue, dark blue, and red spheres, respectively. The interatomic distances were obtained through Rietveld refinement performed on our ambient pressure XRD measurement.
Minerals 15 00021 g001
Figure 2. (a) FESEM image of the Sc2O3 nanoparticles and (b) particle size distribution fitted with a log normal distribution function.
Minerals 15 00021 g002
Figure 3. Room-temperature (a) XRD and (b) RS of nano-Sc2O3 at ambient pressure.
Minerals 15 00021 g003aMinerals 15 00021 g003b
Figure 4. (a) Room-temperature XRD patterns of nano-Sc2O3 at selected pressures on upstroke. (b) Pressure dependence of the experimental (black square symbols) and theoretical (black line) volume of the bixbyite Sc2O3 on the upstroke. The red line in (b) represents the third-order Birch–Murnaghan (B-M) fit performed on the experimental data up to 10 GPa, and the gray symbols represent the experimental data reported by Ovsyannikov et al. [2].
Minerals 15 00021 g004
Figure 5. Theoretical pressure dependence of the free Wyckoff position of Sc2(x) (a) and O1 atoms (b), the average <Sc-O> bond length (c), the volume of the octahedral Sc1 and Sc2 ions (d), and the distortion index of these octahedra (inset in (d)). The theoretical data were compared with the experimental data obtained at ambient pressure (black and red squares) and reported by Ovsyannikov et al. [2].
Minerals 15 00021 g005aMinerals 15 00021 g005b
Figure 6. Room-temperature Raman spectra of nano-Sc2O3 at selected pressures on upstroke.
Minerals 15 00021 g006
Figure 7. Pressure dependence of the wavenumbers of the Raman modes of nano-Sc2O3. Low-wavenumber (a) and high-wavenumber modes (b). The black squares represent the experimental data and the lines the data obtained by theoretical calculations, both from this work. The colored circles represent the experimental data reported by Ovsyannikov et al. [2] for single-crystalline Sc2O3.
Minerals 15 00021 g007
Figure 8. Pressure dependence of the low-wavenumbers (a) and high-wavenumber (b) IR-active modes in bulk Sc2O3 obtained by theoretical calculations.
Minerals 15 00021 g008
Figure 9. Theoretical (lines) and experimental (symbols) pressure evolution of the wavenumber of the (a) Tg1 Raman and (b) Tu1 and Tu2 IR vibrational modes in Sc2O3. The red symbols represent the experimental data reported by Ovsyannikov et al. [2] for single-crystalline Sc2O3.
Minerals 15 00021 g009
Table 1. EOS parameters at ambient pressure of experimental and theoretical bixbyite Sc2O3.
V03)B0B0′
Experimental (this work) 953.4(5)194(4)4 (fixed)
Theoretical (this work) 943.4(1)180.2(6)4 (fixed)
Barzilai et al. (bulk) [3]EDS953.1198(12)4.8
ADS954.6191(11)4.8
DFT-GGA954.1174.5(1)4.53
Liu et al. (bulk) [1] 971.8(1)154(5)7 (Fixed)
Ovsyannikov et al. (single crystal) [2] 953.9(3)198.2(3)4 (Fixed)
Yusa et al. (bulk) [4] 955.7(2)189(7)4.0(6)
Yadav et al. [9] (nanoparticles—31 nm) 947(3)217(35)12(4)
Table 2. Experimental and theoretical (DFT-PBEsol) zero-pressure wavenumbers (in cm–1) and linear pressure coefficients (in cm–1/GPa) for the Raman-active modes of bixbyite nano-Sc2O3 and bulk Sc2O3, respectively. The pressure dependence of all Raman-active modes has been fitted to a linear polynomial in the low-pressure range (0–12 GPa). Experimental zero-pressure wavenumbers and pressure coefficients for bulk Sc2O3 [2] are also shown for comparison.
SymmetryExperimentalTheoreticalOvsyannikov et al. [2]
ω0
(cm–1)
dω/dP
(cm–1/GPa)
ω0
(cm–1)
dω/dP
(cm–1/GPa)
d2ω/dP2
(cm–1/GPa2)
ω0
(cm–1)
dω/dP
(cm–1/GPa)
d2ω/dP2
(cm–1/GPa2)
Tg1189.40.07(1)182.30.04−0.008189.70.348−0.019
Tg2 195.00.3
Ag1 212.11.1 2211.510.025
Tg3 247.11.2 2531.85−0.019
Eg1 268.21.2 2741.610.008
Tg4 313.81.7
Tg5319.12.3319.61.8 3202.82−0.037
Eg2 353.22.5
Tg6 355.02.3
Tg7358.82.9357.02.5 3593.05−0.015
Tg8 375.63.6 3804.30−0.060
Ag2390.6-389.02.2 3914.22−0.034
Tg9417.83.1416.53.2 4203.96−0.025
Eg3429.44.0423.93.5 4314.37−0.038
Tg10 439.93.0 4455.72−0.084
Ag3 474.43.7
Tg11494.24.2481.13.6 4964.59−0.042
Tg12521.14.4505.03.9 5244.71−0.039
Tg13 577.53.2
Ag4 612.83.7 6254.77−0.060
Eg4 617.13.7
Tg14 658.53.9 6694.82−0.034
709
Table 3. Theoretical (DFT-PBEsol) zero-pressure wavenumbers (in cm−1) and pressure coefficients (in cm−1/GPa) for the IR-active modes of bixbyite bulk Sc2O3. The pressure dependence of all IR-active modes has been fitted to a linear and polynomial equations from 0 to 32 GPa.
SymmetryTheoretical
ω0
(cm–1)
dω/dP
(cm–1/GPa)
d2ω/dP2
(cm–1/GPa2)
Tu1167.26−0.67(2)-
Tu2207.100.75(4)−0.0225(1)
Tu3228.390.77(4)-
Tu4245.201.05(4)-
Tu5264.761.35(5)-
Tu6305.102.42(6)-
Tu7324.274.65(4)−0.051(2)
Tu8350.104.23(14)−0.049(4)
Tu9365.112.97(2)-
Tu10375.963.14(7)-
Tu11399.225.16(8)−0.056(3)
Tu12436.022.49(4)-
Tu13455.512.425(7)-
Tu14495.884.29(6)-
Tu15528.974.09(6)-
Tu16611.723.89(5)-
Disclaimer/Publisher’s Note: The statements, opinions and data contained in all publications are solely those of the individual author(s) and contributor(s) and not of MDPI and/or the editor(s). MDPI and/or the editor(s) disclaim responsibility for any injury to people or property resulting from any ideas, methods, instructions or products referred to in the content.

