Article

Till Geochemistry as a Vector to Metasomatic Iron and Alkali-Calcic Systems and Associated Deposits in the Great Bear Magmatic Zone, Northwest Territories, Canada

by
Philippe X. Normandeau
1,
Isabelle McMartin
2,* and
Louise Corriveau
3
1
Northwest Territories Geological Survey, 4601-B, 52 Ave, Yellowknife, NT X1A 2L9, Canada
2
Natural Resources Canada, Geological Survey of Canada, 601 Booth Street, Ottawa, ON K1A 0E8, Canada
3
Natural Resources Canada, Geological Survey of Canada, 490 rue de la Couronne, Québec, QC G1K 9A9, Canada
*
Author to whom correspondence should be addressed.
Minerals 2024, 14(6), 547; https://doi.org/10.3390/min14060547
Submission received: 26 April 2024 / Revised: 16 May 2024 / Accepted: 19 May 2024 / Published: 26 May 2024

Abstract

:
Recent advances in the characterization of metasomatic iron and alkali-calcic (MIAC) systems with associated iron-oxide apatite (IOA) prospects and iron-oxide–copper–gold (IOCG) and metasomatic cobalt deposits of the Great Bear magmatic zone were used to determine if the geochemistry of glacial sediments can unveil pathfinder elements indicative of mineralization and associated alteration. Analysis of variance within bedrock lithogeochemical (n = 707 samples) and till geochemical datasets (n = 92 samples) are compared. Results show that Fe, Co, Ni, Cu, As, Mo, Bi, La, Th, U, and W were identified as potential vectoring elements in different fractions of till due to their anomalous concentrations down-ice of various mineralized outcrops within the study area. For instance, Fe, Co, Cu, and Mo were established as the most useful vectoring elements in the locally derived till (<2 km down-ice) near the Sue Dianne IOCG deposit, and Fe, Co, Ni, Cu, Mo, W, Bi, and U near the Fab IOCG prospect. At the Sue Dianne deposit, the ratios of near-total (4-acid digestion) versus partial (modified aqua regia digestion) concentrations in the silt + clay-sized till fraction (<0.063 mm) for both La and Th reflect the mineralization alteration signature and define a more consistent dispersal train from mineralization compared to element concentrations mapped alone. Additional testing in an area of continuous till cover near an isolated point source is recommended to further develop the elemental ratio method for exploration of MIAC systems.

Graphical Abstract

1. Introduction

Till geochemistry is widely used for mineral exploration in glaciated terrain where till is widespread, has a relatively simple transport history, and a distinct composition that reflects its source material (e.g., [1,2,3,4,5,6,7,8]). Anomalous concentrations of ore and pathfinder elements in till can therefore be used to assess and trace back sources of potential mineralized bedrock. Suites of pathfinder elements in till have been defined through case studies for a broad range of mineral deposits, including magmatic Ni-Cu-PGE, Cu porphyry, volcanogenic massive sulfide, U, Au, Mississippi Valley-type Pb-Zn, and diamonds (e.g., [9,10,11,12,13,14,15,16,17,18,19,20,21,22]). Here, we tested whether till geochemistry can be used to identify iron-oxide apatite (IOA) and iron oxide–copper–gold (IOCG) deposits with complex alteration signatures within the Great Bear magmatic zone (GBMZ) in the Northwest Territories, Canada. The potential for geochemical exploration applied to IOCG deposits has been demonstrated in non-glaciated hyperarid settings using lag talus samples [23,24,25,26]. Statistical analysis of large till and bedrock datasets from Sweden demonstrated the application of till geochemistry geared towards rare earth elements (REE) bearing deposits, including IOA and hydrothermal iron-REE deposits at a regional scale [27]. However, very few case studies using till composition have been conducted near IOCG deposits, and these were focused on indicator minerals [28,29]. An orientation study was conducted at the NICO Co-Au-Bi-Cu deposit, a metasomatic iron-rich cobalt (MI-Co) type deposit with IOCG components in the GBMZ [30,31,32]. The study showed the potential of As, Bi, Co, Au, Cu, Sb, W, and Cd as pathfinder elements in till [28,33]. The present work built on this study and aimed to evaluate a full suite of elements that could be used as exploration vectors in the GBMZ. To this end, till sampling surveys were completed at the Sue Dianne Cu-Ag-Au magnetite to hematite-group IOCG deposit and the Fab system U-Th-Cu magnetite-group IOCG showings, as well as in the vicinity of several polymetallic showings within the larger family of metasomatic iron and alkali-calcic (MIAC) systems [31,32,34,35]. The mineralization and their extensive and pervasive alteration systems [31,32,36,37] are characterized by specific lithogeochemical signatures [35,38,39,40]. This study compared potential pathfinder elements determined from a comprehensive lithogeochemistry database [41] with till geochemistry datasets in the GBMZ. The spatial distribution as well as statistical significance of element concentrations in till were evaluated to assess their mineral exploration applicability for IOA, IOCG and affiliated deposits within MIAC systems.

2. Study Area

2.1. Geochemistry of MIAC Systems and Affiliated Deposits

A wide range of elements of economic potential occur within IOCG, IOA, and affiliated deposits found in MIAC systems. These include Cu, Au, Ag, Al, Bi, Co, F, Fe, In, Mo, Ni, P, platinum-group elements (PGE), Pb, Re, REE, Th, U, V, W, and/or Zn [31,35]. The metasomatic alteration zones associated with these systems are characterized by the enrichment in alkali, alkaline-earth metals, and Fe [34,36,37] and may extend hundreds of square kilometers from mineralization [42]. The metasomatic alteration footprints form at district scale and cluster a wide variety of deposit types [31,32,34,43]. The extent and intensity of the metasomatism explains the rarity of unaltered protoliths for many of the MIAC metasomatites in the GBMZ and worldwide [32,43]. Based on extensive alteration mapping of the GBMZ and other Canadian systems and comparisons with global mining districts, Corriveau et al. [31,37] provide a framework for the alteration zoning [36,44,45]. Six sequential stages of metasomatism where the coupling and decoupling of elements leads to metal associations and potential deposit types are observed. This model is summarized here as: (1) early high- to low-temperature (HT to LT) albite dominant Na and Na-Ca alteration; (2) high-temperature (HT) Ca-Fe alteration (amphibole- to magnetite-dominant with and without apatite) evolving to a transitional HT Ca-K-Fe alteration facies (amphibole- to magnetite- to biotite-dominant); (3) high-temperature (HT) K-Fe alteration (K-feldspar to biotite-rich, with magnetite); (4) barren K-felsite in silicic hosts or K-skarn type alteration in carbonate-rich hosts; (5) low-temperature (LT) K-Fe to Ca-Mg alteration (e.g., sericite–hematite to epidote–chlorite–carbonate), and (6) epithermal alteration and extensive quartz and carbonate vein networks. The high intensity of alteration reached at each facies results in complete replacement of the protolith mineralogy with or without preservation of their original textures. Hence, metasomatites at each facies acquire distinct and diagnostic composition that serve as vectors towards the distinct deposit types of MIAC systems (associations between alteration facies and potential deposit types are detailed in Corriveau et al. [35]). Overprinting of prograde and retrograde alteration leads to the juxtaposition of alteration types at outcrop-, deposit- and system-scale, a feature prevalent within the ore zones [31].
Systematic behaviors of elements are related to each MIAC alteration facies in the GBMZ and other MIAC districts worldwide [31,35,38]. Strong positive correlations between K and Al as well as Rb and Ba are visible in most types of alteration as well as strong positive correlations between Fe and Co, Ni, and Cu. Multivariate analysis of GBMZ samples and global comparisons of deposit resources show many specific elemental enrichments in each alteration facies. The main elemental enrichments in each alteration facies are the following: (1) Ti, Ga, Sr, Zr, Nb, and Ta in Na alteration; (2) Mg, P, V, Mn, Fe, Ni, REE, and W in HT Ca-Fe alteration; (3) Fe, Co, Cu, Mo, Ag, PGEs, Au, and U in the HT K-Fe alteration facies; (4) K, Rb, Ba, and Th in K-felsite; and (5) Cu, Zn, Mo, Ag, light REEs, Re, Au, Pb, and U in LT K-Fe and Ca-Mg alteration facies [35], listed in Table 2 of Corriveau et al. [32]. While being enriched within the sodic alteration, Sr is strongly decoupled from Ca due to incompatibility with amphiboles. Enrichment in Co, Ni, Cu, Ag, Y + REEs, Au, Bi, Th, and U is observed in the HT Ca-K-Fe and HT K-Fe alteration of prospects and deposits of the southern GBMZ. As well, an increase in the less mobile high field strength elements (HFSE) Nb, Ta, and Th and a decrease in REEs are associated with the earlier sodic alteration (e.g., Esther zone and MHF prospect [46]).

2.2. Bedrock Geology of the Great Bear Magmatic Zone

The GBMZ (Figure 1) is a 1.87 Ga volcanic and plutonic, felsic to intermediate to mafic Andean type, calc-alkaline belt intruded by a 1.87–1.85 Ga batholith [47,48] that follows the 1.88 Ga Calderian Orogeny responsible for the Wopmay Orogen [48,49,50]. It is exposed between the western margin of the Slave Craton to the east and the Phanerozoic cover to the west [51,52]. Remnants of an older arc in suture with the Slave Craton also outcrop at the western margin of the GBMZ (i.e., Hottah Terrane) [47,51,53]. To the east, the Wopmay fault separates the GBMZ from metamorphic rocks of the Wopmay Orogen, including reworked components of the Archean Slave Craton [47,50]. Many MIAC systems of the GBMZ have been the subject of recent petrological, mineral chemistry, geochemical, geochronological, isotopic, and economic geology studies which outline the potential for undiscovered deposits in the GBMZ [30,31,32,35,54,55,56,57,58,59].

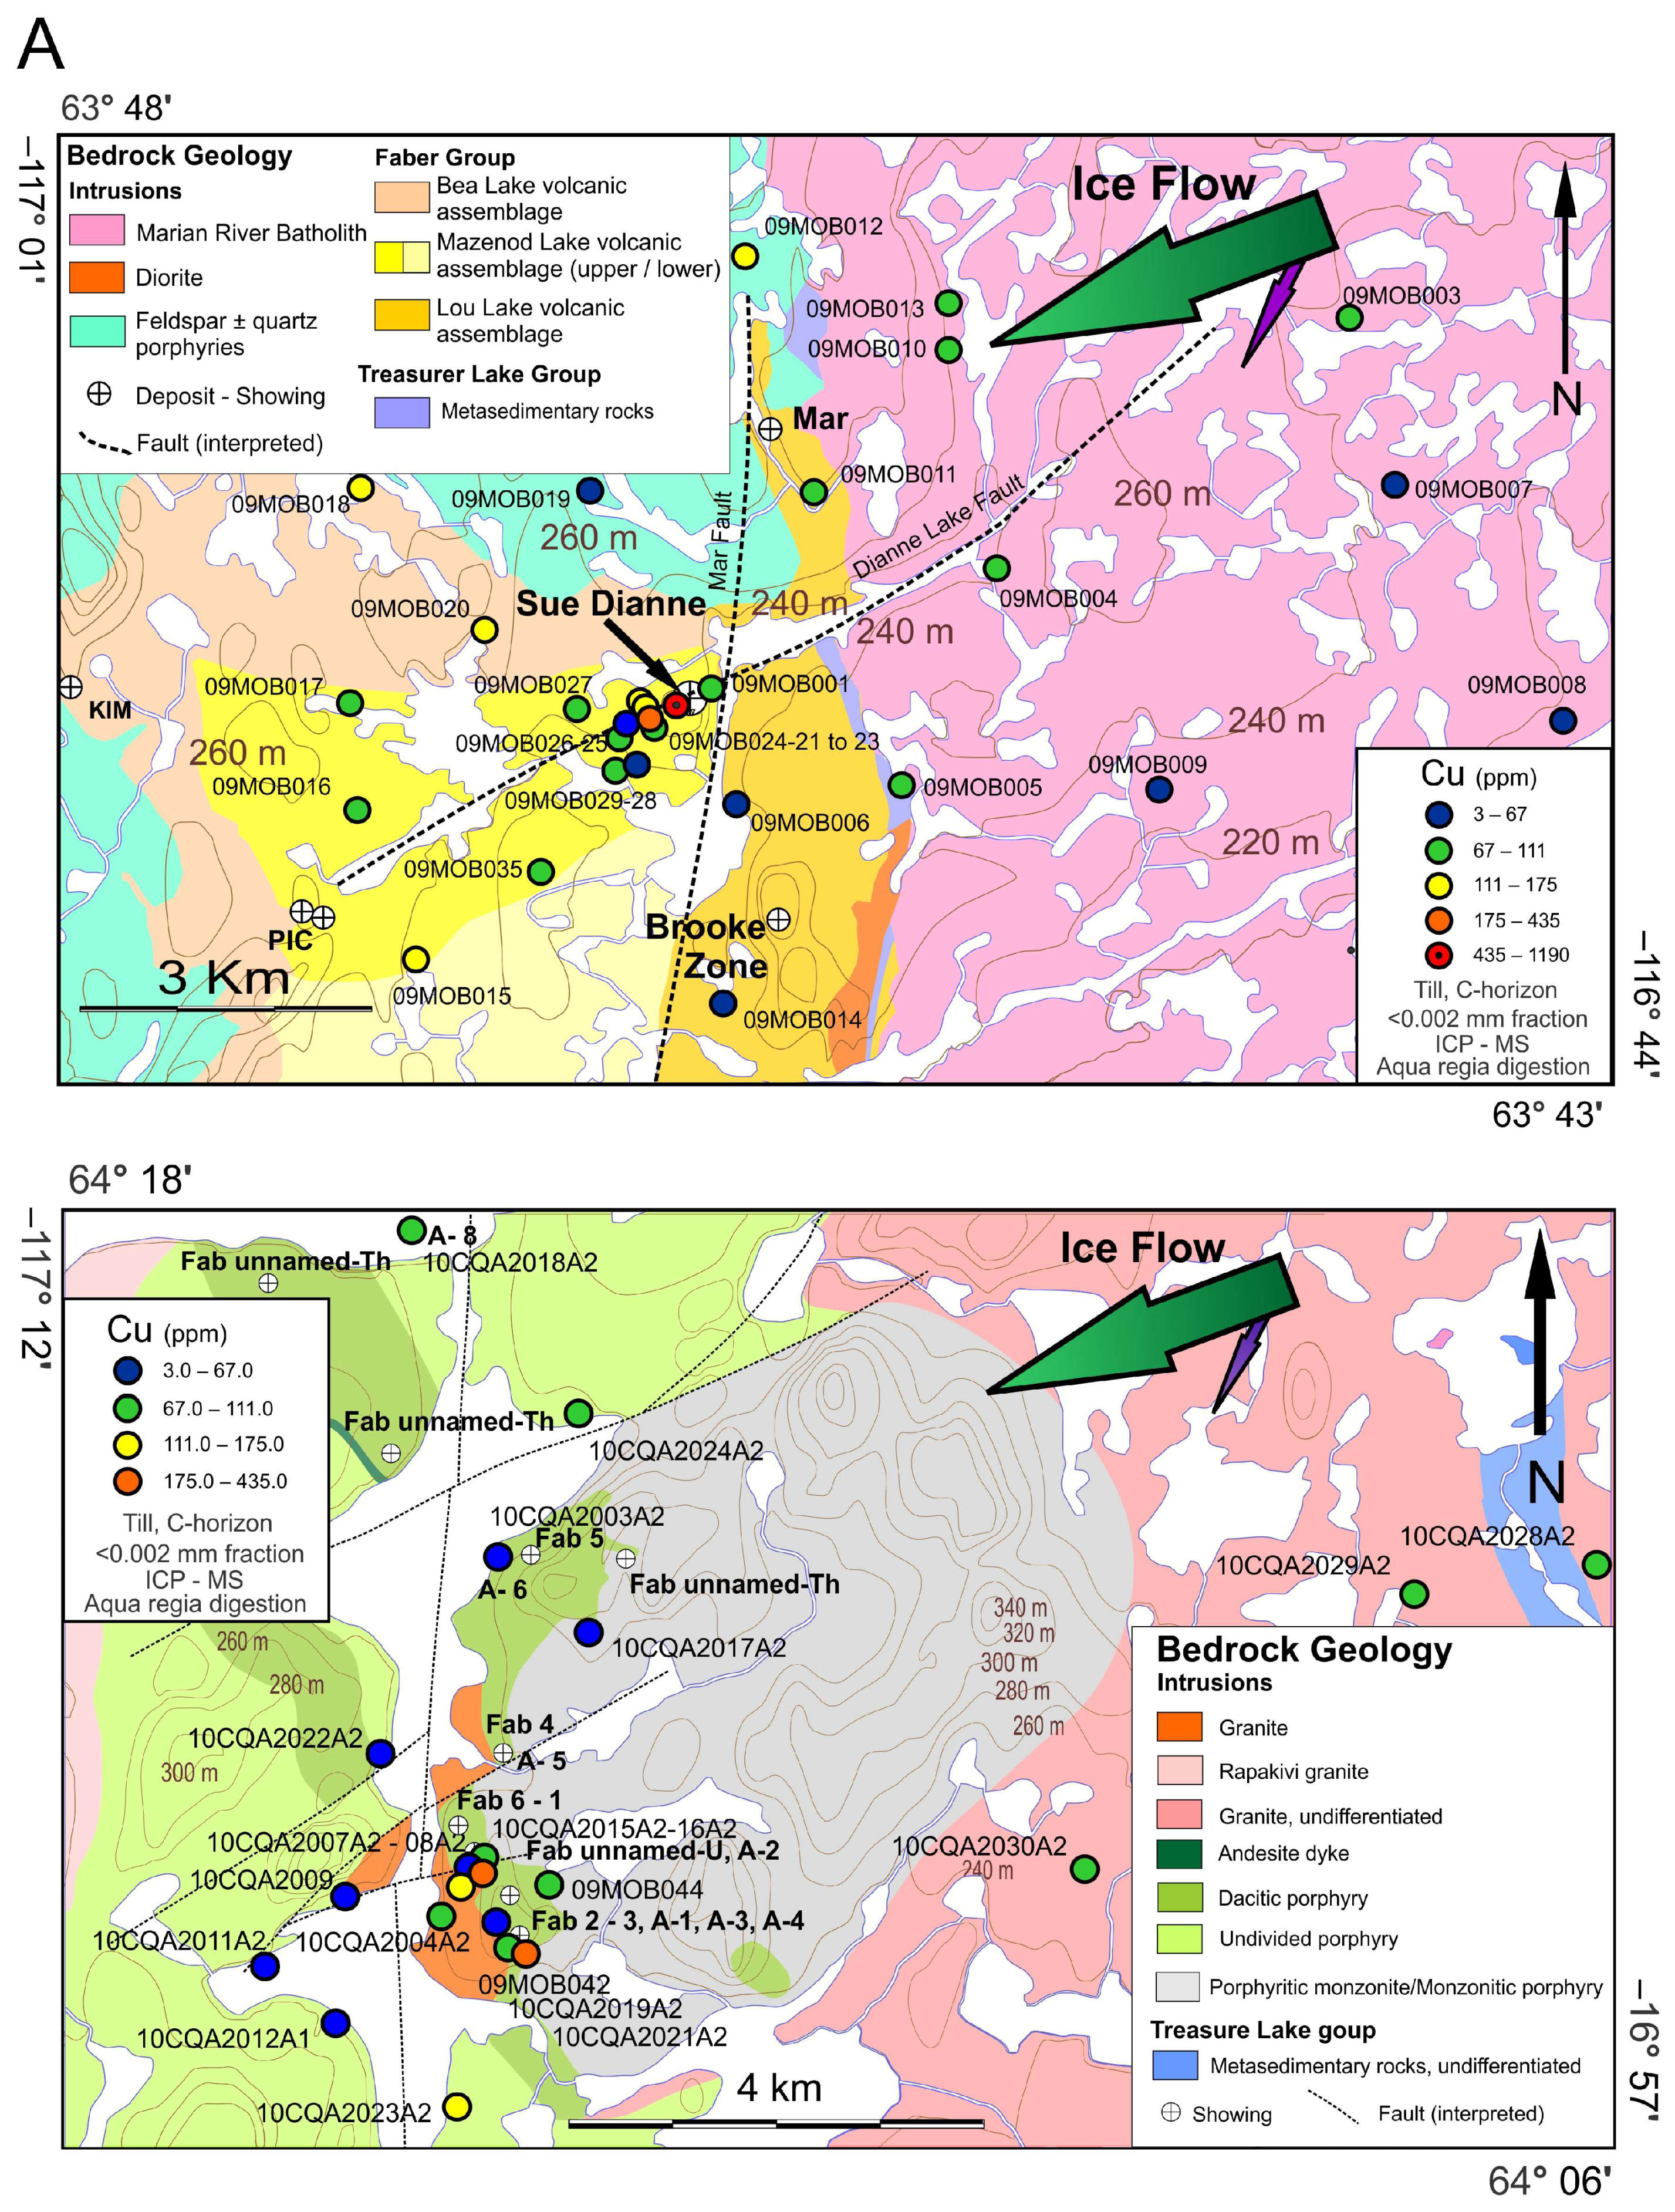
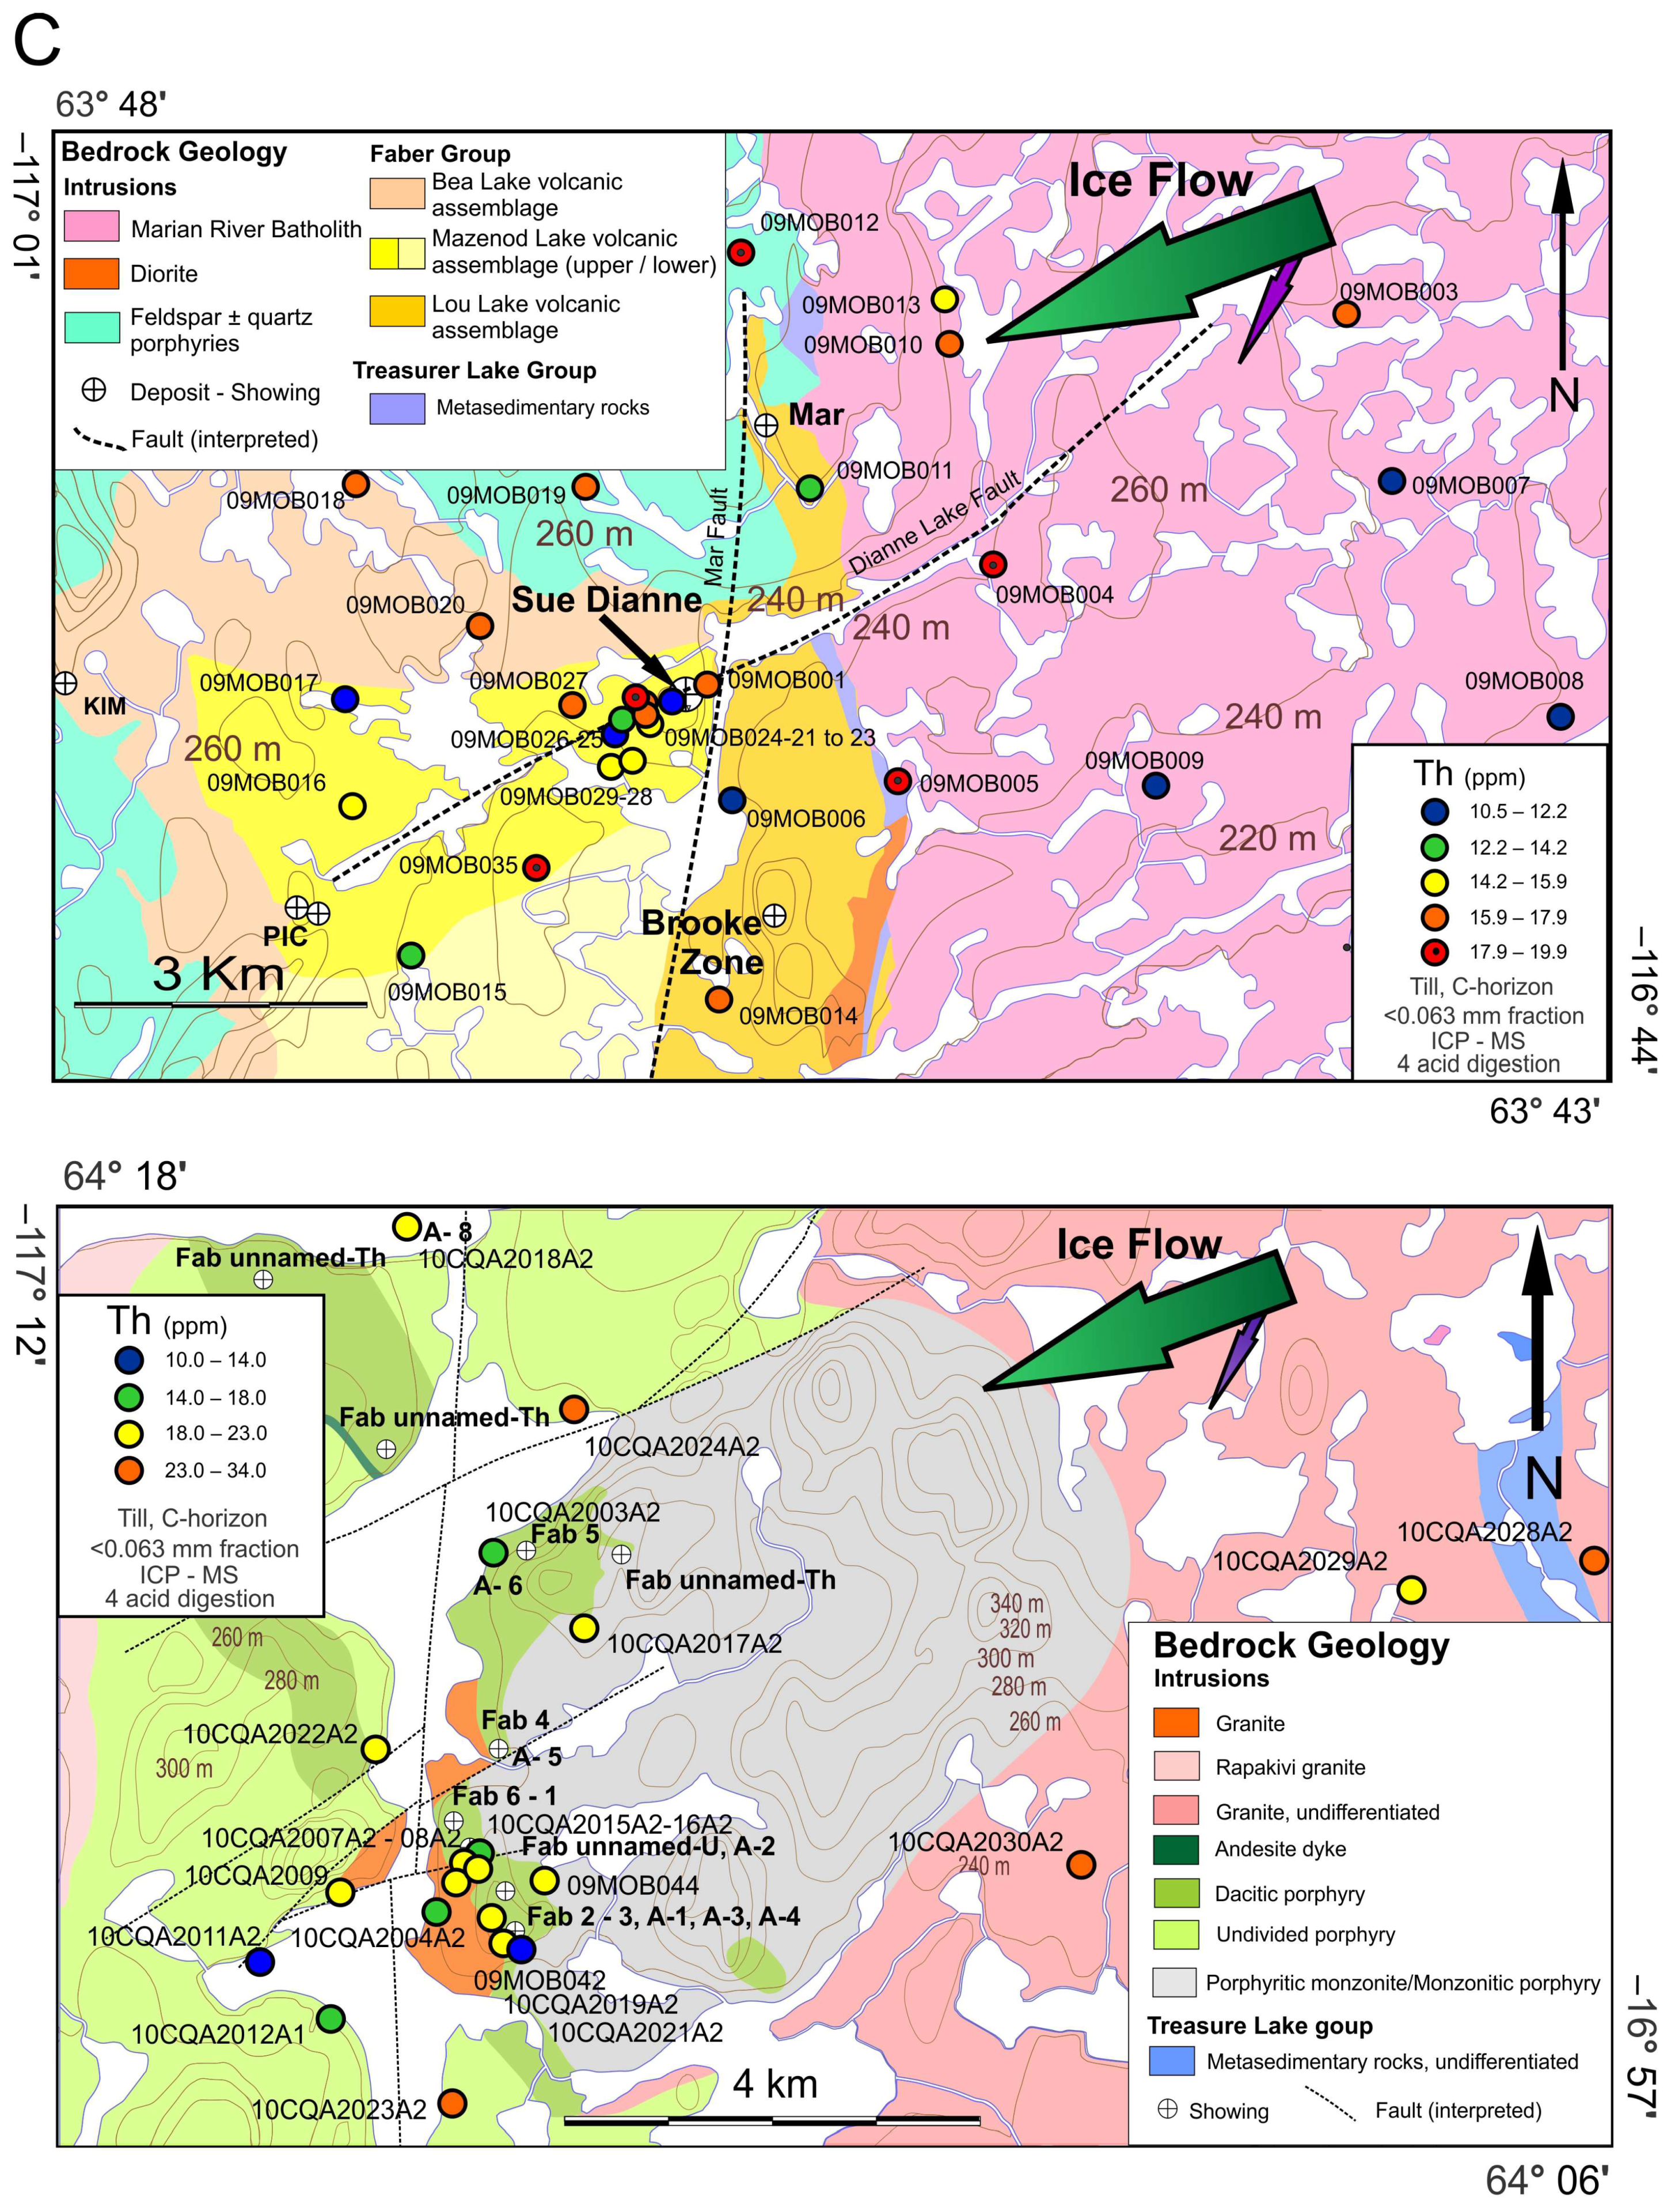
2.3. The Sue Dianne IOCG System

The Sue Dianne Cu-Ag-(U-Au) deposit (Figure 2A) is hosted in a tectonohydrothermal breccia complex occurring in the Faber Group volcanic rocks at the intersection of the Mar and Dianne Lake faults [60,61,62]. Major ore minerals are chalcopyrite, bornite, chalcocite and covellite; emplectite, wittichenite, and carrollite also occur while chalcocite is more localized in the shallower part of the deposit [57,61,62]. The alteration zone is well exposed within 1 km of the Sue Dianne deposit and extends up to 7 km along the main Dianne Lake Fault trend [62]. The predominant alteration types outcropping at the deposit are HT K-felsite (K-feldspar dominant) and the HT K-Fe alteration facies with magnetite and K-feldspar. These facies locally evolve to the LT K-Fe alteration facies with hematite and can be overprinted by a LT Ca-Mg-Fe alteration with epidote, quartz, and allanite. Sodic and HT Ca-Fe alteration facies are the predominant peripheral alteration facies and are also present, in small proportion, in the immediate vicinity of outcropping mineralization [46]. An envelope of quartz and quartz–epidote veins, breccia and stockworks overprint the potassic alteration [31]. Alteration minerals including quartz, sericite, K-felspar, hematite, chlorite, fluorite, epidote, andradite, magnetite, and albite decrease in abundance with increasing distance from mineralization. The same alterations and associated mineralogy are present at the nearby Brooke Zone (Bi-Cu-Mo-LREE) showing, characterized by high Mo, W, and LREE concentrations with lesser Bi and Th [46]. Both systems are enriched in LREE when compared to host rocks. REEs are hosted primarily in apatite and allanite with minor monazite and retrograde britholite [63,64]. Further mention of the Sue Dianne system includes both the Sue Dianne deposit and Brooke Zone showing.
Figure 1. General geology of the Great Bear magmatic zone (GBMZ, modified from Corriveau et al. [35]) with till and bedrock sample locations. The main IOA/IOCG/MI-Co mineralization zones and deposits are indicated with arrows. The IOCG Brooke prospect and IOA Mar prospect occur in the vicinity of the Sue Dianne deposit (Figure 2A).
Minerals 14 00547 g001

2.4. The Fab IOCG System

The Fab system (Figure 2B) includes eight historical showings of U-Cu-Fe, and/or F [65] along with many newly identified unnamed U and Th showings and anomalies [30,56]. Here, the MIAC system has produced magnetite-group IOCG mineralization among a large alteration footprint, outcropping over an area that is 5 by 10 km [56]. Least altered and weakly to completely albitized precursor hypabyssal intrusions are cross-cut by HT Ca-Fe alteration that grades into a transitional HT Ca-K-Fe alteration which, with increasing intensity of K-feldspar, develops large breccia zones, intense HT K-Fe alteration zones, and zones of base and specialized metal mineralization [30,57]. Both historical and newly identified showings are found within or near hydrothermal magnetite-rich veins and breccias with K-feldspar haloes (HT K-Fe facies) as well as magnetite–apatite–actinolite veins (HT Ca-Fe facies). Some of these veins contain up to 10% apatite with or without biotite, muscovite, chlorite, and scheelite [58,63,64]. Uranium ± Cu showings contain combinations of uraninite variably altered to coffinite, titanite, ilmenite, fluorapatite, pyrite, scheelite, thorite, and fluorite [30,58,65] and are located in the central area of the Fab system (Figure 2B). The U and Th showings are limited to the northern part of the Fab system and are within amphibole–magnetite veins and breccias without sulfides (HT Ca-Fe facies).

2.5. Quaternary Geology

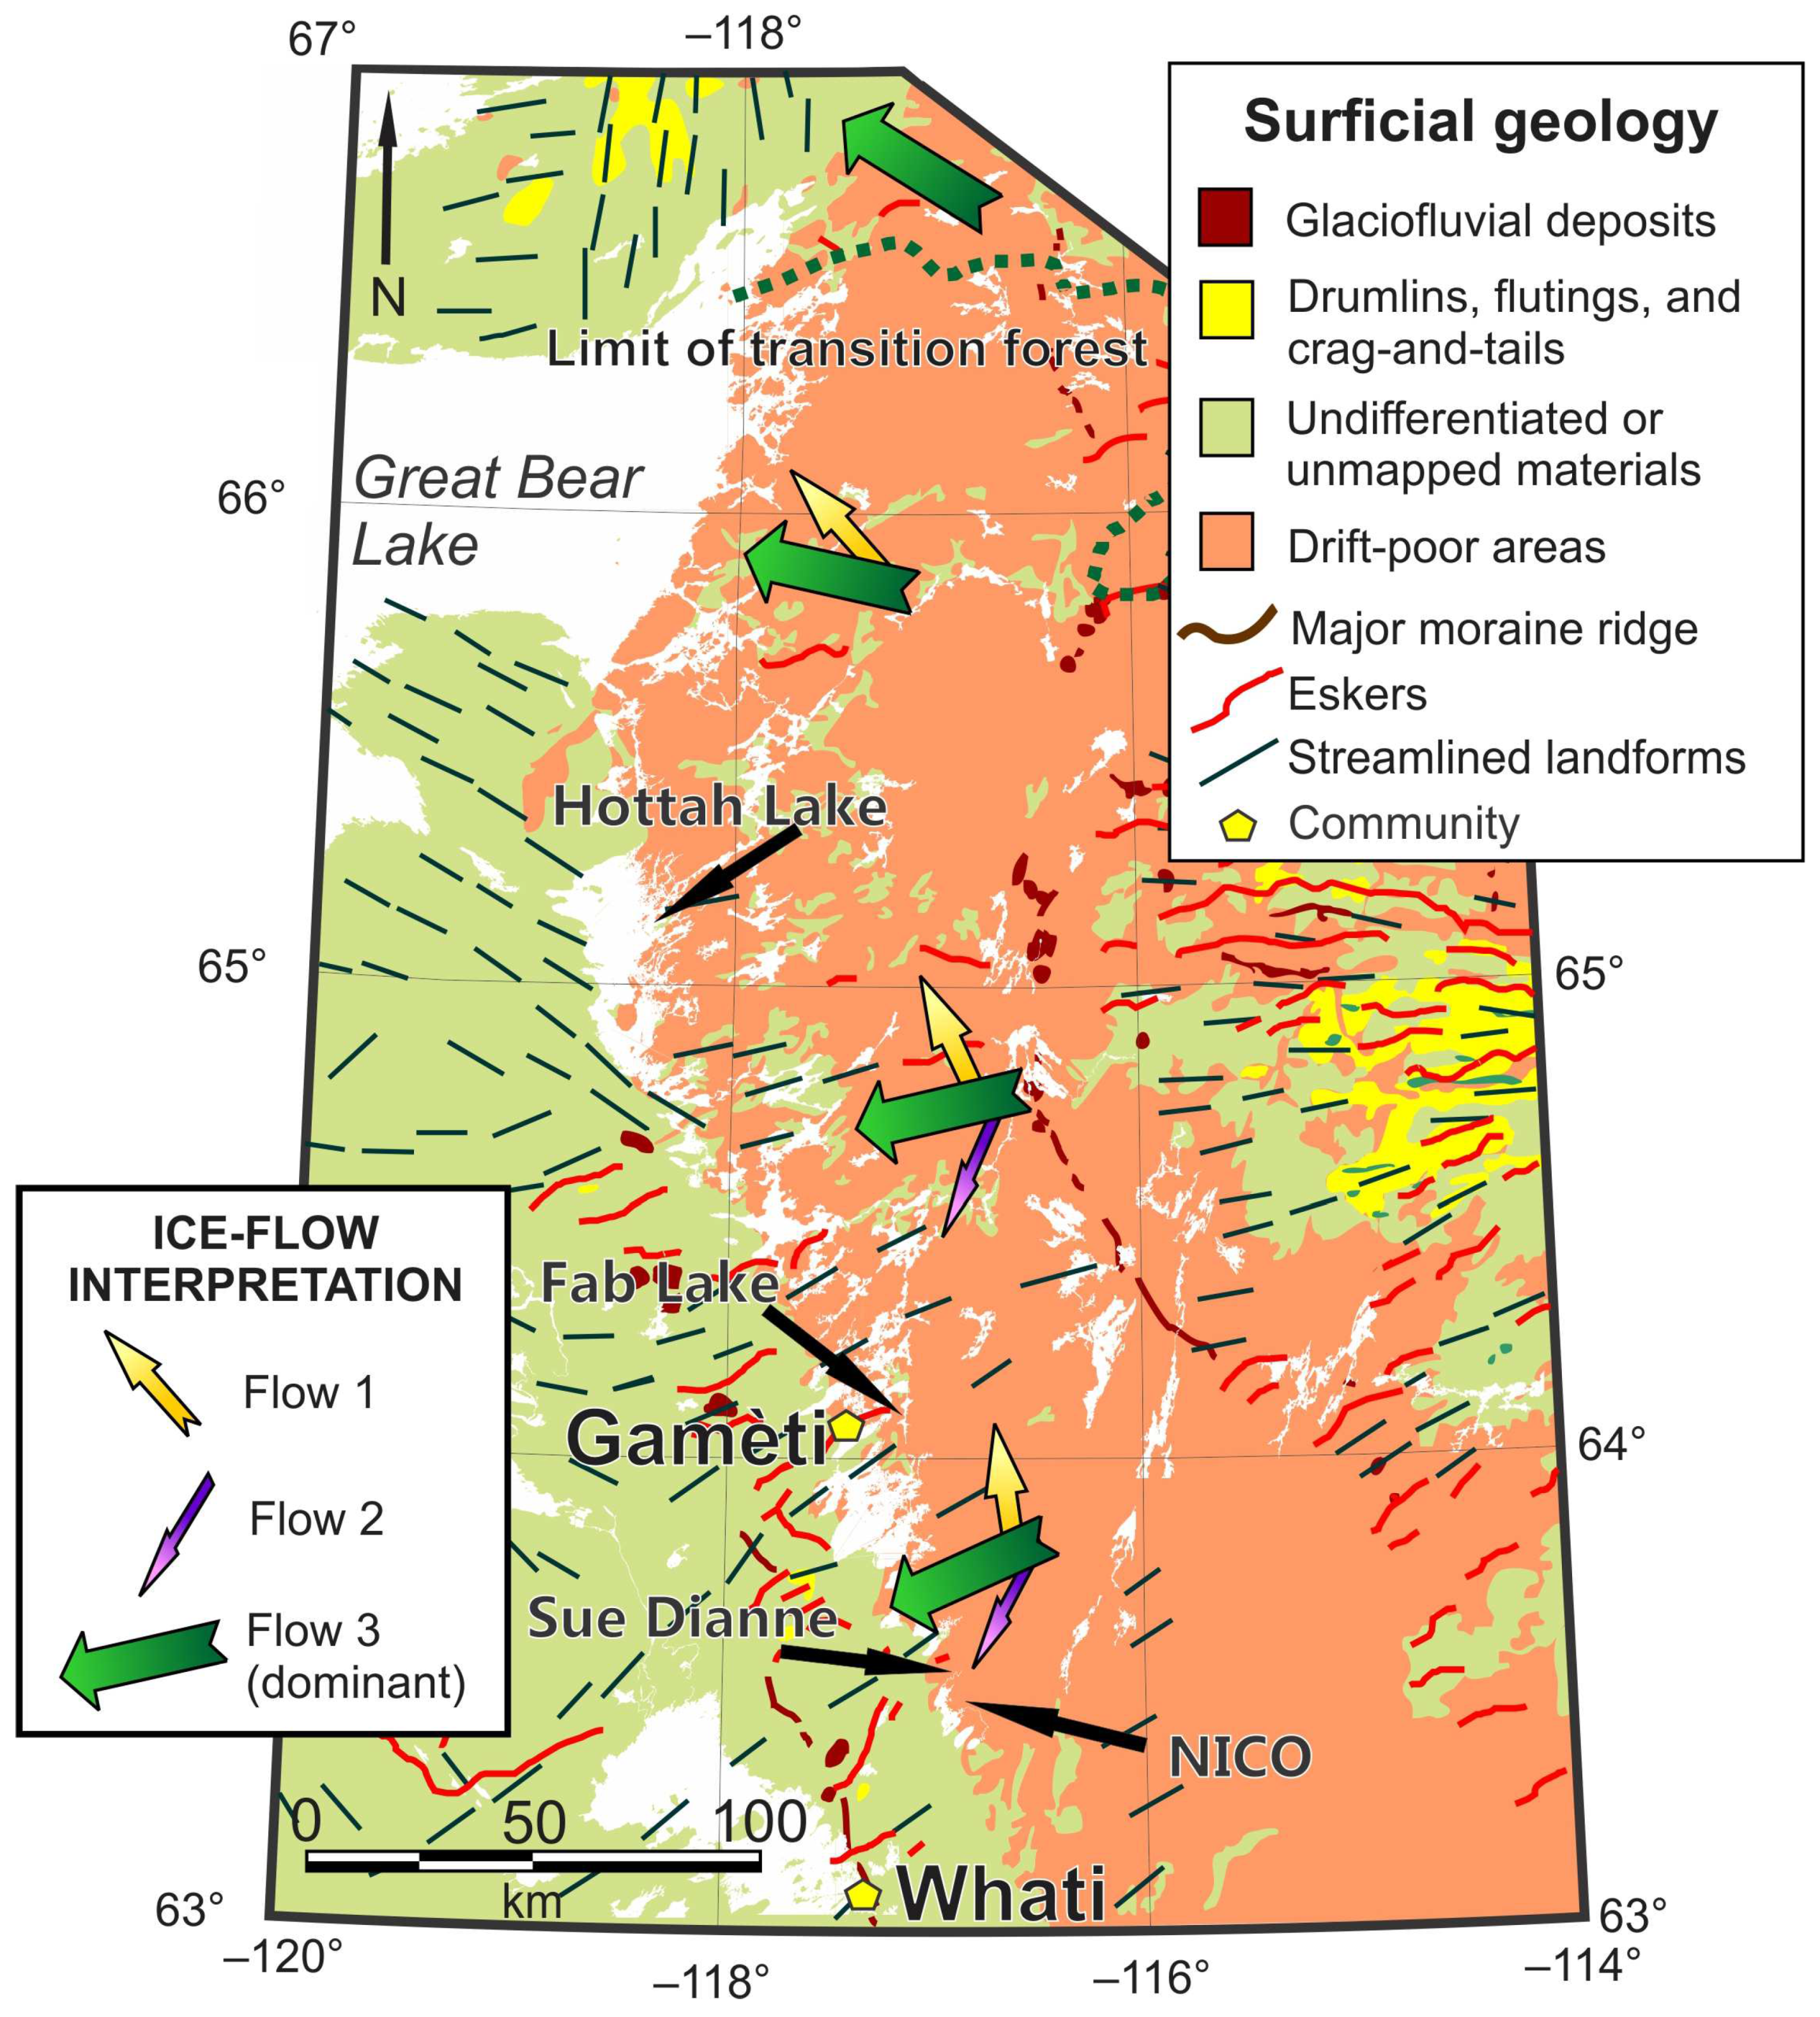
2.5.1. Physiography and Surficial Sediments

In the GBMZ, supracrustal rocks and the hydrothermal alteration zones tend to form prominent bedrock ridges striking SSE to NNW (Figure 3). These ridges have relief exceeding 100 m and are dominated by exposed bedrock draped by a discontinuous till cover generally less than 2 m thick. In contrast, the intrusive rocks of the GBMZ commonly form lowlands (170 to 250 m above sea level—a.s.l.) [67]. Glaciofluvial deposits are scarce and form isolated esker segments (Figure 4). Raised glaciolacustrine beaches and till partly winnowed by waves, shore ice, and currents are found below the maximum elevation of Glacial Lake McConnell at 300 m a.s.l. [68,69]. Offshore, glaciolacustrine sediment veneer occurs in lowlands and protected embayments above modern lake levels.

2.5.2. Glacial Geology and Glacial Transport

The GBMZ was under the western part of the Keewatin Sector of the Laurentide Ice Sheet during the last glaciation [72,73,74]. Glacial Lake McConnell (11.8–8.3 ka 14C BP [68,69]) invaded the lowlands between Great Bear and Great Slave lakes as the ice retreated to the east during deglaciation (12–10 ka 14C BP [74,75]). Ice-flow indicators show that the study area was influenced primarily by ice flowing to the WSW south of Hottah Lake and to the WNW north of Hottah Lake [67]. Three distinct phases of ice flow are observed in the study area (Figure 4). Phase 1 (360° to 308°) and Phase 2 (210°) consist of relict features preserved on the western side of outcrops, protected from ice flow during Phase 3 (Figure 4). Phase 3 ice-flow indicators range in orientation from 225° to 305° across the GBMZ, gradually shifting from west-southwestward in the south to west-northwestward in the north. Phase 3 is the dominant ice-flow direction and is consistent with compilations of streamlined landforms from air photo interpretation and remote sensing observations [73,76,77,78,79,80,81,82].
Till pebble lithology studies suggest a short dispersal distance over the GBMZ. For example, heavily metasomatized clasts (4 to 9.8 mm size) are dispersed less than 800 m to the west (down-ice) of the Sue Dianne deposit [67]. For most showings and deposits of the GBMZ, however, the presence of multiple mineralization outcrops, at a scale similar to glacial transport distances (<1 km), adds complexity to the interpretation of dispersal trains as mineralization can rarely be confidently interpreted as single point sources for anomalies in till.

3. Methods

3.1. Sampling Procedures and Analytical Approach

Whole rock geochemistry analyses of 707 bedrock samples from Corriveau et al. [41] lithogeochemical database were selected to represent the bedrock source of 92 till samples collected in the field. Selected lithogeochemical results are from the Sue Dianne deposit and Fab systems, from other MIAC systems where till samples were collected, and from background sites with barren lithologies in the GBMZ (Table 1). The location of these samples is shown in Figure 1. Bedrock sampling methods and lithogeochemical analytical procedures are presented in Montreuil et al. [38] and Corriveau et al. [41]. Lithogeochemical results were obtained with either instrumental neutron activation (INAA) at Becquerel Laboratories in Toronto, Canada, a combination of inductively coupled plasma–mass spectrometry (ICP-MS) (trace elements) and inductively coupled plasma–atomic emission spectroscopy (ICP-AES) (major and some trace elements) after alkaline fusion performed at INRS-ETE in Québec City, Canada, and ICP-MS analysis after multi-acid near total digestion performed at ACME Labs in Vancouver, Canada. A distribution analysis using Tukey box plots [83,84,85] of economic and accessory elements within the GBMZ (Na, K, Ca, V, Cr, Mn, Fe, Co, Ni, Cu, As, Mo, La, Yb, W, Bi, Th, and U) was performed using log-transformed concentrations to identify potential geochemical indicators common to all the sampled mineralized occurrences. The selection of these elements was based on reported enrichments by Mumin et al. [31] and Montreuil et al. [38] in addition to established pathfinder elements noted in till at the NICO deposit by McMartin et al. [33]. Bedrock samples collected from IOCG and MI-Co ore zones, breccia and showings, or from MIAC systems containing large amounts of sulfides and/or hydrothermal magnetite and/or hematite, were classified as “mineralized” (n = 107). Selections were made independent of elemental concentrations or alteration type. Within these mineralized samples, 25 are from the Sue Dianne deposit and 10 are from the Fab system (Table 1). GBMZ background samples were selected to represent the least altered GBMZ host rocks (n = 215). The remaining bedrock samples represent the various metasomatized but barren rocks associated with each studied system.
A total of 92 till samples from distinct locations were collected in C-horizon soils at an average depth of 50 cm across the entire GBMZ (Figure 1 and Figure 3, Table 1), focusing on the Sue Dianne (n = 30) and Fab systems (n = 23) (Figure 2). Till samples were also collected near other known showings within large IOCG-type alteration systems (n = 25), including the area of the NICO deposit. To assess the range of geochemical background values, till samples were collected away from any known MIAC systems in the GBMZ (n = 9) as well as in the Wopmay internal metamorphic zone (n = 3) and in the Slave Province (n = 2). One sample taken randomly per block of about 25 samples was collected as a field duplicate to test site variability for a total of four field duplicates. The thin cover, discontinuity, and the variable preservation state of the GBMZ till constrained the choice of sample locations during field work. For these reasons, a grid-like pattern of sample locations, typical of exploration programs, was not possible. Nonetheless, till could be sampled at various distances down-ice and up-ice of outcropping mineralization. Detailed sampling methods and till sample locations and descriptions are provided in Normandeau and McMartin [67].

3.2. Analytical Methods for Till Samples

Till samples were dry sieved to obtain the <0.063 mm fraction (silt + clay). The <0.002 mm fraction (clay) was obtained through centrifugation and decantation. Approximately 1 g of the <0.002 mm fraction was analyzed at ACME Labs, Vancouver, Canada, using ICP-MS following a hot (95 °C) modified aqua regia digestion (HCl–HNO3, 1:1). In addition, approximately 30 g of the <0.063 mm fraction was analyzed using ICP-MS following the modified aqua regia digestion; a separated 0.25 g split of the same fraction was analyzed using ICP-MS, 4-acid digestion (HNO3–HClO4–HF dissolved in HCl). About 30 g of the <0.063 mm fraction was also analyzed at Activation Laboratories Ltd., Lancaster, Canada, by instrumental neutron activation analysis (INAA). Quality assurance (QA) and quality control (QC) procedures followed the protocols developed as part of the Geomapping for Energy and Minerals program of Natural Resources Canada [6]. Results are reproducible and considered accurate with the differences between measured and certified values for the standards falling at or below 10%. Elements with high relative standard deviation (≥30%) or accuracies worse than 10% for specific methods and/or batches were excluded from the present study. These include one or more data sets of analyses for Ag, Au, B, Cd, Hg, In, P, S, Sb, Se, Re, and, in some cases, W. Variability between each of the four field duplicate sample sites exceeds the variability within duplicate data sets. The complete analytical results and QA/QC analysis are available in Normandeau and McMartin [67].

3.3. Data Selection for Analyzed Till Samples

Chalcophile elements and most base metals are typically hosted within primary sulfides and clay-sized phyllosilicates or scavenged onto clay minerals and secondary oxide/hydroxides concentrated in the clay-sized till fraction [86,87,88,89]. All these mineral phases are completely dissolved after a partial extraction such as a modified aqua regia digestion [90,91,92,93]. Therefore, of the elements of interest determined from the lithogeochemical dataset, Ni, Cu, As, Mo, and Bi, were obtained from the modified aqua regia digestion on the clay-sized fraction (<0.002 mm) to enhance contrasts between anomalous and background values. Tungsten data were also obtained from the modified aqua regia digestion but on the silt + clay-sized fraction (<0.063 mm) for which the results are more reliable than in the clay-sized fraction [67].
Data from the stronger near-total 4-acid digestion on the silt + clay-sized fraction (<0.063 mm) were used for lithophile and most siderophile elements (i.e., Na, K, Ca, Fe, Co, La, Yb, Th, and U). These elements can be used to investigate the potential effect of MIAC alteration on till composition. Major rock forming minerals such as feldspar are only partially dissolved by the modified aqua regia digestion [94,95] and tend to reach a terminal size in the sand- and silt-sized fractions of glacial sediments [89,96]. In contrast to the 4-acid digestion, alkali results obtained from modified aqua regia primarily target the phyllosilicate minerals [97]. Of note, the 4-acid digestion method still underestimates K values above 2000 ppm compared to fusion methods in bedrock samples [41]. Till geochemical results obtained with both partial and near-total digestion methods and from different size fractions were also compared to gain insight into till mineralogy [15,87,97,98] and source partitioning into host mineral phases modal size fractions [87,99].

3.4. Till Geochemistry Data Preparation

Preparation of till geochemistry data included conversion of the geochemical results to a common unit of measurement (i.e., ppm). Geochemical concentrations below the detection limit were assigned values that were half the detection limit (e.g., reported value of <1 ppm set to 0.5 ppm). This substitution was applied when the number of values falling below detection limit was no greater than 10% of the dataset as suggested by Reimann et al. [84] to minimize the censoring effect on further statistical procedures [85,100]. Elements were excluded when more than 10% of their values in the data set fell below their analytical detection limit. Results from each pair of laboratory duplicates were averaged to single values [101]. Numerical data analyses were carried out in the R programming environment [102] with extensive use of the ‘rgr’ Applied Geochemistry EDA package [103,104].

4. Data Analysis and Results

4.1. Lithogeochemistry

Tukey box plots (Figure 5) and Kruskal–Wallis analysis of variance (Table 2) [84,105,106] are used to compare data from two categories of samples, ‘mineralized’ bedrock samples and ‘GBMZ host rock’, composed of the least altered bedrock samples. Elements are listed in order of decreasing contrast between mineralized and background samples. The Kruskal–Wallis Z-test [107,108] is a non-parametric median-based test and was chosen for its robustness, since we cannot assume equality of variance within mineralized samples or background samples, in addition to the absence of normality in the data distribution. A positive result indicates that, within a 95% confidence interval, the median of the mineralized sample is significantly different from the median of the GBMZ background sample. When significant, the difference is expressed as either higher (H) or lower (L) in Table 2. Based on these methods, the entire dataset ‘mineralized’ bedrock samples (line 1 in Table 2) have higher values for Fe, Cu, Co, As, Ni, Mo, W, U, and Bi and lower values for Na and Th than GBMZ background samples. The range of the element distributions observed in Figure 5 also varies between the mineralized and background samples. For all studied elements except Fe, Mn, and Cr, mineralized samples have greater data spread than background samples.
Additional Kruskal–Wallis Z-tests were performed to investigate the differences in elemental abundances between and within the Sue Dianne and Fab system samples (Table 2). Samples from the Sue Dianne system have a higher median value of Na, K, As, W, La, Th, U, and Bi abundances and a lower median value of Ca and Ni abundances than samples representing the GBMZ background. Within the Sue Dianne sample subsets, mineralized samples show higher median abundance values of Fe, Cu, Co, Mo, W, U, and Bi than non-mineralized samples, while their Na, Th, and Yb median abundances are lower. Samples belonging to the Fab system have higher median values for Ca, As, Th, U, La, and Yb as well as a lower median of Na than those representing the GBMZ background. Within the Fab system subset, mineralized samples show higher median abundance values of Cu than non-mineralized host rock samples. Although Mn, Cr, and V may be remobilized and enriched in MIAC systems [35,38], their abundances in the present dataset do not differentiate any sampling category. These elements were therefore excluded from any further data analysis in the till samples.

4.2. Till Geochemistry

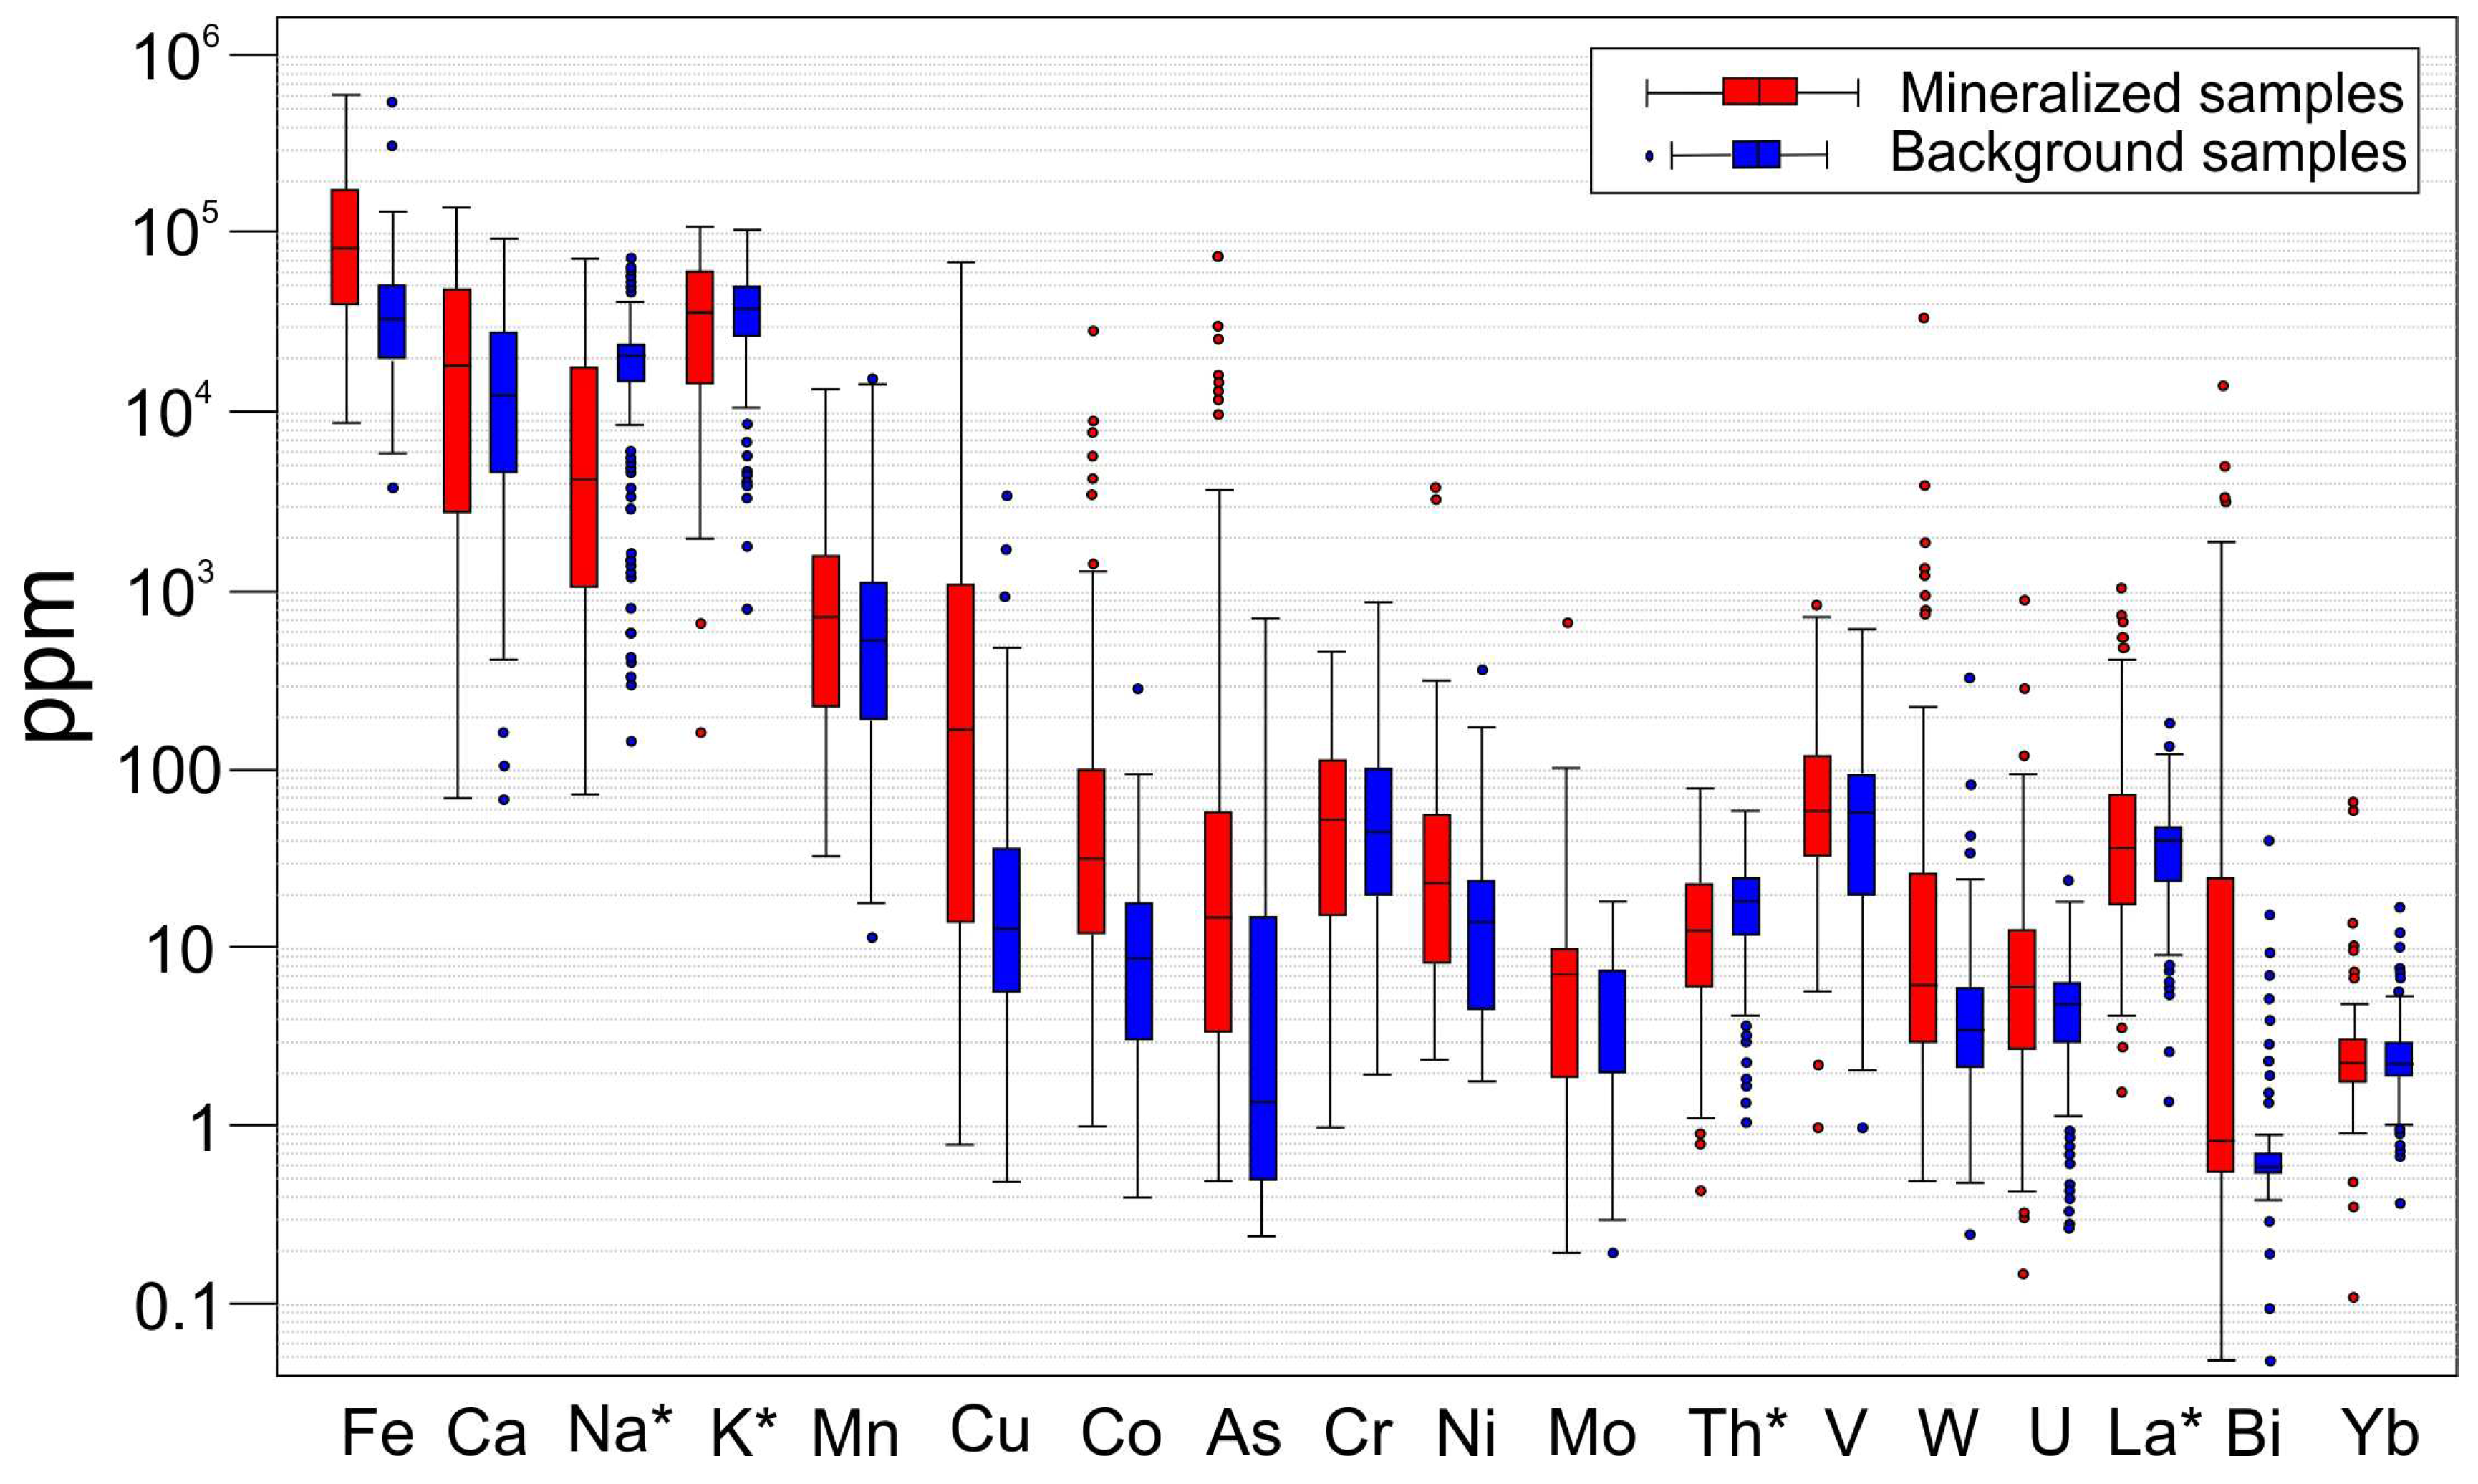
4.2.1. Elemental Distribution

The concentrations of the investigated elements established in the previous section (Na, K, Ca, Fe, Co, Ni, Cu, As, Mo, La, Yb, W, Bi, Th, and U) are presented by till location in Table 3. Threshold is defined as the median till value of the GBMZ background samples ±2 standard deviations. The grouping of local background samples for the Sue Dianne and Fab systems was based on till sample location and the results of the pebble lithological analysis [67].
At the Sue Dianne system, maximum contents of Na, Fe, Co, La, Yb, U, W, Cu, Mo, and Bi occur in till samples collected less than 500 m down-ice of the deposit (Table 3). The highest Cu concentration (1189 ppm) is found in a sample collected less than 200 m down-ice of the Sue Dianne deposit (09MOB002; Table 3; Figure 6A). Nickel is anomalous in all Sue Dianne samples compared to the GBMZ background (Table 3). Cobalt, Cu, and Bi, and to some extent Fe, Mo, and U (Figure 6D) are sporadically elevated down-ice of the Sue Dianne deposit compared to the local background.
Within the Fab system, the highest contents of Na, Fe, Co, U, W, Cu, As, and Mo occur in samples collected less than 500 m down-ice of the showings (Table 3). In contrast, the highest contents of La, Th, and Ni are found in the local background or up-ice from the showings among the large metasomatic system that hosts the mineralization. The second highest Cu concentration (435 ppm) occurs in a till sample located less than 250 m down-ice of one of the Fab showings (10CQA2016A2; Table 3; Figure 6A). Within the Fab till sampling area, Fe, Co, La, Th, and Ni are generally anomalous in the entire system and local background with respect to the GBMZ background, and U, W, Cu, Mo, and Bi are sporadically elevated down-ice of the deposit in comparison to the local background.
The highest contents of K, Ca, La, Yb, Th, U, W, and Bi are found in till samples collected directly down-ice or in the vicinity of various MIAC showings within the GBMZ (Table 3). Although there are a few till samples that contain elevated Na and Yb contents, all K and Ca contents are lower than the threshold. Low values for K, Ca, Na, and Yb, however, are more common. Iron, La, Yb, Th, U, W, Cu, As, Mo, and Bi display the highest background to anomaly contrast, with anomalous content at least twice the median value.
Results also indicate that Ni concentrations with respect to GBMZ background, as well as Cu and Bi contents with respect to local backgrounds, are generally anomalous in till samples near both Sue Dianne and Fab systems. However, results show highly variable elemental concentrations within each of these detailed sampling areas. This spatial variability is illustrated in Figure 6 where high and low values often occur in close proximity to each other, as close as 50 m between sample sites. In both the Sue Dianne and Fab systems areas, many samples collected down-ice from the deposits or showings do not display consistent elemental enrichment. Additionally, specific samples that are anomalous in certain elements may differ greatly from one to another in the concentrations of other elements. For example, 09MOB002 and 09MOB022 contain the highest Cu content down-ice of the Sue Dianne deposit, but they differ significantly from one another in most other elemental contents (Table 3). Sample 09MOB022 is anomalous in Fe, Co, La, U, Ni, Cu, and Bi content whereas sample 09MOB002 is only anomalous in Cu and Mo content. For many elements, both highly anomalous and lowest contents are measured in samples located down-ice of mineralization (e.g., Na, Co, and Mo).

4.2.2. Statistical Significance of Elemental Enrichments and Depletions

The till geochemical dataset was submitted to a Kruskal–Wallis analysis of variance [105,106] to identify elements that show significant differences in median concentrations between samples down-ice of deposits/showings and the up-ice and background populations (Table 4). A confidence interval of 90% was chosen here to account for the smaller number of till samples than bedrock samples. Consecutive tests were performed for each investigated element as the response variable, and the selected population (‘collected down-ice’ or ‘background’) as the factor variable. These tests were performed using all till samples and the Sue Dianne and Fab subsets. Tests were repeated for both digestions and both size fractions.
Results show that enrichments in Ca, W, Bi, and U as well as depletions in Na, Co, Ni, and Th are significant in samples collected directly down-ice of IOCG mineralization and/or MIAC systems in comparison to all background samples (Table 4). The results are dependent on the digestion method used and the size fraction analyzed. Samples from the Sue Dianne deposit area show the most significant results; enrichment of K, Ca, Fe, Cu, As, and Bi as well as depletion of Na and Th can all be observed in at least one analytical technique. Within the silt + clay-sized fraction (<0.063 mm), similar discriminations are noted between modified aqua regia and 4-acid digestion results, with the exception of As. Despite the presence of many elemental enrichments in samples down-ice of the Fab system compared to local background samples (Cu, Mo, W, and U; Table 3, Figure 6), no element enrichment is consistent enough to allow a significant discrimination with the Kruskal–Wallis analysis of variance (Table 4). However, lower medians of La and Th are present down-ice of the Fab showings for all analytical techniques. Most elements have lower median values down-ice of the showings in the clay-sized fraction (<0.002 mm). These contrasts highlight the complexity of the MIAC alteration systems, where element remobilizations may be enriched in mineralization and depleted in the surrounding metasomatized bedrock or vice versa, and the difficulty in predicting the presence of a MIAC system using elemental concentrations alone.

4.2.3. Comparison between Geochemical Dissolution Methods and Size Fractions

To gain a better understanding of the till mineralogy and associated till geochemical composition in the GBMZ samples, a rank-based regression analysis [109] was performed between modified aqua regia and 4-acid geochemical results on elements where both sets of results were available (Table 5). Very strong rank-based correlations (Spearman r > 0.95, p > 0.99) between element contents obtained by modified aqua regia and 4-acid digestions exist for most investigated base metals (Fe, Co, Ni, Cu) as well as for U in the silt + clay-size fraction of till (Table 5). These relationships indicate that the minerals hosting these elements within the silt + clay-sized fraction are susceptible to partial dissolution across all sampling areas. Rank-based correlations between digestion methods for As, La, and Th are strong (r > 0.75; p > 0.99) for all sampling areas. In contrast, rank-based correlations for K and Ca within specific sampling groups vary from strong (r > 0.75) to weak (r < 0.6). This suggests variability in host minerals between the sampling groups for K and Ca. While these tests are performed on a small number of samples (n = 8 to 25), confidence remains very high (p > 0.99), indicating statistical significance.
Rank-based regression analyses were also constructed to further investigate these bivariate relationships (Table 5) within and outside of a single dispersal train. These regression analyses were performed using the rfit R package [109] and are presented on biplots for As, La, U, and Th, using samples collected in the Sue Dianne system area only (Figure 7A). The Sue Dianne area subset was chosen for this analysis because of the larger number of samples (down-ice and background). For La and Th, samples collected down-ice from the Sue Dianne deposit have slightly higher values with 4-acid digestion compared to modified aqua regia digestion values, whereas the results for local background samples tend to fall slightly below the 1 to 1 ratio (Figure 7A). This indicates that till samples collected down-ice of Sue Dianne contain more resistant La and Th minerals, not dissolved by modified aqua regia. The following analysis tests whether this difference in mineral hosts of La and Th between up-ice and down-ice samples can be used as a vectoring tool.
Lanthanum and Th contents from the Sue Dianne system were submitted to a cluster-wise mixture of regression analysis (R package ‘mixreg’ [110]) as a test for detecting mineralization. This technique presumes that a number of data distributions (e.g., La determined after a modified aqua regia digestion and La after a 4-acid digestion) are each composed of multiple unknown components ‘mixed together’ (e.g., La in till derived from altered and unaltered bedrock). This technique attempts to distinguish sub-populations by clustering samples based on their affinity to a bivariate relation (cluster-wise regression) using an iterative procedure with an arbitrary starting configuration of clusters (bootstrapping) (see Everitt and Hand [111] and Titterington et al. [112] for examples). This approach was chosen for (1) its compliance with the present constraint of having both regressions based on a single predictor (modified aqua regia digestion value), and (2) its low computational demands, originating from the sole use of linear regression models, allowing for step-wise covariance calculations necessary for the estimation of the confidence interval. The model was constrained to converge towards two regressions not allowed to intercept. Equality of variance between each sub-population was not presumed. Results are represented in Figure 7B with each resulting output sub-population corresponding to samples falling within the prediction envelope (red or blue). For both La and Th, one of the sub-populations (identified with the red prediction band on Figure 7B) has the following characteristics: (1) it contains a much smaller number of samples than the other (identified with the blue prediction band on Figure 7B), (2) its regression diverges from the 1 to 1 ratio, (3) it contains a smaller number of samples exclusively within its prediction bands (7 out of 23 for La and 3 out of 28 for Th), and (4) it contains few of the local background samples within the 95% confidence interval. This smaller sub-population, identified by the model, might therefore be interpreted as successfully representing the samples affected by the Sue Dianne deposit’s geochemical signal, based on the bivariate relationship between the two digestion methods.
Cluster-wise mixture of regression analysis can distinguish samples collected down-ice of Sue Dianne deposit based on geochemistry irrespective of spatial reference. Lanthanum and Th ratio maps highlight the dispersal train (Figure 8) in comparison with the scattered enrichments and/or depletions observed with the single elemental abundances, or with the Cu map (Figure 6A). The ratio method, for both La and Th, defines a dispersal train extending 2.7 km southwest from the mineralized zone, i.e., down-ice along the dominant phase of ice movement. Background values with the La and Th ratio method have less variations. For example, till samples collected outside the dispersal train with elevated La or Th content (Figure 6B,C) are no longer anomalous (Figure 8A,B). Furthermore, samples 09MOB013 and 09MOB010 collected <500 m apart, over the Marian River batholith, contain variable, albeit background, La and Th contents and exhibit similar digestion ratios to each other.

5. Discussion

5.1. Element Abundance in Till Associated with IOA/IOCG Mineralization and MIAC Systems

A number of elements (Na, K, Ca, Fe, Co, Ni, Cu, As, Mo, La, Yb, W, Bi, Th, and U) in the lithogeochemistry dataset characterizes the presence of IOCG and affiliated mineralization and their host MIAC systems. Some of these elements are reflected in the till geochemistry. However, this association is complex and not systematically detected in the till matrix through a statistical analysis of variance but is revealed by the presence of anomalous elemental concentrations in till up to 2 km down-ice of the various deposits and showings in the GBMZ. Iron and Co content by the 4-acid digestion of the silt + clay-sized fraction and Ni, Cu, As, and Mo by the modified aqua regia digestion of the clay-sized fraction of till have potential as pathfinder elements of the multiple mineralization types in the MIAC systems studied. Anomalous concentrations of La, Th, and U derived from the 4-acid digestion of the silt + clay-sized fraction, and of W and Bi with the modified aqua regia digestion of the silt + clay-sized fraction and clay-sized fraction, respectively, are sporadically found in till down-ice of some MIAC systems and deposits. Of these elements, La and Th represent pathfinder elements of the MIAC systems alteration halos as these elements may be remobilized by the MIAC metasomatism [35,38,57].
Elements with vectoring potential to IOA, IOCG and affiliated deposits, and the MIAC systems in till listed above are highly variable throughout the GBMZ, which reflects the variability within the source mineralization across the GBMZ and within MIAC systems [35]. Likewise, dispersal patterns mapped out from the Sue Dianne deposit and Fab mineralization systems display a high geochemical variability between till sampling sites. This variability is also observed in the till matrix mineralogy analyzed by XRD showing highly variable proportions of feldspar and clay minerals [67]. The vectoring capabilities of elemental abundance maps are therefore limited by the high variability of the till matrix.

5.2. Digestion Method Ratios in Till with Respect to the Sue Dianne IOCG Deposit Alterations

In the Sue Dianne deposit area, La and Th are the main elements in the <0.063 mm till fraction that show slight but distinct concentration differences between the 4-acid and modified aqua regia digestion results. This relationship is therefore used successfully as a discrimination factor to separate sub-populations representing different sources through a cluster-wise regression analysis. Samples collected down-ice of the deposit systematically have higher La and Th digestion method ratios (near total over partial digestion results) than in the local background samples in which the ratios approach or fall below one. The use of digestion method ratios for these elements therefore provides means for delineating the dispersal train from the Sue Dianne deposit with less variability than with the single element distribution.
The main La and REE-bearing minerals at the Sue Dianne deposit are metasomatic apatite and allanite as well as minor monazite and britholite, whereas the main REE mineral in the barren and less altered host rocks is magmatic apatite [63,64]. Sue Dianne LREE enrichment in bedrock is associated with the HT and LT K-Fe alteration, and to a lesser extent, to the subsequent LT Ca-Mg-Fe alteration [62], as is typical of MIAC systems globally [32]. Rare earth elements remobilization from apatite to secondary phases such as monazite and/or allanite due to alkali-rich fluid evolution has been described from laboratory experiments [113,114,115], and documented in the Kiruna district [116,117], Bafq district [118], and at the Sue Dianne deposit [64]. The efficiency of the La ratio map at detecting mineralization suggests that REEs are hosted in mineral species more resistant to modified aqua regia digestion (e.g., monazite and allanite) glacially transported down-ice of the deposit. In till derived from barren and less altered rocks, the REEs are more likely hosted in minerals susceptible to modified aqua regia digestion (e.g., apatite). Therefore, an association can be made between La digestion method ratio variations and the alteration phases (K-Fe as well as Ca-Mg-Fe) at the Sue Dianne system where a high La ratio in till indicates proximity to altered source rocks, therefore providing a useful application of till geochemistry for surface exploration in the GBMZ.
Thorium minerals were not identified within the least altered host rocks at the Sue Dianne deposit, yet Th enrichment occurs in the LT Ca-Mg-Fe alteration and is associated with minor thorite and britholite [30,57,62,63,64]. Based on global comparisons, Th ratio variations might result from the LT Ca-Mg-Fe stage and from the K-felsite that forms a widespread halo around the Sue Dianne deposit [32,35].

5.3. Limitations of Till Geochemical Methods in the GBMZ

Several limitations to the application of till geochemical methods exist in the GBMZ. The presence of multiple mineralization outcrops throughout and/or close to the sampled areas at the Sue Dianne deposit and Fab system prevented the deposits/showings from acting as single point sources for geochemical anomalies in the locally derived till and added complexity to characterizing the dispersal trains. In addition, the discontinuous till distribution in the GBMZ also caused restrictions to sampling locations. A variety of PCA based tests and methodologies were performed on the available datasets in the early phases of this project (e.g., [119]) The limited number of samples for each sampled locality and the combined variability of the source bedrock and till rendered the PCA results less informative than the present analysis. These PCA results were therefore excluded from this work. Although the use of digestion ratios was successful at the Sue Dianne deposit, this method requires additional testing around other deposits. The low number of samples in the Fab system area (n = 23) was insufficient to test further this potential vectoring tool. Bedrock alteration mapping related to IOCG deposits and MIAC systems remains a challenge due to overprinting and retrograde alterations that juxtapose alteration types [31,32]. This overprinting limits the characterization of the relationship between a geochemical anomaly in till and a single type of alteration. Because of these limitations, it is difficult to identify single elements that can be used to evaluate proximity to IOCG alteration without testing bivariate relationships as demonstrated with La and Th digestion method ratios at the Sue Dianne deposit area. Further research is warranted to optimize potential discrimination of the sourced alteration facies. Integration of the recently developed barcodes methods used to process MIAC related lithogeochemical data [35,37,38,40] can potentially be utilized for till geochemistry data as well.

6. Conclusions

Till samples collected near known mineralized zones throughout the GBMZ are variably enriched in Fe, Co, Ni, Cu, As, Mo, Bi, La, Th, U, and W. All investigated MIAC systems contain one or a combination of these elements in anomalous concentrations down-ice of mineralized outcrops, even with low sampling density. The vectoring potential of till geochemistry in the GBMZ however, remains limited due to the discontinuous till cover, the variability of elemental enrichments within IOA to IOCG mineralization, as well as the complexity and size of the alteration system.
Mineralization in the Sue Dianne deposit is enriched in Fe, Co, Cu, Mo, W, Bi, and U as shown by the lithogeochemical analysis of mineralized samples versus barren samples. Of these elements, Fe and Co, determined via 4-acid digestion of the silt + clay-sized fraction (<0.063 mm) of till, and Cu, Mo, and Bi, determined via modified aqua regia digestion of the clay-sized (<0.002 mm) fraction, have the highest potential to be used as vectors to mineralization.
The mineralization in the Fab system is enriched in Ca, As, La, Yb, Th, Cu, and U compared to the GMBZ background, as shown by lithogeochemical analysis. Of the various anomalous values in the till geochemistry in the Fab system, only U, determined via the 4-acid digestion of the silt + clay-sized fraction, and Cu, determined via the modified aqua regia digestion of the clay-sized fraction, reflect the lithogeochemical enrichments. However, Fe, Co, Mo, W, Ni, and Bi in till samples collected within the Fab system may also be sporadically anomalous relative to the GBMZ background.
Sodium, Ca, and K concentrations in till determined by the 4-acid digestion of the silt + clay-sized fraction are influenced by MIAC alteration and IOCG mineralization yet using these elements as tracers to target specific alteration zones is challenging without incorporating additional discrimination methods due to the complex nature of these metasomatic systems. The ratio of the 4-acid digestion over the modified aqua regia digestion concentrations within the silt + clay-sized fraction of till provides the largest anomaly in the Sue Dianne deposit area when used with either La or Th. The well-defined ratio anomaly extends over 2.7 km down-ice (southwest) from the main mineralization. This ratio-based method also provides an insight into the potential direct transfer of a bedrock alteration signature into the till composition. As such, the fine fraction of till in which La preferentially resides in minerals that are most resistant to 4-acid digestion reflects HT to LT K-Fe as well as LT Ca-Mg-Fe alteration. Further testing of the ratio method in other alteration systems is needed to assess its applicability to additional deposits.

Author Contributions

Conceptualization, P.X.N. and I.M.; methodology, P.X.N.; validation, McMartin, I.; data acquisition, sampling and field activities, P.X.N., I.M. and L.C.; analysis, P.X.N.; writing—original draft preparation, P.X.N.; writing—review and editing, I.M. and L.C.; visualization, P.X.N.; supervision, I.M.; project administration, L.C. and I.M.; funding acquisition, L.C. and I.M. All authors have read and agreed to the published version of the manuscript.

Funding

This research was funded by Natural Resources Canada under the IOCG/Multiple Metals—Great Bear Region (NWT) within the Geo-mapping for Energy and Minerals (GEM) program [MGM010], as well as by Natural Resources Canada under the Polar Continental Shelf Program (PCSP) [00410] [50709] [010009] and by the Research Affiliate Program of Natural Resources Canada (RAP). NRCan Contribution number 20160408.

Data Availability Statement

The data presented in this study are openly available in GSC Open Files 7643 and 7307 at, https://doi.org/10.4095/296301 and https://doi.org/10.4095/292560 [41,67].

Acknowledgments

This work stems from the Geomapping for Energy and Minerals (GEM) IOCG/Multiple Metals Great Bear Region project at the Geological Survey of Canada (GSC; Natural Resources Canada) led by Louise Corriveau conducted in partnership with the Wopmay Bedrock Mapping project of the Northwest Territories Geological Survey. This paper supports the Targeted Geoscience Initiative, phase 6, Ore systems project sub-activity Metasomatic iron and alkali-calcic systems with iron oxide-copper-gold (IOCG) and critical metal deposits: footprints, endowment, genesis, and prospective settings. This work was part of a PhD research project within the department of Earth and Planetary Science of McGill University under the thorough and thoughtful co-supervision of Jeanne Paquette and Isabelle McMartin. Processing of till samples for grain size separation and geochemical analyses was supervised by Shauna Madore at the Sedimentology Laboratory of the GSC. Vincent Van Hinsberg from McGill University provided feedback specific to statistical analysis. Thanks are due to Catherine Fontaine, Louis-Philippe Gélinas, Vincent Martel, and Samuel Simard for astounding assistance in the field. Alain Plouffe provided comments and suggestions as part of the GSC internal review process. The authors thank two anonymous reviewers for their constructive and valuable comments.

Conflicts of Interest

The authors declare no conflict of interest.

References

  1. McClenaghan, M.B.; Thorleifson, L.H.; DiLabio, R.N.W. Till geochemical and indicator mineral methods in mineral exploration. Ore Geol. Rev. 2000, 16, 145–166. [Google Scholar] [CrossRef]
  2. Klassen, R.A. A Quaternary geological perpective on geochemical exploration in glaciated terrain. Geol. Soc. Lond. Spec. Publ. 2001, 185, 1–17. [Google Scholar] [CrossRef]
  3. McClenaghan, M.B.; Kjarsgaard, B.A. Indicator mineral and geochemical methods for diamond exploration in glaciated terrain in Canada. Geol. Soc. Lond. Spec. Publ. 2001, 185, 83–123. [Google Scholar] [CrossRef]
  4. McMartin, I.; Dredge, L.A.; Grunsky, E.; Pehrsson, S. Till geochemistry in west-central Manitoba: Interpretation of provenance and mineralization based on glacial history and multivariate data analysis. Econ. Geol. 2016, 111, 1001–1020. [Google Scholar] [CrossRef]
  5. McClenaghan, B.M.; Paulen, R.C. Application of till mineralogy and geochemistry to mineral exploration. In Past Glacial Environment, 2nd ed.; Menzies, J., van der Meer, J., Eds.; Elsevier: Amsterdam, The Netherlands, 2018; pp. 689–751. [Google Scholar]
  6. McClenaghan, B.M.; Spirito, W.A.; Plouffe, A.; McMartin, I.; Campbell, J.E.; Paulen, R.C.; Garrett, R.G.; Pelchat, P.; Gauthier, M.S. Geological Survey of Canada Till-Sampling and Analytical Protocols: From Field to Archive, 2020 Update; Open File 8591; Geological Survey of Canada: Ottawa, ON, Canada, 2020; 82p.
  7. McClenaghan, B.M.; Spirito, W.A.; Day, S.J.A.; McCurdy, M.W.; McNeil, R.J.; Adcok, S.W. Overview of surficial geochemistry and indicator mineral surveys and case studies from the Geological Survey of Canada’s GEM Program. Geochem. Explor. Environ. Anal. 2022, 22, 1–70. [Google Scholar] [CrossRef]
  8. McClenaghan, B.M.; Paulen, R.C.; Smith, R.C.; Rice, J.M.; Plouffe, A.; McMartin, I.; Campbell, J.E.; Parsasadr, M.; Lethonen, M. Review of till geochemistry, indicator mineral, and boulder tracing methods for mineral exploration in glaciated terrain. Geochem. Explor. Environ. Anal. 2023, 23, 1–43. [Google Scholar] [CrossRef]
  9. McClenaghan, M.B. Till geochemistry in areas of thick drift and its application to gold exploration, Matheson area, northeastern Ontario. Explor. Min. Geol. 1994, 3, 17–30. [Google Scholar]
  10. Kaszycki, C.A.; Nielsen, E.; Gobert, G. Surficial geochemistry and response to volcanic-hosted massive sulphide mineralization in the Snow Lake region. In Extech I: A Multidisciplinary Approach to Massive Sulphide Research in the Rusty Lake-Snow Lake Greenstone Belts, Manitoba; Bonham-Carter, G.F., Galley, A.G., Hall, G.E.M., Eds.; Geological Survey of Canada: Bulletin, MB, Canada, 1996; Volume 426, pp. 139–154. [Google Scholar]
  11. Levson, V.M. Quaternary Geology and Till Geochemistry of the Babine Porphyry Copper Belt, British Columbia (NTS 93 L/9,16, M/1, 2, 7, 8); Bulletin 110; British Columbia Ministry of Energy and Mines, and Petroleum Resources: Victoria, UK, 2002; 278p.
  12. Klassen, R. The geochemical and physical properties of till, Bathurst Mining Camp, New Brunswick, Canada. Econ. Geol. Monogr. 2003, 11, 661–678. [Google Scholar]
  13. Lehtonen, M.; Marmo, J.; Nissinen, A.; Johanson, B.; Pakkanen, L. Glacial dispersal studies using indicator minerals and till geochemistry around two eastern Finland kimberlites. J. Geochem. Explor. 2005, 87, 19–43. [Google Scholar] [CrossRef]
  14. Campbell, J.E. Drift prospecting for uranium in the Athabasca Basin, Saskatchewan. In Application of till and Stream Sediment Heavy Mineral and Geochemical Methods to Mineral Exploration in Western and Northern Canada: Short Course Notes 18; Paulen, R., McMartin, I., Eds.; Geological Association of Canada: St. John’s, NB, Canada, 2009; Volume 111, pp. 2045–2072. [Google Scholar]
  15. McClenaghan, M.B.; Layton-Matthews, D.; Matile, G. Till geochemical signatures of magmatic Ni–Cu deposits, Thompson Nickel Belt, Manitoba, Canada. Geochem. Explor. Environ. Anal. 2011, 11, 145–159. [Google Scholar] [CrossRef]
  16. McClenaghan, B.M.; Peter, J. Till geochemical signatures of volcanogenic massive sulphide deposits: An overview of Canadian examples. Geochem. Explor. Environ. Anal. 2016, 1, 27–47. [Google Scholar] [CrossRef]
  17. Hashmi, S.; Ward, B.C.; Plouffe, A.; Leybourne, M.I.; Ferbey, T. Geochemical and mineralogical dispersal in till from the Mount Polley Cu-Au porphyry deposit, central British Columbia, Canada. Geochem. Explor. Environ. Anal. 2015, 15, 234–249. [Google Scholar] [CrossRef]
  18. Plouffe, A.; Ferbey, T.; Hashmi, S.; Ward, B.C. Till geochemistry and mineralogy: Vectoring towards Cu porphyry deposits in British Columbia, Canada. Geochem. Explor. Environ. Anal. 2016, 16, 213–232. [Google Scholar] [CrossRef]
  19. McClenaghan, B.M.; Paulen, R.C.; Orviatt, N.M. Geometry of indicator mineral and till geochemistry dispersal fans from the Pine Point Mississippi Valley-type Pb-Zn district, Northwest Territories, Canada. J. Geochem. Explor. 2018, 190, 69–86. [Google Scholar] [CrossRef]
  20. McClenaghan, B.M.; Ames, D.E.; Cabris, L.J. Indicator mineral and till geochemical signatures of the Broken Hammer Cu–Ni–PGE–Au deposit, North Range, Sudbury Structure, Ontario, Canada. Explor. Environ. Anal. 2020, 20, 337–356. [Google Scholar] [CrossRef]
  21. Hashmi, S.; Leybourne, M.I.; Hamilton, S.; Layton-Matthews, D.; McClenaghan, B.M. Suitability of surficial media for Ni–Cu–PGE exploration in an established mining camp: A case study from the South Range of the Sudbury Igneous Complex, Canada. Explor. Environ. Anal. 2022, 22, 1–22. [Google Scholar] [CrossRef]
  22. Plouffe, A.; Kjarsgaard, I.M.; Ferbey, T.; Wilton, D.H.C.; Petts, D.C.; Percival, J.B.; Kobylinski, C.H.; McNeil, R.J. Detecting buried porphyry Cu mineralization in a glaciated landscape: A case study from the Gibraltar Cu-Mo deposit, British Columbia, Canada. Econ. Geol. 2022, 117, 777–799. [Google Scholar] [CrossRef]
  23. Benavides, J.; Kyser, T.K.; Clark, A.H.; Stanley, C.; Oates, C. Application of molar element ratio analysis of lag talus composite samples to the exploration for iron oxide–copper–gold mineralization: Mantoverde area, northern Chile. Geochem. Explor. Environ. Anal. 2008, 8, 369–380. [Google Scholar] [CrossRef]
  24. Benavides, J.; Kyser, T.K.; Clark, A.H.; Stanley, C.; Oates, C. Exploration guidelines for copper-rich iron oxide–copper–gold deposits in the Mantoverde area, northern Chile: The integration of host-rock molar element ratios and oxygen isotope compositions. Geochem. Explor. Environ. Anal. 2008, 8, 343–367. [Google Scholar] [CrossRef]
  25. Fabris, A.J.; Halley, S.; Van Der Wilen, S.; Keeping, T.; Gordon, G. IOCG-style mineralisation in the central eastern Gawler Craton, SA. In Characterisation of Alteration, Geochemical Associations and Exploration Vectors; Report Book 2013/00014; Department of Innovation, Manufacturing, Trade, Resources and Energy: Adelaide, Australia, 2013. [Google Scholar]
  26. Fabris, A.J.; Van Der Wilen, S.; Keeping, T.; Gordon, G. Geochemicaal Footprint of IOCG Deposits Beneath Thick Cover: Insights from the Olympic Cu-Au Province, South Australia. In Proceedings of the 27th International Applied Geochemistry Symposium, Tucson, AZ, USA, 20–24 April 2015. [Google Scholar]
  27. Sadeghi, M.; Arvanitidis, N.; Landenbergger, A. Geochemistry of rare earth elements in bedrock and till, applied in the contrext of mineral potential in Sweden. Minerals 2020, 10, 365. [Google Scholar] [CrossRef]
  28. McMartin, I.; Corriveau, L.; Beaudoin, G. An orientation study of the heavy mineral signature of the NICO Co-Au-Bi deposit, Great Bear magmatic zone, NW Territories, Canada. Geochem. Explor. Environ. Anal. 2011, 11, 293–307. [Google Scholar] [CrossRef]
  29. Sappin, A.A.; Dupuis, C.; Beaudoin, G.; McMartin, I.; McClenaghan, M.B. Optimal ferromagnetic fraction representative of iron oxide compositional variations in till samples along ice-flow paths: Case studies from the Sue-Dianne IOCG and Thompson magmatic Ni-Cu deposits, Canada. Geochem. Explor. Environ. Anal. 2014, 14, 315–329. [Google Scholar] [CrossRef]
  30. Montreuil, J.-F.; Potter, E.G.; Corriveau, L.; Davis, W.J. Element mobility patterns in magnetite-group IOCG systems: The FAb IOCG system, Northwest Territories, Canada. Ore Geol. Rev. 2016, 72, 562–584. [Google Scholar] [CrossRef]
  31. Corriveau, L.; Montreuil, J.-F.; Potter, E.; Blein, O.; De Toni, A.F. Mineral systems with IOCG and affiliated deposits: Part 3–metal pathways and ore deposit model. In Mineral Systems with Iron Oxide Copper-Gold (IOCG) and Affiliated Deposits, Special Paper 52; Corriveau, L., Potter, E.G., Mumin, A.H., Eds.; Geological Association of Canada: St. John’s, NB, Canada, 2022; pp. 205–245. [Google Scholar]
  32. Corriveau, L.; Montreuil, J.-F.; Potter, E.; Ehrig, K.; Clark, J.; Mumin, A.H.; Williams, P.J. Mineral systems with IOCG and affiliated deposits: Part 1—Metasomatic footprints of alteration facies. In Mineral Systems with Iron Oxide Copper-Gold (IOCG) and Affiliated Deposits, Special Paper 52; Corriveau, L., Potter, E.G., Mumin, A.H., Eds.; Geological Association of Canada: St. John’s, NB, Canada, 2022; pp. 113–158. [Google Scholar]
  33. McMartin, I.; Corriveau, L.; Beaudoin, G. Heavy mineral and till geochemical signatures of the NICO Co-Au-Bi deposit, Great Bear magmatic zone, Northwest Territories, Canada. In Proceedings of the 24th International Applied Geochemistry Symposium (IAGS 2009), Fredericton, NB, Canada, 1–4 June 2009. [Google Scholar]
  34. Porter, T.M. Current understanding of iron oxide associated-alkali altered mineralized systems: Part 1—An overview; part 2—A review. In Hydrothermal Iron Oxide Copper-Gold and Related Deposits: A Global Perspective; Porter, T.M., Ed.; PGC Publishing: Adelaide, Australia, 2010; pp. 5–106. [Google Scholar]
  35. Corriveau, L.; Montreuil, J.-F.; Blein, O.; Ehrig, K.; Potter, E.G.; Fabris, A.J.; Clark, J. Mineral systems with IOCG and affiliated deposits: Part 2—geochemical footprints. In Mineral Systems with Iron Oxide Copper-Gold (IOCG) and Affiliated Deposits, Special Paper 52; Corriveau, L., Potter, E.G., Mumin, A.H., Eds.; Geological Association of Canada: St. John’s, NB, Canada, 2022; pp. 159–204. [Google Scholar]
  36. Williams, P.J.; Barton, M.D.; Johnson, D.A.; Fontboté, L.; De Haller, A.; Mark, G.; Oliver, N.H.; Marschik, R. Iron oxide copper-gold deposits: Geology, space-time distribution, and possible modes of origin. In Economic Geology, One Hundredth Anniversary Volume 1905–2005; Hedenquist, J., Thompson, F.H., Goldfarb, R.J., Richards, J.P., Eds.; Society of Economic Geologists: Littleton, CO, USA, 2005; pp. 371–405. [Google Scholar]
  37. Corriveau, L.; Montreuil, J.-F.; Potter, E.G. Alteration facies linkages among IOCG, IOA and affiliated deposits in the Great Bear magmatic zone, Canada. Econ. Geol. 2016, 111, 2045–2072. [Google Scholar] [CrossRef]
  38. Montreuil, J.-F.; Corriveau, L.; Grunsky, E. Compositional data analysis of hydrothermal alteration in IOCG systems, Great Bear magmatic zone, Canada: To each alteration type its own geochemical signature. Geochem. Explor. Environ. Anal. 2013, 13, 229–247. [Google Scholar] [CrossRef]
  39. Acosta-Góngora, G.P.; Potter, E.G.; Lawley, C.J.M. Geochemical characterization of the Central Mineral Belt U±Cu±Mo±V mineralization, Labrador, Canada: Evaluation of IOCG potential and application of unsupervised machine-learning. J. Geochem. Explor. 2022, 237, 106995. [Google Scholar] [CrossRef]
  40. Drejing-Carroll, D.; Hitzman, M.W.; Coller, D. Geology of the Nautanen North Cu-Au-Ag-(Mo) Deposit, Norrbotten, Sweden. Econ. Geol. 2023, 118, 1765–1794. [Google Scholar] [CrossRef]
  41. Corriveau, L.; Lauzière, K.; Montreuil, J.-F.; Potter, E.; Hanes, R.; Prémont, S. Dataset of Geochemical Data from Iron Oxide Alkali-altered Mineralising Systems of the Great Bear Magmatic Zone, Northwest Territories; Open File 7643; Geological Survey of Canada: Ottawa, ON, Canada, 2015; 24p.
  42. Barton, M.D.; Johnson, D.A. Footprints of Fe-Oxide (Cu-Au) Systems; Special Publication; Center for Global Metallogeny, University of Western Australia: Perth, Australia, 2004; pp. 112–116. [Google Scholar]
  43. Mumin, A.H. Echo Bay IOCG Thematic Map Series: Geology, Structure and Hydrothermal Alteration of a Stratovolcano Complex, Northwest Territories, Canada; Open File 7807; Geological Survey of Canada: Ottawa, ON, Canada, 2015; 19p.
  44. Hitzman, M.W.; Oreskes, N.; Einaudi, M.T. Geological characteristics and tectonic setting of proterozoic iron oxide (Cu U Au REE) deposits. Precam. Resear. 1992, 58, 241–287. [Google Scholar] [CrossRef]
  45. Barton, M.D.; Johnson, D.A. Evaporitic-source model for igneous-related Fe oxide–(REE-Cu-Au-U) mineralization. Geology 1996, 24, 259–262. [Google Scholar] [CrossRef]
  46. Montreuil, J.-F.; Corriveau, L.; Potter, E.G. On the relation between alteration signature and metal endowment of iron oxide alkali altered systems, southern Great Bear magmatic zone (Canada). Econ. Geol. 2016, 111, 2139–2168. [Google Scholar] [CrossRef]
  47. Hildebrand, R.S.; Hoffman, P.F.; Bowring, S.A. Tectono-magmatic evolution of the 1.9-Ga Great Bear magmatic zone, Wopmay Orogen, northwestern Canada. J. Volcan. Geotherm. Resear. 1987, 32, 99–118. [Google Scholar] [CrossRef]
  48. Hildebrand, R.S.; Hoffman, P.F.; Bowring, S.A. The Calderian orogeny in Wopmay orogen (1.9 Ga), northwestern Canadian Shield. Geol. Soc. Am. Bull. 2010, 122, 794–814. [Google Scholar] [CrossRef]
  49. Jackson, V.A.; van Breemen, O.; Ootes, L.; Bleeker, W.; Bennett, V.; Davis, W.J.; Ketchum, J.; Smar, L.; McFarlane, C. U–Pb zircon ages and field relationships of Archean basement and Proterozoic intrusions, south-central Wopmay Orogen, NWT: Implications for tectonic assignments 1, 2. Can. J. Earth Sc. 2013, 50, 979–1006. [Google Scholar] [CrossRef]
  50. Jackson, V.A.; Ootes, L.; Pierce, K.L.; Bennett, V.; Smar, L.; Mackay, D.; Sanderman, H.A. Geology of the South-Central Wopmay orogen, Northwest Territories (Parts of NTS 86B, 86C, and 86D); Results from the South Wopmay Bedrock Mapping Project; NWT Open File 2017-01; Northwest Territories Geological Survey: Yellowknife, NT, Canada, 2022; 103p.
  51. Hildebrand, R.S. Geological Synthesis of Northern Wopmay Orogen/Coppermine Homocline, Northwest Territories–Nunavut; Open File 6390, Open Report 2010-011; Northwest Territories Geological Survey: Yellowknife, NT, Canada; Geological Survey of Canada: Ottawa, ON, Canada, 2011.
  52. Jackson, V.A.; Irwin, D. Bedrock Geology of the Wopmay Orogen and Coppermine Homocline, Northwest Territories; NWT Open File 2021-02; Northwest Territories Geological Survey: Yellowknife, NT, Canada, 2022.
  53. Ootes, L.; Snyder, D.; Davis, W.J.; Acosta-Góngora, G.P.; Corriveau, L.; Mumin, A.H.; Montreuil, J.-F.; Gleeson, S.A.; Samson, I.A.; Jackson, V.A. A Paleoproterozoic Andean-type iron oxide copper-gold environment, the Great Bear magmatic zone, Northwest Canada. Ore Geol. Rev. 2017, 81, 123–139. [Google Scholar] [CrossRef]
  54. Gandhi, S.S.; Prasad, N.; Charbonneau, B. Geological and Geophysical Signatures of a Large Polymetallic Exploration Target at Lou Lake, Southern Great Bear Magmatic Zone, Northwest Territories; Geological Survey of Canada: Ottawa, ON, Canada, 1996; pp. 147–158.
  55. Gandhi, S.S.; Potter, E.G.; Fayek, M. Polymetallic U-Ag Veins at Port Radium, Great Bear Magmatic Zone, Canada: Main Botryoidal Pitchblende Stage Cuts 1.74 Ga Diabase Dykes and Has REE Signatures Diagnostic of Unconformity-Type Deposits; Open File 7493; Geological Survey of Canada: Ottawa, ON, Canada, 2013; 1p.
  56. Potter, E.G.; Montreuil, J.-F.; DeToni, A. Geology and Hydrothermal Alteration of the Fab Lake Region, Northwest Territories; Open File 7339; Geological Survey of Canada: Ottawa, ON, Canada, 2013; 27p.
  57. Acosta-Góngora, G.P.; Gleeson, S.A.; Samson, I.M.; Ootes, L.; Corriveau, L. Trace element geochemistry of magnetite and its relationship to Cu-Bi-Co-Au-Ag-UW mineralization in the Great Bear magmatic zone, NWT, Canada. Econ. Geol. 2014, 109, 1901–1928. [Google Scholar] [CrossRef]
  58. DeToni, A.F. Systèmes à Oxydes de fer et Alterations en Élémeents Alcalins, Zone Magmatic du Grand Lac de l’Ours. Master’s Thesis, Centre–Eau Terre Environnement, Institut National de la Recherche Scientifique, Université du Québec, Québec, QC, Canada, 2016; 738p. [Google Scholar]
  59. Potter, E.; Acosta-Góngora, G.P.; Corriveau, L.; Montreuil, J.-F.; Yang, Z. Uranium enrichment processes in iron oxide and alkali-calcic alteration systems as revealed by uraninite trace element chemistry. In Mineral Systems with Iron Oxide Copper-Gold (IOCG) and Affiliated Deposits, Special Paper 52; Corriveau, L., Potter, E.G., Mumin, A.H., Eds.; Geological Association of Canada: St. John’s, NB, Canada, 2022; pp. 325–345. [Google Scholar]
  60. Goad, R.E.; Mumin, A.H.; Duke, N.; Neale, K.; Mulligan, D. Geology of the Proterozoic iron oxide-hosted, NICO cobalt-gold-bismuth, and Sue Dianne copper-silver deposits, southern Great Bear magmatic zone, Northwest Territories, Canada. In Hydrothermal Iron Oxide Copper-Gold and Related Deposits a Global Perspective Volume 1; Porter, T.M., Ed.; Porter Geoscience Consultancy Publishing: Adelaide, Australia, 2000; pp. 249–268. [Google Scholar]
  61. Goad, R.E.; Mumin, A.H.; Duke, N.A.; Neale, K.L.; Mulligan, D.L.; Camier, W.J. The NICO and Sue-Dianne Proterozoic, iron oxide-hosted, polymetallic deposits, Northwest Territories: Application of the Olympic Dam model in exploration. Explor. Min. Geol 2000, 9, 123–140. [Google Scholar] [CrossRef]
  62. Camier, W.J. The Sue-Dianne Fe-Oxide Cu-Ag-Au Breccia Complex, Southern Great Bear Magmatic Zone, Northwest Territories, Canada. Master’s Thesis, University of Western Ontario, London, ON, Canada, 2002. [Google Scholar]
  63. Lypaczewski, P.; Normandeau, P.; Paquette, J.; McMartin, I. Petrographic and Cathodoluminescence Characterization of Apatite from the Sue-Dianne and Brooke IOCG Mineralization Systems, Great Bear Magmatic Zone, Northwest Territories; Open File 7319; Geological Survey of Canada: Ottawa, ON, Canada, 2013; 18p.
  64. Normandeau, P.X.; Harlov, D.E.; Corriveau, L.; Paquette, J.; McMartin, I. Characterization of fluorapatite within iron oxide alkali-calcic alteration systems of the Great Bear magmatic zone: A potential metasomatic process record. Can. Min. 2018, 56, 167–187. [Google Scholar] [CrossRef]
  65. Gandhi, S.S. Volcano-plutonic setting of U-Cu bearing magnetite veins of Fab claims, southern Great Bear magmatic zone, Northwest Territories. In Current Research, Paper 88-1C; Geological Survey of Canada: Ottawa, ON, Canada, 1988; pp. 177–188. [Google Scholar]
  66. Jackson, V.A. Preliminary Geologic Map of Part of the Southern Wopmay Orogen (Parts of NTS 86B and 86C; 2007 Updates); Descriptive Notes to Accompany 1:100 000 Scale Map; NWT Open Report 2008-007; Northwest Territories Geoscience Office: Yellowknife, NT, Canada, 2008.
  67. Normandeau, P.X.; McMartin, I. Composition of till and Bedrock across the Great Bear Magmatic Zone: Quaternary Field Database and Analytical Results from the GEM IOCG-Great Bear Project; Open File 7307; Geological Survey of Canada: Ottawa, ON, Canada, 2013; 22p.
  68. Lemmen, D.S.; Duk-Rodkin, A.; Bednarski, J.M. Late glacial drainage systems along the northwestern margin of the Laurentide Ice Sheet. Quat. Sci. Rev. 1994, 13, 805–828. [Google Scholar] [CrossRef]
  69. Smith, D.G. Glacial Lake McConnell: Paleogeography, age, duration, and associated river deltas, Mackenzie River basin, western Canada. Quat, Sci. Rev. 1994, 13, 829–843. [Google Scholar] [CrossRef]
  70. Aylsworth, J.M.; Shilts, W.W. Glacial Features around the Keewatin Ice Divide: Districts of Mackenzie and Keewatin; Paper 88-24; Geological Survey of Canada: Ottawa, ON, Canada, 1989; 21p.
  71. Fulton, R.J. Surficial Materials of Canada; Map 1880A, 1:5 000 000 scale; Geological Survey of Canada: Ottawa, ON, Canada, 1995; 1p.
  72. Dyke, A.S.; Prest, V.K. Late Wisconsinan and Holocene history of the Laurentide ice sheet. Géo. Phys. Quat. 1987, 41, 237–263. [Google Scholar] [CrossRef]
  73. Dyke, A.S.; Dredge, L. Quaternary geology of the northwestern Canadian Shield. In Geology of Canada Chapter 3 of Quaternary Geology of Canada and Greenland; Fulton, R.J., Ed.; Geological Survey of Canada: Ottawa, ON, Canada, 1989; Volume 1, pp. 189–214. [Google Scholar]
  74. Dyke, A.S. An outline of North American deglaciation with emphasis on central and northern Canada. Dev. Quat. Sci. 2004, 2, 373–424. [Google Scholar]
  75. Dalton, A.S.; Margold, M.; Stokes, C.R.; Tarasov, L.; Dyke, A.S.; Adams, R.S.; Allard, S.; Arends, H.E.; Atkinson, N.; Attig, J.W.; et al. An updated radiocarbon-based ice margin chronology for the last deglaciation of the North American Ice Sheet Complex. Quat. Sci. Rev. 2020, 234, 27. [Google Scholar] [CrossRef]
  76. Prest, V.K.; Grant, D.R.; Rampton, V.N. Glacial Map of Canada, Map 1253A; Geological Survey of Canada: Ottawa, ON, Canada, 1968.
  77. Clark, C.D. Mega-scale glacial lineations and cross-cutting ice-flow landforms. Earth Surf. Process. Landforms. 1993, 18, 1–29. [Google Scholar] [CrossRef]
  78. Kerr, D.E.; O’Neill, H.B. Reconnaissance Surficial Geology, Hardisty Lake, Northwest Territories, NTS 86-C; Canadian Geoscience Map 337 (preliminary), scale 1:125,000; Geological Survey of Canada: Ottawa, ON, Canada, 2018.
  79. Kerr, D.E.; O’Neill, H.B. Reconnaissance Surficial Geology, Rivière Grandin, Northwest Territories, NTS 86-D; Canadian Geoscience Map 361, scale 1:125,000; Geological Survey of Canada: Ottawa, ON, Canada, 2018.
  80. Kerr, D.E.; O’Neill, H.B. Reconnaissance Surficial Geology, Calder River, Northwest Territories, NT S 86-F; Canadian Geoscience Map 389, scale 1:125 000; Geological Survey of Canada: Ottawa, ON, Canada, 2019.
  81. Kerr, D.E.; O’Neill, H.B. Reconnaissance Surficial Geology, Leith Peninsula, Northwest Territories, NTS 86-E; Canadian Geoscience Map 409, scale 1:125,000; Geological Survey of Canada: Ottawa, ON, Canada, 2019.
  82. Kerr, D.E. Reconnaissance Surficial Geology, Sloan River, Northwest Territories–Nunavut, NTS 86-K; Canadian Geoscience Map 450, scale 1:125 000; Geological Survey of Canada: Ottawa, ON, Canada, 2022.
  83. Tukey, J.W. Exploratory Data Analysis; Addison-Wesley Publishing Compagny: Boston, MA, USA, 1977; 688p. [Google Scholar]
  84. Reimann, C.; Filzmoser, P.; Garrett, R.; Dutter, R. Statistical Data Analysis Explained: Applied Environmental Statistics with R; John Wiley & Sons, Ltd.: Hoboken, NJ, USA, 2008; p. 359. [Google Scholar]
  85. Grunsky, E.C. The interpretation of geochemical survey data. Geochem. Explor. Environ. Anal. 2010, 10, 27–74. [Google Scholar] [CrossRef]
  86. Cole, D.R.; Rose, A.W. Distribution and mode of occurrence of zinc and lead in glacial soils. J. Geochem. Explor. 1984, 20, 137–160. [Google Scholar] [CrossRef]
  87. Tarvainen, T. The geochemical correlation between coarse and fine fractions of till in southern Finland. J. Geochem. Explor. 1995, 54, 187–198. [Google Scholar] [CrossRef]
  88. Peuraniemi, V.; Aario, R.; Pulkkinen, P. Mineralogy and geochemistry of the clay fraction of till in northern Finland. Sed. Geol. 1997, 111, 313–327. [Google Scholar] [CrossRef]
  89. Klassen, R.A. The interpretation of background variation in regional geochemical surveys–an example from Nunavut, Canada. Geochem. Explor. Environ. Anal. 2001, 1, 163–173. [Google Scholar] [CrossRef]
  90. Shilts, W.W. Principles of geochemical exploration for sulphide deposits using shallow samples of glacial drift. Can. Inst. Min. Metall. Bull. 1975, 68, 73–80. [Google Scholar]
  91. Niskavaara, H. A Comprehensive Scheme of Analysis for Soils, Sediments, Humus and Plant Samples Using Inductively Coupled Plasma Atomic Emission Spectrometry (ICP-AES): Current Research; Geological Survey of Finland: Romaniemi, Finland, 1995; Volume 20, pp. 167–175. [Google Scholar]
  92. Koljonen, T.; Malisa, E. Solubility in aqua regia of selected chemical elements occurring in the fine fraction of till till. In Environmental Geochemistry in Northern Europe, Special Paper 9; Pulkkinen, E., Ed.; Geological Survey of Finland: Romaniemi, Finland, 1991; pp. 49–52. [Google Scholar]
  93. Shilts, W.W. Drift exploration. In Glacial Environments, Sediment Forms and Techniques; Menzies, J., Ed.; Butterworth Heinemann Ltd.: Oxford, UK, 1996; pp. 411–439. [Google Scholar]
  94. Foster, J.R. The efficiency of various digestion procedures on the extraction of metals from rocks and rock forming minerals. Can. Inst. Min. Bull. 1973, 66, 85–92. [Google Scholar]
  95. Snäll, S.; Liljefors, T. Leachability of major elements from minerals in strong acids. J. Geochem. Explor. 2000, 71, 1–12. [Google Scholar] [CrossRef]
  96. Dreimanis, A.; Vagners, U. The dependence of the composition of till upon the rule of bimodal composition. INQUA VIII Internat. Cong. Gener. Sess 1971, 787–789. [Google Scholar]
  97. Lahtinen, R.; Lestinen, P.; Savolainen, H. The Use of Total and Partial Dissolution till Geochemical Data in Delineating Favourable Areas for Ni Prospects: An Example from the Tampere–Hämeenlinna Area, Southern Finland; Special Paper 18; Geological Survey of Finland: Romaniemi, Finland, 1993; pp. 101–111. [Google Scholar]
  98. McMartin, I. Till Provenance across the Terminus of the Dubawnt Lake Ice Stream, Central Nunavut; Current Research 2017-1; Geological Survey of Canada: Ottawa, ON, Canada, 2017; 13p.
  99. Mäkinen, J. Effects of grinding and chemical factors on the generation and composition of the till fine fraction: An experimental study. J. Geochem. Explor. 1995, 54, 49–62. [Google Scholar]
  100. Sanford, R.F.; Pierson, C.T.; Crovelli, R.A. An objective replacement method for censored geochemical data. Mathem. Geol. 1993, 25, 59–80. [Google Scholar] [CrossRef]
  101. Thompson, M.; Howarth, R.J. Duplicate analysis in geochemical practice, part 1. Theoretical approach and estimation of analytical reproductubility. Analyst 1973, 101, 690–698. [Google Scholar] [CrossRef]
  102. R_Project. The R Project for Statistical Computing. 2016. Available online: www.r-project.org/ (accessed on 4 March 2011).
  103. Garrett, R. The GSC Applied Geochemistry EDA Package. Version 1.12. Available online: http://gsc.nrcan.gc.ca/dir/index_e.php?id=4961 (accessed on 4 March 2011).
  104. Garrett, R.G. The ‘rgr’ package for the R Open Source statistical computing and graphics environment-a tool to support geochemical data interpretation. Geochem. Explor. Environ. Anal. 2013, 13, 355–378. [Google Scholar] [CrossRef]
  105. Kruskal, W.H.; Wallis, W.A. Use of ranks on one-criterion variance analysis. J. Am. Stat. Assoc. 1952, 47, 583–621. [Google Scholar] [CrossRef]
  106. Hollander, M.; Wolfe, D.A.; Chicken, E. Nonparametric Statistical Methods; John Wiley & Sons: Hoboken, NJ, USA, 2013; 828p. [Google Scholar]
  107. Dunn, O.J. Multiple comparisons using rank sums. Technometrics 1964, 6, 241–252. [Google Scholar] [CrossRef]
  108. Gibbons, J. Nonparametric Methods for Quantitative Analysis, 3rd ed.; Rinehart and Winston: New York, NY, USA, 1997; 853p. [Google Scholar]
  109. Kloke, J.D.; McKean, J.W. Rfit: Rank-based estimation for linear models. R J. 2012, 4, 57–64. [Google Scholar] [CrossRef]
  110. Turner, T.R. Estimating the propagation rate of a viral infection of potato plants via mixtures of regressions. J. R. Stat. Soc. Ser. C Appl. Stat. 2000, 49, 371–384. [Google Scholar] [CrossRef]
  111. Everitt, B.S.; Hand, D.J. Finite Mixture Distributions: Monographs on Applied Probability and Statistics; Chapman and Hall: London, UK, 1981; 85p. [Google Scholar]
  112. Titterington, D.M.; Smith, A.F.; Makov, U.E. Statistical Analysis of Finite Mixture Distributions; Wiley: New York, NY, USA, 1985; 243p. [Google Scholar]
  113. Harlov, D.E.; Förster, H.-J. Fluid-induced nucleation of (Y+ REE)-phosphate minerals within apatite: Nature and experiment. Part II. Fluorapatite. Am. Min. 2004, 88, 1209–1229. [Google Scholar] [CrossRef]
  114. Harlov, D.E.; Wirth, R.; Förster, H.-J. An experimental study of dissolution–reprecipitation in fluorapatite: Fluid infiltration and the formation of monazite. Contr. Min. Petro. 2005, 150, 268–286. [Google Scholar] [CrossRef]
  115. Budzyń, B.; Harlov, D.E.; Williams, M.L.; Jercinovic, M.J. Experimental determination of stability relations between monazite, fluorapatite, allanite, and REE-epidote as a function of pressure, temperature, and fluid composition. Am. Min. 2011, 96, 1547–1567. [Google Scholar] [CrossRef]
  116. Harlov, D.E.; Andersson, U.B.; Förster, H.-J.; Nyström, J.O.; Dulski, P.; Broman, C. Apatite–monazite relations in the Kiirunavaara magnetite–apatite ore, northern Sweden. Chem. Geol. 2002, 191, 47–72. [Google Scholar] [CrossRef]
  117. Harlov, D.E.; Wirth, R.; Hetherington, C.J. The relative stability of monazite and huttonite at 300–900 C and 200–1000 MPa: Metasomatism and the propagation of metastable mineral phases. Am. Min. 2007, 92, 1652–1664. [Google Scholar] [CrossRef]
  118. Bonyadi, Z.; Davidson, G.J.; Mehrabi, B.; Meffre, S.; Ghazban, F. Significance of apatite REE depletion and monazite inclusions in the brecciated Se–Chahun iron oxide–apatite deposit, Bafq district, Iran: Insights from paragenesis and geochemistry. Chem. Geol. 2011, 281, 253–269. [Google Scholar] [CrossRef]
  119. Normandeau, P.X.; McMartin, I.; Paquette, J.; Corriveau, L.; Montreuil, J.-F. Geochemical signatures of IOCG mineralization and alteration in till. In Proceedings of the Goldschmidt 2012, Conference Abstracts, Montréal, QC, Canada, 23–28 June 2012. [Google Scholar]
Figure 2. (A) Bedrock geology of the Sue Dianne deposit area and sample location, after Camier [62]; (B) geology of the Fab system area and sample location, modified from Potter et al. [56], Gandhi [65] and Jackson [66]. Generalized ice flow directions are shown (the orientation in green is younger and predominant).
Minerals 14 00547 g002
Figure 3. (A) Supracrustal rocks forming bedrock ridges with thin till cover near the NICO deposit; (B) intrusive rocks in the foreground covered by a continuous till cover with supracrustal bedrock ridges near the NICO deposit in the background; (C) Phase 2 surface striated to the SW preserved on the lee side of dominant Phase 3 surface striated to the WSW near Gamèti; (D) hand-dug hole in till collected from C-horizon at sample site near the Sue Dianne deposit.
Minerals 14 00547 g003
Figure 4. Simplified interpretation of ice-flow directions and relative ages within the GBMZ (modified from Normandeau and McMartin [67]). Regional surficial geology after Aylsworth and Shilts [70] and Fulton [71]. Undifferentiated and unmapped areas are mostly covered by till.
Minerals 14 00547 g004
Figure 5. Tukey boxplot (dots = outliers, box = Q1 and Q3, horizontal line = median, whiskers = 1.5 interquartile range) of the lithogeochemistry data from mineralized (n = 107) and GBMZ background (n = 215) samples, in order of highest to lowest contrast between element medians (* with Na, K, La, and Th having higher medians in the background). Highest contrasts represent elements most likely to be anomalous in till collected down-ice from IOA/IOCG/MI Co mineralization zones and deposits within the GBMZ.
Minerals 14 00547 g005
Figure 6. (A) Copper content in the clay-sized fraction (<0.002 mm) of till C-horizon as determined by modified aqua regia/ICP-MS in the Sue Dianne and Fab areas as an example of the base metal distribution; (B) La, (C) Th, and (D) U contents in the silt and clay-sized fraction (<0.063 mm) of C-horizon till determined by 4-acid/ICP-MS as examples of lithophile element distribution.
Minerals 14 00547 g006aMinerals 14 00547 g006bMinerals 14 00547 g006cMinerals 14 00547 g006d
Figure 7. (A) Bi-plots of modified aqua regia (partial digestion) and 4-acid (near total digestion) in the <0.063 mm fraction of till samples collected in the Sue Dianne area for As, La, Th, and U; (B) mixture of regression models discriminating two sample populations based on linear regressions for La and Th (line: regression, red and blue dark envelope: 95% confidence interval, red and blue pale envelope: prediction band).
Minerals 14 00547 g007
Figure 8. (A) Lanthanum, and (B) Th ratios of 4-acid (near total digestion) concentrations over modified aqua regia (partial digestion) concentrations within the silt and clay-sized fraction (<0.063 mm) of till C-horizon in the Sue Dianne system area.
Minerals 14 00547 g008
Table 1. Number of samples.
SystemTillBedrock
Down-Ice *Up-Ice **BackgroundTotalMineralizedNon-MineralizedTotal
Sue Dianne 1011930256388
Fab132823102030
Other MIAC systems25--2572302374
GBMZ host rock--99-215215
Slave Craton and Wopmay metamorphic zone--55---
* Down-ice distances varies from 200 to 2000 m; ** Up-ice distances are less than 200 m at Sue Dianne system and less than 500 m at Fab system.
Table 2. Kruskal–Wallis test results discriminating populations within the lithogeochemistry datasets at the 95% confidence level. Populations can be distinguished based on a relatively higher (H) or lower (L) median with respect to the median of the second population; (-) indicates where populations cannot be distinguished. Population tested refers to the various sample subsets presented in Table 1.
Population TestedNaKCaVCrMnFeCoNiCuAsMoLaYbWBiThU
Mineralized samples vs. GBMZ host rockL-----HHHHHH--HHLH
All of Sue Dianne system vs. GBMZ host rockHHL-----L-H-H-HHHH
Mineralized vs. non-mineralized samples in the Sue Dianne systemL-----HH-H-H-LHHLH
All of Fab system samples vs. GBMZ host rockL-H-------H-HH--HH
Mineralized vs. non-mineralized samples in the Fab system---------H--------
Table 3. Concentrations of selected elements in the <0.063 mm and the <0.002 mm fractions of till samples analyzed by ICP-MS after a 4-acid digestion and by ICP-MS after a modified aqua regia digestion, respectively. Values higher than the median background plus 2 standard deviations are in bold and values lower than the median background minus 2 standard deviations are in italic. Distances down-ice are measured with respect to the Sue Dianne deposit and Fab showings, parallel to predominant ice-flow direction (WSW).* For W, results are from ICP-MS after a modified aqua regia digestion on the <0.063 mm fraction due to reliability issues within the <0.002 mm fraction for that element.
SettingSample(s)NaKCaFeCoLaYbThUW *NiCuAsMoBi
ppmppmppmppmppmppmppmppmppmppmppmppmppmppmppm
ICP-MS after a 4-Acid DigestionICP-MS after an Aqua Regia Digestion
<0.063 mm Fractions <0.002 mm Fraction
MIAC showings within the GBMZMedian (n = 25)20,10025,60010,40021,8008.537.41.715.63.80.7043.481.38.61.21.9
Hottah Lakemedian (n = 8)22,08526,25014,40021,2508.240.61.815.33.00.7033.462.96.10.71.4
Stew Zone (NICO area)09MOB03719,18020,10010,40025,7009.336.01.214.63.80.5061.042.28.30.41.2
LCL09MOB04323,39022,40012,20019,20012.230.31.413.72.80.5085.385.225.71.01.5
UR09MOB04120,42022,20010,00018,5005.631.32.022.97.10.9027.255.312.63.42.4
Dry10CQA2061A214,52025,600840020,9009.341.62.015.65.60.2041.975.06.81.52.7
DV-310CQA2034A215,83029,200960049,40016.169.92.730.66.40.5049.082.119.71.91.0
DV-810CQA2031A218,48029,80010,50036,60012.677.22.429.66.90.9053.7124.629.54.02.0
Grouard Lake South10CQA2041A216,65029,70010,20033,40010.683.44.334.116.02.7034.9274.56.34.63.4
Jackpot-McPhoo10CQA2052A216,36023,200870036,50014.033.71.412.23.80.2054.244.816.41.72.1
Jackpot-McPhoo10CQA2055A218,23022,700980029,20012.641.11.513.54.10.2062.785.914.42.11.6
MRB09MOB03220,34023,50011,10016,7005.826.61.310.62.30.4061.081.311.70.60.9
HS-1 (NICO area)09MOB03019,69024,500980029,90013.036.11.218.92.50.9083.1161.242.10.72.6
OUR (NICO area)09MOB03622,86020,20012,10017,6007.036.31.213.22.10.4050.1128.337.21.62.8
Lou Lake (NICO area)09MOB03820,10021,500860020,2006.029.11.111.82.30.2030.936.712.00.91.7
Rainy Lake 1 (Terra mine area)10CQA2046A219,59027,200970025,8009.032.01.713.03.00.8049.3175.225.92.43.5
UR09MOB04018,87022,000800022,9007.845.82.532.717.71.1028.959.48.60.61.6
Torrie Lake-Unnamed10CQA2059A215,08026,900810029,20010.656.52.520.48.90.5047.2170.36.91.22.8
Tatie09MOB04517,23025,600840019,4005.331.62.016.96.80.9020.129.45.51.21.3
GBMZ background and other samples
GBMZ backgroundMedian (n = 9)18,84024,90011,40025,7008.741.02.016.03.30.6038.276.08.81.11.6
Standard dev.23322819184842682.15.60.32.52.40.309.224.83.81.70.3
Slave Craton and east of the Wopmay fault zoneMedian (n = 5)23,76023,20013,40025,1009.034.01.016.03.00.251.066.010.01.00.9
Sue Dianne deposits and local backgroundMedian (n = 30)21,52022,75011,10024,00011.238.21.316.23.00.2067.188.110.80.80.9
Down-ice (<200 m)09MOB002706013,600410028,1005.434.31.310.56.90.3020.01189.09.112.14.5
Down-ice (<500 m)09MOB02121,58025,50012,40031,80015.043.01.316.73.80.2077.4114.98.60.70.7
Down-ice (<500 m)09MOB02212,49023,800910052,20043.260.41.716.59.40.6093.8347.914.92.32.8
Down-ice (<500 m)09MOB02323,66023,50014,00023,8009.637.91.614.93.10.2068.0103.19.50.30.9
Down-ice (<500 m)09MOB02421,79024,00012,60030,60014.941.71.318.54.20.2073.5173.19.50.61.0
Down-ice (<1000 m)09MOB02522,59023,50014,10024,00011.032.11.413.02.30.2048.851.47.90.61.0
Down-ice (<1000 m)09MOB02618,40021,800960035,60012.730.91.110.52.30.3050.380.826.82.42.2
Down-ice (<1000 m)09MOB02718,94023,30010,50031,50013.240.01.317.93.10.3074.292.912.90.71.8
Down-ice (<1000 m)09MOB02820,19024,30010,80022,7008.943.61.315.93.00.2054.949.38.00.50.7
Down-ice (<1000 m)09MOB02916,40027,800900033,50015.034.41.415.53.00.4074.695.513.52.01.1
Up-ice (<200 m)09MOB00121,81020,40011,30021,10012.132.11.217.62.40.30138.9111.228.51.71.4
Sue Dianne deposit local background
Marian River BatholithMedian (n = 7)21,70022,00012,00022,5008.431.91.215.73.00.2062.769.39.60.80.8
Undifferentiated porphyryMedian (n = 9)21,64022,60010,90023,3009.834.91.216.52.50.2057.185.310.90.81.0
Undifferentiated volcanicMedian (n = 3)21,46021,50012,10023,30011.344.01.618.73.30.3070.990.614.81.00.9
Fab system and local backgroundMedian (n = 23)21,52022,75011,10024,00011.238.21.316.23.00.5062.478.29.62.01.0
Down-ice (<200 m)09MOB04211,78013,40010,20051,60013.940.21.817.88.11.3027.657.117.017.43.0
Down-ice (<250 m)10CQA2016A218,43026,00011,90034,50013.356.81.921.55.10.5065.4435.412.42.71.1
Down-ice (<250 m)10CQA2019A2825013,300500022,8007.544.91.519.49.80.9024.294.14.84.90.9
Down-ice (<250 m)10CQA2021A2532011,800370011,7002.926.21.19.54.21.406.7318.13.47.70.7
Down-ice (<300 m)10CQA2007A217,30027,00010,80028,3008.649.61.918.84.60.3048.461.57.07.90.8
Down-ice (<500 m)10CQA2003A217,11024,30010,90028,8009.740.11.415.75.70.4043.343.94.65.61.1
Down-ice (<500 m)10CQA2004A217,58023,10010,80032,90013.933.81.213.92.90.5067.878.219.43.41.3
Down-ice (<500 m)10CQA2008A220,81028,10013,90029,60011.751.32.019.03.60.7069.0130.316.83.92.2
Down-ice (<500 m)10CQA2015A2941014,600720062,50035.731.51.115.13.81.3036.868.69.214.72.8
Down-ice (<2000 m)10CQA200916,06025,60012,95043,80019.953.01.622.58.90.5062.446.96.20.90.6
Down-ice (<2000 m)10CQA2011A218,50024,10011,10028,7009.831.61.312.52.40.4065.646.814.82.31.1
Down-ice (<2000 m)10CQA2012A120,54027,00014,30025,90011.436.91.615.52.90.5051.827.25.22.00.7
Down-ice (<2000 m)10CQA2022A216,37029,40013,10037,10018.065.02.222.89.20.3064.857.85.30.50.6
Up-ice (<500 m)Average (n = 2)20,59524,85012,70029,00012.359.12.219.44.50.4556.266.08.20.90.8
Fab system local background
Undifferentiated porphyryMedian (n = 3)19,39025,60013,90026,90011.171.22.127.35.60.6061.1111.717.02.01.2
Undifferentiated graniteMedian (n = 5)17,76028,00010,50039,60017.351.71.622.15.30.3077.196.310.21.51.0
Table 4. Kruskal–Wallis test results discriminating populations within the till geochemistry at 90% confidence interval. Samples collected down-ice of an IOA/IOCG/Mi-Co deposit or showing can be distinguished based on a higher (H) or lower (L) median value than the median background value; (-) indicates where populations cannot be distinguished and (na) indicates where results are not available for the specific element and analytical technique.
Population TestedDigestion Method
and Size Fraction
NaKCaFeCoNiCuAsMoLaYbWBiThU
Sample collected down-ice of all showings or deposits (from <200 m to <2000 m), tested against all background samplesaqua regia, <0.063 mmna H-----na--HH--
4 acid, <0.063 mmL-------na--na--H
aqua regia, <0.002 mm--H-LL----nanaHL-
Samples collected down-ice of the Sue Dianne deposit (from <200 m to <1000 m), tested against the local backgroundaqua regia, <0.063 mmnaH-H--HHna---H--
4 acid, <0.063 mmLH-H--H-na--nana--
aqua regia, <0.002 mmLHHH------nanaHL-
Samples collected down-ice of the Fab system (from <500 m to <2000 m, tested against the local backgroundaqua regia, <0.063 mmna-------naLL--L-
4 acid, <0.063 mm--------naL-nanaL-
aqua regia, <0.002 mmLL--LLLL-Lnana-LL
Table 5. Spearman r and probability of acceptance (p) of rank-based correlation between modified aqua regia (partial digestion) and 4-acid (near total digestion) results in the <0.063 mm fraction of till.
Rank Based Regression AnalysisKCaFeCoNiCuAsLaThU
rprprprprprprprprprp
All samples (n = 92)<0.60>0.990.66>0.990.99>0.990.99>0.990.98>0.990.99>0.990.88>0.990.91>0.990.88>0.990.97>0.99
GBMZ background (n = 9)<0.60<0.95<0.6<0.951.00>0.991.00>0.990.95>0.990.95>0.990.83>0.990.78>0.990.92>0.990.98>0.99
Within other MIAC system (n = 25)<0.600.990.61>0.990.98>0.990.97>0.990.94>0.990.98>0.990.77>0.990.96>0.990.97>0.990.98>0.99
Sue Dianne deposit local background (n = 19)<0.600.990.84>0.990.97>0.990.98>0.990.98>0.990.99>0.990.95>0.990.94>0.990.91>0.990.96>0.99
Down-ice of Sue Dianne deposit (n = 10)0.620.97<0.6<0.950.98>0.990.96>0.991.00>0.991.00>0.991.00>0.990.92>0.990.87>0.990.99>0.99
Fab system local
background (n = 8)
0.62<0.950.99>0.991.00>0.990.96>0.991.00>0.990.99>0.990.95>0.990.95>0.990.88>0.990.99>0.99
Down-ice of Fab system
(n = 13)
0.83>0.990.85>0.990.98>0.990.96>0.990.98>0.990.93>0.990.86>0.990.97>0.990.86>0.991.00>0.99
Disclaimer/Publisher’s Note: The statements, opinions and data contained in all publications are solely those of the individual author(s) and contributor(s) and not of MDPI and/or the editor(s). MDPI and/or the editor(s) disclaim responsibility for any injury to people or property resulting from any ideas, methods, instructions or products referred to in the content.

