
Investigation of Viscoelastic-Plastic Properties of Fresh Cemented Gangue Fly Ash Backfill Slurries

Abstract
1. Introduction
2. Materials and Methods
2.1. Materials
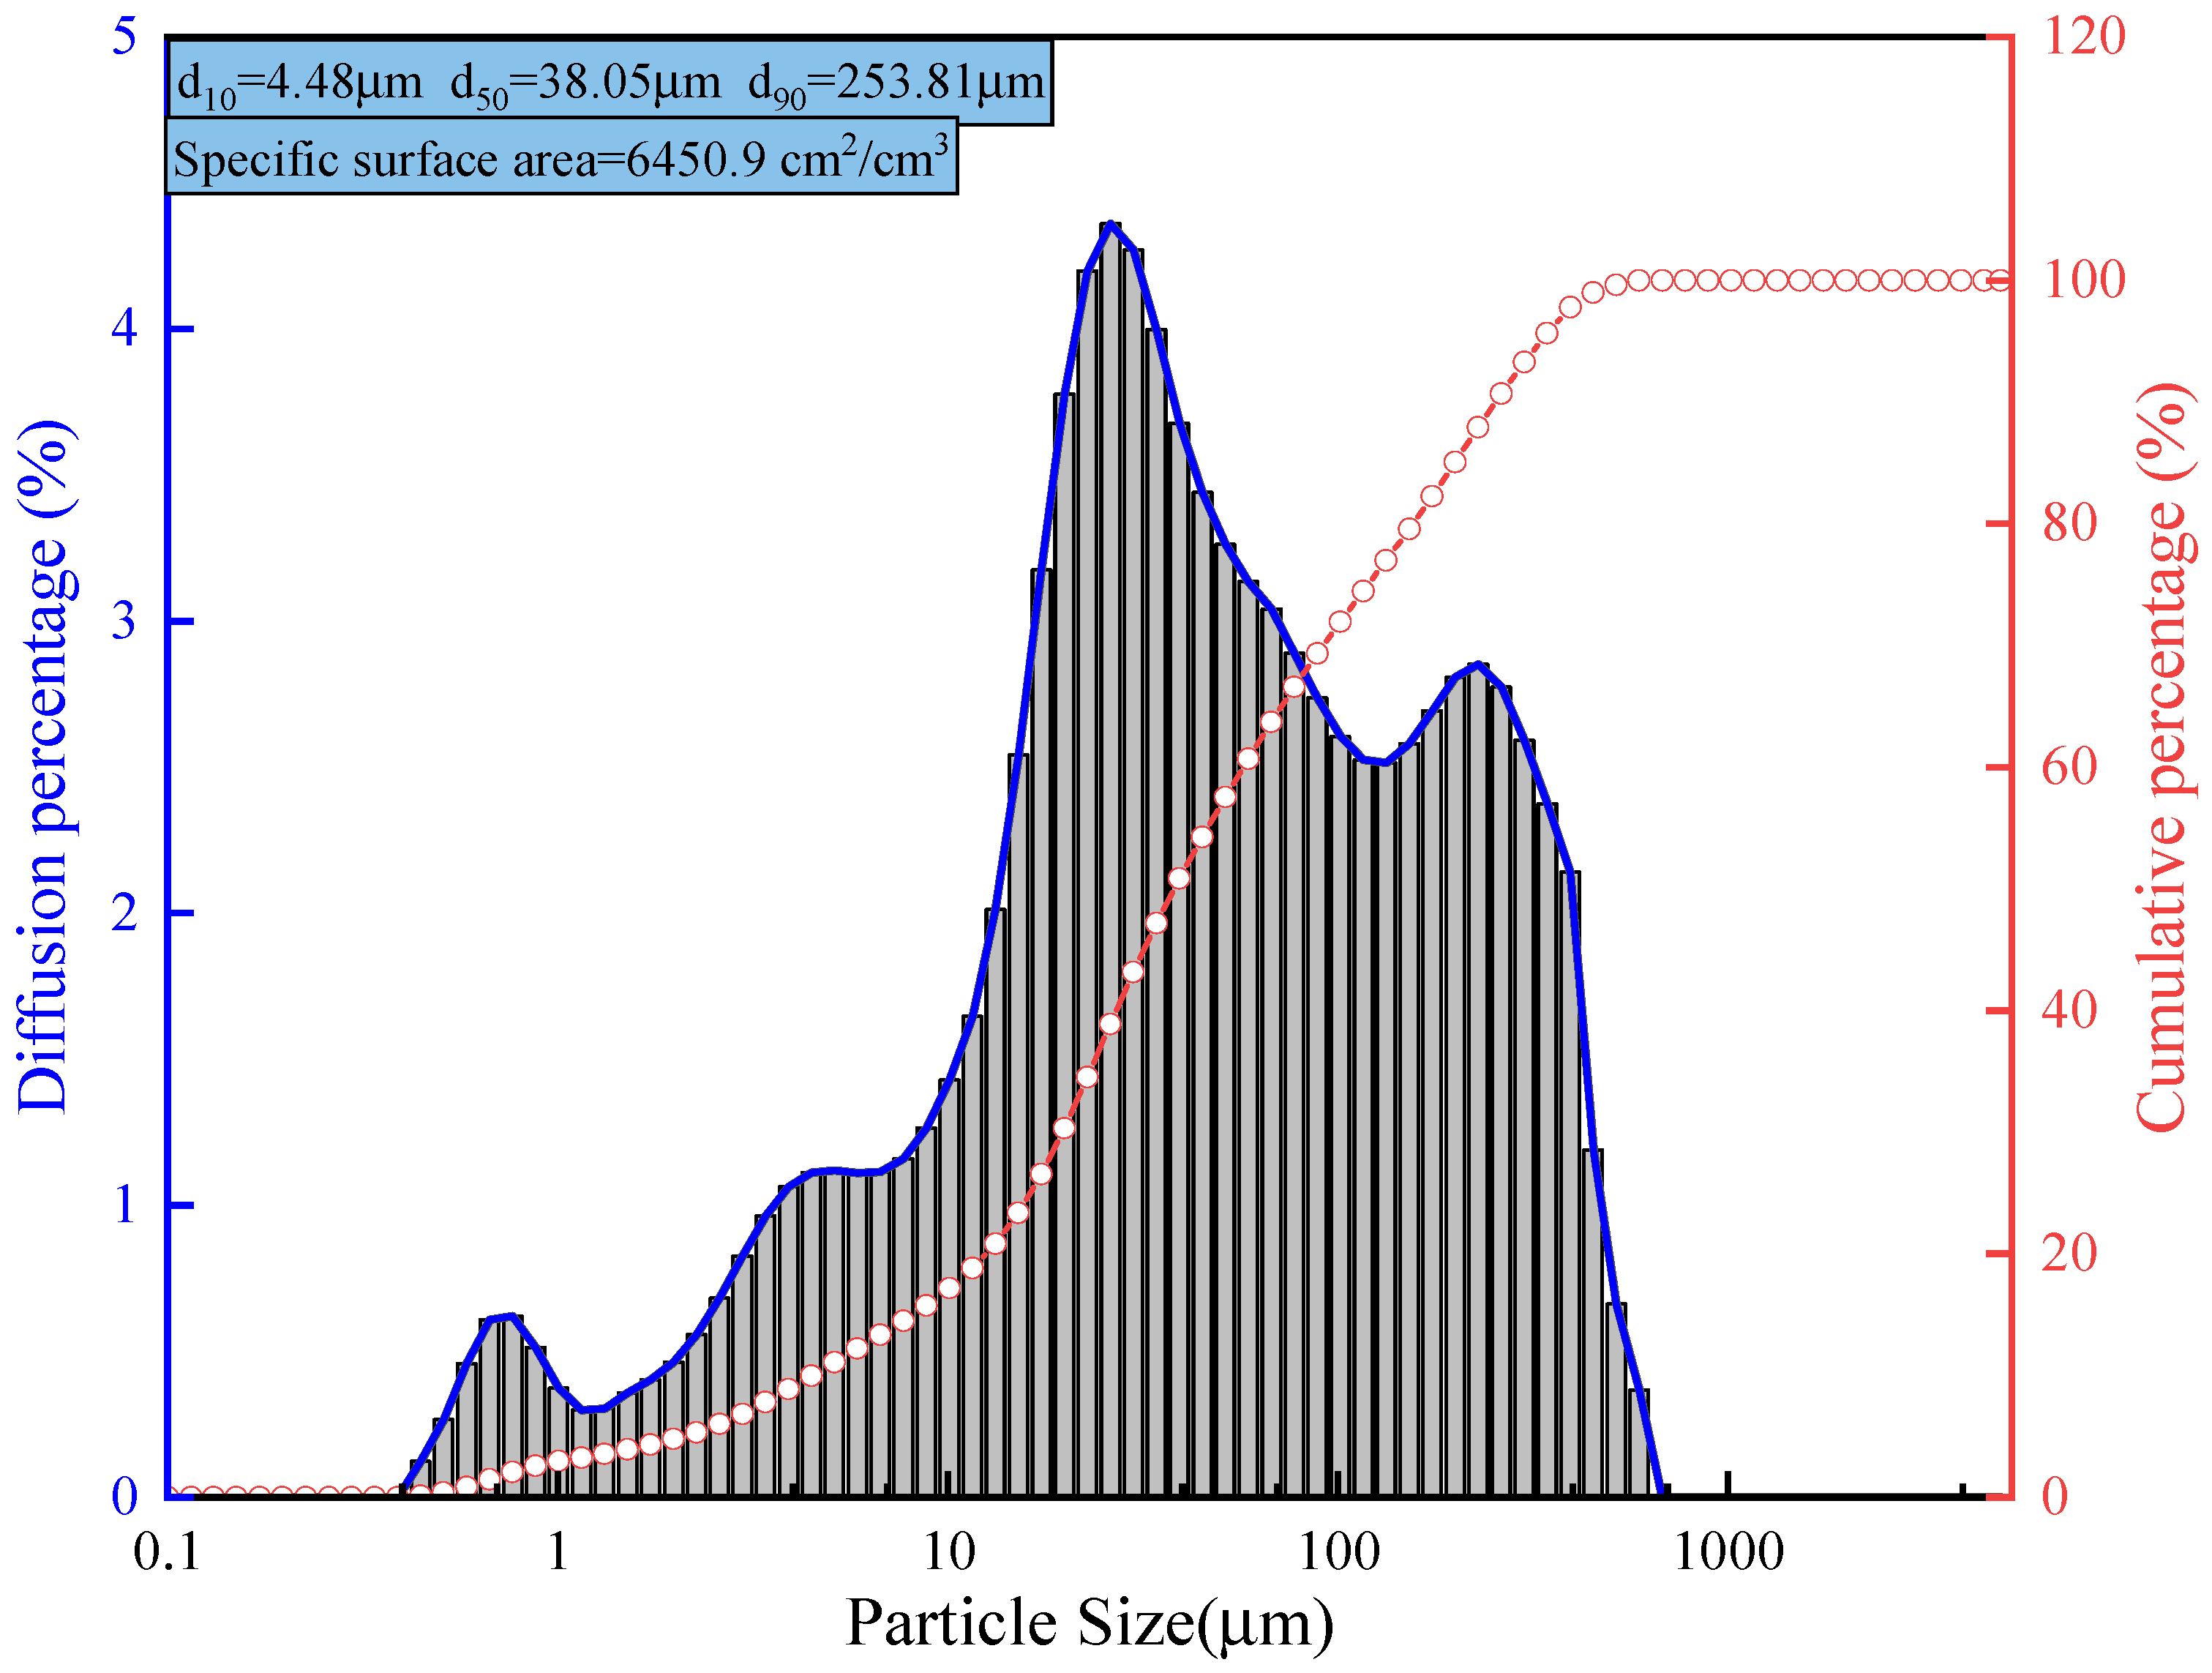
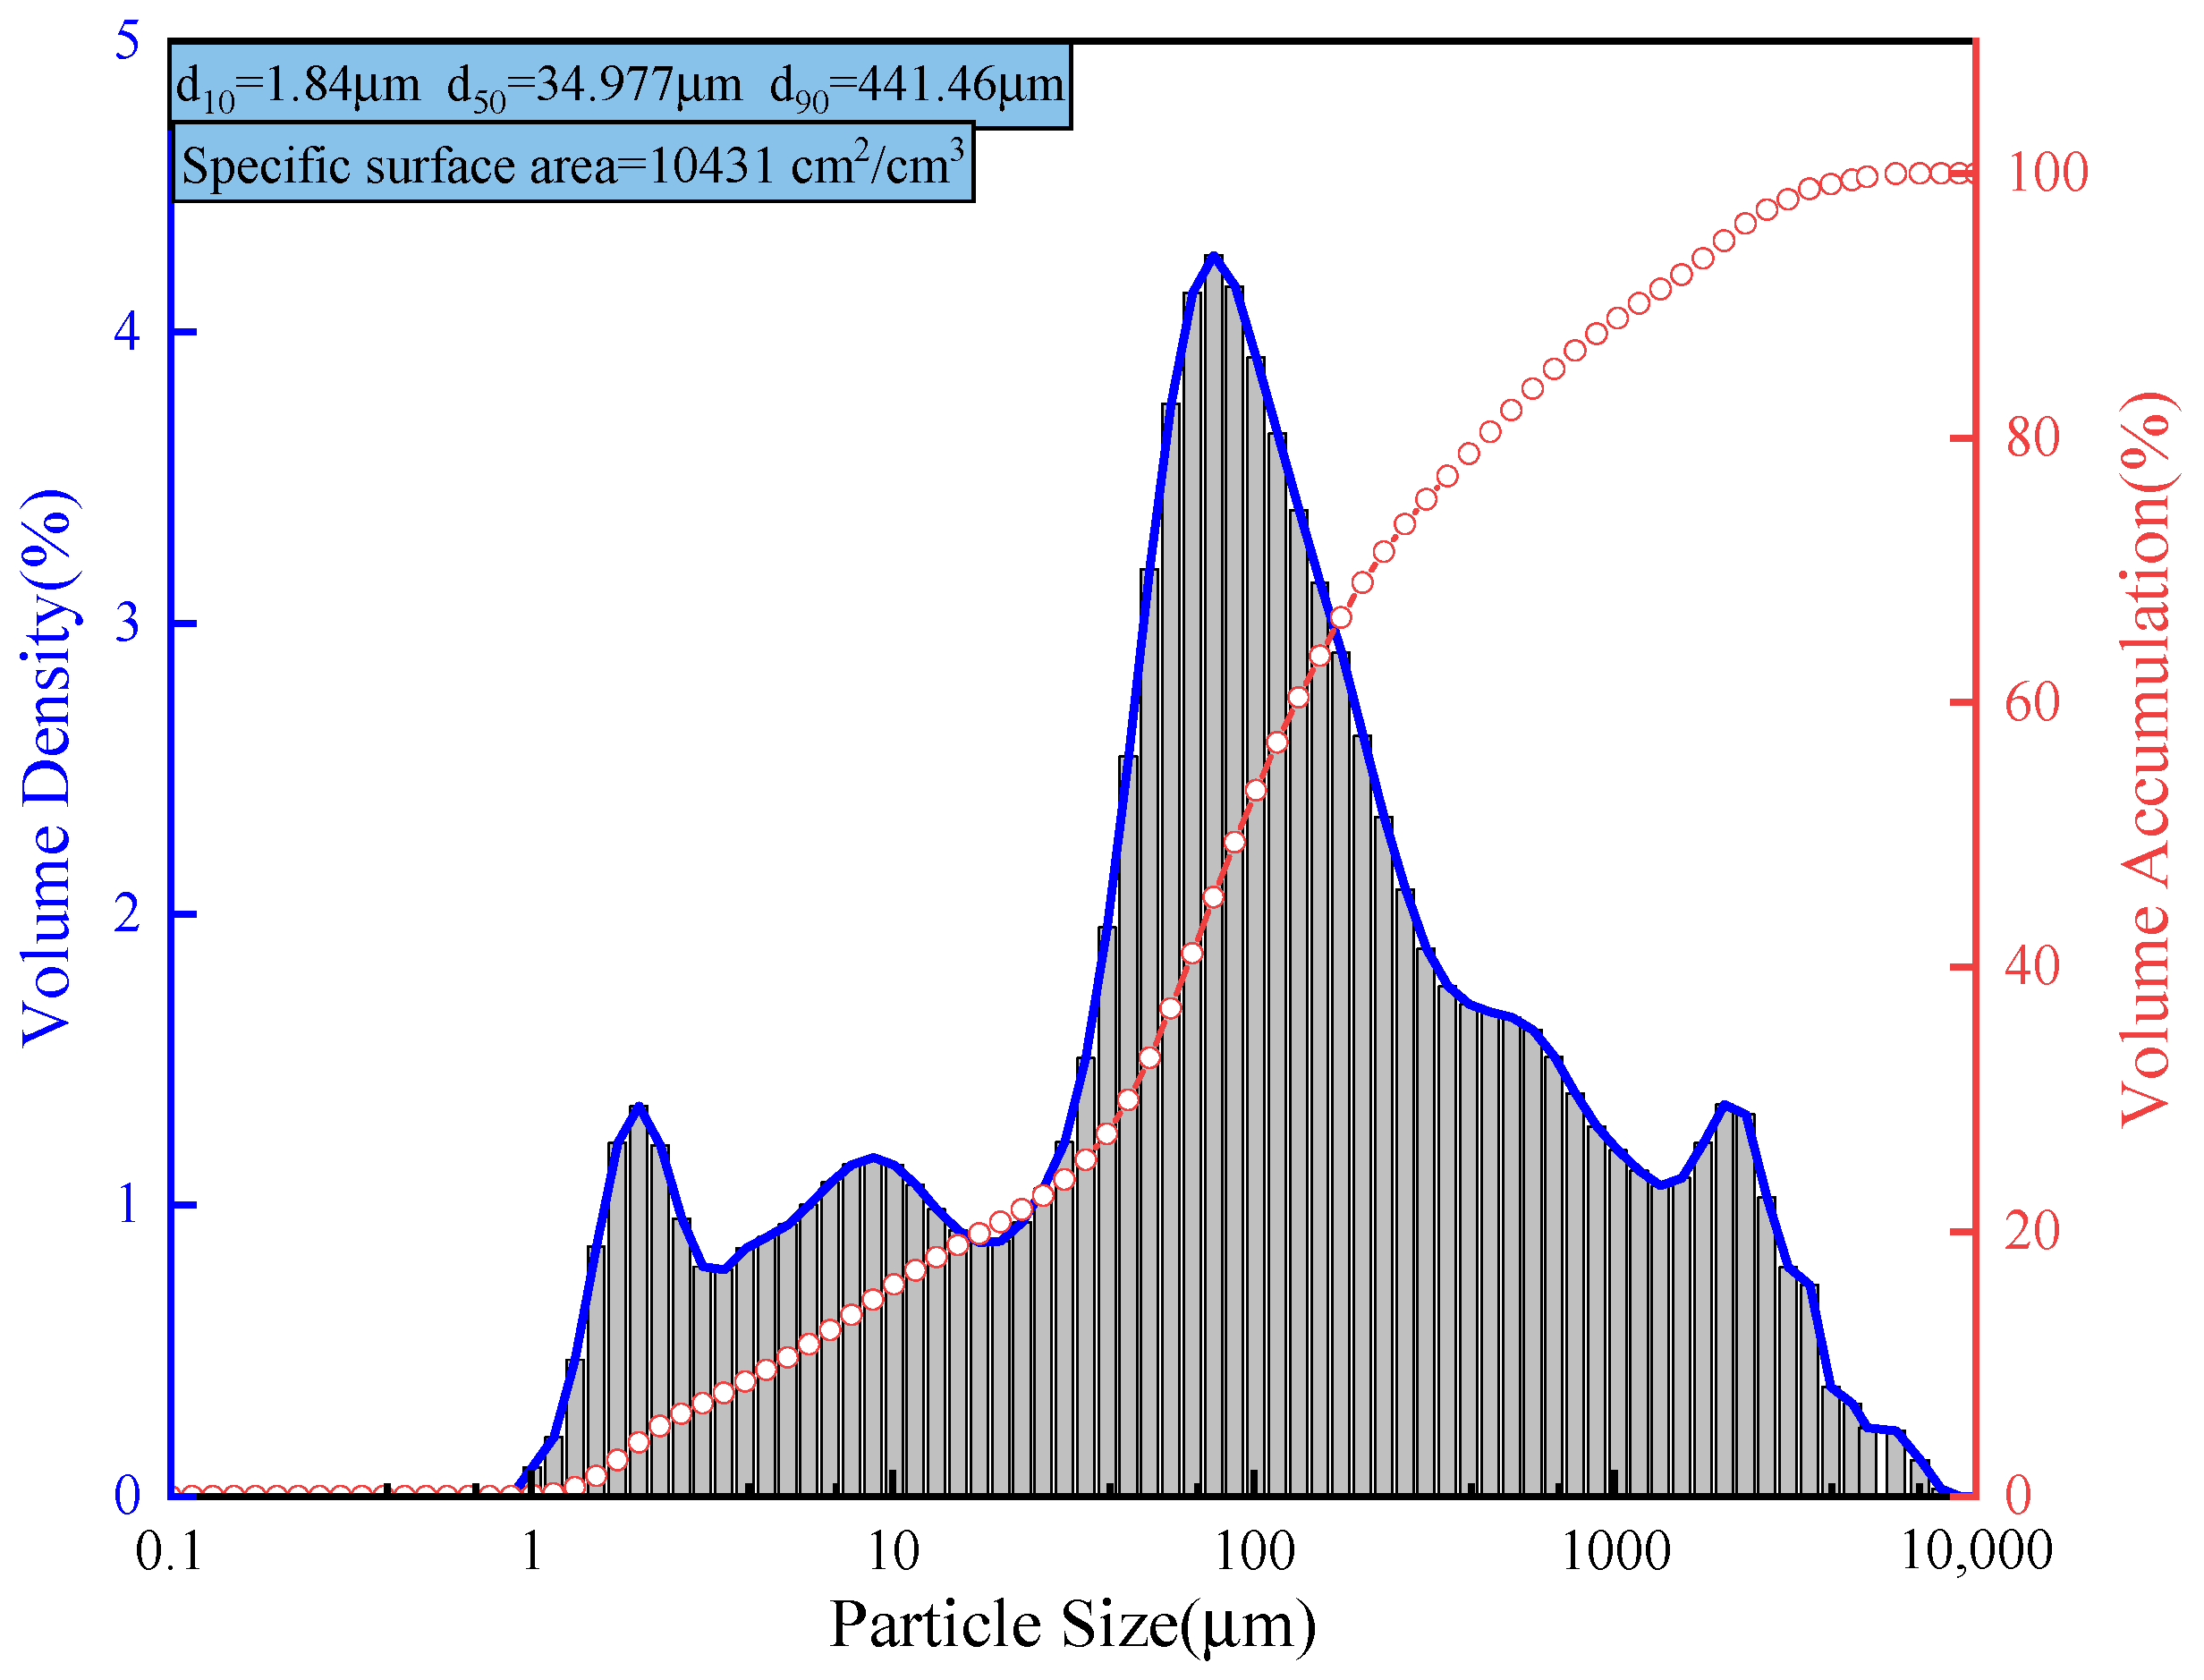
2.1.1. Gangue
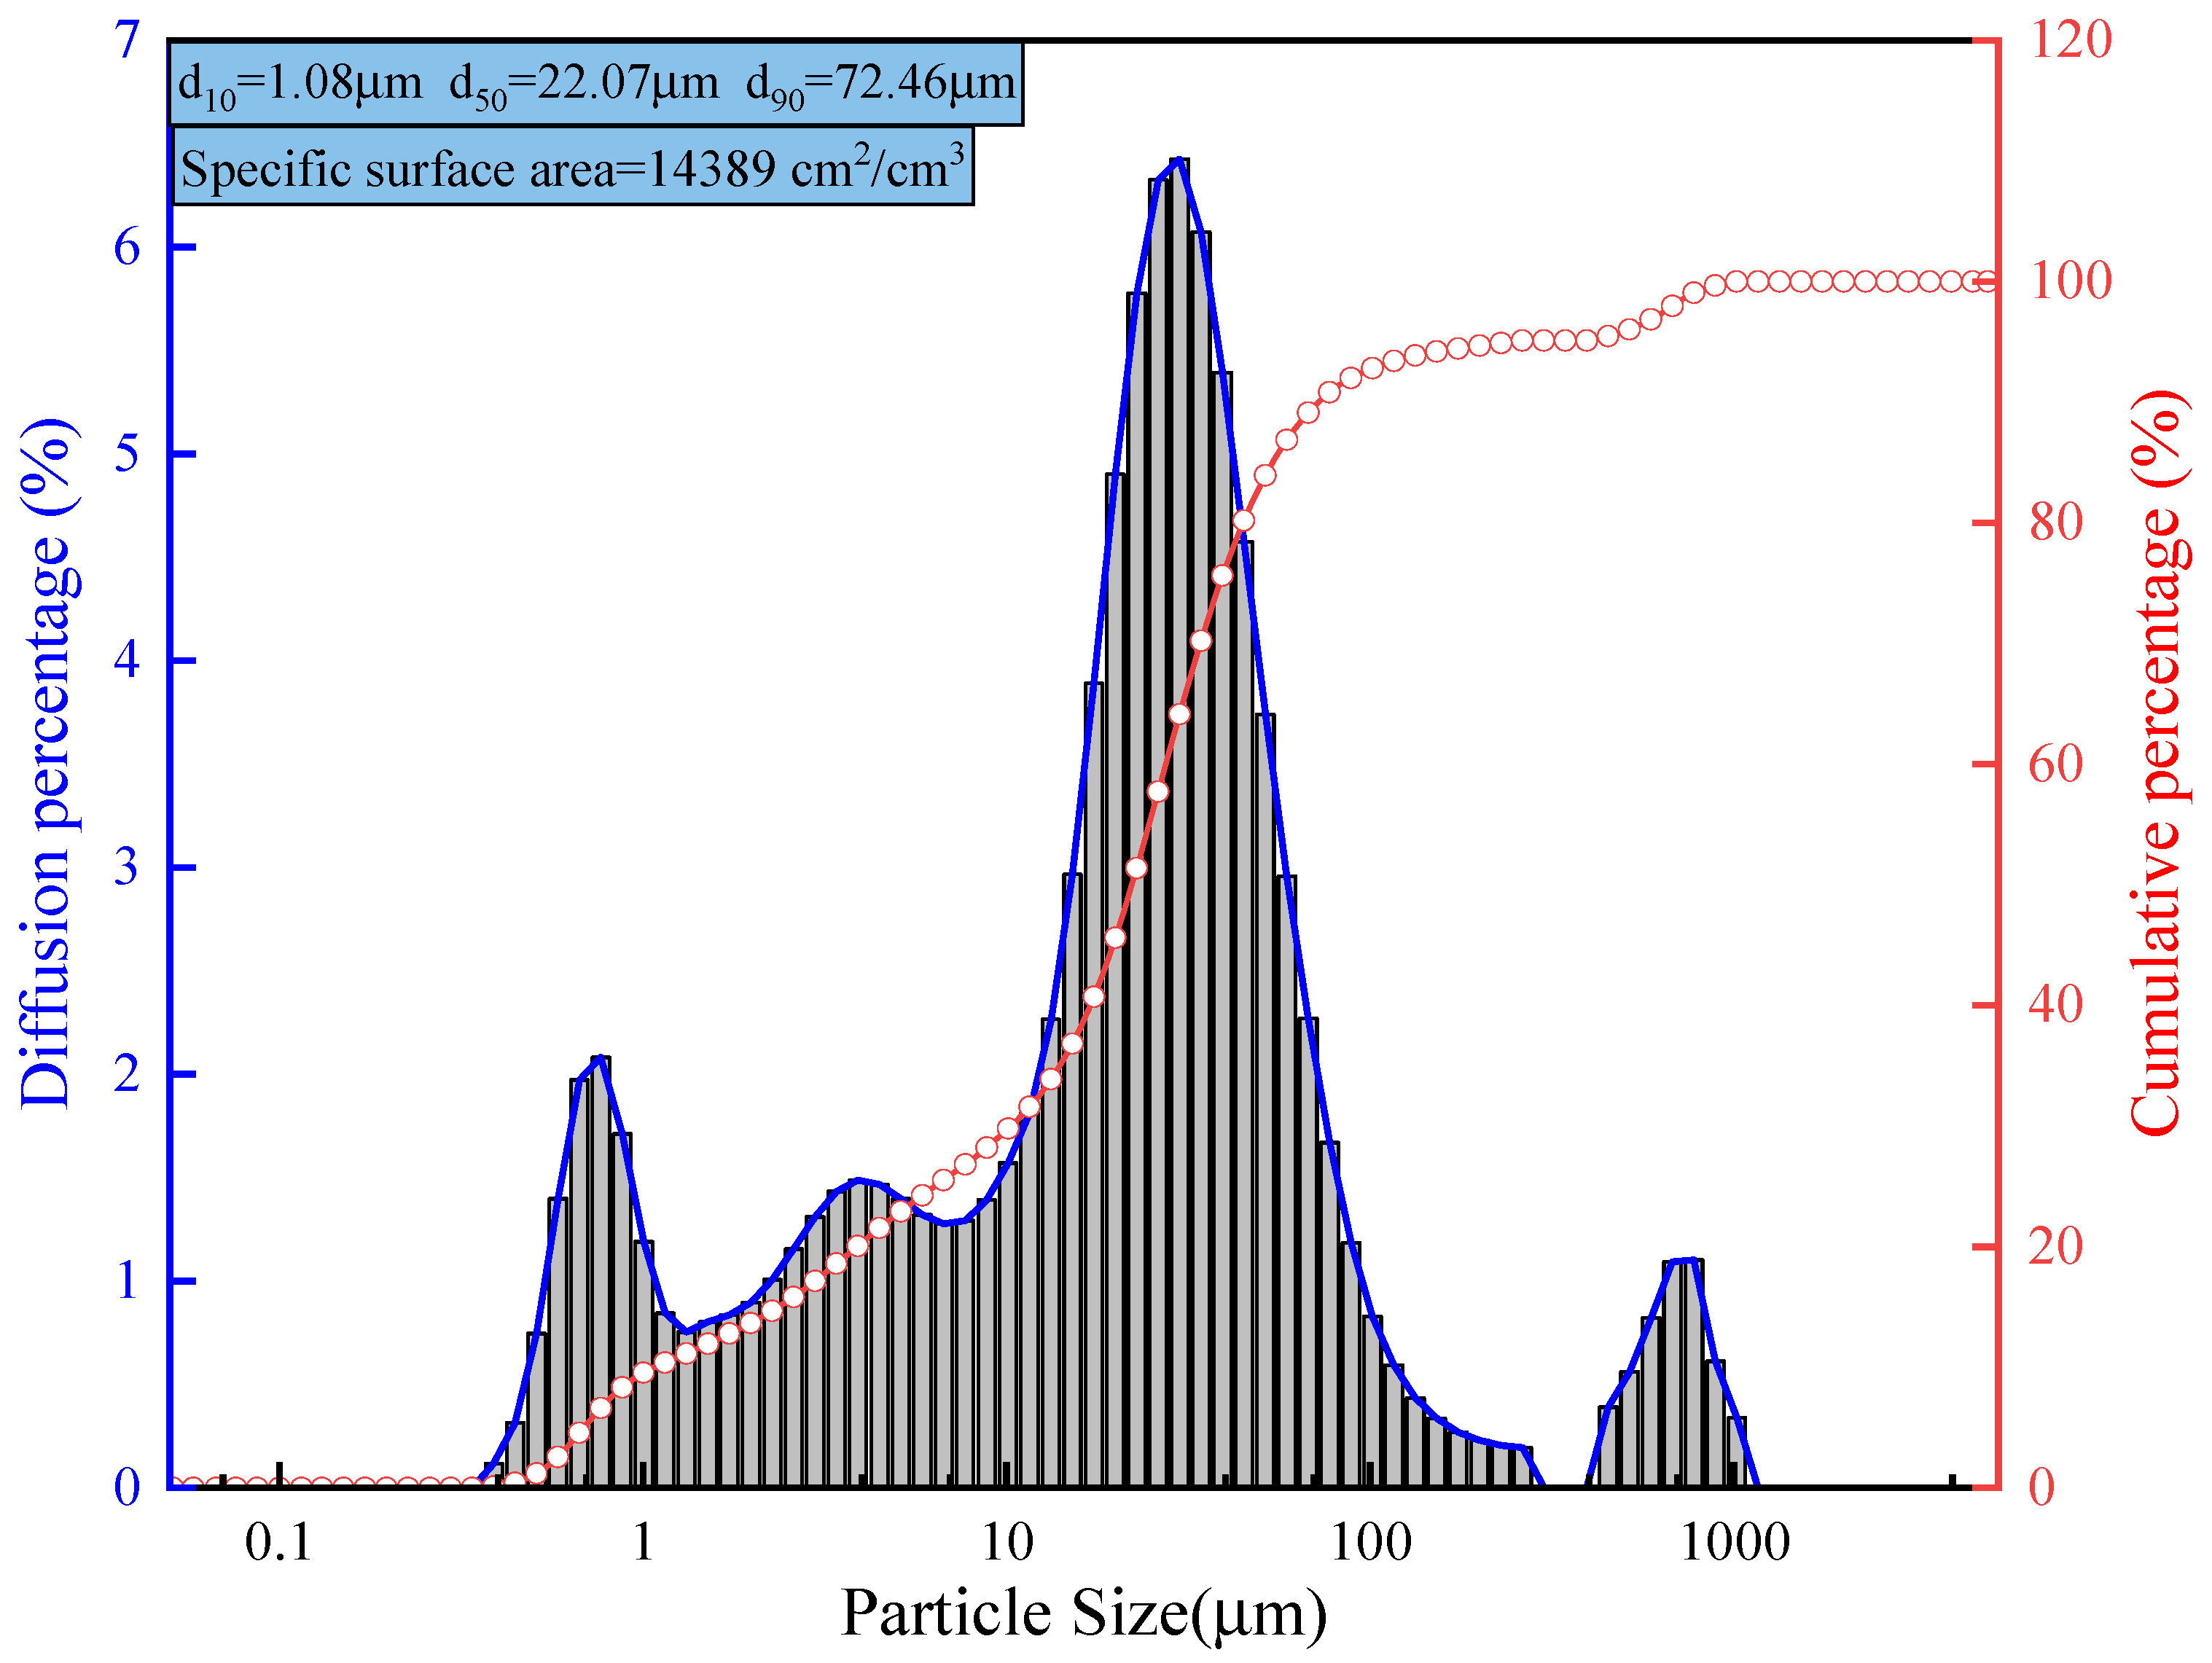
2.1.2. Fly Ash
2.1.3. Binder
2.1.4. Water
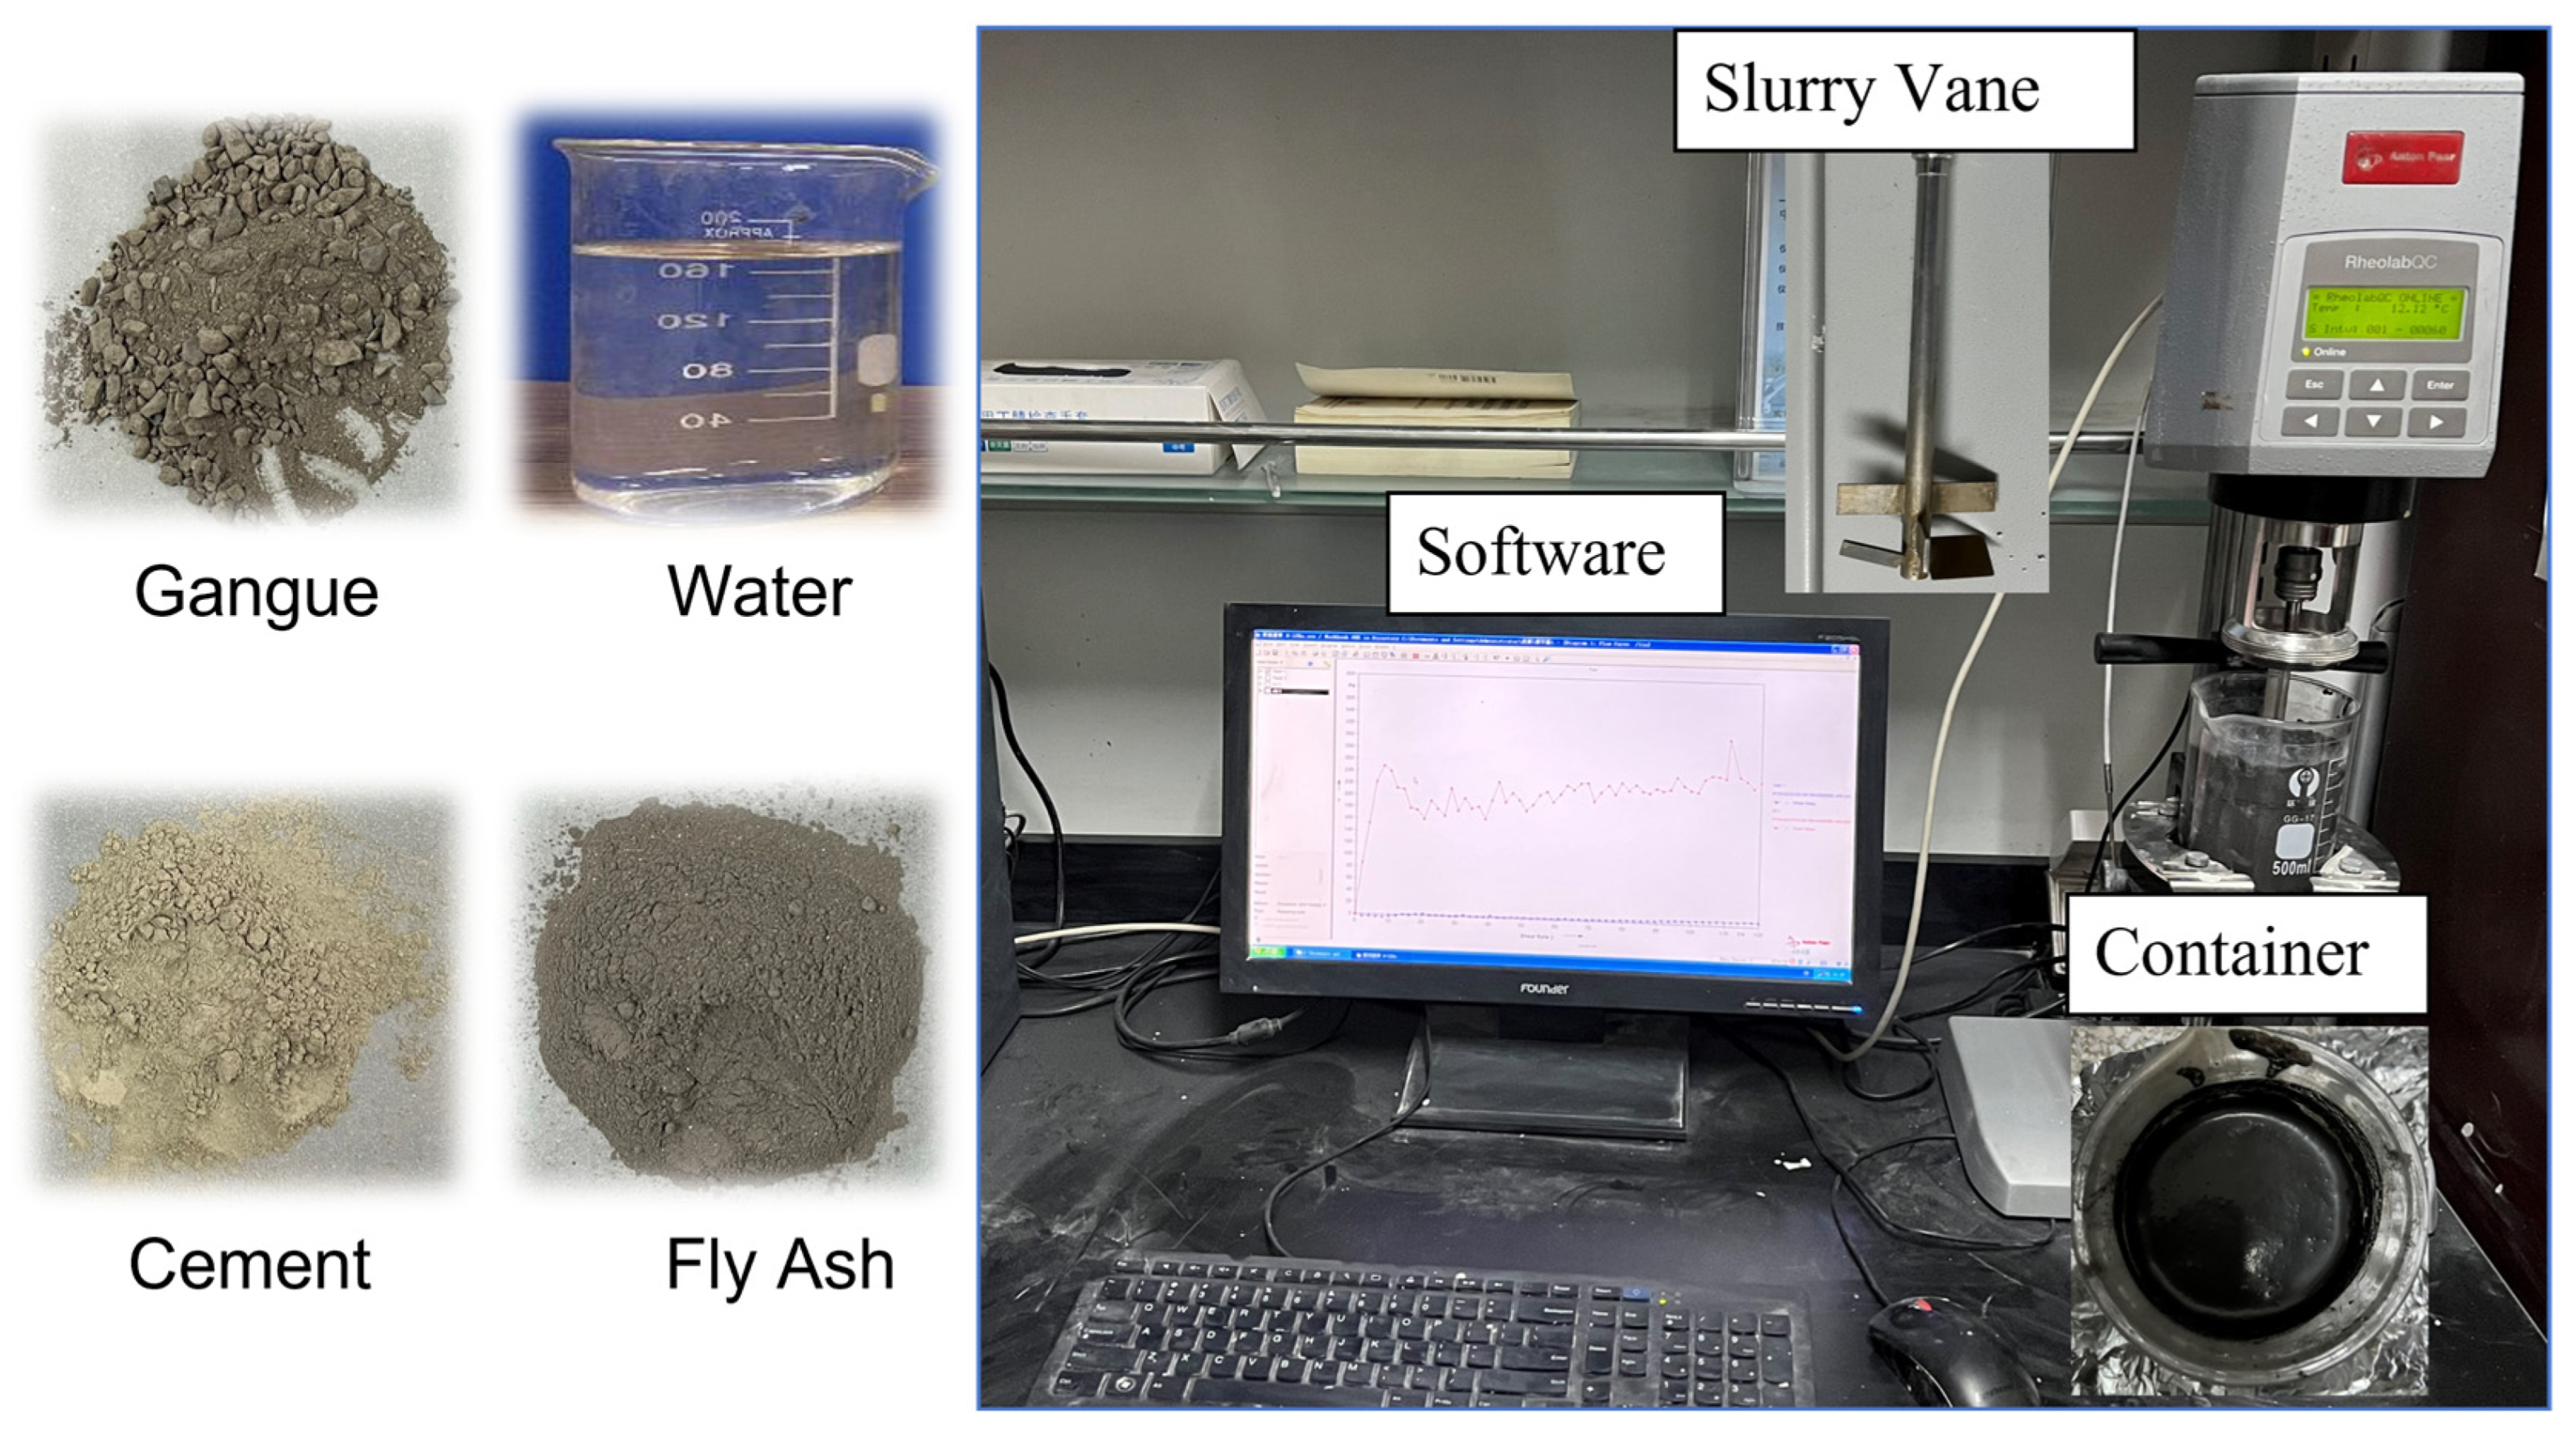
2.2. Samples Preparation
2.3. Apparatus and Experimental Procedures
2.3.1. Viscosity-Yield Stress Testing
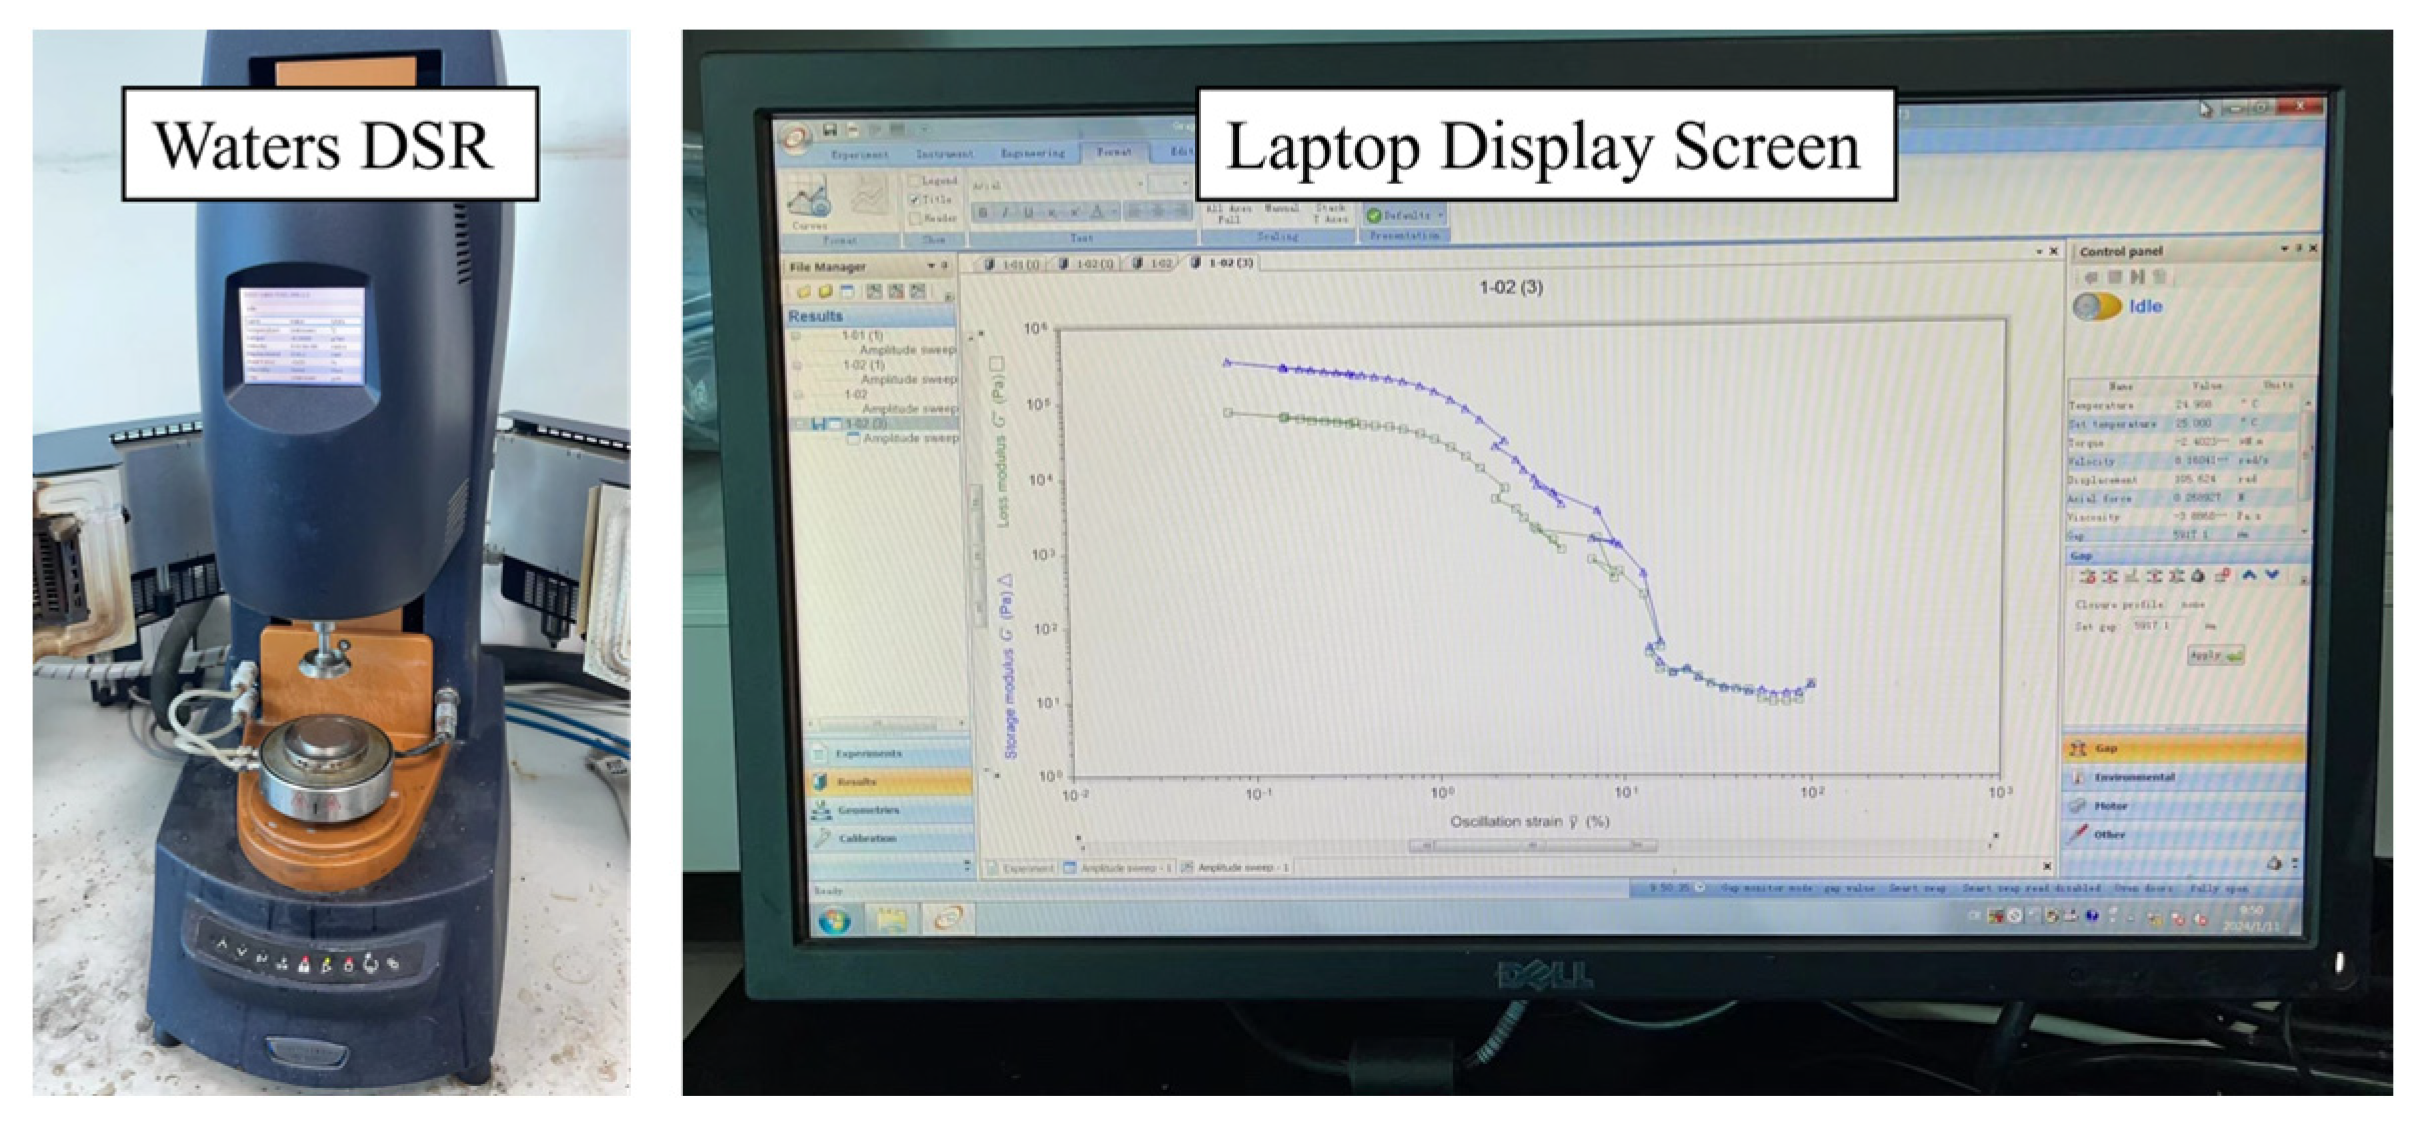
2.3.2. Dynamic Shear Rheological Test
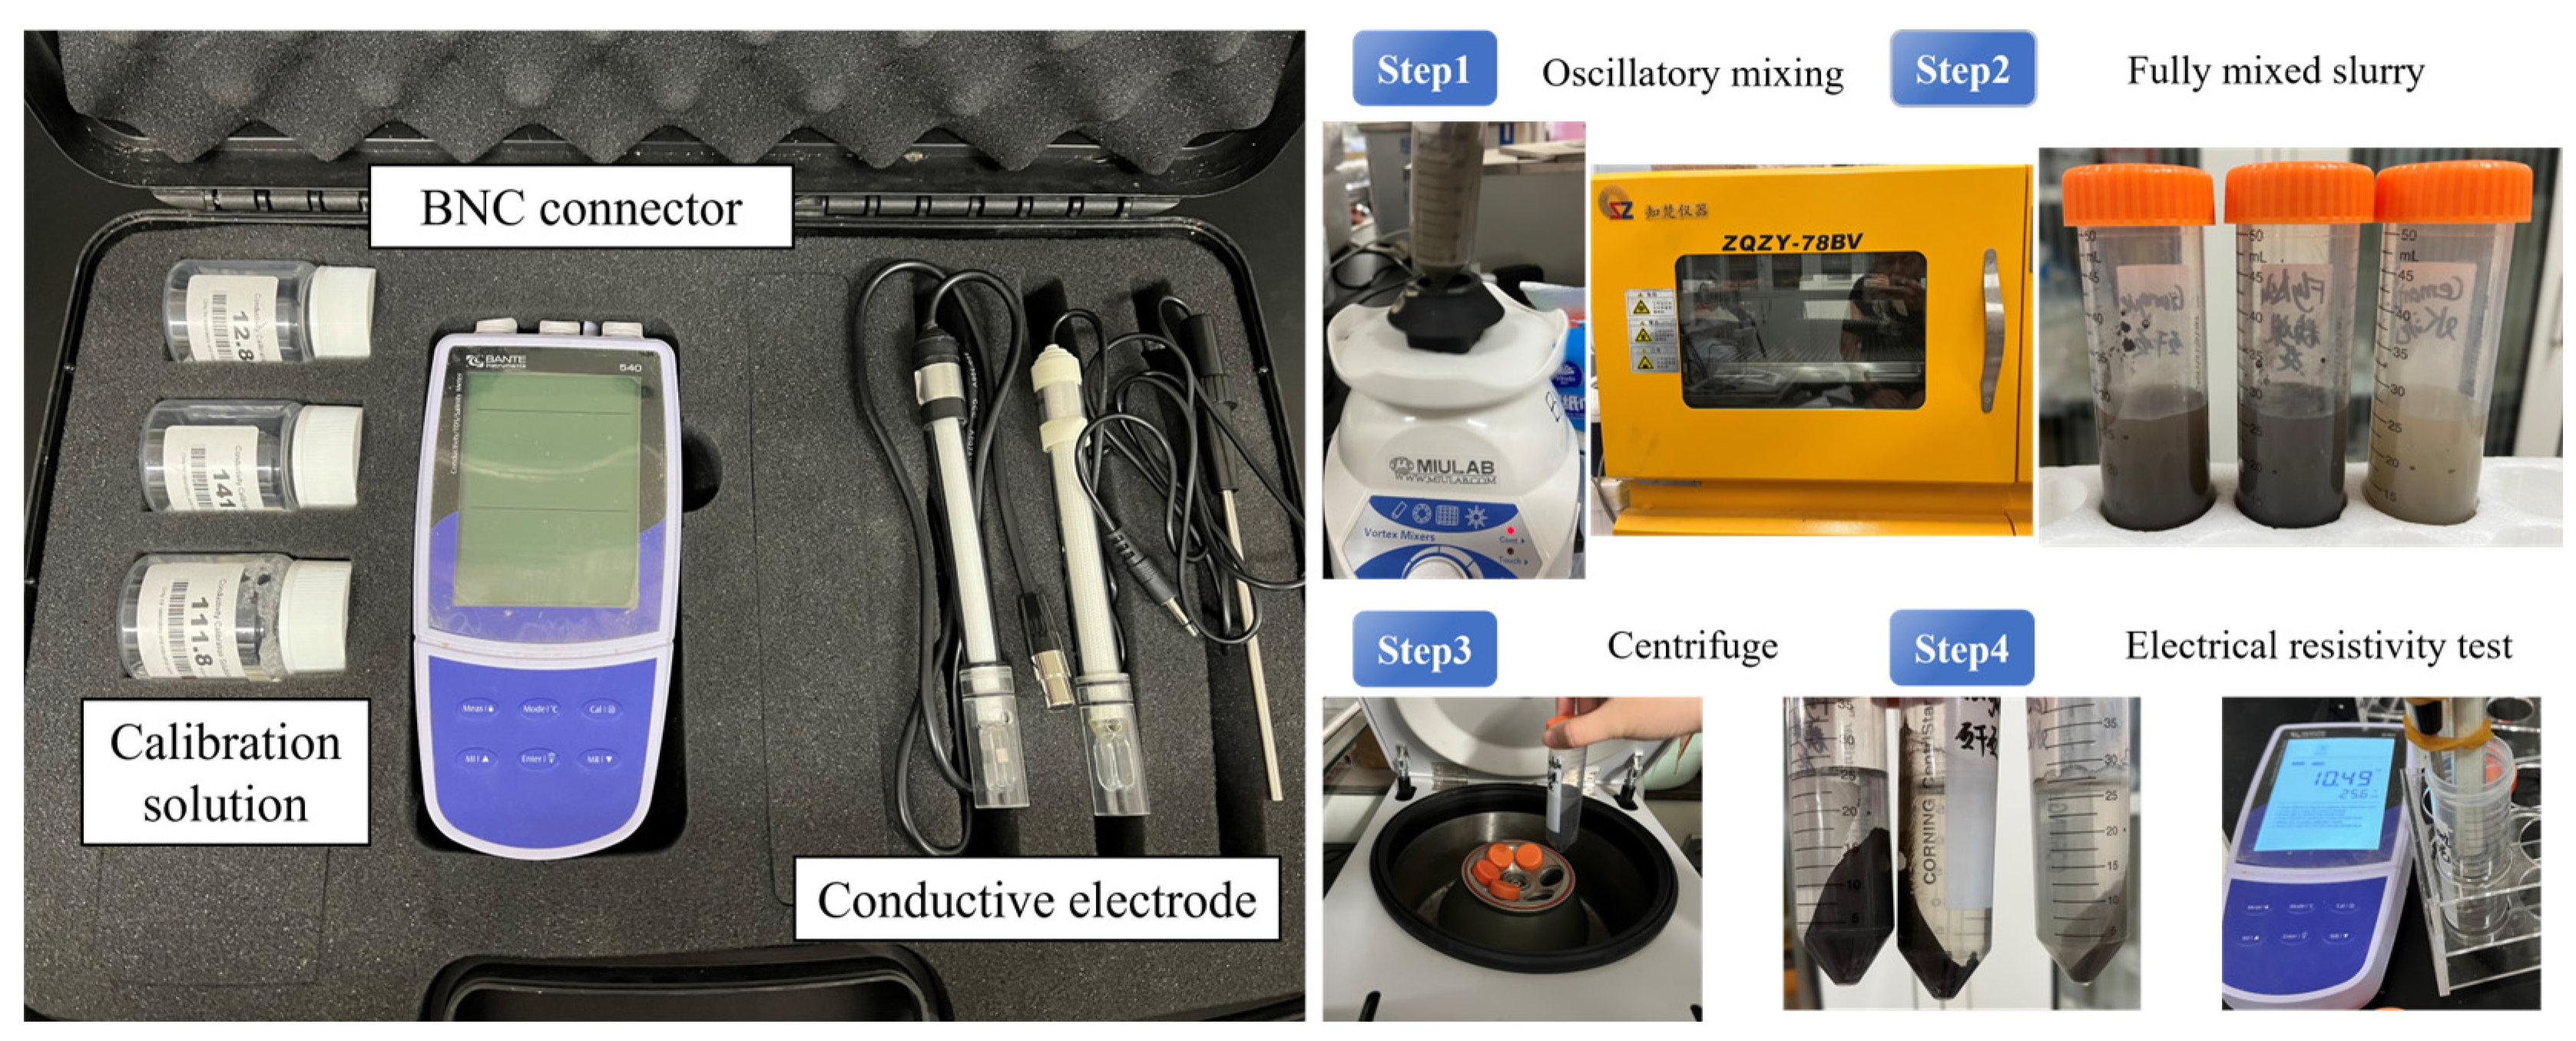
2.3.3. Electrical Resistivity Test
- Clean the ORP electrode with distilled or deionized water.
- Immerse the electrode sensor in the sample and stir slowly.
- When the measured value stabilizes, the screen automatically displays the stable icon.
- Record the measured value and the measurement is complete.
3. Results and Analysis
3.1. Visco-Plastic Test Results
3.1.1. Solid Content Effect
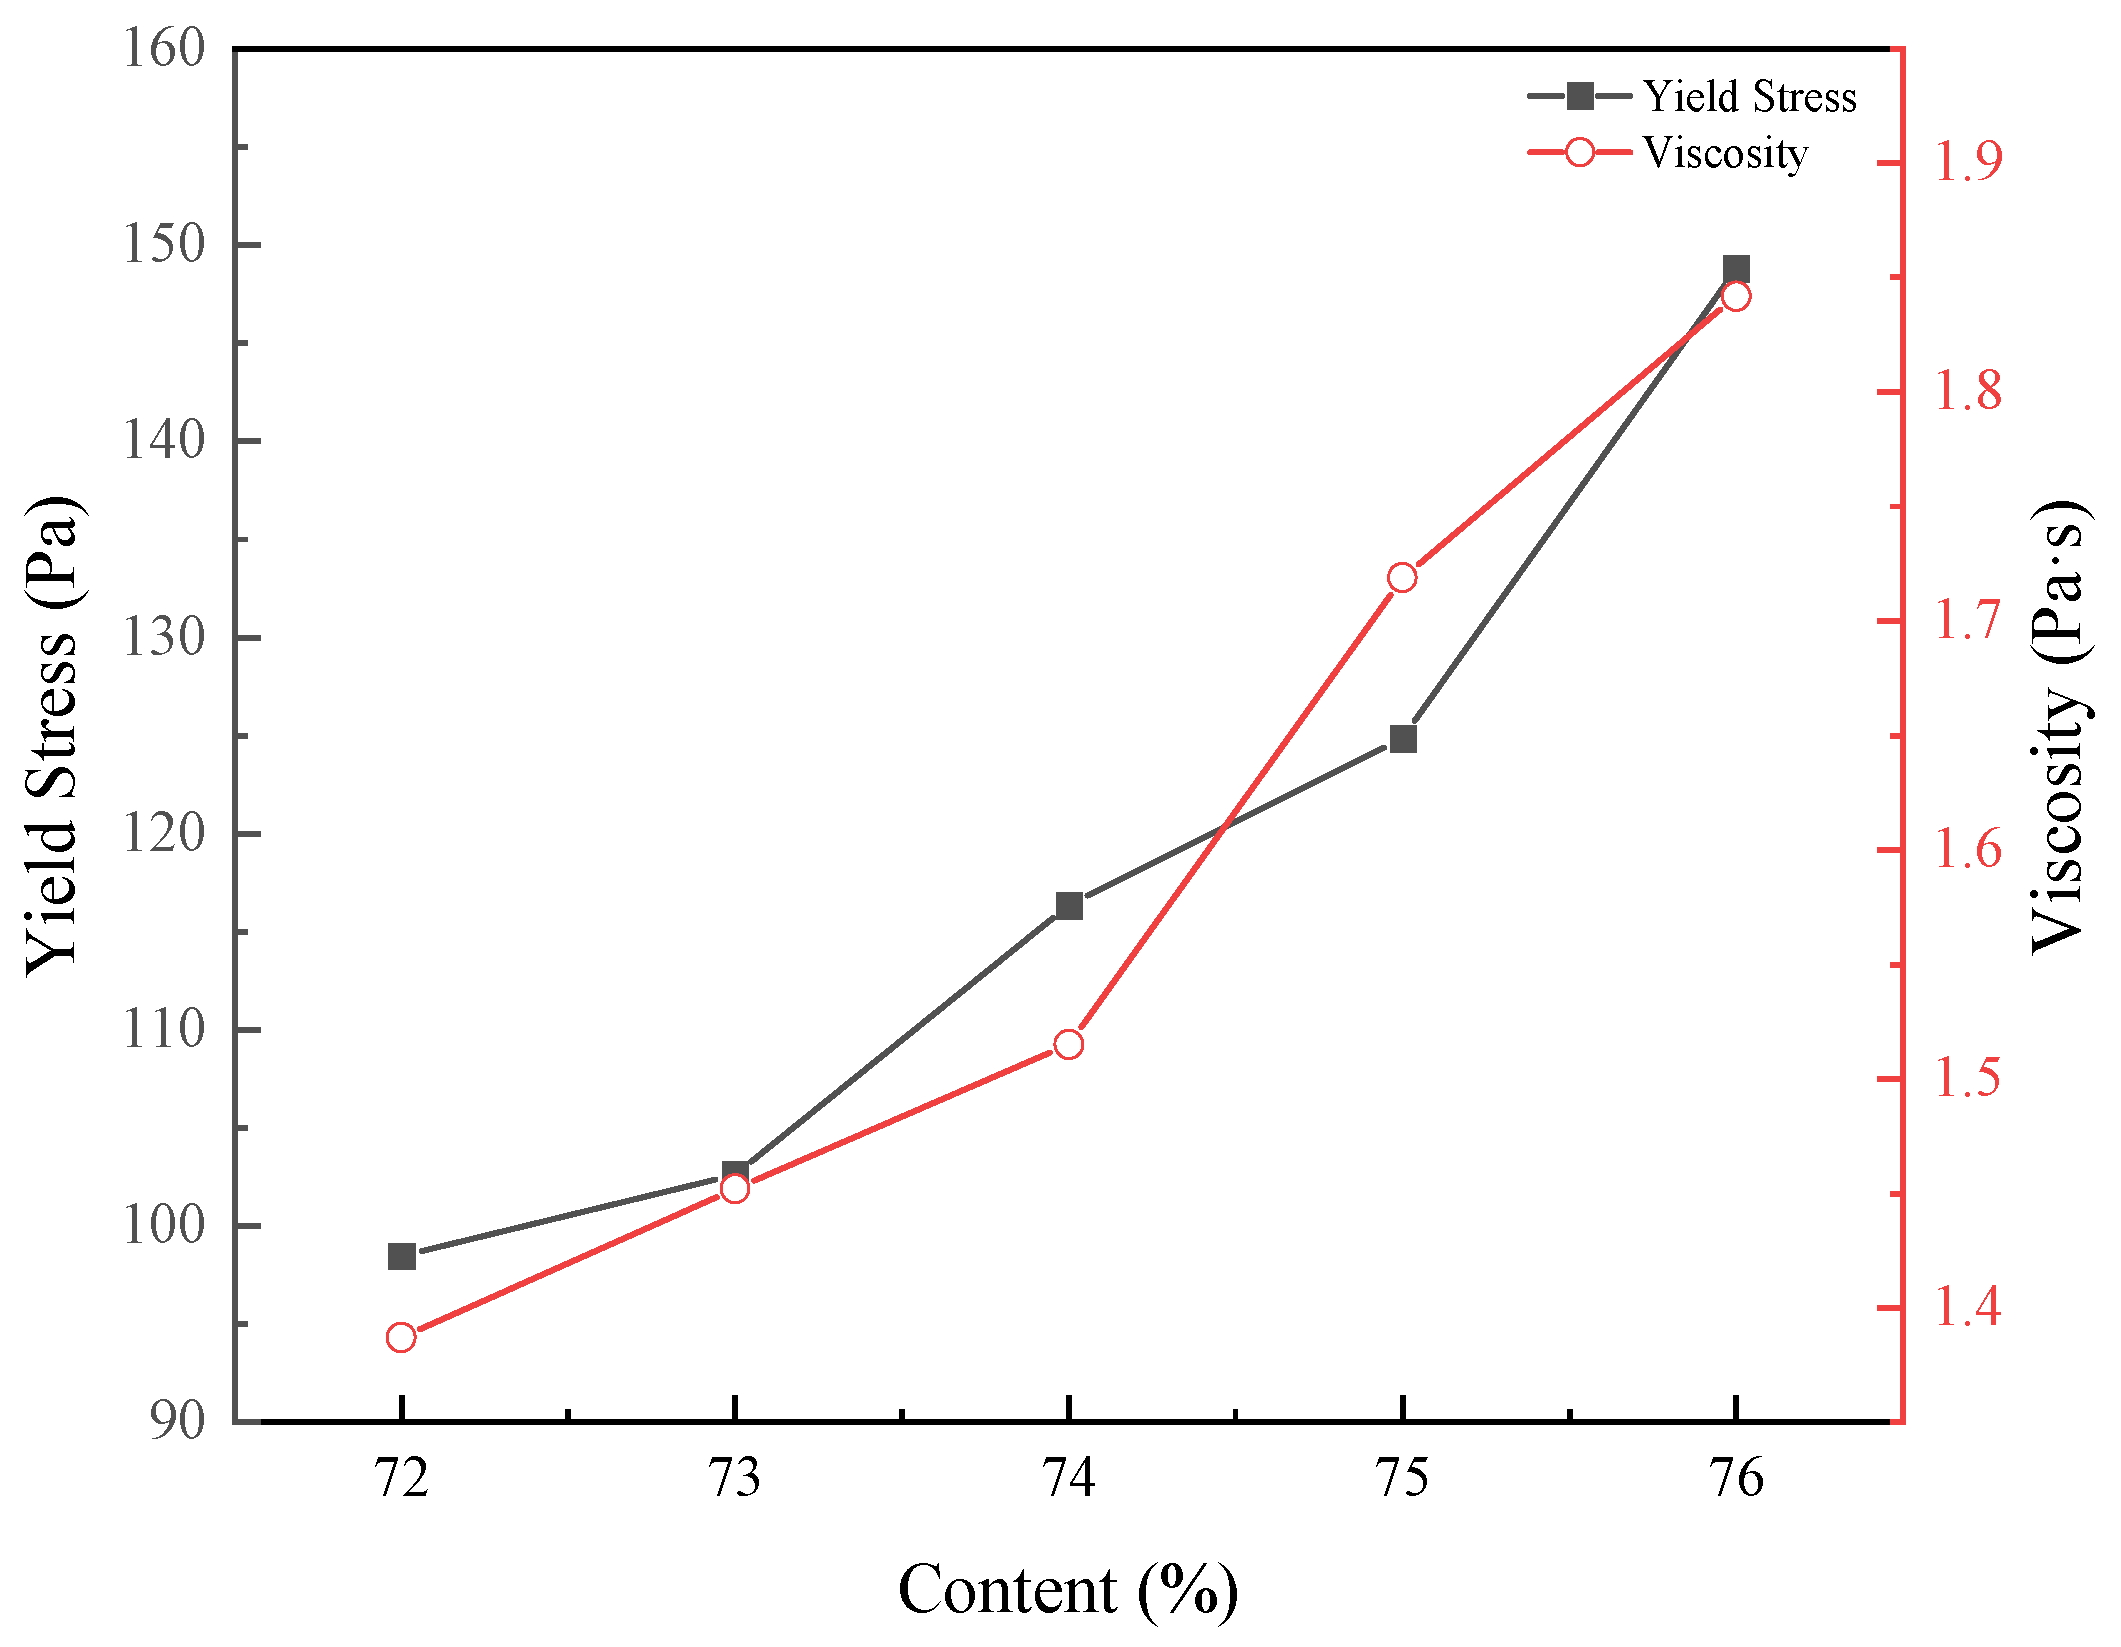
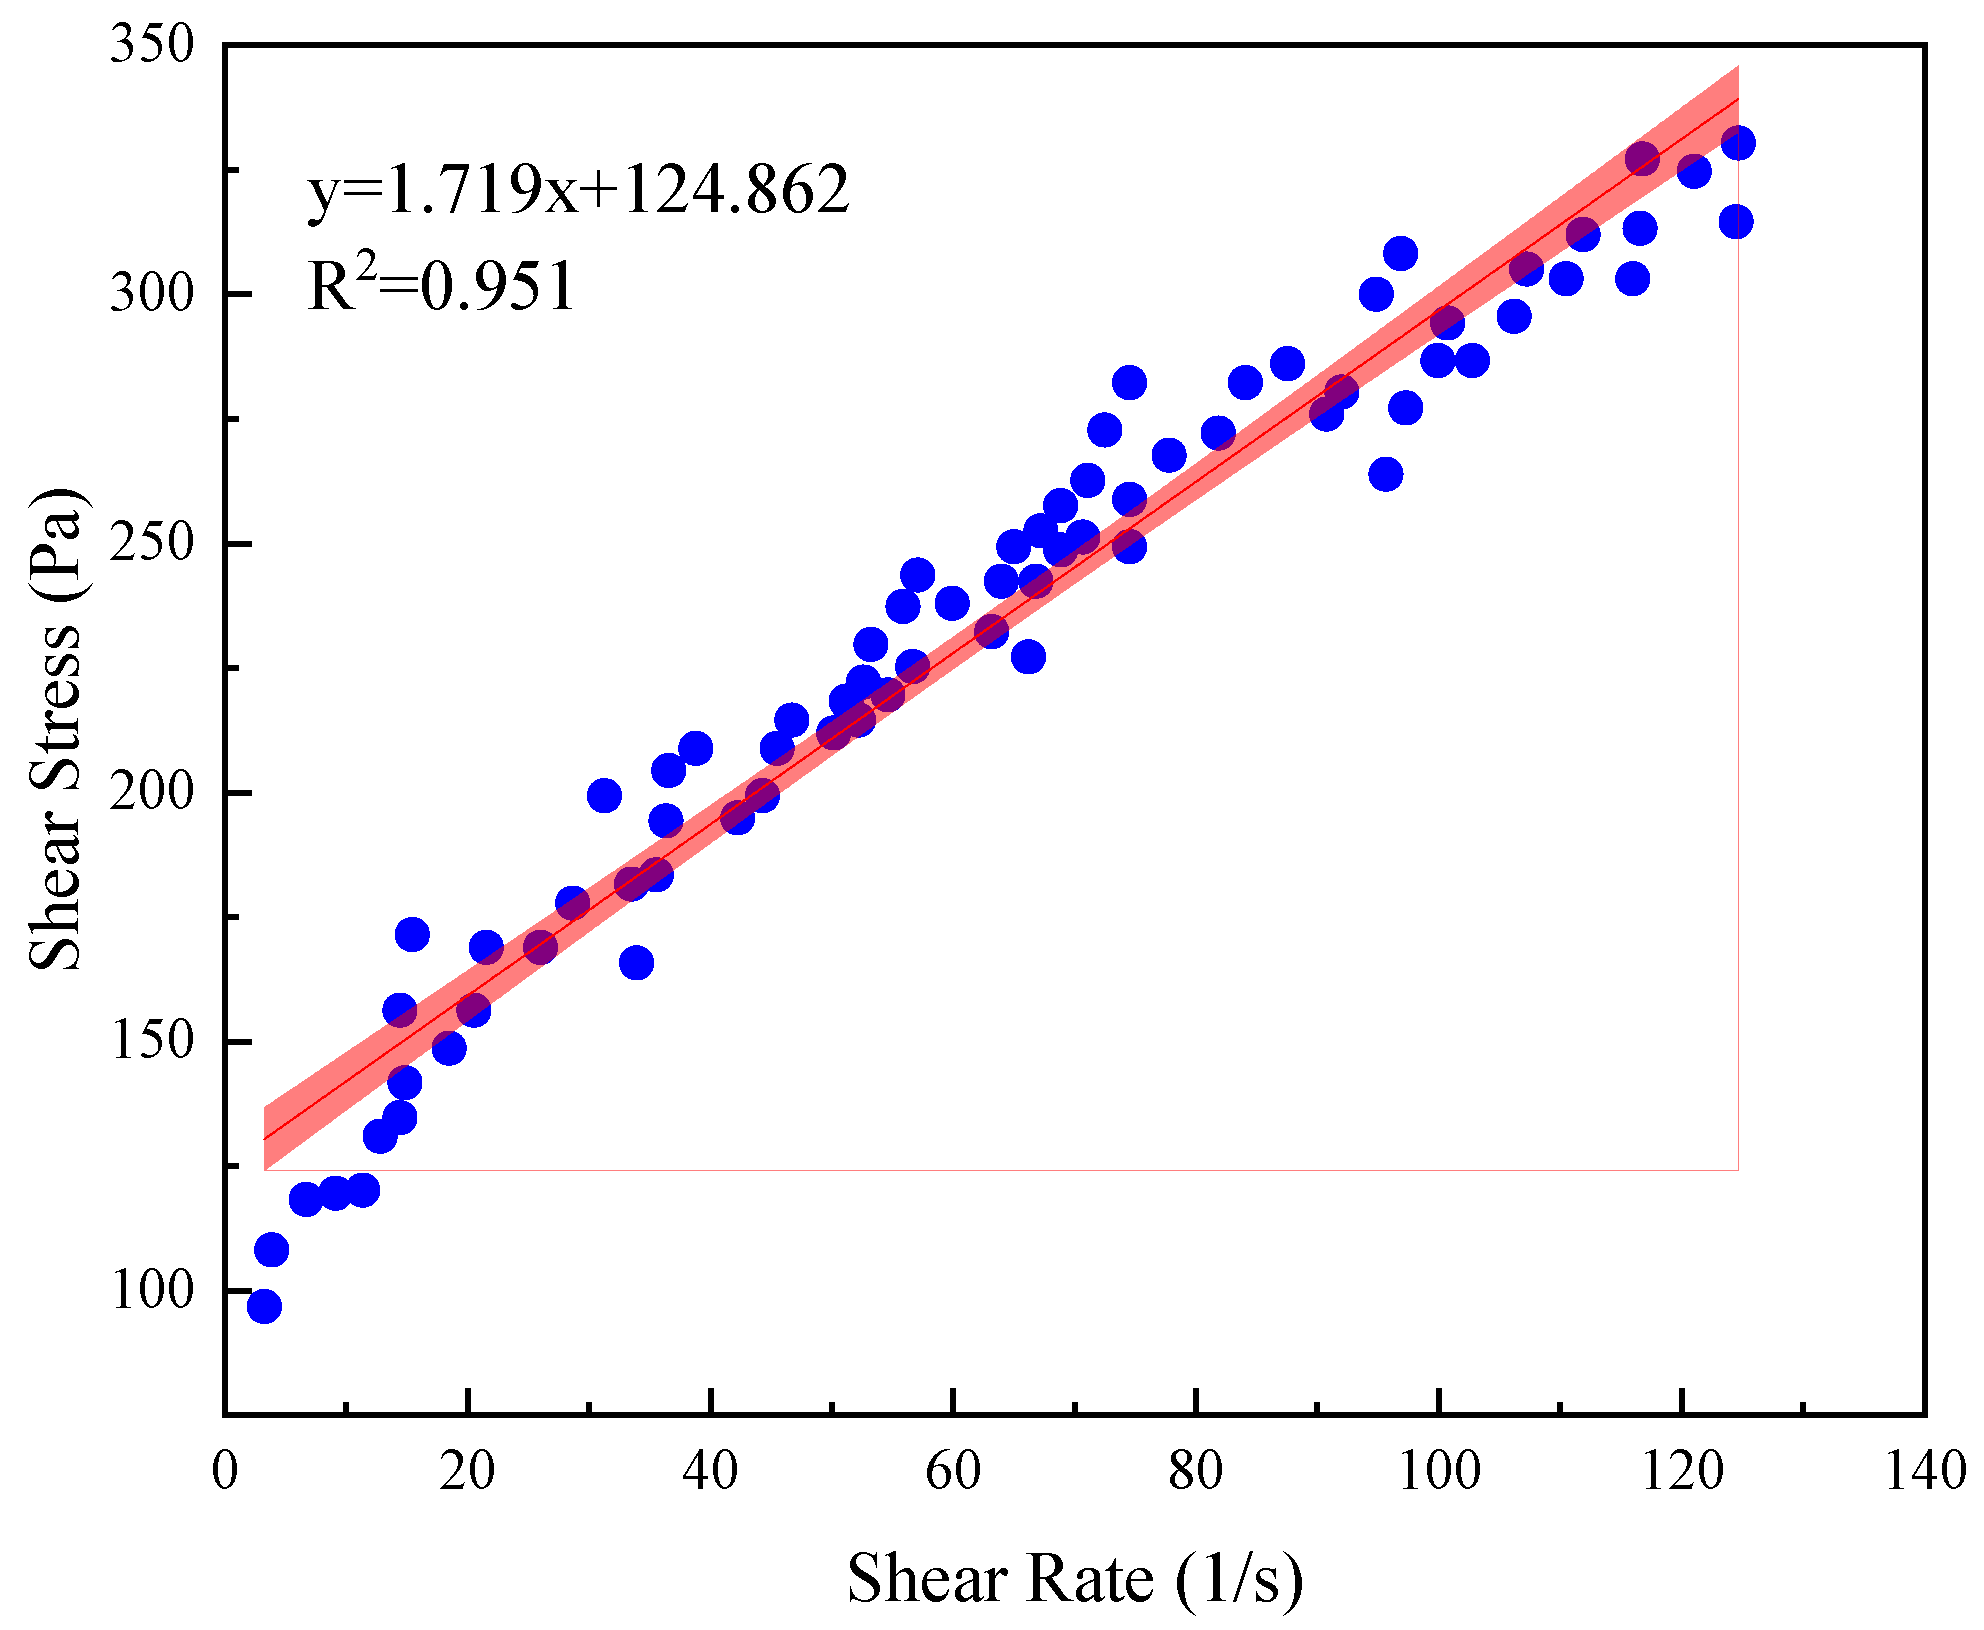
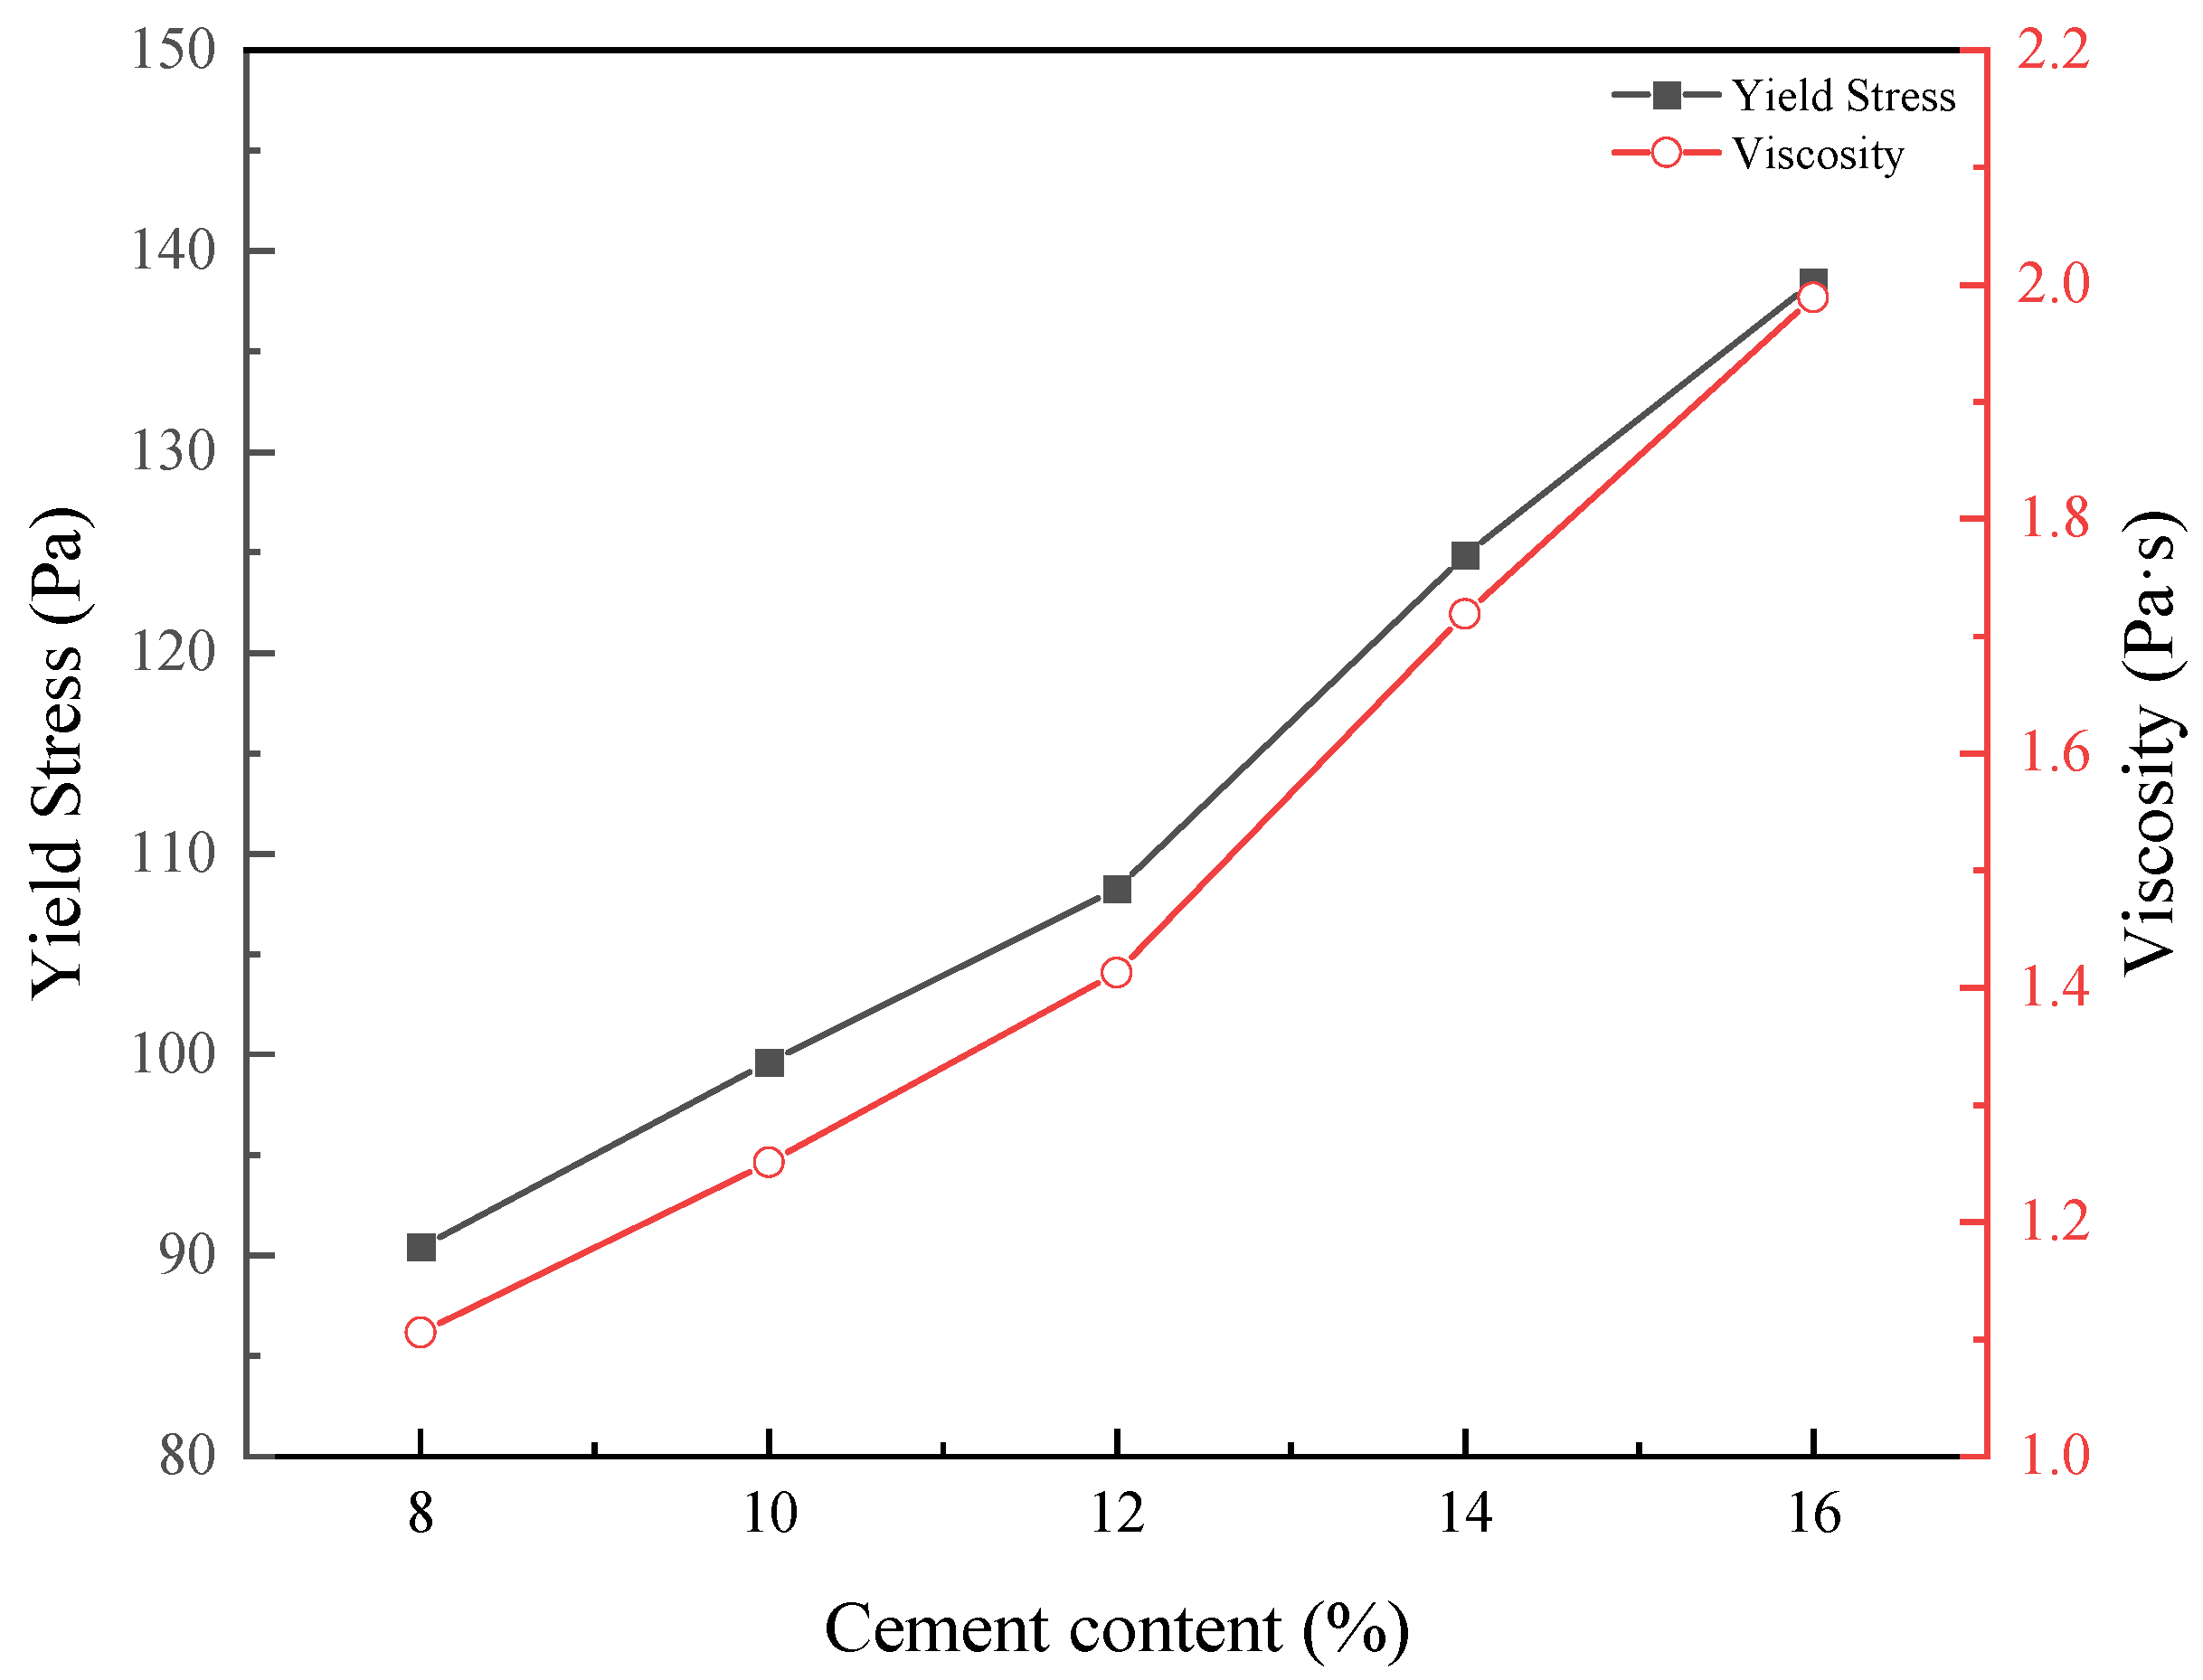
3.1.2. Cement Content Effect
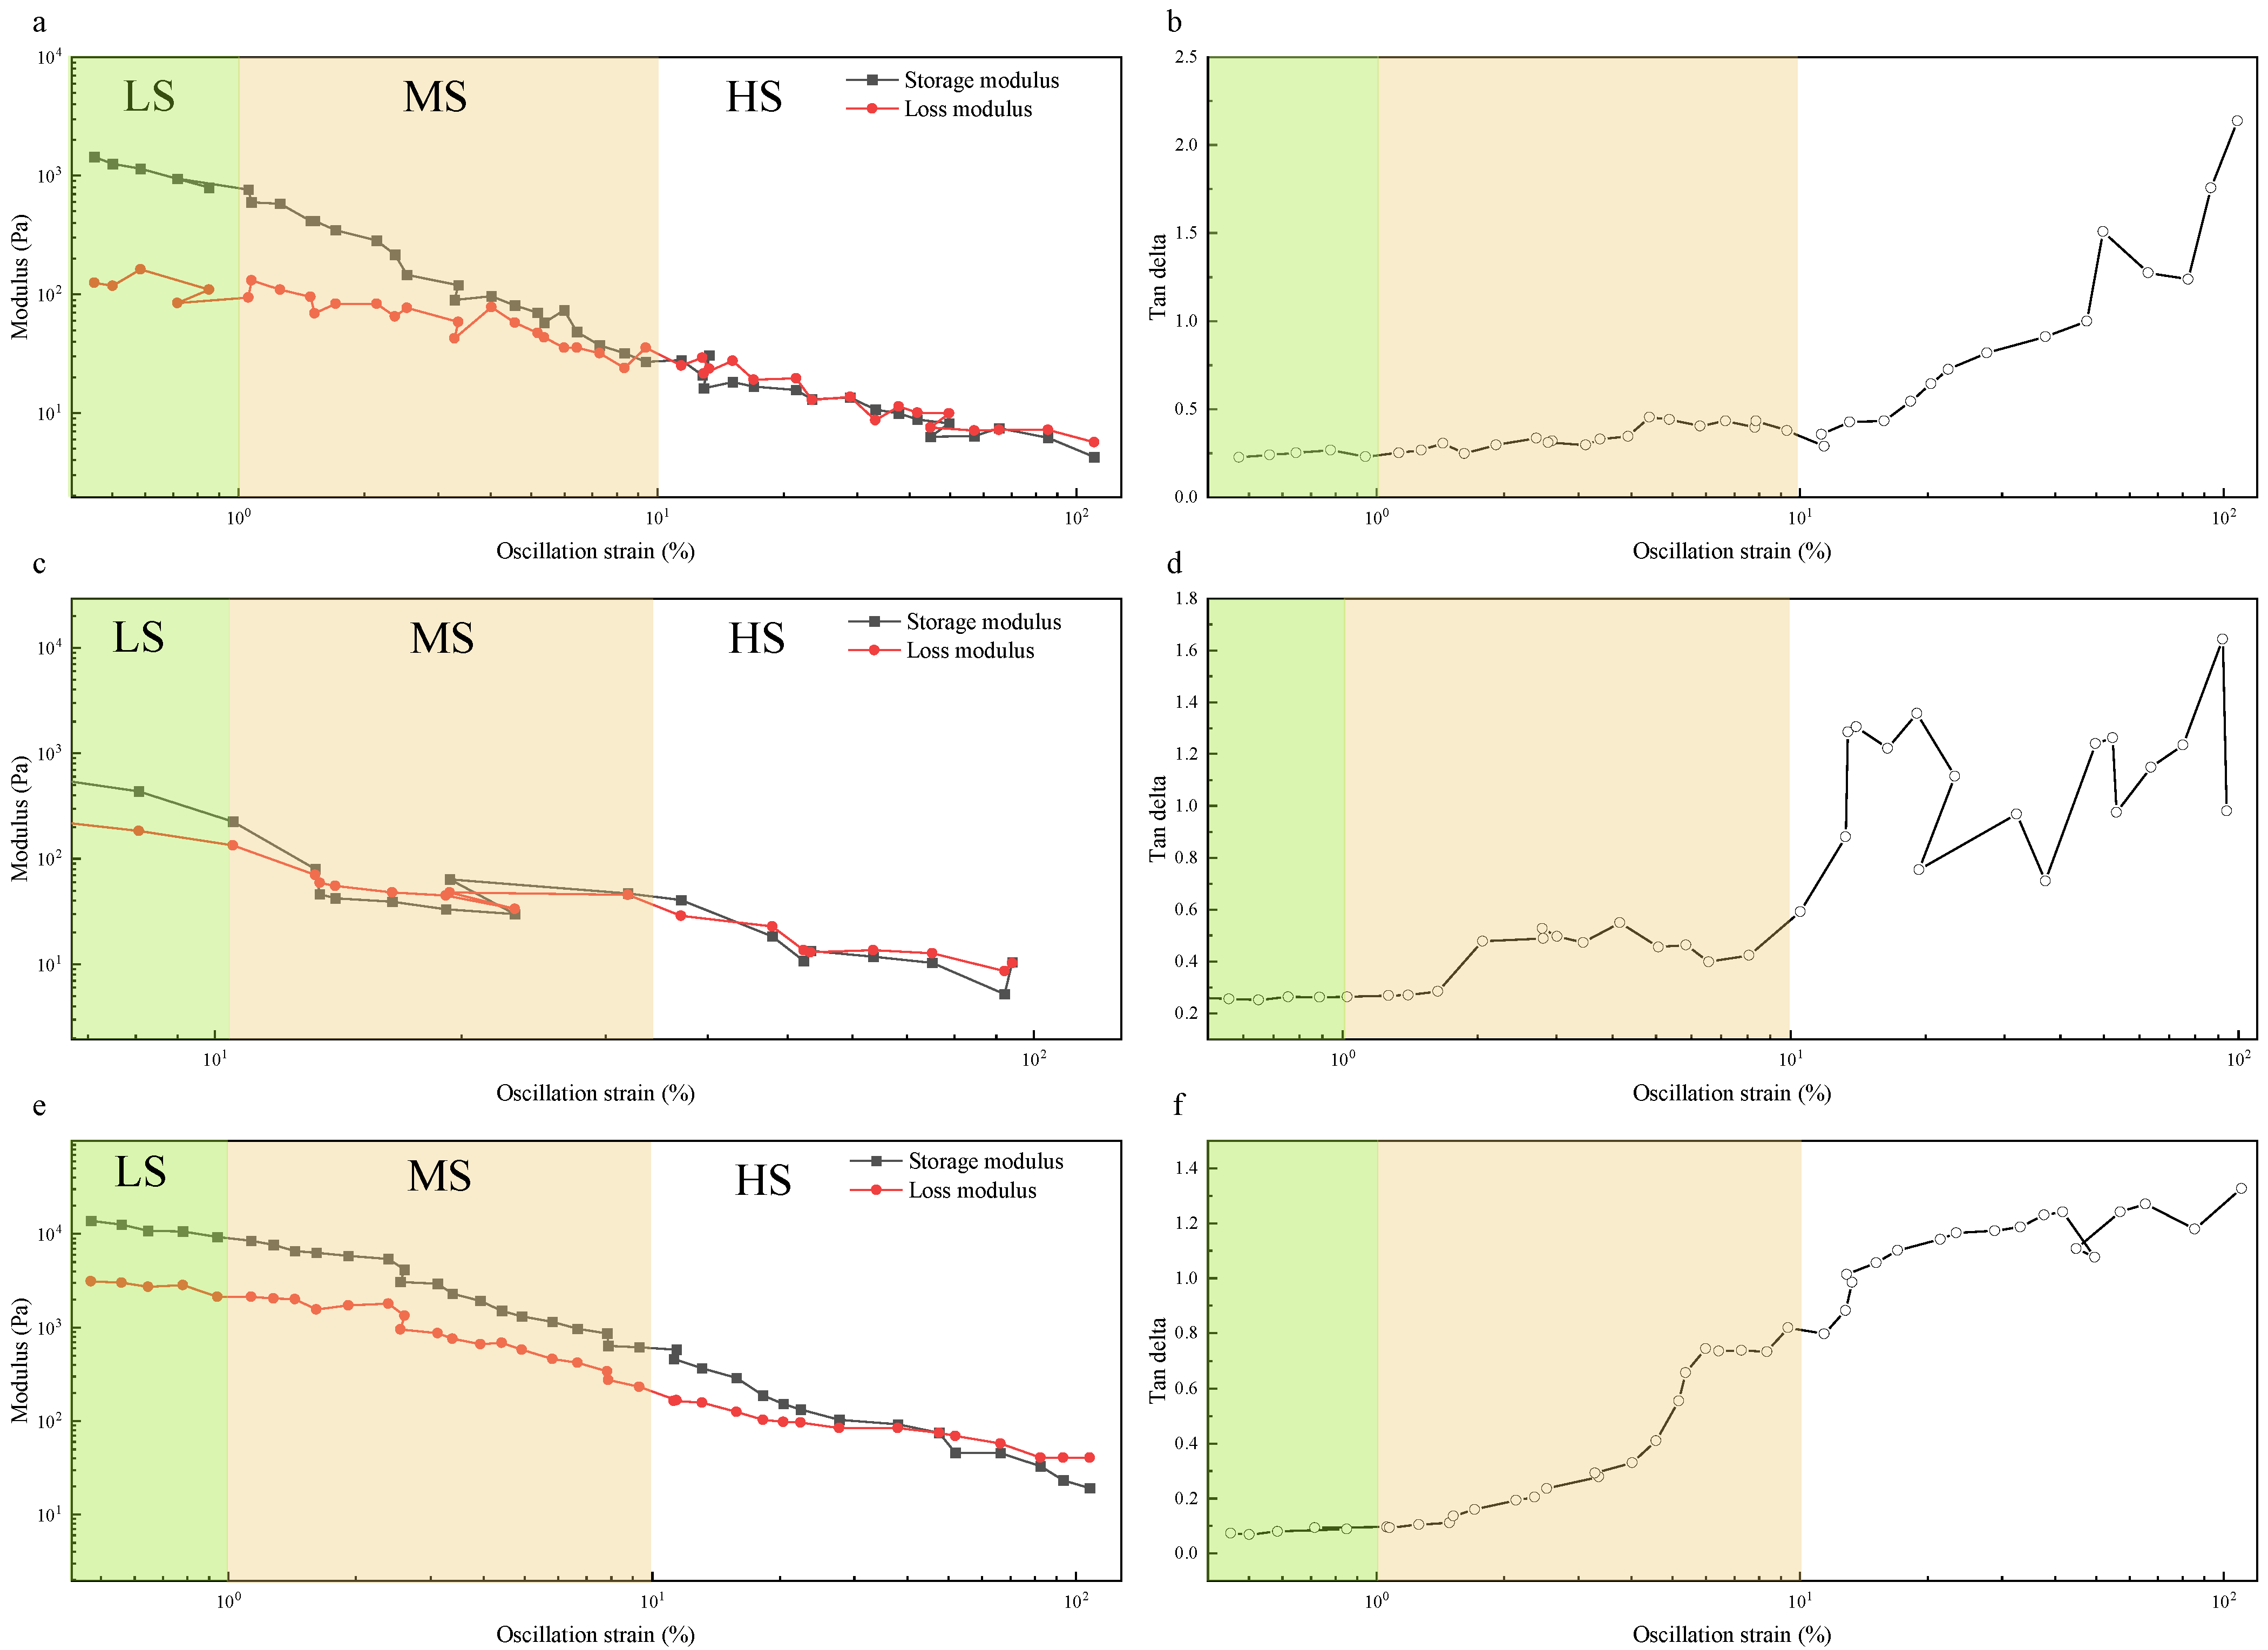
3.2. DSR Testing Results
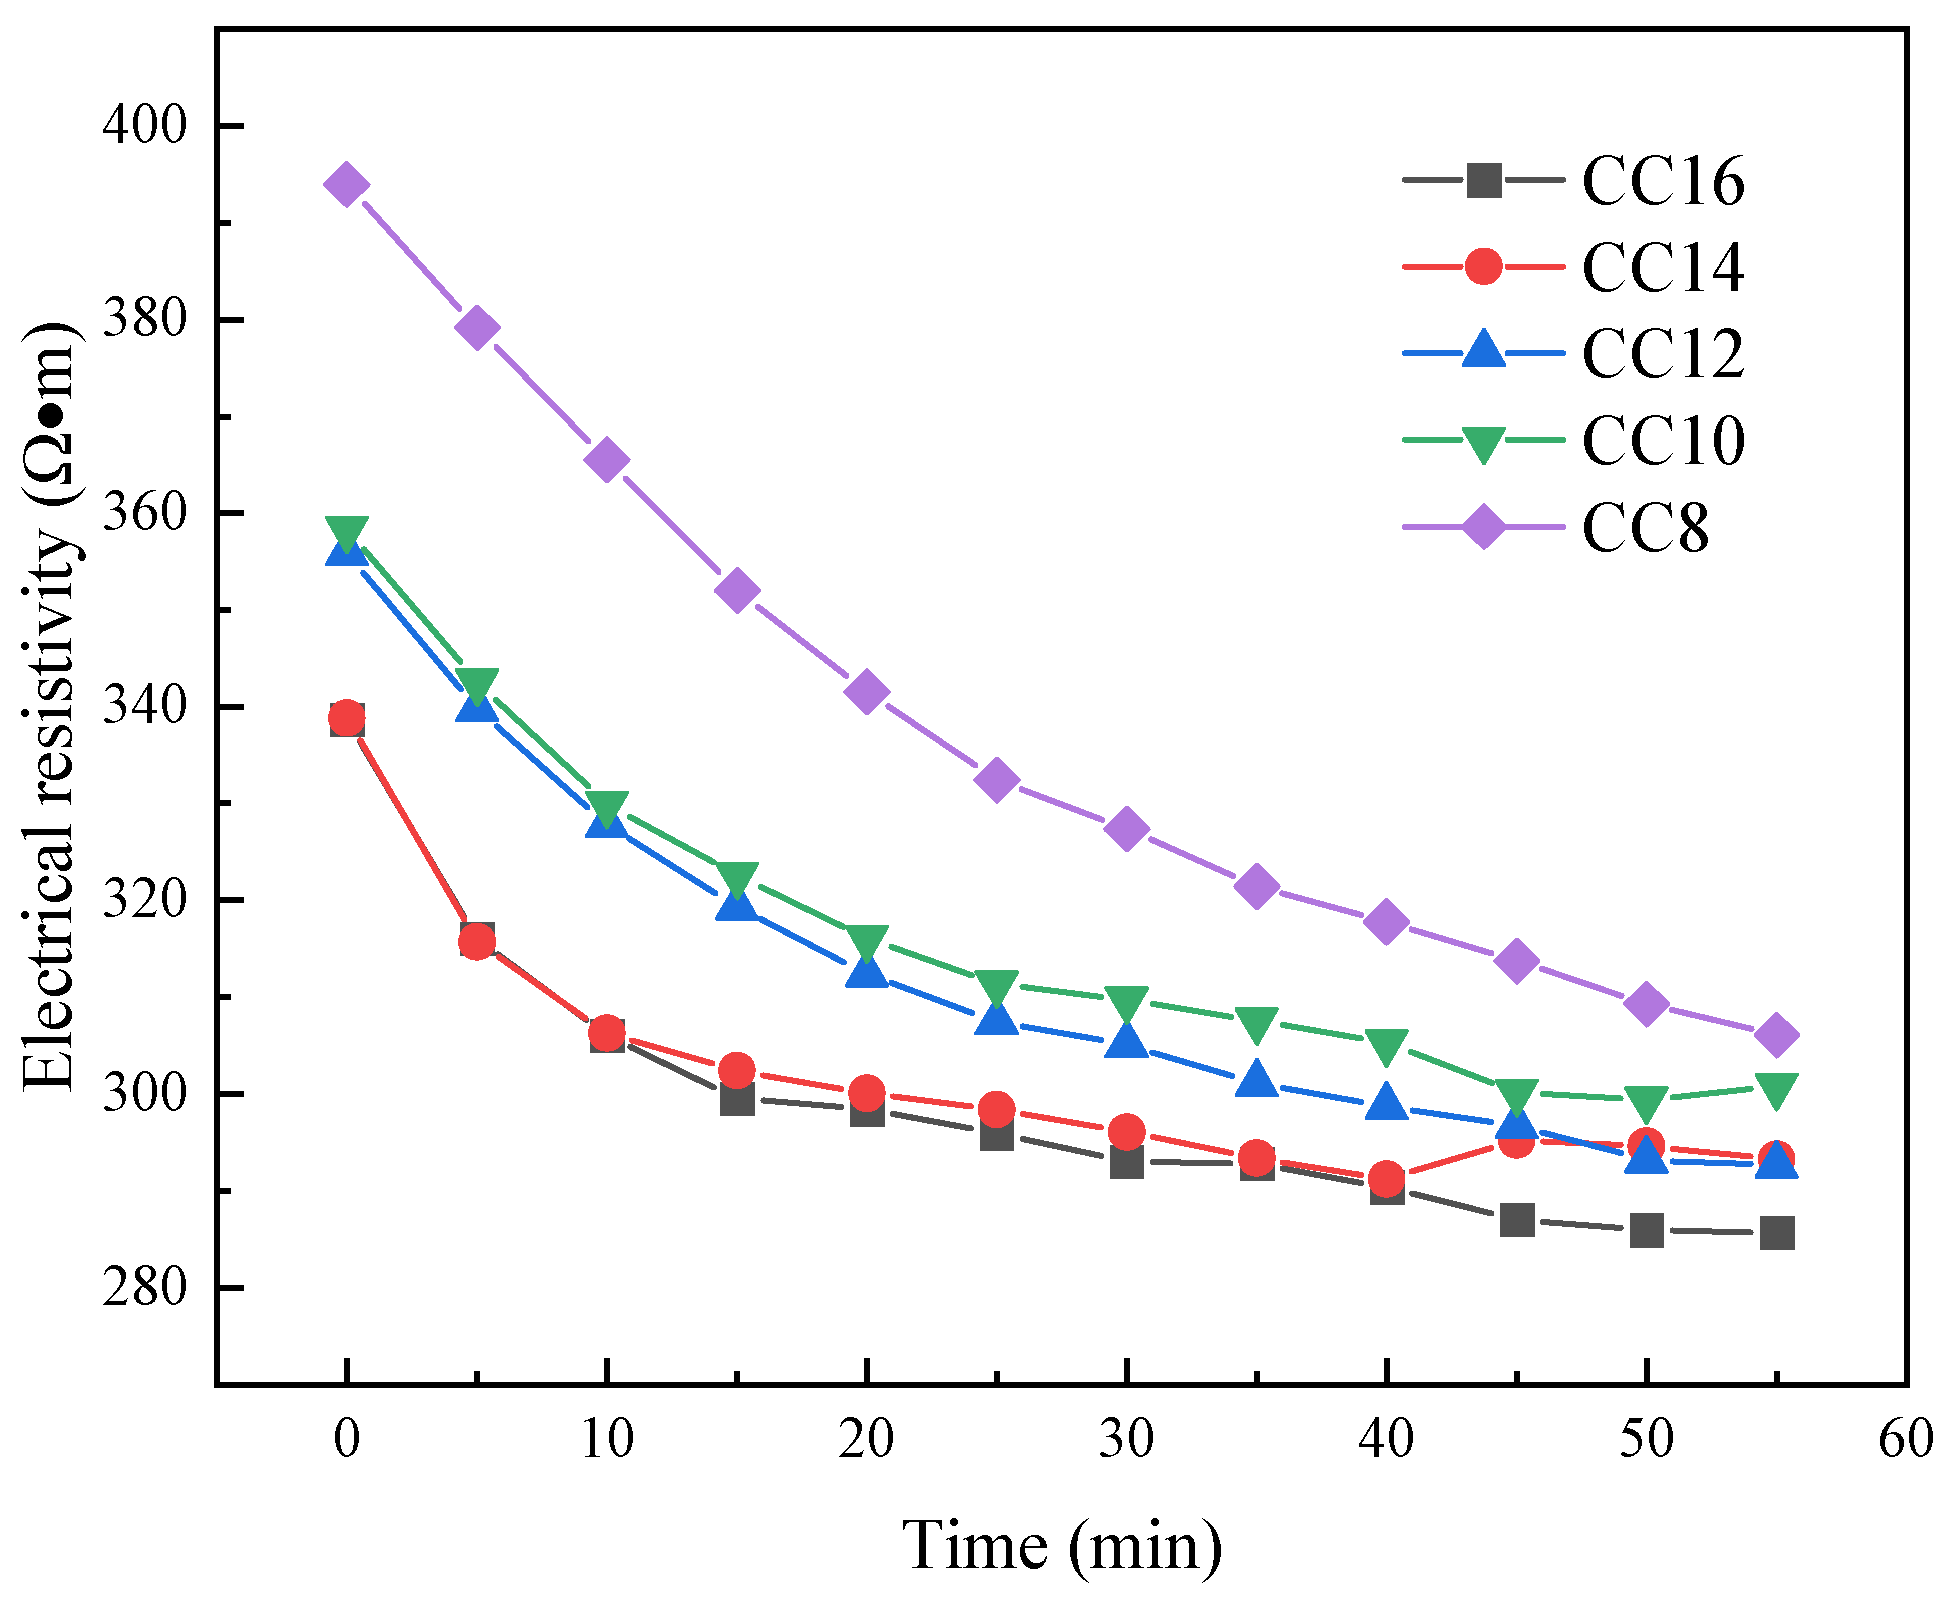
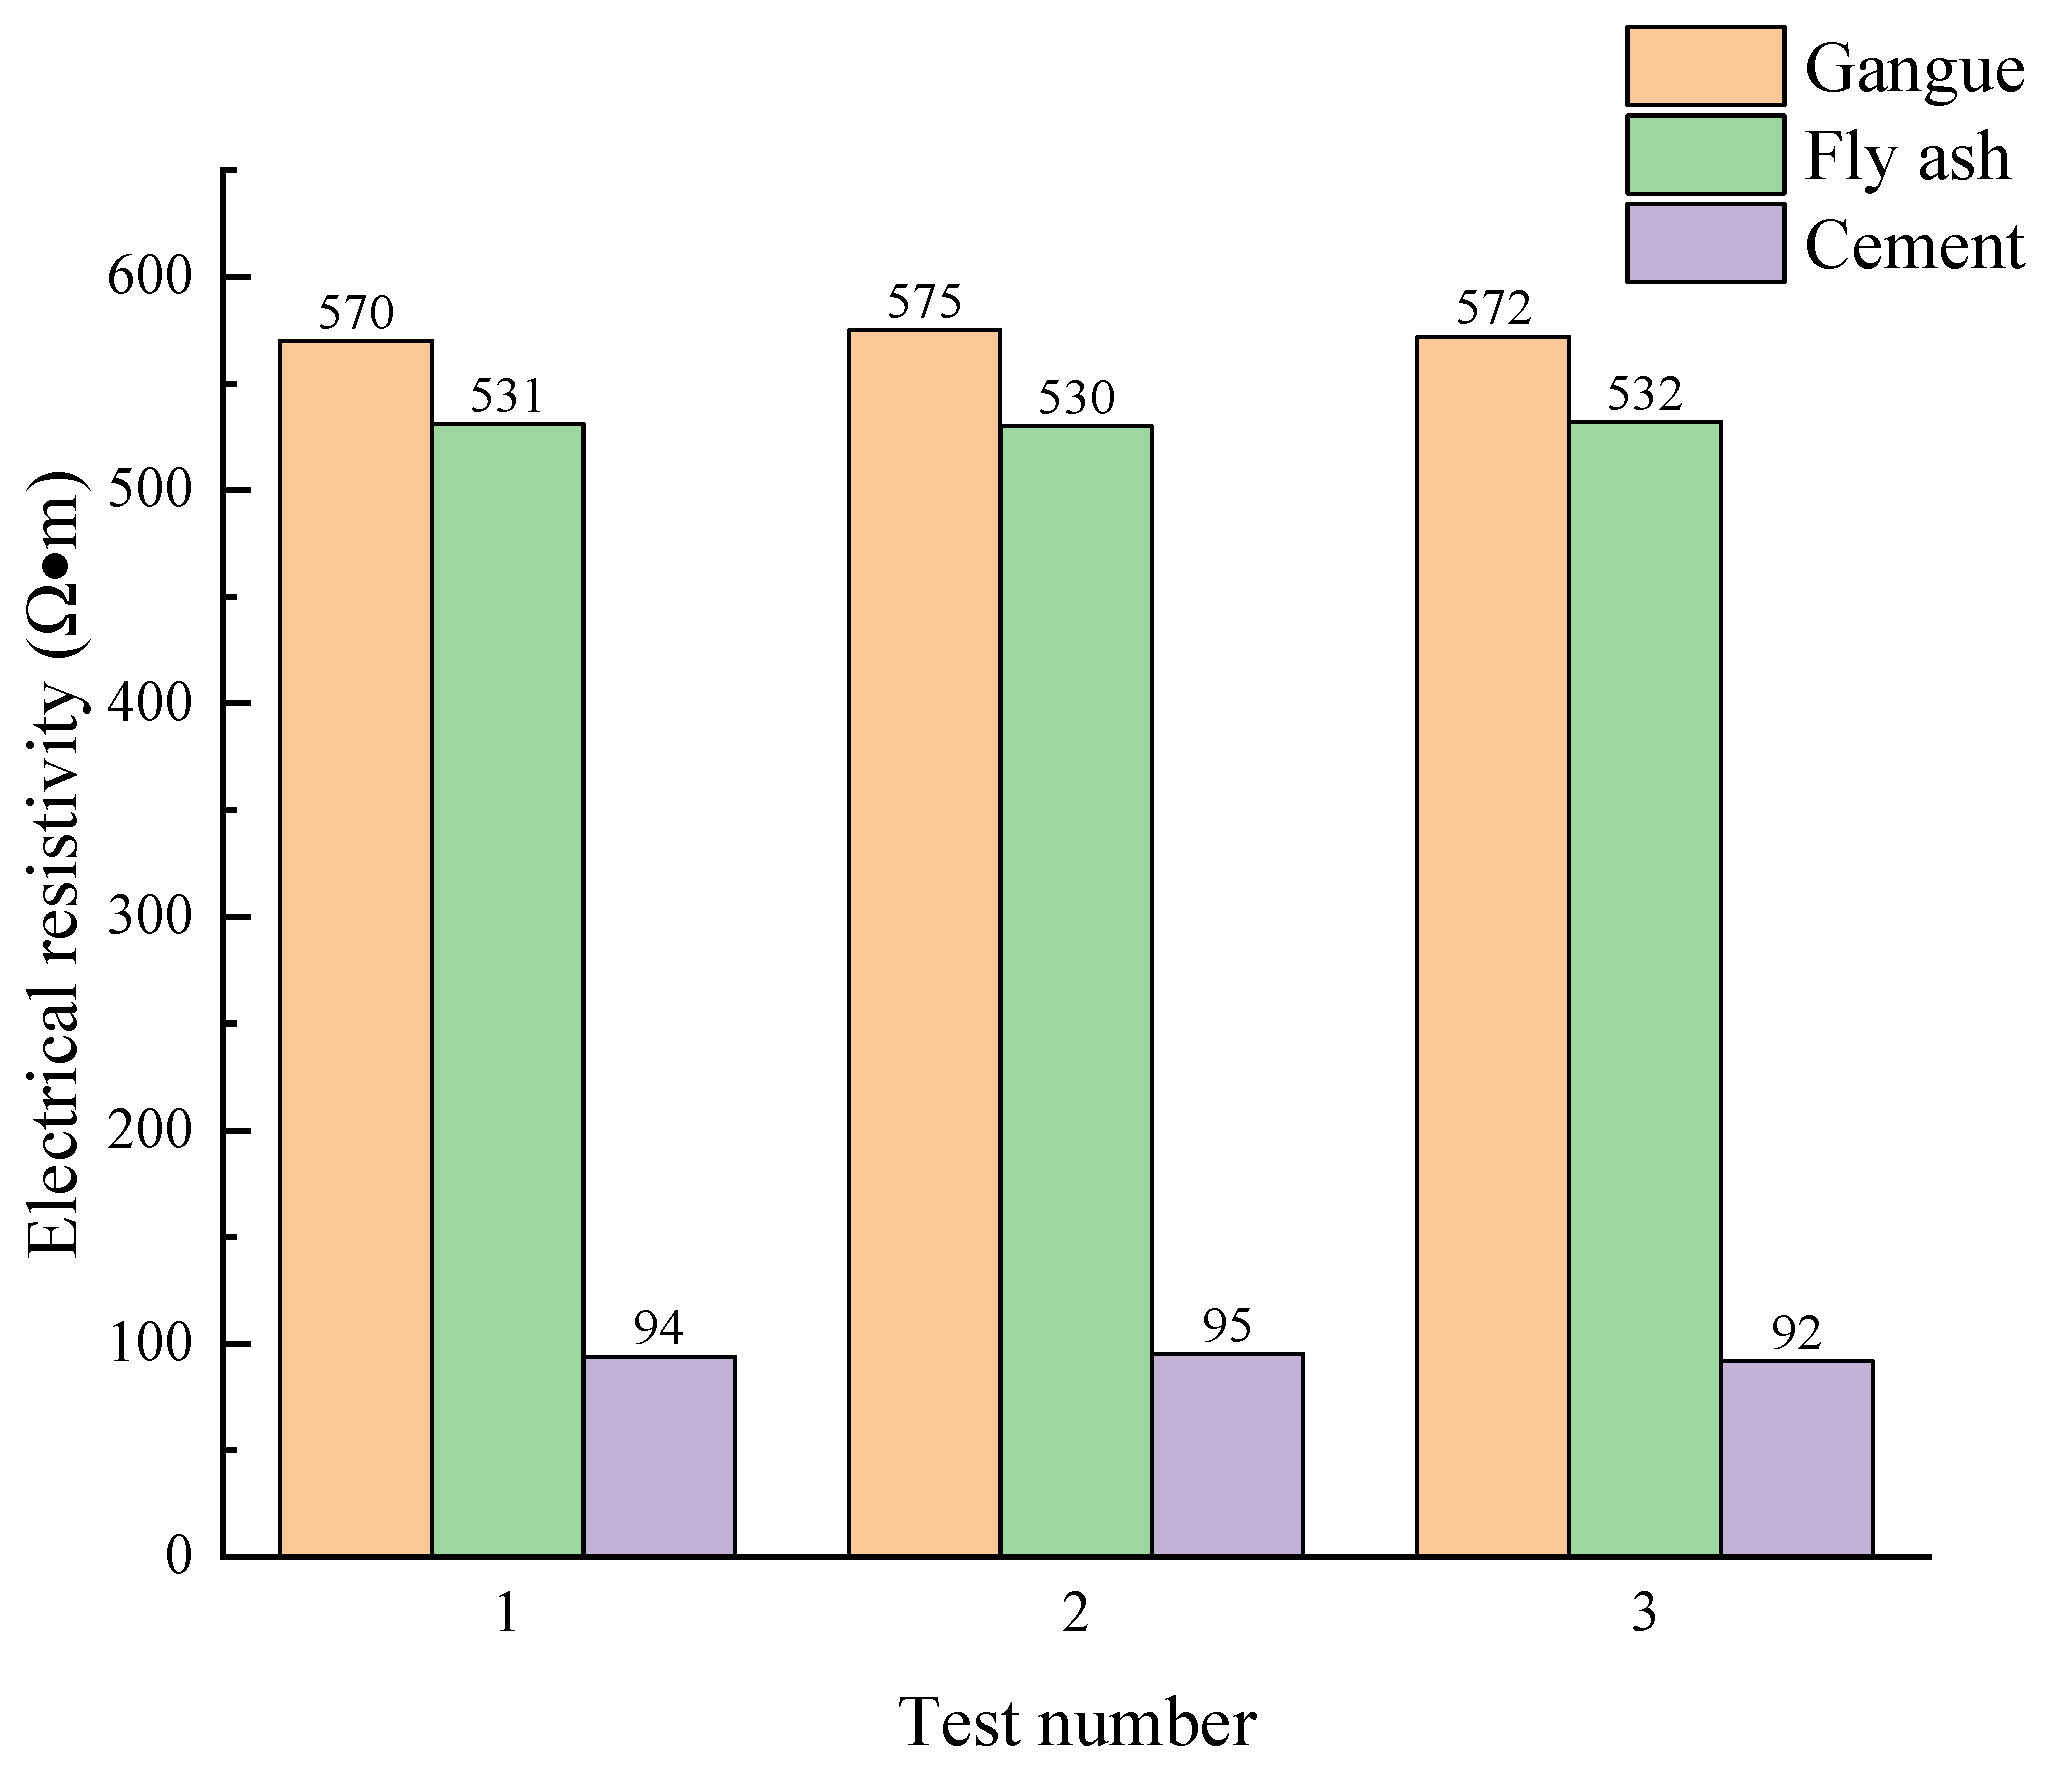
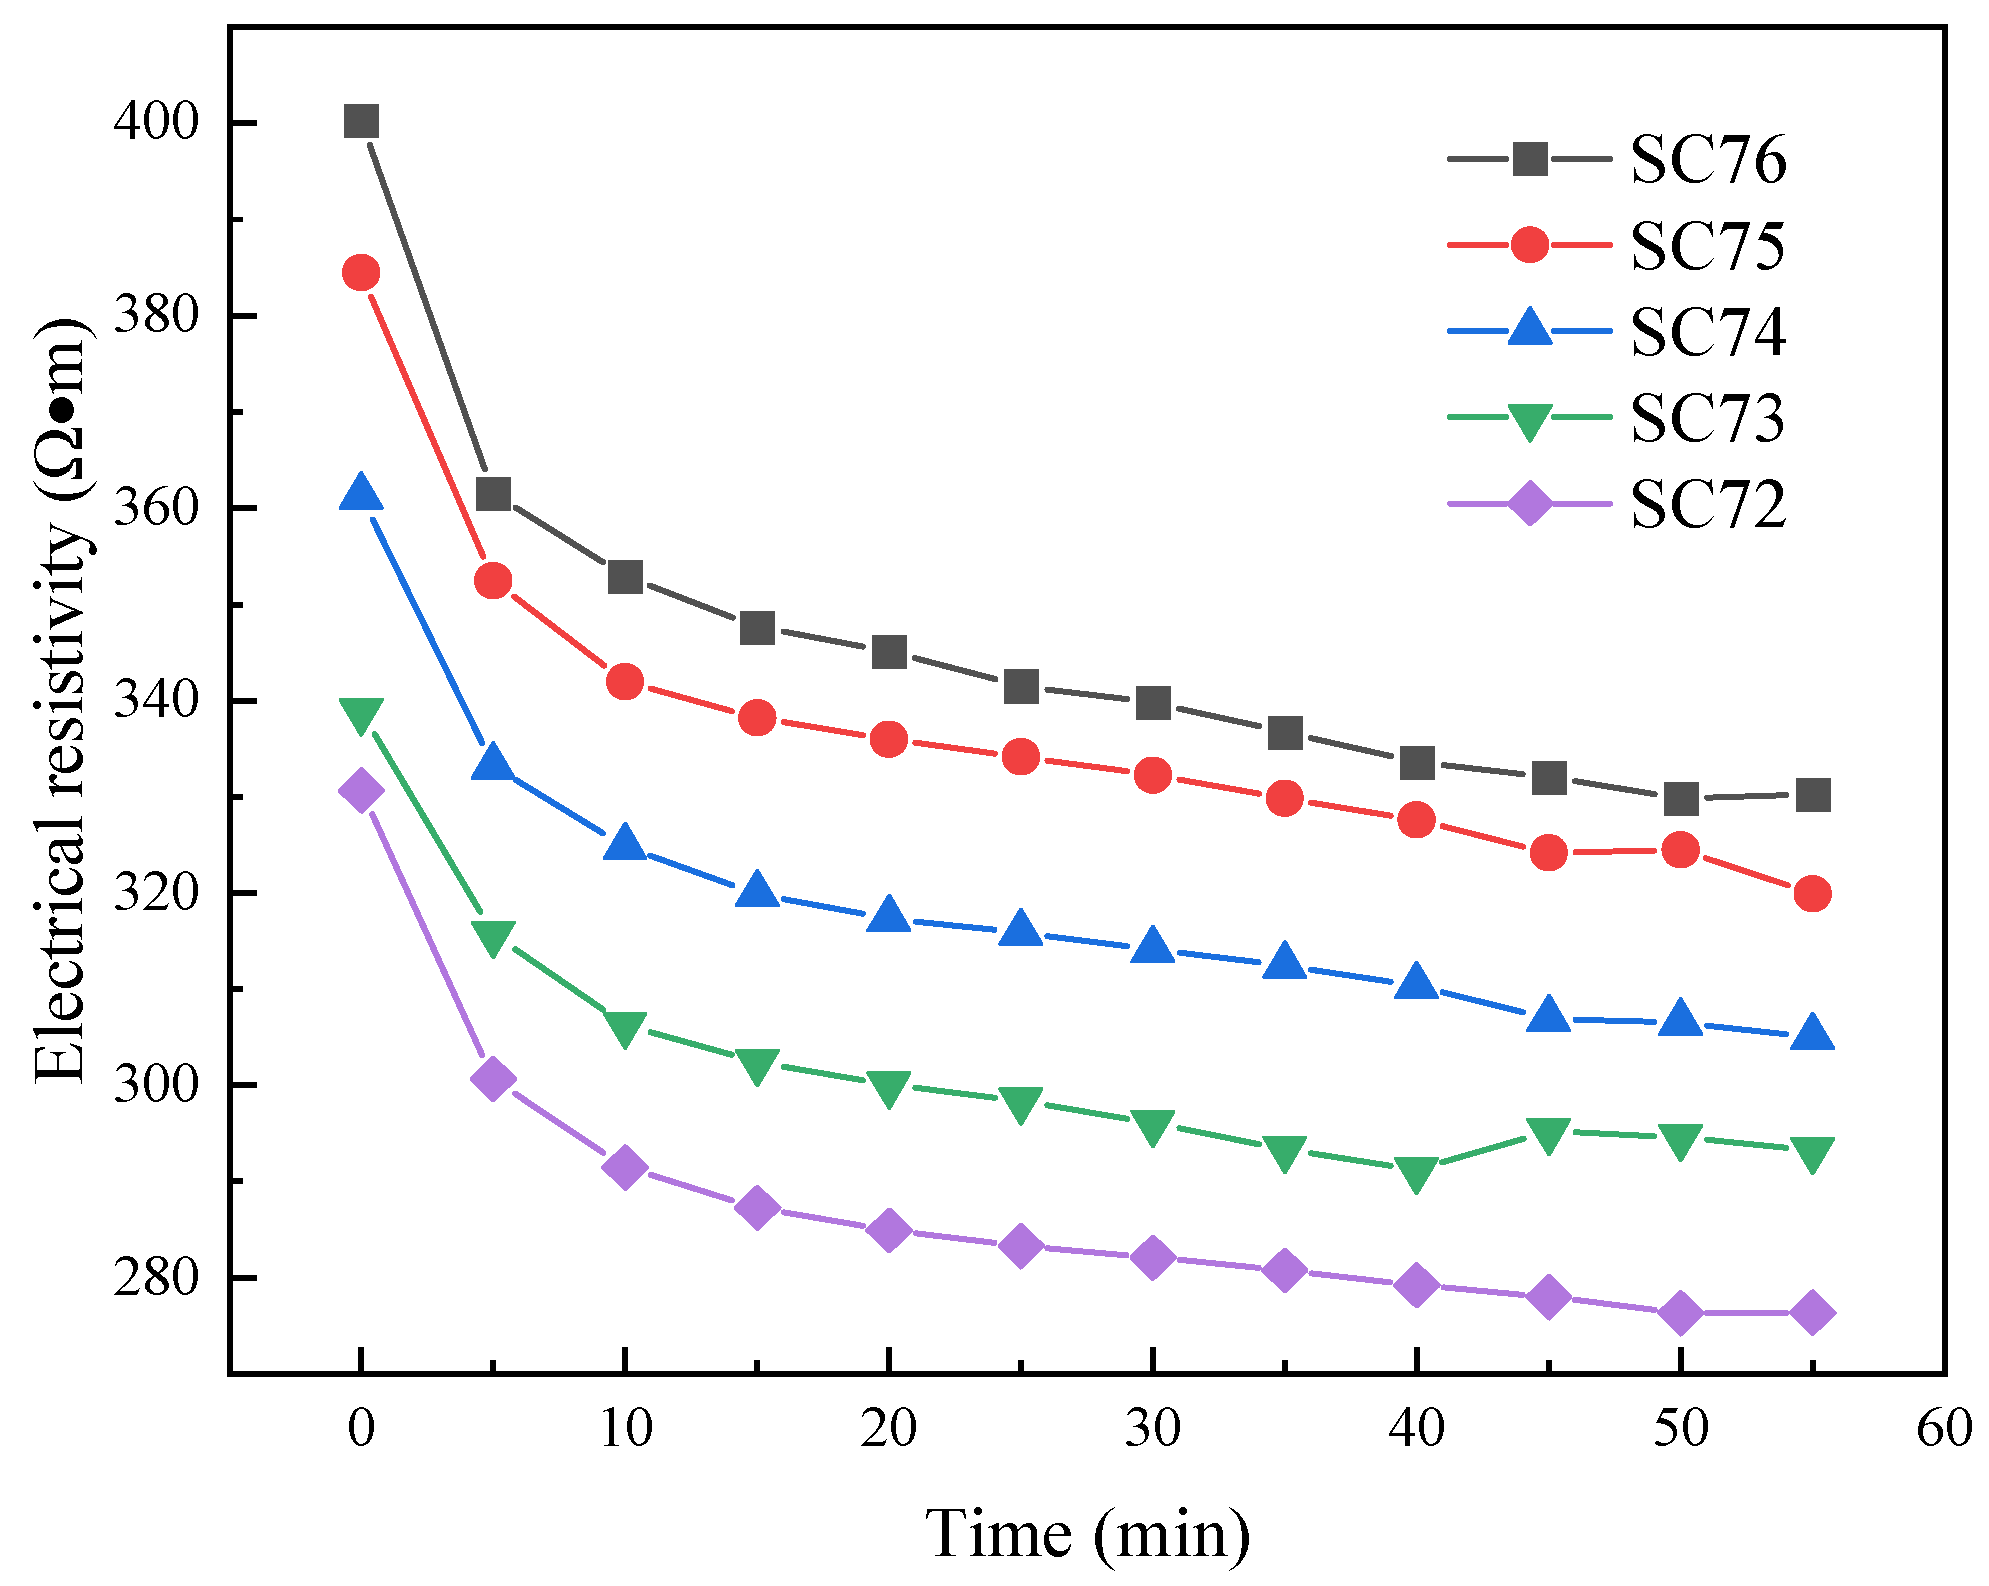
3.3. Electrical Resistivity Test Results
4. Conclusions
Author Contributions
Funding
Data Availability Statement
Conflicts of Interest
References
- Yang, B.; Wang, X.; Yin, P.; Gu, C.; Yin, X.; Yang, F.; Li, T. The Rheological Properties and Strength Characteristics of Cemented Paste Backfill with Air-Entraining Agent. Minerals 2022, 12, 1457. [Google Scholar] [CrossRef]
- Li, B.; Zhang, J.; Yan, H.; Zhou, N.; Li, M. Experimental investigation into the thermal conductivity of gangue-cemented paste backfill in mine application. J. Mater. Res. Technol. 2022, 16, 1792–1802. [Google Scholar] [CrossRef]
- Zhang, M.; Qiu, Y.; Li, C.; Cui, T.; Yang, M.; Yan, J.; Yang, W. A Habitable Earth and Carbon Neutrality: Mission and Challenges Facing Resources and the Environment in China—An Overview. Int. J. Environ. Res. Public Health 2023, 20, 1045. [Google Scholar] [CrossRef] [PubMed]
- Zhu, A.; Wang, Q.; Liu, D.; Zhao, Y. Analysis of the Characteristics of CH4 Emissions in China’s Coal Mining Industry and Research on Emission Reduction Measures. Int. J. Environ. Res. Public Health 2022, 19, 7408. [Google Scholar] [CrossRef] [PubMed]
- Bo, L.; Yang, S.; Liu, Y.; Zhang, Z.; Wang, Y.; Wang, Y. Coal Mine Solid Waste Backfill Process in China: Current Status and Challenges. Sustainability 2023, 15, 13489. [Google Scholar] [CrossRef]
- Qi, T.; Gao, X.; Feng, G.; Bai, J.; Wang, Z.; Chen, Q.; Wang, H.; Du, X. Effect of biomass power plant ash on fresh properties of cemented coal gangue backfill. Constr. Build. Mater. 2022, 340, 127853. [Google Scholar] [CrossRef]
- Wu, J.; Liu, X. Risk assessment of underground coal fire development at regional scale. Int. J. Coal Geol. 2011, 86, 87–94. [Google Scholar] [CrossRef]
- Wang, Y.; Zhang, X.; Sugai, Y.; Sasaki, K. A Study on Preventing Spontaneous Combustion of Residual Coal in a Coal Mine Goaf. J. Geol. Res. 2015, 2015, 712349. [Google Scholar] [CrossRef]
- Zhang, X.; Feng, X.; Wang, Z.; Jian, J.; Chen, S.; Luo, W.; Zhang, C. Experimental study on the physico-mechanical properties and microstructure of foam concrete mixed with coal gangue. Constr. Build. Mater. 2022, 359, 129428. [Google Scholar] [CrossRef]
- Wu, D.; Sun, G.; Liu, Y. Modeling the thermo-hydro-chemical behavior of cemented coal gangue-fly ash backfill. Constr. Build. Mater. 2016, 111, 522–528. [Google Scholar] [CrossRef]
- Wu, D.; Yang, B.; Liu, Y. Transportability and pressure drop of fresh cemented coal gangue-fly ash backfill (CGFB) slurry in pipe loop. Powder Technol. 2015, 284, 218–224. [Google Scholar] [CrossRef]
- Wang, X.; Zhao, B.; Zhang, C.; Zhang, Q. Paste-like self-flowing transportation backfilling technology based on coal gangue. Min. Sci. Technol. 2009, 19, 137–143. [Google Scholar] [CrossRef]
- Haiqiang, J.; Fall, M.; Cui, L. Yield stress of cemented paste backfill in sub-zero environments: Experimental results. Miner. Eng. 2016, 92, 141–150. [Google Scholar] [CrossRef]
- Sun, K.; Zhang, J.; He, M.; Li, M.; Guo, S. Control of surface deformation and overburden movement in coal mine area by an innovative roadway cemented paste backfilling method using mining waste. Sci. Total Environ. 2023, 891, 164693. [Google Scholar] [CrossRef]
- Shi, Z.; Zhao, H.; Liang, B.; Sun, W.; Wang, J.; Fang, S. Simulation test study on filling flow law of gangue slurry in goaf. Sci. Rep. 2023, 13, 19117. [Google Scholar] [CrossRef] [PubMed]
- Min, C.; Shi, Y.; Lu, X.; Liu, Z.; Zhou, Y. Cemented backfill using Ca(OH)2-pretreated phosphogypsum as aggregate: Hydration characteristics, structural features and strength development. Constr. Build. Mater. 2023, 402, 133011. [Google Scholar] [CrossRef]
- Zhao, X.; Yang, K.; Wei, Z.; He, X.; Chen, R. Study on the effect of multi-source solid waste on the performance of its backfill slurry. Heliyon 2023, 9, e16251. [Google Scholar] [CrossRef] [PubMed]
- Yang, J.; Yang, B.; Yu, M. Pressure Study on Pipe Transportation Associated with Cemented Coal Gangue Fly-Ash Backfill Slurry. Appl. Sci. 2019, 9, 512. [Google Scholar] [CrossRef]
- Rovnaník, P.; Kusák, I.; Bayer, P.; Schmid, P.; Fiala, L. Comparison of electrical and self-sensing properties of Portland cement and alkali-activated slag mortars. Cem. Concr. Res. 2019, 118, 84–91. [Google Scholar] [CrossRef]
- Mohammed, A.S. Vipulanandan models to predict the electrical resistivity, rheological properties and compressive stress-strain behavior of oil well cement modified with silica nanoparticles. Egypt. J. Pet. 2018, 27, 1265–1273. [Google Scholar] [CrossRef]
- Wang, Z.H.; Qi, T.Y.; Feng, G.R.; Bai, J.W.; Pei, X.M.; Cui, B.Q.; Song, C.; Ran, H.Y. Electrical resistivity method to appraise static segregation of gangue-cemented paste backfill in the pipeline. Int. J. Pres. Ves. Pip. 2021, 192, 104385. [Google Scholar] [CrossRef]
- Liu, J.; Zha, F.; Xu, L.; Kang, B.; Tan, X.; Deng, Y.; Yang, C. Mechanism of stabilized/solidified heavy metal contaminated soils with cement-fly ash based on electrical resistivity measurements. Measurement 2019, 141, 85–94. [Google Scholar] [CrossRef]
- Medeiros-Junior, R.A.; Lima, M.G. Electrical resistivity of unsaturated concrete using different types of cement. Constr. Build. Mater. 2016, 107, 11–16. [Google Scholar] [CrossRef]
- van Noort, R.; Hunger, M.; Spiesz, P. Long-term chloride migration coefficient in slag cement-based concrete and resistivity as an alternative test method. Constr. Build. Mater. 2016, 115, 746–759. [Google Scholar] [CrossRef]
- Yim, H.J.; Bae, Y.H.; Jun, Y. Hydration and microstructural characterization of early-age cement paste with ultrasonic wave velocity and electrical resistivity measurements. Constr. Build. Mater. 2021, 303, 124508. [Google Scholar] [CrossRef]
- Xu, W.; Tian, X.; Cao, P. Assessment of hydration process and mechanical properties of cemented paste backfill by electrical resistivity measurement. Nondestruct. Test. Eva. 2018, 33, 198–212. [Google Scholar] [CrossRef]
- Xu, W.; Tian, X.; Wan, C. Prediction of Mechanical Performance of Cemented Paste Backfill by the Electrical Resistivity Measurement. J. Test. Eval. 2018, 46, 2450–2458. [Google Scholar] [CrossRef]
- Feng, G.; Wang, Z.; Qi, T.; Du, X.; Guo, J.; Wang, H.; Shi, X.; Wen, X. Effect of velocity on flow properties and electrical resistivity of cemented coal gangue-fly ash backfill (CGFB) slurry in the pipeline. Powder Technol. 2022, 396, 191–209. [Google Scholar] [CrossRef]
- Fu, Z.; Li, H.; Deng, J.; Qiao, D.; Wang, J. Bivariate rheological model of ultrafine tailings backfill slurry based on structural parameter and its applications. Chin. J. Nonferrous Met. 2021, 31, 1672–1685. [Google Scholar] [CrossRef]
- Deng, X.; Klein, B.; Tong, L.; de Wit, B. Experimental study on the rheological behavior of ultra-fine cemented backfill. Constr. Build. Mater. 2018, 158, 985–994. [Google Scholar] [CrossRef]
- Yin, S.; Shao, Y.; Wu, A.; Wang, Z.; Yang, L. Assessment of expansion and strength properties of sulfidic cemented paste backfill cored from deep underground stopes. Constr. Build. Mater. 2020, 230, 116983. [Google Scholar] [CrossRef]
- Chidiac, S.E.; Mihaljevic, S.N.; Krachkovskiy, S.A.; Goward, G.R. Characterizing the effect of superabsorbent polymer content on internal curing process of cement paste using calorimetry and nuclear magnetic resonance methods. J. Therm. Anal. Calorim. 2021, 145, 437–449. [Google Scholar] [CrossRef]
- Yang, L.; Wang, H.; Li, H.; Zhou, X. Effect of High Mixing Intensity on Rheological Properties of Cemented Paste Backfill. Minerals 2019, 9, 240. [Google Scholar] [CrossRef]
- Gürer, C.; Düşmez, C.; Boğa, A.R. Effects of different aggregate and conductive components on the electrically conductive asphalt concrete’s properties. Int. J. Pavement Eng. 2023, 24, 2068547. [Google Scholar] [CrossRef]
- Rahman, M.L.; Ceylan, H.; Kim, S.; Taylor, P.C. Influence of electrode placement depth on thermal performance of electrically conductive concrete: Significance of threshold voltage for long-term stability. Constr. Build. Mater. 2024, 412, 134883. [Google Scholar] [CrossRef]


| Chemical Composition | SiO2 | Al2O3 | CaO | Fe2O3 | TiO2 | K2O | Total |
|---|---|---|---|---|---|---|---|
| Content | 39.15 | 26.38 | 23.42 | 5.03 | 1.34 | 0.79 | 100 |
| Chemical Composition | SiO2 | Al2O3 | Fe2O3 | TiO2 | K2O | CaO | Total |
|---|---|---|---|---|---|---|---|
| Content | 57.68 | 31.42 | 4.98 | 1.74 | 1.59 | 1.42 | 100 |
| Chemical Composition | CaO | SiO2 | Al2O3 | Fe2O3 | MgO | Others | Total |
|---|---|---|---|---|---|---|---|
| Content | 64.55 | 23.28 | 5.42 | 3.48 | 1.19 | 2.08 | 100 |
| Illustration of Nomenclature | SC72 | SC73 | SC74 | SC75 | SC76 | CC8 | CC10 | CC12 | CC14 | CC16 |
|---|---|---|---|---|---|---|---|---|---|---|
| w (%) | 72 | 73 | 74 | 75 | 76 | 74 | 74 | 74 | 74 | 74 |
| wg (%) | 58 | 58 | 58 | 58 | 58 | 64 | 62 | 60 | 58 | 56 |
| wf (%) | 28 | 28 | 28 | 28 | 28 | 28 | 28 | 28 | 28 | 28 |
| wc (%) | 14 | 14 | 14 | 14 | 14 | 8 | 10 | 12 | 14 | 16 |
| Sample Nomenclature | Regression Equation | R2 | Yield Stress (Pa) | Viscosity (Pa·s) |
|---|---|---|---|---|
| SC72 | 1.387x + 98.463 | 0.971 | 98.463 | 1.387 |
| SC73 | 1.452x + 105.631 | 0.983 | 105.631 | 1.452 |
| SC74 | 1.515x + 116.365 | 0.968 | 116.365 | 1.515 |
| SC75 | 1.719x + 124.862 | 0.951 | 124.862 | 1.719 |
| SC76 | 1.842x + 148.791 | 0.958 | 148.791 | 1.842 |
| Sample Nomenclature | Regression Equation | R2 | Yield Stress (Pa) | Viscosity (Pa·s) |
|---|---|---|---|---|
| CC8 | 1.106x + 90.425 | 0.953 | 90.425 | 1.106 |
| CC10 | 1.251x + 99.631 | 0.961 | 99.631 | 1.251 |
| CC12 | 1.413x + 108.254 | 0.956 | 108.254 | 1.413 |
| CC14 | 1.719x + 124.862 | 0.951 | 124.862 | 1.719 |
| CC16 | 1.989x + 138.436 | 0.972 | 138.436 | 1.989 |
Disclaimer/Publisher’s Note: The statements, opinions and data contained in all publications are solely those of the individual author(s) and contributor(s) and not of MDPI and/or the editor(s). MDPI and/or the editor(s) disclaim responsibility for any injury to people or property resulting from any ideas, methods, instructions or products referred to in the content. |
© 2024 by the authors. Licensee MDPI, Basel, Switzerland. This article is an open access article distributed under the terms and conditions of the Creative Commons Attribution (CC BY) license (https://creativecommons.org/licenses/by/4.0/).
Share and Cite
Hao, Y.; Song, X.; Wang, C.; Fan, B.; Yang, K. Investigation of Viscoelastic-Plastic Properties of Fresh Cemented Gangue Fly Ash Backfill Slurries. Minerals 2024, 14, 401. https://doi.org/10.3390/min14040401
Hao Y, Song X, Wang C, Fan B, Yang K. Investigation of Viscoelastic-Plastic Properties of Fresh Cemented Gangue Fly Ash Backfill Slurries. Minerals. 2024; 14(4):401. https://doi.org/10.3390/min14040401
Chicago/Turabian StyleHao, Yuxin, Xuepeng Song, Chengshuai Wang, Bowen Fan, and Kai Yang. 2024. "Investigation of Viscoelastic-Plastic Properties of Fresh Cemented Gangue Fly Ash Backfill Slurries" Minerals 14, no. 4: 401. https://doi.org/10.3390/min14040401
APA StyleHao, Y., Song, X., Wang, C., Fan, B., & Yang, K. (2024). Investigation of Viscoelastic-Plastic Properties of Fresh Cemented Gangue Fly Ash Backfill Slurries. Minerals, 14(4), 401. https://doi.org/10.3390/min14040401