Abstract
Soils derived from black shale enriched in heavy metals pose risks to the environment and human health. Eighty sets of soil–rice samples were collected in northwest Zhejiang, China. The results showed significant enrichment of As, Cd, Pb, and Zn in the studied soil. Sequential extraction data indicated that Cd had relatively high bioavailability. Thirty-four percent of the rice samples exceeded the heavy metal pollution thresholds of national food safety standards. A comprehensive evaluation of soil heavy metals using the potential ecological risk index (RI) revealed low-to-moderate-grade risk. Risk assessment code (RAC) levels decreased as follows: Cd > Ni > Zn > Cr > Cu > Pb > As > Hg. The RAC of Cd was high and very high risk, whereas those of others were no or low risk. Cd was the major contributor to the environmental risk based on the total heavy metal concentration, toxicity, and chemical fractions. The health risk to the local populace was assessed using the method recommended by the USEPA. Local people may experience both non-carcinogenic and carcinogenic health risks, and children face greater health risks than adults. As, Cd, and Pb are the most significant contributors to non-carcinogenic health risks, and Cd is the main carcinogenic risk. In conclusion, special attention should be given to heavy metal pollution in black shale-derived soils.
1. Introduction
Heavy metals such as cadmium (Cd), chromium (Cr), mercury (Hg), lead (Pb), copper (Cu), zinc (Zn), nickel (Ni), and arsenic (As) are naturally ubiquitous throughout the soil environment. When heavy metals in soils are directly exposed or transmitted through the food chain, they not only affect the ecological environment but also seriously threaten animals and human health [1,2,3,4,5,6]. In addition to soil heavy metal pollution caused by typical human activities, such as mining and metallurgy, industry, and agriculture, a high regional geochemical background is an important factor for soil heavy metal enrichment [7,8,9,10]. A high geochemical background refers to the enrichment of heavy metals in the soil caused by a high content of heavy metals in its parent material. For example, soils derived from black shale or karst regions are often anomalously enriched in heavy metals [11,12]. The karst region in the southwestern provinces (i.e., Guangxi, Yunnan, and Guizhou) of China, well known as one of the largest karst terrains globally, has been reported to have widespread heavy metal anomalies, and its environmental effects have been widely studied [13,14]. Research has shown that the potential mobility and bioavailability of heavy metals in soils with a high geochemical background related to karsts are usually low [12]. Black shale, which is a composite system of siliceous, carbonate, argillaceous, and metamorphic rocks, is often formed in relatively deep anoxic oceanic basins. Black shale is enriched in sulfides and organic matter (OM) during the deposition process; therefore, it is rich in various heavy metals. After exposure, they easily decompose by weathering and produce acidic drainage, resulting in the entry of heavy metals into the surrounding environment [15]. In recent years, the ecological risks caused by the weathering of black shale have gradually attracted the attention of scholars. Kontinen and Hanski [16] found that the geochemical weathering of the Talvivaara black shale in Finland significantly increased the Pb, Cu, Mn, Ni, and Zn contents in stream sediments. The Cd content in soils derived from black shale in Okchon, South Korea, is 0.2–5.7 mg·kg−1, which is significantly higher than the global average [17]. Du et al. [18] found that high concentrations of Se, As, Mo, and Ti in soil, plants, and water samples from southern Shaanxi, China, may pose health risks to local residents because of the weathering of black shale. The above-mentioned studies all show that relatively high concentrations of potentially toxic heavy metals in soils derived from black shale can be transferred into water systems and plants, which may eventually threaten human health.
The soil–crop system is a significant way that humans are exposed to potentially harmful elements. Therefore, attention should be given to the ecological environment and human health risks caused by heavy metal pollution in farmland soil–crop systems. In southern China, metal-enriched black shale dating to the Early Cambrian occurs over several thousands of kilometers throughout the Yangtze Platform [19]. As one of the largest black shale distribution areas in China, the northwest Zhejiang Province, which includes Kaihua, Chun An, Lin An, and Anji counties, has a significantly higher soil heavy metal content due to the weathering of black shale [20,21,22]. However, there are few studies on the ecological risk assessment of heavy metals in this area, which restricts the safe use of land and the production of agricultural products in high-geochemical-background areas of black shale.
Therefore, this study selected the farmland soil–crop system of the black shale region in northwestern Zhejiang and analyzed the migration and enrichment characteristics of As, Cd, Cr, Cu, Hg, Ni, Pb, and Zn in the soil–crop system. Based on the total heavy metal concentration, toxicity, and chemical fractions, the potential ecological risk index (RI) and risk assessment code (RAC) were used to comprehensively assess the ecological risk of heavy metals in the study area. The human health risk assessment method recommended by the USEPA was used to quantify the health risks of residents exposed to heavy metals through food consumption, soil ingestion, and dermal contact. This study provides a reliable scientific basis for solving the problem of soil heavy metal pollution prevention and protecting the health of local people.
2. Materials and Methods
2.1. Study Area
The study area was located in the northwest Zhejiang Province, and the majority of the sampling sites were distributed in the Cambrian black shales in Anji and Chunan counties (Figure 1), which have a high geochemical background of heavy metals such as Cd (Figure 2). Northwestern Zhejiang is covered by a Lower Cambrian black shale sequence with a thickness of 450–1700 m. The top series, which includes the Huayansi and Xiyangshan formations, is well developed. The Hetang and Dachenling formations are in the bottom series, and the Yangliugang Formation is in the intermediate series. The lowest section of the Cambrian is composed of siliceous sedimentary rock interwoven with coal seams and phosphate rock layers, whereas the middle and top sections are dominated by carbonate rocks [23]. Average yearly temperatures range from 15 to 18 °C, with average annual precipitation ranging from 1100 to 2000 mm. The terrain is mainly mountainous and hilly, with elevation ranging from 15 to 1543 m. Agriculture, which includes paddy fields, dry land, and woodland, was the primary land use category. The three basic soil types used for agriculture were paddy, red, and yellow.
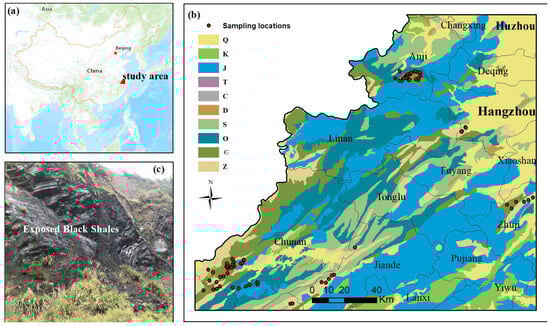
Figure 1.
(a) Location of the study area in Zhejiang, China. (b) Distribution of sampling sites and simplified geological map. (c) Exposed black shale outcrop in the study area.
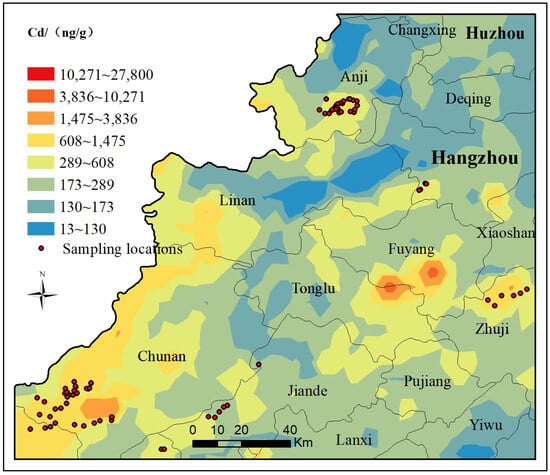
Figure 2.
Distribution of sampling sites and Cd geochemical soil map in Zhejiang, China [22].
2.2. Sample Collection
In the study region, 80 sets of soil–rice samples were collected. In each chosen field, four or more sampling points were established to gather soil and rice samples. Five to ten different rice panicle strains were collected from each rice sampling point and pooled into a single sample. Each rice sample weighed >0.5 kg. Root soil samples from the surface layer (0–20 cm) were collected at the same location as the plant samples, and the initial mass of each soil sample was larger than 1 kg. The collected soil samples were screened using a 10-mesh (2 mm) nylon screen after drying naturally. The soil samples were sifted, mixed equally, placed in polyethylene plastic bottles, and delivered to the laboratory. Plant samples were delivered directly to the laboratory for processing and analysis.
2.3. Analytical Methods
As, Cd, Cr, Cu, Ni, Pb, and Zn concentrations were analyzed in soil and crop samples, in addition to pH and OM analysis in soil samples. The Experimental Testing Center of the Institute of Geophysical and Geochemical Exploration, Chinese Academy of Geological Sciences, completed the testing and analysis of the samples. The analytical methods and detection limits for the soil and crop samples are listed in Table 1. Analytical accuracy and precision were controlled based on analyses of standard reference materials (GSS22, GSS25, GSS26, GSS27, GSB-1, and GSB-2), as well as field and laboratory replicate samples. A total of 6 field replicate samples were collected. For each set of 20 samples, a laboratory replicate sample was collected. RD (relative deviation) was used to test the results of replicate samples.

Table 1.
Analysis methods and detection limits for soil and crop samples.
For the sequential extraction procedures, a seven-step sequential extraction procedure was selected to extract As, Cd, Cr, Cu, Hg, Ni, Pb, and Zn from the soils. The operating procedures, based on the Technical Requirements for the Analysis of Samples for Ecogeochemical Evaluation [24], are listed in Table 2.
Table 2.
Sequential extraction procedures.
2.4. Statistical and Data Analysis Methods
2.4.1. Bioconcentration Factor (BCF) from Soil to Plant
The bioconcentration factor (BCF) [25,26] is an important index for describing the degree of heavy metal absorption from soil by crops. It can be used to quantitatively assess the risks and harm caused by heavy metal accumulation in crops. The BCF was defined using the following formula:
where CPlant and CSoil represent the heavy metals in the edible parts of the crops and corresponding soil samples, respectively. The greater the BCF, the higher the absorption and enrichment of heavy metals by crops.
BCF = CPlant/CSoil,
2.4.2. Potential Ecological Risk Index (RI)
The RI [27] was used to evaluate the degree of potential ecological risk caused by heavy metal concentrations affecting the soil quality. The RI is based on heavy metal content and considers the ecological environment and toxicological effects of heavy metals. The RI is defined as follows:
where is the single potential ecological risk index of a heavy metal; Ci and are the measured and background concentrations of heavy metals in soils, respectively; is the toxicity factor; and the values for each heavy metal are: Zn = 1, Cr = 2, Cu = Ni = Pb = 5, As = 10, Cd = 30, and Hg = 40 [27]. The grading standards for and RI are listed in Table 3 [27].
Table 3.
Grading standards for potential ecological risk.
2.4.3. Risk Assessment Code (RAC)
The RAC was originally defined by Perin et al. [28] and is based on the different chemical fractions of heavy metals in the soil. The RAC determines the bioavailability of heavy metals by applying a scale to the proportions of heavy metals in the bioavailable fraction. The higher the RAC, the greater the ecological risk posed by heavy metals. The RAC is defined as follows:
where (CF1 + CF2 + CF3) is the sum of the water-soluble, exchangeable, and carbonate-bound fractions of the heavy metals in the soil. CTotal is the total amount of heavy metals in the soil. A five-level classification of RAC is defined as follows: no risk (RAC < 1%), low risk (1% ≤ RAC < 10%), medium risk (10% ≤ RAC < 30%), high risk (30% ≤ RAC < 50%), and very high risk (RAC ≥ 50%).
RAC = (CF1 + CF2 + CF3)/CTotal,
2.4.4. Human Health Risk Assessment
Based on behavioral and physiological differences, the target inhabitants were categorized into two groups: adults and children. Non-carcinogenic and carcinogenic health risks were estimated based on food consumption, soil ingestion, and dermal contact. The estimated average daily intake (ADI) was calculated as follows [29]:
where ADIfood, ADIing, and ADIdermal are the average daily doses of heavy metals through food consumption, soil ingestion, and dermal absorption, respectively (mg/kg/day); Ccrop and Csoil are the heavy metal concentrations in the crops and soil (mg/kg), respectively. The parameters and reference data provided by the U.S. Environmental Protection Agency are listed in Table 4.
Table 4.
Parameters used for health risk assessment.
Non-carcinogenic risks were characterized by the target hazard quotient (HQ) and hazard index (HI). The HQ is the ratio of the estimated average daily intake (ADI, (mg/kg/day)) to the reference dose (RfD, (mg/kg/day)). HI is used to estimate the total potential health risk, which is equal to the sum of all HQs values [30]:
The reference dose (RfD) of each element and the value of each adopted parameter are listed in Table 5. There is no serious risk from heavy metal exposure if HI is lower than 1; when HI is equal to or higher than 1, the exposed population is likely to experience adverse effects.
Table 5.
Health risk assessment of risk reference dose (RfD) and slope coefficient (SF).
Carcinogenic risk (CR), estimated as the probability of carcinogenic risk over a lifetime, is the ADI multiplied by the cancer slope factor (SF) [31]:
If the CR value is higher than 1 × 10⁻⁴, the risk is unacceptable. A CR between 1 × 10⁻⁶ and 1 × 10⁻⁴ means an acceptable or tolerable carcinogenic risk. A CR value less than 1 × 10⁻⁶ indicates no significant health hazards. The values of each parameter are listed in Table 5.
3. Results
3.1. Soil Characteristics and Heavy Metals Concentrations in Soils
The statistical results for the soil heavy metal content, pH, and OM are shown in Table 6. The soil pH value in the study area ranged from 4.88 to 7.80, with a mean value of 6.07, indicating obvious acidic characteristics. The OM ranged from 0.74% to 5.85%, with an average of 3.40%, which was obviously higher than the soil geochemical background values of Zhejiang Province (1.34%) and China (1.15%) [32]. The average soil contents of As, Cd, Pb, and Zn were 13.96, 0.07, 48, and 126, also obviously higher than the soil geochemical background values of Zhejiang Province and China, indicating that they had clear enrichment characteristics. The CVs of As, Cd, Cu, Hg, Ni, Pb, and Zn in the soil were all greater than 0.36, indicating that they were highly variable elements. The CV (coefficient of variation) of Cr was between 0.16 and 0.35, indicating that Cr exhibited moderate variability. Based on the national soil environmental quality risk control standard (GB15618-2018) [33], the over-standard rates of heavy metals in soil followed a decreasing order: Cd (85%), Zn (10%), As (9%), Cu (6%), Pb (6%), Hg (4%), and Ni (1%). Cr in all the soil samples did not exceed the risk screening value of GB15618-2018, indicating no risk of pollution.
Table 6.
Descriptive statistics of heavy metals in soils of the study area (n = 80).
3.2. Heavy Metal Fractionations in Soils
The chemical fractions of heavy metals in the soil are important indicators of heavy metal mobility and bioavailability. The water-soluble (F1), exchangeable (F2), carbonate-bound (F3), humic-acid-bound (F4), Fe-Mn oxide-bound (F5), strong organic-bound (F6), and residual fractions (F7) were obtained using a seven-step sequential extraction procedure [24]. Metal solubility, mobility, and biological activity gradually decreased. The available fraction (F1 + F2 + F3) is the bioavailable component that is most easily absorbed and utilized by plants. The medium-availability fraction (F4 + F5 + F6) was a potential bioavailable component. The residual fraction (F7) is the most stable, mainly existing in the mineral lattice and difficult for plants to absorb and utilize [34,35].
The percentages of the chemical fractions of heavy metals in the soil of the study area are shown in Figure 3. As, Cr, Hg, Ni, and Zn existed in the form of residual fractions in the soil, accounting for 64.7%, 78.4%, 78.7%, 71.2%, and 61.7% of the total, respectively. The bioavailable components (F1 + F2 + F3) of As, Cr, Hg, Ni, and Zn were low, accounting for 2.42%–8.97% of the total content. The potential bioavailable components (F4 + F5 + F6) of Cu and Pb were the highest, accounting for 48.67% and 45.83%, respectively. The bioavailable component (F1+ F2+ F3) of Cd accounted for 59.90%, of which the F2 fraction was the highest proportion and accounted for 53.6%; the potentially bioavailable component (F4 + F5 + F6) accounted for 27.02%, and the residual fraction accounted for the smallest proportion. The bioavailable component, which is the sum of (F1 + F2 + F3), is more easily assimilated by organisms and transferred to the human body via the food chain [36]. The bioavailable and potential bioavailable components of Cd in the studied soils were significantly higher than those of other heavy metal elements, indicating high bioavailability. Chemical fractions indicated that Cd in the soil mainly exists in the form of Cd2+ or simple coordination ions, and its binding ability to organic ligands and iron–manganese oxides is relatively weak. In the acidic soil environment of the study area, Cd is more easily converted to the exchangeable fraction in the soil and absorbed and utilized by crops, resulting in a high environmental risk [22].
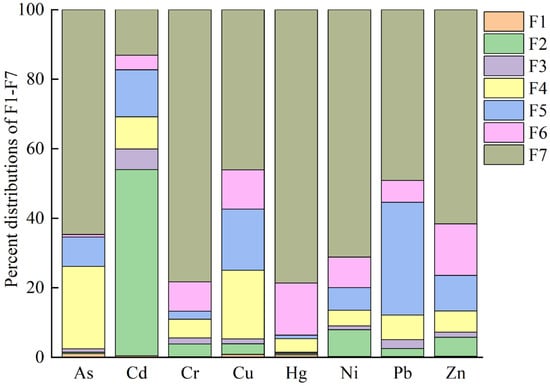
Figure 3.
Chemical fractions of heavy metals in the soil. F1: water-soluble fraction; F2: exchangeable fraction; F3: carbonate-bound fraction; F4: humic-acid-bound fraction; F5: Fe-Mn oxide-bound fraction; F6: strong organic-bound fraction; F7: residual fraction.
3.3. Heavy Metal Concentrations in Crops
The statistical characteristics of the heavy metal concentrations in the crops in the study area are shown in Table 7. According to the national food quality standard (GB2762-2017) [37], the concentrations of As, Cr, Hg, and Pb in rice were lower than national safety limits. A total of 27 rice samples had Cd concentrations exceeding national safety limits (0.2 mg∙kg−1), and the over-standard rate was 34%, which was significantly lower than the over-standard rate of Cd in soil. Although the over-standard rate of heavy metal concentrations in the studied soil is high, the over-standard rate of heavy metal concentrations in crops is low. Therefore, the chemical fraction characteristics, absorption, and enrichment of heavy metals by crops should be further considered in comprehensive ecological risk assessments to avoid wasting cultivated land resources.
Table 7.
Characteristic statistics of heavy metal content in crops.
The transport and accumulation of heavy metals from soil to crops are critical processes in human exposure to heavy metals via the food chain, and the absorption and migration ability of heavy metals in soil–crop systems is an important index for ecological risk assessment [38]. The BCF values of the crop samples in the study area are listed in Table 8. Based on the investigation of 80 paired soil–rice samples, the ability to transfer was found to be significantly different among the various studied metals, with a wide range of BCF values. The average BCF values of heavy metals in the rice samples were as follows: Cd > Zn > Cu > Hg > As > Ni > Cr > Pb; thus, Cd had a higher ecological risk than the other heavy metal elements. The BCFs of Cd and Zn in the rice samples were one to two orders of magnitude higher than those of the other heavy metal elements, and that of Cd was significantly higher than that of Zn, indicating that Cd in the soil was the most likely to migrate into rice, followed by Zn and Cu. The migration and absorption rate of Cd in rice was approximately 27.6%, significantly higher than that of other heavy metal elements. This shows the high bioavailability of soil Cd, which is consistent with the results that the chemical fractions of Cd (Figure 3) were mainly bioavailable (59.90%) and potential bioavailable components (27.02%). Compared to other heavy metals, the absorption and accumulation ability of Cd in rice is relatively strong, and the over-standard rate of Cd is higher. Although Zn and Cu were primarily in the residual state, their migration and absorption rates in rice were second only to those of Cd. This is because Zn and Cu are essential elements for crop growth, but when excessively enriched in soil, they can harm crop growth [39,40].
Table 8.
Bioconcentration factors (BCFs) of heavy metals in crop samples.
4. Discussion
4.1. Ecological Risk Assessment
To evaluate the pollution and potential ecological risks posed by heavy metals in the study area, and RI values were determined for all soil samples (Table 9). The Ei values of Cr, Cu, Ni, Pb, and Zn in the soil samples were all less than 40, indicating a low-grade risk. The average value of As was 17.9, which represented a low-grade risk, accounting for 91.25% of the total samples. The value of Hg ranged from 11.7 to 366.7, with an average of 43.1. The samples with low- and moderate-grade risks of Hg accounted for 61.25% and 35% of the total samples, respectively. The value of Cd ranged from 27.2 to 366.7, with low- to very-high-grade risk. The RI of Cd was moderate to considerable, accounting for 36.25% and 30% of the total samples, followed by high and very high grades, accounting for 13.75% and 11.25% of the total samples. The results showed that Cd was the most significant risk element in the soil of the study area, followed by Hg. The comprehensive RI of heavy metals in the soil ranged from 56.7 to 1032, with an average of 241. The RI revealed that the risks of soil heavy metals were primarily low to moderate grade, accounting for 37.5% and 45% of the total samples. Considerable- and high-grade ecological risk samples accounted for a relatively small proportion, 10% and 7.5%, respectively, and there was no very-high ecological risk sample. Based on the results of the comprehensive potential ecological risk assessment of the total amount of heavy metals, there are potential ecological risks in the study area, though they are mainly low to moderate grade.
Table 9.
Classification statistics for the potential ecological risk assessment of heavy metals in soil.
In addition to the total amount, the chemical fractions of heavy metals in soil are imperative for assessing their hazards, as the mobility and bioavailability of heavy metals in soils are closely related to their chemical fractions. Singh et al. [41] showed that an increase in the exchangeable and carbonate-bound fractions significantly increased the bioavailability of heavy metals. The soil in the study area was acidic, and the carbonate-bound state easily became a direct supplier of the exchangeable state and was easily absorbed by the plants. Therefore, when determining RAC in the study area, the sum of the water-soluble (F1), exchangeable (F2), and carbonate-bound fractions (F3) was used as the bioavailable fraction. RAC levels decreased in the following order: Cd > Ni > Zn > Cr > Cu > Pb > As > Hg (Figure 4). As, Cr, Cu, Hg, Ni, Pb, and Zn in most soil samples were either low- or no-risk, indicating that these heavy metals had low mobility and bioavailability. The RAC of Cd was mainly at high and very high risk, accounting for 20% and 51% of the total samples. Cd poses a high potential environmental risk owing to its toxicity and chemical fractions. This element is potentially hazardous, and related to 80% monosulfides (sphalerite), 10% pyrite, and 10% silicate in low-rank coals [42,43]. The high geochemical background caused by the weathering of black shale in the study area has led to a high ecological risk from soil Cd in the region. Black shale often forms in relatively deep, anoxic ocean basins. During the deposition process, it is rich in sulfides, organic matter, and a variety of heavy metal elements. After exposure, it decomposes easily via weathering, producing acidic drainage. Driven by hydrodynamic forces, it can accelerate the migration of heavy metals to surrounding and downstream farmland soils, which further threatens the ecological environment and human health [44,45,46].
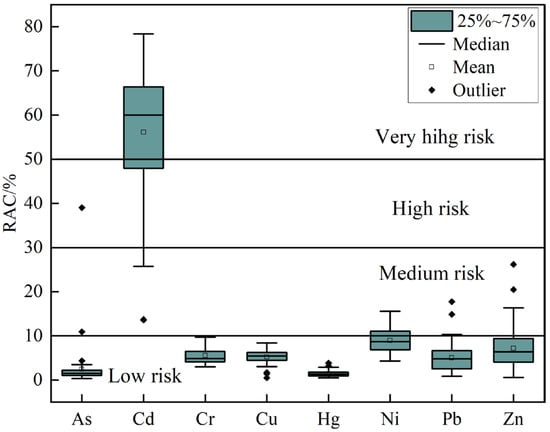
Figure 4.
Risk assessment code (RAC) grade map of soil heavy metals.
4.2. Health Risk Assessment
Heavy metals in soils not only damage the ecological environment but also endanger human health [19]. The potential health risks caused by heavy metals in soils and crops have been divided into two pathways: chronic exposure to polluted soil particles and ingestion of contaminated crops [47,48]. Based on behavioral and physiological differences, the target inhabitants were categorized into two groups: children and adults. Non-carcinogenic and carcinogenic health risks were estimated based on food consumption, soil ingestion, and dermal contact (Table 10). The HI values for adults and children were 5.2 and 15.1, respectively. Both were greater than 1, indicating that the local population may experience non-carcinogenic health risks. The sums of the HQ values of As, Cd, and Pb for adults and children were 4.5 and 13.2, accounting for 86% and 88% of the HI values, respectively (Figure 5). This indicates that the non-carcinogenic risk in the study area was primarily caused by exposure to As, Cd, and Pb. The non-carcinogenic health risk for children is significantly greater than that of adults, indicating that children are more sensitive to environmental pollutants [49].
Table 10.
Estimation of non-carcinogenic health risks of soil heavy metals.

Figure 5.
Hazard index (HI) for (a) adults and (b) children for different soil heavy metals.
Comparing the effects of the different exposure pathways on human health risks (Figure 6), crops contaminated with heavy metals were the most significant contributors to health risks. In our study, the mean HQfood values for adults and children were 4.7 and 11.2, contributing approximately 89.0% and 73.9% of the total risk (HI). Previous studies have indicated that Cd and Pb accumulate in rice grains, becoming the most significant source of dietary Cd and Pb in China [50]. The main food source for the residents in the study area is rice, which easily accumulates heavy metals. It can efficiently absorb heavy metals from acidic soil and water, with these contaminants concentrating in rhizomes and grains and posing a direct risk to human health [51]. However, this study only considered the health risks caused by the intake of heavy metal-contaminated rice and did not consider the intake of other types of food, potentially underestimating the HQfood values. In addition to food consumption, soil ingestion and dermal contact with soil are two other pathways of heavy metal transfer to local inhabitants [47]. The HQing values for adults and children were 0.53 and 3.74, and contributed approximately 10.2% and 24.8% of the total risk. The HQing values for children were greater than 1, indicating that the exposure pathway of soil ingestion poses non-carcinogenic health risks for children. The HQdermal values of adults and children were 0.04 and 0.20 and contributed approximately 0.8% and 1.3% of the total risk. Dermal contact with the soil is relatively safe for both adults and children. Children had higher HQing and HQdermal values than adults, indicating that children have a higher health risk under both exposure pathways. Children ingest significantly higher quantities of soil because of hand-to-mouth or finger-sucking activities and lower body weight, which are widely regarded as the two reasons for the higher values of risks through ingestion and dermal contact [13]. Developing good hygiene habits may be an effective way to protect children from exposure to heavy metals.
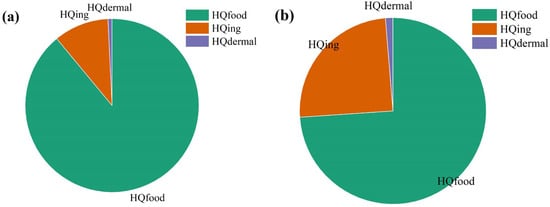
Figure 6.
HI for (a) adults and (b) children under different exposure pathways.
The health risk in the study area is primarily caused by exposure to As, Cd, and Pb, which are the main carcinogenic heavy metals [52]. The potential carcinogenic risks of As, Cd, and Pb exposure were assessed; the results are shown in Table 11. The comprehensive CR values of adults and children were 2.64 × 10⁻³ and 7.45 × 10⁻³, respectively. Both were greater than 1.00 × 10⁻⁴, indicating that the local populace may experience unacceptable carcinogenic health risks. Figure 7 and Figure 8 show the distribution of the carcinogenic risk index caused by different elements in adults and children, respectively. The mean CR values for Pb in the adults and children were 5.37 × 10⁻⁷ and 2.36 × 10⁻⁶, respectively. Exposure to Pb in adults and children resulted in carcinogenic risks of non-significant and acceptable grades, respectively. As and Cd were the main carcinogenic risk elements in the study area, and the CR value of Cd was significantly higher than that of As. Cd is the most significant contributor to carcinogenic health risks. Cd is considered a carcinogenic contaminant because of its specific toxicity, which is related to the carcinogenic risk (CR) value [53]. Through food consumption, soil ingestion, and dermal contact, the CR values of children were significantly higher than those of adults. Therefore, it is necessary to consider the carcinogenic health risks of farmland soil systems to the human body, particularly to children, in the study area.
Table 11.
Carcinogenic risk (CR) estimation of soil heavy metals.
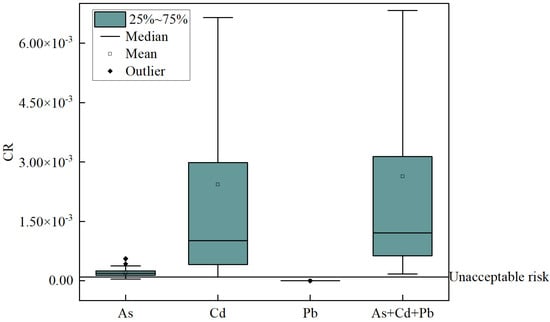
Figure 7.
CR of adults.
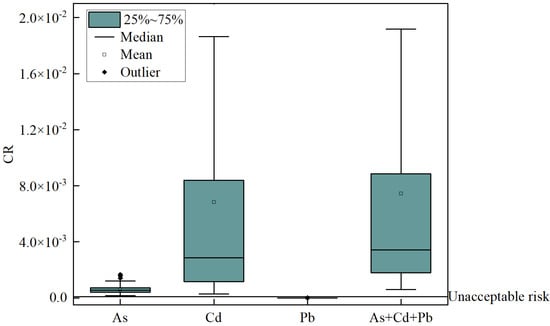
Figure 8.
CR of children.
5. Conclusions
Significant enrichment of As, Cd, Pb, and Zn was found in the sampled soils across the black shale region and was attributed to the weathering of the black shale, producing high concentrations of heavy metals in subsequent soil formation. The bioactive and potentially bioactive components of Cd accounted for 59.90% and 27.02%, respectively, with relatively high bioavailability. As, Cr, Hg, Ni, and Zn were predominantly found in the residual fraction (mean of 61.65% to 78.67%). A total of 34% of the rice samples contained Cd above the heavy metal pollution thresholds of the national food safety standards. The BCFs of heavy metals in the rice samples were as follows: Cd > Zn > Cu > Hg > As > Ni > Cr > Pb. A comprehensive evaluation of soil heavy metals using the RI revealed that the risks of soil heavy metals were mainly low to moderate grade. The RAC levels decreased in the following order: Cd > Ni > Zn > Cr > Cu > Pb > As > Hg. The RAC of Cd was high and very high risk, whereas other heavy metals were no or low risk. Cd poses a high potential environmental risk based on the total heavy metal concentration, toxicity, and chemical fractions, and the results of the health risk assessments illustrated that the local populace may experience non-carcinogenic and carcinogenic health risks. The health risks associated with heavy metal exposure in children are significantly greater than those in adults. Food consumption is the main exposure pathway for heavy metals, followed by soil ingestion and dermal contact. As, Cd, and Pb are the most significant contributors to non-carcinogenic health risks, and Cd was also the main carcinogenic risk element in the study area. In conclusion, Cd contributed the most to the potential ecological and health risks in the study area. Special attention should be given to heavy metal pollution in black shale-derived soils. Policies are needed to reduce soil pollution levels and to implement classified management of agricultural land to ensure the safety of the agricultural production environment.
Author Contributions
Conceptualization, C.W. and B.S.; methodology, M.T.; software, X.C.; formal analysis, C.W.; investigation, C.W. and D.L.; resources, B.S.; data curation, Y.Z.; writing—original draft preparation, C.W.; writing—review and editing, B.S. and M.T.; visualization, X.C.; supervision, C.W.; project administration, C.W.; funding acquisition, C.W. All authors have read and agreed to the published version of the manuscript.
Funding
This research was funded by the China Geological Survey Project (DD20221807), Surplus Funds of the Institute of Geophysical and Geochemical Exploration (JY201905), and National Nonprofit Institute Research Grant of IGGE (AS2022P03).
Data Availability Statement
Data can be obtained from the corresponding author upon reasonable request.
Conflicts of Interest
Author Dong Liu was employed by the Shanxi Geological Survey Institute Co., Ltd. The remaining authors declare that the research was conducted in the absence of any commercial or financial relationships that could be construed as a potential conflict of interest.
References
- Liu, M.; Zhang, A.; Liao, Y.; Chen, B.; Fan, D. The Environment Quality of Heavy Metals in Sediments from the Central Bohai Sea. Mar. Pollut. Bull. 2015, 100, 534–543. [Google Scholar] [CrossRef] [PubMed]
- Wang, S.; Cai, L.M.; Wen, H.H.; Luo, J.; Wang, Q.S.; Liu, X. Spatial Distribution and Source Apportionment of Heavy Metals in Soil from a Typical County-Level City of Guangdong Province, China. Sci. Total Environ. 2019, 655, 92–101. [Google Scholar] [CrossRef] [PubMed]
- Rascio, N.; Navari-Izzo, F. Heavy Metal Hyperaccumulating Plants: How and Why Do They Do It? And What Makes Them so Interesting? Plant Sci. 2011, 180, 169–181. [Google Scholar] [CrossRef] [PubMed]
- Wu, W. Assessment of Heavy Metal Pollution and Human Health Risks in Urban Soils around an Electronics Manufacturing Facility. Sci. Total Environ. 2018, 630, 53–61. [Google Scholar] [CrossRef] [PubMed]
- Salati, S.; Moore, F. Assessment of Heavy Metal Concentration in the Khoshk River Water and Sediment, Shiraz, Southwest Iran. Environ. Monit. Assess. 2010, 164, 677–689. [Google Scholar] [CrossRef] [PubMed]
- Saydam Eker, Ç. Distinct Contamination Indices for Evaluating Potentially Toxic Element Levels in Stream Sediments: A Case Study of the Harşit Stream (NE Turkey). Arab. J. Geosci. 2020, 13, 1175. [Google Scholar] [CrossRef]
- Zhao, F.J.; Ma, Y.; Zhu, Y.G.; Tang, Z.; McGrath, S.P. Soil Contamination in China: Current Status and Mitigation Strategies. Environ. Sci. Technol. 2015, 49, 750–759. [Google Scholar] [CrossRef] [PubMed]
- N’guessan, Y.M.; Probst, J.L.; Bur, T.; Probst, A. Trace Elements in Stream Bed Sediments from Agricultural Catchments (Gascogne Region, S-W France): Where Do They Come From? Sci. Total Environ. 2009, 407, 2939–2952. [Google Scholar] [CrossRef] [PubMed]
- Wu, X.; Probst, A. Influence of Ponds on Hazardous Metal Distribution in Sediments at a Catchment Scale (Agricultural Critical Zone, S-W France). J. Hazard. Mater. 2021, 411, 125077. [Google Scholar] [CrossRef]
- Eker, Ç.S.; Arı, U.V. The Potential Toxic Element Contents of Berriasian–Aptian Carbonate Rocks: Distribution of Elements in Dolomite and Limestone and Possible Sources (Gümüşhane/NE Türkiye). Carbonates Evaporites 2024, 39, 6. [Google Scholar] [CrossRef]
- Duan, Y.; Yang, Z.; Yu, T.; Yang, Q.; Liu, X.; Ji, W.; Jiang, H.; Zhuo, X.; Wu, T.; Qin, J.; et al. Geogenic Cadmium Pollution in Multi-Medians Caused by Black Shales in Luzhai, Guangxi. Environ. Pollut. 2020, 260, 113905. [Google Scholar] [CrossRef]
- Wen, Y. Evaluation of Various Approaches to Predict Cadmium Bioavailability to Rice Grown in Soils with High Geochemical Background in the Karst Region, Southwestern China. Environ. Pollut. 2020, 258, 113645. [Google Scholar] [CrossRef]
- Chen, H.; Teng, Y.; Lu, S.; Wang, Y.; Wang, J. Contamination Features and Health Risk of Soil Heavy Metals in China. Sci. Total Environ. 2015, 512–513, 143–153. [Google Scholar] [CrossRef] [PubMed]
- China National Environmental Monitoring Centre (CNEMC). Elemental Background Values of Soils in China; Environmental Science Press of China: Beijing, China, 1990. [Google Scholar]
- Lavergren, U.; Åström, M.E.; Falk, H.; Bergbäck, B. Metal Dispersion in Groundwater in an Area with Natural and Processed Black Shale—Nationwide Perspective and Comparison with Acid Sulfate Soils. Appl. Geochem. 2009, 24, 359–369. [Google Scholar] [CrossRef]
- Kontinen, A.; Hanski, E. The Talvivaara Black Shale-Hosted Ni-Zn-Cu-Co Deposit in Eastern Finland. In Mineral Deposits of Finland; Elsevier: Amsterdam, The Netherlands, 2015; pp. 557–612. ISBN 978-0-12-410438-9. [Google Scholar]
- Lee, J.S.; Chon, H.T.; Kim, K.W. Migration and Dispersion of Trace Elements in the Rock–Soil–Plant System in Areas Underlain by Black Shales and Slates of the Okchon Zone, Korea. J. Geochem. Explor. 1998, 65, 61–78. [Google Scholar] [CrossRef]
- Du, Y.; Luo, K.; Ni, R.; Hussain, R. Selenium and Hazardous Elements Distribution in Plant–Soil–Water System and Human Health Risk Assessment of Lower Cambrian, Southern Shaanxi, China. Environ. Geochem. Health 2018, 40, 2049–2069. [Google Scholar] [CrossRef] [PubMed]
- Jiang, Y.; Chao, S.; Liu, J.; Yang, Y.; Chen, Y.; Zhang, A.; Cao, H. Source Apportionment and Health Risk Assessment of Heavy Metals in Soil for a Township in Jiangsu Province, China. Chemosphere 2017, 168, 1658–1668. [Google Scholar] [CrossRef]
- Xie, X.J.; Ren, T.X.; Sun, H.Z. Geochemical Atlas of China; Geological Publishing House: Beijing, China, 2012. [Google Scholar]
- Zhu, H.; Zhang, T.; Lang, J.; Zeng, J.; Liang, X.; He, Y.; Wang, G.; Li, J. Influence of Black Shale Composition on Methane Adsorption and Gas Content: Implications for Gas Storage in the Longmaxi Black Shales. Earth Sci. Res. J. 2018, 22, 59–63. [Google Scholar] [CrossRef]
- Zhang, S.; Xu, Y.; Wu, M.; Mao, X.; Yao, Y.; Shen, Q.; Zhang, M. Geogenic Enrichment of Potentially Toxic Metals in Agricultural Soils Derived from Black Shale in Northwest Zhejiang, China: Pathways to and Risks from Associated Crops. Ecotoxicol. Environ. Saf. 2021, 215, 112102. [Google Scholar] [CrossRef]
- Hu, G.; Hu, W.; Cao, J.; Yao, S. Stratigraphic Correlations and Occurrence Patterns of Two Sets of Lower Cretaceous Black Shales in Coastal Southeastern China and Geological Implications: Insights from Zircon U–Pb Ages. Geol. J. 2016, 52, 594–608. [Google Scholar] [CrossRef]
- DD2005-03; Technical Requirements for Analysis of Samples for Ecogeochemical Evaluation. China Geological Survey: Beijing, China, 2005.
- Islam, S.; Ahmed, K.; Mamun, H.A. Apportionment of Heavy Metals in Soil and Vegetables and Associated Health Risks Assessment. Stoch. Environ. Res. Risk Assess. 2016, 30, 365–377. [Google Scholar] [CrossRef]
- Han, Y.; Ni, Z.; Li, S.; Qu, M.; Tang, F.; Mo, R.; Ye, C.; Liu, Y. Distribution, Relationship, and Risk Assessment of Toxic Heavy Metals in Walnuts and Growth Soil. Environ. Sci. Pollut. Res. 2018, 25, 17434–17443. [Google Scholar] [CrossRef] [PubMed]
- Hakanson, L. An Ecological Risk Index for Aquatic Pollution Control. A Sedimentological Approach. Water Res. 1980, 14, 975–1001. [Google Scholar] [CrossRef]
- Perin, G.; Craboledda, L.; Lucchese, L. Heavy metals peciation in the sediments of Northern Adriatic Sea. A new approach for environmental toxicity determination. In Heavy Metals in the Environment; Lakkas, T.D., Ed.; CEP Consultants: Edinburgh, UK, 1985. [Google Scholar]
- USEPA. Exposure Factors Handbook, Final ed.; US Environmental Protection Agency: Washington, DC, USA, 2011.
- USEPA. Guidelines for the Health Risk Assessment of Chemical Mixtures; US Environmental Protection Agency: Washington, DC, USA, 1986.
- USEPA. Risk Assessment Guidance for Superfund, Human Health Evaluation Manual. Part A; Office of Emergency and Remedial Response: Washington, DC, USA, 1989.
- Hou, Q.Y.; Yang, Z.F.; Yu, T. Soil Geochemical Parameters of China; Geological Publishing House: Beijing, China, 2020. [Google Scholar]
- GB15618-2018; Soil Environmental Quality Risk Control Standard for Soil Contamination of Agricultural Land. Ministry of Ecology and Environment of the People’s Republic of China: Beijing, China, 2018. (In Chinese)
- Howard, J.L.; Vandenbrink, W.J. Sequential Extraction Analysis of Heavy Metals in Sediments of Variable Composition Using Nitrilotriacetic Acid to Counteract Resorption. Environ. Pollut. 1999, 106, 285–292. [Google Scholar] [CrossRef] [PubMed]
- Zhao, K.; Liu, X.; Zhang, W.; Xu, J.; Wang, F. Spatial Dependence and Bioavailability of Metal Fractions in Paddy Fields on Metal Concentrations in Rice Grain at a Regional Scale. J. Soils Sediments 2011, 11, 1165–1177. [Google Scholar] [CrossRef]
- Li, F.; Xiao, M.; Zhang, J.; Liu, C.; Qiu, Z.; Cai, Y. Spatial Distribution, Chemical Fraction and Fuzzy Comprehensive Risk Assessment of Heavy Metals in Surface Sediments from the Honghu Lake, China. Int. J. Environ. Res. Public. Health 2018, 15, 207. [Google Scholar] [CrossRef]
- GB2762-2017; National Food Safety Standards—Limit of Pollutants in Food. National Health Commission of The People’s Republic of China: Beijing, China, 2017.
- Obiora, S.C.; Chukwu, A.; Davies, T.C. Heavy Metals and Health Risk Assessment of Arable Soils and Food Crops around Pb–Zn Mining Localities in Enyigba, Southeastern Nigeria. J. Afr. Earth Sci. 2016, 116, 182–189. [Google Scholar] [CrossRef]
- Adrees, M.; Ali, S.; Rizwan, M.; Ibrahim, M.; Abbas, F.; Farid, M.; Zia-ur-Rehman, M.; Irshad, M.K.; Bharwana, S.A. The Effect of Excess Copper on Growth and Physiology of Important Food Crops: A Review. Environ. Sci. Pollut. Res. 2015, 22, 8148–8162. [Google Scholar] [CrossRef]
- Cakmak, I.; McLaughlin, M.J.; White, P. Zinc for Better Crop Production and Human Health. Plant Soil 2017, 411, 1–4. [Google Scholar] [CrossRef]
- Singh, A.K.; Hasnain, S.I.; Banerjee, D.K. Grain Size and Geochemical Partitioning of Heavy Metals in Sediments of the Damodar River—A Tributary of the Lower Ganga, India. Environ. Geol. 1999, 39, 90–98. [Google Scholar] [CrossRef]
- Finkelman, R.B.; Palmer, C.A.; Wang, P. Quantification of the Modes of Occurrence of 42 Elements in Coal. Int. J. Coal Geol. 2018, 185, 138–160. [Google Scholar] [CrossRef]
- Saydam Eker, Ç.; Sipahi, F.; Akpınar, İ. Assessment of the Concentration and Environmental Impacts of Potential Hazardous Elements in Coalfields in Northeastern Turkey. Environ. Earth Sci. 2021, 80, 148. [Google Scholar] [CrossRef]
- Anjum, F.; Bhatti, H.N.; Asgher, M.; Shahid, M. Leaching of Metal Ions from Black Shale by Organic Acids Produced by Aspergillus Niger. Appl. Clay Sci. 2010, 47, 356–361. [Google Scholar] [CrossRef]
- He, W.H.; Dai, D.Q.; Ren, B.Z.; Tang, Z.Y.; Qiu, Y. Heavy Metal Regularity of Carboniferous Weathered Black Shale in Qiziqiao Area, Central Hunan. Minerals 2023, 13, 1044. [Google Scholar] [CrossRef]
- Godel, B.; Gonzalez-Alvarez, I.; Barnes, S.J.; Barnes, S.-J.; Parker, P.; Day, J. Sulfides and Sulfarsenides from the Rosie Nickel Prospect, Duketon Greenstone Belt, Western Australia. Econ. Geol. 2012, 107, 275–294. [Google Scholar] [CrossRef]
- Ke, X.; Gui, S.; Huang, H.; Zhang, H.; Wang, C.; Guo, W. Ecological Risk Assessment and Source Identification for Heavy Metals in Surface Sediment from the Liaohe River Protected Area, China. Chemosphere 2017, 175, 473–481. [Google Scholar] [CrossRef] [PubMed]
- Lei, M.; Tie, B.; Song, Z.; Liao, B.-H.; Lepo, J.E.; Huang, Y. Heavy Metal Pollution and Potential Health Risk Assessment of White Rice around Mine Areas in Hunan Province, China. Food Secur. 2015, 7, 45–54. [Google Scholar] [CrossRef]
- Pan, L.; Wang, Y.; Ma, J.; Hu, Y.; Su, B.; Fang, G.; Wang, L.; Xiang, B. A Review of Heavy Metal Pollution Levels and Health Risk Assessment of Urban Soils in Chinese Cities. Environ. Sci. Pollut. Res. 2018, 25, 1055–1069. [Google Scholar] [CrossRef] [PubMed]
- Tang, L.; Deng, S.; Tan, D.; Long, J.; Lei, M. Heavy Metal Distribution, Translocation, and Human Health Risk Assessment in the Soil-Rice System around Dongting Lake Area, China. Environ. Sci. Pollut. Res. 2019, 26, 17655–17665. [Google Scholar] [CrossRef]
- Chaney, R.L.; Reeves, P.G.; Ryan, J.A.; Simmons, R.W.; Welch, R.M.; Scott Angle, J. An Improved Understanding of Soil Cd Risk to Humans and Low Cost Methods to Phytoextract Cd from Contaminated Soils to Prevent Soil Cd Risks. Biometals 2004, 17, 549–553. [Google Scholar] [CrossRef]
- Zhang, X.; Yang, L.; Li, Y.; Li, H.; Wang, W.; Ye, B. Impacts of Lead/Zinc Mining and Smelting on the Environment and Human Health in China. Environ. Monit. Assess. 2012, 184, 2261–2273. [Google Scholar] [CrossRef] [PubMed]
- Xiao, R.; Wang, S.; Li, R.; Wang, J.J.; Zhang, Z. Soil Heavy Metal Contamination and Health Risks Associated with Artisanal Gold Mining in Tongguan, Shaanxi, China. Ecotoxicol. Environ. Saf. 2017, 141, 17–24. [Google Scholar] [CrossRef] [PubMed]
Disclaimer/Publisher’s Note: The statements, opinions and data contained in all publications are solely those of the individual author(s) and contributor(s) and not of MDPI and/or the editor(s). MDPI and/or the editor(s) disclaim responsibility for any injury to people or property resulting from any ideas, methods, instructions or products referred to in the content. |
© 2024 by the authors. Licensee MDPI, Basel, Switzerland. This article is an open access article distributed under the terms and conditions of the Creative Commons Attribution (CC BY) license (https://creativecommons.org/licenses/by/4.0/).