Article

Effect of Screen-Panel Tensile Length and Material Characteristics on Screening Performance of Flip-Flow Vibrating Screens for Dry-Screening Fine, Low-Grade Bituminous Coal

1
School of Chemical and Environmental Engineering, China University of Mining and Technology-Beijing, Beijing 100083, China
2
Zijin School of Geology and Mining, Fuzhou University, Fuzhou 350108, China
*
Author to whom correspondence should be addressed.
Minerals 2024, 14(3), 271; https://doi.org/10.3390/min14030271
Submission received: 27 January 2024 / Revised: 26 February 2024 / Accepted: 27 February 2024 / Published: 4 March 2024
(This article belongs to the Section Mineral Processing and Extractive Metallurgy)

Abstract

:
Flip-flow vibrating screens (FFVSs) effectively tackle the challenges posed by the dry deep-screening of wet, fine, low-grade bituminous coal, thereby facilitating advancements in the thermal coal preparation process. The tensile lengths of the screen panels not only influence the service lives of the screen panels but also play a pivotal role in determining the screening performance of the FFVSs. To investigate the effect of the screen-panel tensile length on the screening performance of an FFVS, this study constructs a dual-mass flip-flow screening test rig. The experimental results reveal that when the fine-particle content and the external water content in the feed of low-grade bituminous coal are 55% and 16%, respectively, the most favorable tensile length of the screen panels is 2 mm. With a fine-particle content of 55% in the feed of low-grade bituminous coal and an increase in the external water content from 4% to 20%, the screening efficiency of the FFVS initially decreases and then increases. Notably, low-grade bituminous coal with 16% external water content poses the most challenging screening conditions. Furthermore, when the external water content of the low-grade bituminous coal is 16% and the fine-particle content in the feed increases from 25% to 55%, the screening efficiency of the FFVS gradually improves.

1. Introduction

Vibrating screens play a crucial role in mineral processing, serving various purposes such as classification, dehydration, desliming, and medium removal [1,2,3]. Low-grade bituminous coal, characterized by a low degree of metamorphism, tends to adhere and obstruct the screen’s apertures due to the surface tension of external water [4,5]. Traditional vibrating screens, with their limited ejection intensity, often encounter issues such as blocked screen apertures and agglomeration of the screen’s surface when dry-screening wet, fine, low-grade bituminous coal [6,7,8]. These challenges significantly impede the progress of the thermal coal preparation process [9,10]. To address these issues, flip-flow vibrating screens (FFVSs) have emerged as innovative screening equipment, combining features of the crank-link-type flip-flow screen and the traditional vibrating screen [11,12]. These FFVSs not only inherit the high ejection intensity and self-cleaning ability of the crank-link-type flip-flow screens but also incorporate the simplicity and high reliability associated with traditional linear and circular vibration screens [13,14]. Consequently, FFVSs effectively tackle the challenges posed by the dry deep-screening of wet, fine, low-grade bituminous coal, thereby facilitating advancements in the thermal coal preparation process.
The screen case of an FFVS consists of a main screen frame, a floating screen frame, rubber shear springs, and elastic flip-flow screen panels, with two ends connecting to the main and floating screen frames, respectively [15,16]. The main and the floating screen frames are interconnected by rubber shear springs, allowing the two screen frames to undergo the relative motion along the screen’s surface. The flip-flow screen panel, crafted from polyurethane, serves as the pivotal elastic component within an FFVS, enabling effective material classification. Through the relative movement between the main and the floating screen frames, a flip-flow screen panel undergoes a trampoline-like motion, yielding an impressive ejection intensity at the midpoint of the panel that ranges from 30 to 50 g (acceleration of gravity) [17,18]. In stark contrast, traditional linear and circular vibrating screens typically exhibit ejection intensities within the range of 2.5 to 4 g [19,20]. Furthermore, the flip-flow motion induces periodic tightening of the screen panels by 1 to 2 mm, instigating micro-deformations in the screen’s apertures. This dynamic process actively facilitates the expulsion of obstructive particles and fine particles that have adhered to the screen’s apertures, enhancing screening efficiency [21].
Recent investigations into flip-flow screen panels have predominantly centered on two key facets: kinematics and dynamics. Xiong et al. proposed a kinematic model of an inclined flip-flow screen panel, and they indicated that the slack length and the incline angle had significant impacts on the vibrations of a flip-flow screen panel [22]. Chen et al. simplified the vibration of a flip-flow screen panel into a string model and obtained numerical solutions based on the Hamilton principle [23]. Yu et al. divided a flip-flow screen panel into multiple rigid bodies and realized the approximate motion of the screen panel [24]. Peng et al. investigated the effect of the initial stretch on the kinematic characteristics of a flip-flow screen panel via an experimental prototype [25]. Lin et al. experimentally studied the mechanical properties of flip-flow screen panels and established a nonlinear dynamic model of the screen panels [26]. Nevertheless, the tensile length of a screen panel not only influences the motion of the screen’s panels but also plays a pivotal role in determining the service life of a screen panel and the screening performance of an FFVS. For example, Tang et al., using the finite element model of a screen panel, found that the maximum stress of a flip-flow screen panel was at the edges [27]. Zhou et al. determined that the tensile length of a flip-flow screen panel affected the screening performance of a Liwell flip-flow screen, and the most favorable tensile length was −3 mm for a Liwell flip-flow screen [28]. The screen panels of an FFVS are affixed within the screen’s surface slot on the screen’s beam using wedge bars [29]. Adjusting the tensile length of a screen panel poses challenges, which has resulted in limited research on its impact on the screening performance of an FFVS.
To investigate the effect of screen-panel tensile length on the screening performance of an FFVS, this study constructs a dual-mass flip-flow screening test rig and conducts experimental analyses. The most favorable tensile length of a flip-flow screen panel is determined. Under the most favorable tensile length, this study further examines the effects of the external water content and fine-particle content in the feed of low-grade bituminous coal on the screening performance of an FFVS.

2. Experiments

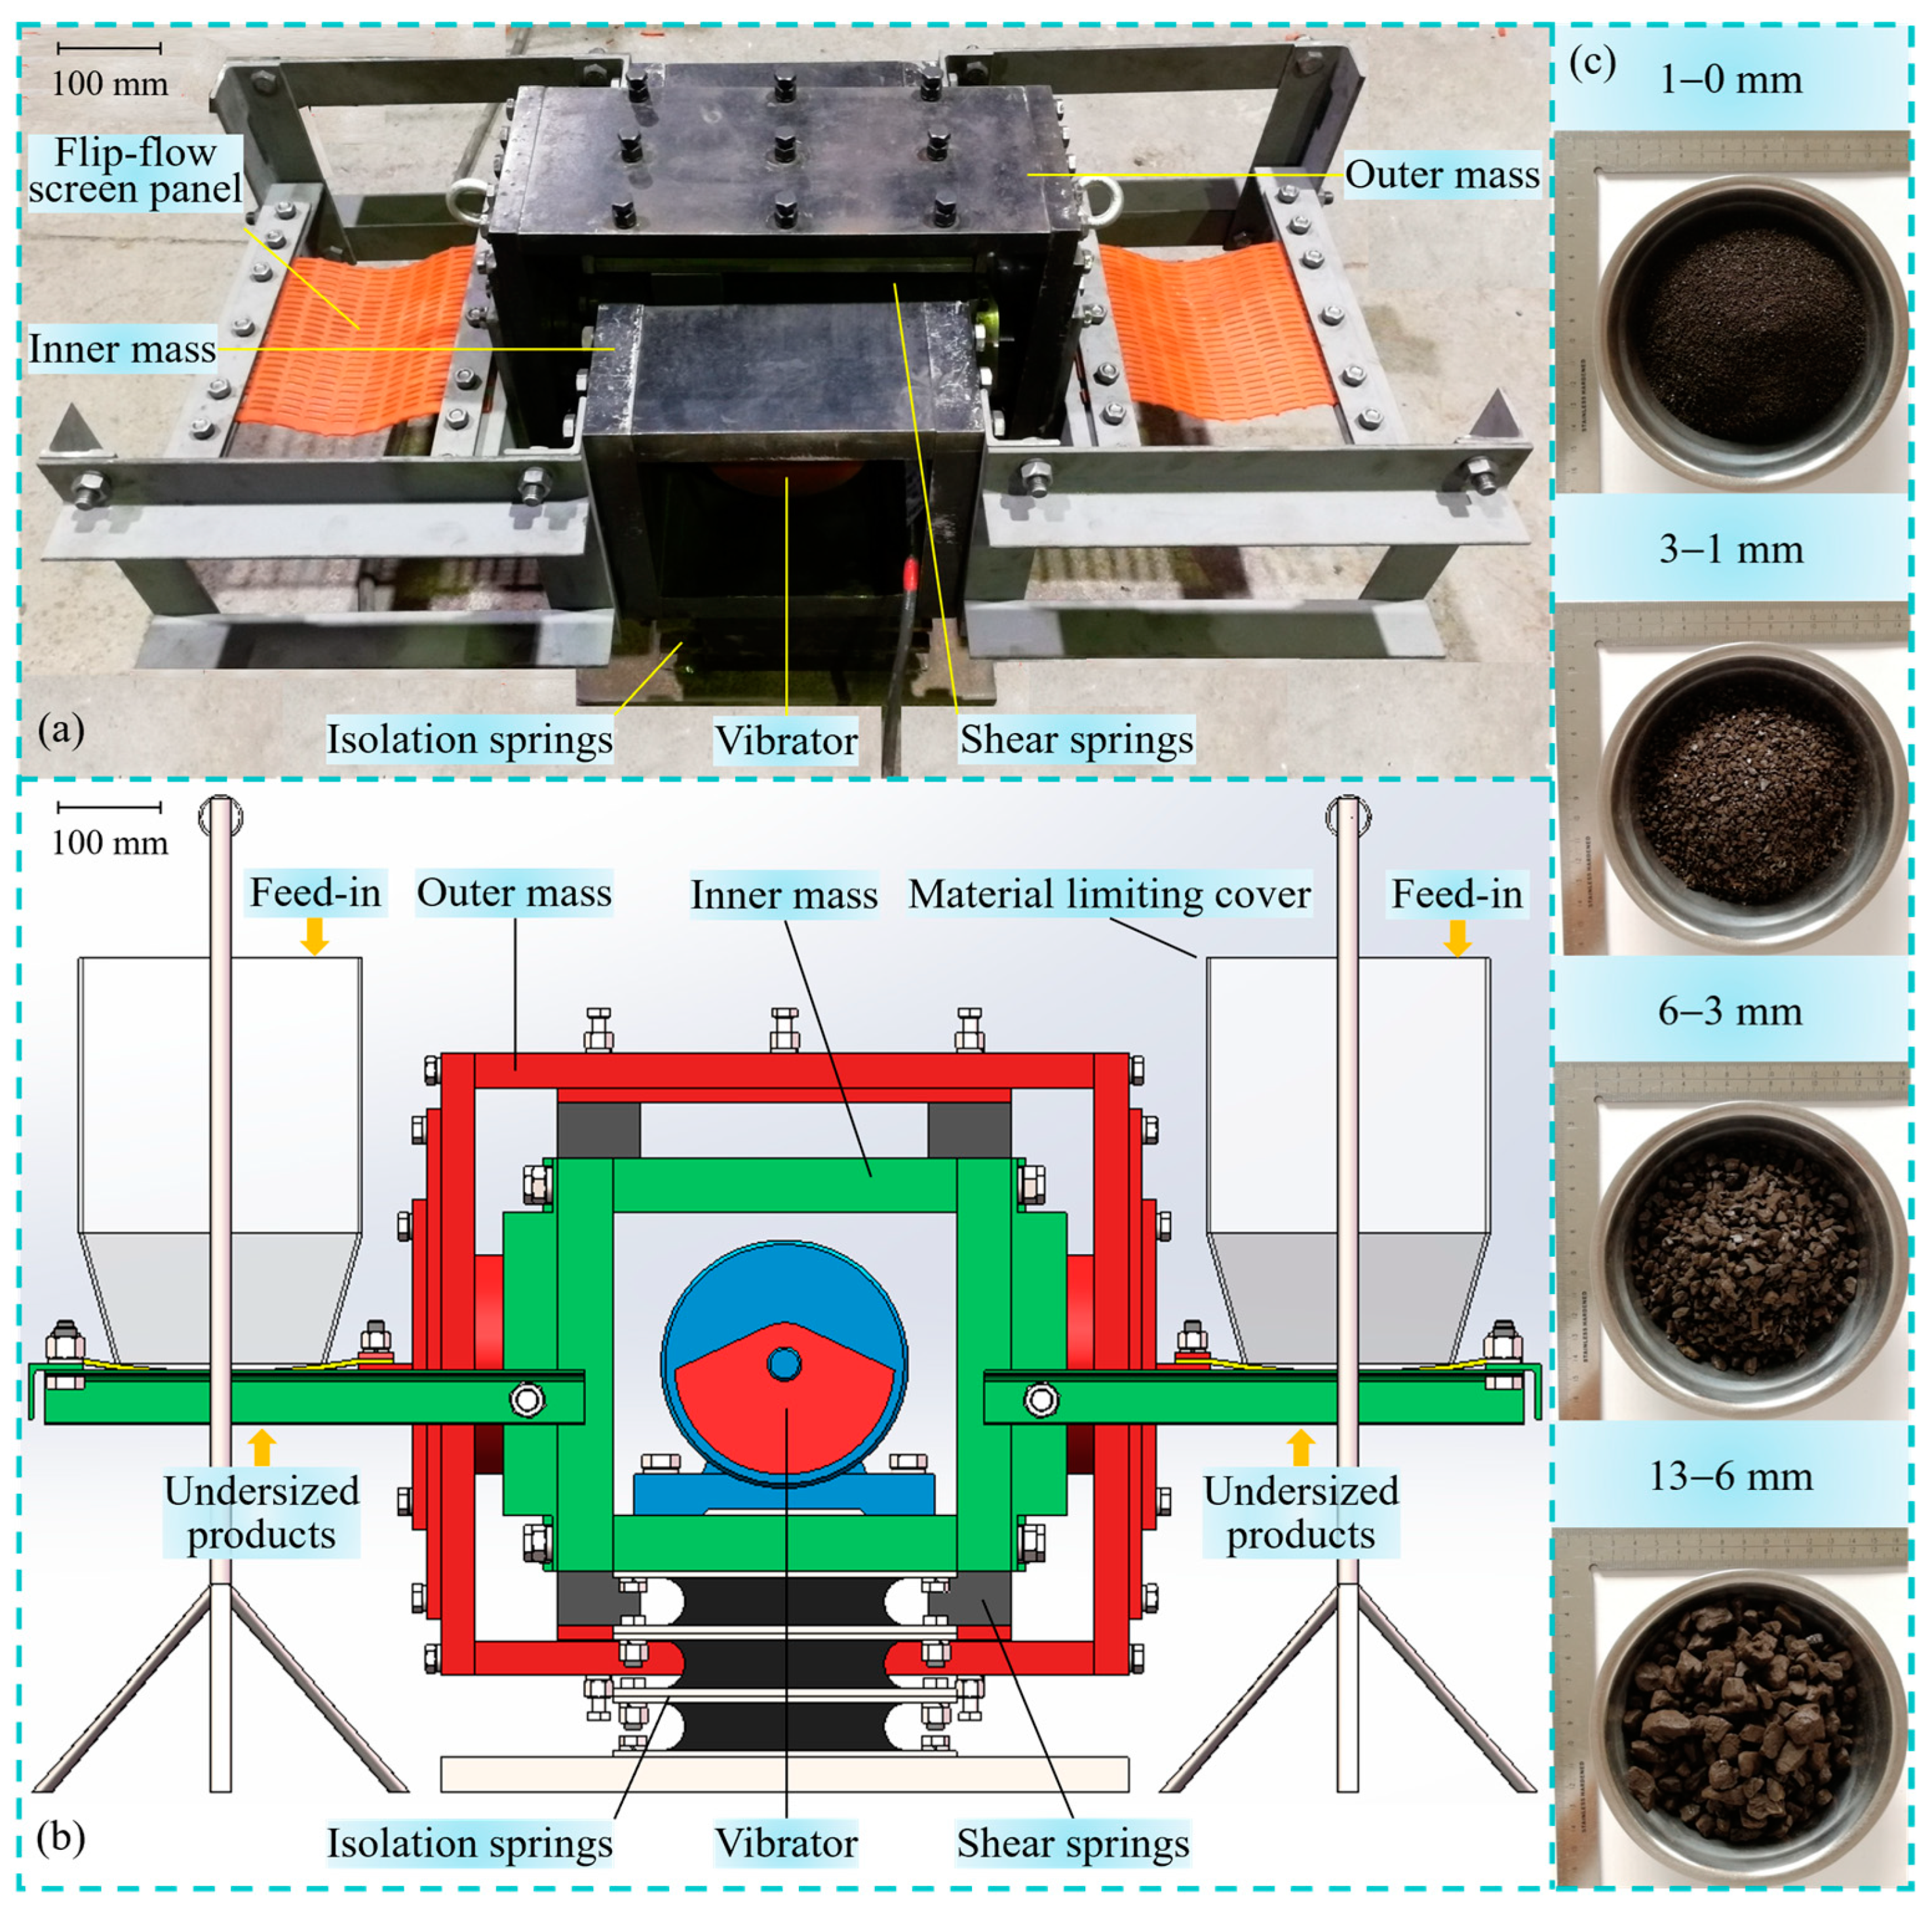
2.1. Test Rig and Experimental System

To experimentally investigate the impacts of screen-panel tensile length and material characteristics on the screening performance of an FFVS, a dual-mass flip-flow screening test rig is constructed, as illustrated in Figure 1a,b. The test rig comprises an inner mass, an outer mass, a vibrator (0.12 kw and 765 r/min), shear springs, vibration isolation springs, screen surface brackets, two flip-flow screen panels, two material limiting covers, and a base plate. The two masses are hollow cubes, with the inner mass passing through the outer mass, and they are connected by horizontally installed shear springs. The vibrator is securely fixed inside the inner mass, which, in turn, is mounted on the base plate via vibration isolation springs. The screen surface bracket links the two ends of the flip-flow screen panel to the inner and outer masses, respectively. The lower end of the material limiting cover is flexibly attached to the flip-flow screen panel, serving as a side wall of the screen. This design does not impede the movement of the screen panel and materials, providing a three-dimensional movement space for materials on the screen’s surface.
The operational principle of the test rig is as follows: the centrifugal force generated by the vibrator’s rotation induces the relative horizontal movement between the inner and outer masses, resulting in a trampoline-like motion of the flip-flow screen panel. The relative amplitude between the inner and outer masses along the horizontal direction is set at 8 mm. With minimal vertical amplitude, the inner and outer masses move nearly horizontally. The tensile length of the screen panel represents the difference between the relative amplitudes of its two ends and the initial slack length. Setting the initial slack length of the screen panel to 10, 8, 6, and 4 mm yields tensile lengths of −2, 0, 2, and 4 mm, respectively. Once the test rig achieves stable operation, all materials are promptly loaded into the material limit device. The flexible excitation of the screen panel allows particles in the material limiting cover to become loosened, layered, and screened. The test rig is horizontally oriented and lacks the ability to transport materials along the screen’s surface direction. Consequently, materials undergo a periodic jumping-falling-jumping movement perpendicular to the screen’s surface. Undersized products are collected at different time intervals. After drying in an oven, subsequent screening using a test sieve, and weighing with an electronic balance, the productivities of the different size fractions at various time intervals can be determined. Additionally, key metrics such as yield of undersized product, screening efficiency, misplaced material, and the distribution rate of each size fraction over different time durations can be assessed [17,24]. Three parallel tests are conducted for each experiment. Given the negligible discrepancies among the results of these tests, data from any one of them can be chosen for analysis.

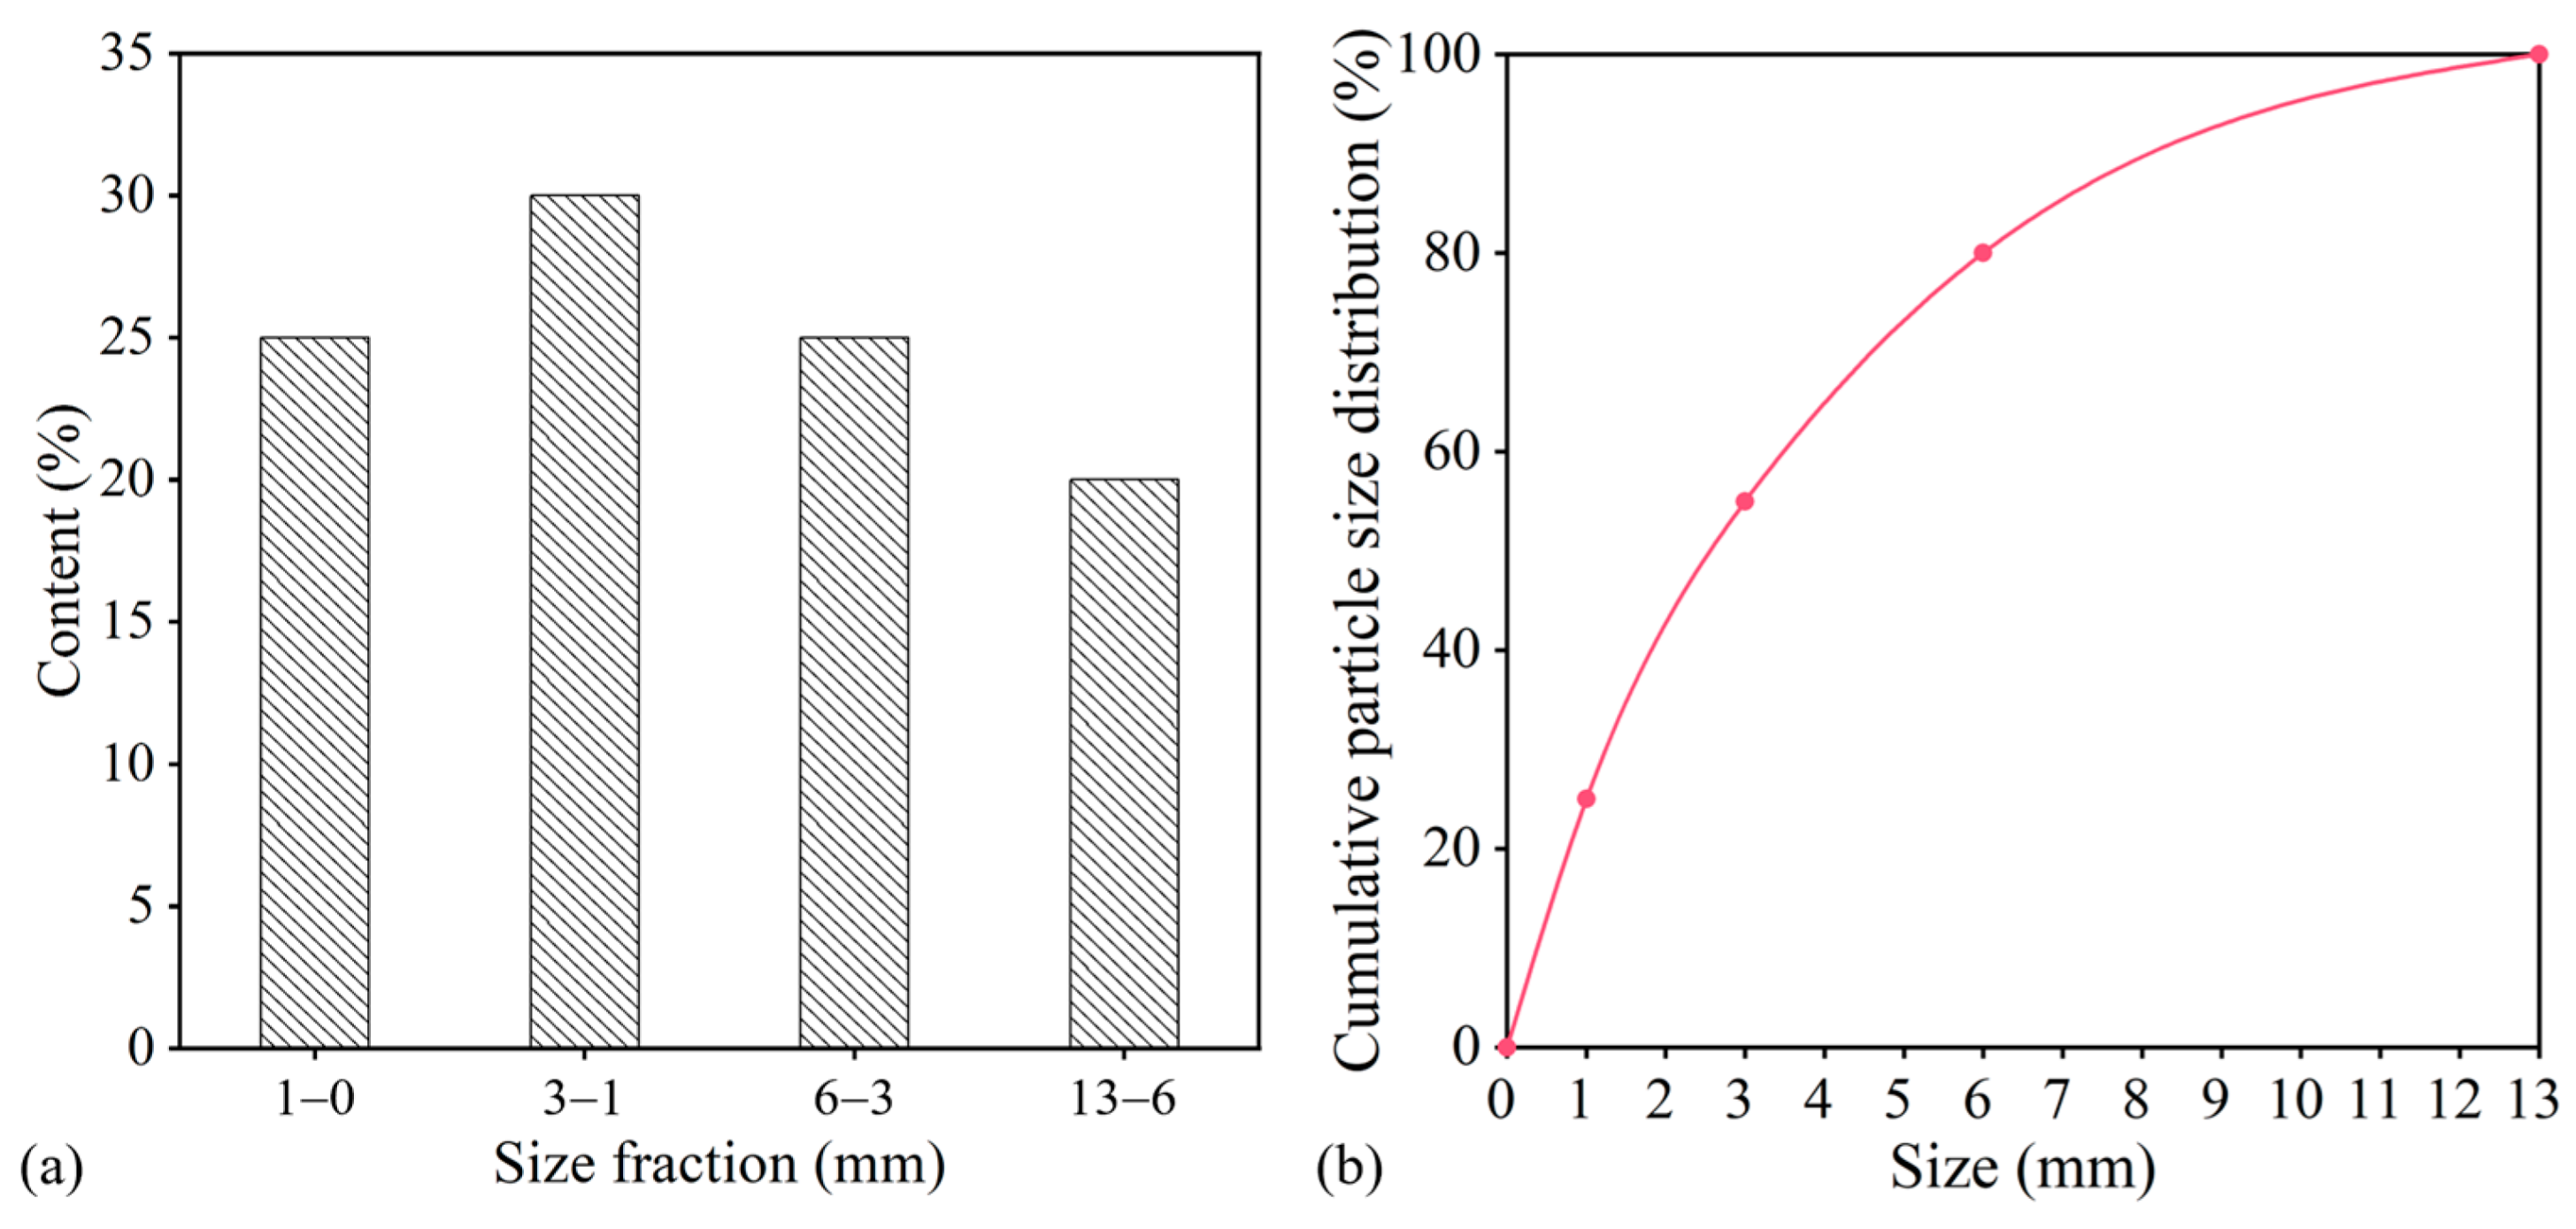
2.2. Experimental Materials

The screening test utilizes bituminous coal, specifically, air-dried coal samples, with the coal type highlighted in Figure 1c for each size fraction. Table 1 provides the results of the industrial analysis of these coal samples. Air-dried coal samples undergo the removal of external moisture, leaving only internal moisture. The internal moisture content varies across the size fractions, with values of 1.25%, 0.84%, 0.44%, and 0.26% for the 13–6 mm, 6–3 mm, 3–1 mm, and 1–0 mm size fractions, respectively. Coal ash results from the minerals in the coal and gangue being mixed into the roof, floor, and gangue layers during the mining process. Among the particle sizes, the 13–6 mm size fraction exhibits the lowest ash content at 7.20%, while the 6–3 mm size fraction has the highest ash content at 19.46%. The volatile content decreases with increasing the coalification degree, ranging from 37.71% to 34.21% in the air-dried coal samples, classifying them as low-grade bituminous coal. Fixed carbon, indicative of coal deterioration, increases with the coalification degree. The air-dried coal samples in this study show fixed carbon ranging from 44.49% to 53.84%, emphasizing their low-grade bituminous nature.
FFVSs have extensive use in the dry deep-screening of moist, fine coal below 6 mm. For the screening test, a flip-flow screen surface with an aperture width of 3 mm and an aperture length of 20 mm is selected. The square screen panel has a width of 200 mm. The thickness of the material layer on the screen’s surface plays a significant role in determining the screening efficiency. The initial material layer thickness is set to 30 mm, and the material mass can be calculated based on the bulk density of the low-grade bituminous coal. The total mass of the air-dried coal sample is approximately 1.5 kg, with size fraction proportions of 20%, 25%, 30%, and 25% for the 13–6 mm, 6–3 mm, 3–1 mm, and 1–0 mm size fractions, respectively. The particle size distribution of each particle size fraction is shown in Figure 2. The coal sample contains 55% fine particles smaller than the aperture, and its external moisture content is 16%.

2.3. Evaluation Indexes

To assess the effectiveness of screening operations, screening efficiency and mismatch content are commonly employed as indicators for gauging the perfection of the screening process [30]. The calculation formula for the screening efficiency is given by Equation (1), while the formula for calculating the mismatch content is provided by Equation (2), as follows:
η = E c + E f 100 E c = γ o × O c ÷ F c r × 100 E f = F f r γ o × O f ÷ F f r × 100   and
M o = M c + M f M c = γ o × O f × 100 M f = γ u × U c × 100 ,
where η is the screening efficiency (%); E c stands for the effective placement efficiency of the coarse particles (the term “coarse particles” refers to those particles that are larger than the aperture size) (%); E f represents the effective placement efficiency of the fine particles (the term “fine particles” refers to those particles that are smaller than the aperture size) (%); γ o and γ u denote the oversized and undersized product yields, respectively (%); O c and O f are the ratios of the coarse and fine particles in the oversized product, respectively (%); F c r and F f r represent the ratios of the coarse and fine particles in the feed, respectively (%); M o is the total misplaced materials (%); M c and M f are the misplaced materials of the coarse and fine particles, respectively (%); and U c denotes the ratio of coarse particles in the undersized product (%).
To mitigate the influence of variations in the raw coal composition on the classification outcome and enhance comparability among efficiency indicators, partition curves are frequently employed to visually depict the classification effect. The partition curve serves as a graphical representation of the distribution rate of different components within a specific product. It functions as a characteristic curve, illustrating the separation efficiency of materials based on the particle size in the classification equipment [17,30]. The likelihood deviation is commonly utilized as an indicator to assess classification errors, with its calculation formula defined in Equation (3), as follows:
E p = δ 75 δ 25 2 ,
where E p is the possibility deviation (mm) and δ 75 and δ 25 stand for the particle sizes with distribution rates of 75% and 25%, respectively, in the distribution curve (mm).

3. Results and Discussions

3.1. Effect of Screen-Panel Tensile Length on the Screening Performance of an FFVS

The tensile length of a screen panel plays a key role in determining the projection intensity of the screen’s surface, subsequently influencing the deagglomeration and desorption of sticky and wet materials, as well as the self-cleaning ability of the screen’s surface. When the relative amplitude between the main and floating screen frames of an FFVS is set at 8 mm and the excitation frequency is 12.75 Hz (765 r/min), varying the slack lengths of the flip-flow screen panel at 4 mm, 6 mm, 8 mm, and 10 mm results in corresponding tensile lengths of 4 mm, 2 mm, 0 mm, and −2 mm. This variation demonstrates the impact of screen-panel tensile length on the screening performance of an FFVS, as illustrated in Figure 3. The datum are shown in Table A1, Table A2, Table A3 and Table A4.
The impact of screen-panel tensile length on the yield of undersized product in an FFVS is depicted in Figure 3a. At 0 s and 80 s, the lowest yield of the undersized product is observed with a screen panel tensile length of −2 mm. At 80 s and 150 s, the time interval widens, reaching the maximum yield of the undersized product across the various screen panel tensile lengths. After surpassing a screening time of 150 s, the yield of the undersized product declines. This decline results from the employment of one-time feeding instead of continuous feeding. With screening progression, the content of fine particles on the screening surface gradually diminishes, thereby reducing the yield of the undersized product. Figure 3b illustrates the influence of screen-panel tensile length on the screening efficiency of an FFVS. The screening efficiency initially increases and then decreases, reaching its maximum at 150 s. At 0 s and 80 s, the screening efficiency is the lowest with a screen panel tensile length of −2 mm. The effect of screen-panel tensile length on the total misplaced material of an FFVS is presented in Figure 3c. The total misplaced material decreases and then increases, reaching its minimum at 150 s. Up to 80 s, the total misplaced material for a −2 mm screen-panel tensile length is consistently higher than at the other tensile lengths of 4 mm, 2 mm, and 0 mm. In Figure 3d, the effect of screen-panel tensile length on the distribution curve of an FFVS at 80 s is shown. Due to the selection of sticky and fine materials with an external moisture content of 16% and a fine-particle ratio of 55%, the distribution curve displays a significant upturn at the left end [17,30]. The distribution curve for a −2 mm screen-panel tensile length rises more gradually compared to the curves for tensile lengths of 4 mm, 2 mm, and 0 mm, deviating substantially from the ideal distribution curve. This indicates that a screen panel with a negative tensile length fails to effectively enhance the screening performance of an FFVS. A tensile length of 4 mm causes considerable tensile deformation during panel movement, leading to fatigue damage. Conversely, a tensile length of 0 mm prevents the panel from undergoing tensile deformation, rendering it incapable of cleaning the obstructive particles and fine particles that have adhered to the screen’s apertures. Therefore, 2 mm is the most favorable tensile length for an FFVS.

3.2. Effect of External Moisture Content on the Screening Performance of an FFVS

Under consistent screening operation parameters, the external moisture content of a coal sample plays a pivotal role in determining the viscosity of materials and stands as the primary factor influencing the screening performance. With the relative amplitude between the main and floating screen frames of an FFVS set at 8 mm, a screen-panel tensile length of 2 mm, and an excitation frequency of 12.75 Hz, the impact of varying the external moisture content of the coal sample (ranging from 4% to 20%) on the screening performance of an FFVS is demonstrated in Figure 4. The datum are shown in Table A2, Table A5, Table A6, Table A7 and Table A8.
Under the condition where a coal sample is comprised of 55% fine particles, the influence of the external moisture content on the yield of the undersized product is presented in Figure 4a. At 0 s and 20 s, the yield of the undersized product initially decreases and then increases with the rising external moisture content. Notably, the yield is lowest at a 16% external moisture content, while it attains its maximum at a 4% external moisture content. Figure 4b illustrates the impact of the external moisture content of a coal sample on the screening efficiency of an FFVS. The screening efficiency reaches its maximum at 40 s for a 4% external moisture content and at 150 s for other external moisture contents. At 0 s and 80 s, the screening efficiency is its highest at a 4% external moisture content and its lowest at a 16% external moisture content. This phenomenon suggests that as the external moisture content increases, the adhesion force of wet, fine materials first rises and then declines. Under a coal sample external moisture content of 16%, the adhesion force of fine coal reaches its maximum. The influence of the external moisture content of the total misplaced material of an FFVS is depicted in Figure 4c. The total misplaced material initially decreases and then increases with increasing screening time. The total misplaced material reaches its minimum at 40 s for a 4% external moisture content and at 150 s for other external moisture contents. At 0 s and 80 s, the total misplaced material at a 16% external moisture content consistently exceeds that of other external moisture contents (4%, 8%, 12%, and 20%). At 80 s, the impact of the external moisture content on the distribution curve of an FFVS is shown in Figure 4d. At a 4% external moisture content, the distribution curve lacks an upturn at the left end [17,30]. The distribution curve for a 16% external moisture content rises more gradually than those for other external moisture contents (4%, 8%, 12%, and 20%) and significantly deviates from the ideal distribution curve, indicating that low-grade bituminous coal with a 16% external moisture content poses the most challenging screening conditions.

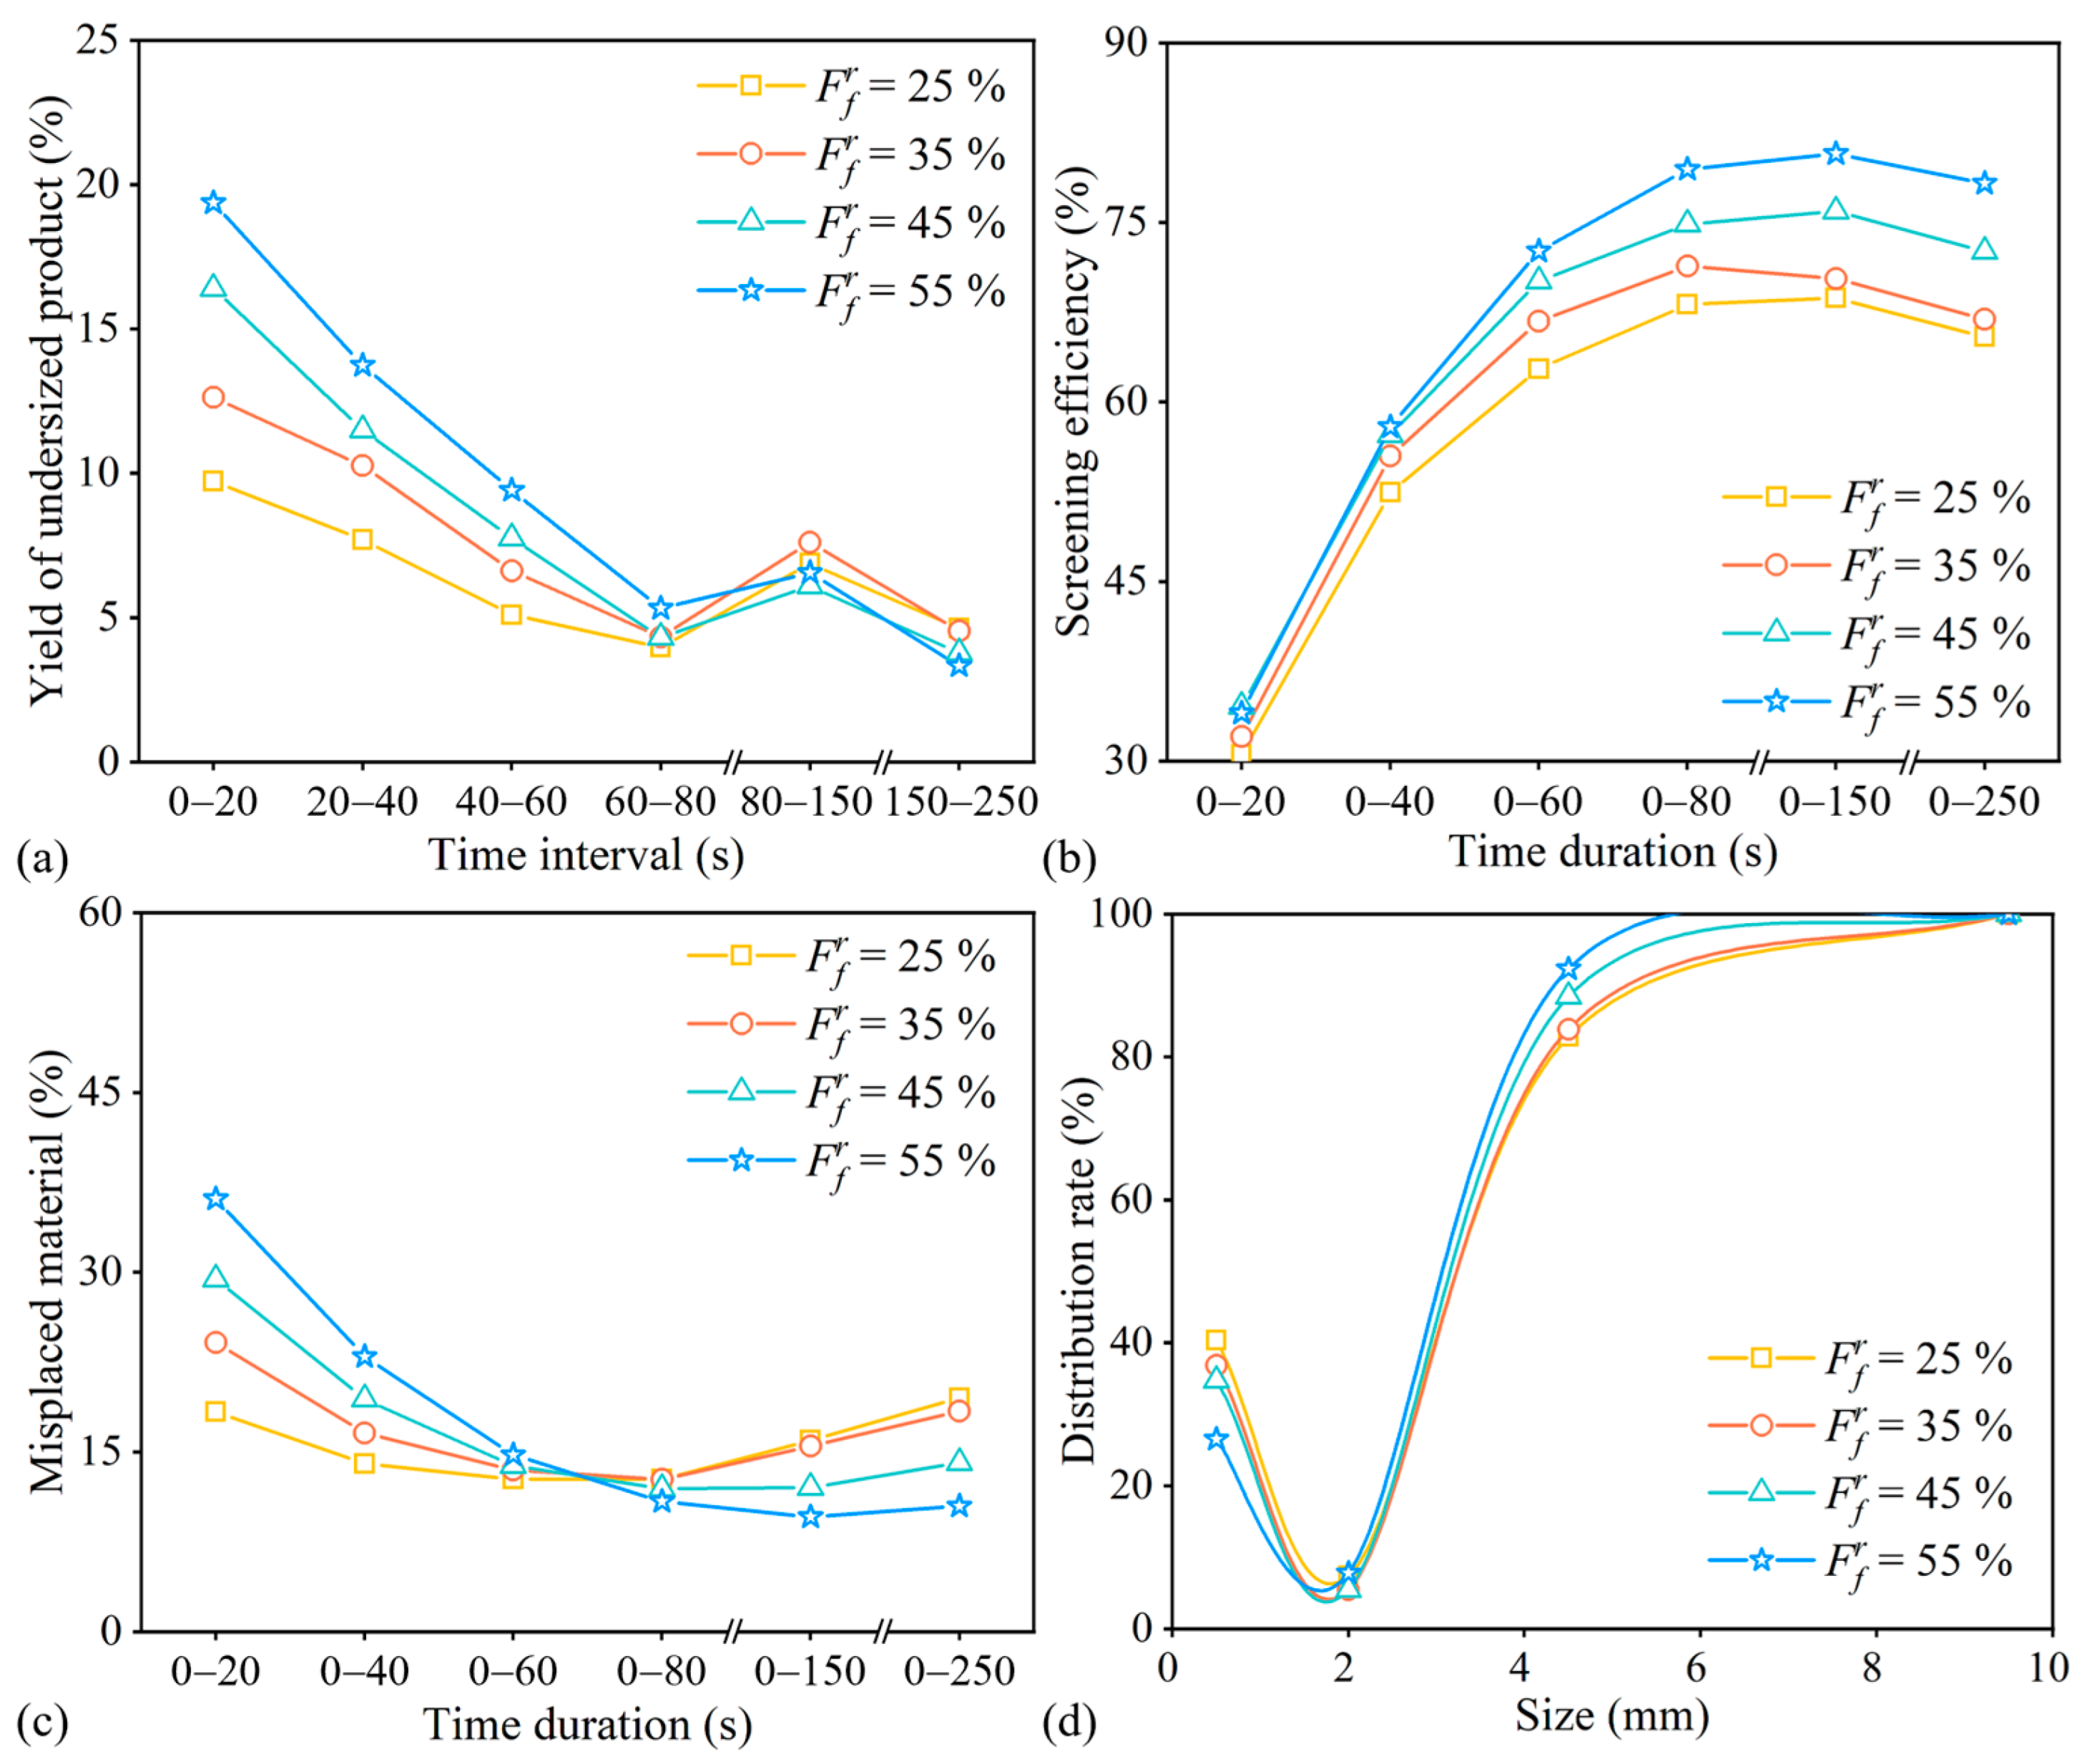
3.3. Effect of the Ratio of Fine Particles in the Feed on the Screening Performance of an FFVS

Under a consistent external moisture content, the ratio of fine particles plays a crucial role in influencing material adhesion, consequently impacting the screening efficiency of an FFVS. With the relative amplitude between the main and floating screen frames of an FFVS set at 8 mm, a screen-panel tensile length of 2 mm, and an excitation frequency of 12.75 Hz, the fine-particle content of the coal sample varies at 25%, 35%, 45%, and 55%, respectively. This variation unveils the influence of the fine-particle ratio in the feed on the screening performance of an FFVS, as illustrated in Figure 5. The datum are shown in Table A2, Table A9, Table A10 and Table A11.
Under the condition where the external moisture content of the coal sample is 16%, the impact of the fine-particle ratio in the coal sample on the yield of the undersized product of an FFVS is depicted in Figure 5a. At 0 s and 80 s, the yield of the undersized products increases with the rise in the fine-particle content. The smallest yield is observed at a fine-particle content of 25%, while the largest yield is recorded at a 55% fine-particle content. Figure 5b illustrates the influence of the fine-particle content in the coal samples on the screening efficiency of the FFVSs. The screening efficiencies for various fine-particle contents initially increase and then decrease. The screening efficiencies for 55% and 45% fine-particle contents reach their maximum at 150 s, while the screening efficiency for 25% and 35% fine-particle contents reaches their maximum at 80 s. At 0 s and 250 s, the screening efficiency for a 55% fine-particle content is the highest and the efficiency for a 25% fine-particle content is the lowest. As the fine-particle contents in the coal samples increase, the porosity inside the material decreases, the outer surface area of the material group increases, and the screening performances of the FFVSs improve. The impact of the fine-particle content in the coal samples on the total misplaced materials of the FFVSs is presented in Figure 5c. The total misplaced materials for the different fine-particle contents initially decrease and then increase with the extension of screening time. At 0 s and 60 s, the total misplaced material for a 55% fine-particle content consistently surpasses those of the other fine-particle contents (45%, 35%, and 25%). At 80 s, the influence of the fine-particle content on the distribution curve of an FFVS is shown in Figure 5d. The distribution curve for a 55% fine-particle content rises steeply compared to the curves for 45%, 35%, and 25% fine-particle contents, deviating slightly from the ideal distribution curve. This indicates that low-grade bituminous coal with a 55% fine-particle content is advantageous for screening. Additionally, the increase in the content of fine particles in the material group will reduce the partition size.

4. Conclusions

This study experimentally investigates the effect of screen-panel tensile length on the screening performance of a flip-flow vibrating screen (FFVS). From this research, the following conclusions can be drawn.
The most favorable tensile length of the screen panel of an FFVS is 2 mm when the fine-particle content and the external water content in the feed of low-grade bituminous coal are 55% and 16%, respectively. With a fine-particle content of 55% in the feed of low-grade bituminous coal and an increase in the external water content from 4% to 20%, the screening efficiency of an FFVS initially decreases and then increases. Notably, low-grade bituminous coal with a 16% external water content poses the most challenging screening conditions. Furthermore, when the external water content of low-grade bituminous coal is 16% and the fine-particle content in the feed increases from 25% to 55%, the screening efficiency of the FFVS gradually improves. The screening mechanism and particle motion of an FFVS will be further studied.

Author Contributions

Conceptualization, D.L. and X.Z.; methodology, D.L. and D.Q.; software, D.L.; validation, D.L., R.L. and Z.W.; formal analysis, N.X. and W.Z.; investigation, D.L.; resources, X.W.; data curation, D.L.; writing—original draft preparation, D.L.; writing—review and editing, D.L.; visualization, N.X. and W.Z.; supervision, X.W.; project administration, X.W.; funding acquisition, X.W. and D.L. All authors have read and agreed to the published version of the manuscript.

Funding

This research was funded by the China Scholarship Council under grant number 202106430037 and in part by the Anhui Province Major Science and Technology Achievements Engineering Research and Development Special Project under grant number 202103c08020007.

Data Availability Statement

The data presented in this study are available on request from the corresponding author due to the external policy.

Conflicts of Interest

The authors declare no conflicts of interest.

Appendix A

Table A1. Yield of each size fraction at the different time intervals under a 4 mm tensile length.
Size
Fraction
(mm)
0–20 s Yield20–40 s Yield40–60 s Yield60–80 s Yield80–150 s Yield150–250 s YieldOversized Product Yield
A (%)B (%)A (%)B (%)A (%)B (%)A (%)B (%)A (%)B (%)A (%)B (%)A (%)B (%)
13–60.000.000.000.000.000.000.000.000.000.000.000.0049.3620.09
6–34.160.344.450.365.830.508.350.7223.684.6979.844.8133.5313.65
3–167.185.5364.795.1861.075.2856.754.8841.698.256.460.391.130.46
1–028.652.3630.762.4633.102.8634.893.0034.636.8613.700.8315.996.51
Total100.008.23100.007.99100.008.64100.008.60100.0019.80100.006.03100.0040.71
Note: A is the undersized product accounted for in this section and B is the undersized product accounted for in the feed.
Table A2. Yield of each size fraction at the different time intervals under a 2 mm tensile length.
Size
Fraction
(mm)
0–20 s Yield20–40 s Yield40–60 s Yield60–80 s Yield80–150 s Yield150–250 s YieldOversized Product Yield
A (%)B (%)A (%)B (%)A (%)B (%)A (%)B (%)A (%)B (%)A (%)B (%)A (%)B (%)
13–60.000.000.000.000.000.000.000.000.000.000.000.0050.1520.09
6–35.190.393.590.295.430.447.130.5822.434.9178.844.9333.7813.53
3–166.374.9862.305.0260.774.8957.544.7142.509.307.840.491.430.57
1–028.442.1434.112.7533.812.7235.332.8935.077.6813.320.8314.635.86
Total100.007.51100.008.05100.008.05100.008.19100.0021.89100.006.25100.0040.06
Table A3. Yield of each size fraction at the different time intervals under a 0 mm tensile length.
Size
Fraction
(mm)
0–20 s Yield20–40 s Yield40–60 s Yield60–80 s Yield80–150 s Yield150–250 s YieldOversized Product Yield
A (%)B (%)A (%)B (%)A (%)B (%)A (%)B (%)A (%)B (%)A (%)B (%)A (%)B (%)
13–60.000.000.000.000.000.000.000.000.000.000.000.0051.7120.09
6–33.900.315.870.507.380.6210.280.8828.736.3280.544.6130.4411.83
3–164.295.0960.565.2059.955.0256.044.7937.778.317.500.432.911.13
1–031.812.5233.572.8832.662.7333.672.8833.507.3711.960.6814.935.80
Total100.007.92100.008.58100.008.37100.008.56100.0021.99100.005.73100.0038.86
Table A4. Yield of each size fraction at the different time intervals under a −2 mm tensile length.
Size
Fraction
(mm)
0–20 s Yield20–40 s Yield40–60 s Yield60–80 s Yield80–150 s Yield150–250 s YieldOversized Product Yield
A (%)B (%)A (%)B (%)A (%)B (%)A (%)B (%)A (%)B (%)A (%)B (%)A (%)B (%)
13–60.000.000.000.000.000.000.000.000.000.000.000.0043.1320.09
6–36.990.396.220.368.350.468.990.5214.682.8647.455.3832.4315.11
3–167.833.7864.793.7162.043.3961.753.6054.1410.5524.352.764.672.18
1–025.181.4028.991.6629.611.6229.261.7131.196.0828.203.2019.779.21
Total100.005.57100.005.72100.005.47100.005.83100.0019.49100.0011.34100.0046.59
Table A5. Yield of each size fraction at the different time intervals under a 4% external moisture content.
Size
Fraction
(mm)
0–20 s Yield20–40 s Yield40–60 s Yield60–80 s Yield80–150 s Yield150–250 s YieldOversized Product Yield
A (%)B (%)A (%)B (%)A (%)B (%)A (%)B (%)A (%)B (%)A (%)B (%)A (%)B (%)
13–60.000.000.000.000.000.000.000.000.000.000.000.0059.0220.09
6–33.681.6722.852.6455.871.7378.061.2487.842.3888.551.5640.7213.86
3–151.3923.2649.245.6923.480.736.750.112.730.074.960.090.080.03
1–044.9320.3327.913.2220.650.6415.190.249.430.266.490.110.180.06
Total100.0045.26100.0011.55100.003.09100.001.59100.002.71100.001.76100.0034.05
Table A6. Yield of each size fraction at the different time intervals under an 8% external moisture content.
Size
Fraction
(mm)
0–20 s Yield20–40 s Yield40–60 s Yield60–80 s Yield80–150 s Yield150–250 s YieldOversized Product Yield
A (%)B (%)A (%)B (%)A (%)B (%)A (%)B (%)A (%)B (%)A (%)B (%)A (%)B (%)
13–60.000.000.000.000.000.000.000.000.000.000.000.0047.5320.09
6–31.660.322.100.296.500.6113.380.7140.272.6463.512.1243.4818.38
3–158.4311.3258.117.9858.245.4853.542.8529.711.959.480.320.180.08
1–039.917.7339.785.4735.263.3233.081.7630.021.9727.020.908.823.73
Total100.0019.37100.0013.74100.009.41100.005.32100.006.55100.003.33100.0042.28
Table A7. Yield of each size fraction at the different time intervals under a 12% external moisture content.
Size
Fraction
(mm)
0–20 s Yield20–40 s Yield40–60 s Yield60–80 s Yield80–150 s Yield150–250 s YieldOversized Product Yield
A (%)B (%)A (%)B (%)A (%)B (%)A (%)B (%)A (%)B (%)A (%)B (%)A (%)B (%)
13–60.000.000.000.000.000.000.000.000.000.000.000.0050.8420.09
6–32.360.303.760.426.130.7111.801.1241.044.7872.842.8837.6114.86
3–164.628.2760.046.6556.866.5450.184.7729.573.454.750.190.280.11
1–033.024.2236.204.0137.014.2638.023.6129.393.4222.410.8911.274.45
Total100.0012.79100.0011.07100.0011.50100.009.50100.0011.65100.003.96100.0039.52
Table A8. Yield of each size fraction at the different time intervals under a 20% external moisture content.
Size
Fraction
(mm)
0–20 s Yield20–40 s Yield40–60 s Yield60–80 s Yield80–150 s Yield150–250 s YieldOversized Product Yield
A (%)B (%)A (%)B (%)A (%)B (%)A (%)B (%)A (%)B (%)A (%)B (%)A (%)B (%)
13–60.000.000.000.000.000.000.000.000.000.000.000.0053.5020.09
6–34.250.354.390.415.400.506.190.6021.544.5077.783.8539.5414.85
3–159.394.9557.335.3455.575.1053.875.2541.938.779.490.470.240.09
1–036.363.0338.283.5639.033.5839.943.8936.537.6412.740.636.722.53
Total100.008.34100.009.31100.009.18100.009.74100.0020.91100.004.96100.0037.56
Table A9. Yield of each size fraction at the different time intervals under a 25% ratio of fine particles in the feed.
Size
Fraction
(mm)
0–20 s Yield20–40 s Yield40–60 s Yield60–80 s Yield80–150 s Yield150–250 s YieldOversized Product Yield
A (%)B (%)A (%)B (%)A (%)B (%)A (%)B (%)A (%)B (%)A (%)B (%)A (%)B (%)
13–60.000.000.000.000.000.000.000.000.000.000.000.0053.9033.42
6–316.401.6022.021.7037.241.9049.831.9873.685.0788.264.0840.9425.39
3–157.275.5749.783.8338.031.9431.591.2512.770.882.170.100.040.02
1–026.332.5628.202.1724.741.2618.580.7413.550.939.570.445.133.18
Total100.009.72100.007.70100.005.09100.003.97100.006.88100.004.62100.0062.01
Table A10. Yield of each size fraction at the different time intervals under a 35% ratio of fine particles in the feed.
Size
Fraction
(mm)
0–20 s Yield20–40 s Yield40–60 s Yield60–80 s Yield80–150 s Yield150–250 s YieldOversized Product Yield
A (%)B (%)A (%)B (%)A (%)B (%)A (%)B (%)A (%)B (%)A (%)B (%)A (%)B (%)
13–60.000.000.000.000.000.000.000.000.000.000.000.0053.6428.99
6–37.540.9513.271.3626.571.7640.931.7768.255.1982.253.7339.6221.41
3–161.827.8156.085.7545.232.9933.641.4612.170.932.220.100.020.01
1–030.643.8730.653.1528.191.8625.431.1019.581.4915.530.706.723.63
Total100.0012.63100.0010.26100.006.61100.004.33100.007.61100.004.53100.0054.03
Table A11. Yield of each size fraction at the different time intervals under a 45% ratio of fine particles in the feed.
Size
Fraction
(mm)
0–20 s Yield20–40 s Yield40–60 s Yield60–80 s Yield80–150 s Yield150–250 s YieldOversized Product Yield
A (%)B (%)A (%)B (%)A (%)B (%)A (%)B (%)A (%)B (%)A (%)B (%)A (%)B (%)
13–60.000.000.000.000.000.000.000.000.000.000.000.0048.9324.54
6–33.070.506.420.7414.191.1027.881.2050.773.0977.222.9142.0121.07
3–163.3510.4059.926.8953.634.1639.721.7119.051.161.420.050.250.13
1–033.585.5133.663.8732.182.5032.401.4030.181.8421.350.818.804.41
Total100.0016.41100.0011.50100.007.76100.004.31100.006.09100.003.77100.0050.16

References

  1. Duda-Mroz, N.; Anufriiev, S.; Stefaniak, P. Application of wavelet filtering to vibrational signals from the mining screen for spring condition monitoring. Minerals 2021, 11, 1076. [Google Scholar] [CrossRef]
  2. Guerreiro, F.S.; Gedraite, R.; Ataíde, C.H. Residual moisture content and separation efficiency optimization in pilot-scale vibrating screen. Powder Technol. 2016, 287, 301–307. [Google Scholar] [CrossRef]
  3. Zhang, J.X.; Wang, Y.; Niu, F.S.; Zhang, H.M.; Li, S.Y.; Wang, Y.P. Parameterization of multi-angle shaker based on PSO-BP neural network. Minerals 2023, 13, 929. [Google Scholar] [CrossRef]
  4. Yang, X.; Zhang, Y.M.; Bao, S.X. Preparation of high purity V2O5 from a typical low-grade refractory stone coal using a pyro-hydrometallurgical process. Minerals 2016, 6, 69. [Google Scholar] [CrossRef]
  5. Lawinska, K.; Modrzewski, R.; Wodzinski, P. Comparison of the potential of using drum and vibrating screens for segregating mineral and municipal waste. Rocz. Ochr. Sr. 2015, 17, 1365–1388. [Google Scholar]
  6. Shanmugam, B.K.; Vardhan, H.; Raj, M.G.; Kaza, M.; Sah, R.; Harish, H. Evaluation of a new vibrating screen for dry screening fine coal with different moisture contents. Int. J. Coal Prep. Util. 2022, 42, 752–761. [Google Scholar] [CrossRef]
  7. Moncada, M.; Rodríguez, C.G. Dynamic modeling of a vibrating screen considering the ore inertia and force of the ore over the screen calculated with discrete element method. Shock Vib. 2018, 2018, 1714738. [Google Scholar] [CrossRef]
  8. Peng, L.P.; Jiang, H.S.; Chen, X.H.; Liu, D.Y.; Feng, H.H.; Zhang, L.; Zhao, Y.M.; Liu, C.S. A review on the advanced design techniques and methods of vibrating screen for coal preparation. Powder Technol. 2019, 347, 136–147. [Google Scholar] [CrossRef]
  9. Zhou, Z.G.; Huang, L.; Jiang, H.S.; Wen, P.F.; Zhao, L.L.; Zhao, Y.M.; Duan, C.L.; Luo, Z.F.; Wang, Z.Q.; Liu, C.S.; et al. Kinematics of elastic screen surface and elimination mechanism of plugging during dry deep screening of moist coal. Powder Technol. 2019, 346, 452–461. [Google Scholar] [CrossRef]
  10. Zhang, B.; Zhu, G.Q.; Lv, B.; Yan, G.H. A novel and effective method for coal slime reduction of thermal coal processing. J. Clean. Prod. 2018, 198, 19–23. [Google Scholar] [CrossRef]
  11. Wang, W.N.; Hou, X.; Mao, P.F.; Pan, M.; Yu, S.J.; Jiang, H.S.; Qiao, J.P.; Duan, C.L. Kinematic characteristics of key structures and time evolution law of material distribution characteristics during flip-flow screening. Miner. Eng. 2023, 201, 108241. [Google Scholar] [CrossRef]
  12. Xu, N.N.; Tang, S.; Lin, D.D.; Geng, R.H.; Wang, X.W.; Liang, X.H. Complex granular flows of sticky-wet material on flip-flow screens: Calibration of discrete element simulations. Particuology 2024, 84, 290–308. [Google Scholar] [CrossRef]
  13. Zhao, G.F.; Wang, X.W.; Lin, D.D.; Xu, N.N.; Yu, C.; Geng, R.H. Study of Double-Deck Vibrating Flip-Flow Screen Based on Dynamic Stiffness Characteristics of Shear Springs. Minerals 2021, 11, 928. [Google Scholar] [CrossRef]
  14. Li, H.X.; Liu, C.S.; Shen, L.; Zhao, L.L.; Li, S. Kinematics characteristics of the flip-flow screen with a crankshaft-link structure and screening analysis for moist coal. Powder Technol. 2021, 394, 326–335. [Google Scholar] [CrossRef]
  15. Wang, W.A.; Pan, M.; Duan, C.L.; Jiang, H.S.; Zhao, Y.M.; Lu, H.D. Dry deep screening of spodumene and its mineral processing technology. Miner. Eng. 2022, 179, 107445. [Google Scholar] [CrossRef]
  16. Lin, D.D.; Ji, J.C.; Wang, X.W.; Wang, Y.X.; Xu, N.N.; Ni, Q.; Zhao, G.F.; Feng, K. A rigid-flexible coupled dynamic model of a flip-flow vibrating screen considering the effects of processed materials. Powder Technol. 2023, 427, 118753. [Google Scholar] [CrossRef]
  17. Yu, C.; Pu, K.W.; Geng, R.H.; Qiao, D.Z.; Lin, D.D.; Xu, N.N.; Wang, X.W.; Li, J.W.; Gong, S.P.; Zhou, Q. Comparison of flip-flow screen and circular vibrating screen vibratory sieving processes for sticky fine particles. Miner. Eng. 2022, 187, 107791. [Google Scholar] [CrossRef]
  18. Gong, S.P.; Oberst, S.; Wang, X.W. An experimentally validated rubber shear spring model for vibrating flip-flow screens. Mech. Syst. Signal Pr. 2020, 139, 106619. [Google Scholar] [CrossRef]
  19. Makinde, O.A.; Ramatsetse, B.I.; Mpofu, K. Review of vibrating screen development trends: Linking the past and the future in mining machinery industries. Int. J. Miner. Process 2015, 145, 17–22. [Google Scholar] [CrossRef]
  20. Linhares, T.B.; Vimieiro, C.B.S. Analysis of the dynamic forces acting on a vibrating screen and its support structure using a scale model. Measurement 2021, 176, 109179. [Google Scholar] [CrossRef]
  21. Lin, D.D.; Xu, N.N.; Yu, C.; Geng, R.H.; Wang, X.W.; Gong, S.P. Nonlinear model of vibrating flip-flow screens that considers the effects of screen panels. IEEE Access 2022, 10, 34246–34259. [Google Scholar] [CrossRef]
  22. Xiong, X.Y.; Niu, L.K.; Gu, C.X.; Wang, Y.H. Vibration characteristics of an inclined flip-flow screen panel in banana flip-flow screens. J Sound Vib. 2017, 411, 108–128. [Google Scholar] [CrossRef]
  23. Chen, B.X.; Yu, C.; Gong, S.P.; Wang, X.W. Dynamic characteristics of LIWELL flip-flow screen panel and particle movement. Chem. Eng. Sci. 2021, 245, 116853. [Google Scholar] [CrossRef]
  24. Yu, C.; Geng, R.H.; Wang, X.W. A numerical study of separation performance of vibrating flip-flow screens for cohesive particles. Minerals 2021, 11, 631. [Google Scholar] [CrossRef]
  25. Peng, L.P.; Li, F.M.; Dong, H.L.; Liu, C.S.; Zhao, Y.M.; Duan, C.L. Characteristics analysis of a novel centralized-driving flip-flow screen. Int. J. Min. Sci. Technol. 2014, 24, 195–200. [Google Scholar] [CrossRef]
  26. Lin, D.D.; Ji, J.C.; Yu, C.; Wang, X.W.; Xu, N.N. A non-linear model of screen panel for dynamics analysis of a flip-flow vibrating screen. Powder Technol. 2023, 418, 118312. [Google Scholar] [CrossRef]
  27. Tang, J.; Niu, L.K.; Xiong, X.Y.; Jie, S.J. Viscoelasticity of rubber springs affects vibration characteristics of a flip-flow screen with the high G value. IEEE Access 2020, 8, 26950–26965. [Google Scholar] [CrossRef]
  28. Zhou, E.H.; Yan, G.H.; Weng, X.Y.; Zhang, Z.X.; Zhao, P.F.; Zhang, B. A novel and low cost coal separation process: Combination of deep screening classification and gravity separation. Powder Technol. 2020, 367, 568–575. [Google Scholar] [CrossRef]
  29. Yu, C.; Wang, X.W.; Gong, S.P.; Pang, K.F.; Zhao, G.F.; Zhou, Q.; Lin, D.D.; Xu, N.N. Stability analysis of the screening process of a vibrating flip-flow screen. Powder Technol. 2021, 163, 106794. [Google Scholar] [CrossRef]
  30. Geng, R.H.; Yu, C.; Wang, Y.X.; Wang, X.W.; Zhang, X.K.; Li, R.L. Effect of external moisture content on screening performance of vibrating flip-flow screen and circular vibrating screen. Minerals 2023, 13, 585. [Google Scholar] [CrossRef]
Figure 1. Dual-mass flip-flow screening test rig and experimental materials: (a) photo of the test rig; (b) three-dimensional schematic of the test rig; and (c) experimental materials.
Minerals 14 00271 g001
Figure 2. Particle size distribution of the samples: (a) content of each particle size fraction; and (b) cumulative particle size distribution curve.
Minerals 14 00271 g002
Figure 3. Effect of screen-panel tensile length on the screening performance of an FFVS: (a) yield of undersized product; (b) screening efficiency; (c) total misplaced material; and (d) distribution rate.
Minerals 14 00271 g003
Figure 4. Effect of external moisture content on the screening performance of an FFVS: (a) yield of undersized product; (b) screening efficiency; (c) total misplaced material; and (d) distribution rate.
Minerals 14 00271 g004
Figure 5. Effect of the ratio of fine particles in the feed on the screening performance of an FFVS: (a) yield of undersized product; (b) screening efficiency; (c) total misplaced material; and (d) distribution rate.
Minerals 14 00271 g005
Table 1. Industrial analysis of the air-dried coal samples.
Size Fraction (mm)Mad (%)Aad (%)Vad (%)FCad (%)
13–61.257.2037.7153.84
6–30.8419.4635.2244.49
3–10.4416.6834.2148.67
1–00.2616.2535.0648.43
Note: Mad is the moisture mass fraction of a sample in the air-dried basis; Aad is the ash mass fraction of a sample in the air-dried basis; Vad is the volatile matter mass fraction of a sample in the air-dried basis; FCad is the fixed-carbon mass fraction of a sample in the air-dried basis.
Disclaimer/Publisher’s Note: The statements, opinions and data contained in all publications are solely those of the individual author(s) and contributor(s) and not of MDPI and/or the editor(s). MDPI and/or the editor(s) disclaim responsibility for any injury to people or property resulting from any ideas, methods, instructions or products referred to in the content.

