Article

Study on the Dynamic Evolution of Mining-Induced Stress and Displacement in the Floor Coal-Rock Induced by Protective Layer Mining

1
The National Joint Engineering Laboratory of Internet Applied Technology of Mines, China University of Mining & Technology (CUMT), Xuzhou 221116, China
2
College of Environment and Safety Engineering, Qingdao University of Science & Technology, Qingdao 266061, China
3
Shanxi Coking Coal Xishan Coal Electricity (Group) Co., Ltd., Taiyuan 030027, China
*
Author to whom correspondence should be addressed.
Minerals 2024, 14(11), 1084; https://doi.org/10.3390/min14111084
Submission received: 15 September 2024 / Revised: 23 October 2024 / Accepted: 26 October 2024 / Published: 28 October 2024

Abstract

:
Protective layer mining is the most effective means to prevent and control coal and gas outbursts. In order to deeply understand the dynamic evolution law of mining stress and displacement of the bottom plate coal rock body in the process of protective layer mining, the effects of upper protective layer mining on stress variation and displacement deformation in the underlying coal seam were studied using the similar experiment and FLAC3D simulations. The results reveal that mining in the 82# coal seam notably alleviates pressure in the 9# coal seam below, with an average relief rate of 86.2%, demonstrated by the maximal strike expansion deformation rate of 11.3‰ in the 9# coal seam post-mining. Stress monitoring data indicates a stress concentration zone within 32 m ahead of the working face, and a pressure relief zone within 51 m behind it. The research provides a scientific foundation for pressure-relief gas extraction techniques, affirming the substantial impact of upper protective layer mining on alleviating pressure in underlying coal seams, enhancing safety, and optimizing mining efficiency.

1. Introduction

Coal continues to be a primary energy source, serving as the ballast in the energy transition under the dual-carbon goals in China [1,2,3]. To mitigate mining-related gas incidents, a primary objective is to reduce both the gas content and pressure within coal seams. Globally, including in China, common strategies primarily focus on protective layer mining and gas pre-drainage techniques. Through extensive engineering applications, it has been demonstrated that combining protective layer mining with pressure-relief gas extraction is highly effective in preventing outbursts [4]. The impact of protective layer mining on coal seams has been extensively studied, with several key investigations shedding light on the associated mechanical and permeability changes. Yin et al. [5] conducted a thorough analysis of the mechanical behavior and permeability evolution of gas-infiltrated coal during protective layer mining, with particular attention to the effects of mining-induced stress paths on the structural properties of coal. Their findings underline the importance of stress-path alterations in influencing coal permeability, which is critical for gas extraction. In another significant study, Wang et al. [6] proposed an innovative safety strategy for preventing coal and gas outbursts in deep and thick coal seams by employing soft rock protective layer mining. This approach involves the selection of a soft rock layer adjacent to the deep coal seams as the initial protective mining layer. Field research at the Luling coal mine demonstrated the strategy’s effectiveness, showing that it significantly reduced outburst risks by facilitating efficient pressure relief and gas extraction. This technique transformed high-risk outburst-prone coal seams into safer zones for mining operations. Liu and Cheng [7] explored the use of long-distance lower protective seam mining combined with stress-relief gas extraction as a means of eliminating coal and gas outburst disasters, particularly in the Huaibei coal mine area. Their study utilized simulations and field experiments to investigate pressure relief deformation, the development of mining-induced cracks, and the overall effectiveness of pressure relief measures in preventing outbursts. Zhang et al. [8] applied numerical simulations using FLAC3D software (version 9.20) to assess the stress evolution and deformation of overlying coal seams due to lower protective layer mining at the Hezhuang Coal Mine in Western Henan. Their research highlighted the significant impact of PLM on stress distribution and mechanical behavior. Specifically, the study revealed that PLM leads to the formation of stress concentration and relief zones, which alter the deformation patterns of the overlying seams. Cheng et al. [9] investigated the optimization of gas drainage borehole layouts in protective coal seam mining, focusing on gas seepage characteristics. Their research provided critical insights into the relationship between borehole positioning and the efficiency of gas extraction, emphasizing the importance of optimized layouts in enhancing the effectiveness of protective seam mining.
Accurately monitoring the stress and displacement changes in floor mass during the coal mining is crucial for ensuring the stability of the roof and floor [10,11,12]. The dynamic change stress should be deeply understood to effectively predict and prevent roof collapse triggered by the stress concentration, thereby reducing mining accidents [13,14,15]. Additionally, the risk of gas outbursts in coal seams can be identified, and appropriate ventilation and gas extraction measures are implemented to ensure the safety of miners [16,17]. Furthermore, the dynamic evolution of stress and displacement should be explored to optimize the mining plan. For example, the most suitable coal extraction methods and sequences are selected to mitigate the stress concentration, thereby enhancing the mining efficiency [18,19]. Investigating the stress and displacement changes in floor mass can help understand the deformation characteristics of the mass during the protective layer mining, thus optimizing the gas emission scheme. The stress state of floor mass should be obtained to formulate effective pressure relief measures, improving the efficiency of gas extraction and reducing the threat of gas accumulation to mine safety. In recent years, scholars have conducted numerous on mining stress in the mass. Song et al. [20] conducted uniaxial mechanical experiments on combinations and discovered that the compressive strength lies between the coal and rock, being higher than coal but significantly lower than rock. Cheng et al. [21] investigated the mechanical properties of the composite mass and explored the effect of height ratio, shape, and interface parameters of mass on the mechanical characteristics. The results indicated that the influence degree is in the following order: the height ratio is the most pronounced, followed by the coal strength and the rock strength, and finally by the interface parameters. Du et al. [22] explored the specimen failure from the perspective of energy conversation and deeply analyzed the energy accumulation mechanism of composite structures in practical engineering. Li et al. [23] investigated the stress distribution of surrounding rocks at the roadway and working face through the numerical simulation of FLAC3D, and discussed the impact of the floor coal thickness on the surrounding stress. The findings revealed that the stress concentration rapidly diminishes and eventually stabilizes as the floor coal thickness decreases. Zhang et al. [24] utilized numerical simulations and theoretical analyses to reveal the vertical stress distribution of surrounding rocks at the roadway under different coal thickness conditions. He et al. [25] analyzed the vertical stress distribution inside the coal pillar under varying coal thickness conditions and determined the appropriate width of the coal pillar. Yu et al. [26] elucidated the distribution law of vertical stress in the roof coal under different coal thicknesses and compared it with measured data for validation. Yang et al. [27] explored the influence of coal thickness change on the peak value of the advanced support stress and the stress distribution law. Xiong et al. [28] deeply analyzed the deformation of an inclined coal seam roadway and derived an analytical solution for the stress of surrounding rocks based on the complex function theory. The stress and deformation exhibit distinct asymmetric distribution characteristics. Xiong et al. [29] further proposed that the stress and deformation damage of the low roof surrounding rocks are more significant compared to the high roof, reflecting an asymmetric feature. The concept of a “cyclic failure” mechanism was introduced, which suggested that the interaction between the two sidewalls, the corners, and the roof of the roadway exacerbates the damage, leading to overall instability. Cheng et al. [30] found that the position of the peak pressure and the development of the plastic zone on the higher side were greater than on the lower side when the inclined roadway was excavated along the roof; they proposed a support scheme combining an anchor-net support with high-side enforcement using anchor cables, which achieved good support effects. Tao et al. [31] studied the deformation difference between inclined rock stratum roadways and shallow horizontal rock stratum roadways in deep mining and pointed out that the top and bottom of the roadways experienced damage on the left side, while the left and right sidewalls were damaged near the bottom under 45° and 60° inclined strata.
Although significant research has been conducted on mining-induced stress in the surrounding rock, particularly in the roof and walls, the dynamic evolution of stress and displacement in the floor coal mass during mining operations is not yet fully understood. To investigate the stress change and displacement deformation of the roof and floor rock strata, as well as the protected layer, an experimental platform was constructed, and similar simulation experiments were conducted to reveal the pressure-relief effect on the protected layer during the protective layer mining using the 82 coal seam and the 9 coal seam in the third mining area of Qidong Coal Mine as the geological background. Meanwhile, numerical simulation methods were employed to analyze the dynamic evolution of stress and deformation of the mass during the mining process. This study uniquely integrates both similar simulation experiments and FLAC3D numerical simulations to explore the dynamic evolution of mining-induced stress and displacement in the floor coal mass during protective layer mining. While previous studies have focused on either the roof or the overall mining-induced stress, this study provides a detailed and specific analysis of the floor coal mass, which has received comparatively less attention. By addressing this gap, the study offers new insights into the stress redistribution and deformation characteristics unique to the floor, a critical factor for ensuring mining safety and optimizing pressure-relief techniques.

2. Similar Experiments of Upper Protective Layer Mining

2.1. Similarity Theory

2.1.1. Laws of Similarity

Based on the similarity theory, physical phenomena can be simulated, and the basic properties and features of similar phenomena can be expressed through three similarity theorems [32,33,34,35,36].
According to the first law of similarity, the similarity criteria should be equal, with a similarity index of 1 and a similar single-value condition. There exists an invariant combination quantity in two similar systems, known as the similarity criterion. Geometric, physical, boundary, and initial conditions are included in the single-value condition, which distinguish the phenomena from similar phenomena.
The second law of similarity, also known as the “π-theorem”, can be stated as follows: if the phenomena are similar, the relationship between parameters describing the phenomena can be transformed into a functional relationship between the similarity criteria, and the functional relationship of similarity criteria for similar phenomena are identical. Because the similarity criteria are dimensionless, the physical equations are presented in the following Equation (1):
f a 1 , a 2 , , a k , a k + 1 , a k + 2 , , a n = 0
It can be transformed into a dimensionless similarity criterion equation [37], as shown in the following Equation (2):
F π 1 , π 2 , , π n k = 0
where a 1 , a 2 , , a k are the basic quantities, and a k + 1 , a k + 2 , , a n represent the derived quantities. Thus, it can be observed that there are (nk) similarity criteria. The second law of similarity provides a theoretical basis for extending the results of similar simulation experiments.
According to the third law of similarity, if two phenomena can be described by the same relationship, and if they satisfy the similarity of a single-value condition and equal similarity criteria, then the phenomena are considered similar. In engineering practice, achieving complete similarity is difficult or impossible. Therefore, the primary factors can be selected for “approximate simulation” based on the characteristics of the research object, disregarding the secondary factors.

2.1.2. Similarity Criterion

The experimental model is required to be similar to the prototype in shape and size, for which the size ratio is a constant, as shown in the following Equation (3):
C L = L m L p
where C L is the geometric constant; L m represents the geometric dimension parameter of the actual model; and L p stands for the combined dimension parameter of the prototype. The geometric similarity constant C L for the model test is taken as 1/100.
As the mining face advances, the range and the boundary of mining are continuously changing, and the model is a dynamic model [38,39], which also needs to meet the requirement of time similarity. The calculation formula is as follows in Equation (4):
C i = C L = 1 / 10
where C i is a time similarity constant.
All forces acting on the model and the actual prototype should be similar. The specific gravity ratio is required to be a constant in mine pressure experiments [40,41,42], as given in the following Equation (5):
C γ = γ m γ p
where γ p is the specific gravity of the actual prototype; γ m stands for the specific gravity of the model, with a similarity constant of 0.6.
The dominant similarity criteria in the process of deformation and failure of rocks under the gravity and internal stress is presented as follows in Equation (6):
σ m γ m L m = σ p γ p L p
The similarity constants satisfy the following relationship, as presented in the following Equation (7):
C σ = C γ C L
where σ p is the stress of the actual prototype, σ m represents the stress of the model, and C σ stands for the similarity constant of the stress (strength).

2.2. Geological Background

The primary coal seams involved in the third mining area of Qidong Coal Mine are the 82# coal seam and the 9# coal seam. The 82# coal seam is located in the upper protective layer, and the thickness ranges from 1.01 m to 3.03 m, with an average of 1.90 m, which demonstrates the high admissibility and relatively stable structure of the coal seams. The 9# coal seam is situated as the underlying protected layer, and the thickness exhibits significant variations, ranging from 0.29 m to 5.29 m. The coal seam structure is complex, and some areas are eroded by magmatic rock, leading to an unstable coal seam overall. The 82# coal seam is one of the main minable coal seams in the mining area, and the thickness ranges from 1.01 m to 3.03 m, with an average of 1.90 m, a variation coefficient of 44.6%, and an admissibility index of 1. The coal seam structure is relatively simple, commonly containing a layer of mudstone gangue. A total of 22 boreholes are in the area, mudstone gangue occurs in 20 boreholes, and the thickness ranges from 0.3 m to 0.88 m, with an average of 0.45 m. Thus, the 82# coal seam is relatively stable. The 9# coal seam is also a primary minable coal seam, which is located 7.65 m to 16.26 m below the 82# coal seam, with an average distance of 11.28 m. Due to the erosion of magmatic rock, the coal seam thickness varies significantly, resulting in a large non-mining area. The mining area mostly exist in the form of natural coke, and the coal thickness (including natural coke) ranges from 0.29 m to 5.29 m, with an average of 2.47 m, a variation coefficient of 56.0%, and an admissibility index of 0.82. The coal seam structure is complex, containing 1 to 3 layers of gangue, primarily composed of magmatic rock, mixture of magmatic rock and natural coke, and mudstone. Therefore, the 9# coal seam is unstable.
The immediate roof of the 82# coal seam is interbedded with gray to dark gray mudstone and sandstone, with a thickness range of 0.54 m to 9.46 m and an average thickness of 2.74 m. The main roof is composed of off-white fine-grain quartz sandstone, predominantly made up of quartz, followed by feldspar, containing a small amount of dark minerals with wavy and oblique bedding. Part of the main roof is interbedded with thin layers of mudstone, exhibiting horizontal bedding, moderate performance for sorting and roundness, and calcareous cementation. Argillaceous inclusions and sideritic ooids can be observed in the lower part, and the uniaxial compressive strength is 879,141 MPa in the natural state, with an average strength of 117.5 MPa. The floor is gray mudstone with a muddy structure, interbedded with numerous fine sandstones or interbeds, and contains plant fossil fragments. The thickness ranges from 1.01 m to 8.24 m, with an average of 3.4 m. The uniaxial compressive strength is 40,659.3 MPa in the natural state, with an average of 49.2 MPa.
Some sections of the 9# coal seam are primarily located in the eastern part of the mining area, and the immediate roof is composed of gray mudstone and siltstone. The thickness varies from 0.56 m to 5.22 m, with an average thickness of 2.67 m and a compressive strength of 38.2 MPa in the natural state. The main roof consists of off-white fine-grain quartz sandstone, dominated by quartz, followed by feldspar, and contains dark minerals. The lithology is hard and dense, with a blocky structure and horizontal gentle wave bedding, containing large amounts of argillaceous inclusions. The thickness ranges from 4.78 m to 10.63 m, with an average of 7.89 m, and the natural compressive strength varies from 394,122.8 MPa, with an average of 61.6 MPa. The floor is comprised of gray mudstone and siltstone, with local areas appearing to be slightly purple, and contains plant fossil fragments. The thickness varies from 0.59 m to 10.34 m, with an average of 2.86 m. The natural compressive strength ranges from 12.7 MPa to 50.5 MPa, with an average of 37.8 MPa.
The geological information presented in this study is based on fundamental measurement data collected from Qidong Coal Mine. These data were obtained through routine geological surveys, borehole records, and on-site measurements conducted at the mine. The geological data reflect the actual conditions of the mining area and ensure that the geological model used in this study aligns with the real-world site conditions.

2.3. Similarity Experiment

The selected dimensions for the simulation test bench of similar materials are as follows: length × height × thickness = 2500 mm × 1900 mm × 300 mm, respectively, and the geometric similarity constant for the model is taken as 1/100. Based on experimental requirements, the total laying thickness of the model is 149 cm, simulating a total of 17 coal–rock strata. The thickness of floor rock stratum in the 9# coal seam is 59 cm, and the laying thickness of the 9# coal seam is 2.0 cm. The interlayer spacing between the 82# coal seam and the 9# coal seam is 12.5 cm, the laying thickness of the 82# coal seam is 1.8 cm, and the thickness of roof rock stratum in the 82# coal seam is 73.7 cm.
To eliminate the boundary effect of the test bench, a 25 cm unexcavated area is reserved on the left and right sides of the 82# coal seam to simulate the boundary pillar. The strike excavation length of the simulated coal seam is 200 m. The actual density of the rock strata is 2500 kg/m3, and the material density in the model generally ranges from 1500 kg/m3 to 1700 kg/m3. If the density is too high, forming and tamping become difficult, while if the density is too low, the model material is loose, resulting in forming failure. Therefore, a density of 1500 kg/m3 is chosen for the experiment, and the similarity constant of specific gravity is C γ = 0.6.
The movement and deformation of rock strata induced by mining are monitored through the CoordMeasis 3D photogrammetric monitoring system (Hangdaqingyun, Beijing, China). The photogrammetry involves pasting the markers with a black background and a white center onto the model surface, with a spacing of 100 mm × 100 mm. Fixed markers are installed on the surrounding metal frame. Three stress measurement lines are arranged to determine the stress changes in the roof and floor during the mining process of the 82# coal seam, which are located at the middle of the 9# coal seam, the floor of the 82# coal seam, and the roof of the 82# coal seam, respectively. Each measurement line is equipped with 15 strain gauges, as shown in Figure 1a. Data collection is performed through the stress testing system of the ZC40YL physical model, as illustrated in Figure 1b.

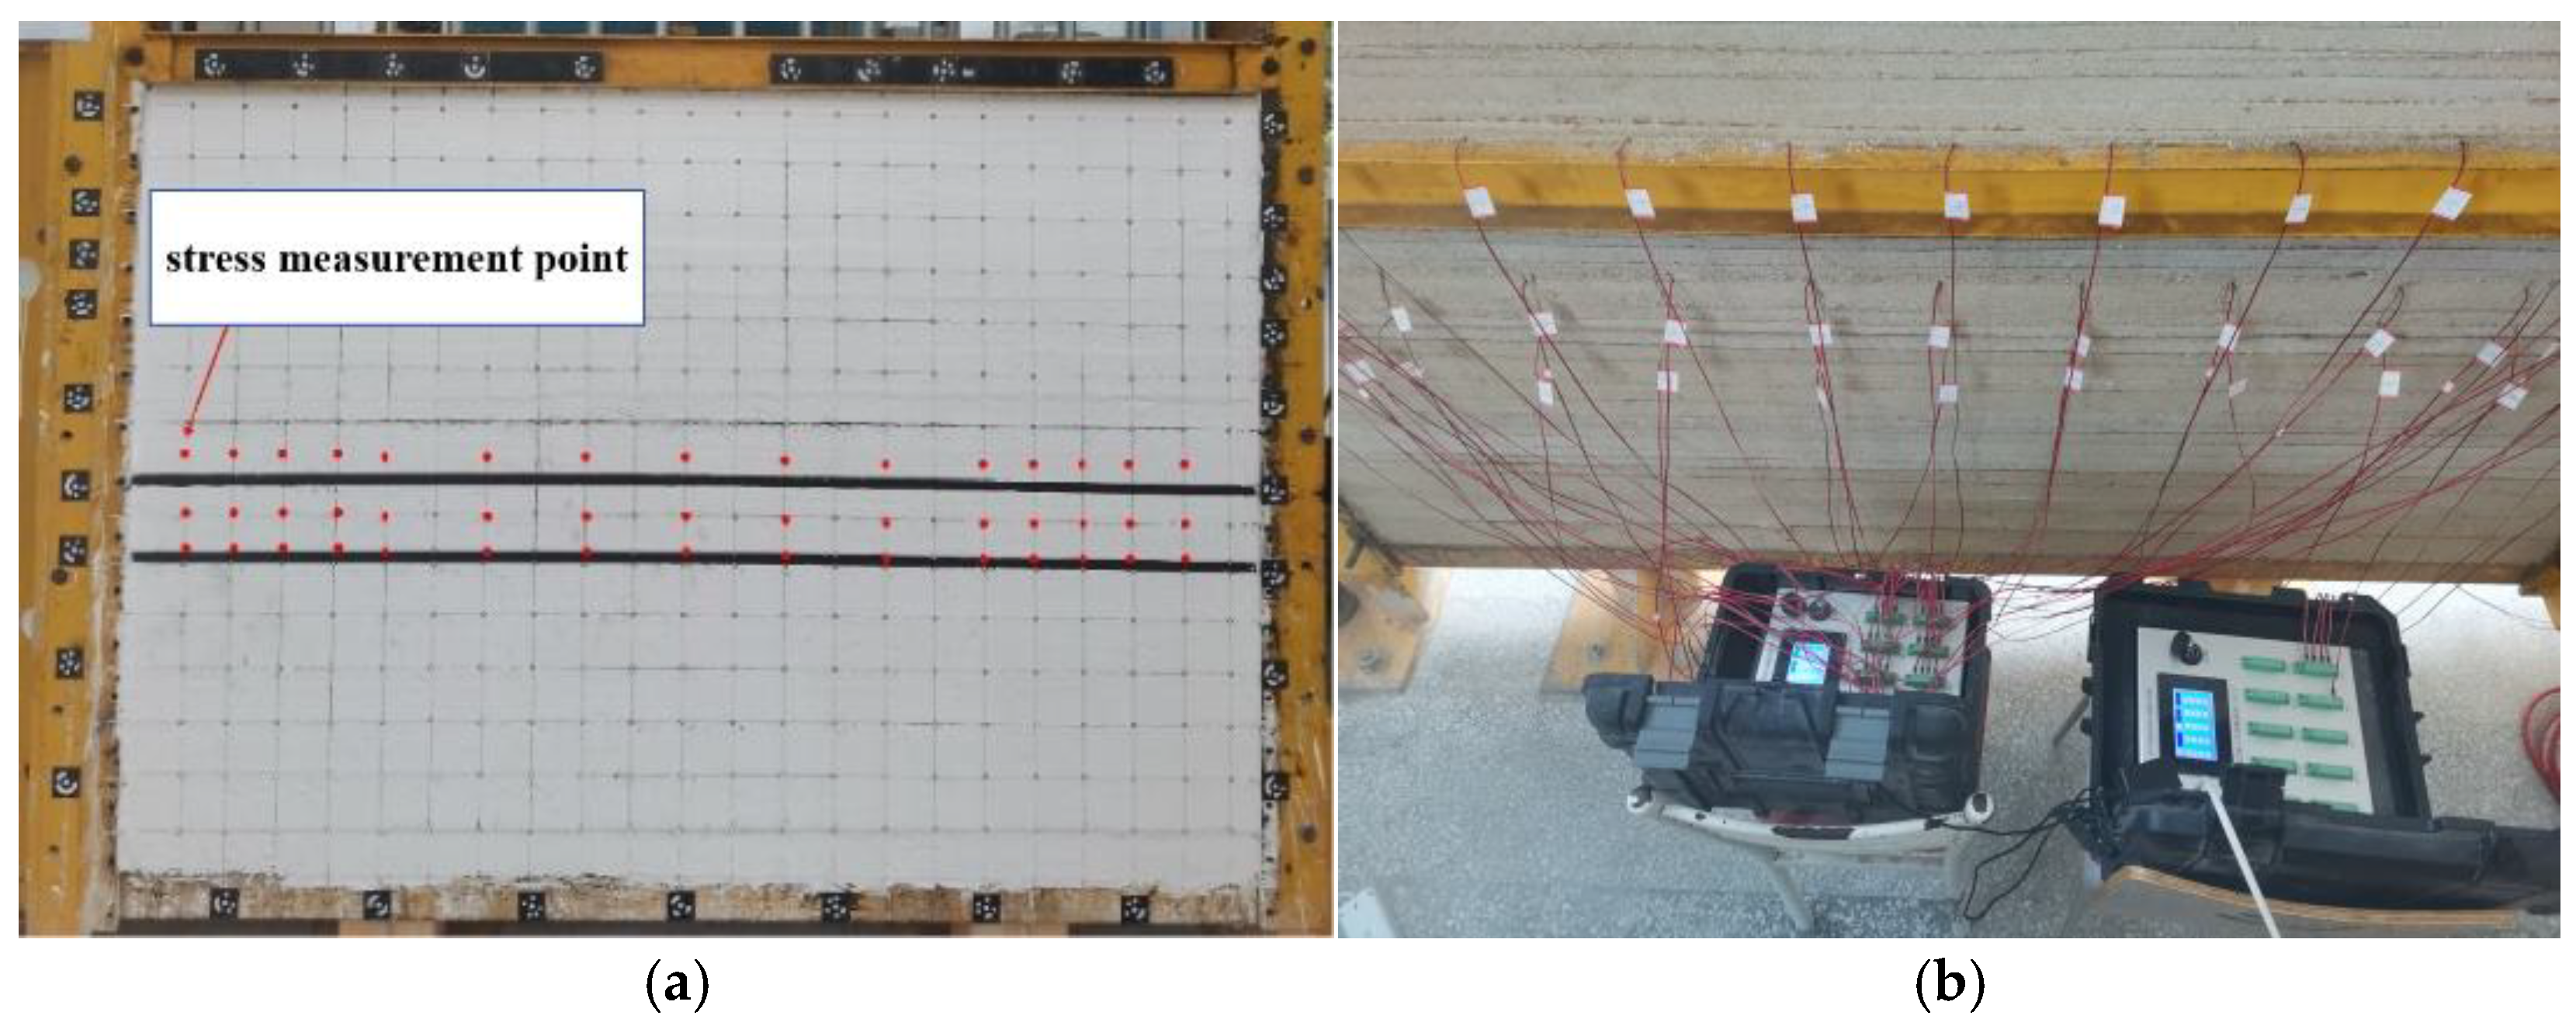
2.4. Experiment Method

The mine surface elevation is approximately 21 m, and the starting and ending elevation of the working face ranges from −528.1 m to −603.5 m. The central elevation of the working face is −566 m, the top elevation of the model is −492 m, and the supplemented thickness of rock strata is 513 m. The pressure is generated through simulating pressurization. The specific weight of the overlying rock layer is 25 kN/m3, and the pressure exerted by rock strata with a thickness of 513 m is calculated using the following Equation (8).
σ = γ h = 512 × 25,000 = 12.825   MPa
Based on the model size, C L is the line ratio, taken as 1/100, and Cγ is the specific weight ratio, taken as 0.6. Therefore, the actual loading pressure is determined using Equation (9), as follows:
σ m = σ p × C L × C γ = 12.825 × 1 / 100 × 0.6 = 0.07695   MPa
When selecting similar materials, the strength and deformation properties should be similar to the actual rocks, and the mechanical properties should be stable and not affected by external conditions. Moreover, the model should be easy to make at a low cost, and the materials should be readily available. In accordance with the specified requirements, fine river sand is selected as the aggregate, while lime (calcium carbonate) and gypsum serve as the cements. Water is used to assist the mixing and cohesion of materials, such as gypsum and calcium carbonate, enabling the formation of a cohesive mixture. Mica powder is applied at the stratified interfaces to reduce adhesion and compaction between layers, simulating the behavior of natural geological interfaces. While mica powder helps to create slip surfaces that allow relative movement between layers, it only partially reflects the behavior of natural geological interfaces. When the thickness of the rock stratum exceeds 2 cm, a small amount of mica powder should be sprinkled every 2 cm to ensure the stratified uniformity, and more mica powder can be added between thicker strata. The material ratio is determined based on the specific gravity, compressive strength, and tensile strength, and the specific ratio, as presented in Table 1. Each layer in the model is represented by a combination of materials (sand, calcium carbonate, gypsum, and water) selected to match the mechanical properties of the actual geological strata. These material ratios were calibrated based on a series of laboratory tests that measured the compressive strength and density of the resulting mixtures to ensure that they closely replicate the properties of the corresponding strata.
When mixing the materials, the dry materials are uniformly stirred first, and then water is added to continue stirring until the mixture is ready for molding. The process of molding and tamping should be completed within 20 min to prevent premature solidification of the materials. Coal seams can be identified by using ink instead of water. Before laying the model, lubricant should be applied to the inner sides of the channel steel to prevent surface irregularities during the demolding, and tools, such as an electric mixing bucket, electronic scale, shovel, water container, tamping hammer, and measuring tape should be prepared. After the model is completed, white emulsion paint should be brushed to the surface to observe fractures and breakage. The experiment system is shown in Figure 2.
The model materials is proportioned based on the similar conditions, and the ratio of similar materials XY(10 − Y) is determined by the ratio number. Thus, the proportion of sand in the total materials is X/(X + 1), the proportion of calcium carbonate is Y/(Y + 1), and the proportion of gypsum is (10 − Y)/10(X + 1), which is calculated to obtain the amount of stratified material.

3. Numerical Simulation Description

3.1. Overview for Numerical Simulation

The mining of the protective layer in contiguous coal seams induces the redistribution of insitu rock stress field and structural movement in the overlying rock and floor rock strata, resulting in the deformation and permeability change of the protected coal seams below. To investigate the dynamic evolution of stress and displacement in the floor mass during the protective layer mining, numerical simulations are conducted to analyze the stress and deformation of mass. During the process of coal seam mining, in situ stress is reduced within a certain range due to the movement and deformation of the roof and floor coal seams, which provides the theoretical basis of protective layer mining technology [43,44,45]. The deformation and pressure relief of strata reduce the stress of the protected coal seam and promote the development of fractures, which not only reduces the potential for coal and gas outbursts, but also significantly improves the permeability of coal seam, providing possibilities for gas extraction in the protective layer. Similar material models, field experiments, and numerical simulation methods are generally combined in geotechnical engineering and mining engineering. Numerical simulation can comprehensively reveal the movement, deformation, and stress change of the underlying coal–rock mass during the protective layer mining, laying the foundation for further research on the pressure relief and permeability change in the protected layer.
FLAC3D has been widely used in underground mining and civil engineering to simulate stress distribution, failure mechanisms, and the impact of geological conditions on rock stability. Previous studies have applied FLAC3D to model blast-induced damage factors, tunnel support systems, and the interaction between mining operations and rock mass behavior under various stress conditions. Such studies provide valuable insights into the capabilities of FLAC3D in replicating complex real-world conditions, further supporting its application in the present research. FLAC3D adopts the explicit finite difference method for continuous media, and the basic principle and algorithm are similar to the discrete element method. The large deformation and distortion can be effectively analyzed based on the continuous condition of node displacement, which is particularly suitable for tracking the gradual failure and collapse phenomena of materials [46,47,48]. The control structure during the calculation is shown in Figure 3.
The Coulomb yield criterion [49,50,51], the strength characteristics of the rock, are described as follows in Equation (10):
f s = σ 1 σ 3 1 + sin φ 1 sin φ 2 c 1 + sin φ 1 sin φ
where σ 1 and σ 3 are the maximum and minimum principal stresses, respectively; c and φ represent the material cohesion and internal friction angle, respectively. When f s > 0, shear failure will occur. The tensile strength of rock mass is very low in the normal stress state, so the tensile strength criterion ( σ 3 σ T ) can be employed to determine whether the rock mass undergoes tensile failure. Tensile stress is defined as a positive value, while compressive stress is defined as a negative value in FLAC3D.
The Qidong Coal Mine in Anhui Province is selected as the experimental prototype to simulate the impact of the 82# coal seam mining on the underlying rock strata and the protected layer of the 9th coal seam The research focuses on analyzing the displacement and stress variations of the underlying strata, and the results are utilized to guide the gas extraction of the underlying strata. The 8237 working face is located in the third horizontal mining area of the east wing, with a starting and ending elevation of −528.1 m to −603.5 m, with a dip width of 199 m (horizontal distance) and a strike length of about 1548 m. The working face is basically a monocline structure, with strata inclined to the northeast at an angle of 11°–15°, and an average of around 13°. The average coal thickness is 1.71 m, which makes it a prominent dangerous coal seam. The roof is gray fine sandstone, and the floor is gray mudstone. The distance between the 82# coal seam and the 9# coal seam is about 12.66 m, and the average coal thickness of the 9# coal seam is 2.04 m. The 8235 working face is adjacent to the 8237 working face, so the geological structure and the coal seam reserve are similar. The starting and ending elevation of the 8235 working face are −486.2 m to −562.3 m, with a dip width of 180.5 m (horizontal distance) and a strike length of 1392 m. The average coal thickness of the 8235 working face is 2.07 m. Considering that the two working faces are adjacent to each other and the strata are similar, the 8237 working face is taken to simulate the stress and displacement changes of the underlying mass during the mining process of the working face.

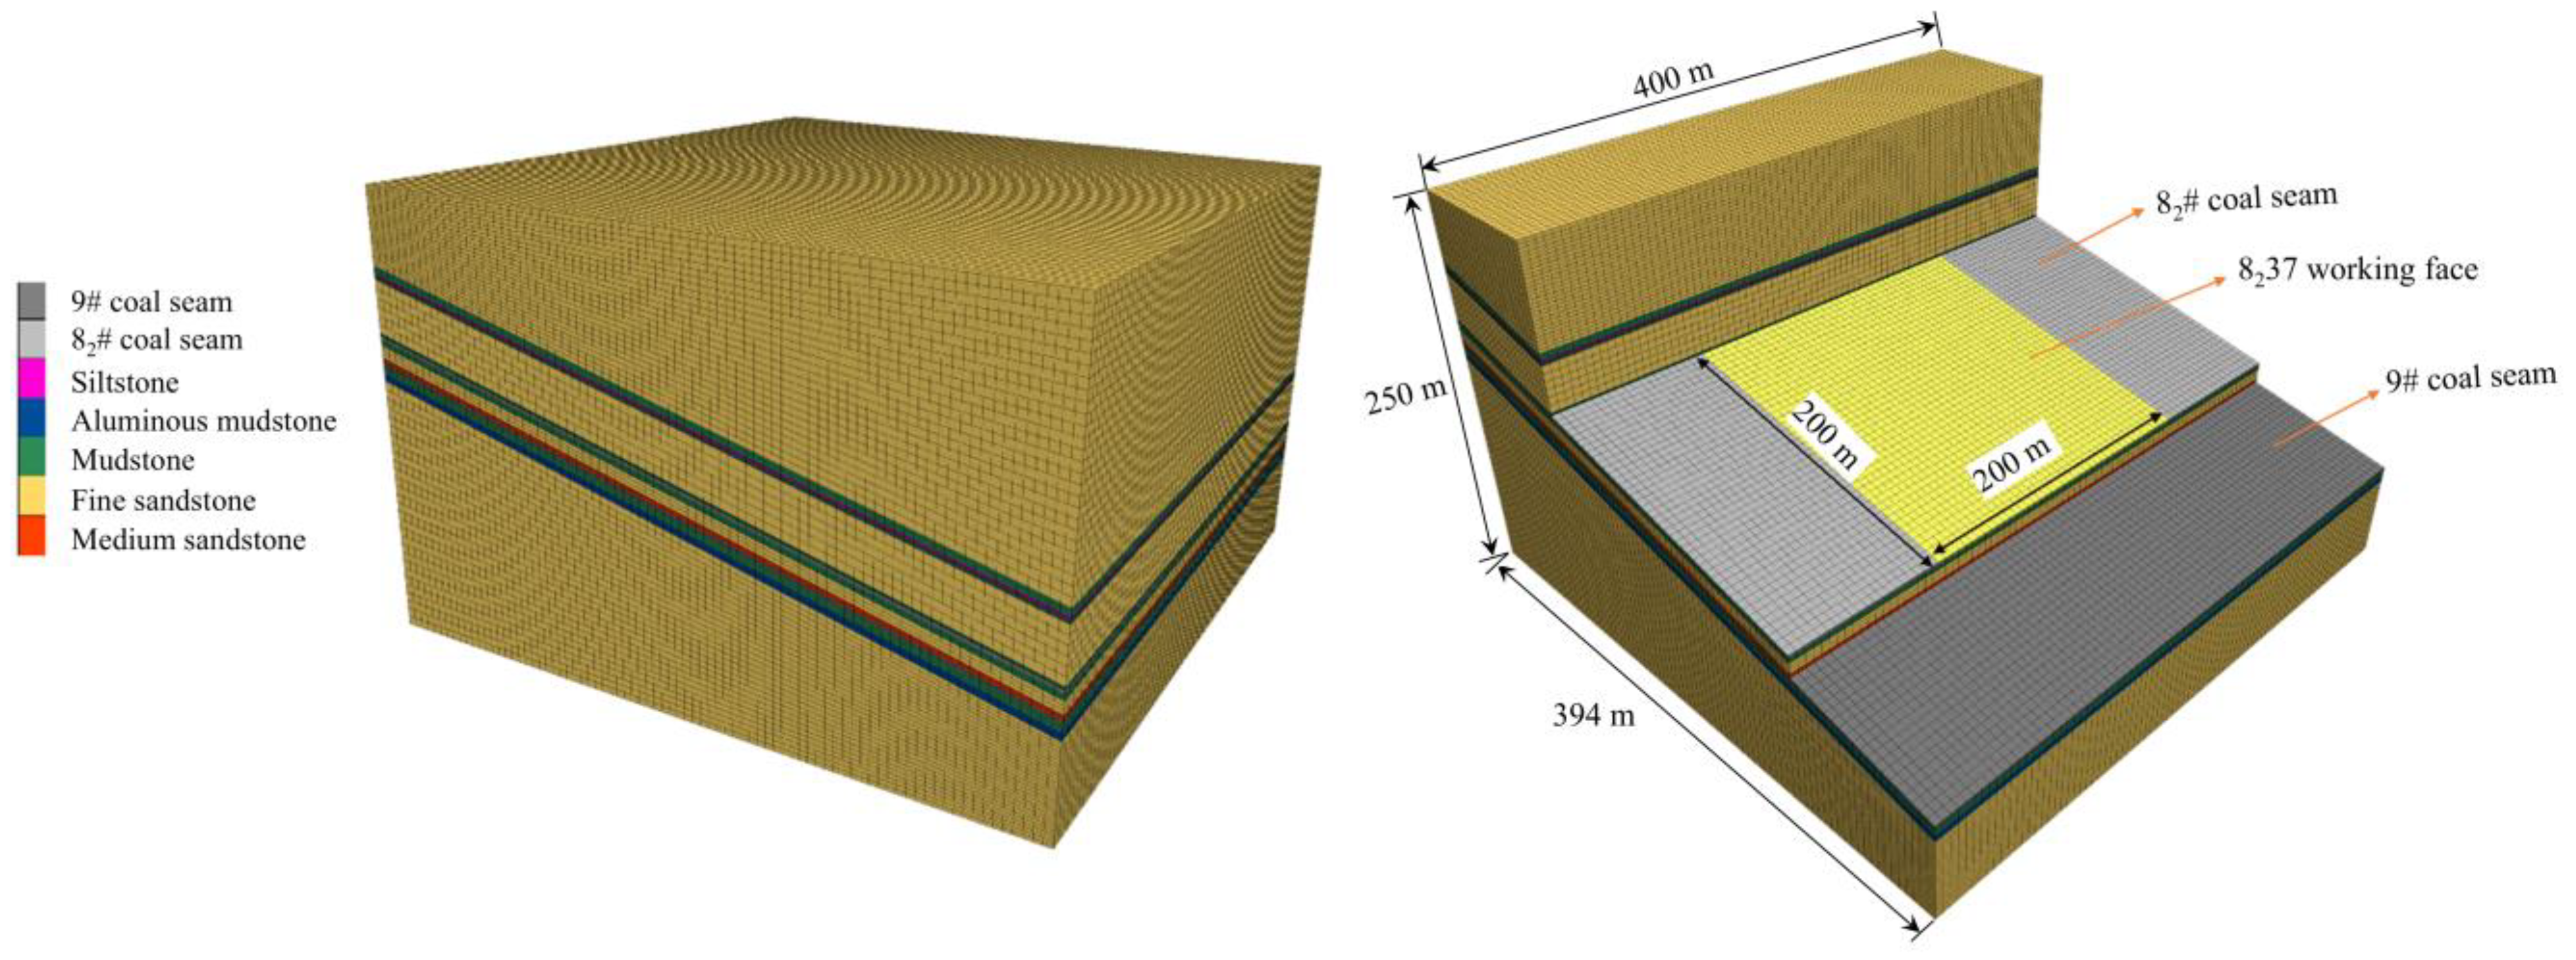
3.2. Numerical Model

After the mining of the upper protective layer, movement, deformation, fissure development, and failure occurred in the roof and floor rock strata, resulting in a redistribution of rock stress and a wide impact range. However, the affected area is limited based on the Saint Venant principle. Generally, the movement of the roof rock strata is much greater than that of the floor. The underlying mass is taken as the simulation object; therefore, the main scope of the model is the floor rock strata of the protective layer. The model with a strike length of 400 m, an inclined length of 394 m, and a height of 250 m. To avoid the influence of the boundary effect, 100 m protective coal pillars are reserved on both sides along the strike direction. The strike mining model is adopted, and the strike mining length of the working face is 200 m. The three-dimensional numerical model established by the FLAC3D software is presented in Figure 4.
The zero-displacement boundary condition is applied to the left and right boundaries, as well as the bottom boundary of the model. The boundary conditions for the computational model are determined as follows: take u = 0, v ≠ 0 (u is the x-direction displacement, v is the y-direction displacement) at the left and right boundaries, i.e., the single constraint boundary; take u = v = 0 at the lower boundary, which is the fully constraint boundary. The unconstrained upper boundary is a free boundary. The rock strata above the upper boundary are applied as external loads on the upper boundary of the model. The actual burial depth of the 82# coal seam is 586.5 m, and the distance between the 82# coal seam and the top of the model is 126 m. Therefore, the load of 460.5 m is considered for the model top compensation.
The uniformly distributed load that should be applied to the upper boundary can be calculated according to the formula, as presented in the following Equation (11):
q = γ h
where q is the uniformly distributed load applied to the upper boundary, MPa; h is the vertical depth at the top of the model; γ is the average density of the overlying rock strata, taken as 2.5 × 10³ kg/m3. The uniformly distributed load that should be applied to the upper boundary is 11.5 MPa by calculation.
The grid discretization is as finely divided as possible in principle, but the grid cannot be finely divided due to the large calculation range of the model and the limitation of computer capacity [52,53]. The grid is divided based on the simulation period and the accuracy of the simulation results. Considering the dip angle of the rock strata in the model and the involvement of multiple layers, the uniform grid division of the protective and protected layers is performed to conserve computer resources according to the experimental requirements. The model includes a total of 615,600 unit cells and 637,632 nodes.
The relevant mechanical parameters of mass are required for numerical simulation, such as density, tensile strength, etc., as listed in Table 2.

4. Experiment Results

4.1. Movement Characteristic

Figure 5 illustrates the movement characteristics of the rock strata in the working face under different advanced lengths. When the working face advances to 50 m, the lower immediate roof begins to collapse, and the upper immediate roof exhibits delamination. Due to the limited advance distance and mining height, the height of the immediate roof collapse is about 2 m, and the collapse range is 45 m along the strike length. Upon advancing to 60 m, the initial pressure basically occurs, the immediate roof collapses to full height, and the thickness is 8 m, forming a masonry beam equilibrium structure. Delamination occurs in the rock strata above the basic roof, and the range of mining influence expands. When advancing to 100 m, the working face experiences the first periodic pressure, the basic roof fractures, and the rock mass forms a double key masonry beam equilibrium structure. The strata above the basic roof undergo significant subsidence, the gravity is primarily exerted on the equilibrium structure of the basic roof, and a large aperture delamination fracture forms between the rack strata and the upper sub-key stratum. Upon advancing to 120 m, the basic roof fractures again, and the mining field enters the second periodic pressure. Both the basic roof and the sub-key stratum form a masonry beam equilibrium structure. The basic roof only bears the weight of the rock strata from the sub-key stratum, and the upper strata is supported by the equilibrium structure formed by the sub-key stratum.

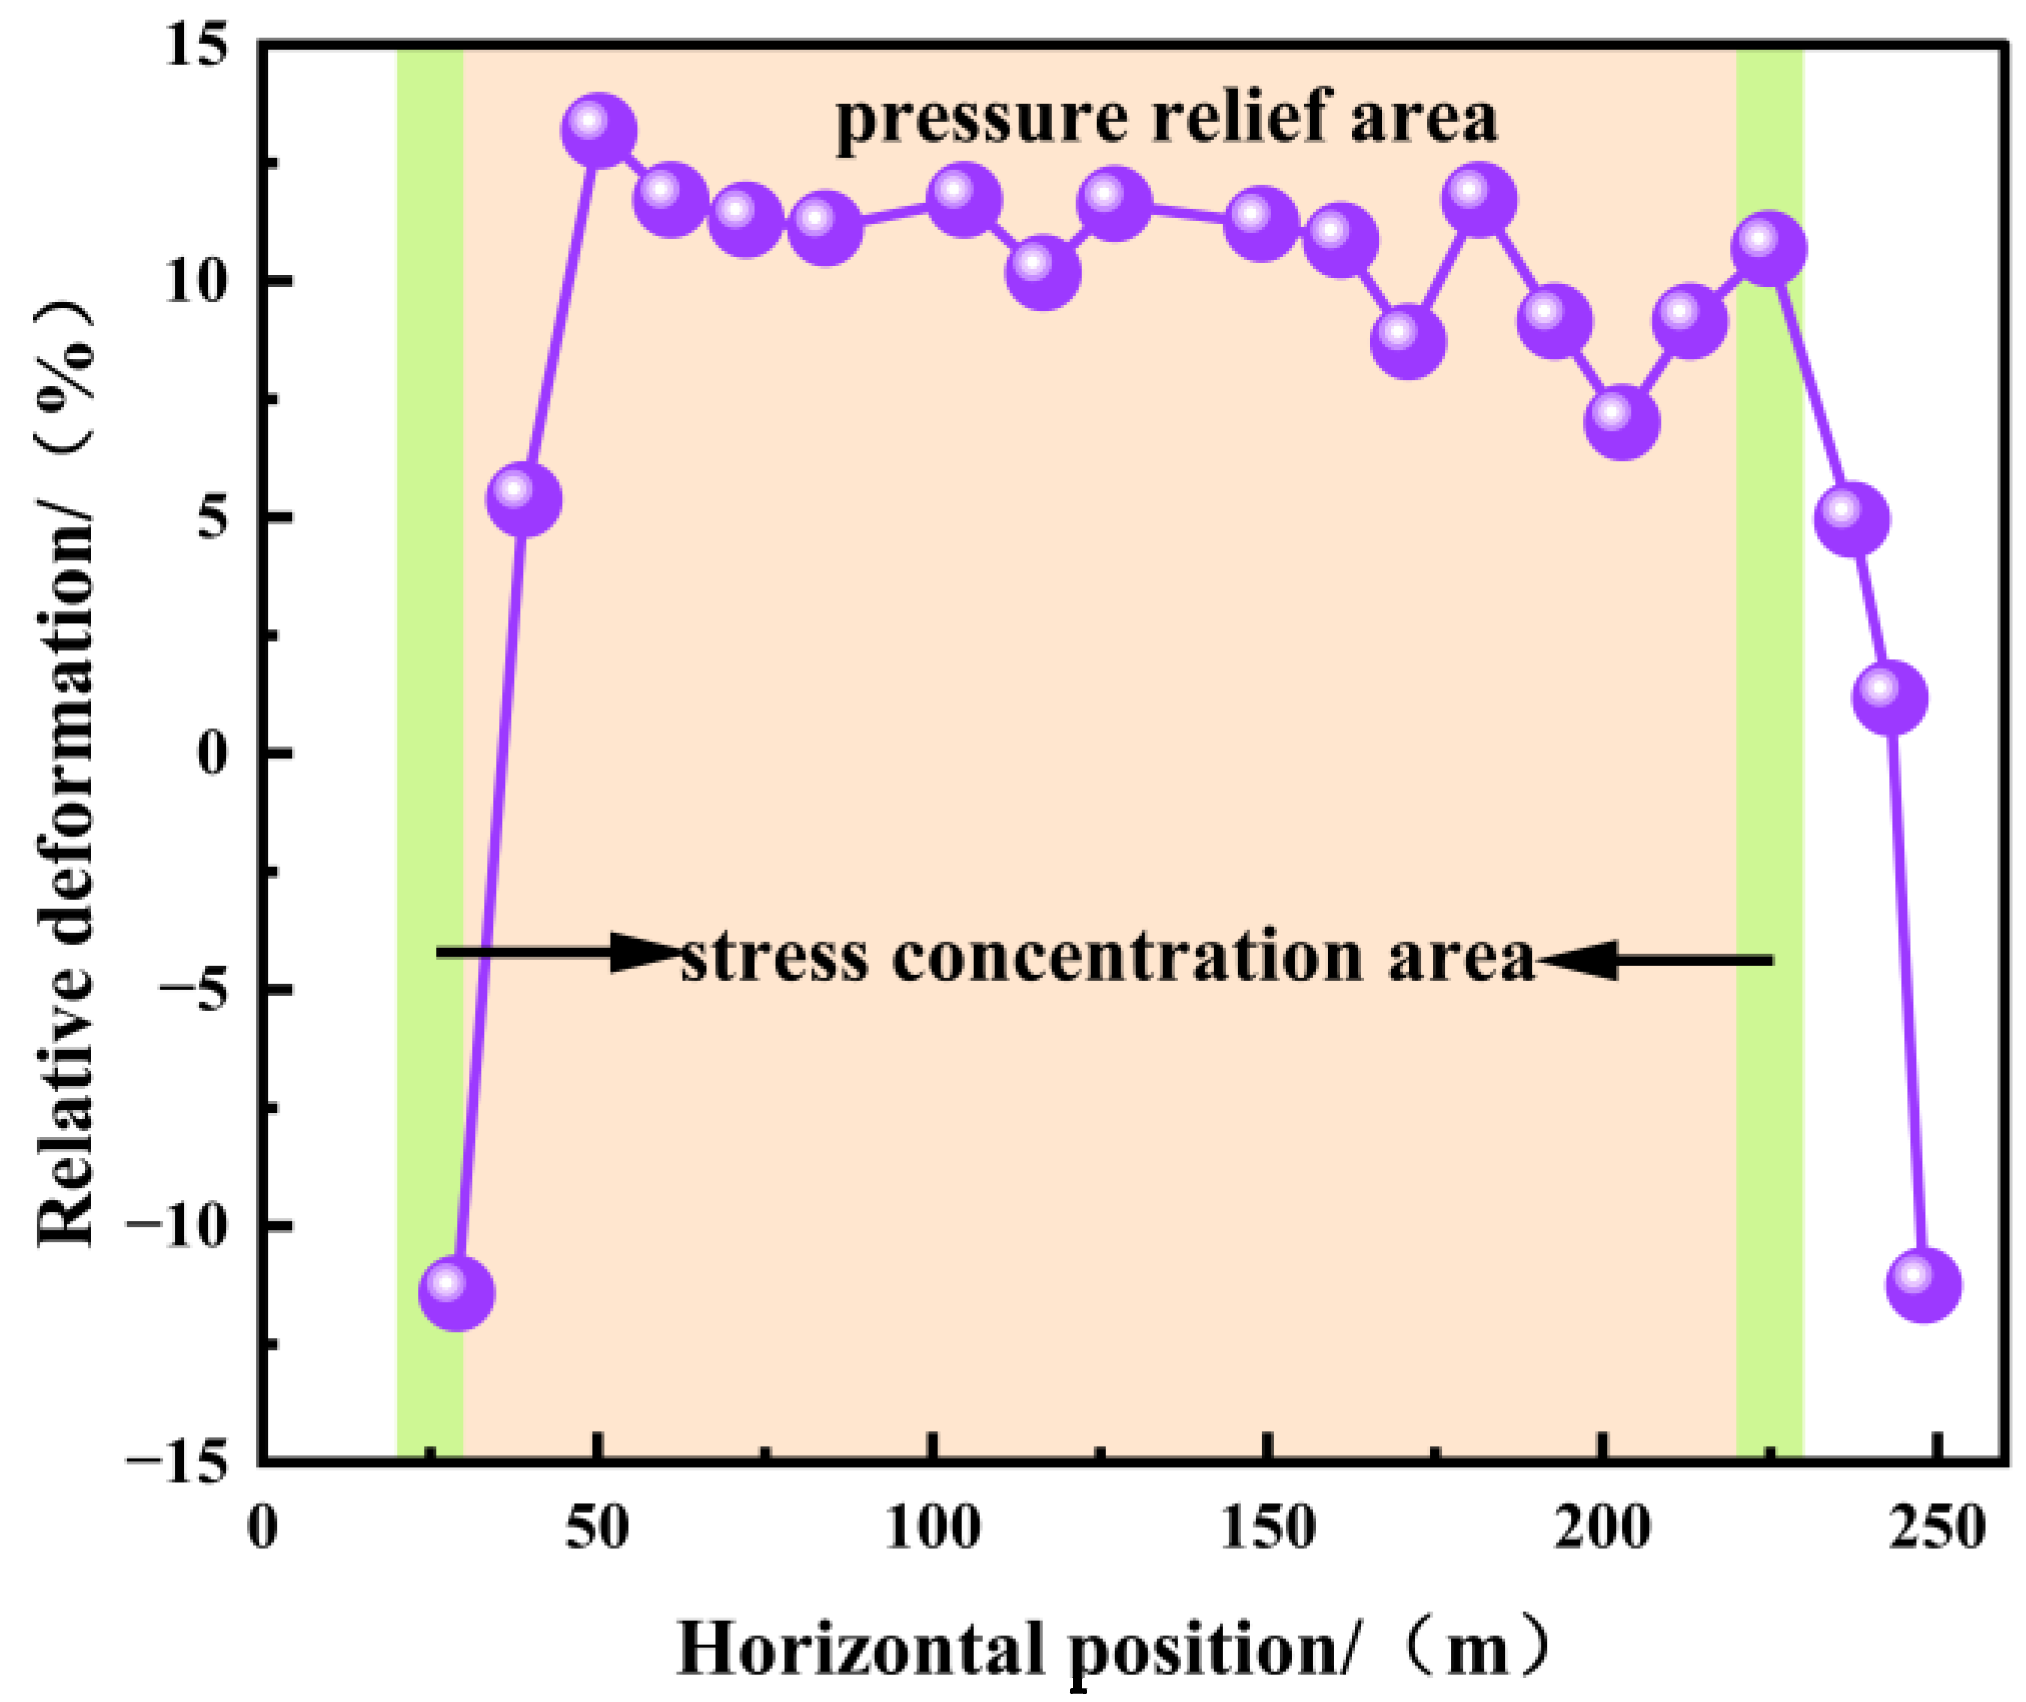
4.2. Deformation Characteristics of Protected Layer

During the mining of the 82# coal seam, the displacement data of the marked points at the horizontal positions of the roof and floor of the 9# coal seam are monitored. The data are plotted as shown in Figure 6a.
Figure 6b presents the vertical displacement of the roof and floor of the 9# coal seam when the working face advances 200 m. It can be observed that within the ranges of 0 m–25 m and 225 m–250 m, the subsidence of the roof of the 9# coal seam is greater than that of the floor, suggesting that the protected layer in the unmined area is in a compression state and also experiences subsidence, with a maximum subsidence of 0.023 m. Within the range of 25 m–225 m, the displacement of the roof of the 9# coal seam is greater than that of the floor, indicating that the protected layer beneath the working face exhibits expansion, with a maximum of 0.023 m.
Figure 7 illustrates the relative deformation of the 9# coal seam. The absolute deformation of the 9# coal seam can be obtained by subtracting the floor deformation from the roof deformation, and the relative deformation is calculated by dividing the absolute deformation by the thickness of the 9# coal seam. In the pressure relief zone, the maximum absolute expansion deformation is 23 mm, and the maximum relative expansion is 11.3‰. In the stress concentration zone, the maximum absolute compression deformation is 23 mm, and the maximum relative compression is 11.6‰.

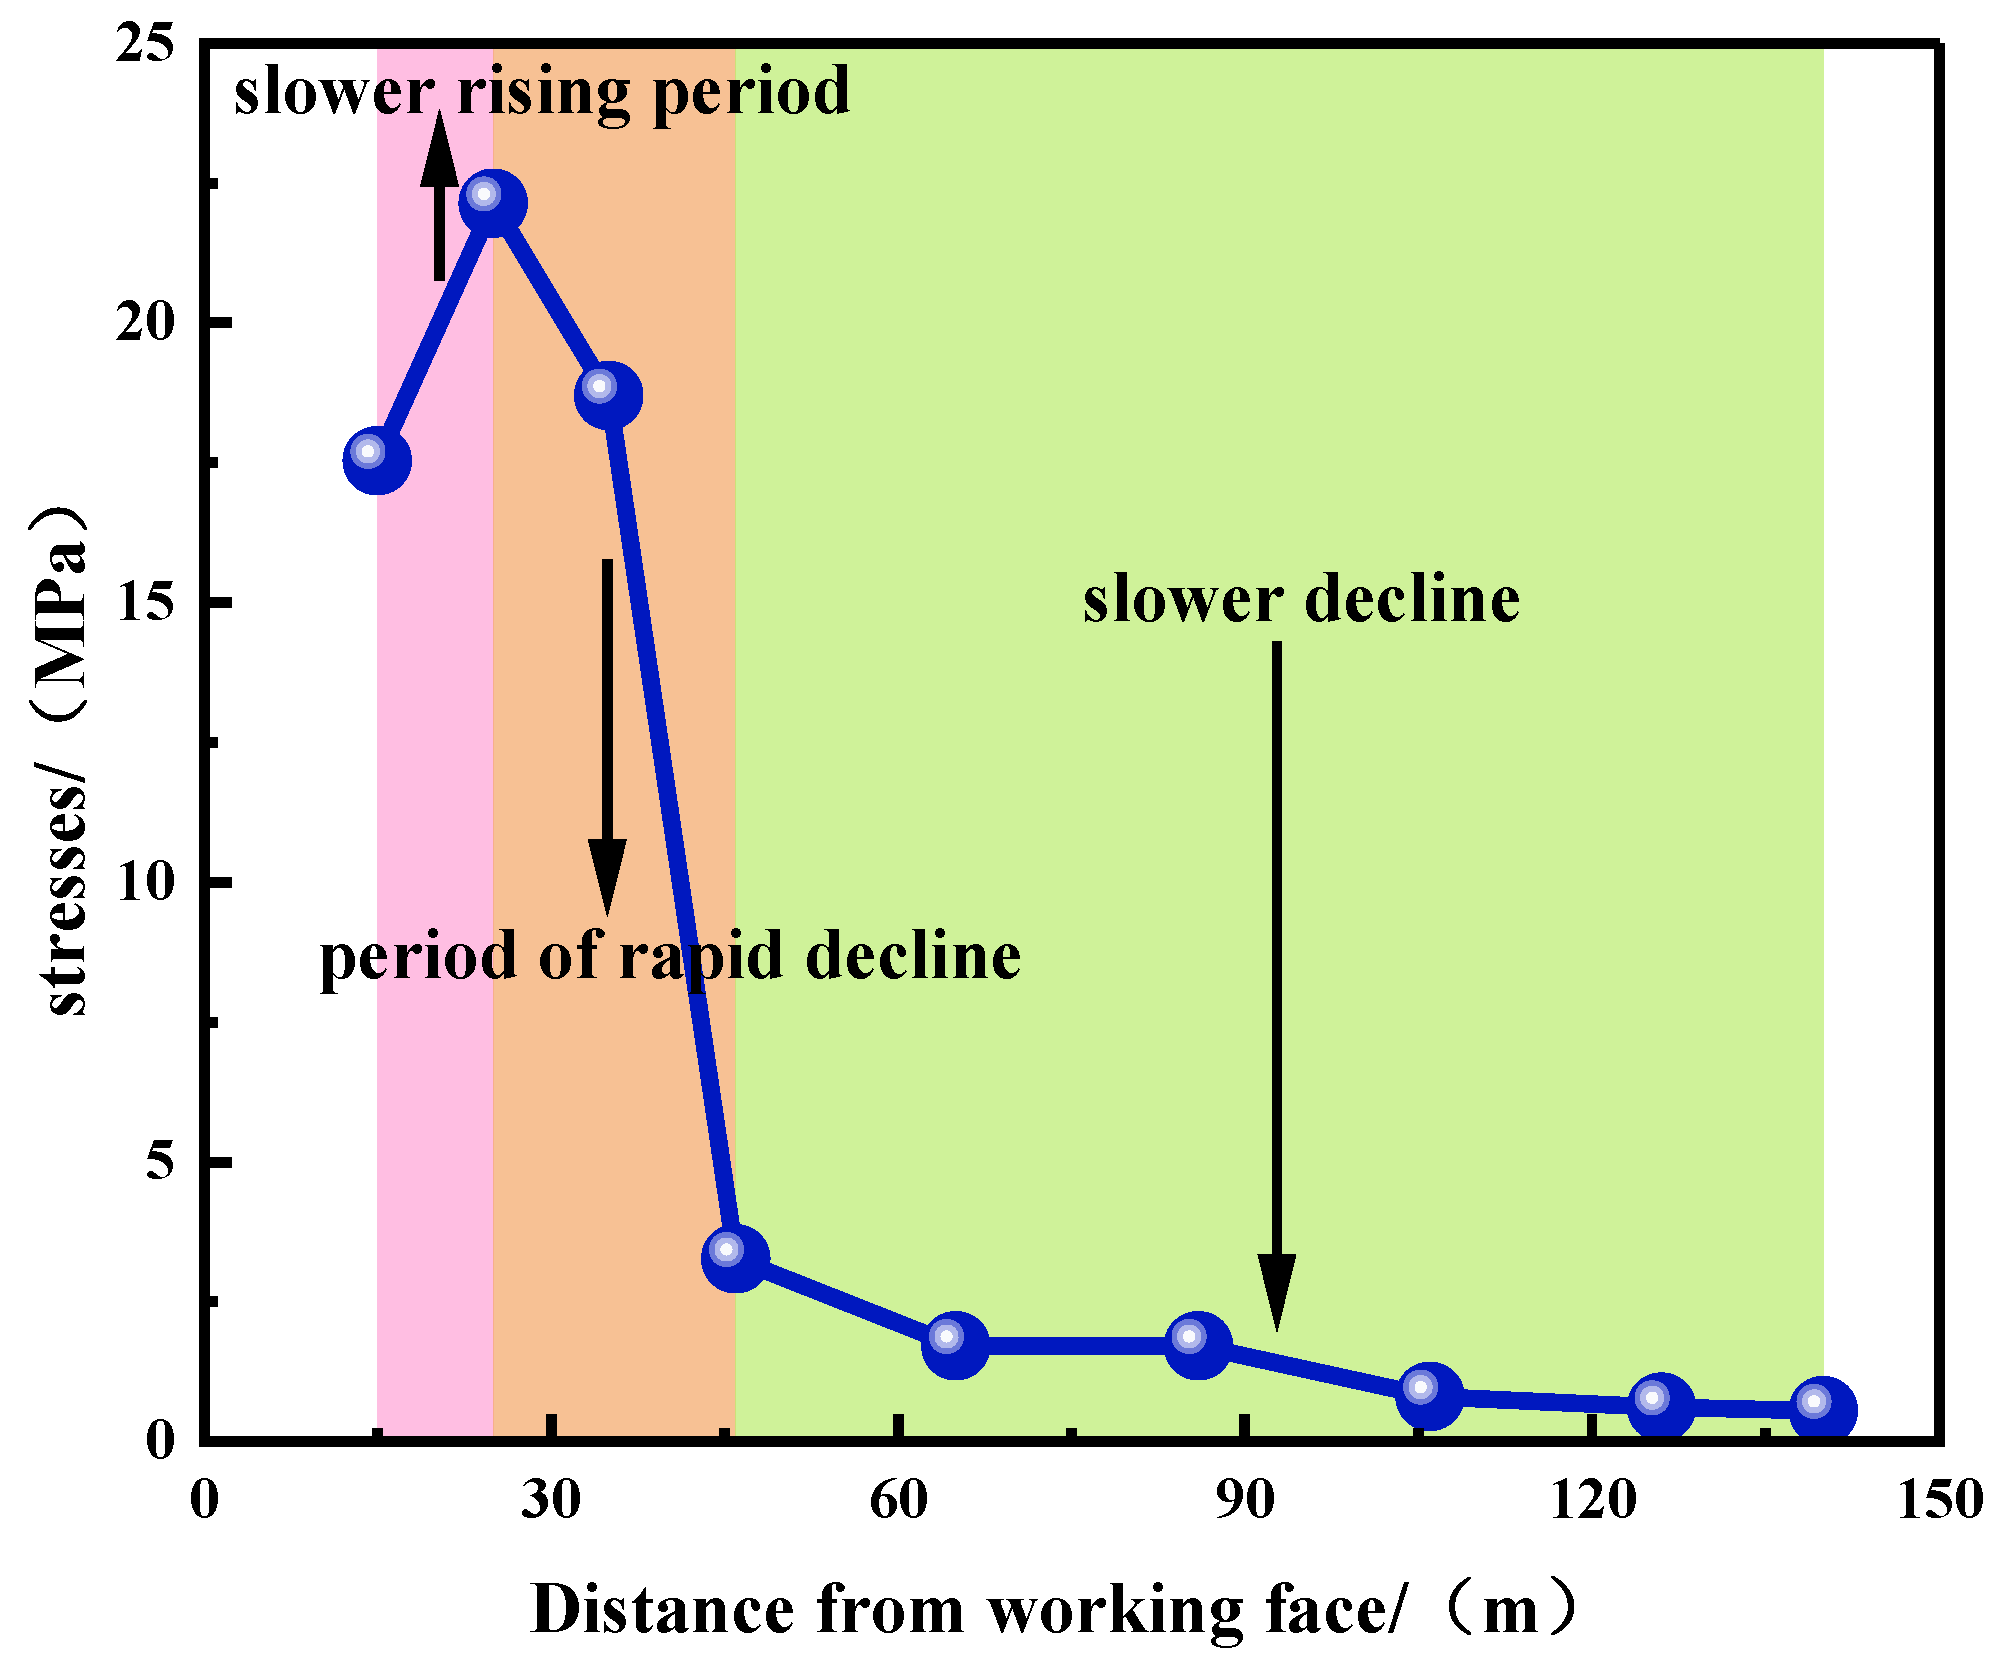
4.3. Stress Characteristics of Protected Layer

Figure 8 displays the variation of vertical stress data along the stress measurement line in the middle of the 9# coal seam. Figure 8 suggests that the vertical stress in the area rises in the 0 m–25 m stage, indicating that stress concentration occurs in the excavation process, reaching a maximum value of 22 MPa at 25 m. However, the stress is in a decreasing state at 25 m–125 m, reaching a minimum of 0.7 MPa at 125 m, implying that stress relief occurs in the 9# coal seam as the working face advances. Based on the similar simulation experiments, the stress during the protected layer mining process is monitored, the stress concentration zone is within 32 m ahead of the working face, and the original stress zone is beyond 32 m in front of the working face. The stress relief zone is within 51 m behind the working face, and the stress recovery zone is beyond 51 m behind the working face.

5. Numerical Simulation Results

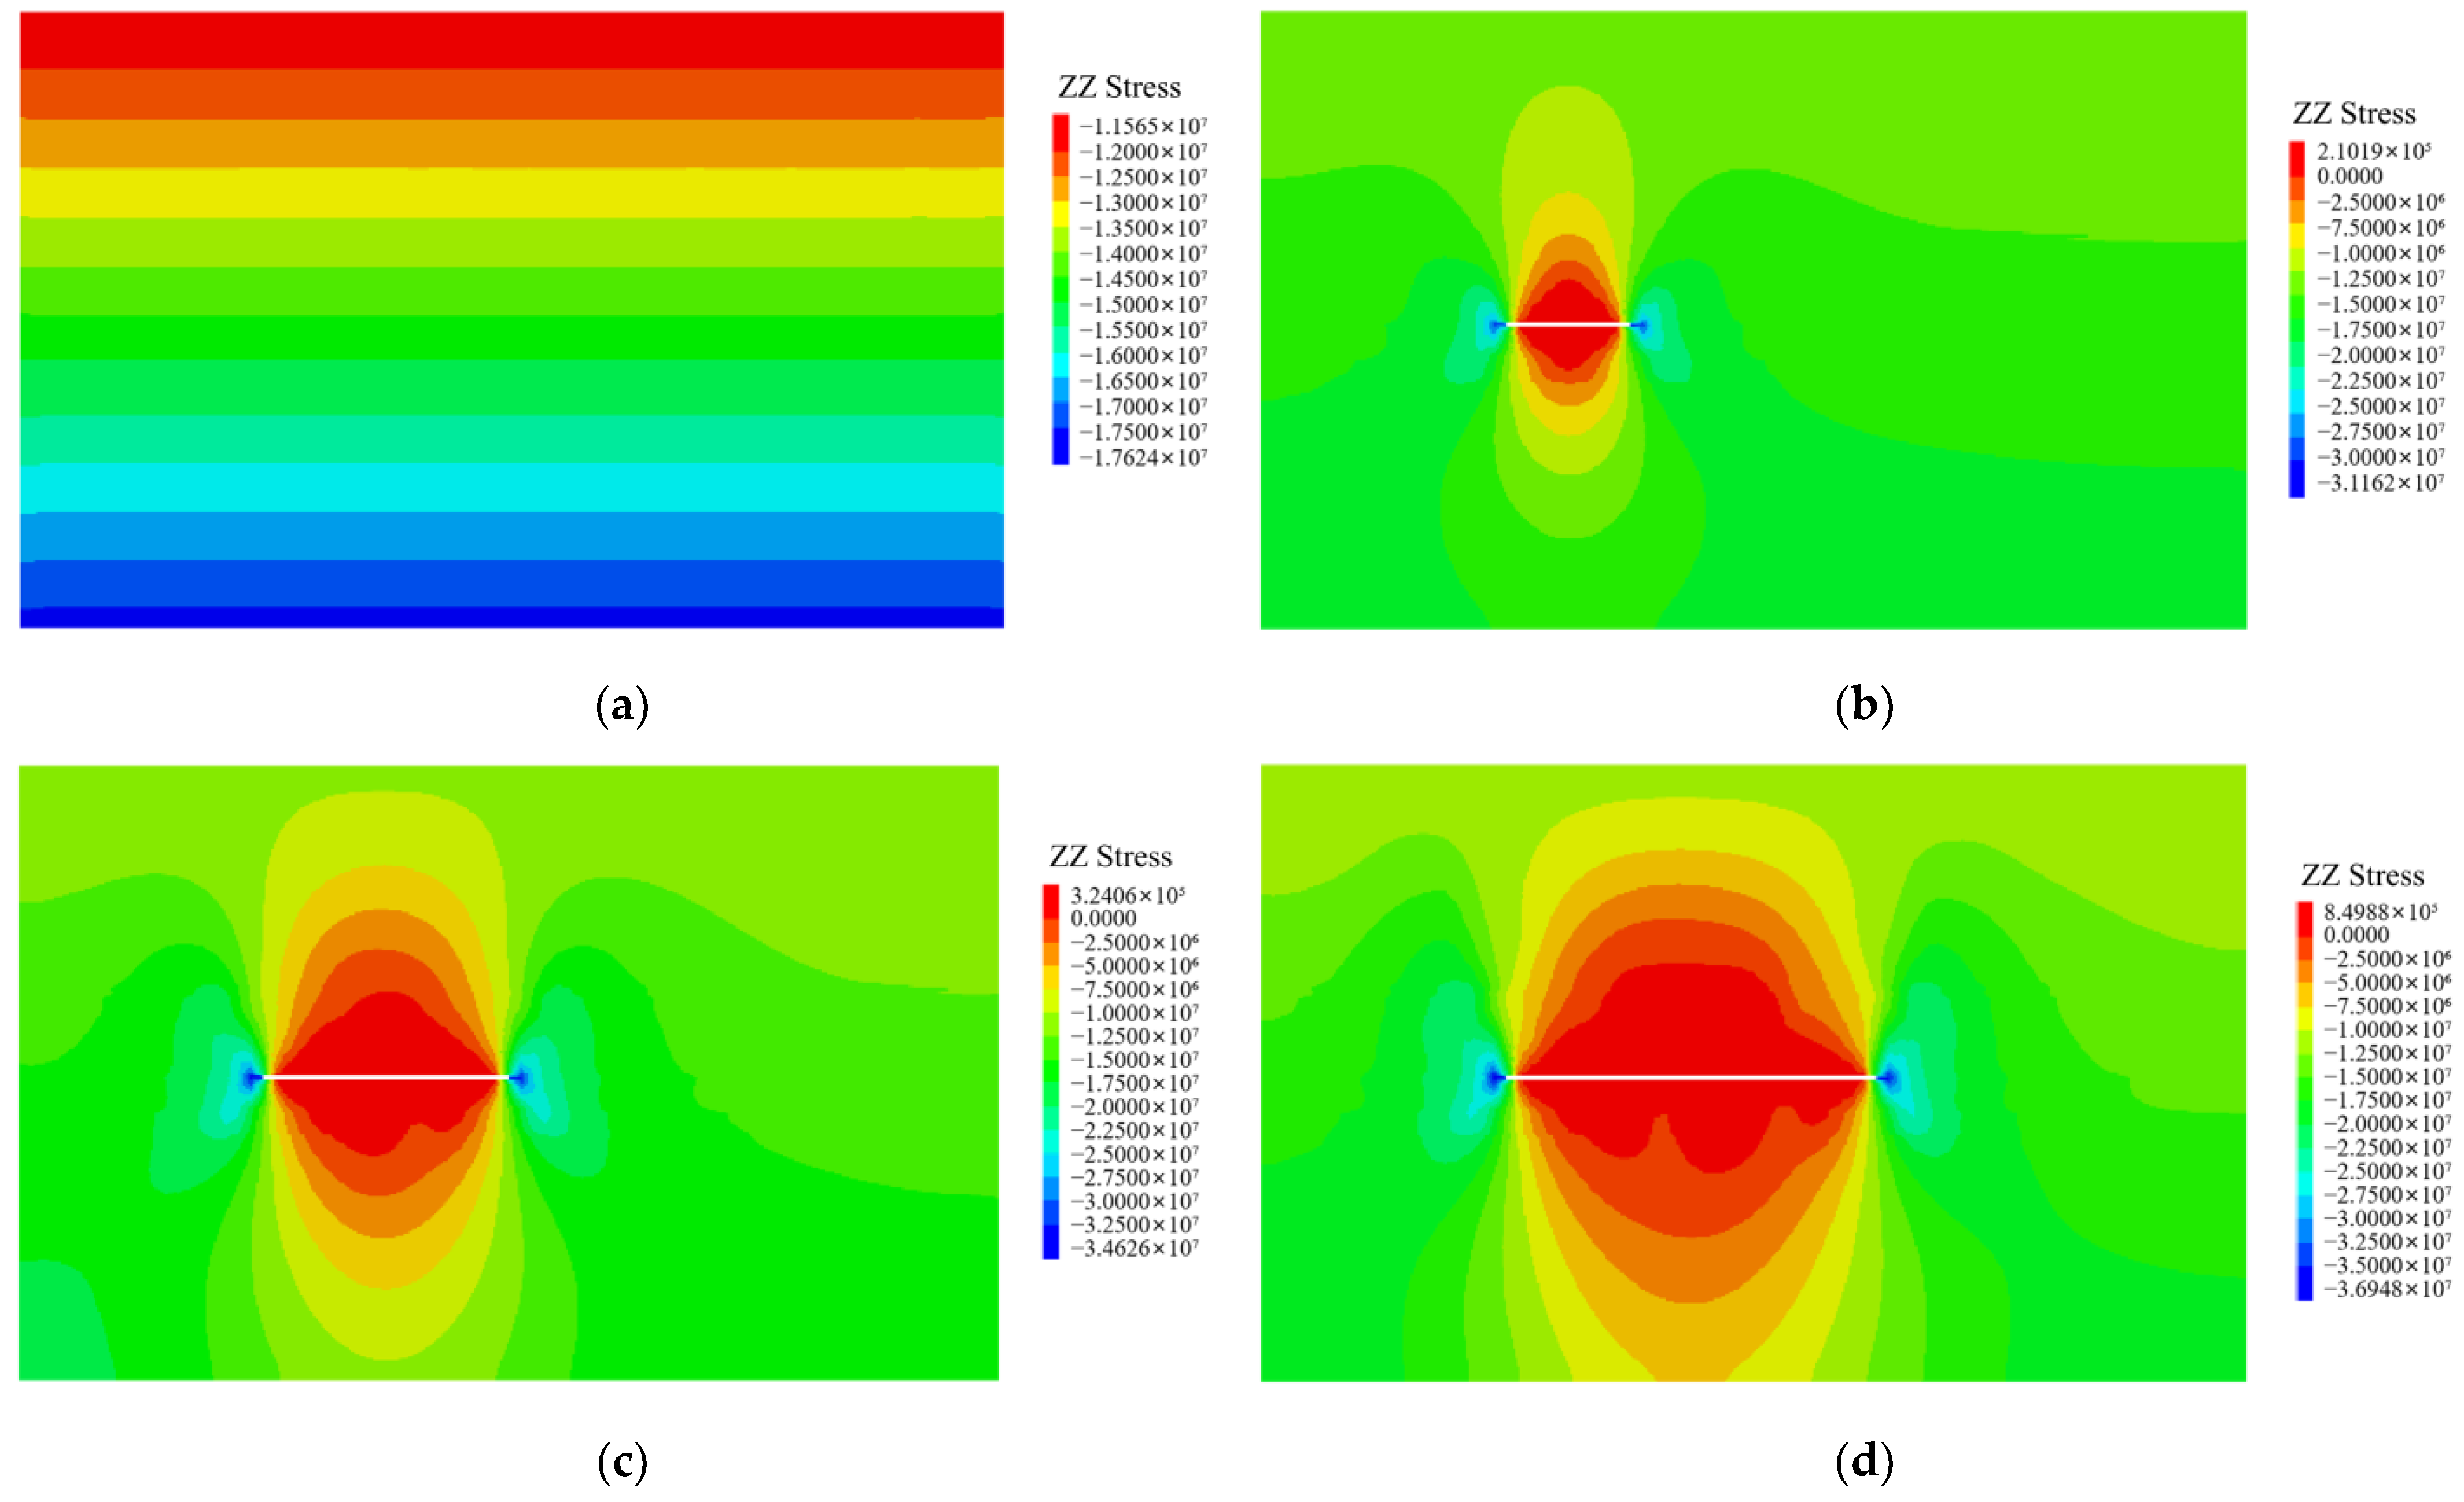
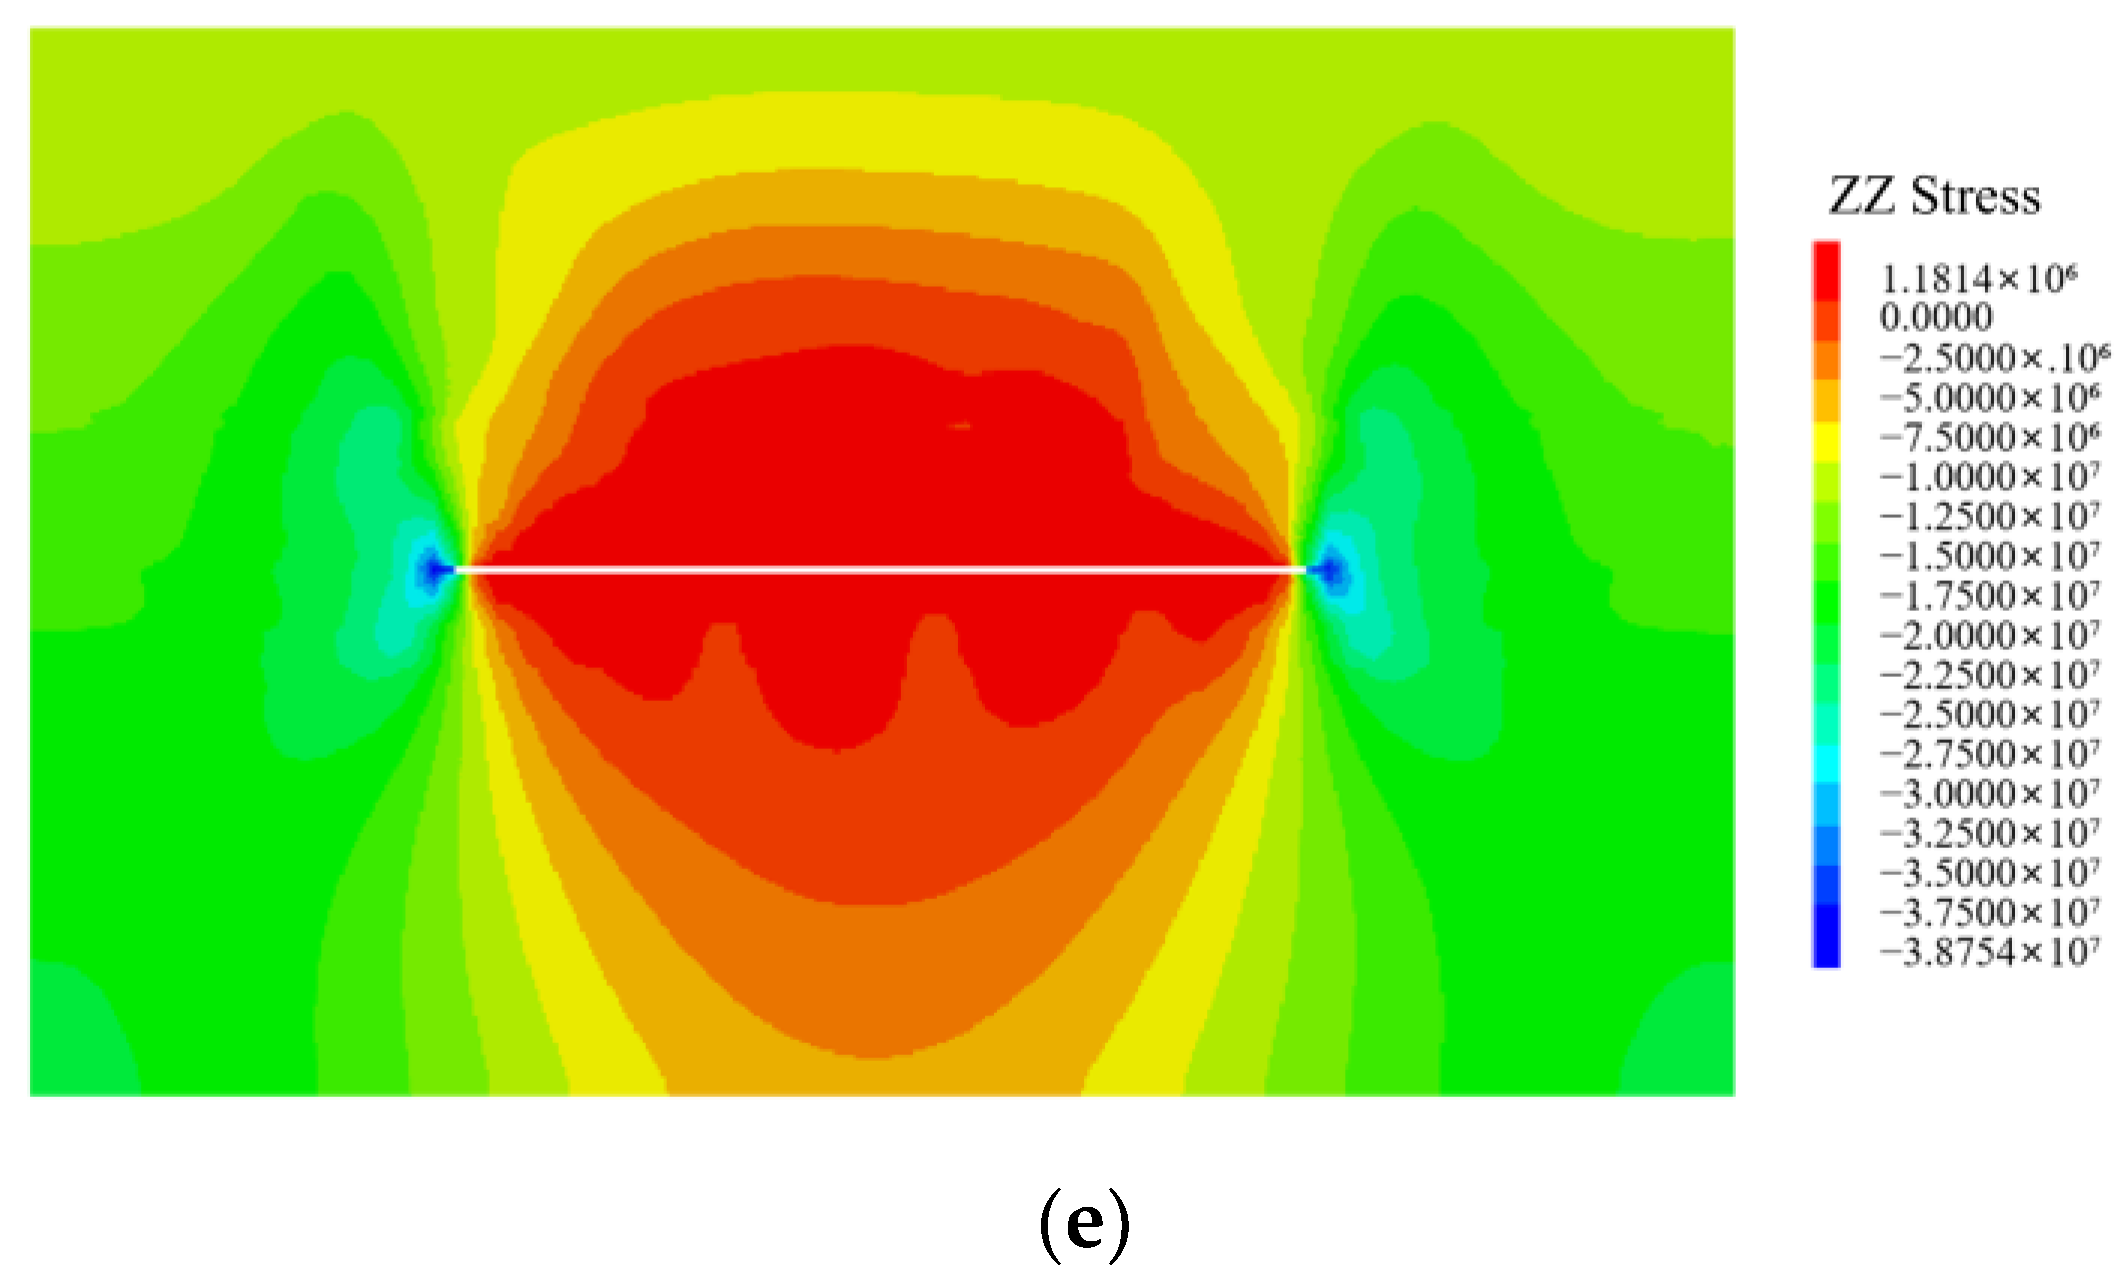
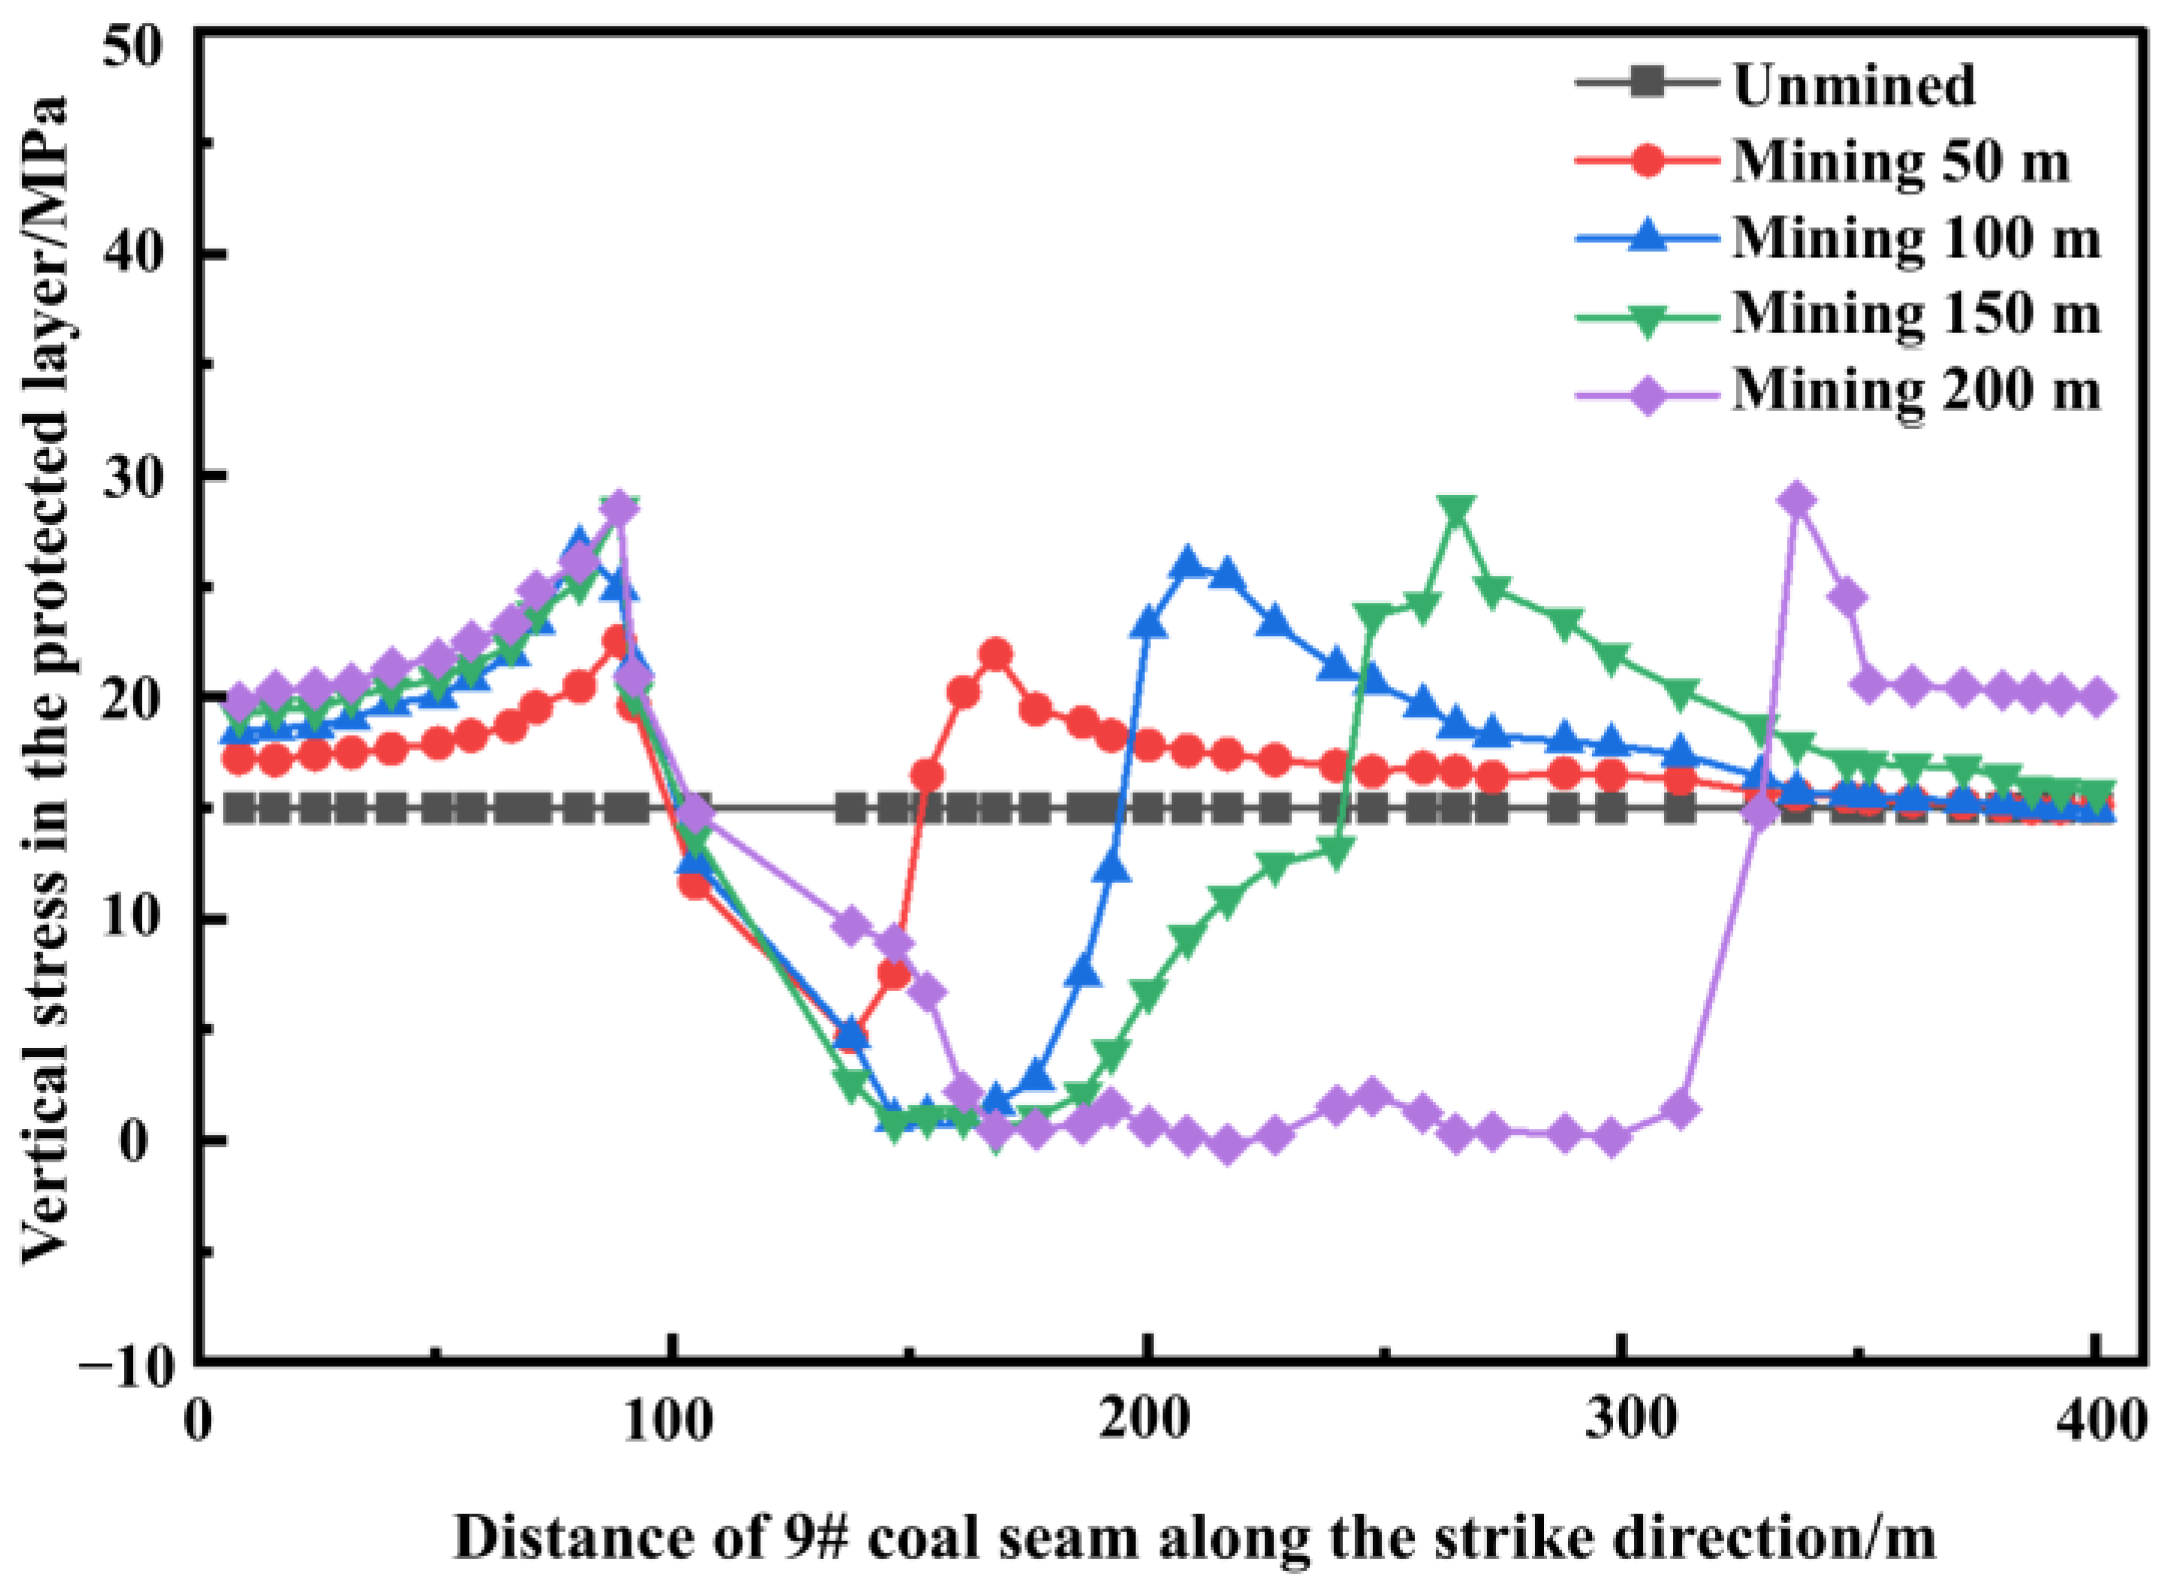
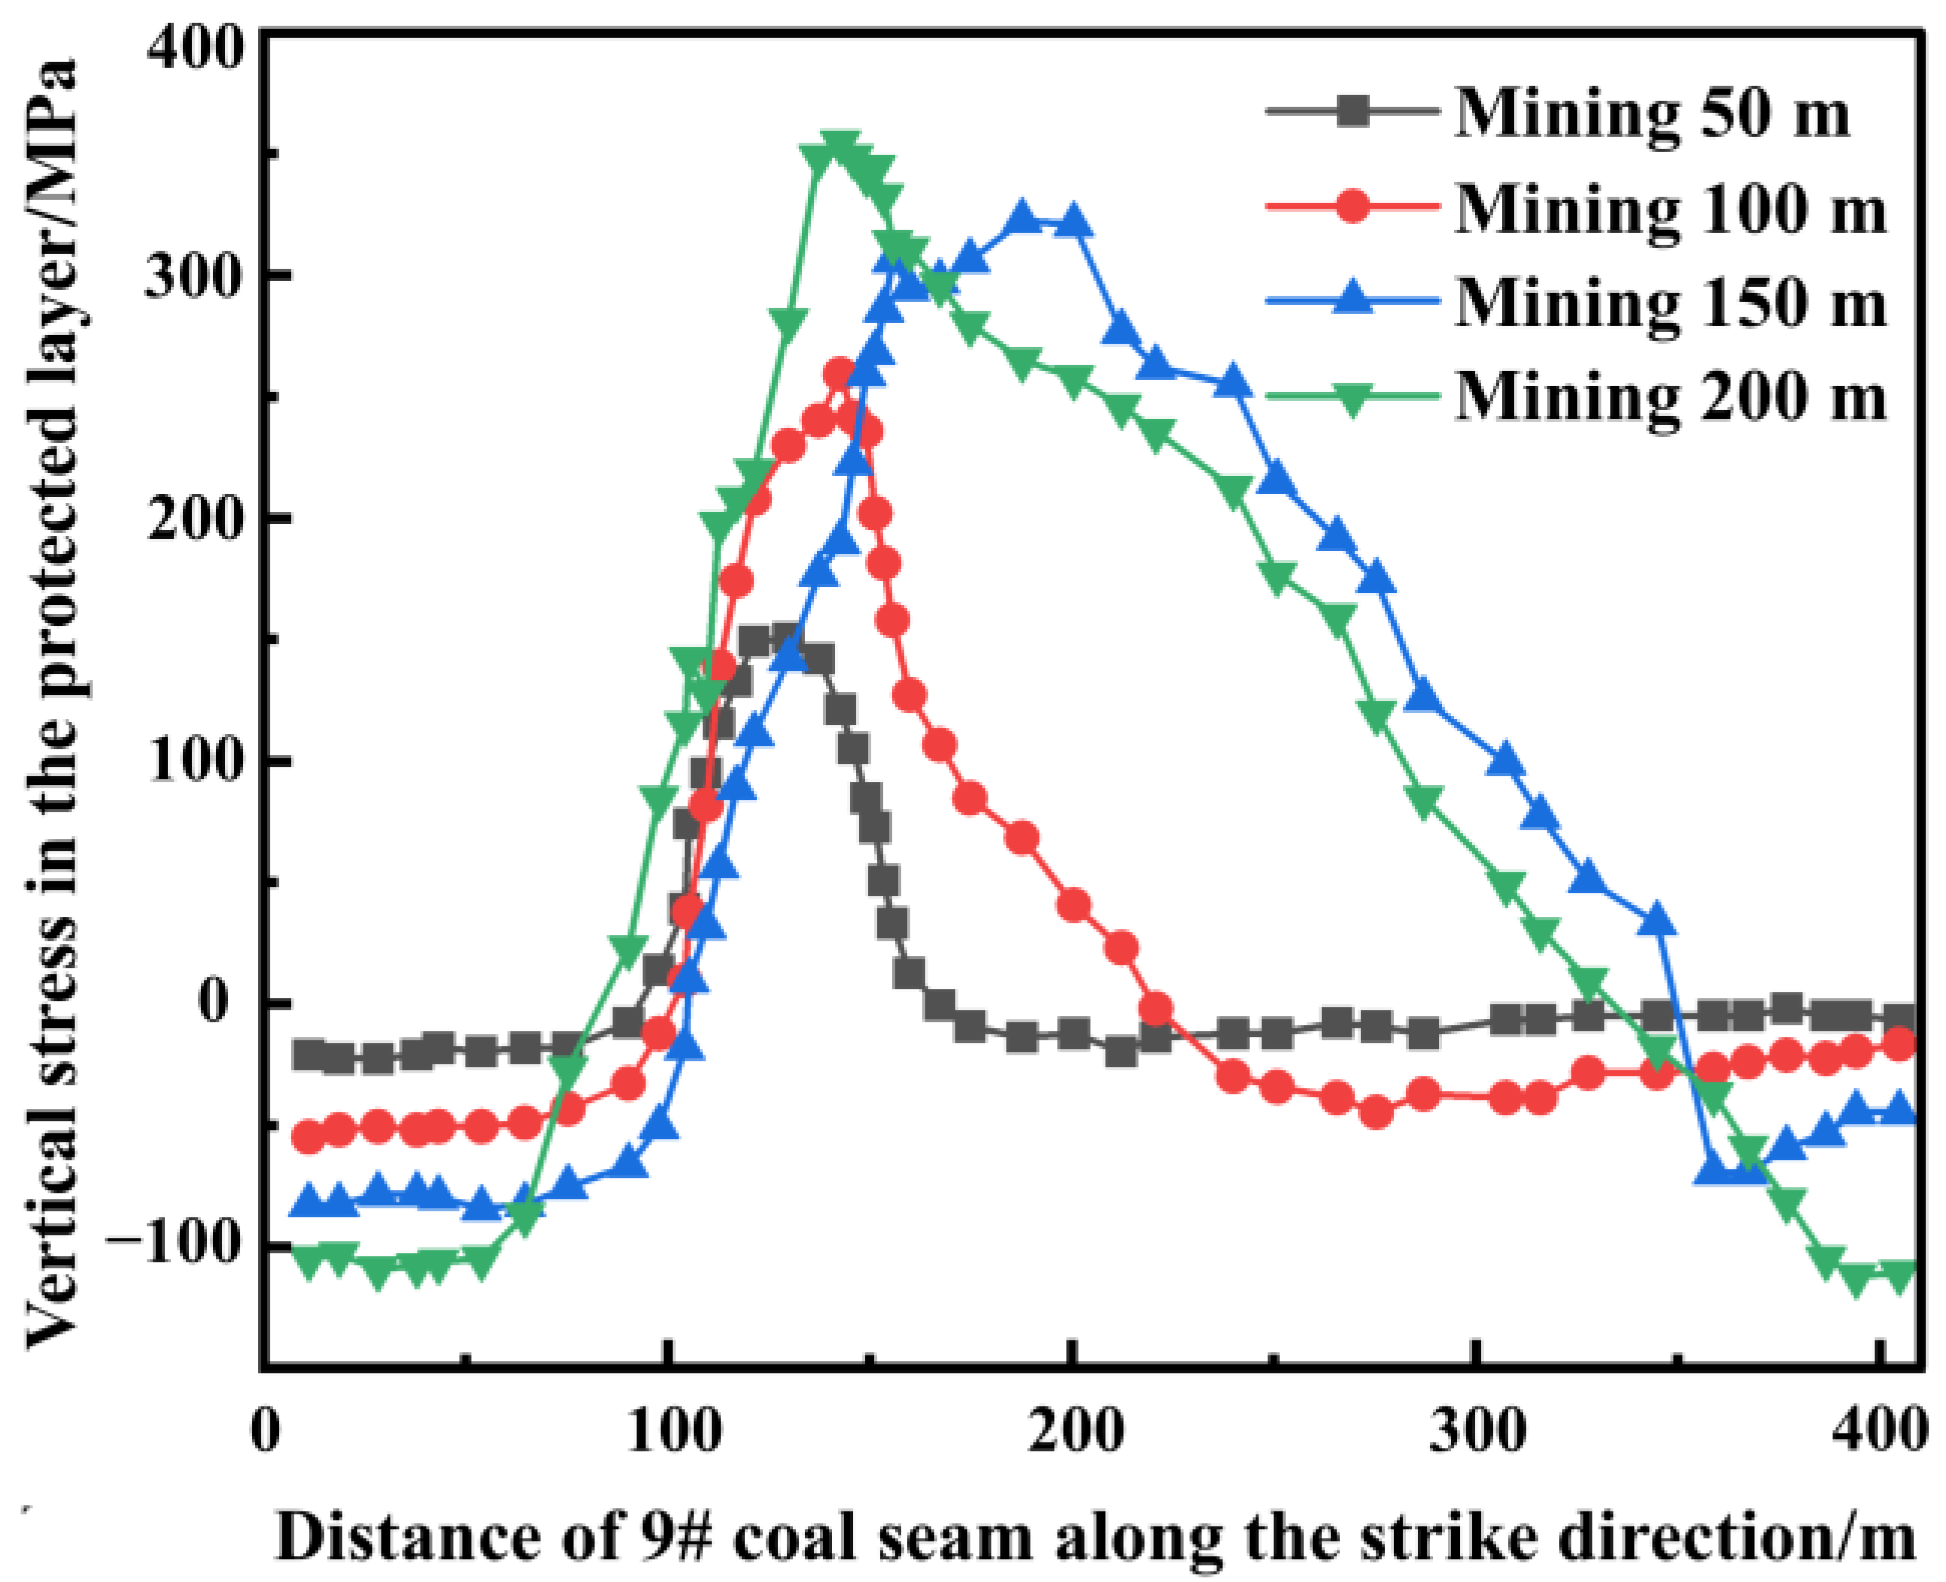
5.1. Analysis of Stress Characteristics During the Protective Layer Mining

After the mining of the working face in the protective layer, the original stress balance is broken, and the stress is transferred to the deep part of the strata, forming a new stress balance state. The vertical stress distribution of the underlying mass is analyzed through FLAC3D during the advancement of the working face in the protective layer. Figure 9 presents the vertical stress distribution as the 8237 working face advances to 50 m, 100 m, 150 m, and 200 m. The positive value in the figure represents the tensile stress, while the negative value is the compressive stress.
Figure 9a shows the original vertical stress distribution. According to the prototype geological conditions, a uniformly distributed load of 11.5 MPa is applied at the top of the model. The vertical stress on each stratum is the sum of the externally applied load and the weight of the upper stratum, gradually increasing from top to bottom. From Figure 9b to Figure 9e, as the working face advances, a stress reduction zone occurs in the roof and floor strata of the protective layer, and a stress concentration zone appears at the open-off cut and the working face, which is basically symmetrically distributed.
Figure 10 illustrates the variation of vertical stress on the horizontal observation line in the middle of the 9# coal seam of the protected layer with the mining length of the working face in the protective layer. The original vertical stress of the 9# coal seam is 15 MPa. After the 8237 working face advances 50 m, the coal walls at the open-off cut and the working face are affected by the supporting stress. The stress increases to 21.1 MPa, with an increment of 6.1 MPa and a stress concentration coefficient of 1.4. Consequently, the vertical stress of the upper and lower rock strata in the goaf is effectively released, with a pressure relief depth of 17 m. The 9# coal seam is within the pressure relief range, and the pressure relief exhibits a “V” shape and symmetrical distribution. The stress at the center is the lowest, at 1.27 MPa, which is 13.73 MPa lower than the original rock stress. The reduction rate of vertical stress reaches the maximum of 91.3%, with an average pressure relief rate of 57.7%.
When the 8237 working face advances to 100 m, the vertical stress of the 9# coal seam in the lower part of the goaf decreases to 0.27 MPa, with a maximum decrease rate of 98.2% and an average pressure relief rate of 78.3%. At this time, the pressure relief range in the vertical direction (upper and lower parts of the mining area) remarkably expands compared to the mining distance of 50 m. The stress concentration of the coal wall in front of the mining working face and the coal wall behind the open-off cut increases to 24.79 MPa, with a stress concentration coefficient of 1.65. When advancing to 150 m, the pressure relief range of the roof and floor of the goaf further expands, and the vertical stress of the 9# coal seam in the lower part of the goaf decreases to 0.2 MPa, with a maximum reduction rate of 98.6% and an average pressure relief rate of 82%. Consequently, the stress concentration of the coal wall in front of the mining working face and the coal wall behind the open-off cut continues increasing, reaching up to 26.6 MPa, with a stress concentration coefficient of 1.77.
When advancing to 200 m, the vertical stress of the 9# coal seam in the lower part of the goaf diminishes to 0.05 MPa, with a decrease rate of 99.6% and an average pressure relief rate of 86.2%. Although the expansion of the pressure relief area on the roof and floor of the goaf is not as significant as the case when advancing 150 m, the concentrated stress on the coal wall in front of the mining working face and the coal wall behind the open-off cut rises to 28.3 MPa, with a stress concentration coefficient of 1.88.
In summary, the mining impact of 8237 working face of the upper protective layer in Qidong Coal Mine on the surrounding rock is closely related to the mining distance. After the mining of the upper protective layer, the vertical stress of the mass in the upper and lower parts of the goaf decreases, performing a pressure relief effect. As the working face advances, the degree of pressure relief in the protected layer increases and the pressure relief range gradually expands, but it ultimately tends to stabilize. Additionally, the stress concentration occurs in the coal wall in front of the mining face and behind the open-off cut. As the protective layer is mined, the stress concentration coefficient gradually rises, but tends to stabilize in the later stage. The results indicate that the stress is gradually recovered due to the compaction effect of the fallen gangue in the goaf. An increase in the vertical stress of the upper and lower coal mass is attributed to the stress transition, as well as the coal pillars on both sides, but the increment is relatively small.

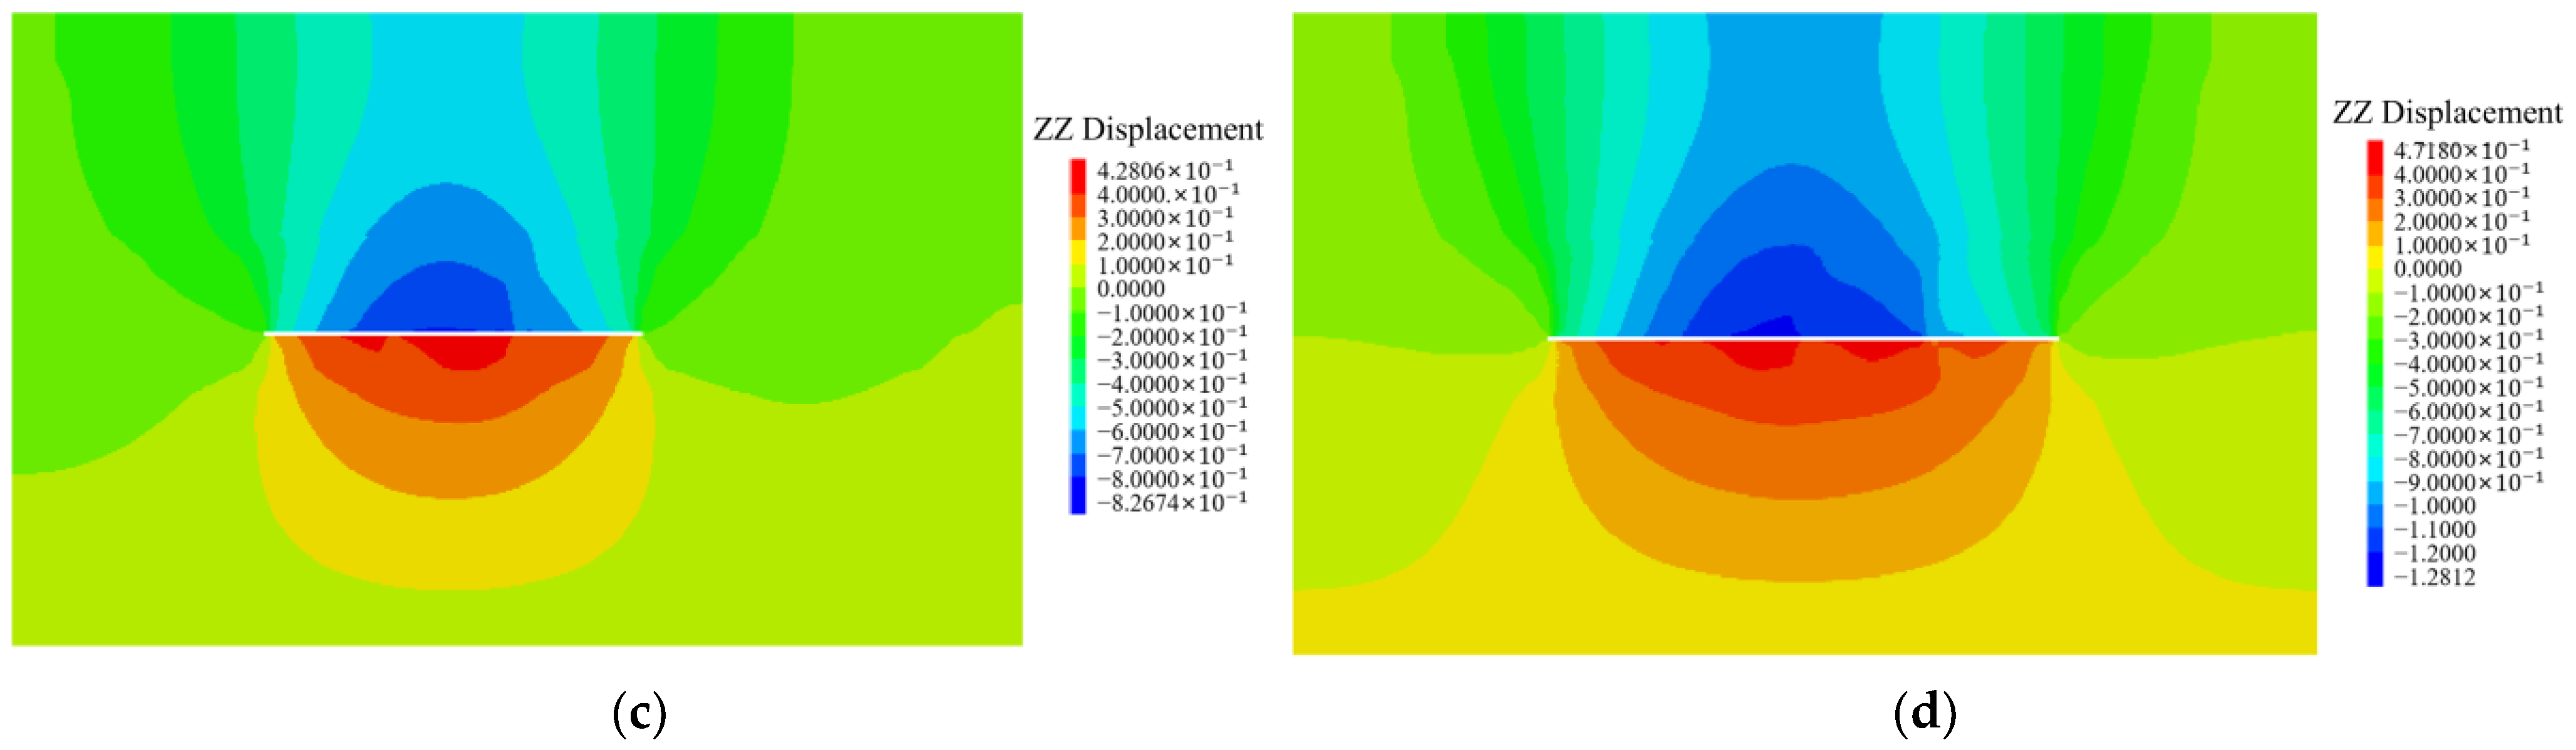
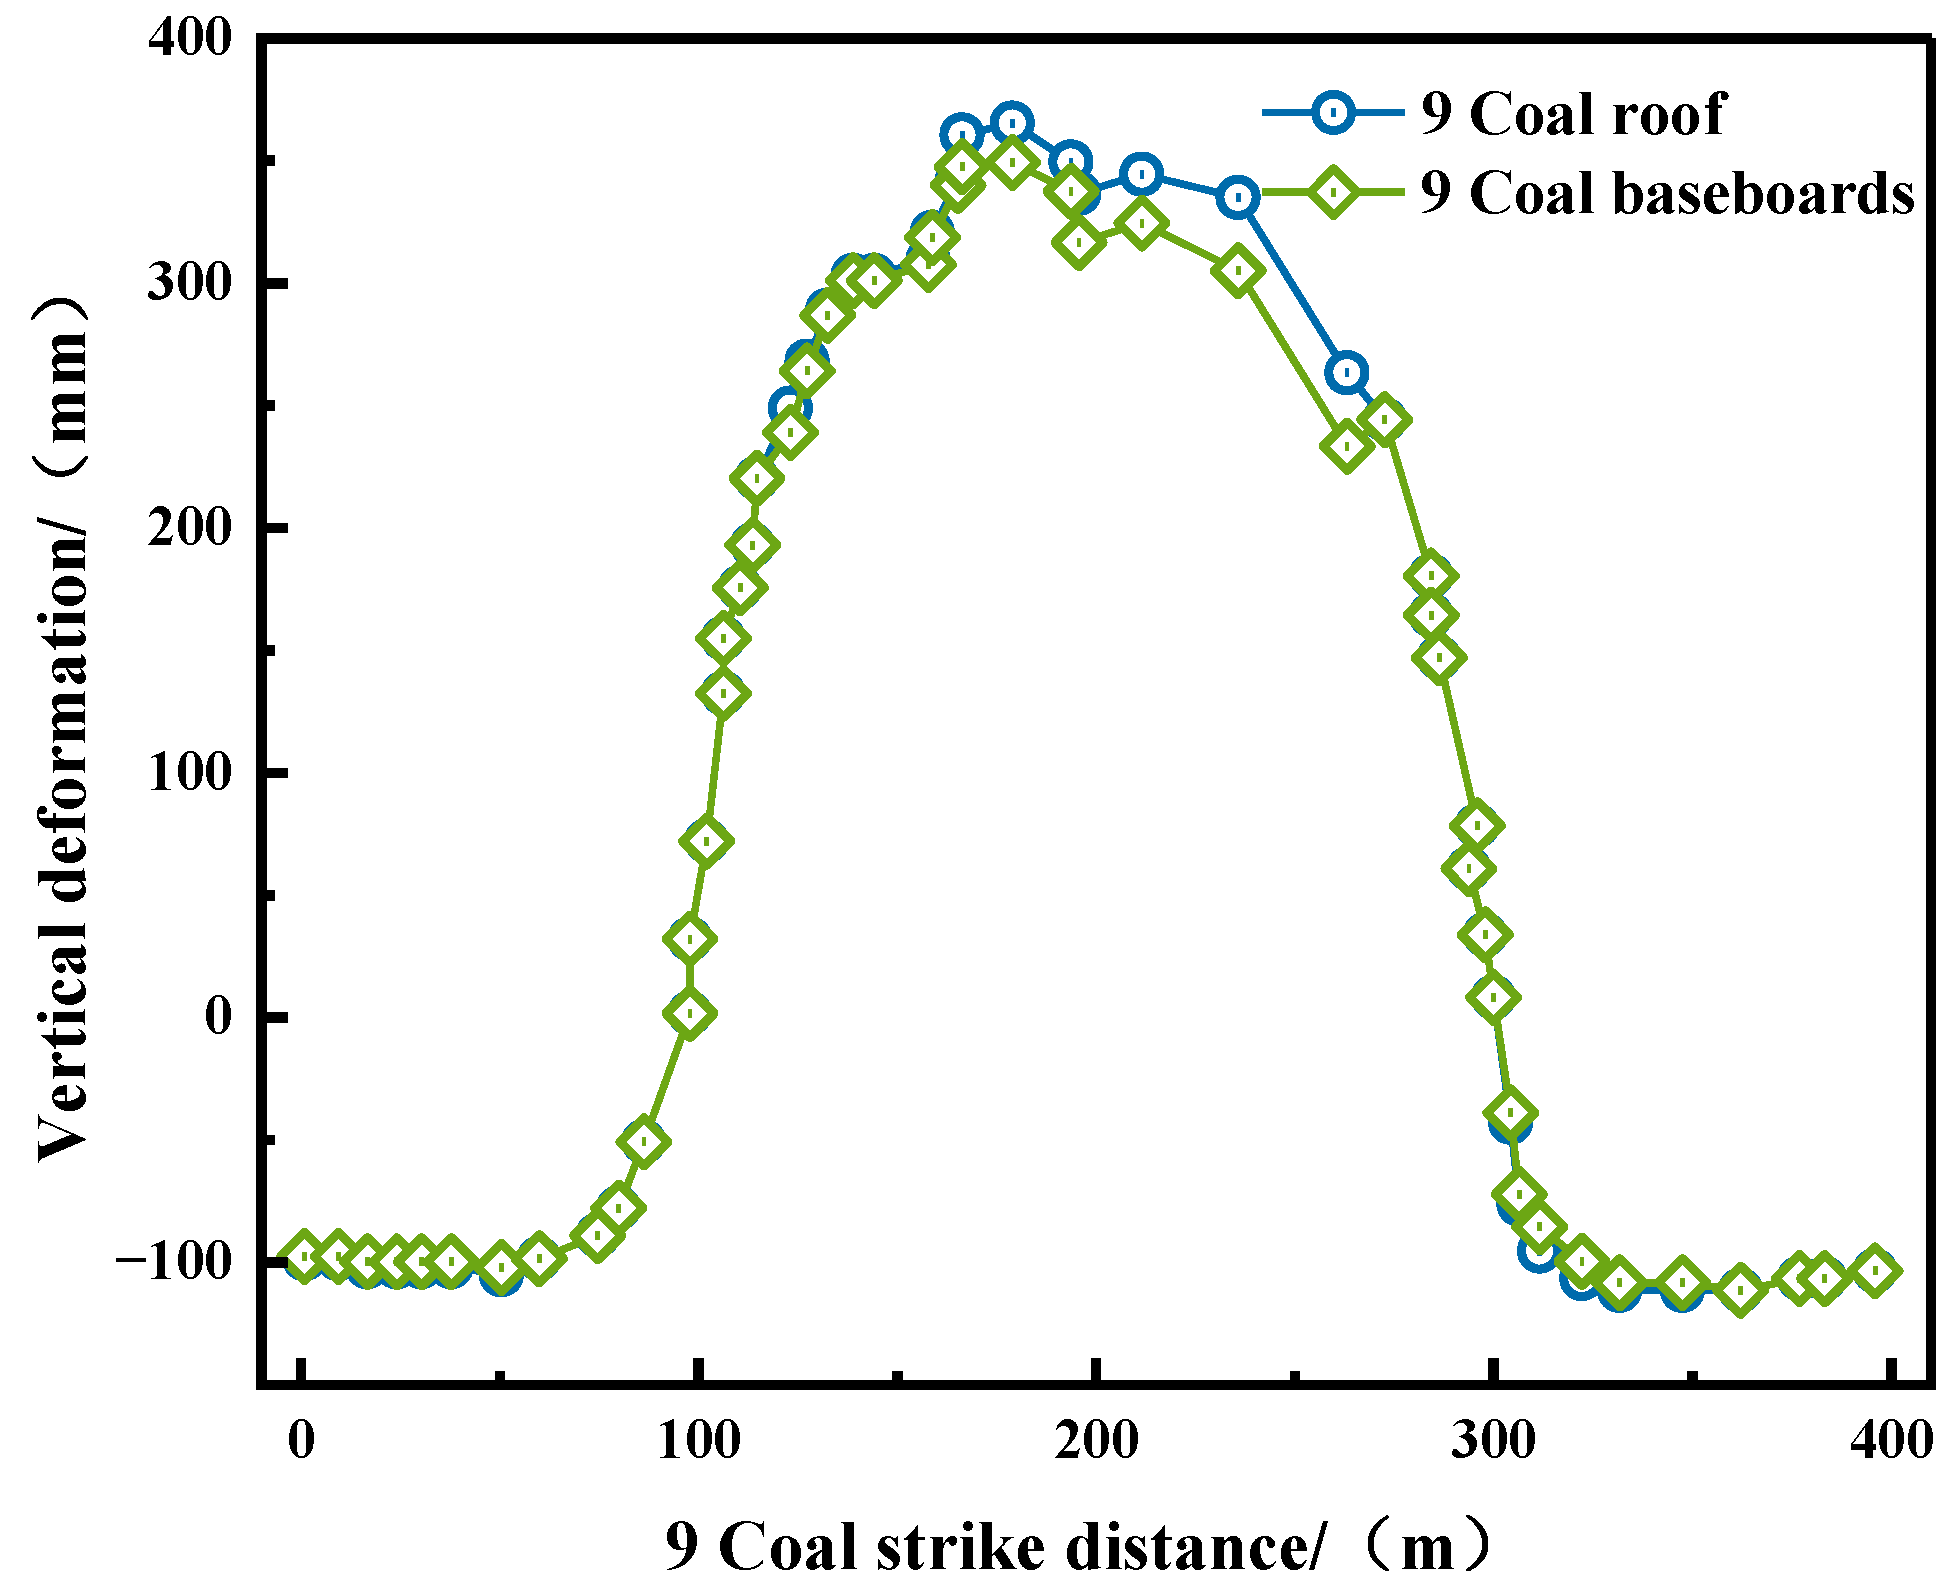
5.2. Analysis of the Deformation

During the mining process of the upper protective layer, the strata within a certain range are affected by mining, and the floor moves towards the goaf direction under the compassion of mass and the gravity of the overlying rock mass. The original coal seam location is changed, and ultimately the expansion, deformation, and failure of the mass are generated, developing different degrees of pores, fissures, and cracks. The displacement distribution of the working face in the protected layer at different mining distances is presented in Figure 11.
From Figure 11a to Figure 11d, as the working face advances, the displacement of the mass above the goaf is greater than that below. The farther away from the goaf, the smaller the displacement of the mass. The displacement and deformation of the mass gradually increases, eventually forming a funnel shape above the goaf and a semi-circular shape below.
Figure 12 demonstrates the variation in the vertical displacement in the middle of the 9# coal seam in the protected layer with the mining distance. When the working face advances 50 m, the vertical displacement of the 9# coal seam exhibits an inverted “V” shape, with a maximum expansion deformation of 155 mm, and the coal subsidence occurs below the working face and the open-off cut. As the working face advances, the vertical displacement change gradually increases, as does the subsidence.
Figure 13 shows the vertical movement of the roof and floor protected layer as the working face advances to 200 m. The roof and floor movement are basically symmetrical, the maximum movement occurs in the middle of the goaf. The maximum roof upward movement is 368 mm, and the maximum floor upward movement is 354 mm. The roof and floor have a certain downward movement within the coal pillars on both sides.
The deformation of the protected layer is obtained by subtracting the displacement of the roof and floor, as shown in Figure 14. The protected layer inside the coal pillars on both sides is compressed, with a maximum absolute compression of 24 mm and a relative compression deformation of 11.7‰. The maximum absolute expansion deformation of the protected layer in the lower part of the goaf is 15.6 mm, and the maximum relative expansion deformation is 7.6‰, with an average absolute expansion deformation of 9.9 mm and an average relative expansion deformation of 4.8‰.

6. Discussion

The experimental results indicate that the stress state and deformation characteristics of the underlying 9# coal seam are significantly affected by the mining of the 82# coal seam. Specifically, the maximum strike expansion deformation rate of the 9# coal seam reaches 11.3‰ after the mining of the 82# coal seam, demonstrating a significant deformation induced by the mining. The stress monitoring results further reveal that a stress concentration zone is formed within 32 m in front of the working face, a pressure relief zone is located within 51 m behind the working face, and the original stress level returns beyond 51 m behind the working face. It can be found that the stress in the underlying coal seam is significantly reduced due to the mining of the upper protective layer, resulting in a distinct pressure relief effect.
The results of the FLAC3D numerical simulation further verify the finding. The average pressure relief reaches 86.2% in the 9# coal seam due to the mining of the 82# coal seam, indicating that mining of the upper protective layer can significantly reduce the pressure in the underlying coal seam. This phenomenon is of great practical significance for gas extraction. The gas pressure in the underlying coal seam can be effectively reduced by the pronounced pressure relief effect, thus improving the efficiency of gas extraction and reducing the risk of gas explosion. An in-depth understanding of the dynamic pressure relief effect of coal seams can provide a scientific basis for gas management and optimize the gas extraction technology to improve the safety and economic benefit of the mine.
While the use of the same material types (sand, calcium carbonate, gypsum, and water) for different strata simplifies the modeling process and enhances the experimental reproducibility, we recognize that this approach could affect the precision of the simulation for strata with significantly different mechanical properties. The mechanical behavior of the different strata was primarily controlled by adjusting the material proportions (as described earlier), which ensured that the overall properties of the layers were within the acceptable range of the actual geological conditions. However, in cases where different geological layers have distinct compositional differences, using the same base materials may introduce minor discrepancies in simulating the exact in situ behavior of those layers. This limitation was considered when interpreting the results, particularly in terms of stress and deformation distributions in the floor and roof strata. The calibration process aimed to minimize these discrepancies, and future work could further explore the use of different materials for layers with significantly varying mechanical characteristics to enhance the model’s accuracy. Additionally, the FLAC3D numerical simulation models employed simplified the material properties for the rock mass, which could lead to an oversimplification of the geological complexity. While the model parameters were calibrated to approximate the mechanical behavior of the rock mass, the complex heterogeneity of the geological layers may not be fully reflected in the simulation. Future work should consider refining these models to better account for the variability in material properties across different layers of the rock mass.
In summary, this study systematically reveals the pressure relief effect of upper protected layer mining on the underlying coal seam and the impact on gas extraction through similar simulations and numerical simulations. The results not only provide a scientific basis for understanding the changes in terms of stress and deformation in the process of coal seam mining, but also provide an important reference for the development of gas management and extraction technology. The application of the pressure-relief technology can effectively improve mine safety and reduce production risks, which exhibits practical application value and broad promotion prospect.

7. Conclusions

Protective layer mining is the most effective means to prevent and control coal and gas outbursts. In order to deeply understand the dynamic evolution law of mining stress and displacement of the bottom plate coal rock body in the process of protective layer mining, the effects of upper protective layer mining on stress variation and displacement deformation in the underlying coal seam were studied using similarity experiments and FLAC3D simulations. The main findings are as follows:
  • Through similarity simulation experiments, the maximum strike expansion deformation rate is 11.3‰ in the 9# coal seam after the mining of the 82# coal seam. Stress monitoring during the protective layer mining reveals that the stress concentration zone is within 32 m ahead of the working face, the original stress zone is beyond 32 m ahead of the working face, the stress relief zone is within 51 m behind the working face, and the stress recovery zone is beyond 51 m behind the working face.
  • Through FLAC3D numerical simulation, it can be concluded that the vertical stress of the underlying mass is reduced due to the mining of the protective layer. The reduction rate of vertical stress gradually increases as the working face advances, reaching up to 99.6%. The stress concentration zone gradually forms and enlarges in front of the goaf and behind the open-off cut. The displacement and deformation of the underlying mass is affected by the protective layer mining, forming a funnel-shaped displacement above the goaf and a semicircular displacement below. The displacement increases gradually as the working face advances; eventually the displacement of the roof and floor is symmetrically distributed, and the maximum expansion deformation in the upper goaf reaches 15.6 mm. The pressure relief effect is exerted on the underlying 9# coal seam after the mining of the 82# coal seam, with an average pressure relief rate of 86.2%, demonstrating a good pressure relief effect.
Although the results from both the similar simulation experiments and FLAC3D numerical simulations provide valuable insights into the stress and deformation characteristics of the mass during protective layer mining, we acknowledge the importance of in situ measurements to verify these findings. In future work, we plan to perform field measurements to validate and further refine the assumptions and results derived from the simulations.

Author Contributions

Conceptualization, C.L.; Methodology, C.L.; Supervision, C.L.; Funding acquisition, C.L.; Data curation, Z.M. and M.L.; Investigation, M.L.; Project administration, M.L.; Writing—original draft, Z.M. and M.L.; Writing—Review and editing, Z.M. All authors have read and agreed to the published version of the manuscript.

Funding

This research received support from three funding sources: The National Natural Science Funds of China (Grant No: 52074283), the National Key Research and Development Program (Grant No: 2020YFA0711802), and the Fundamental Research Funds for the Central Universities (Grant No:2021ZDPY0208).

Data Availability Statement

The original contributions presented in the study are included in the article, and further inquiries can be directed to the corresponding author.

Conflicts of Interest

The co-author Maolin come from the company Shanxi Coking Coal Xishan Coal Electricity (Group) Co., Ltd. The remaining authors declare that the research was conducted in the absence of any commercial or financial relationships that could be construed as a potential conflict of interest.

References

  1. Ren, S.-h.; Jiao, X.-m.; Zheng, D.-Z.; Zhang, Y.-n.; Xie, H.-p.; Guo, Z.-q. Demand and fluctuation range of China’s coal production under the dual carbon target. Energy Rep. 2024, 11, 3267–3282. [Google Scholar]
  2. Li, K.-z.; Xiao, L.; Qi, K.; Song, Y.-m. Clean energy transition and energy security in metropolises: A case study of Beijing under the “coal-to-gas” movement. Elem. Sci. Anthr. 2024, 12, 00074. [Google Scholar] [CrossRef]
  3. Zhang, X.-y; Cui, J.; Dong, F.; Xu, L.-y.; Zhu, X.-z.; Li, Y.-f. Carbon inequality under domestic value chain fragmentation. J. Clean. Prod. 2024, 471, 143309. [Google Scholar] [CrossRef]
  4. Cheng, Y.; Wang, L.; Liu, H.; Kong, S.; Yang, Q.; Zhu, J.; Tu, Q. Definition, theory, methods, and applications of the safe and efficient simultaneous extraction of coal and gas. Int. J. Coal Sci. Technol. 2015, 2, 52–65. [Google Scholar] [CrossRef]
  5. Yin, G.; Li, M.; Wang, J.G.; Xu, J.; Li, W. Mechanical behavior and permeability evolution of gas infiltrated coals during protective layer mining. Int. J. Rock Mech. Min. Sci. 2015, 80, 292–301. [Google Scholar] [CrossRef]
  6. Wang, K.; Du, F. Coal-gas compound dynamic disasters in China: A review. Process Saf. Environ. Prot. 2020, 133, 1–17. [Google Scholar] [CrossRef]
  7. Liu, H.; Cheng, Y. The elimination of coal and gas outburst disasters by long distance lower protective seam mining combined with stress-relief gas extraction in the Huaibei coal mine area. J. Nat. Gas Sci. Eng. 2015, 27, 346–353. [Google Scholar] [CrossRef]
  8. Zhang, H.; Wen, Z.; Yao, B.; Chen, X. Numerical simulation on stress evolution and deformation of overlying coal seam in lower protective layer mining. Alex. Eng. J. 2020, 59, 3623–3633. [Google Scholar] [CrossRef]
  9. Cheng, Z.; Pan, H.; Zou, Q.; Li, Z.; Chen, L.; Cao, J.; Zhang, K.; Cui, Y. Gas Flow Characteristics and Optimization of Gas Drainage Borehole Layout in Protective Coal Seam Mining: A Case Study from the Shaqu Coal Mine, Shanxi Province, China. Nat. Resour. Res. 2020, 30, 1481–1493. [Google Scholar] [CrossRef]
  10. Guo, F.; Zhang, N.; Xie, Z.-z; Han, C.-l.; Zhang, C.-h.; Yuan, Y.-x.; He, Z.; Liu, J.-h. A three-dimensional supporting technology, optimization and inspiration from a deep coal mine in China. Rock Mech. Rock Eng. 2024, 57, 655–677. [Google Scholar] [CrossRef]
  11. Dang, J.-x; Tu, M.; Zhang, X.-y; Bu, Q.-w. Research on the bearing characteristics of brackets in thick hard roof mining sites and the effect of blasting on roof control. Geomech. Geophys. Geo-Energy Geo-Resour. 2024, 10, 18. [Google Scholar] [CrossRef]
  12. Gai, Q.-k; He, M.-c; Gao, Y.-b; Lu, C.-s. A two-dimensional model test system for floor failure during automatic roadway formation mining without pillars above confined water. Eng. Fail. Anal. 2024, 162, 108369. [Google Scholar] [CrossRef]
  13. Majid, K.; He, X.; Guo, J.; Song, D.-z. Accurate prediction of indicators for engineering failures in complex mining environments. Eng. Fail. Anal. 2024, 155, 107736. [Google Scholar]
  14. Zhou, J.; Zhang, Y.-l; Li, C.-q; He, H.-b.; Li, X.-b. Rockburst prediction and prevention in underground space excavation. Undergr. Space 2024, 14, 70–98. [Google Scholar] [CrossRef]
  15. Cai, M. Rockburst risk control and mitigation in deep mining. Deep Resour. Eng. 2024, 1, 100019. [Google Scholar] [CrossRef]
  16. Liu, Y.; Wen, H.; Chen, C.-m; Guo, J.; Jin, Y.-f.; Zheng, X.-z.; Cheng, X.-j.; Li, D.-l. Research status and development trend of coal spontaneous combustion fire and prevention technology in China: A review. ACS Omega 2024, 9, 21727–21750. [Google Scholar] [CrossRef]
  17. Gu, Y.-f.; Li, H.-d.; Dou, L.-h.; Wu, M.; Guo, H.-n.; Huang, W.-s.; Gu, J.-p.; Babaee, S.; Jiang, L.-l.; Feng, L.-l. Advance in Detection and Management for Underground Coal Fires: A Global Technological Overview. Combust. Sci. Technol. 2024, 1–38. [Google Scholar] [CrossRef]
  18. Acharya, B.S.; Kharel, G. Acid mine drainage from coal mining in the United States—An overview. J. Hydrol. 2020, 588, 125061. [Google Scholar] [CrossRef]
  19. Agboola, O.; Babatunde, D.E.; Fayomi, O.S.I.; Sadiku, E.R.; Popoola, P.; Moropeng, L.; Yahaya, A.; Mamudu, O.A. A review on the impact of mining operation: Monitoring, assessment and management. Results Eng. 2020, 8, 100181. [Google Scholar] [CrossRef]
  20. Song, S.-l.; Liu, X.-s.; Tan, Y.-l.; Fan, D.-y.; Ma, Q.; Wang, H.-l. Study on Failure Modes and Energy Evolution of Coal-Rock Combination under Cyclic Loading. Shock. Vib. 2020, 2020, 1–16. [Google Scholar] [CrossRef]
  21. Cheng, Z.-b.; Li, L.-h.; Zhang, Y.-n. Laboratory investigation of the mechanical properties of coal-rock combined body. Bull. Eng. Geol. Environ. 2019, 79, 1947–1958. [Google Scholar] [CrossRef]
  22. Du, X.-h.; Xue, J.-h.; Ma, Q.; Chen, Z.-h.; Zhan, K.-l. Energy Evolution Characteristics of Coal–Rock Composite Bodies Based on Unidirectional Load. Nat. Resour. Res. 2022, 31, 1647–1663. [Google Scholar] [CrossRef]
  23. Li, Z.-l.; He, X.-q.; Dou, L.-m.; Song, D.-z.; Wang, G.-f. Numerical investigation of load shedding and rockburst reduction effects of top-coal caving mining in thick coal seams. Int. J. Rock Mech. Min. Sci. 2018, 110, 266–278. [Google Scholar] [CrossRef]
  24. Zhang, X.; Zhao, X.; Luo, L. Structural Evolution and Motion Characteristics of a Hard Roof During Thickening Coal Seam Mining. Front. Earth Sci. 2022, 9, 527–546. [Google Scholar] [CrossRef]
  25. He, W.; He, F.; Zhao, Y. Field and simulation study of the rational coal pillar width in extra -thick coal seams. Energy Sci. Eng. 2020, 8, 627–646. [Google Scholar] [CrossRef]
  26. Yu, B.; Zhang, R.; Gao, M.-Z.; Li, G.; Zhang, Z.-T.; Liu, Q.-Y. Numerical approach to the top coal caving process under different coal seam thicknesses. Therm. Sci. 2015, 19, 1423–1428. [Google Scholar] [CrossRef]
  27. Yang, Y.; Ma, Y.; Ji, C.; Kang, T.; Guo, X. Effect of Mining Thickness on Overburden Movement and Underground Pressure Characteristics for Extrathick Coal Seam by Sublevel Caving with High Bottom Cutting Height. Adv. Civ. Eng. 2018, 18, 143–158. [Google Scholar] [CrossRef]
  28. Xiong, X.-y.; Dai, J.; Chen, X.-n.; Ouyang, Y.-b. Complex function solution for deformation and failure mechanism of inclined coal seam roadway. Sci. Rep. 2022, 12, 439–452. [Google Scholar] [CrossRef]
  29. Xiong, X.-y.; Dai, J.; Ouyang, Y.-b.; Shen, P. Experimental analysis of control technology and deformation failure mechanism of inclined coal seam roadway using non-contact DIC technique. Sci. Rep. 2021, 11, 539–563. [Google Scholar] [CrossRef]
  30. Tao, Z.; Zhu, C.; Zheng, X.; Wang, D.; Liu, Y.; He, M.; Wang, Y. Failure mechanisms of soft rock roadways in steeply inclined layered rock formations. Geomat. Nat. Hazards Risk 2018, 9, 1186–1206. [Google Scholar] [CrossRef]
  31. Cheng, G.Q.; Yan, M.J.; Zhu, H.L.; Yu, H.-f. Study of Asymmetric Failure Law and Support for Large Embedded Depth Roadway Driving along the Roof in Inclined Coal Seam. In Proceedings of the Mining 2014: Taishan Academic Forum—Project on Mine Disaster Prevention and Control, Qingdao, China, 17–20 October 2014; Volume 27, pp. 195–202. [Google Scholar]
  32. Fu, Y.; Wang, H.; Wang, X. Similarity theory and scaling laws for low-temperature plasma discharges: A comprehensive review. Rev. Mod. Plasma Phys. 2023, 7, 10. [Google Scholar] [CrossRef]
  33. Irzik, G.; Nola, R. Revisiting the foundations of the family resemblance approach to nature of science: Some new ideas. Sci. Educ. 2023, 32, 1227–1245. [Google Scholar] [CrossRef]
  34. Martynenko, S.I.; Varaksin, A.Y. A Physical Insight into Computational Fluid Dynamics and Heat Transfer. Mathematics 2024, 12, 2122. [Google Scholar] [CrossRef]
  35. Zhu, H.; Qu, Z.; Wang, Q.; Zhang, J. Dimension unification and dominance evaluation of multi-physical parameters for nanochannel-based ionic thermoelectric energy conversion using similarity principle. Energy Convers. Manag. 2023, 276, 116589. [Google Scholar] [CrossRef]
  36. Ni, M.; Zhao, X.; Wang, W.; Zhang, Q.; Wang, H.; Wang, J. Research on Resistance Characteristics of Fire Zone of Mine Tunnel Fire and Construction of Calculation Model. Fire 2024, 7, 197. [Google Scholar] [CrossRef]
  37. Fan, C.; Xu, L.; Elsworth, D.; Luo, M.; Liu, T.; Li, S.; Zhou, L.; Su, W. Spatial–temporal evolution and countermeasures for coal and gas outbursts represented as a dynamic system. Rock Mech. Rock Eng. 2023, 56, 6855–6877. [Google Scholar] [CrossRef]
  38. Zhao, P.; Zhuo, R.; Li, S.; Lin, H.; Shu, C.-M.; Shuang, H.; Wei, Z. Greenhouse gas protection and control based upon the evolution of overburden fractures under coal mining: A review of methods, influencing factors, and techniques. Energy 2023, 284, 129158. [Google Scholar] [CrossRef]
  39. Shan, C.; Sun, J.; Jia, X.; Wu, R.; Lu, X. The mechanical behavior of cylindrical shell with composite corrugations under uniform and concentrated pressure. Ocean. Eng. 2024, 298, 117148. [Google Scholar] [CrossRef]
  40. Cappellesso, V.; Van Mullem, T.; Gruyaert, E.; Van Tittelboom, K.; De Belie, N. Enhancing concrete durability in chloride-rich environments through manual application of healing agents. J. Build. Eng. 2024, 90, 109380. [Google Scholar] [CrossRef]
  41. Condé-Wolter, J.; Ruf, M.G.; Liebsch, A.; Lebelt, T.; Koch, I.; Drechsler, K.; Gude, M. Hydrogen permeability of thermoplastic composites and liner systems for future mobility applications. Compos. Part A Appl. Sci. Manuf. 2023, 167, 107446. [Google Scholar] [CrossRef]
  42. Kang, H.; Gao, F.; Xu, G.; Ren, H. Mechanical behaviors of coal measures and ground control technologies for China’s deep coal mines—A review. J. Rock Mech. Geotech. Eng. 2023, 15, 37–65. [Google Scholar] [CrossRef]
  43. Fan, J.; Yuan, Q.; Chen, J.; Ren, Y.; Zhang, D.; Yao, H.; Hu, B.; Qu, Y. Investigation of surrounding rock stability during proximal coal seams mining process and feasibility of ground control technology. Process Saf. Environ. Prot. 2024, 186, 1447–1459. [Google Scholar] [CrossRef]
  44. Liu, J.; Shen, W.; Bai, J.; Shan, C.; Liu, X. Experiment on separated layer rock failure technology for stress reduction of entry under coal pillar in mining conditions. Front. Ecol. Evol. 2023, 11, 1265883. [Google Scholar] [CrossRef]
  45. Zhang, R.; Gomaa, S.M.M.H.; Hussein, M.; Zayed, T.; Meguid, M. Review of numerical approaches used in soil-pipe interaction analysis of water mains. Transp. Geotech. 2023, 42, 101008. [Google Scholar] [CrossRef]
  46. Zhang, R.; Liu, Y.; Hou, S. Evaluation of rockburst risk in deep tunnels considering structural planes based on energy dissipation rate criterion and numerical simulation. Tunn. Undergr. Space Technol. 2023, 137, 105128. [Google Scholar] [CrossRef]
  47. Zhang, W.; Han, D.; Wang, B.; Chen, Y.; Jiao, K.; Gong, L.; Yu, B. Thermal-hydraulic-mechanical-chemical modeling and simulation of an enhanced geothermal system based on the framework of extended finite element methods-Embedded discrete fracture model. J. Clean. Prod. 2023, 415, 137630. [Google Scholar] [CrossRef]
  48. Shi, H.; Chen, W.; Zhang, H.; Song, L. A novel obtaining method and mesoscopic mechanism of pseudo-shear strength parameter evolution of sandstone. Environ. Earth Sci. 2023, 82, 60. [Google Scholar] [CrossRef]
  49. Yao, N.; Deng, X.; Luo, B.; Oppong, F.; Li, P. Strength and failure mode of expansive slurry-inclined layered rock mass composite based on Mohr–Coulomb criterion. Rock Mech. Rock Eng. 2023, 56, 3679–3692. [Google Scholar] [CrossRef]
  50. Liu, H.; Liu, J.; Zhang, S.; Feng, L.; Qiu, L. Experimental study on compression characteristics of fractured soft rock and its Mohr-Coulomb criterion. Theor. Appl. Fract. Mech. 2023, 125, 103820. [Google Scholar] [CrossRef]
  51. Zhao, Y.; Mishra, B.; Shi, Q.; Zhao, G. Size-dependent Mohr–Coulomb failure criterion. Bull. Eng. Geol. Environ. 2023, 82, 218. [Google Scholar] [CrossRef]
  52. Zahtila, T.; Lu, W.; Chan, L.; Ooi, A. A systematic study of the grid requirements for a spectral element method solver. Comput. Fluids 2023, 251, 105745. [Google Scholar] [CrossRef]
  53. Weiss, M.; Kalscheuer, T.; Ren, Z. Spectral element method for 3-D controlled-source electromagnetic forward modelling using unstructured hexahedral meshes. Geophys. J. Int. 2023, 232, 1427–1454. [Google Scholar] [CrossRef]
Figure 1. Experiment system: (a) stress measurement point; (b) stress testing system of the ZC40YL physical model.
Minerals 14 01084 g001
Figure 2. Experiment system for the similar simulation experiment.
Minerals 14 01084 g002
Figure 3. Computational loop structure of the FLAC program.
Minerals 14 01084 g003
Figure 4. Numerical simulation model.
Minerals 14 01084 g004
Figure 5. Movement characteristics of the working face under different advanced lengths: (a) working face advance distance of 50 m; (b) working face advance distance of 60 m; (c) working face advance distance of 90 m; (d) working face advance distance of 100 m; (e) working face advance distance of 120 m; (f) working face advance distance of 160 m; (g) working face advance distance of 180 m; (h) working face advance distance of 200 m.
Minerals 14 01084 g005aMinerals 14 01084 g005b
Figure 6. Displacement of the 9# coal seam: (a) monitor line; (b) displacement of the 9# coal seam.
Minerals 14 01084 g006
Figure 7. Relative deformation curve of the 9# coal seam.
Minerals 14 01084 g007
Figure 8. Variation in vertical stress in the 9# coal seam with the advancement of the working face.
Minerals 14 01084 g008
Figure 9. Vertical stress distribution for different working face advance distance: (a) original vertical stress distribution; (b) working face advance distance of 50 m; (c) working face advance distance of 100 m; (d) working face advance distance of 150 m; (e) working face advance distance of 200 m.
Minerals 14 01084 g009aMinerals 14 01084 g009b
Figure 10. Vertical stress along the strike direction of the 9# coal seam in the protected layer at different mining distances.
Minerals 14 01084 g010
Figure 11. Displacement distribution with working advance distance: (a) working face advance distance of 50 m; (b) working face advance distance of 100 m; (c) working face advance distance of 150 m; (d) working face advance distance of 200 m.
Minerals 14 01084 g011aMinerals 14 01084 g011b
Figure 12. Vertical deformation in the middle of the protected layer.
Minerals 14 01084 g012
Figure 13. Vertical displacement of the roof and floor of the protected layer.
Minerals 14 01084 g013
Figure 14. Deformation of the protected layer.
Minerals 14 01084 g014
Table 1. Material proportions and properties used in the model for each geological units.
LithologyThickness/cmTotal Weight/kgAccumulated Thickness/cmRation NumberSand/kgCalcium Carbonate/kgGypsum/kgWater/kg
Mudstone10.0150149.047390.00 15.756.7516.7
Fine sandstone23.0345139.0437207.0015.5336.2338.3
Mudstone4.060116.047336.006.302.706.7
7# coal seam3.755.5112.077336.383.601.586.2
Mudstone2.030108.347318.003.151.353.3
Fine sandstone29.0435106.3437261.0019.5845.6848.3
Mudstone2.03077.347318.003.151.353.3
82# coal seam1.82775.377317.701.800.753.0
Mudstone3.04573.547327.004.732.035.0
Fine sandstone7.5112.570.543767.505.0611.8112.5
Medium sandstone2.03063.043718.001.353.153.3
9# coal seam2.03061.077319.731.950.833.3
Mudstone4.06059.047336.006.302.706.7
Fine sandstone18.027055.0437162.0012.1528.3530.0
Medium sandstone3.04537.043727.002.034.735.0
Mudstone8.012034.047372.0012.605.4013.3
Fine sandstone26.039026.0437234.0017.5540.9543.3
Table 2. Mechanical parameters for simulation.
LithologyDensity (kg/m3)Volume Modulus (GPa)Shear Modulus (GPa)Cohesion (MPa)Internal Friction Angle (°)Tensile Strength (MPa)
Fine sandstone250016.7176.8403.8
Medium sandstone256017145.1393.6
Siltstone25008.36.253.5371.5
82# coal seam14004.912.011.25320.15
9# coal seam14004.912.011.25320.15
Mudstone24309.56.60.85361.6
Aluminum mudstone24839.977.351.2320.58
Disclaimer/Publisher’s Note: The statements, opinions and data contained in all publications are solely those of the individual author(s) and contributor(s) and not of MDPI and/or the editor(s). MDPI and/or the editor(s) disclaim responsibility for any injury to people or property resulting from any ideas, methods, instructions or products referred to in the content.

