
Gold Mineralization at the Syenite-Hosted Anwangshan Gold Deposit, Western Qinling Orogen, Central China

Abstract
1. Introduction
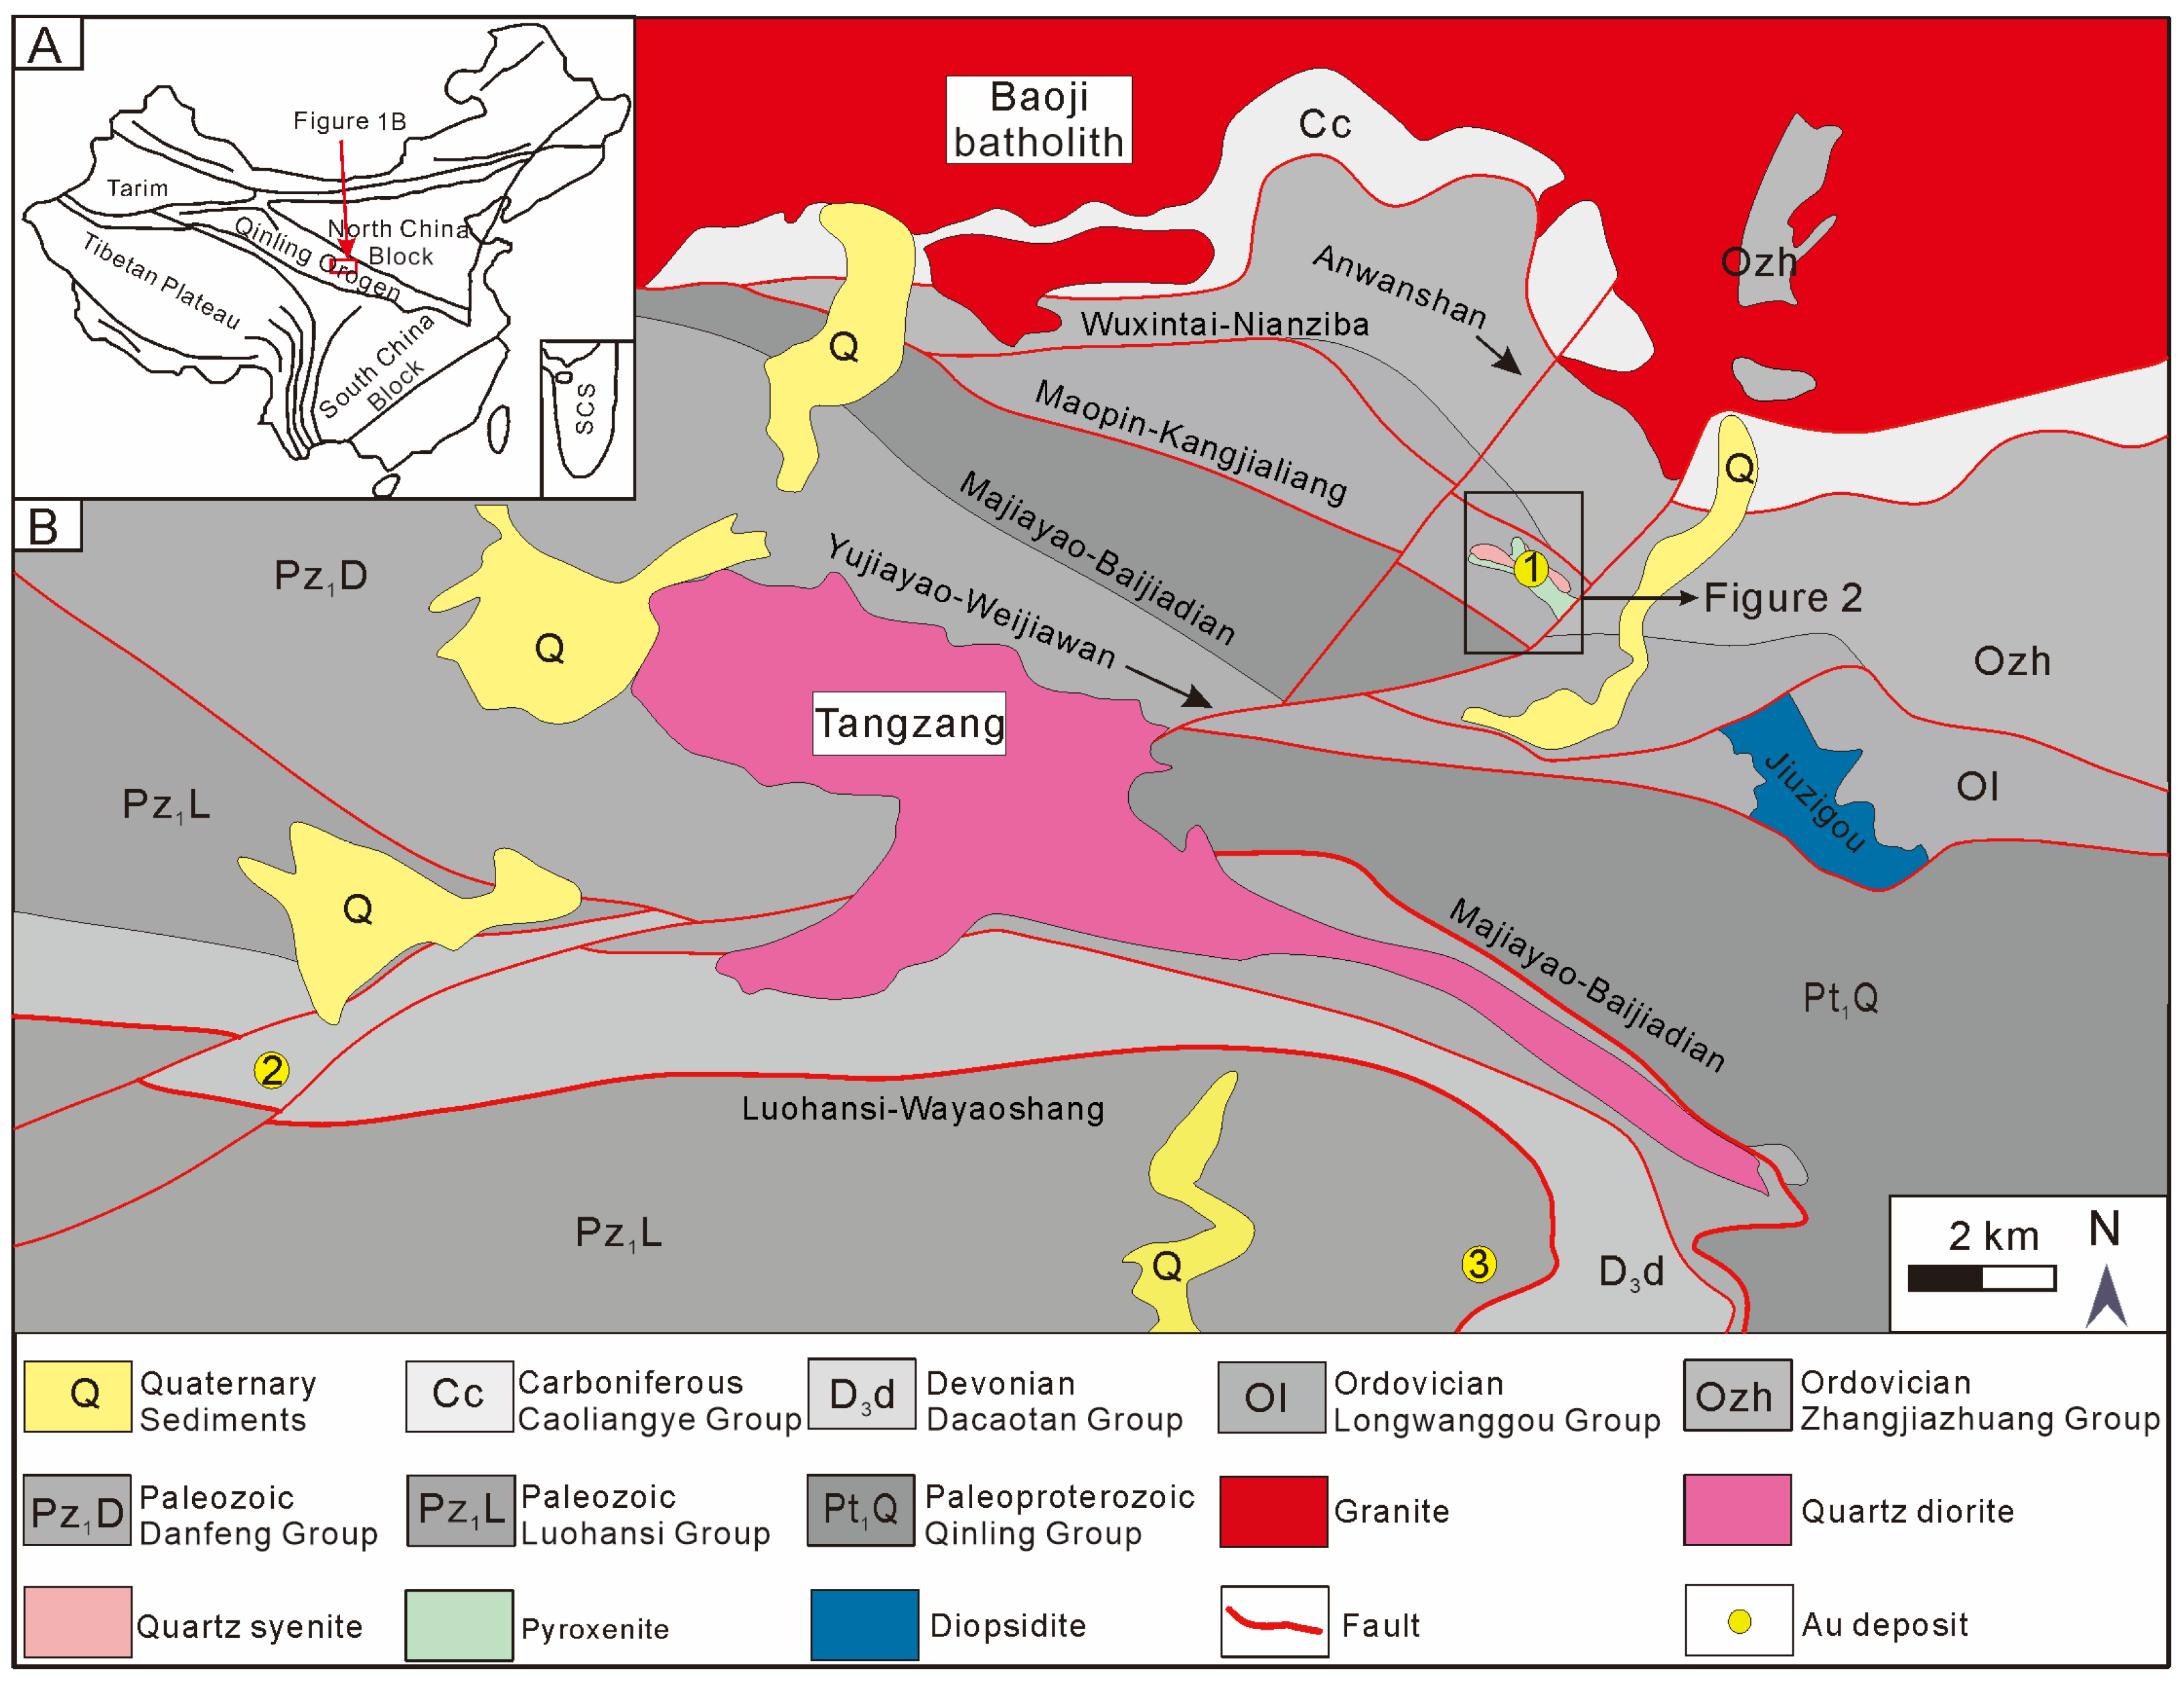
2. Regional Geology
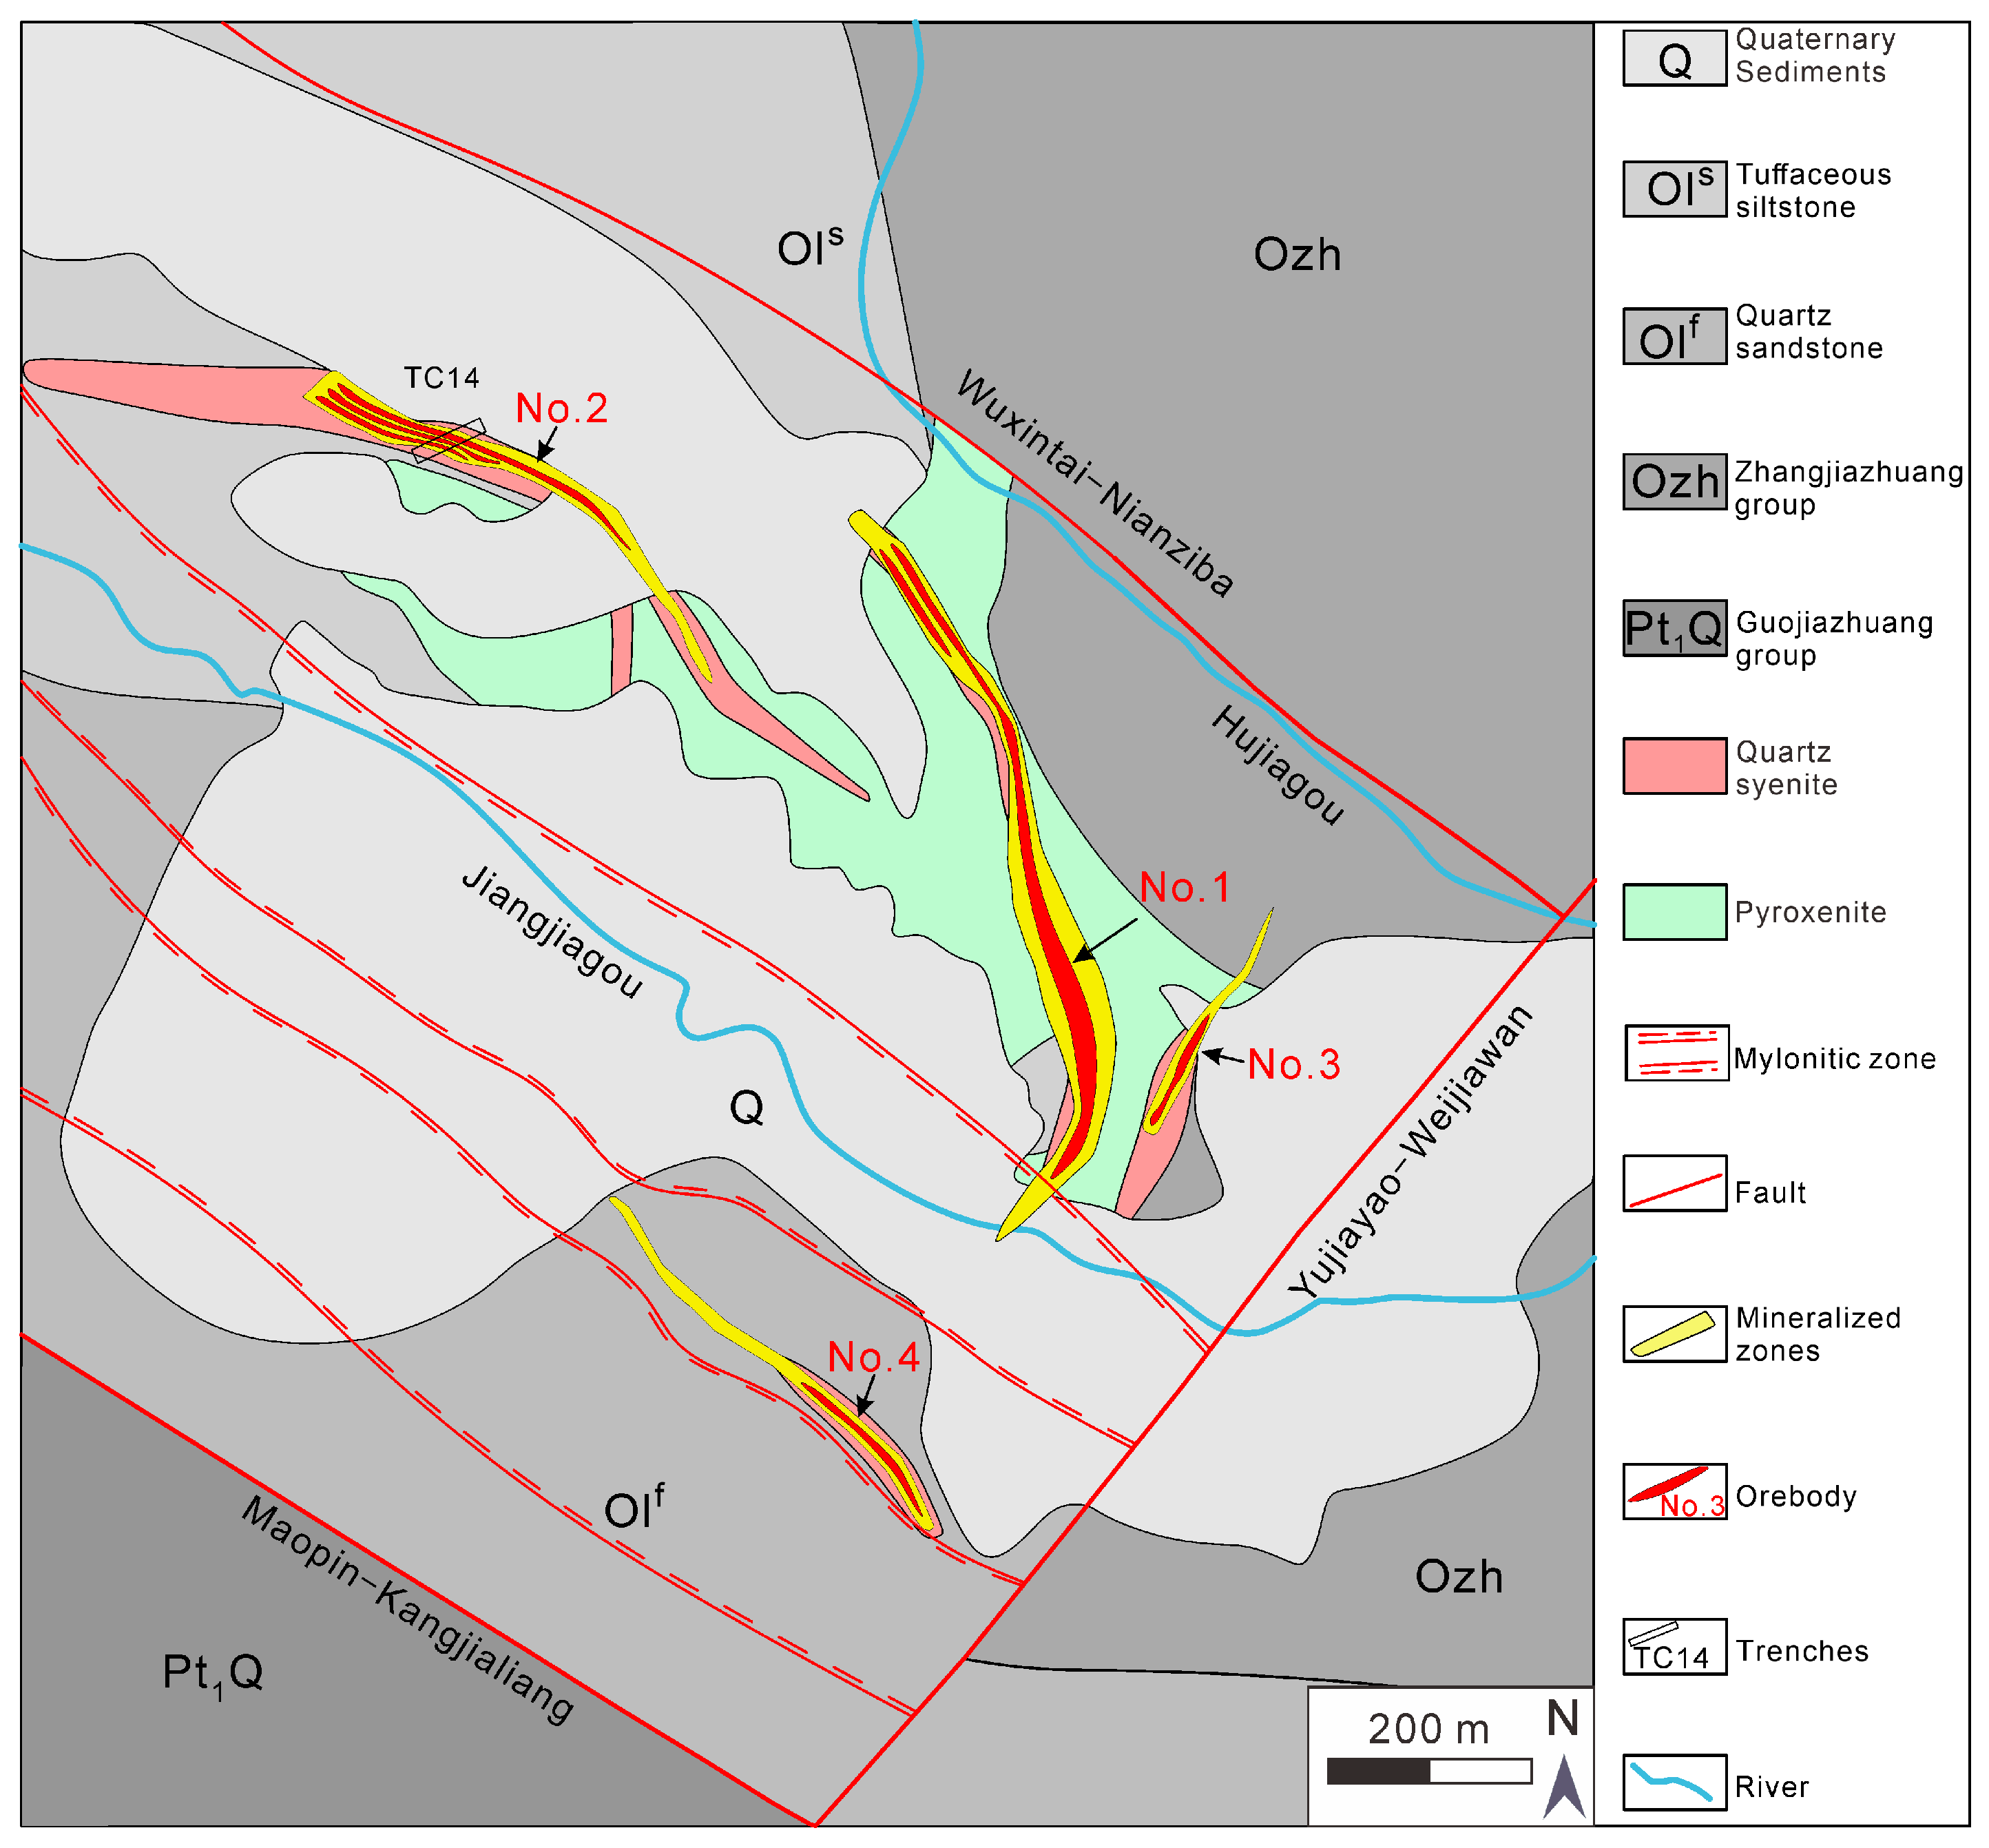
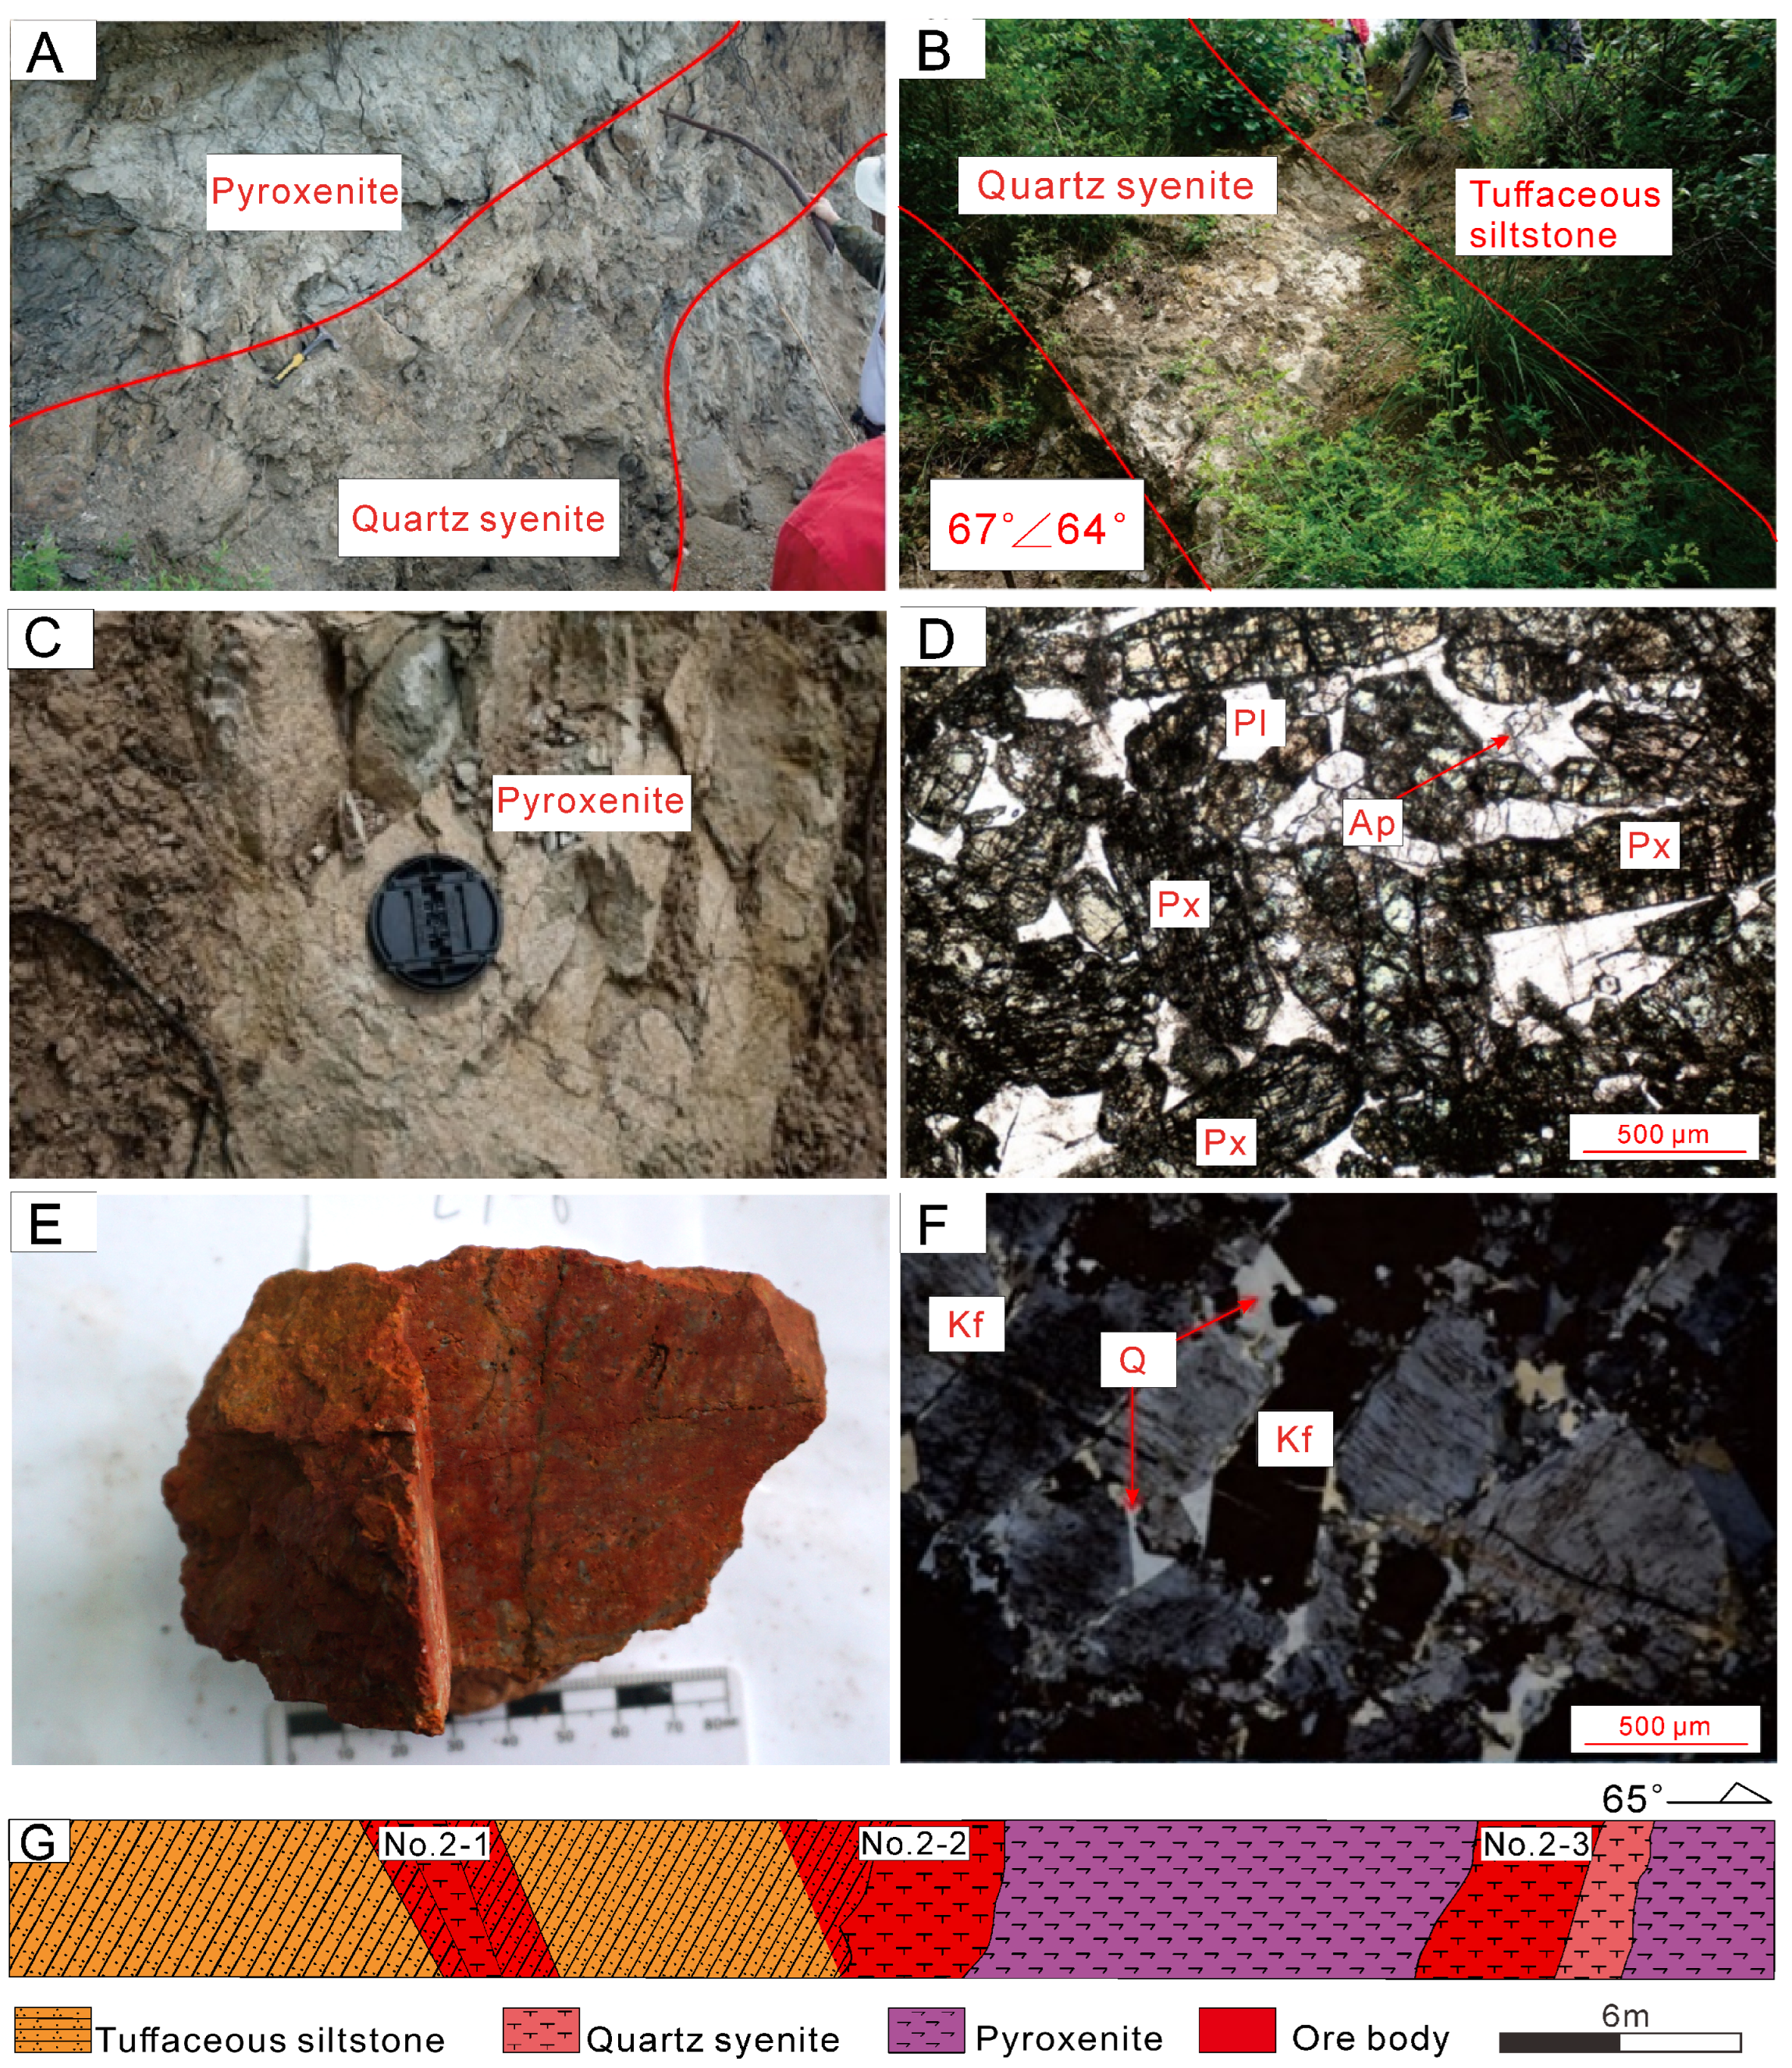
3. The Anwangshan Gold Deposit
4. Sampling and Analytical Methods
5. Results
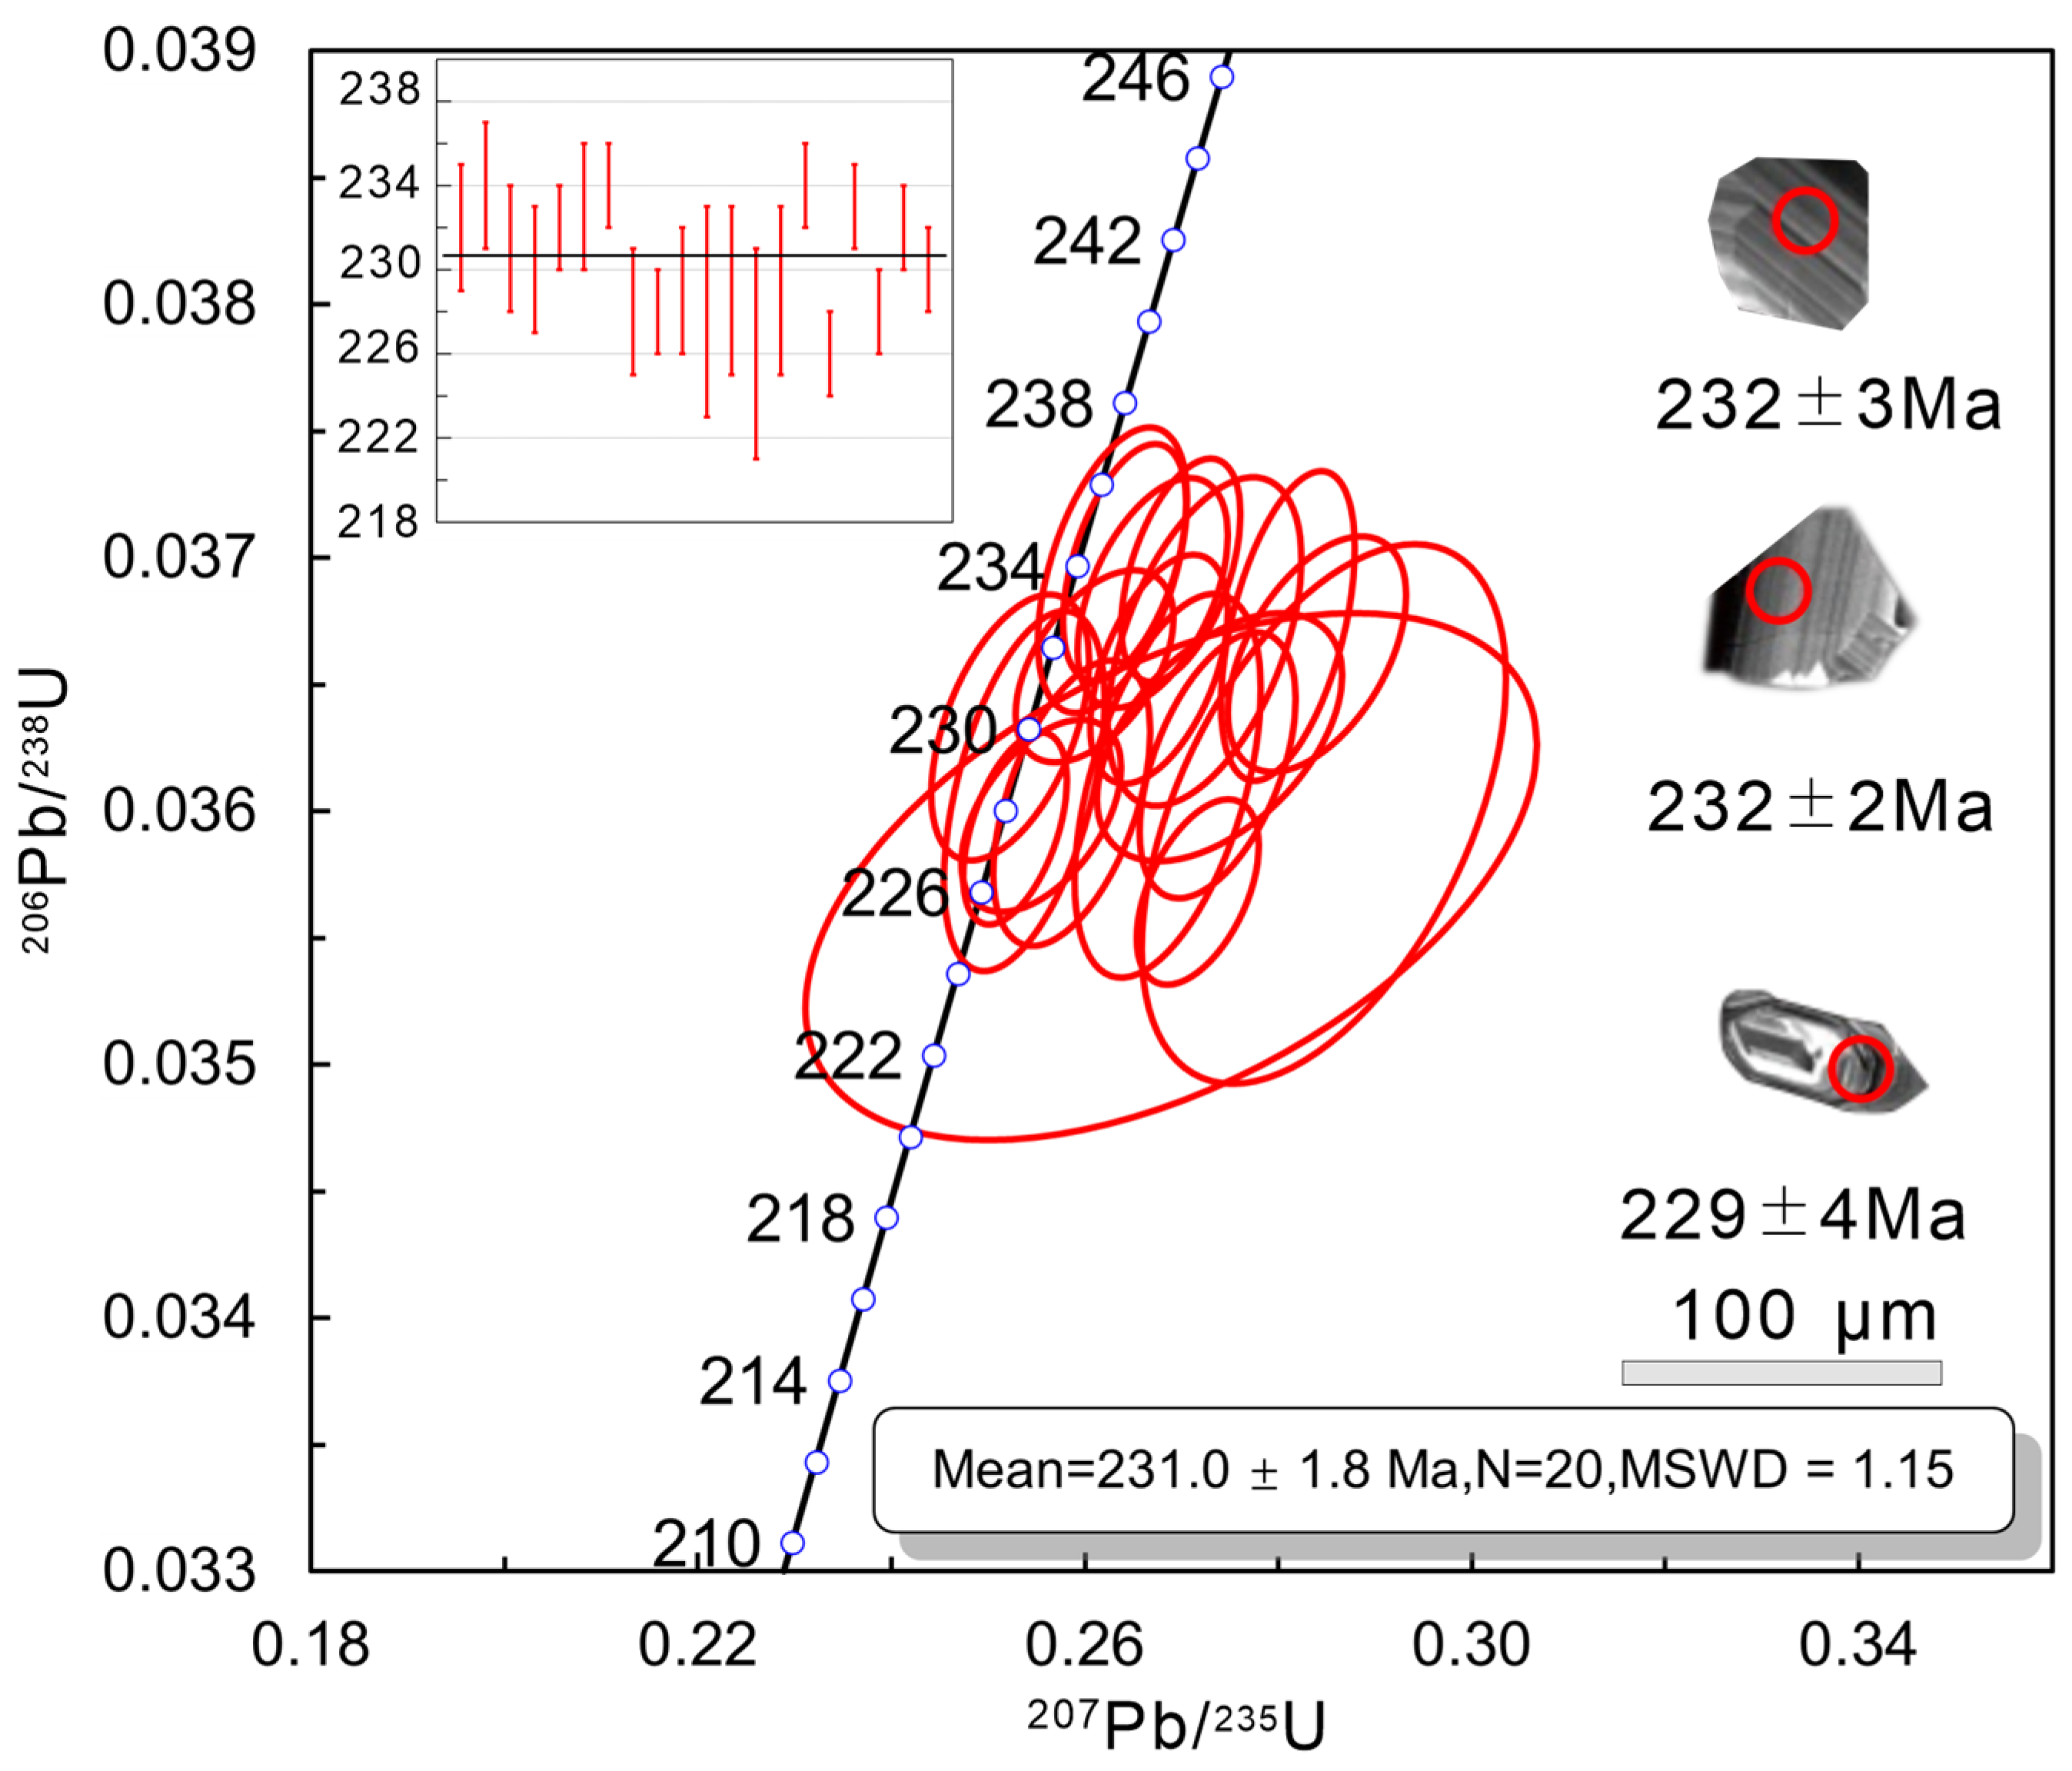
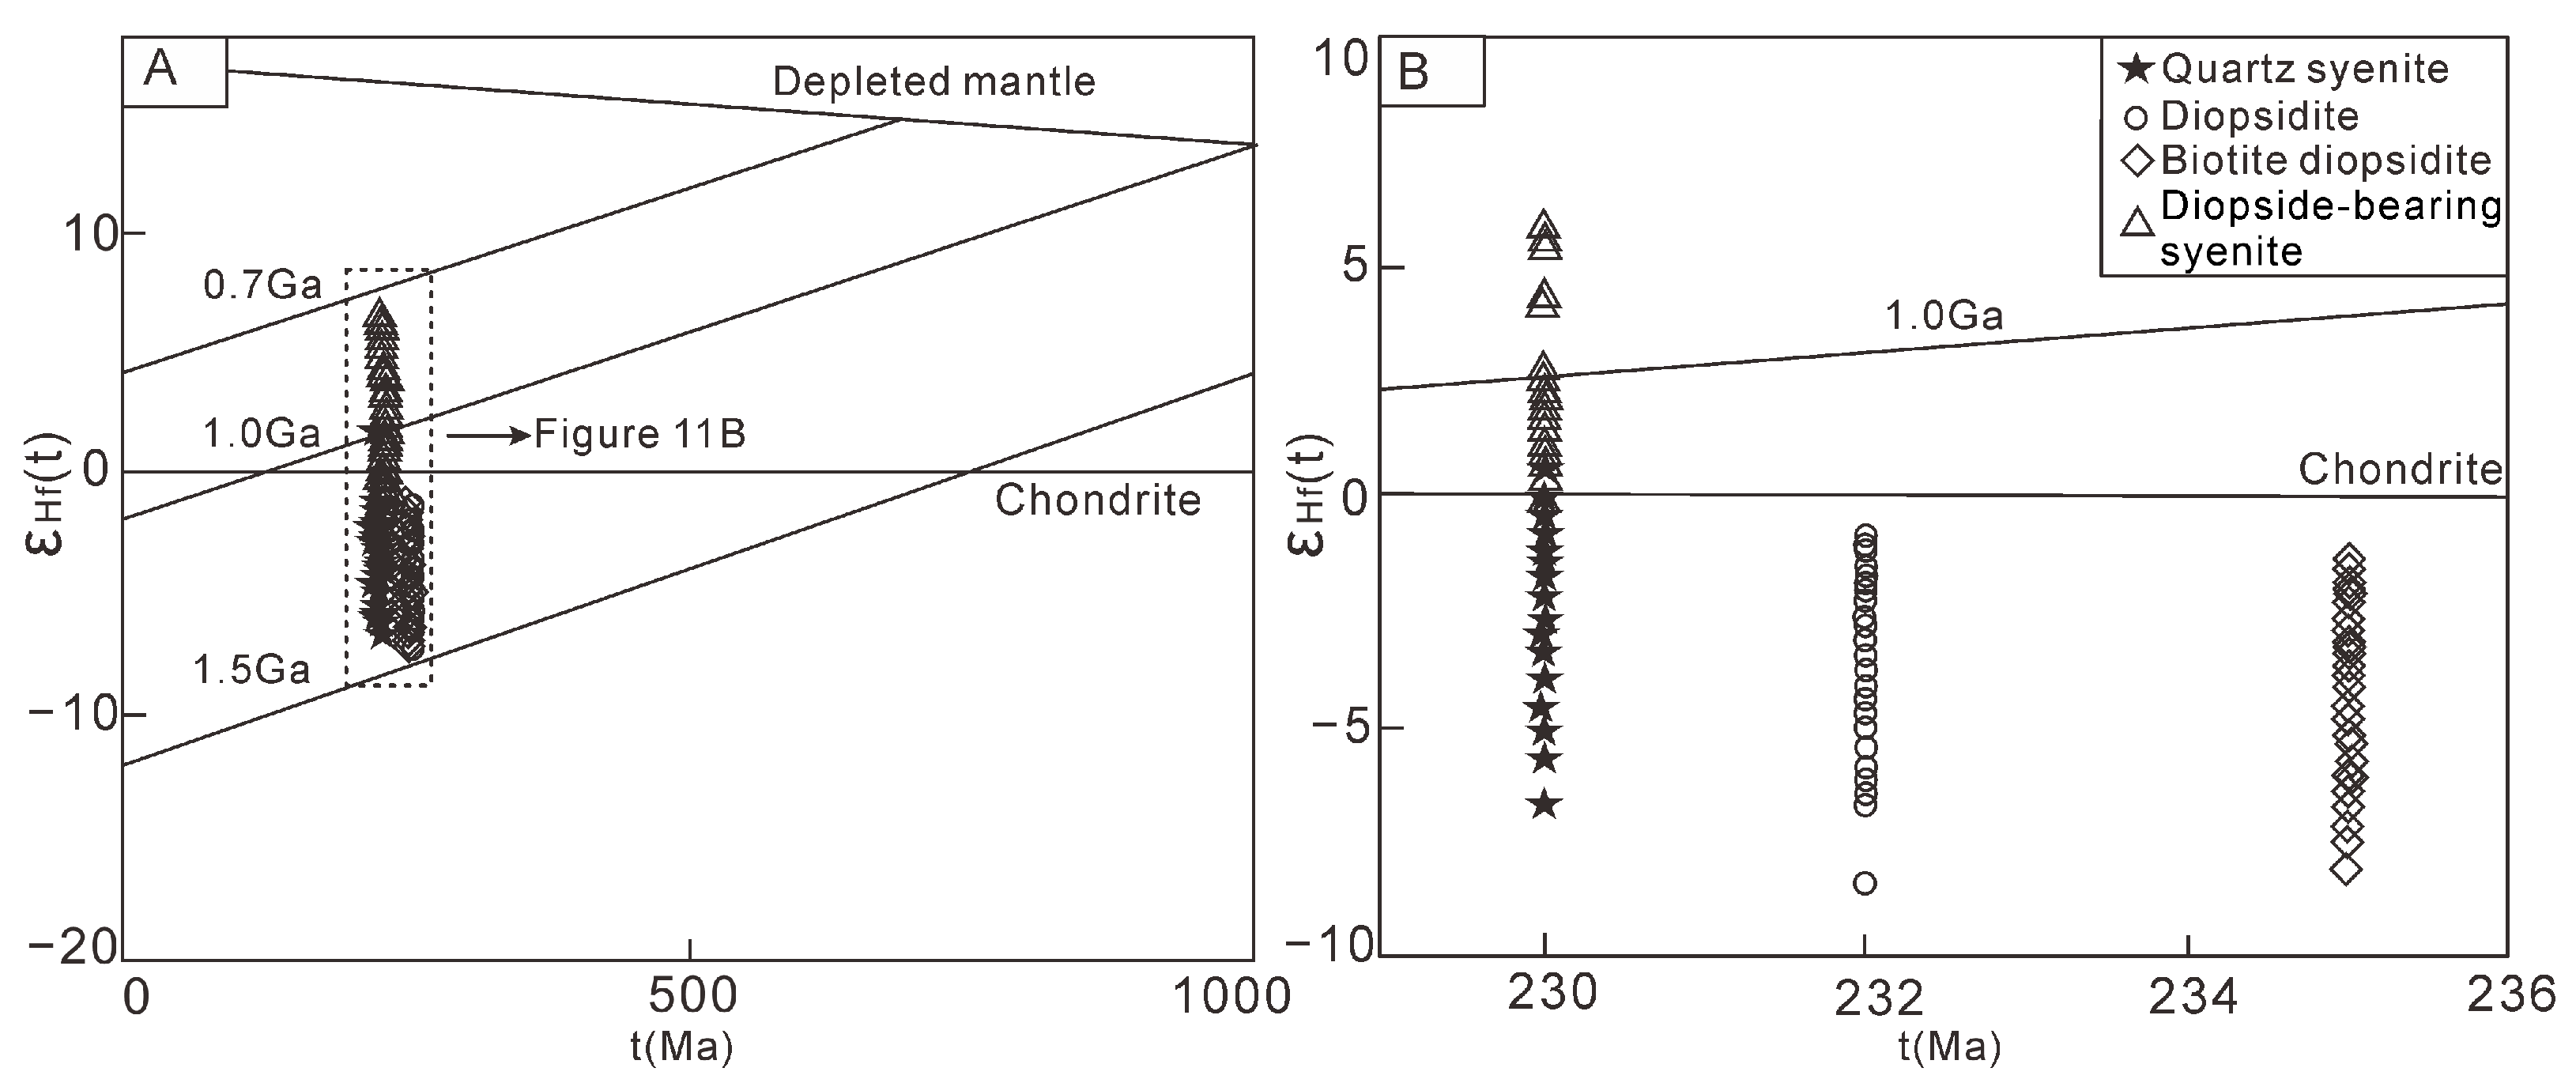
5.1. Zircon U–Pb Ages and Hf Isotope Composition
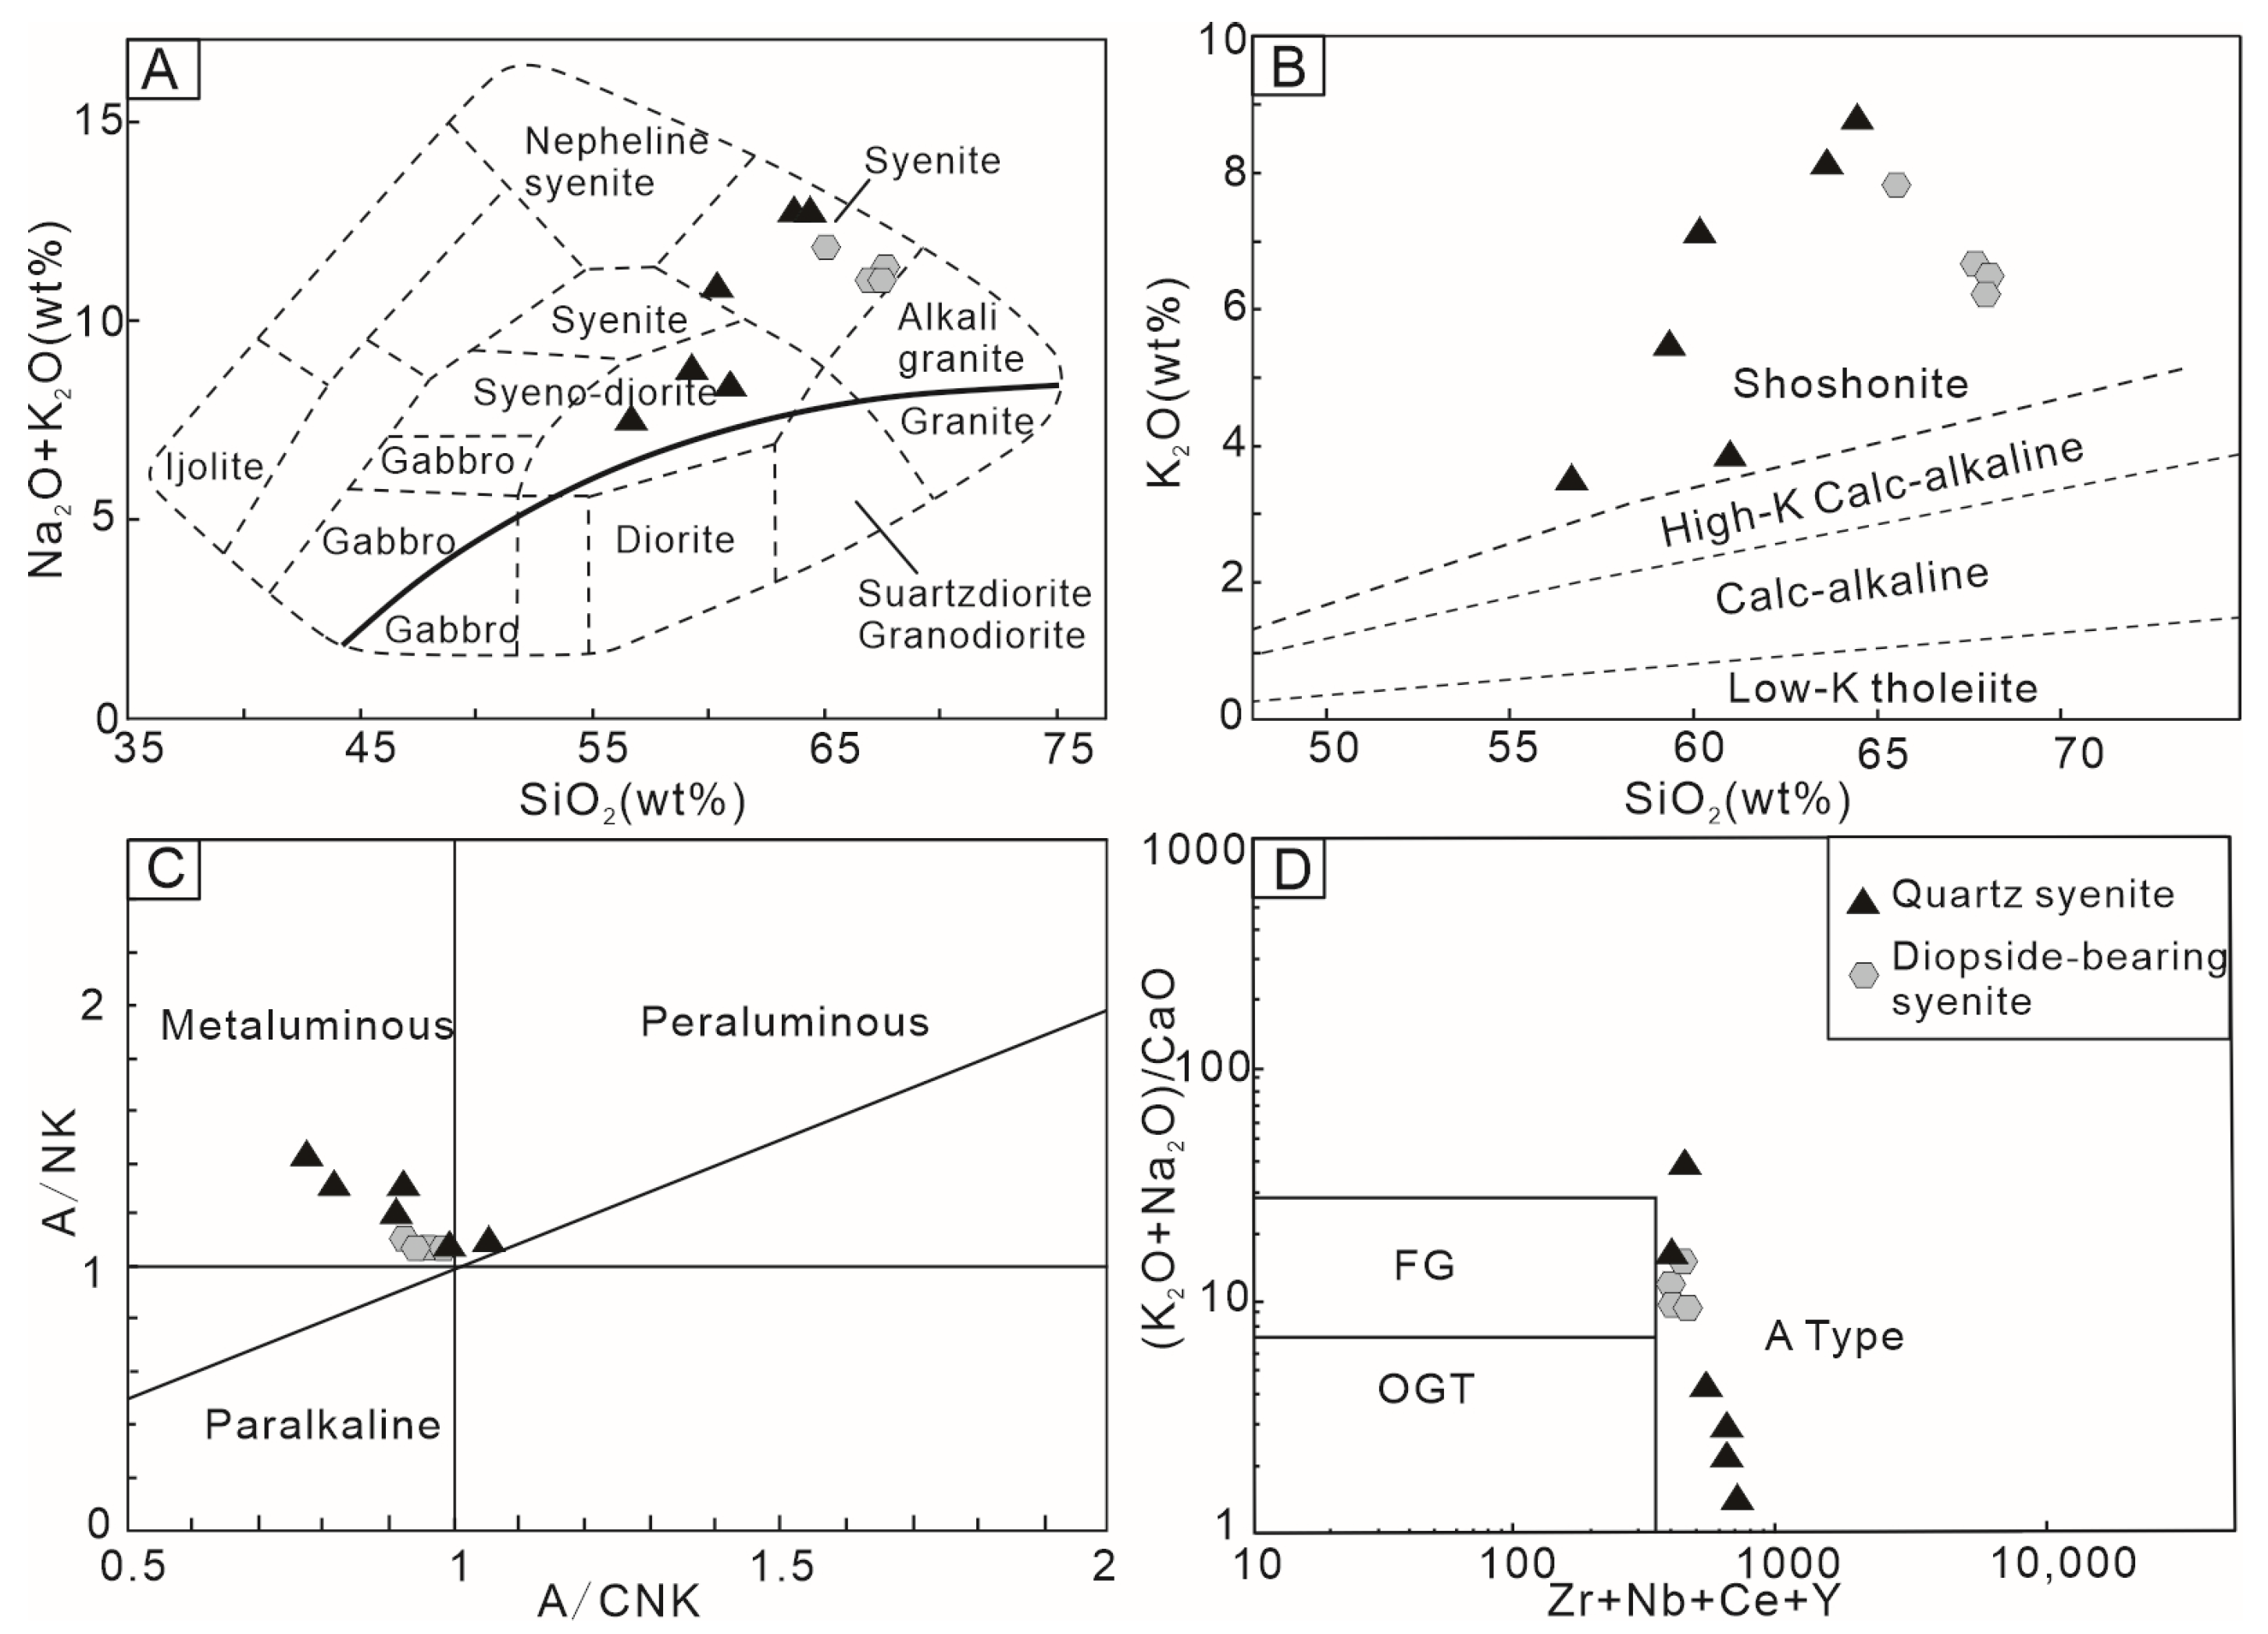
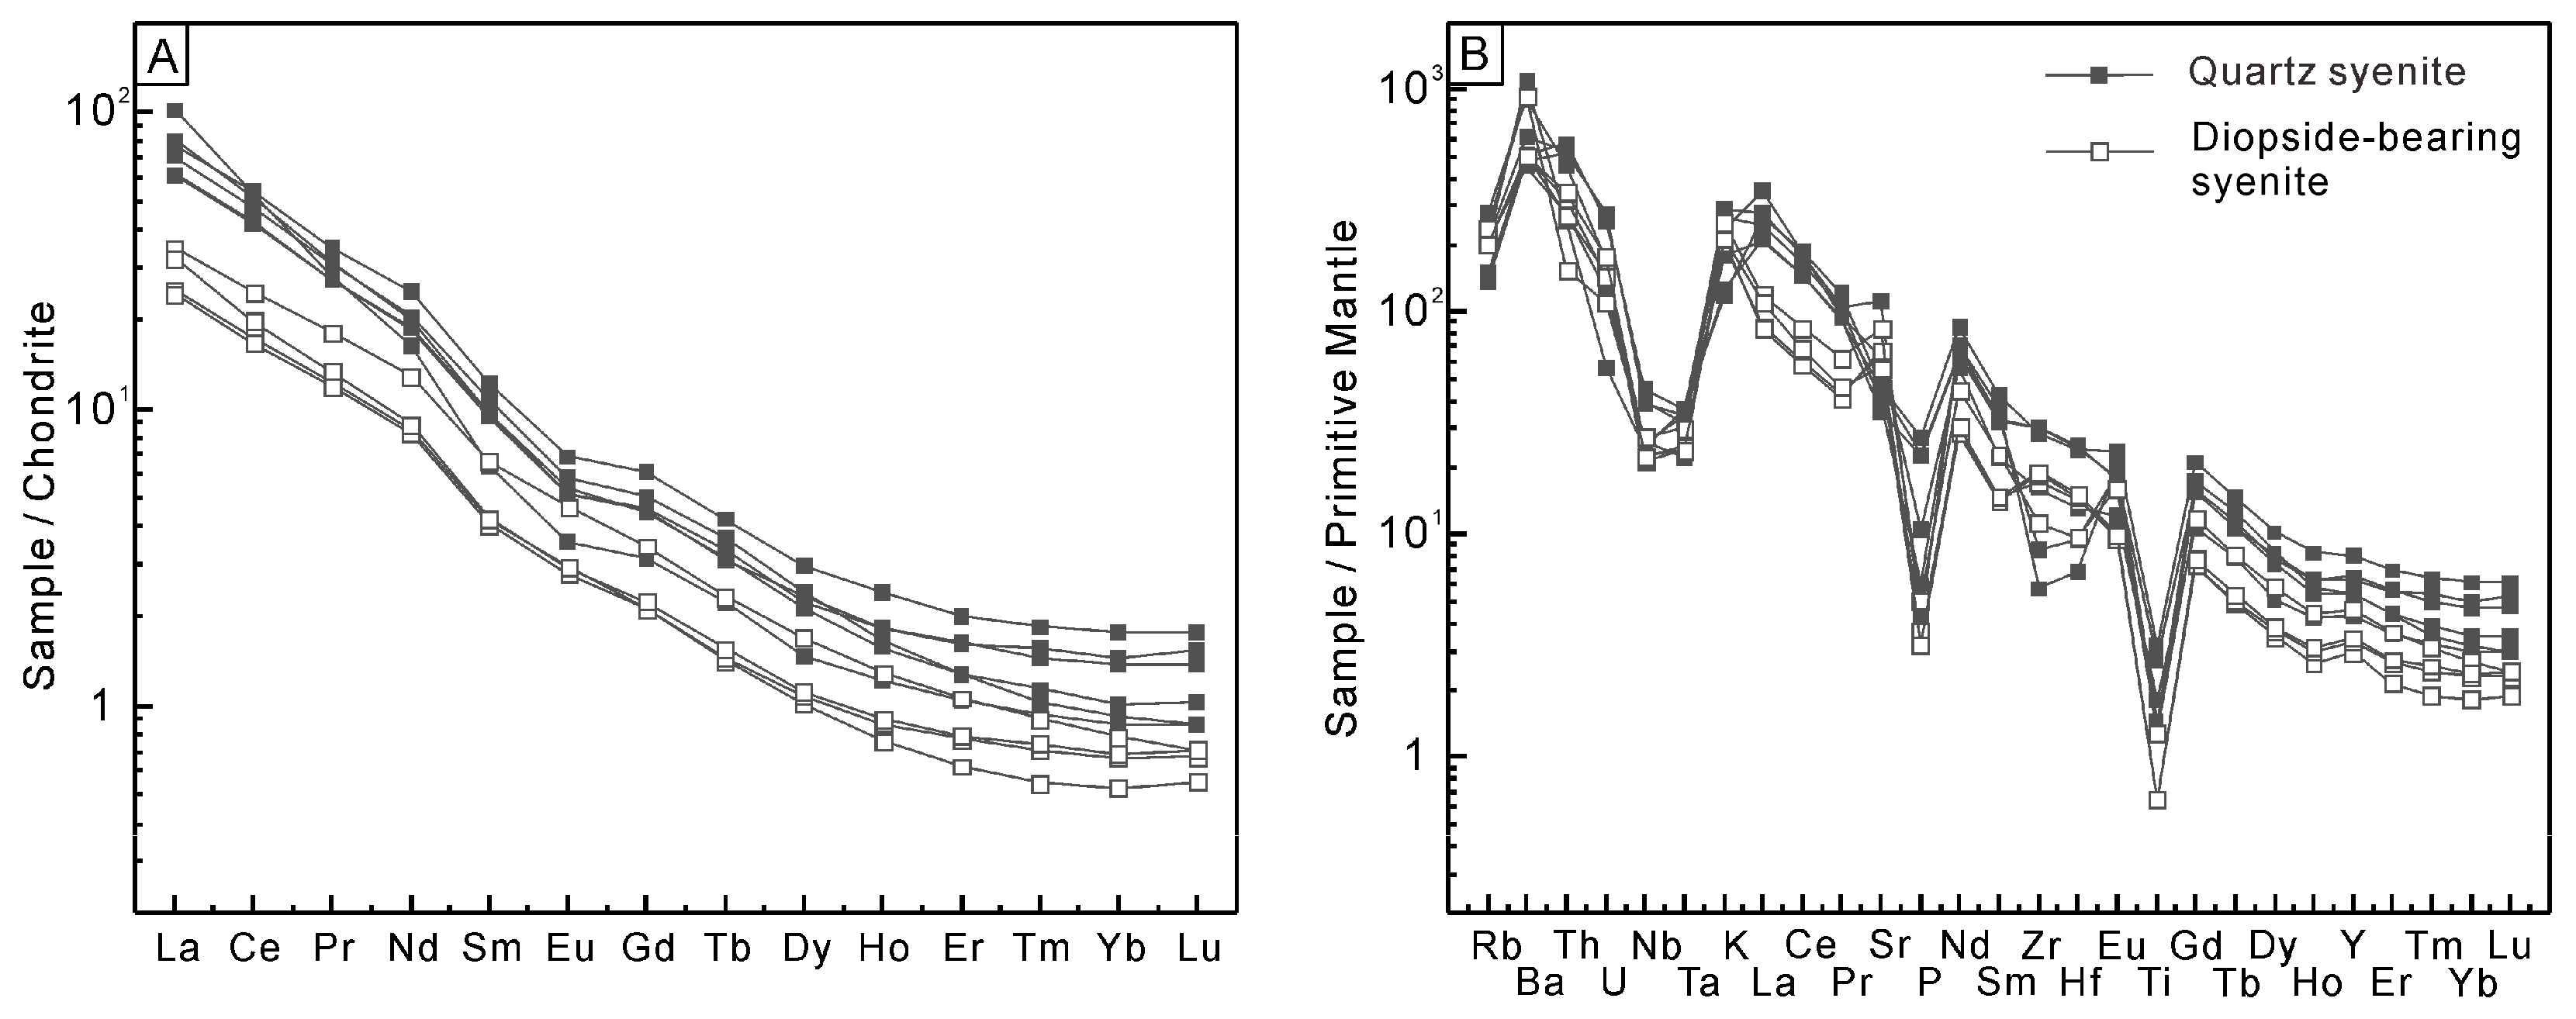
5.2. Rock Geochemistry
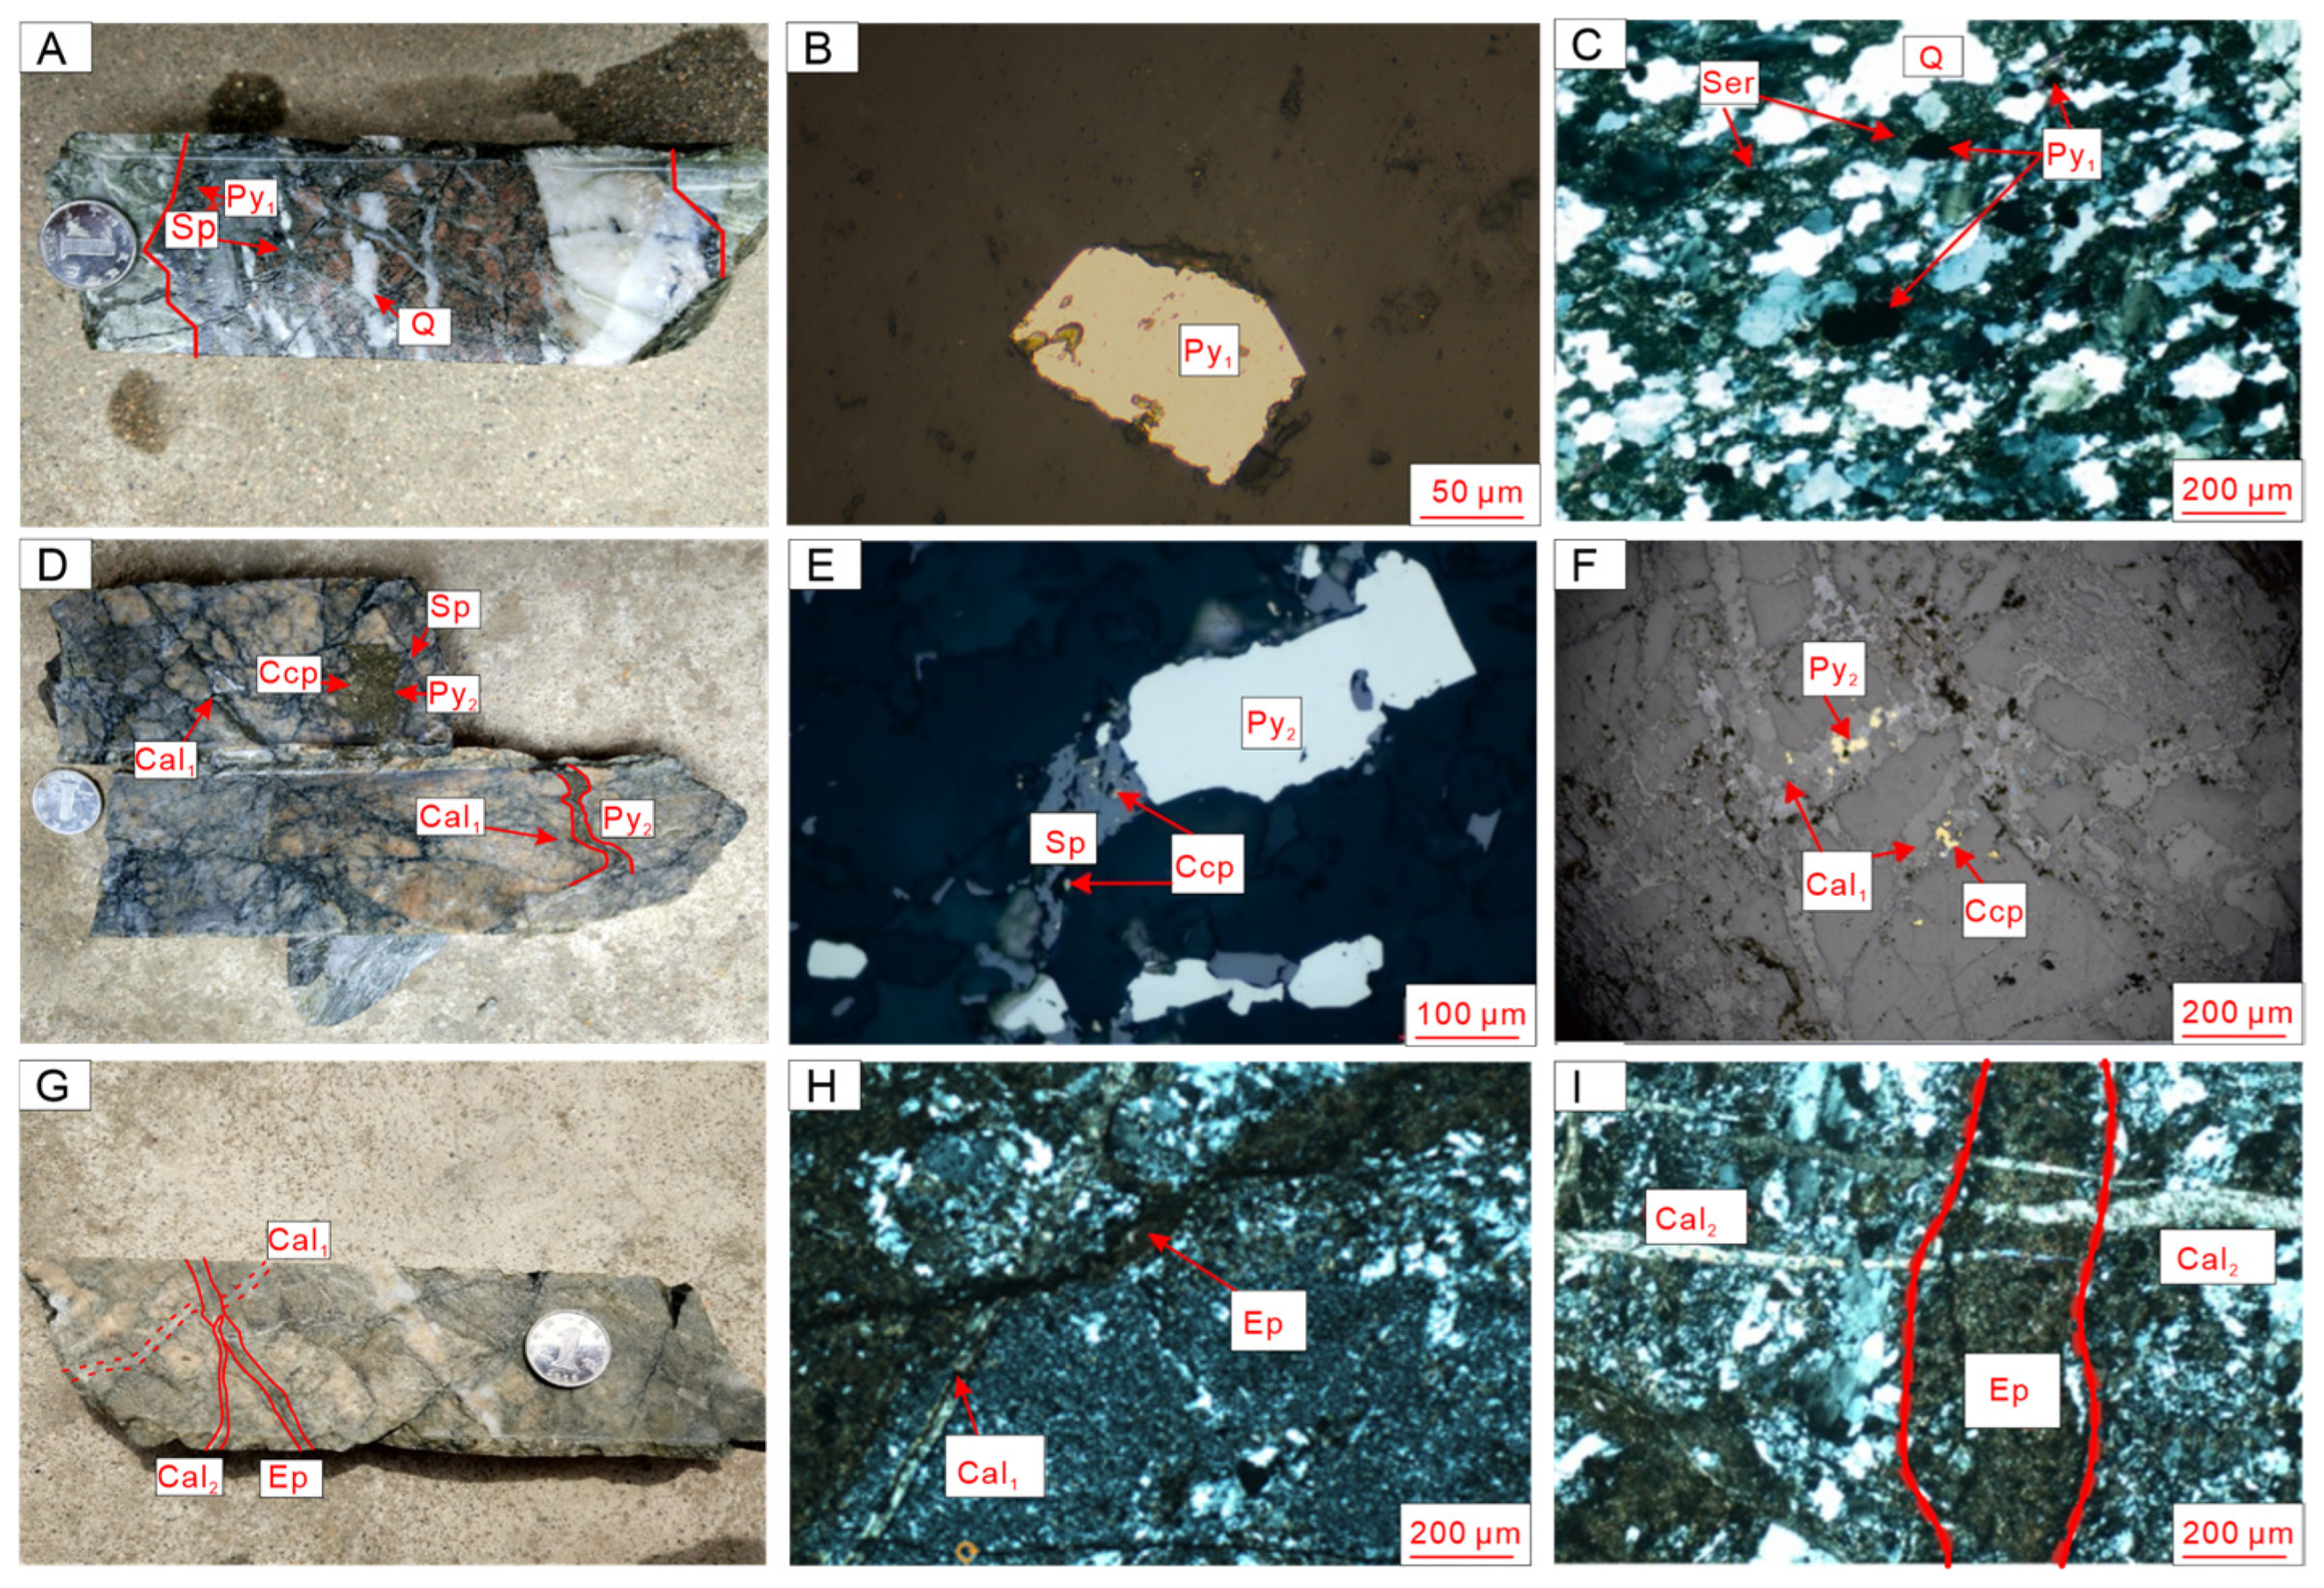
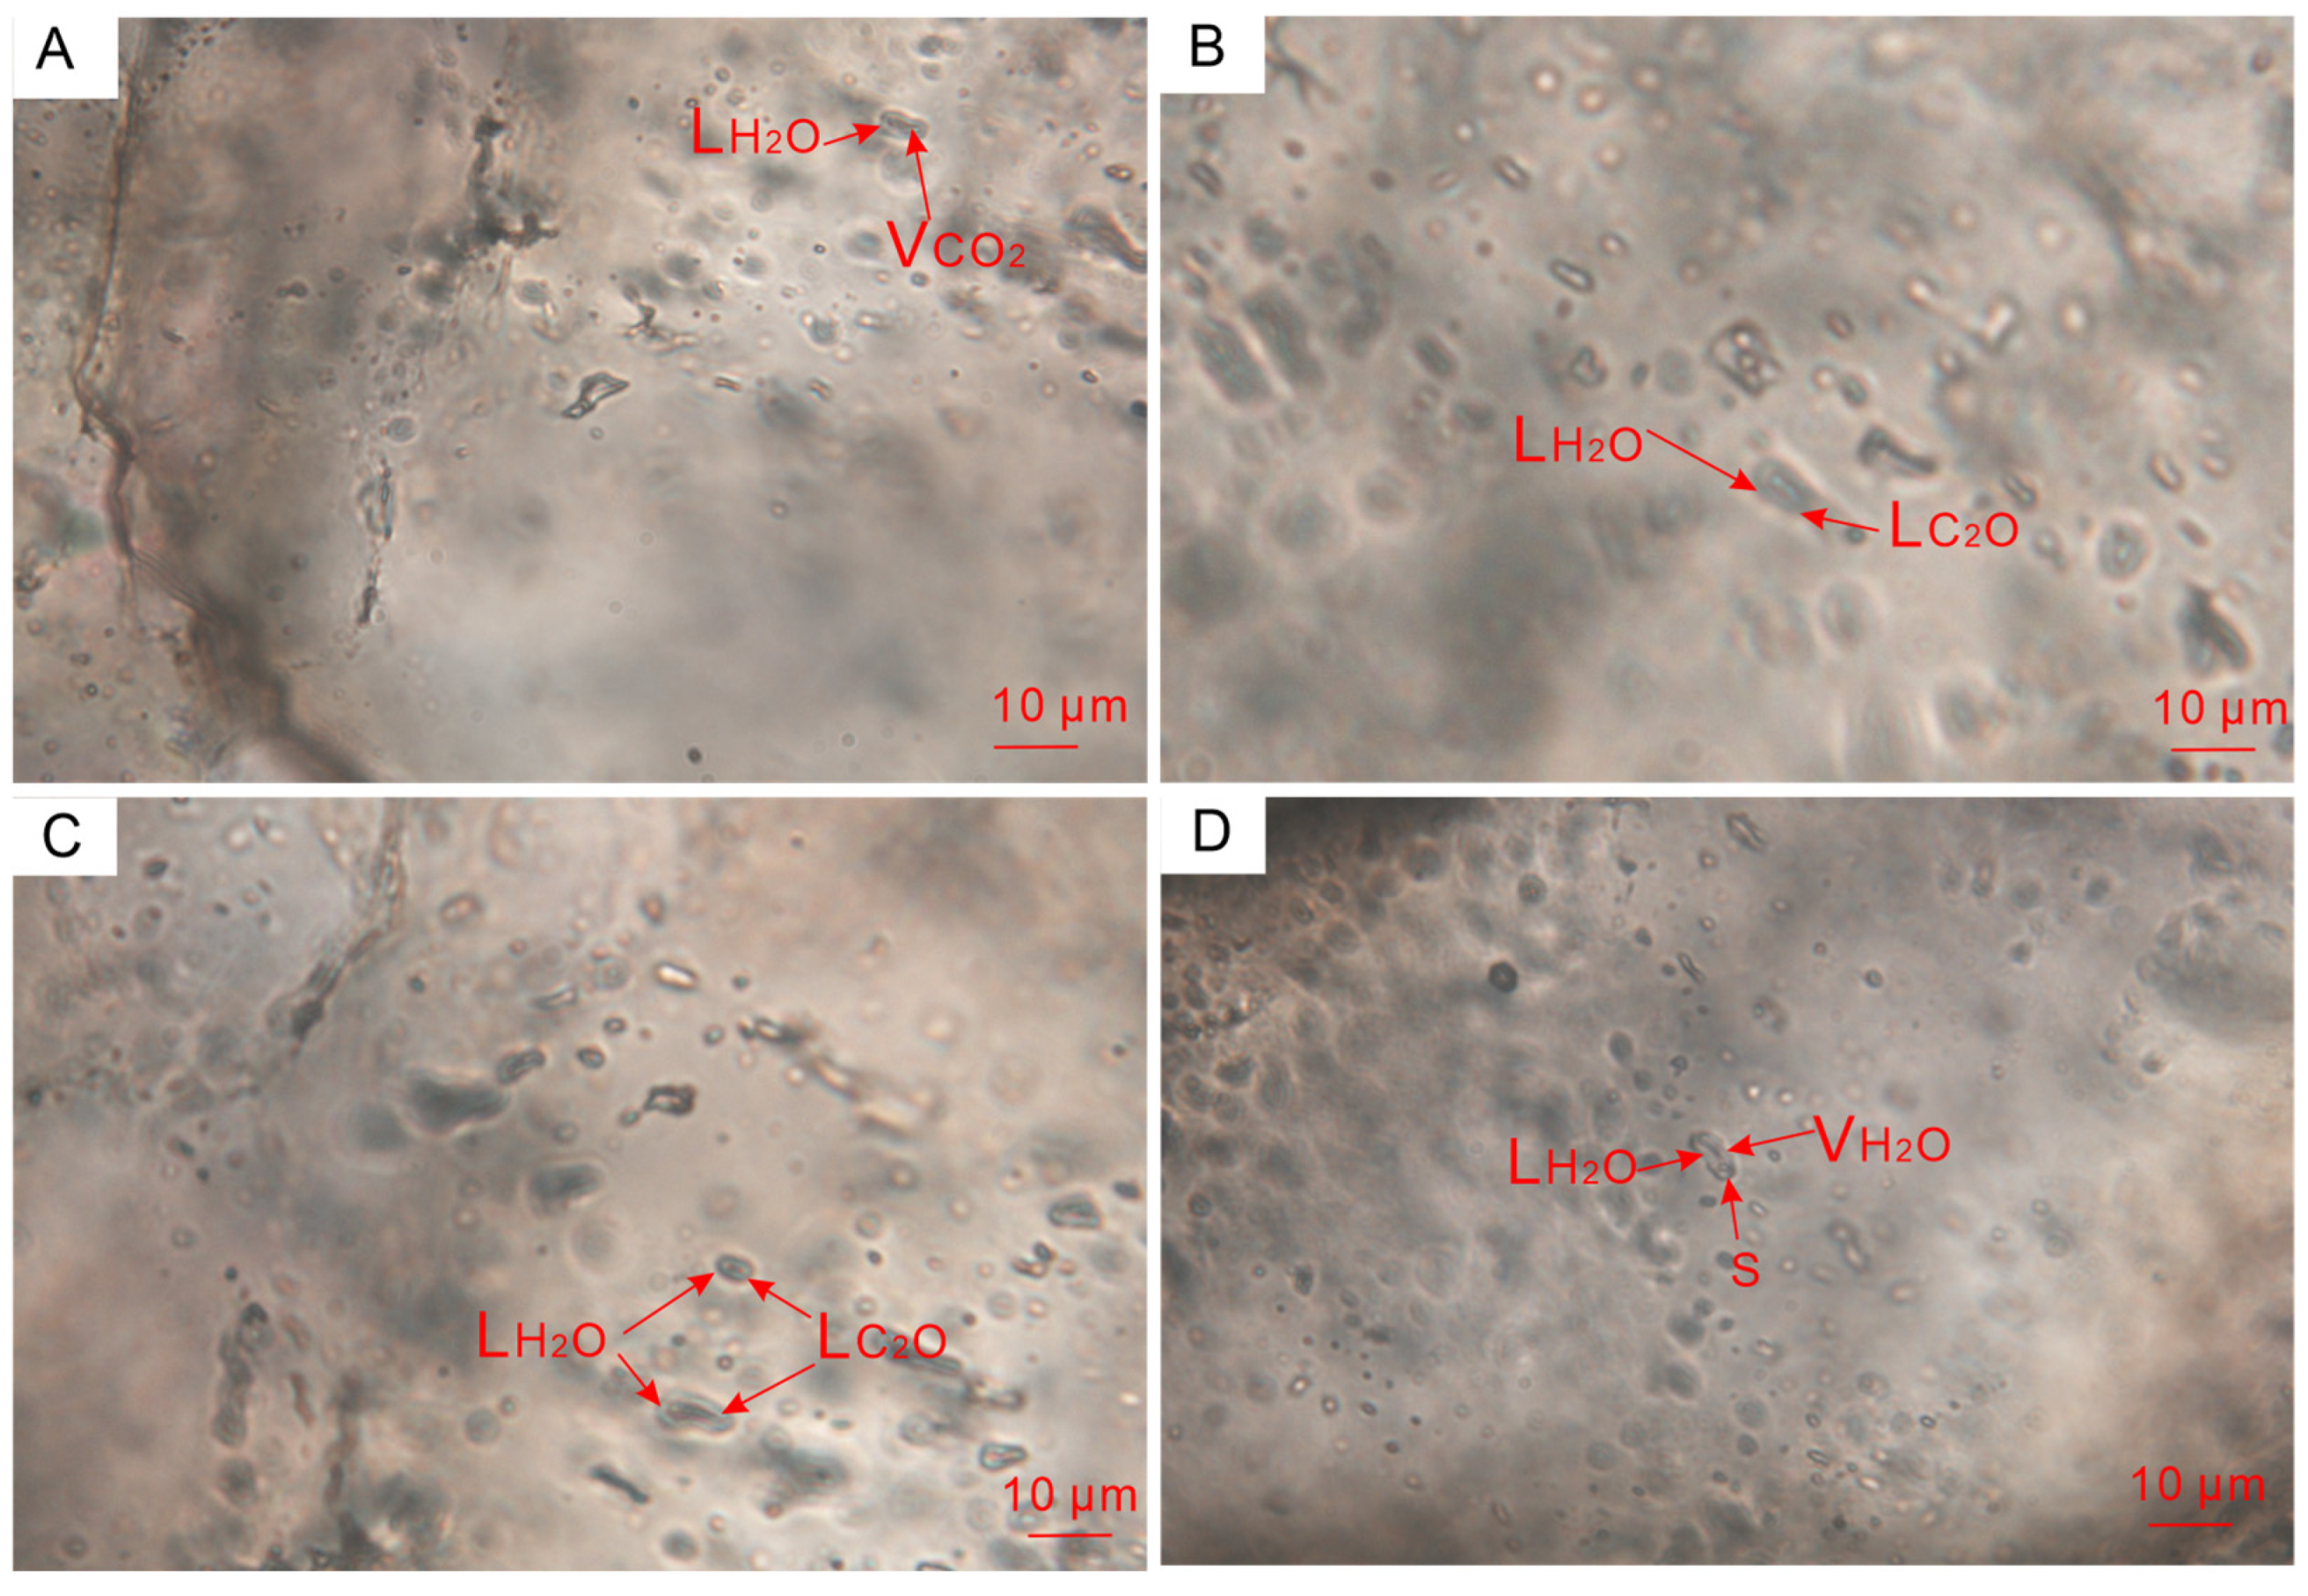
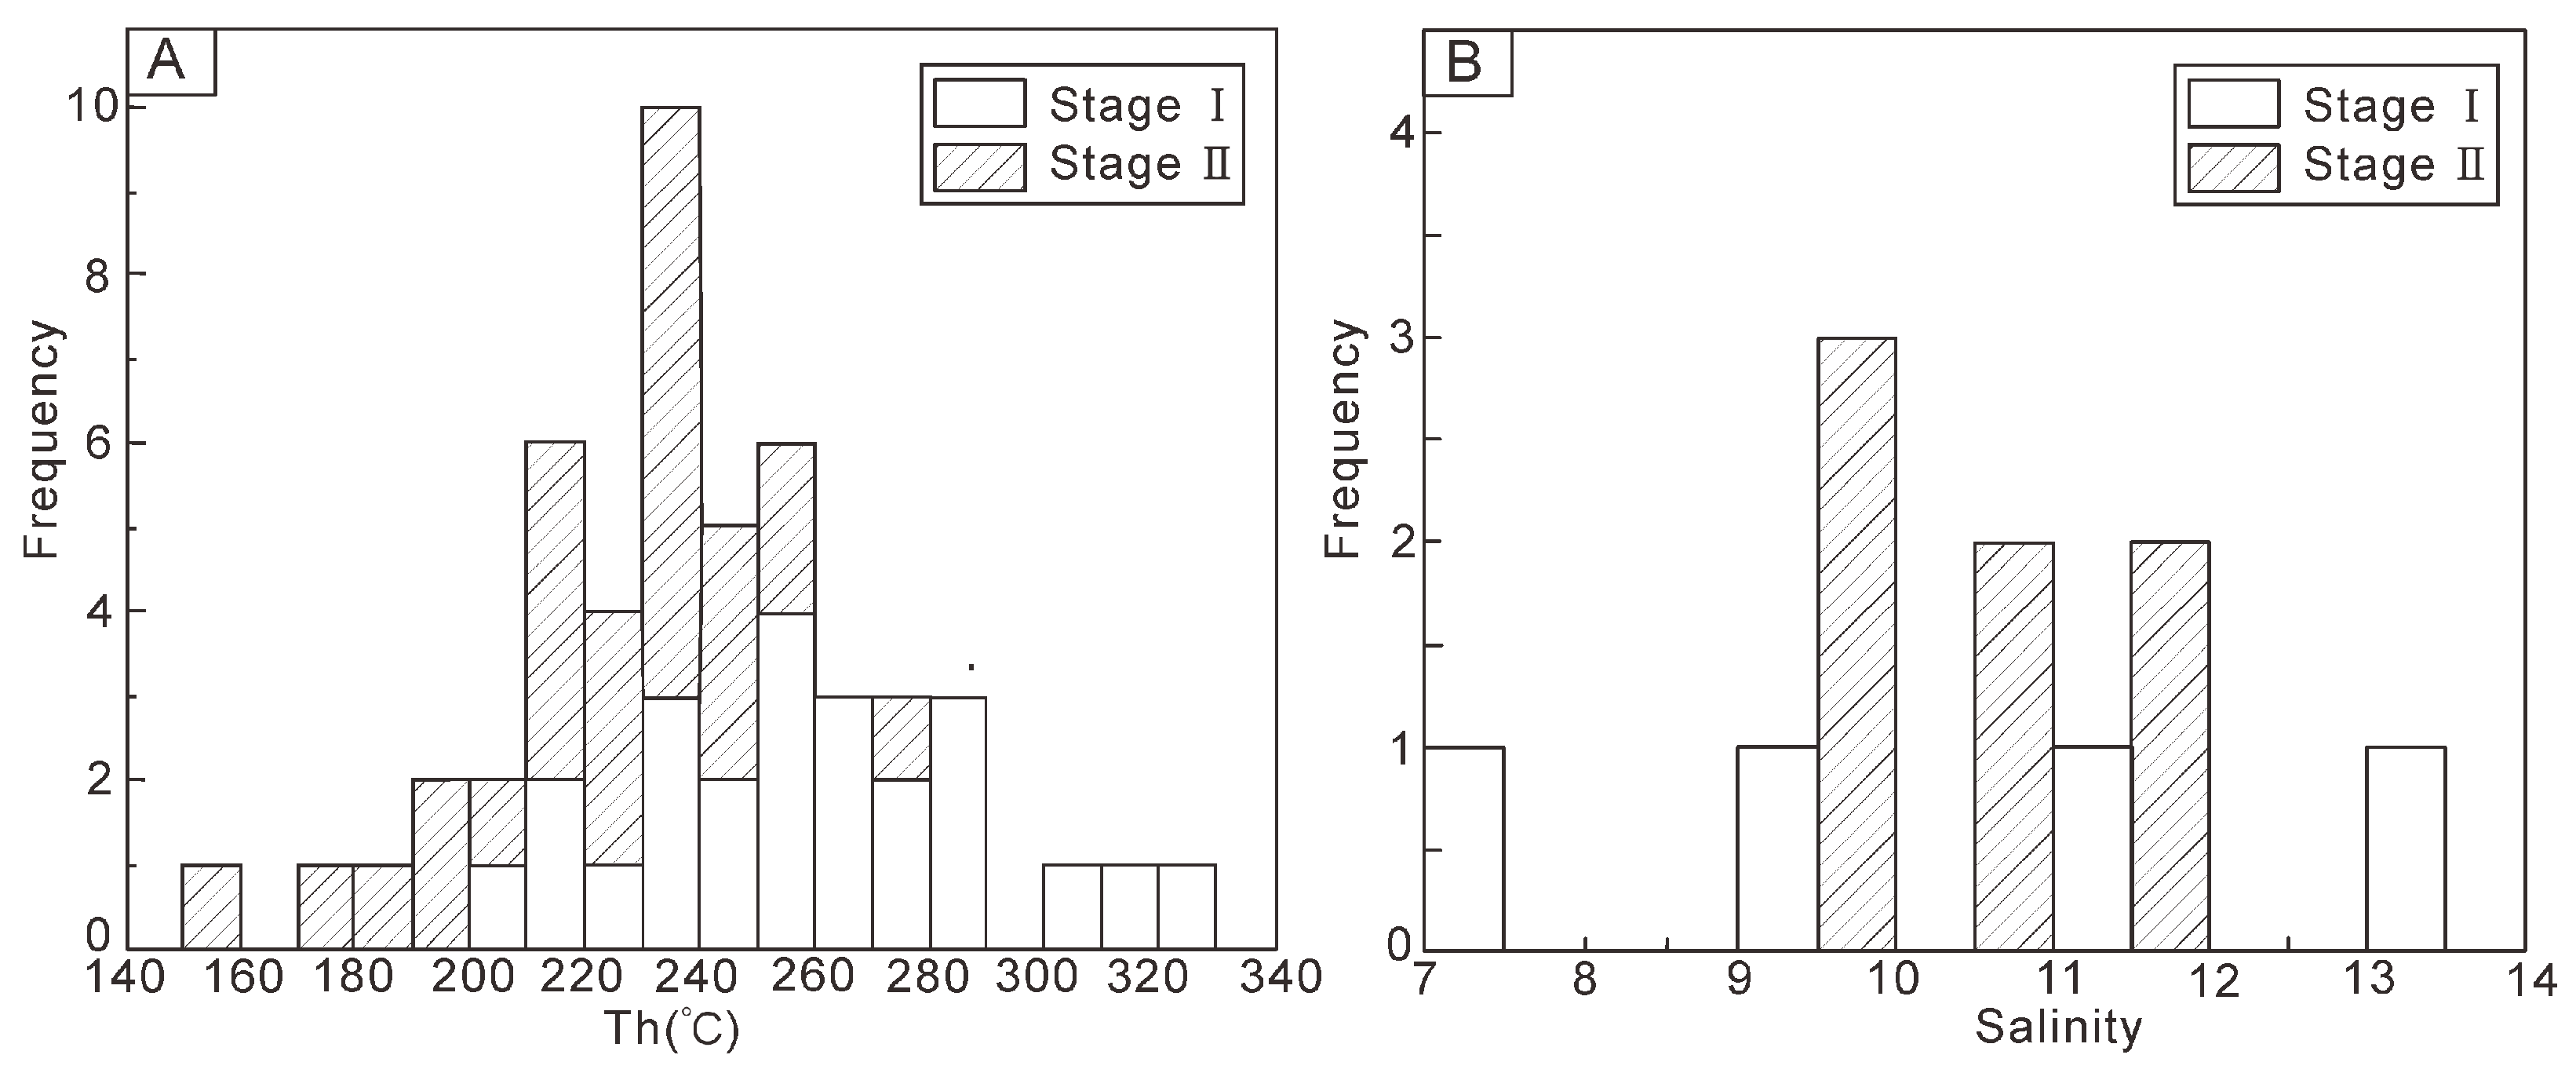
5.3. Fluid Geochemistry
5.4. In Situ Sulfur Isotope Composition of Pyrite
6. Discussion
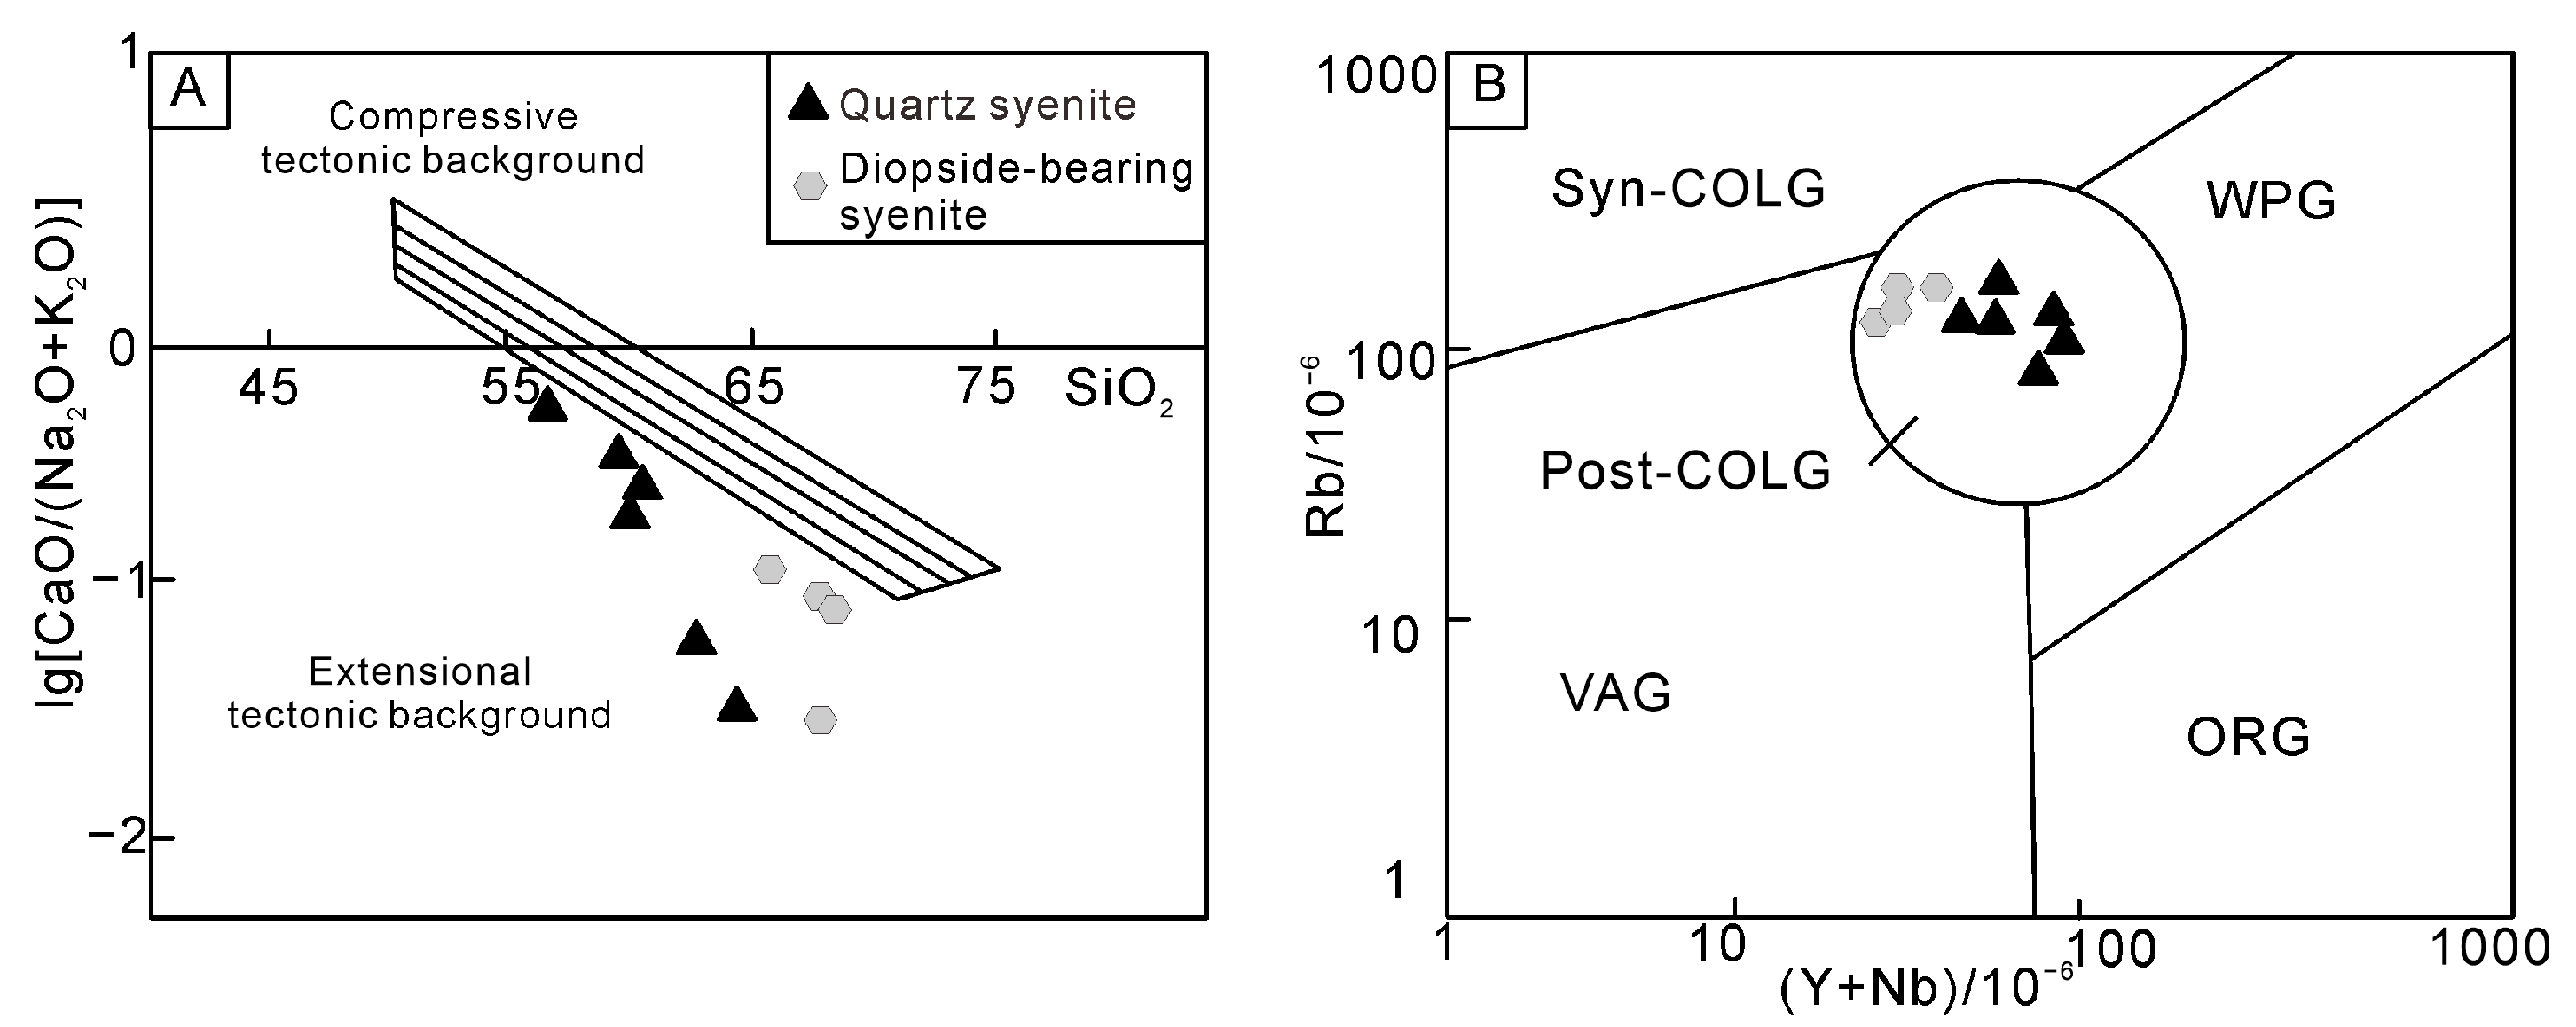
6.1. Genesis of Ore-Bearing Quartz Syenite and Its Tectonic Implication
6.2. Relationship between Quartz Syenite and Gold Mineralization
7. Conclusions
Author Contributions
Funding
Data Availability Statement
Acknowledgments
Conflicts of Interest
Appendix A

| Spot No. | Content/ppm | 207Pb/206Pb | 207Pb/235U | 206Pb/238U | 207Pb/206Pb | 207Pb/235U | 206Pb/238U | |||||||||
|---|---|---|---|---|---|---|---|---|---|---|---|---|---|---|---|---|
| U | Th | Pb | Th/U | Ratio | 1σ | Ratio | 1σ | Ratio | 1σ | Age | 1σ | Age | 1σ | Age | 1σ | |
| No.1 | 181 | 259 | 17.3 | 1.43 | 0.05473 | 0.00199 | 0.27235 | 0.00819 | 0.03667 | 0.00053 | 466 | 81 | 245 | 7 | 232 | 3 |
| No.2 | 627 | 609 | 46.6 | 0.97 | 0.05172 | 0.00136 | 0.26284 | 0.00629 | 0.03695 | 0.00046 | 272 | 59 | 237 | 5 | 234 | 3 |
| No.3 | 748 | 820 | 60.4 | 1.09 | 0.05313 | 0.00115 | 0.26769 | 0.00581 | 0.03656 | 0.00037 | 345 | 50 | 241 | 5 | 231 | 3 |
| No.4 | 1274 | 958 | 85.1 | 0.75 | 0.05029 | 0.00131 | 0.25228 | 0.00666 | 0.03633 | 0.00043 | 209 | 94 | 228 | 5 | 230 | 3 |
| No.6 | 1497 | 1071 | 93 | 0.71 | 0.05158 | 0.00124 | 0.26096 | 0.00668 | 0.03657 | 0.00031 | 265 | 56 | 235 | 5 | 232 | 2 |
| No.7 | 919 | 880 | 66.8 | 0.95 | 0.05537 | 0.00102 | 0.28097 | 0.00564 | 0.03673 | 0.0005 | 428 | 45 | 251 | 4 | 233 | 3 |
| No.8 | 1074 | 1137 | 82.8 | 1.05 | 0.05289 | 0.00099 | 0.26991 | 0.00505 | 0.03695 | 0.00036 | 324 | 43 | 243 | 4 | 234 | 2 |
| No.10 | 574 | 587 | 43.9 | 1.02 | 0.05205 | 0.00126 | 0.25865 | 0.00664 | 0.03603 | 0.00046 | 287 | 56 | 234 | 5 | 228 | 3 |
| No.11 | 1233 | 894 | 75.7 | 0.72 | 0.05092 | 0.00086 | 0.25275 | 0.00436 | 0.03593 | 0.00031 | 235 | 39 | 229 | 4 | 228 | 2 |
| No.13 | 460 | 620 | 41.8 | 1.32 | 0.05491 | 0.0013 | 0.27372 | 0.00659 | 0.03618 | 0.00043 | 409 | 54 | 246 | 5 | 229 | 3 |
| No.14 | 1249 | 992 | 88.1 | 0.73 | 0.05727 | 0.00319 | 0.28469 | 0.01538 | 0.03599 | 0.00087 | 501 | 122 | 254 | 12 | 228 | 5 |
| No.15 | 169 | 420 | 23.4 | 2.48 | 0.05424 | 0.00151 | 0.2686 | 0.00786 | 0.0361 | 0.00062 | 389 | 63 | 242 | 6 | 229 | 4 |
| No.16 | 241 | 396 | 24.8 | 1.64 | 0.05481 | 0.00651 | 0.26891 | 0.03092 | 0.03574 | 0.00085 | 406 | 264 | 242 | 25 | 226 | 5 |
| No.17 | 1744 | 1014 | 102 | 0.58 | 0.05088 | 0.00118 | 0.2537 | 0.00678 | 0.03608 | 0.00058 | 235 | 49 | 230 | 5 | 229 | 4 |
| No.18 | 374 | 968 | 49.5 | 2.58 | 0.0516 | 0.00091 | 0.26408 | 0.0052 | 0.03698 | 0.000382 | 333 | 38 | 238 | 4 | 234 | 2 |
| No.20 | 906 | 746 | 62.9 | 0.828 | 0.05523 | 0.00109 | 0.27166 | 0.00517 | 0.03568 | 0.0003 | 420 | 44 | 244 | 4 | 226 | 2 |
| No.21 | 662 | 634 | 43.5 | 0.95 | 0.05251 | 0.00122 | 0.26702 | 0.00636 | 0.03686 | 0.00037 | 309 | 562 | 240 | 5 | 233 | 2 |
| No.22 | 213 | 394 | 23.6 | 1.84 | 0.05156 | 0.00139 | 0.2555 | 0.00674 | 0.03598 | 0.00031 | 265 | 58 | 231 | 5 | 228 | 2 |
| No.23 | 638 | 601 | 49 | 0.94 | 0.05602 | 0.00137 | 0.28401 | 0.00755 | 0.03662 | 0.00038 | 454 | 54 | 254 | 6 | 232 | 2 |
| No.24 | 398 | 396 | 30.9 | 0.99 | 0.05478 | 0.00214 | 0.27394 | 0.01035 | 0.03629 | 0.0004 | 467 | 82 | 246 | 8 | 230 | 2 |
| Analysis No. | Age | 2α | εHf | εHf (t) | tDM (Hf) | tDM (C) | fLu/Hf | |||
|---|---|---|---|---|---|---|---|---|---|---|
| LH-4-1 | 232 ± 3 | 0.025914 | 0.0011569 | 0.282589 | 0.000022 | −6.47 | −1.44 | 942 | 1359 | −0.97 |
| LH-4-2 | 234 ± 3 | 0.034333 | 0.0015881 | 0.282555 | 0.000025 | −7.67 | −2.72 | 1002 | 1440 | −0.95 |
| LH-4-3 | 231 ± 3 | 0.046215 | 0.0019609 | 0.282566 | 0.000029 | −7.28 | −2.4 | 996 | 1419 | −0.94 |
| LH-4-4 | 230 ± 3 | 0.050392 | 0.0020349 | 0.282564 | 0.000037 | −7.37 | −2.47 | 1002 | 1426 | −0.94 |
| LH-4-5 | 232 ± 2 | 0.033383 | 0.0016093 | 0.282556 | 0.000026 | −7.65 | −2.68 | 1002 | 1440 | −0.95 |
| LH-4-6 | 233 ± 3 | 0.046072 | 0.0020993 | 0.282594 | 0.000022 | −6.31 | −1.44 | 960 | 1359 | −0.94 |
| LH-4-7 | 234 ± 2 | 0.028519 | 0.0013355 | 0.282535 | 0.000019 | −8.37 | −3.39 | 1023 | 1482 | −0.96 |
| LH-4-8 | 228 ± 3 | 0.015010 | 0.0006804 | 0.282554 | 0.000024 | −7.72 | −2.61 | 980 | 1435 | −0.98 |
| LH-4-9 | 228 ± 2 | 0.019341 | 0.0007752 | 0.282484 | 0.000036 | −10.2 | −5.12 | 1080 | 1592 | −0.98 |
| LH-4-10 | 229 ± 3 | 0.004002 | 0.0001692 | 0.282568 | 0.000021 | −7.23 | −2.04 | 948 | 1399 | −0.99 |
| LH-4-11 | 228 ± 5 | 0.011150 | 0.0004350 | 0.282571 | 0.000024 | −7.13 | −1.97 | 950 | 1394 | −0.99 |
| LH-6-1 | 229 ± 4 | 0.050771 | 0.0020629 | 0.282705 | 0.000028 | −2.36 | 2.52 | 797 | 1107 | −0.94 |
| LH-6-2 | 226 ± 5 | 0.004477 | 0.0001959 | 0.282437 | 0.000028 | −11.84 | −6.68 | 1128 | 1692 | −0.99 |
| LH-6-3 | 229 ± 4 | 0.004669 | 0.0001967 | 0.282464 | 0.000034 | −10.9 | −5.72 | 1091 | 1631 | −0.99 |
| LH-6-4 | 234 ± 2 | 0.007766 | 0.0003070 | 0.282531 | 0.000037 | −8.53 | −3.35 | 1002 | 1482 | −0.99 |
| LH-6-5 | 226 ± 2 | 0.012339 | 0.0004776 | 0.282575 | 0.000032 | −6.96 | −1.83 | 945 | 1384 | −0.99 |
| LH-6-6 | 233 ± 2 | 0.038755 | 0.0014199 | 0.282629 | 0.000040 | −5.05 | −0.06 | 892 | 1272 | −0.96 |
| LH-6-7 | 228 ± 2 | 0.050945 | 0.0018332 | 0.282586 | 0.000023 | −6.58 | −1.65 | 964 | 1373 | −0.94 |
| LH-6-8 | 232 ± 2 | 0.021080 | 0.0008728 | 0.282610 | 0.000030 | −5.74 | −0.66 | 906 | 1310 | −0.97 |
| LH-6-9 | 230 ± 2 | 0.011014 | 0.0004390 | 0.282515 | 0.000029 | −9.11 | −3.95 | 1028 | 1520 | −0.99 |
| LH-6-10 | 234 ± 2 | 0.053334 | 0.0019466 | 0.282612 | 0.000025 | −5.65 | −0.73 | 929 | 1315 | −0.94 |
| LH-6-11 | 228 ± 3 | 0.027761 | 0.0010363 | 0.282632 | 0.000034 | −4.95 | 0.08 | 879 | 1262 | −0.97 |
| LH-6-12 | 228 ± 2 | 0.008001 | 0.0003248 | 0.282605 | 0.000063 | −5.92 | −0.77 | 900 | 1316 | −0.99 |
| Sample No. | L7-2 | L7-7 | L8-7 | YFG-11 | YFG-15 | YFG-16 |
|---|---|---|---|---|---|---|
| SiO2 | 63.64 | 64.42 | 60.19 | 56.68 | 59.25 | 60.94 |
| TiO2 | 0.31 | 0.28 | 0.39 | 0.69 | 0.59 | 0.61 |
| Al2O3 | 17.65 | 17.48 | 16.58 | 14.7 | 14.88 | 15.29 |
| MgO | 0.44 | 0.52 | 1.33 | 2.97 | 2.64 | 2.82 |
| CaO | 0.72 | 0.29 | 2.39 | 4.76 | 3.76 | 2.69 |
| Na2O | 4.63 | 3.95 | 3.71 | 3.92 | 3.32 | 4.54 |
| K2O | 8.09 | 8.75 | 7.08 | 3.55 | 5.42 | 3.84 |
| Na2O+K2O | 12.72 | 12.7 | 10.79 | 7.47 | 8.74 | 8.38 |
| K2O/Na2O | 1.75 | 2.22 | 1.91 | 0.91 | 1.63 | 0.85 |
| Mg# | 55.31 | 72.78 | 68.52 | 61.27 | 64.46 | 65.19 |
| A/CNK | 1 | 1.06 | 0.91 | 0.77 | 0.82 | 0.92 |
| A/NK | 1.08 | 1.09 | 1.2 | 1.43 | 1.31 | 1.31 |
| δ | 7.84 | 7.53 | 6.77 | 4.08 | 4.7 | 3.91 |
| Cs | 1.17 | 1.45 | 1.3 | 1.09 | 2.03 | 0.92 |
| Rb | 131 | 175.5 | 131 | 95.7 | 133.5 | 87.3 |
| Ba | 7590 | 6280 | 3160 | 3570 | 4290 | 3350 |
| Th | 21.7 | 38.6 | 23.8 | 48.4 | 44.7 | 43.7 |
| U | 1.18 | 3.54 | 2.61 | 5.41 | 5.75 | 5.78 |
| V | 44 | 43 | 88 | 143 | 108 | 111 |
| Cr | 10 | 10 | 40 | 40 | 40 | 30 |
| Ga | 17.5 | 18 | 16.5 | 20.1 | 18.8 | 19.2 |
| Sr | 2350 | 842 | 1320 | 994 | 973 | 755 |
| Y | 24.8 | 24.5 | 19.5 | 36.8 | 29.5 | 28.4 |
| Zr | 64 | 96 | 180 | 321 | 336 | 339 |
| Nb | 17.4 | 18.3 | 18.5 | 32 | 28.4 | 27.4 |
| La | 168 | 190.5 | 241 | 184 | 144 | 146 |
| Ce | 294 | 318 | 327 | 333 | 257 | 261 |
| Pr | 29.3 | 29.7 | 26.8 | 33.4 | 25.8 | 26 |
| Nd | 95.8 | 93.7 | 75.9 | 115.5 | 88.2 | 86.9 |
| Sm | 16.5 | 14.75 | 9.83 | 18.6 | 14.65 | 14.35 |
| Eu | 3.41 | 3.13 | 2.06 | 4 | 3.01 | 2.98 |
| Gd | 10.4 | 9.23 | 6.43 | 12.6 | 9.55 | 9.31 |
| Tb | 1.37 | 1.17 | 0.84 | 1.59 | 1.24 | 1.15 |
| Dy | 6.12 | 5.44 | 3.74 | 7.52 | 5.7 | 5.9 |
| Ho | 0.94 | 0.89 | 0.69 | 1.36 | 1.03 | 1.03 |
| Er | 2.11 | 2.11 | 1.72 | 3.31 | 2.72 | 2.68 |
| Tm | 0.26 | 0.29 | 0.24 | 0.47 | 0.37 | 0.4 |
| Yb | 1.56 | 1.73 | 1.48 | 3 | 2.33 | 2.47 |
| Lu | 0.22 | 0.26 | 0.22 | 0.45 | 0.35 | 0.39 |
| Hf | 2.1 | 2.9 | 4.1 | 7.4 | 7.6 | 7.8 |
| Ta | 1.5 | 1.4 | 0.9 | 1.5 | 1.3 | 1.4 |
| W | 2 | 8 | 2 | 3 | 2 | 2 |
| Sn | 3 | 3 | 3 | 4 | 4 | 4 |
| ΣREE | 629.99 | 670.9 | 697.95 | 718.8 | 555.95 | 560.56 |
| LREE | 607.01 | 649.78 | 682.59 | 688.5 | 532.66 | 537.23 |
| HREE | 22.98 | 21.12 | 15.36 | 30.3 | 23.29 | 23.33 |
| LREE/HREE | 26.41 | 30.77 | 44.44 | 22.72 | 22.87 | 23.03 |
| (La/Yb)N | 77.25 | 78.99 | 116.8 | 43.99 | 44.33 | 42.4 |
| δEu | 0.74 | 0.76 | 0.74 | 0.75 | 0.73 | 0.74 |
| Stage | Mineral | Size (μm) | Gas–Liquid Ratio (%) | Homogenization Temperature (°C) | Freezing Point (°C) |
|---|---|---|---|---|---|
| I | Quartz | 2 × 4 | 10 | 289 | −9.83 |
| I | Quartz | 3 × 4 | 10 | 315 | −7.72 |
| I | Quartz | 3 × 3 | 10 | 280 | |
| I | Quartz | 3 × 4 | 15 | 256 | |
| I | Quartz | 4 × 4 | 10 | 244 | |
| I | Quartz | 3 × 4 | 10 | 278 | |
| I | Quartz | 4 × 3 | 15 | 262 | |
| I | Quartz | 2 × 4 | 10 | 234 | |
| I | Quartz | 2 × 3 | 10 | 243 | |
| I | Quartz | 2 × 4 | 10 | 303 | |
| I | Quartz | 2 × 3 | 10 | 287 | |
| I | Quartz | 6 × 4 | 30 | 206 | −5 |
| I | Quartz | 3 × 3 | 10 | 254 | |
| I | Quartz | 2 × 4 | 10 | 212 | |
| I | Quartz | 4 × 7 | 10 | 273 | |
| I | Quartz | 2 × 3 | 20 | 264 | |
| I | Quartz | 2 × 4 | 10 | 211 | |
| I | Quartz | 6 × 12 | 15 | 235 | |
| I | Quartz | 4 × 10 | 30 | 258 | |
| I | Quartz | 2 × 3 | 20 | 234 | |
| I | Quartz | 3 × 4 | 25 | 255 | |
| I | Quartz | 2 × 4 | 15 | 260 | |
| I | Quartz | 4 × 6 | 10 | 227 | |
| I | Quartz | 2 × 4 | 20 | 321 | −5.92 |
| II | Quartz | 3 × 4 | 10 | 276 | |
| II | Quartz | 3 × 6 | 15 | 210 | −7.52 |
| II | Quartz | 4 × 4 | 10 | 215 | −6.98 |
| II | Quartz | 4 × 5 | 10 | 230 | |
| II | Quartz | 4 × 4 | 10 | 252 | |
| II | Quartz | 4 × 4 | 10 | 230 | −6.03 |
| II | Quartz | 3 × 4 | 10 | 244 | |
| II | Quartz | 3 × 4 | 10 | 201 | |
| II | Quartz | 4 × 4 | 10 | 229 | −8.13 |
| II | Quartz | 3 × 4 | 10 | 235 | |
| II | Quartz | 3 × 5 | 10 | 215 | |
| II | Quartz | 3 × 2 | 20 | 229 | −6.43 |
| II | Quartz | 2 × 3 | 20 | 231 | |
| II | Quartz | 2 × 4 | 10 | 211 | |
| II | Quartz | 2 × 3 | 10 | 252 | −6.83 |
| II | Quartz | 6 × 16 | 20 | 243 | |
| II | Quartz | 2 × 3 | 20 | 186 | |
| II | Quartz | 2 × 2 | 20 | 190 | |
| II | Quartz | 3 × 2 | 10 | 240 | −5.9 |
| II | Quartz | 2 × 4 | 15 | 155 | |
| II | Quartz | 2 × 6 | 20 | 237 | |
| II | Quartz | 3 × 5 | 25 | 221 | |
| II | Quartz | 2 × 5 | 15 | 230 | |
| II | Quartz | 1 × 2 | 30 | 179 | |
| II | Quartz | 2 × 3 | 30 | 193 | |
| II | Quartz | 2 × 3 | 20 | 235 |
| Sample Number | Pyrite Type | δ34S (‰) |
|---|---|---|
| Aws-55-1 | Py2 | 6.2 |
| Aws-55-2 | Py2 | 6.4 |
| Aws-55-3 | Py2 | 6.5 |
| Aws-55-4 | Py2 | 6.7 |
| Aws-55-5 | Py2 | 5.1 |
| Aws-55-6 | Py2 | 5.8 |
| Aws-55-7 | Py2 | 5.8 |
| Aws-8-1 | Py1 | 3.3 |
| Aws-8-2 | Py2 | 5.6 |
| Aws-4-1 | Py1 | 0.7 |
| Aws-4-2 | Py1 | −1.1 |
| Aws-4-3 | Py1 | 3.8 |
| Aws-21-1 | Py1 | 0.5 |
| Aws-21-2 | Py1 | 2.6 |
| Aws-21-3 | Py1 | 2.7 |
| Aws-21-4 | Py1 | 2.9 |
| Aws-21-5 | Py1 | 2.1 |
| Aws-21-5 | Py1 | 3.0 |
References
- Feng, Y.M.; Cao, X.Z.; Zhang, E.P.; Hu, Y.X.; Pan, X.P.; Yang, J.L.; Jia, Q.Z.; Li, W.M. Structure, Orogenic Processes and Geodynamic of the Western Qinling Orogen; Xi’an Map Press: Xi’an, China, 2002; p. 263. (In Chinese) [Google Scholar]
- Zhang, H.F.; Cheng, Y.L.; Xu, W.C.; Liu, R.; Yuan, H.L.; Liu, X.M. Granitoids around Gonghe basin in Qinghai province: Petrogenesis and tectonic implications. Acta Petrol. Sin. 2006, 22, 2910–2922. (In Chinese) [Google Scholar]
- Wang, H.Q.; Zhu, Y.H.; Lin, Q.X.; Li, X.L.; Wang, K. LA-ICP-MS zircon U–Pb dating of the gabbro from Longwu Gorge ophiolite, Jianzha-Tongren area, Qinghai, China and its geological significance. Geol. Bull. China 2010, 29, 86–92. (In Chinese) [Google Scholar]
- Luo, B.J.; Zhang, H.F.; Lü, X.B. U–Pb zircon dating, geochemical and Sr–Nd–Hf isotopic compositions of Early Indosinian intrusive rocks in West Qinling, central China: Petrogenesis and tectonic implications. Contrib. Mineral. Petrol. 2012, 164, 551–569. [Google Scholar] [CrossRef]
- Qin, J.F.; Lai, S.C.; Grapes, R.; Diwu, C.R.; Ju, Y.J.; Li, Y.F. Geochemical evidence for origin of magma mixing for the Triassic monzonitic granite and its enclaves at Mishuling in the Qinling orogen (central China). Lithos 2009, 112, 259–276. [Google Scholar] [CrossRef]
- Qin, J.F.; Lai, S.C.; Diwu, C.R.; Ju, Y.J.; Li, Y.F. Magma mixing origin for the post-collisional adakitic monzogranite of the Triassic Yangba pluton, Northwestern margin of the South China block: Geochemistry, Sr–Nd isotopic, zircon U–Pb dating and Hf isotopic evidences. Contrib. Mineral. Petrol. 2010, 159, 389–409. [Google Scholar] [CrossRef]
- Qin, J.F.; Lai, S.C.; Grapes, R.; Diwu, C.R.; Ju, Y.J.; Li, Y.F. Origin of Late Triassic High-Mg adakitic granitoid rocks from the Dongjiangkou area, Qinling orogen, central China: Implications for subduction of continental crust. Lithos 2010, 120, 347–367. [Google Scholar] [CrossRef]
- Zhang, C.L.; Wang, T.; Wang, X.X. Origin and tectonic setting of the Early Mesozoic Granitoids in Qinling Orogenic Belt. Geol. J. China Univ. 2008, 14, 304–316. (In Chinese) [Google Scholar]
- Zhang, H.F.; Xiao, L.; Zhang, L. Geochemical and Pb–Sr–Nd isotopic compositions of Indosinian granitoids from the Bikou block, northwest of the Yangtze plate: Constraints on petrogenesis, nature of deep crust and geodynamics. Sci. China Ser. D Earth Sci. 2007, 50, 972–983. (In Chinese) [Google Scholar] [CrossRef]
- Qin, J.F.; Lai, S.C.; Li, Y.F. Slab breakoff model for the Triassic post-collisional adakitic granitoids in the Qinling Orogen, central China: Zircon U–Pb ages, geochemistry, and Sr–Nd–Pb isotopic constraints. Int. Geol. Rev. 2008, 50, 1080–1104. [Google Scholar] [CrossRef]
- Cao, X.F.; Lü, X.B.; Yao, S.Z.; Mei, W.; Zou, X.Y.; Chen, C.; Liu, S.T.; Zhang, P.; Su, Y.Y.; Zhang, B. LA-ICP-MS U–Pb zircon geochronology, geochemistry and kinetics of the Wenquan ore-bearing granites from West Qinling, China. Ore Geol. Rev. 2011, 43, 120–131. [Google Scholar] [CrossRef]
- Jin, W.J.; Zhang, Q.; He, D.F.; Jia, X.Q. SHRIMP dating of adakites in western Qinling and their implications. Acta Petrol. Sin. 2005, 21, 959–966. (In Chinese) [Google Scholar]
- Ying, H.F.; Zhang, K.X. Evolution and characteristics of central orogenic belt. Geol. China. 1998, 23, 437–442. [Google Scholar]
- Lu, L.Z.; Xu, W.L. Petrology; Geological Press: Beijing, China, 2017; p. 377. (In Chinese) [Google Scholar]
- Ressel, M.W.; Noble, D.C.; Henry, C.D.; Trudel, W.S. Dike-hosted ores of the Beast deposit and the importance of Eocene magmatism in gold mineralization of the Carlin trend, Nevada. Econ. Geol. 2000, 95, 1417–1444. [Google Scholar] [CrossRef]
- Luo, Z.H.; Wei, Y.; Xin, H.T.; Zhan, H.M.; Ke, S.; Li, W.T. Petrogenesis of the post-orogenic dike complex Constraints to lithosphere delamination. Acta Petrol. Sin. 2006, 22, 1672–1684. (In Chinese) [Google Scholar]
- Chen, Y.J.; Zhang, J.; Zhang, F.X.; Franco, P.; Li, C. Carlin and Carlin-like Gold Deposits in Western Qinling Mountains and Their Metallogenic Time Tectonic Setting and Model. Geol. Rev. 2004, 2, 134–152. (In Chinese) [Google Scholar]
- Feng, J.Z.; Wang, D.B.; Wang, X.M.; Shao, S.C.; Lin, G.F.; Shi, J.J. Geology and Metallogenesis of Liba Large-size Gold Deposit in Lixian, Gansu Province. Miner. Deposits. 2003, 3, 257–263. (In Chinese) [Google Scholar]
- Mao, J.W.; Zhou, Z.H.; Feng, C.Y.; Wang, Y.T.; Zhang, C.Q.; Peng, H.J.; Yu, M. A preliminary study of the Triassic large-scale mineralization in China and its geodynamic setting. Geol. China 2012, 6, 1437–1471. (In Chinese) [Google Scholar]
- Yin, Y. Relation of dick rock and gold mineralization in West Qin ling Region. Gansu Geol. 2011, 1, 28–37. (In Chinese) [Google Scholar]
- Yao, S.Z.; Zhou, Z.G.; Lü, X.B.; Chen, S.Y.; Ding, Z.J.; Wang, P. Mineralization Characteristics and Prospecting Potential in the Qinling Metallogenic Belt. Northwest. Geol. 2006, 2, 156–178. (In Chinese) [Google Scholar]
- Zhang, G.W.; Meng, Q.R.; Yu, Z.P.; Sun, Y.; Zhou, D.W.; Guo, A.L. Orogenesis and dynamics of Qinling orogen. Sci. China Ser. D Earth Sci. 1996, 3, 193–200. (In Chinese) [Google Scholar]
- Zeng, Q.; McCuaig, T.C.; Hart, C.J.; Jourdan, F.; Muhling, J.; Bagas, L. Structural and geochronological studies on the Liba goldfield of the West Qinling Orogen, Central China. Miner. Depos. 2012, 47, 799–819. [Google Scholar] [CrossRef]
- Sui, J.X.; Li, J.W.; Hofstra, A.H.; O’Brien, H.; Lahaye, Y.; Yan, D.; Jin, X.Y. Genesis of the Zaozigou gold deposit, West Qinling orogen, China: Constraints from sulfide trace element and stable isotope geochemistry. Ore Geol. Rev. 2020, 122, 103477. [Google Scholar] [CrossRef]
- Sui, J.X.; Li, J.W.; Jin, X.Y.; Vasconcelos, P.; Zhu, R. 40Ar/39Ar and U-Pb constraints on the age of the Zaozigou gold deposit, Xiahe-Hezuo district, West Qinling orogen, China: Relation to early Triassic reduced intrusions emplaced during slab rollback. Ore Geol. Rev. 2018, 101, 885–899. [Google Scholar] [CrossRef]
- Ye, K.; Jiang, W.H. County, Shaanxi Province Metallogenic background and prospecting direction of gold deposits in Anwangshan area, Fengxian. World Nonferr. Met. 2020, 7, 117–118. (In Chinese) [Google Scholar]
- Shi, Y.; Yu, J.H.; Santosh, M.J.P.R. Tectonic evolution of the Qinling orogenic belt, Central China: New evidence from geochemical, zircon U–Pb geochronology and Hf isotopes. Precambrian Res. 2013, 231, 19–60. [Google Scholar] [CrossRef]
- Wu, Y.B.; Zheng, Y.F. Tectonic evolution of a composite collision orogen: An overview on the Qinling–Tongbai–Hong’an–Dabie–Sulu orogenic belt in central China. Gondwana Res. 2013, 23, 1402–1428. [Google Scholar] [CrossRef]
- Zhang, G.W.; Zhang, B.R.; Xiao, Q.H. Qinling Orogenic Belt and Continental Dynamics; Beijing Science Press: Beijing, China, 2001; p. 863. (In Chinese) [Google Scholar]
- Luo, B.J. Petrogenesis and Geodynamic Processes of the Indosinian Magmatism in the West Qinling Orogenic Belt, Central China. Ph.D. Thesis, China University of Geosciences, Wuhan, China, 2013. (In Chinese). [Google Scholar]
- Liu, S.F.; Steel, R.; Zhang, G.W. Mesozoic sedimentary basin development and tectonic implication, northern Yangtze block, eastern China: Record of continent-continent collision. J. Asian Earth Sci. 2005, 25, 9–27. [Google Scholar] [CrossRef]
- Qin, J.F. Petrogenesis and Geodynamic Implications of the Late-Triassic Granitoids from the Qinling Orogenic Belt. Ph.D. Thesis, Northwest University, Xi’an, China, 2010. (In Chinese). [Google Scholar]
- Wang, R.T.; Wang, T.; Gao, Z.J.; Chen, E.H.; Liu, L.X. The Main Metal Deposits Metallogenic Series and Exploration Direction in Feng-Tai Ore Cluster Region, Shaanxi Province. Northwest Geol. 2007, 2, 77–84. (In Chinese) [Google Scholar]
- Ma, J.; Lü, X.B.; Escolme, A.; Li, S.; Zhao, N.; Cao, X.; Lu, F. In-situ sulfur isotope analysis of pyrite from the Pangjiahe gold deposit: Implications for variable sulfur sources in the north and south gold belt of the South Qinling orogen. Ore Geol. Rev. 2018, 98, 38–61. (In Chinese) [Google Scholar] [CrossRef]
- Dong, Z.C. The Tectonic Characteristics and Geological Formation of North Qinling Tectonic Belt in Feng-Liangdang County Region. Master’s Thesis, Northwest University, Xi’an, China, 2009. (In Chinese). [Google Scholar]
- Xue, F.; Lerch, M.F.; Kröner, A.; Reischmann, T. Tectonic evolution of the East Qinling Mountains, China, in the Palaeozoic: A review and new tectonic model. Tectonophysics 1996, 253, 271–284. [Google Scholar] [CrossRef]
- Dong, Y.P.; Zhang, G.W.; Hauzenberger, C.; Neubauer, F.; Yang, Z.; Liu, X. Palaeozoic tectonics and evolutionary history of the Qinling orogen: Evidence from geochemistry and geochronology of ophiolite and related volcanic rocks. Lithos 2011, 122, 39–56. [Google Scholar] [CrossRef]
- Zhang, G.W. The Formation and Evolution of the Qinling Orogenic Belt; Northwestern University Press: Xi’an, China, 1988; p. 192. (In Chinese) [Google Scholar]
- Wu, K.; Ling, M.X.; Hu, Y.B.; Guo, J.; Jiang, X.Y.; Sun, S.J.; Sun, W. Melt-fluxed melting of the heterogeneously mixed lower arc crust: A case study from the qinling orogenic belt, Central China. Geochem. Geophys. Geosyst. 2018, 19, 1767–1788. [Google Scholar] [CrossRef]
- Xue, Y.Y. Granitic Magmatism and Crustal Evolution of Baoji-Taibai Area, Qinling Orogen. Ph.D. Thesis, University of Science and Technology of China, Hefei, China, 2018. (In Chinese). [Google Scholar]
- Gong, X.K.; Chen, D.L.; Zhu, X.H.; Dong, Z.C.; Guo, C.L. The determination of Triassic ultramafic-syenite intrusive body and its geological significance, western North Qin ling. Acta Petrol. Sin. 2016, 32, 177–192. (In Chinese) [Google Scholar]
- Zhang, N.; Li, J.; Luo, H.G. Preliminary Geological Report on the Gold-Lead-Zinc Polymetallic Mine in the Anwangshan-Longwanggou area, Feng County, Shaanxi Province, China; Zhong shaan Nuclear Industry Group The 211th Brigade Co.: Xi’an, China, 2017. (In Chinese) [Google Scholar]
- Lu, F.; Yang, S.; Zhang, N.; Li, J. Geological characteristics, genesis and prospecting criteria of the Anwangshan Gold Polymetallic Deposit, Fengxian County, Shaanxi Province. Gold 2019, 9, 12–16. (In Chinese) [Google Scholar]
- Liu, Y.S.; Hu, Z.C.; Gao, S.; Günther, D.; Xu, J.; Gao, C.G.; Chen, H.H. In situ analysis of major and trace elements of anhydrous minerals by LA-ICP-MS without applying an internal standard. Chem. Geol. 2008, 257, 34–43. [Google Scholar] [CrossRef]
- Hu, Z.; Liu, Y.; Gao, S.; Liu, W.; Zhang, W.; Tong, X.; Yang, L. Improved in situ Hf isotope ratio analysis of zircon using newly designed X skimmer cone and jet sample cone in combination with the addition of nitrogen by laser ablation multiple collector ICP-MS. J. Anal. At. Spectrom. 2012, 27, 1391–1399. [Google Scholar] [CrossRef]
- Zhu, Z.Y.; Jiang, S.Y.; Ciobanu, C.L.; Yang, T.; Cook, N.J. Sulfur isotope fractionation in pyrite during laser ablation: Implications for laser ablation multiple collector inductively coupled plasma mass spectrometry mapping. Chem. Geol. 2017, 450, 223–234. [Google Scholar] [CrossRef]
- Wu, Y.B.; Zheng, Y.F. Mineralogical study of zircon genesis and its constraints on U-Pb age interpretation. Chin. Sci. Bull. 2004, 16, 1589–1604. (In Chinese) [Google Scholar]
- Huang, X.F. Petrogenesis of the Indosinian Granitic Magmatism Andtectonic Evolution of the West Qinling Orogenic Belt. Ph.D. Thesis, China University of Geosciences, Beijing, China, 2016. (In Chinese). [Google Scholar]
- Patchett, P.J.; Kouvo, O.; Hedge, C.E.; Tatsumoto, M. Evolution of continental crust and mantle heterogeneity: Evidence from Hf isotopes. Contrib. Mineral. Petrol. 1982, 78, 279–297. [Google Scholar] [CrossRef]
- Wilson, M. (Ed.) Igneous Petrogenesis; Springer: Dordrecht, The Netherlands, 1989. [Google Scholar]
- Peccerillo, A.; Taylor, S.R. Geochemistry of Eocene calc-alkaline volcanic rocks from the Kastamonu area, northern Turkey. Contrib. Mineral. Petrol. 1976, 58, 63–81. [Google Scholar] [CrossRef]
- Rickwood, P.C. Boundary lines within petrologic diagrams which use oxides of major and minor elements. Lithos 1989, 22, 247–263. [Google Scholar] [CrossRef]
- Whalen, J.B.; Currie, K.L.; Chappell, B.W. A-type granites: Geochemical characteristics, discrimination and petrogenesis. Contrib. Mineral. Petrol. 1987, 95, 407–419. [Google Scholar] [CrossRef]
- Gong, X.K. Age of Formation and Geological Significance of the Jiuzigou Ultramafic-Syenite Rock, Feng County, Shaanxi Province, China. Master’s Thesis, Northwest University, Xi’an, China, 2013. (In Chinese). [Google Scholar]
- Sun, S.S.; McDonough, W.F. Chemical and isotopic systematics of oceanic basalts: Implications for mantle composition and processes. Geol. Soc. Lond. Spec. Publ. 1989, 42, 313–345. [Google Scholar] [CrossRef]
- Potter, R.W. Pressure corrections for fluid-inclusion homogenization temperatures based on the volumetric properties of the system NaCl-H2O. J. Res. US Geol. Surv. 1977, 5, 603–607. [Google Scholar]
- Brown, P.E.; Becker, S.M. Fractionation, hybridisation and magma-mixing in the Kialineq centre East Greenland. Contrib. Mineral. Petrol. 1986, 92, 57–70. [Google Scholar] [CrossRef]
- Mou, B.L.; Yan, G.H. Geochemistry of Triassic Alkaline or Subalkaline igneous Complexes in The Yan-Liao Area and Their Significance. Acta Geol. Sin. 1992, 2, 108–121. (In Chinese) [Google Scholar]
- Abdalla, J.A.; Said, A.A.; Visonà, D. New geochemical and petrographic data on the gabbro-syenite suite between Hargeysa and Berbera-Shiikh (Northern Somalia). J. Afr. Earth Sci. 1996, 23, 363–373. [Google Scholar] [CrossRef]
- Mingram, B.; Trumbull, R.B.; Littman, S.; Gerstenberger, H. A petrogenetic study of anorogenic felsic magmatism in the Cretaceous Paresis ring complex, Namibia: Evidence for mixing of crust and mantle-derived components. Lithos 2000, 54, 1–22. [Google Scholar] [CrossRef]
- Upadhyay, D.; Raith, M.M.; Mezger, K.; Hammerschmidt, K. Mesoproterozoic rift-related alkaline magmatism at Elchuru, Prakasam alkaline province, SE India. Lithos 2006, 89, 447–477. [Google Scholar] [CrossRef]
- Litvinovsky, B.A.; Jahn, B.M.; Zanvilevich, A.N.; Saunders, A.; Poulain, S.; Kuzmin, D.V.; Titov, A.V. Petrogenesis of syenite–granite suites from the Bryansky Complex (Transbaikalia, Russia): Implications for the origin of A-type granitoid magmas. Chem. Geol. 2002, 189, 105–133. [Google Scholar] [CrossRef]
- Riishuus, M.S.; Peate, D.W.; Tegner, C.; Wilson, J.R.; Brooks, C.K.; Waight, T.E. Petrogenesis of syenites at a rifted continental margin: Origin, contamination and interaction of alkaline mafic and felsic magmas in the Astrophyllite Bay Complex, East Greenland. Contrib. Mineral. Petrol. 2005, 149, 350–371. [Google Scholar] [CrossRef]
- Huang, X.F.; Mo, X.X.; Yu, X.H.; Li, X.W.; Ding, Y.; Wei, P.; He, W.Y. Zircon U-Pb chronology, geochemistry of the Late Triassic acid volcanic rocks in Tanchang area, West Qinling and their geological significance. Acta Petrol. Sin. 2013, 29, 3968–3980. (In Chinese) [Google Scholar]
- Wang, F.L.; Zhao, T.P.; Chen, W.; Wang, Y. Zircon U-Pb ages and Lu-Hf isotopic compositions of the Nb-Ta-Zr bearing syenitic dikes in the Emeishan large igneous province. Acta Petrol. Sin. 2013, 10, 3519–3532. (In Chinese) [Google Scholar]
- Foley, S.; Peccerillo, A. Potassic and ultrapotassic magmas and their origin. Lithos 1992, 28, 181–185. [Google Scholar] [CrossRef]
- Rapp, R.P.; Watson, E.B. Dehydration melting of metabasalt at 8–32 kbar: Implications for continental growth and crust-mantle recycling. J. Petrol. 1995, 36, 891–931. [Google Scholar] [CrossRef]
- Liu, B.W. Magmatism and Crustal Evolution in the Eastern North Qinling Terrain. Ph.D. Thesis, University of Science and Technology of China, Hefei, China, 2014. (In Chinese). [Google Scholar]
- Wang, D.Z.; Xie, L. Magma Mingling: Evidence from Enclaves. Geol. J. China Univ. 2008, 1, 16–21. (In Chinese) [Google Scholar]
- Wang, Y.; Fan, W.; Zhang, H.; Peng, T. Early Cretaceous gabbroic rocks from the Taihang Mountains: Implications for a paleosubduction-related lithospheric mantle beneath the central North China Craton. Lithos 2006, 86, 281–302. [Google Scholar] [CrossRef]
- Chen, B.; Zhai, M. Geochemistry of late Mesozoic lamprophyre dykes from the Taihang Mountains, north China, and implications for the sub-continental lithospheric mantle. Geol. Mag. 2003, 140, 87–93. [Google Scholar] [CrossRef]
- Eby, G.N. The A-type granitoids: A review of their occurrence and chemical characteristics and speculations on their petrogenesis. Lithos 1990, 26, 115–134. [Google Scholar] [CrossRef]
- Pin, C.; Paquette, J.L.; Monchoux, P.; Hammouda, T. First field-scale occurrence of Si-Al-Na-rich low-degree partial melts from the upper mantle. Geology 2001, 29, 451–454. [Google Scholar] [CrossRef]
- Laloum, T.; Baudin, M.; Frances, L.; Lepage, A.; Billault-Penneteau, B.; Cerri, M.R.; Niebel, A. Two CCAAT-box-binding transcription factors redundantly regulate early steps of the legume-rhizobia endosymbiosis. Plant J. 2014, 79, 757–768. [Google Scholar] [CrossRef]
- Carvalho, B.B.; de Assis Janasi, V.; Henrique-Pinto, R. Geochemical and Sr–Nd–Pb isotope constraints on the petrogenesis of the K-rich Pedra Branca Syenite: Implications for the Neoproterozoic post-collisional magmatism in SE Brazil. Lithos 2014, 205, 39–59. [Google Scholar] [CrossRef]
- Hari, K.R.; Rao, N.C.; Swarnkar, V.; Hou, G. Alkali feldspar syenites with shoshonitic affinities from Chhotaudepur area: Implication for mantle metasomatism in the Deccan large igneous province. Geosci. Front. 2014, 5, 261–276. [Google Scholar] [CrossRef]
- Ren, K.X.; Yan, G.H.; Mou, B.L.; Cai, J.H.; Li, F.T.; Tan, L.K.; Shao, H.X.; Li, Y.K.; Chu, Z.Y. Geochemical characteristics and geological implications of the Hekanzi alkaline complex in Lingyuan County western Liaoning Province. Acta Petrol. Mineral. 2004, 3, 193–202. [Google Scholar]
- Ma, J.; Lü, X.B.; Li, S.; Chen, J.J.; Lu, F.; Yin, X.; Wu, M. The ca. 230 Ma gold mineralization in the Fengtai Basin, Western Qinling orogen, and its implications for ore genesis and geodynamic setting: A case study of the Matigou gold deposit. Ore Geol. Rev. 2021, 138, 104398. [Google Scholar] [CrossRef]
- Brown, G.C. Andesites: Orogenic Andesites and Related Rocks; Thorpe, R.S., Ed.; Wiley: New York, NY, USA, 1982; pp. 437–461. [Google Scholar] [CrossRef]
- Pearce, J. Sources and settings of granitic rocks. Episodes 1996, 19, 120–125. [Google Scholar] [CrossRef]
- Boyle, R.W. The Geochemistry of gold and its deposits. Geol. Surv. Can. Bull 1979, 280, 584. [Google Scholar] [CrossRef]
- Mutschler, F.E.; Mooney, T.C. Precious-metal deposits related to alkalic igneous rocks: Provisional classification, grade-tonnage data and exploration frontiers. Geol. Assoc. Can. Spec. Pap. 1993, 40, 479–520. [Google Scholar]
- Li, C.M. Study on Chronology and Petrochemistry in Dongping and Hougou Gold Orefields, Northern Hebei Province. Ph.D. Thesis, China University of Geosciences, Beijing, China, 2011. (In Chinese). [Google Scholar]
- Xiang, S.Y.; Ye, J.L. Gold Deposit Related to Alkaline Rock- A New Type of Gold Deposit. Mine Res Geol. 1995, 2, 73–76. [Google Scholar]
- Ma, J. Ore-Forming Processes and Genesis of the Gold Deposits in Pangjiahe Region, Fengxian, Shanxi Province. Ph.D. Thesis, China University of Geosciences, Wuhan, China, 2018. (In Chinese). [Google Scholar]
- Ludovic, B.; Michel, J. Gold mineralization at the syenite-hosted Beattie gold deposit, Duparquet, Neoarchean Abitibi Belt, Canada. Econ. Geol. 2015, 110, 315–335. [Google Scholar]
- Ispolatov, V.; Lafrance, B.; Dubé, B.; Creaser, R.; Hamilton, M. Geologic and structural setting of gold mineralization in the Kirkland Lake-Larder Lake gold belt, Ontario. Econ. Geol. 2008, 103, 1309–1340. [Google Scholar] [CrossRef]
- Mao, J.W.; Li, H.M.; Wang, Y.T.; Zhang, C.Q.; Wang, R.T. The Relationship between Mantle-derived Fluid and Gold Ore-formation in the Eastern Shandong Peninsula: Evidences from D-O-C-S lsotopes. Acta Geol. Sin. 2005, 6, 839–857. (In Chinese) [Google Scholar]
- Yin, Y.; Zhao, Y.Q. Relationship between Granite and Gold Mineralization in the gold Enrichment area of West Qinling, Gansu Province. Gans Geol. 2006, 1, 36–41. (In Chinese) [Google Scholar]
- Zhang, L. Fluid Inclusion Characters Comparison of Gold Deposits of Qinling Mountain. Master’s Thesis, China University of Geosciences, Beijing, China, 2014. (In Chinese). [Google Scholar]
- Goldfarb, R.J.; Groves, D.I. Orogenic gold: Common or evolving fluid and metal sources through time. Lithos 2015, 233, 2–26. [Google Scholar] [CrossRef]
- Ma, J.; Lü, X.B.; Li, S.; Fu, J.; Mao, C.; Lu, F.; Zou, B. Pyrite zonation and source of gold in the Pangjiahe orogenic gold deposit, West Qinling Orogen, central China. Ore Geol. Rev. 2021, 139, 104578. (In Chinese) [Google Scholar] [CrossRef]
- Wang, Y.T.; Mao, J.W.; Hu, Q.Q.; Wei, R.; Chen, S.C. Characteristics and Metallogeny of Triassic Polymetallic Mineralization in Xicheng and Fengtai Ore Cluster Zones, West Qinling, China and Their lmplications for Prospecting Targets. J. Earth Sci. Environ. 2021, 3, 409–435. (In Chinese) [Google Scholar]

Disclaimer/Publisher’s Note: The statements, opinions and data contained in all publications are solely those of the individual author(s) and contributor(s) and not of MDPI and/or the editor(s). MDPI and/or the editor(s) disclaim responsibility for any injury to people or property resulting from any ideas, methods, instructions or products referred to in the content. |
© 2024 by the authors. Licensee MDPI, Basel, Switzerland. This article is an open access article distributed under the terms and conditions of the Creative Commons Attribution (CC BY) license (https://creativecommons.org/licenses/by/4.0/).
Share and Cite
Chen, W.; Yan, Z.; Yuan, J.; Zhao, Y.; Xu, X.; Sun, L.; Lü, X.; Ma, J. Gold Mineralization at the Syenite-Hosted Anwangshan Gold Deposit, Western Qinling Orogen, Central China. Minerals 2024, 14, 1057. https://doi.org/10.3390/min14101057
Chen W, Yan Z, Yuan J, Zhao Y, Xu X, Sun L, Lü X, Ma J. Gold Mineralization at the Syenite-Hosted Anwangshan Gold Deposit, Western Qinling Orogen, Central China. Minerals. 2024; 14(10):1057. https://doi.org/10.3390/min14101057
Chicago/Turabian StyleChen, Wenyuan, Zhibo Yan, Jin Yuan, Yuanyuan Zhao, Xinyu Xu, Liqiang Sun, Xinbiao Lü, and Jian Ma. 2024. "Gold Mineralization at the Syenite-Hosted Anwangshan Gold Deposit, Western Qinling Orogen, Central China" Minerals 14, no. 10: 1057. https://doi.org/10.3390/min14101057
APA StyleChen, W., Yan, Z., Yuan, J., Zhao, Y., Xu, X., Sun, L., Lü, X., & Ma, J. (2024). Gold Mineralization at the Syenite-Hosted Anwangshan Gold Deposit, Western Qinling Orogen, Central China. Minerals, 14(10), 1057. https://doi.org/10.3390/min14101057