Abstract
Ferromanganese (Fe-Mn) polymetallic nodules are significant marine mineral resources containing various metal elements of substantial economic and scientific research value. Previous studies have primarily focused on the mineralogy and geochemistry of the nodules, while research on their nano-mineralogy is still lacking. In this study, we conducted scanning electron microscopy (SEM), X-ray powder diffraction (XRD), transmission electron microscopy (TEM), Fourier-transform infrared spectroscopy (FT-IR), Brunauer–Emmett–Teller (BET) porous structure gas adsorption/desorption, and specific surface area analysis to examine the nano-mineralogy and mineralization of the polymetallic nodules from the interbasin of seamounts in the western Pacific Ocean (IBSWP). The results indicate that the growth profiles of the IBSWP polymetallic nodules exhibit microstructural features such as laminated, stromatolithic, columnar, and mottled structures. The mineral compositions are primarily composed of Fe-Mn minerals and detritus, including quartz; minerals from the feldspar group; and minerals from the clay group. The Fe-Mn phase minerals are relatively poorly crystallized. The Mn-phase minerals contain vernadite and small amounts of todorokite, buserite, and birnessite, while the Fe-phase minerals are mainly comprised of amorphous FeOOH. The main ore-forming minerals consist of nano-minerals, and the nanostructures of the polymetallic nodules endow them with unusually large specific surface areas and pore volumes, resulting in strong adsorption properties. The unique nano-properties and surface/interface adsorption effects of Fe-Mn minerals play a crucial role in controlling the enrichment of ore-forming elements.
1. Introduction
Fe-Mn polymetallic nodules, also known as Fe-Mn nodules, Mn nodules, and polymetallic nodules, are a type of solid mineral resource found on the seabed enrichment of Mn, Cu, Ni, Co, Mo, Ti, Li, REE, and other critical metals. Some elements are more comparable to the corresponding metal reserves on land (Hein et al., 2013) [1], which hold significant economic value and research significance. Fe-Mn nodules grow in a relatively oxidizing environment, influenced by an oxygen-rich bottom current. They are generally distributed in low-terrain areas such as abyssal plains, sea basins, and the interbasins of seamounts covered by sediment at water depths of 4000–6500 m, as well as in shallow marginal sea environments (Hein et al., 2014; Guan et al., 2017a) [2,3]. The formation of Fe-Mn nodules mainly occurs through the adsorption of metal ions from seawater by Fe-Mn oxides/hydroxide colloids, which accumulate on the solidified core of sediment surfaces.
Fe-Mn nodules are mainly distributed in the Pacific Ocean, followed by the Indian Ocean and Atlantic Ocean (Sun et al., 2003) [4]. The most economically promising areas for Ni- and Cu-rich nodule mineralization are primarily located in the Clarion–Clipperton Zone of the eastern Pacific, the Peru basin near South America, and the ocean basin of the central Indian Ocean (Hein et al., 2013) [1], while the areas with Co-rich nodule mineralization areas are found in the waters near the Cook Islands in the south Pacific (Hein et al., 2015) [5]. The deep-sea basins in the central Pacific and eastern Pacific cover a vast area and contain abundant zones for the development of Fe-Mn nodules. The western Pacific and central Pacific are reservoirs for numerous seamounts and extensively developed cobalt-rich crusts (Ren et al., 2021) [6]. However, in recent years, high-abundance Fe-Mn nodules have also been discovered in the western Pacific (Ma et al., 2021) [7].
Systematic research on the morphology, structure, constituent minerals, genesis, and mineralization mechanisms of Fe-Mn nodules has contributed to scholars’ greater understanding of these formations. According to the size, morphology, surface structure, and occurrence status, Fe-Mn nodules can be classified into 19 categories (Guo, 1992) [8]. The nodules’ structures encompass microscopic structures such as laminated, stromatolithic, columnar, and mottled structures (Liang, 1992; Xu et al., 1994a; Wu et al., 2001; He et al., 2011) [9,10,11,12]. The minerals in the Fe-Mn encrusts of nodules exhibit poor crystallization and are composed of Mn-phase minerals (todorokite and vernadite), Fe phase minerals (goethite and lepidocrocite), and minor minerals (montmorillonite, illite, phillipsite, minerals from the feldspar group, and quartz) (Aplin et al., 1985; Xu et al., 1994b; He et al., 2011) [12,13,14].
Fe-Mn oxides/hydroxides form independent minerals in the Fe-Mn nodules, while other elements enter the minerals through isomorphism or adsorption (Xu et al., 1993) [15]. Some scholars have proposed that Fe-Mn nodules are formed through biomineralization and serve as the building blocks of ultra-microbes (Bian et al., 1996; Chen et al., 1997) [16,17]. According to the various origins, Fe-Mn nodules can be categorized into hydrogenetic, diagenetic, hydrothermal, and mixed types (Hein et al., 2013; Bau et al., 2014; Luo et al., 2023) [1,18,19]. However, there are still varying interpretations of the mechanism by which metal elements are enriched in Fe-Mn nodules (Halbach et al., 1989; Stüben et al., 1999) [20,21].
Nano-mineralogy is a promising field for investigating the mechanism of metallic element enrichment in Fe-Mn nodules. The presence of nanoscale minerals has been confirmed in the mineral composition of the Fe-Mn nodules (Shi et al., 1995; Bai et al., 2002, Huang et al., 2022) [22,23,24]. Nanoscale minerals exhibit unique nano-properties that are not present in crystalline and amorphous minerals. Surface/interface effects are closely linked to the mineralization and adsorption of elements. The nanopore confinement effect is an important factor in the strong adsorption of elements (He et al., 2011; Bai et al., 2002; Liu et al., 2003; Guan et al., 2017b; Li et al., 2020) [12,23,25,26,27].
This study focuses on the Fe-Mn nodules from the IBSWP. A comprehensive and fine mineralogical study was conducted on the samples, utilizing modern analytical methods to comprehensively analyze the mineral compositions and their nano-mineralogical characteristics and further explore the relationship between nano-minerals and element enrichment mineralization.
2. Geological Setting
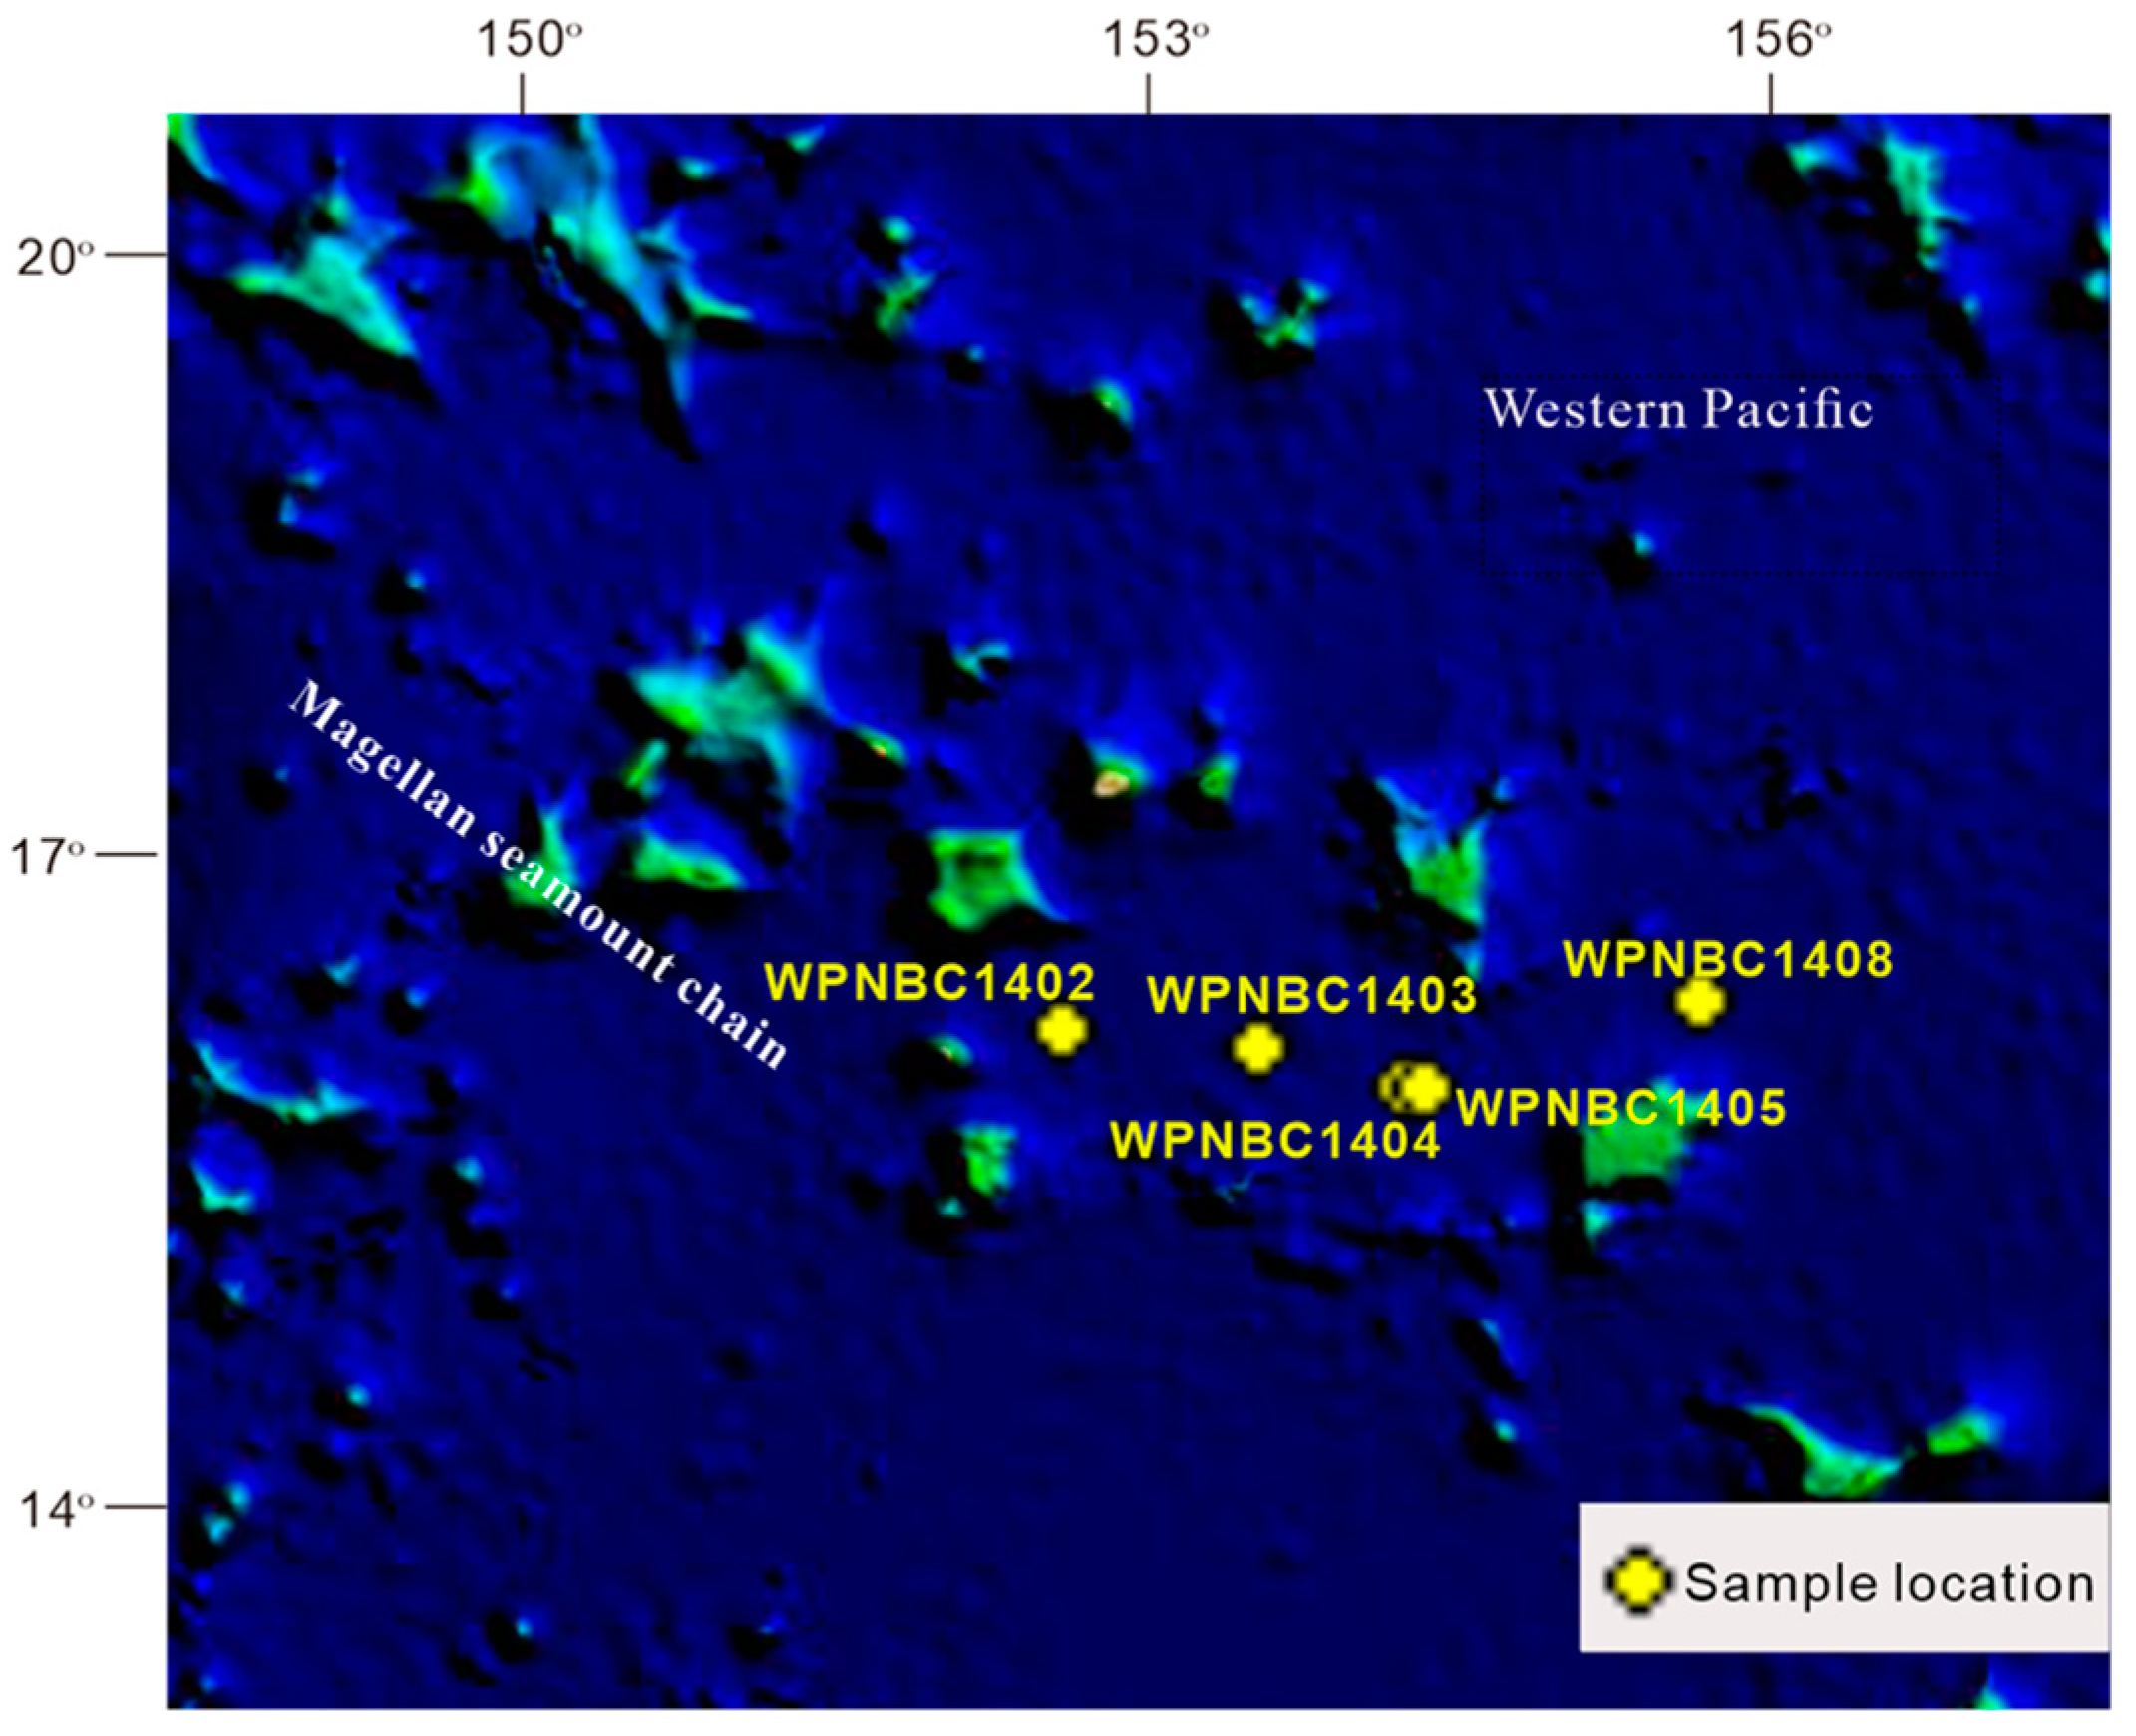
The Fe-Mn nodules utilized in this study were gathered from the IBSWP (see Figure 1). The Magellan seamount area is situated in the western Pacific Ocean, adjacent to the Mariana Trench in the west and extending to the Central Pacific Basin in the east. It is separated from the Marcus Wake seamount area in the north by the Pigafetta Basin and the eastern Mariana Basin in the south. The Magellan seamount area is situated at the forefront of the plate subduction zone. The structure in the area is complex. The seamounts are primarily distributed in a northwest direction due to structural control. The seamounts are mostly isolated peak, bimodal, and multi-peak mesas. The flat top has a depth of 1400–1600 m, and the base has a water depth of around 5000–6000 m. The slope of the mountain top is generally less than 2°. The sediment on the seabed in the study area primarily consists of deep-sea clay, and the bottom seawater is predominantly influenced by the Antarctic bottom water (AABW) (He et al., 2001; Huang et al., 2022) [24,28].
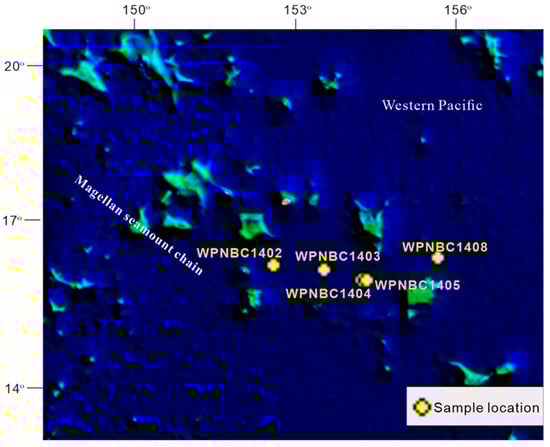
Figure 1.
Research area and sampling location: modified from Huang et al. (2022) [24].
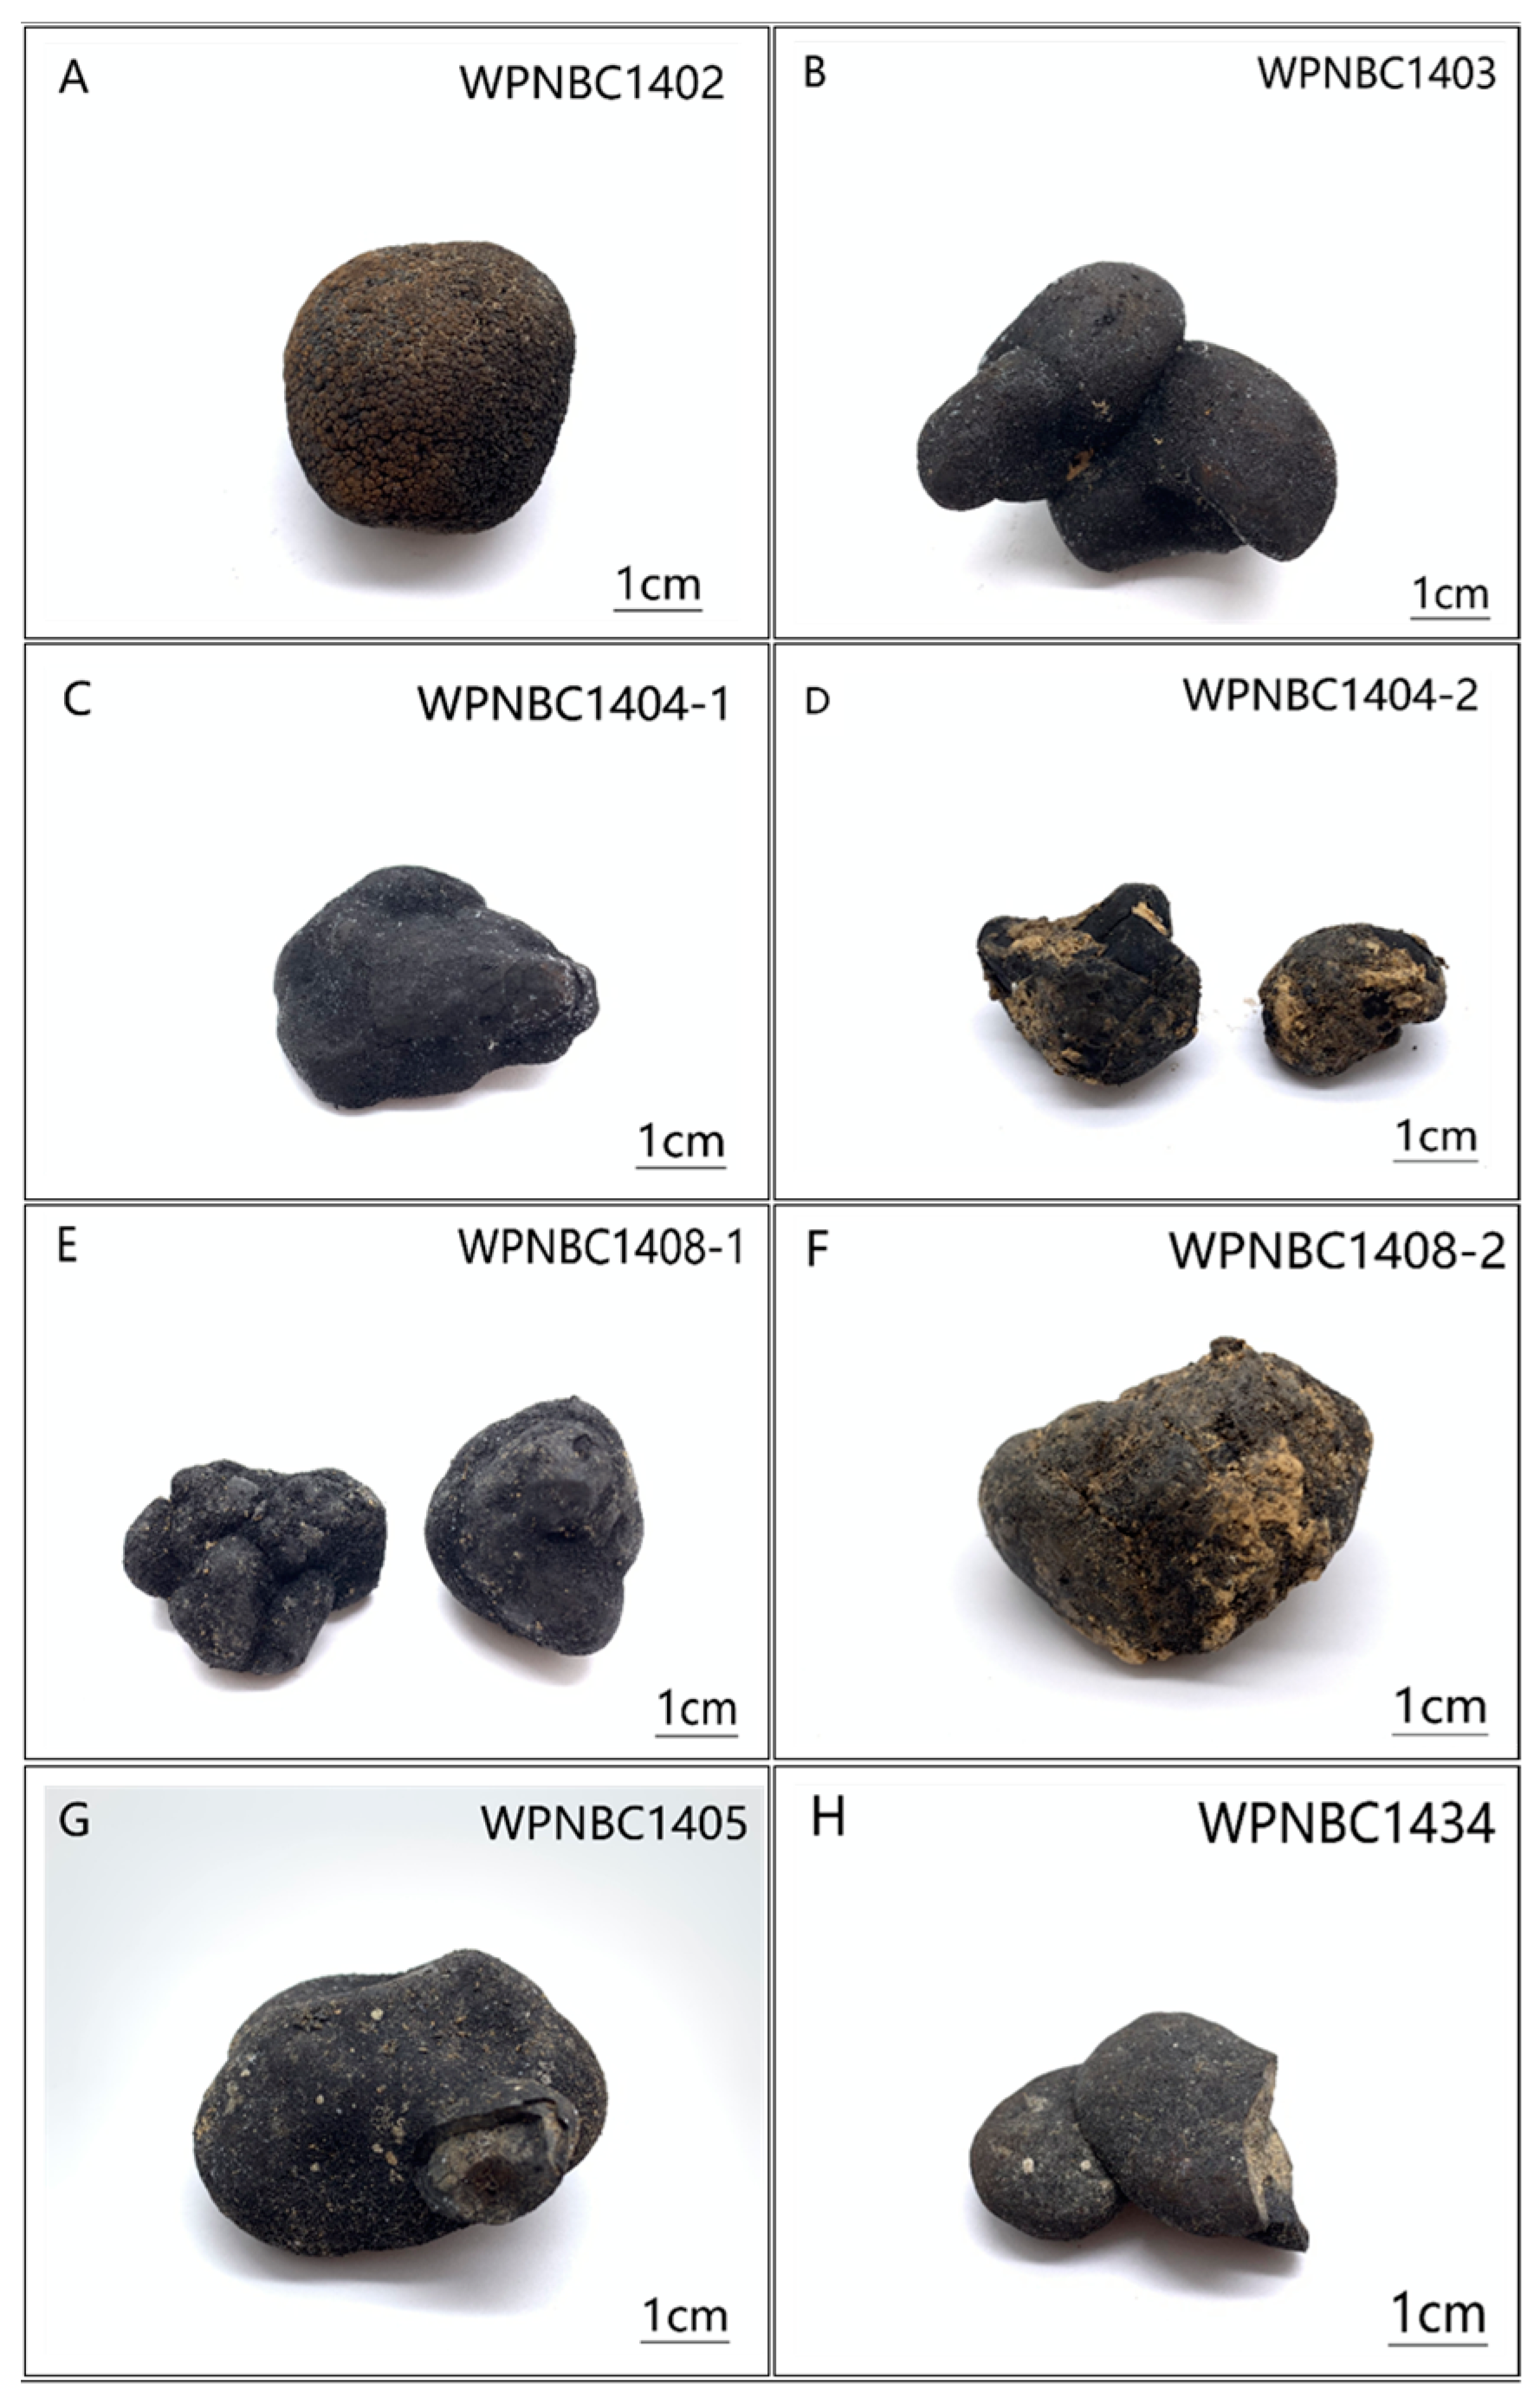
The samples were provided by the 32nd (in 2014) and 41st (in 2016) expeditions of the China Oceanic Survey. The Fe-Mn nodules were collected using box samplers, and eight samples with a relatively intact appearance were chosen for this study (refer Figure 2). The specific details of the samples are presented in Table 1.
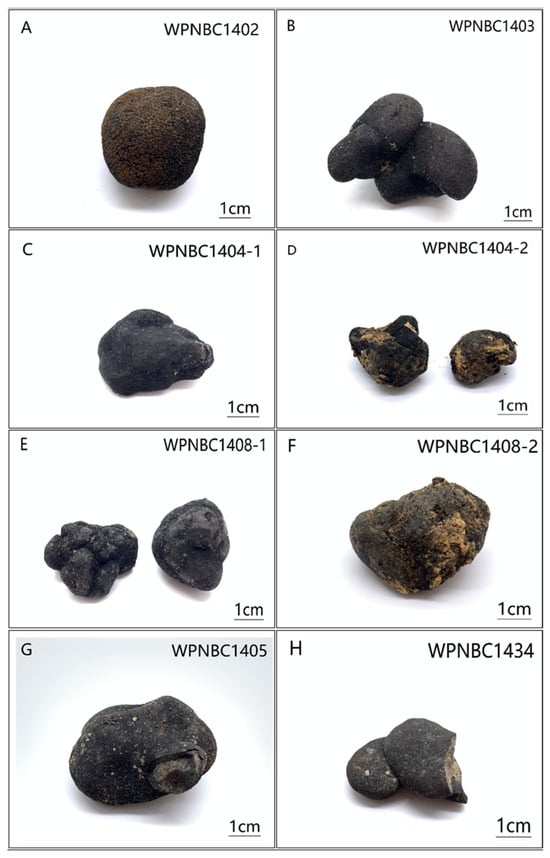
Figure 2.
(A–H) Photos of the Fe-Mn nodules from IBSWP.

Table 1.
Sample description.
3. Samples and Analytical Methods
In order to investigate the enrichment effect of nano-mineral attributes on the mineralization in nodules from the IBSWP, the research utilized scanning electron microscopy (SEM), transmission electron microscopy (TEM), X-ray diffraction (XRD), Fourier transform infrared spectroscopy (FT-IR), and Brunauer–Emmett–Teller (BET) gas sorptometry technology to systematically study nano-mineralogy in the Fe-Mn nodules and explore the enrichment mechanism of ore-forming elements in the Fe-Mn nodules.
3.1. Sample Pretreatment and Microscopic Observation
Samples for slicing and probe sections were fabricated. The samples were reinforced with epoxy resin, cut along the growth profile, and then polished, cleaned, and dried to produce thin slices for analysis. The remaining fragmented samples were weighed and ground into a 200-mesh powder using an agate mortar, weighing ~3–4 g per sample for subsequent testing.
Microstructural observations and mineralogical identification of nodule sections were conducted. A Zeiss AXIO microscope and a TESCAN MIRA field emission SEM (V = 15 kV, BC = 300 pA) with energy-dispersive spectroscopy (EDS) were used. Before observation with the SEM, the carbon was sprayed on the surface of the sections to improve the electrical conductivity of the samples.
3.2. XRD Analysis
The X-ray diffraction (XRD) analyses were conducted on the micro-area analysis platform using an Empyrean X-ray diffractometer manufactured by Panacor, Amsterdam, the Netherlands. The X-ray tube power was 3 kW with a copper target, and a minimum scanning step of 0.0001° was utilized. The continuous scanning method was applied, with scans ranging from 5° to 85° (2θ), a step time of 2°/min (2θ), and an exposure time of 45 min. The raw data was imported into Jade software for the mineral characterization.
3.3. Gas Adsorption Analyses of Porous Structures
The micropores and mesopores of the samples were thoroughly analyzed using a Mack ASAP2460 (from Micromeritics, Norcross, GA, USA) fully-automated specific surface area and porosity analyzer to test the nitrogen adsorption isotherms of the whole-rock powder samples of the Fe-Mn nodules. The pore size distributions and specific surface areas of the samples were determined using the Barrett–Joyner–Halenda (BJH) method and the BET method.
3.4. FT-IR Spectral Analysis
The FT-IR spectral analysis was performed. We utilized the KBr pellets method to analyze whole-rock powder samples of the Fe-Mn nodules. The analysis was conducted using the Nicolet 6700 Continuum infrared spectrometer from Thermo Scientific, Waltham, MA, USA, which is equipped with a DTGS detector and a KBr beam splitter. The detection wavelength range was 4000–400 cm−1 with a resolution of at least 0.09 cm−1.
3.5. TEM Analysis
The TEM analysis instrument used was a Tecnai G2 Spirit (120 kV) transmission electron microscope with an energy-dispersive spectrometer from FEI, Hillsboro, OR, USA. The whole-rock powder samples of the Fe-Mn nodules were placed in a centrifuge tube with a suitable amount of alcohol and shaken using an ultrasonic vibration instrument for 10 min. Later, the suspension was deposited onto a copper mesh (with a carbon film and microgrid) that was specially designed for transmission electron microscopy, and then examined using the machine after it had dried. The experimental data was imported into Digital Micrograph software for processing.
4. Results
4.1. Microscopic Structure Characteristics
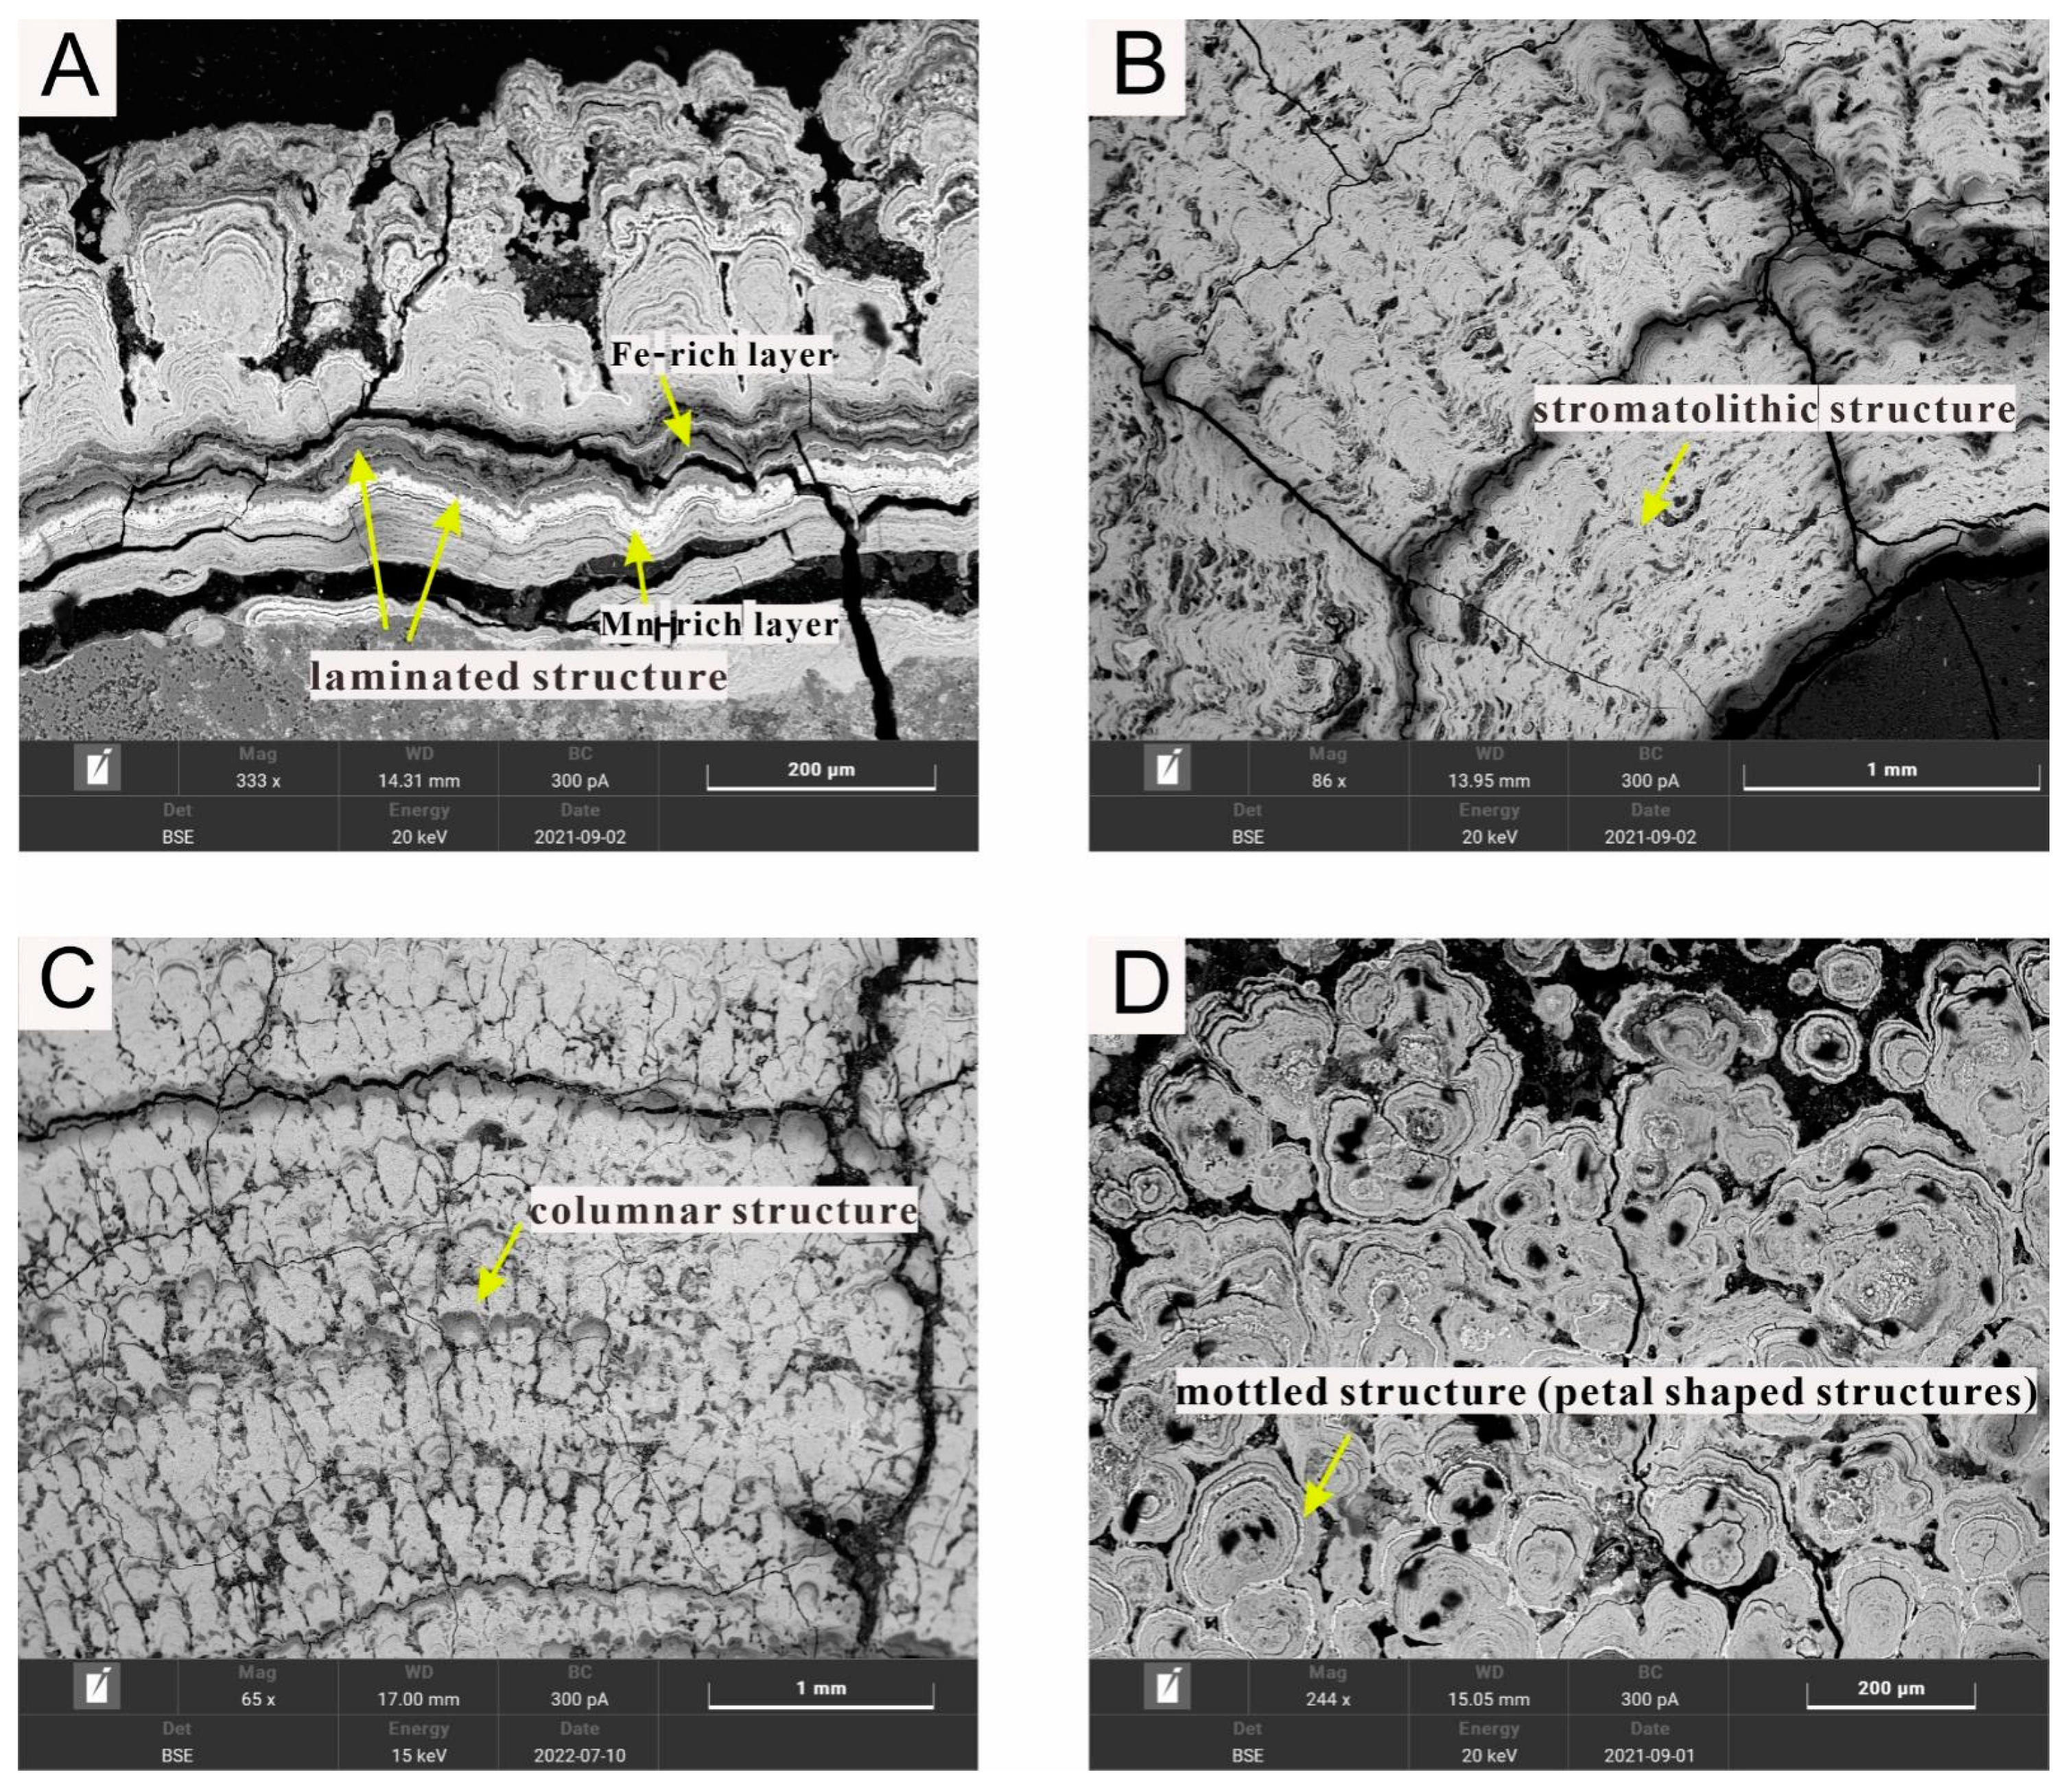
Various types of the Fe-Mn encrusts are present in the Fe-Mn nodules from the IBSWP (refer Figure 3). These Fe-Mn encrusts consist of relatively large crystalline silicates and bioclasts that are cemented or encapsulated by Fe-Mn minerals. In the scanning electron microscopy backscatter (BSE) images, the Mn-rich growth layers often appear brighter, while the Fe-rich growth layers appear darker in comparison (Figure 3A). The predominant growth structures observed in the Fe-Mn nodules include laminated, stromatolithic, columnar, and mottled (petal-shaped) structures.
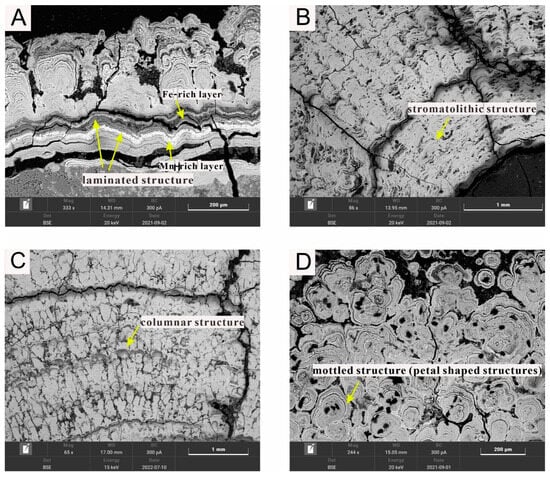
Figure 3.
Microphotographs of the different growth structures of the Fe-Mn nodules from the IBSWP. (A) The laminated structure. (B) The stromatolithic structure. (C) The columnar structure (D) The mottled structure.
The laminated structure (Figure 3A) consists of alternating microlayers of Fe-Mn oxide and impurities, such as clay, distributed in a wavy parallel pattern. The growth alternates between light Mn-rich layers and dark Fe-rich layers.
The stromatolithic structure (Figure 3B) consists of alternating microlayers of amorphous or crystalline Fe-Mn oxides/hydroxides and clay minerals.
The columnar structure (Figure 3C) is composed of amorphous Fe-Mn oxide/hydroxides microlayers, along with clay and other impurities, that are bent in a regular and orderly manner. These microlayers are stacked at high angles, with a parallel or dendritic distribution between the columns.
The mottled structure (Figure 3D) is formed by Fe-Mn oxides/hydroxides and clay debris.
4.2. XRD
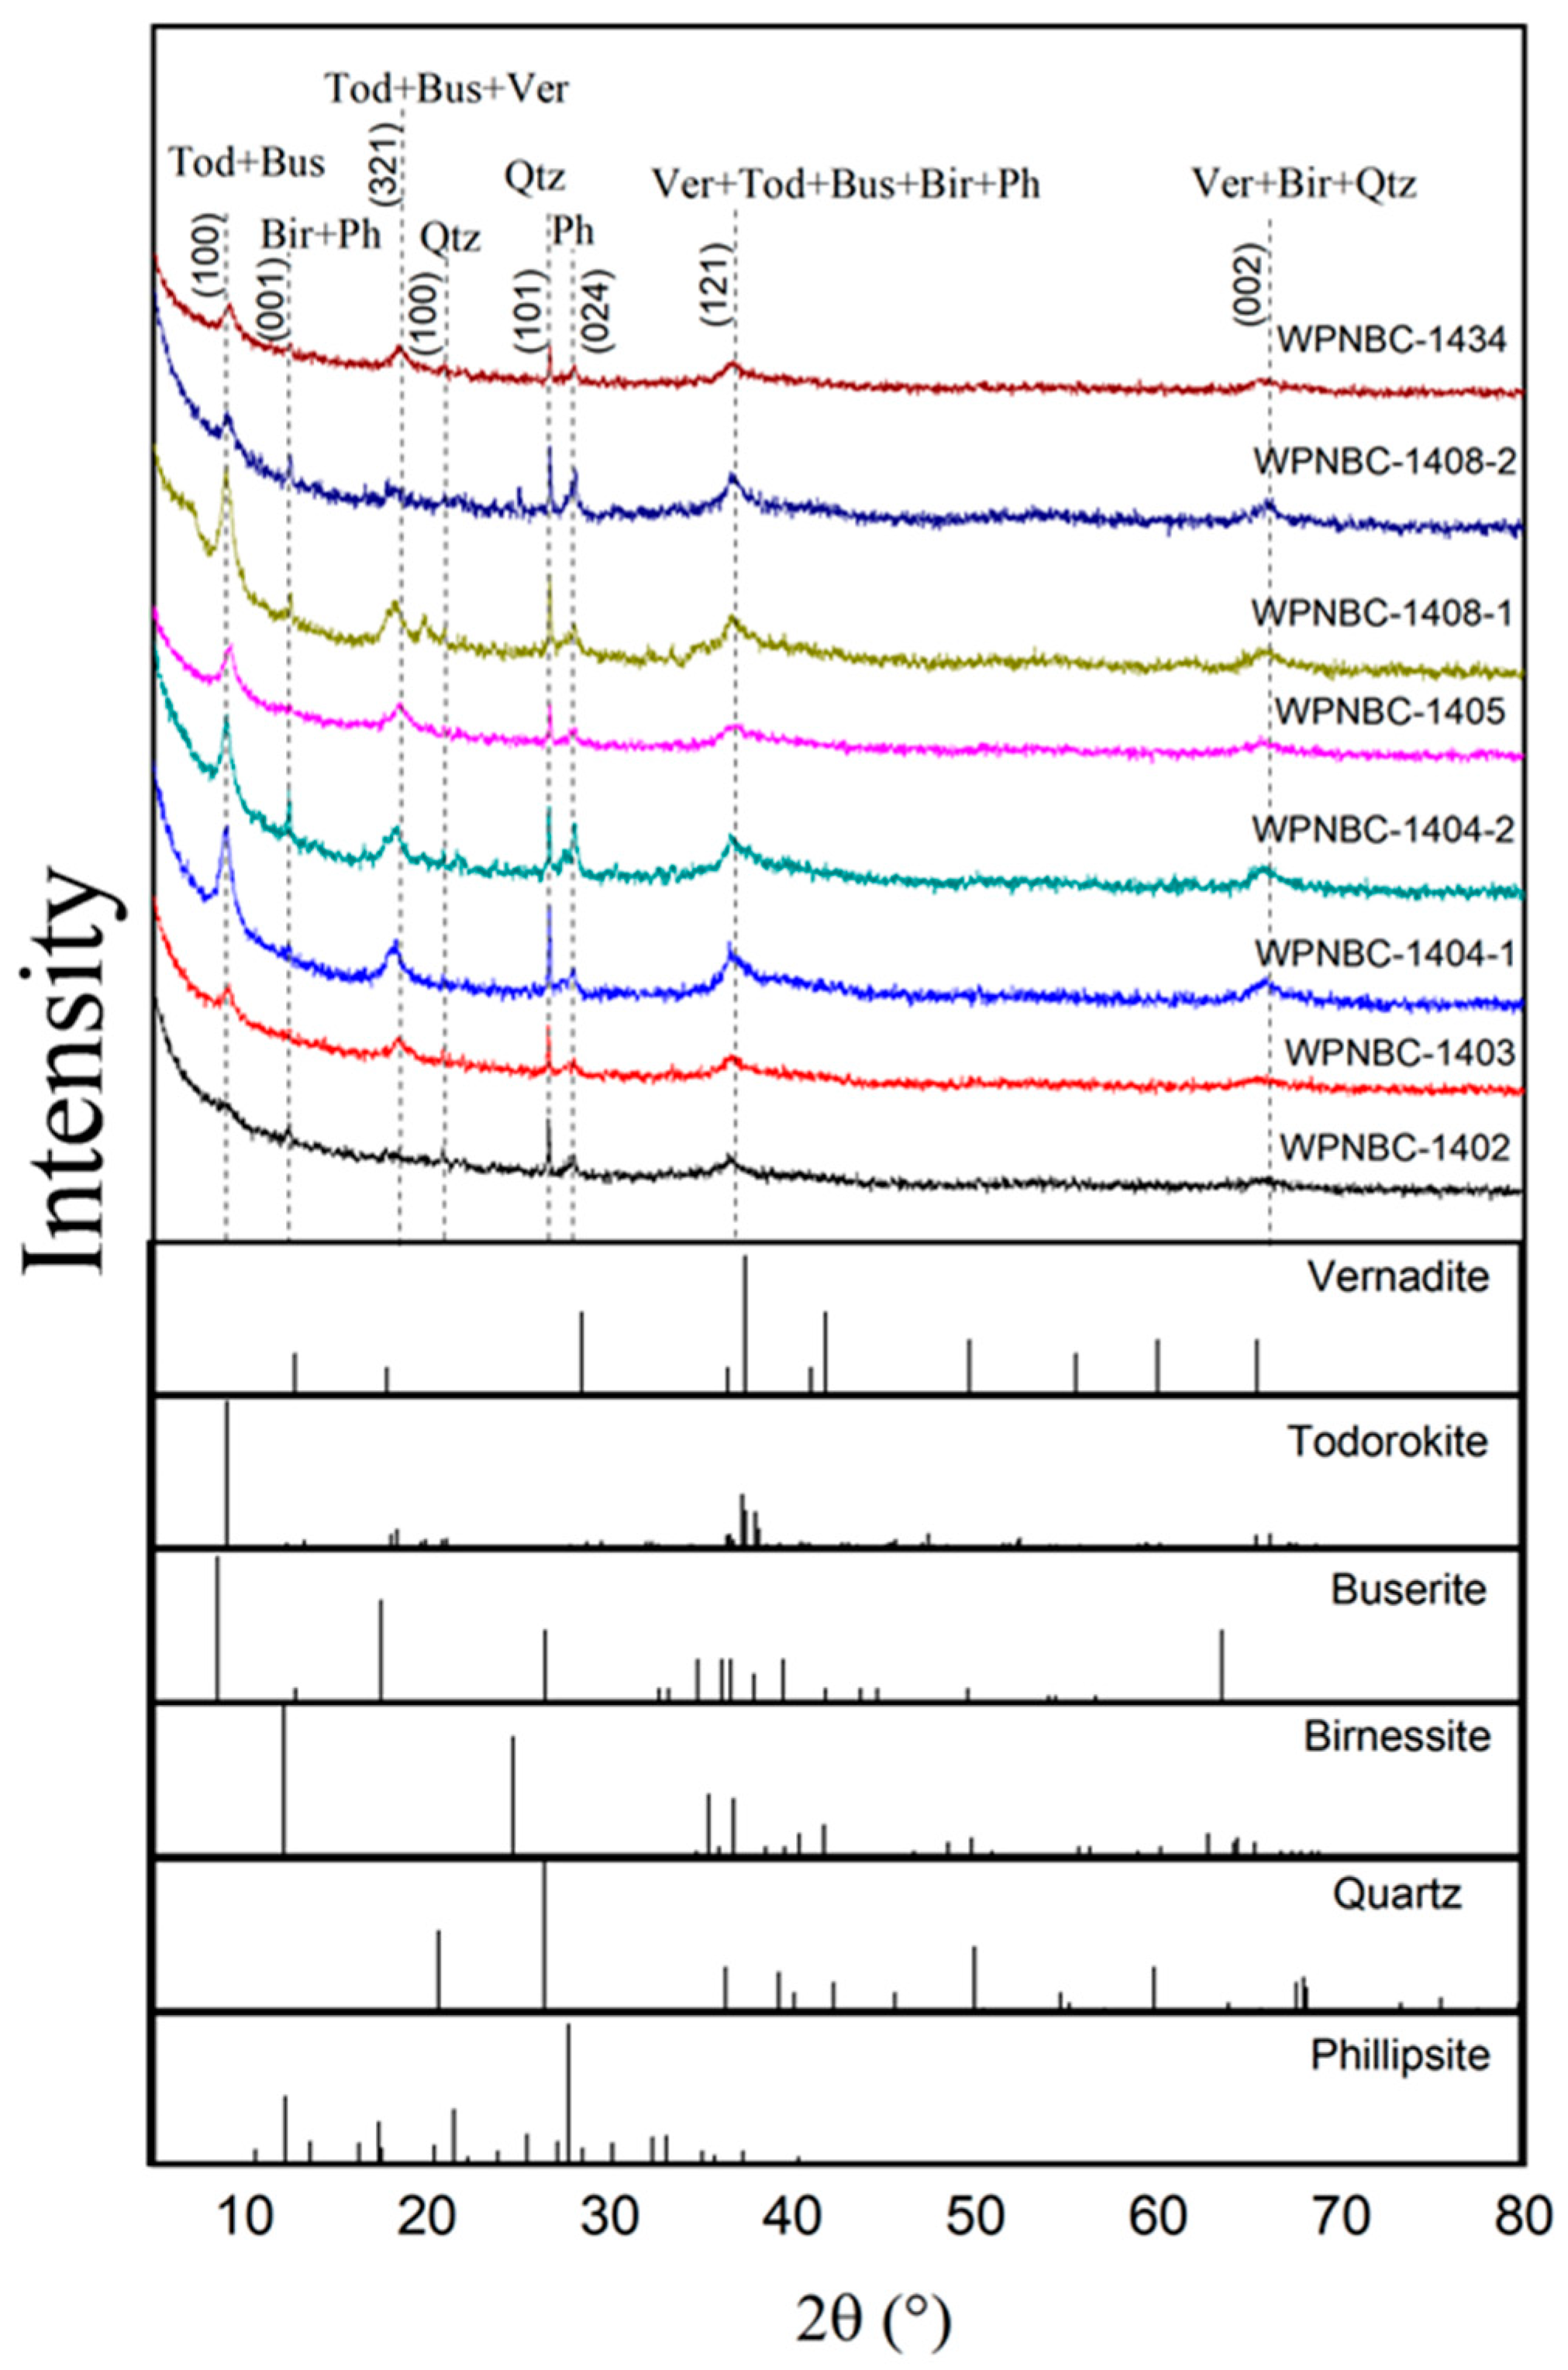
According to the whole-rock XRD patterns (Figure 4), the minerals of the Fe-Mn nodules from the IBSWP are primarily composed of vernadite, todorokite, buserite, birnessite, phillipsite, and quartz. In the XRD patterns, the main d values of vernadite (00-015-0604) and birnessite (00-043-1456) were 7.08 Å (001), 2.45 Å (121), and 1.42 Å (002); todorokite (00-038-0475) and buserite (00-032-1128)’s d values were 2.45 Å (121), 4.80 Å (321), and 9.80 Å (100); phillipsite (00-051-1497)’s d values were 7.08 Å (001), 3.20 Å (024), and 2.45 Å (121), and quartz (00-033-1161)’s d values were 1.42 Å (002), 3.34 Å (101), and 4.26 Å (100).
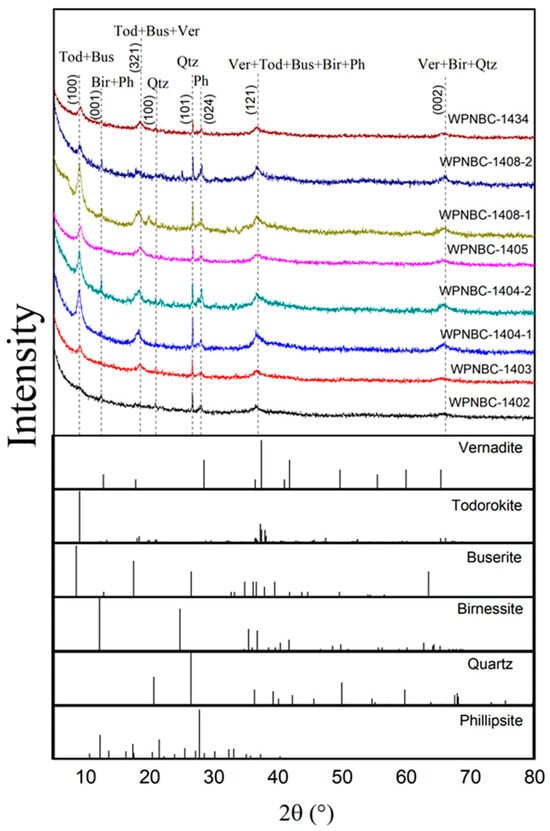
Figure 4.
XRD patterns of the Fe-Mn nodules from the IBSWP.(Tod: todorokite (d = 5.68 Å); Ver: vernadite (d = 3.63 Å); Qtz: quartz (d = 3.00 Å); Bus: buserite (d = 5.68 Å); Bir: birnessite (d = 3.63 Å); Ph: phillipsite (d = 4.24 Å); d(hkl) = Kλ/βcosθ, where K is the particle shape factor, 0.943; λ is the X-ray wavelength, 0.15406 nm; β is the half-width of the (hkl) reflection; and θ = 2θ/2 is the Bragg angle corresponding to the (hkl) reflection).
It is evident that the diffraction curves of the eight Fe-Mn nodules are relatively consistent, with most of the characteristic diffraction peaks exhibiting low intensity and wide breadth. This reflects the lower crystallinity of the corresponding minerals, such as vernadite, todorokite, buserite, birnessite, phillipsite, etc. A small portion of the diffraction peaks have high intensity, sharp peaks, and needle-like shapes, reflecting the high degree of crystallization of the corresponding minerals, such as quartz.
4.3. Infrared Spectrum Analysis
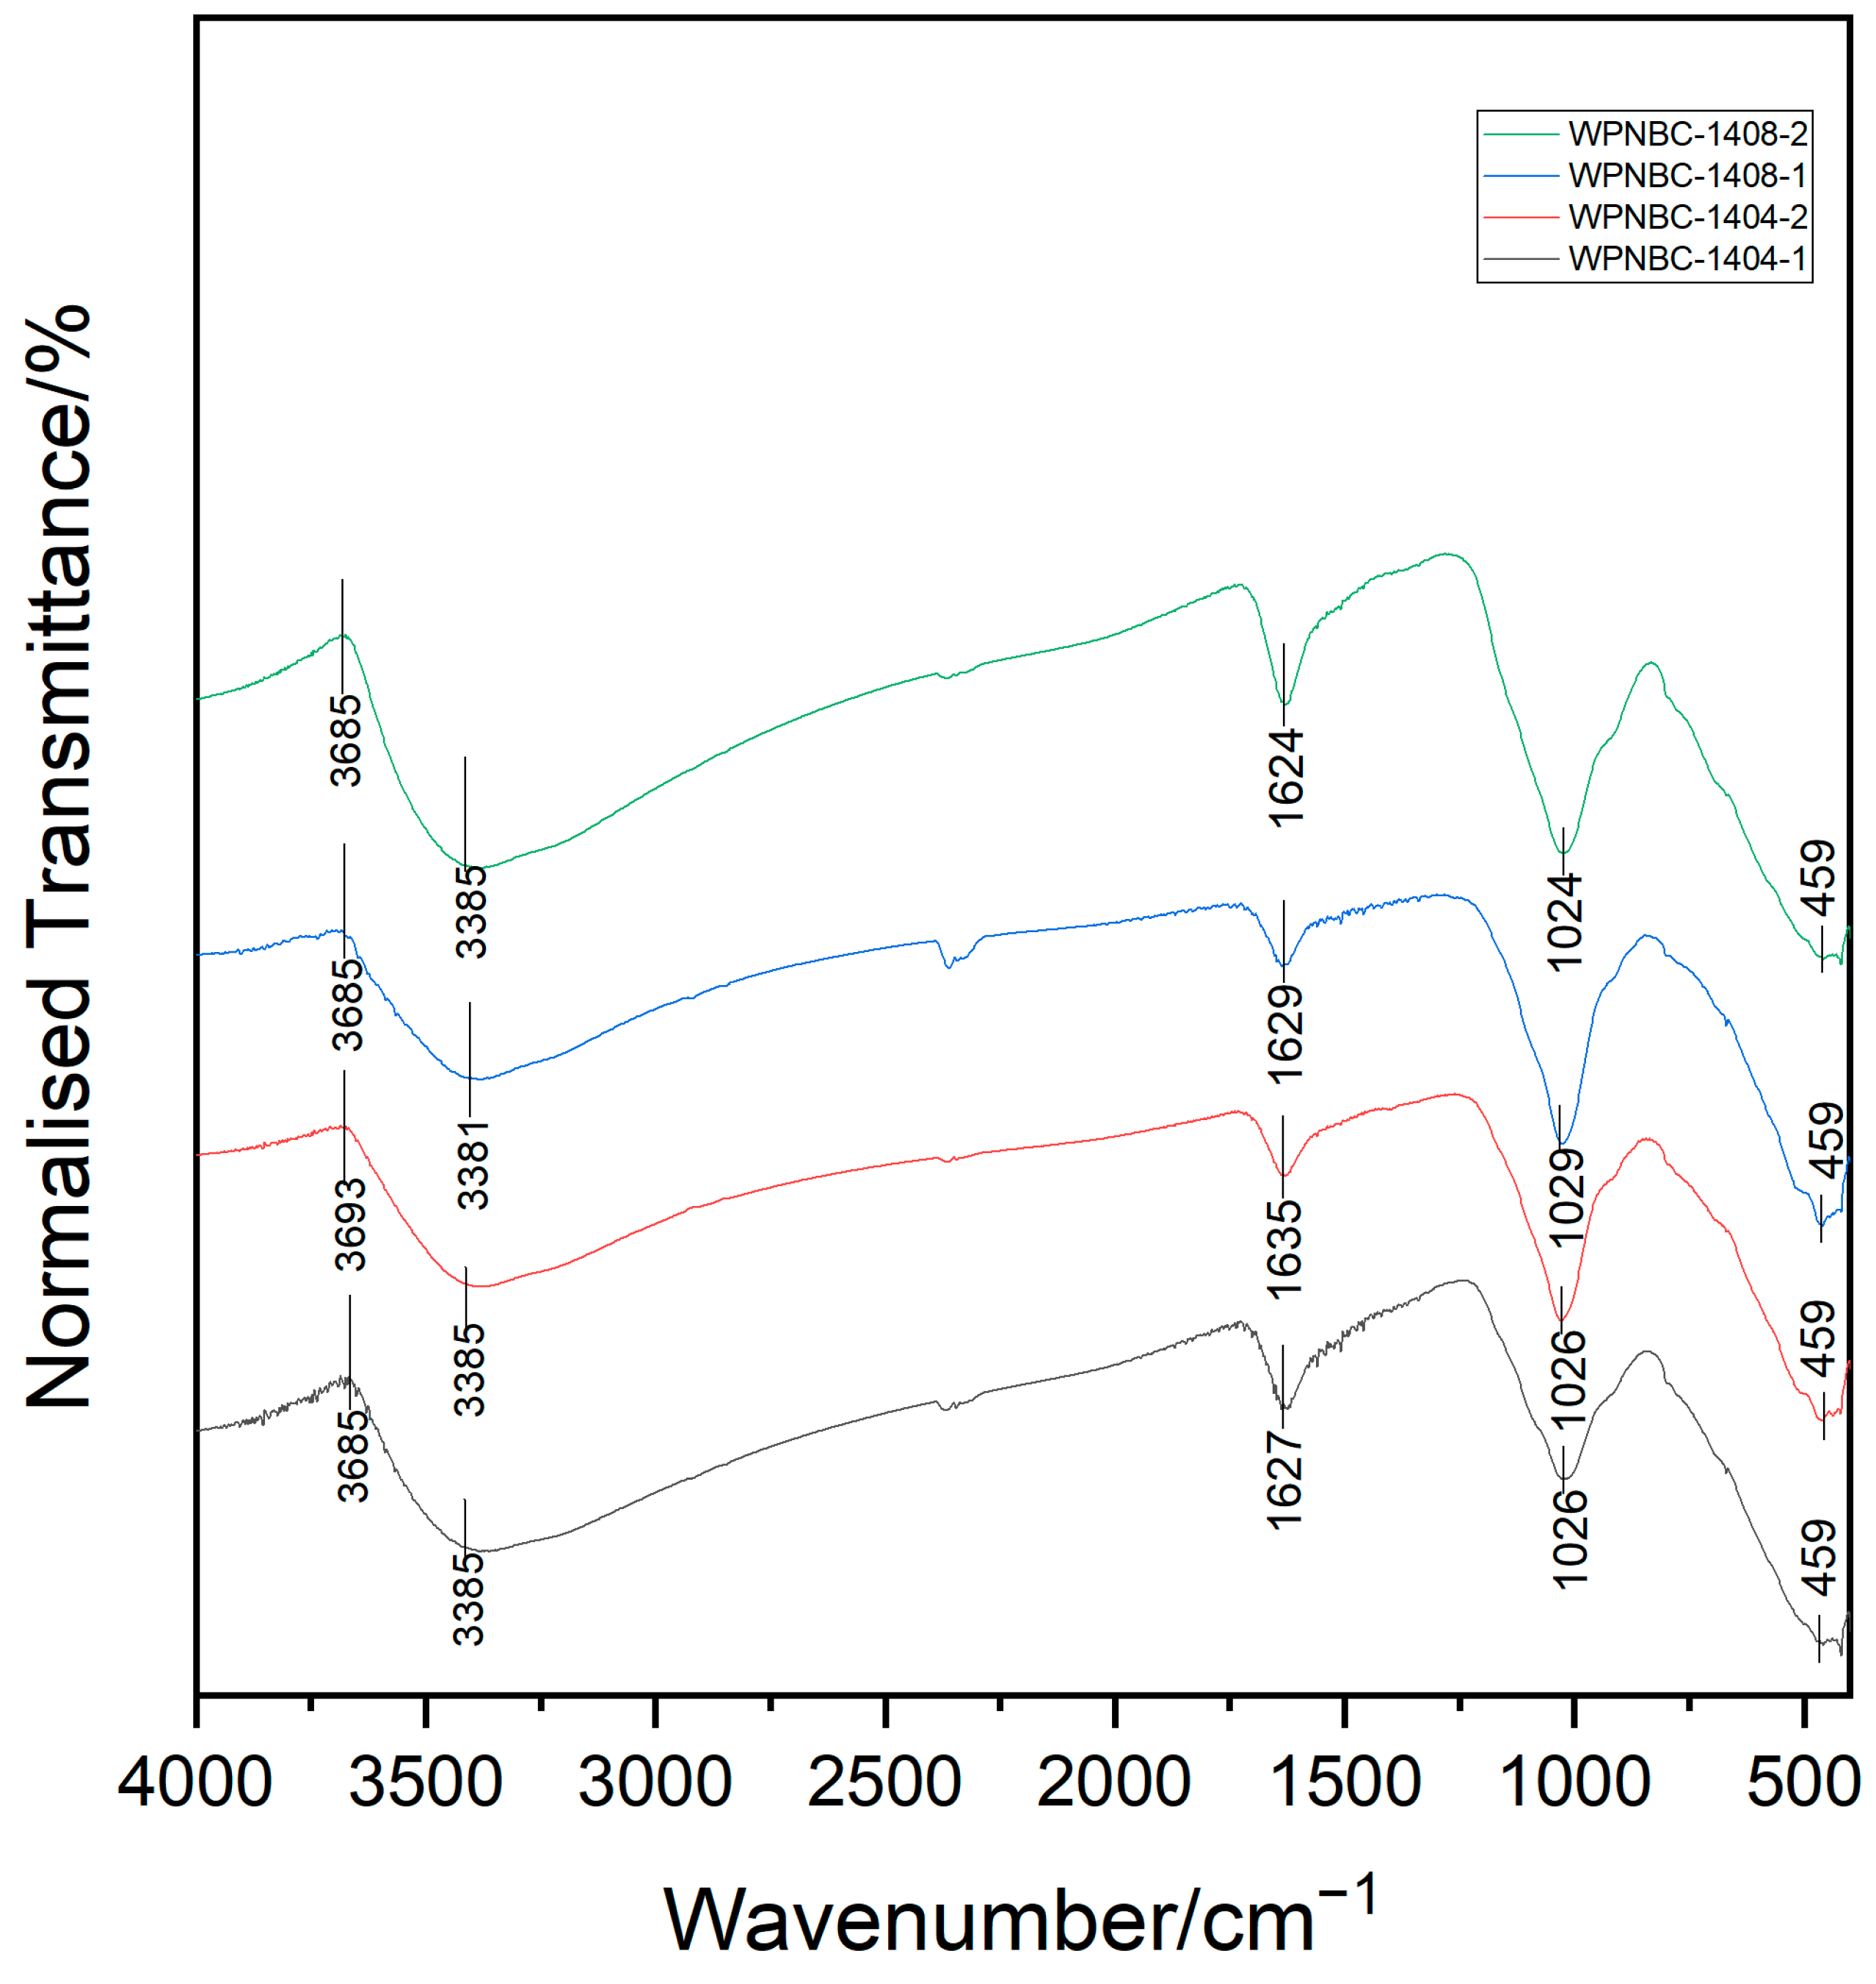
The infrared spectra of the Fe-Mn nodules from the IBSWP are shown in Figure 5, and the spectral characteristics of the four samples are relatively consistent. In the characteristic frequency range of the spectrum (4000–1300 cm−1), there are absorption peaks at 3381–3385 cm−1, which are recognized as the stretching vibration bands of the neutral H2O molecules (3650–2700 cm−1). The absorption peaks at 1624–1635 cm−1 are bending vibration bands of neutral H2O molecules (1680–1560 cm−1); the dense absorption peak of 1580~1320 cm−1 is the absorption band of O-H and inorganic C-O (1480–1580 cm−1, Marino et al., 2019) [29].
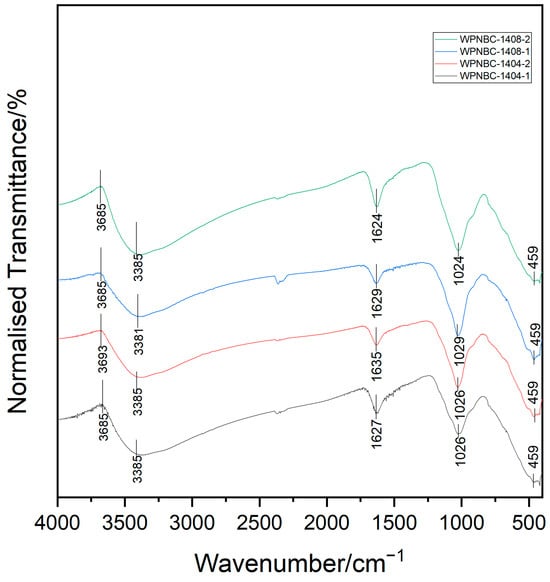
Figure 5.
Infrared spectra of the Fe-Mn nodules from the IBSWP.
4.4. TEM and EDS
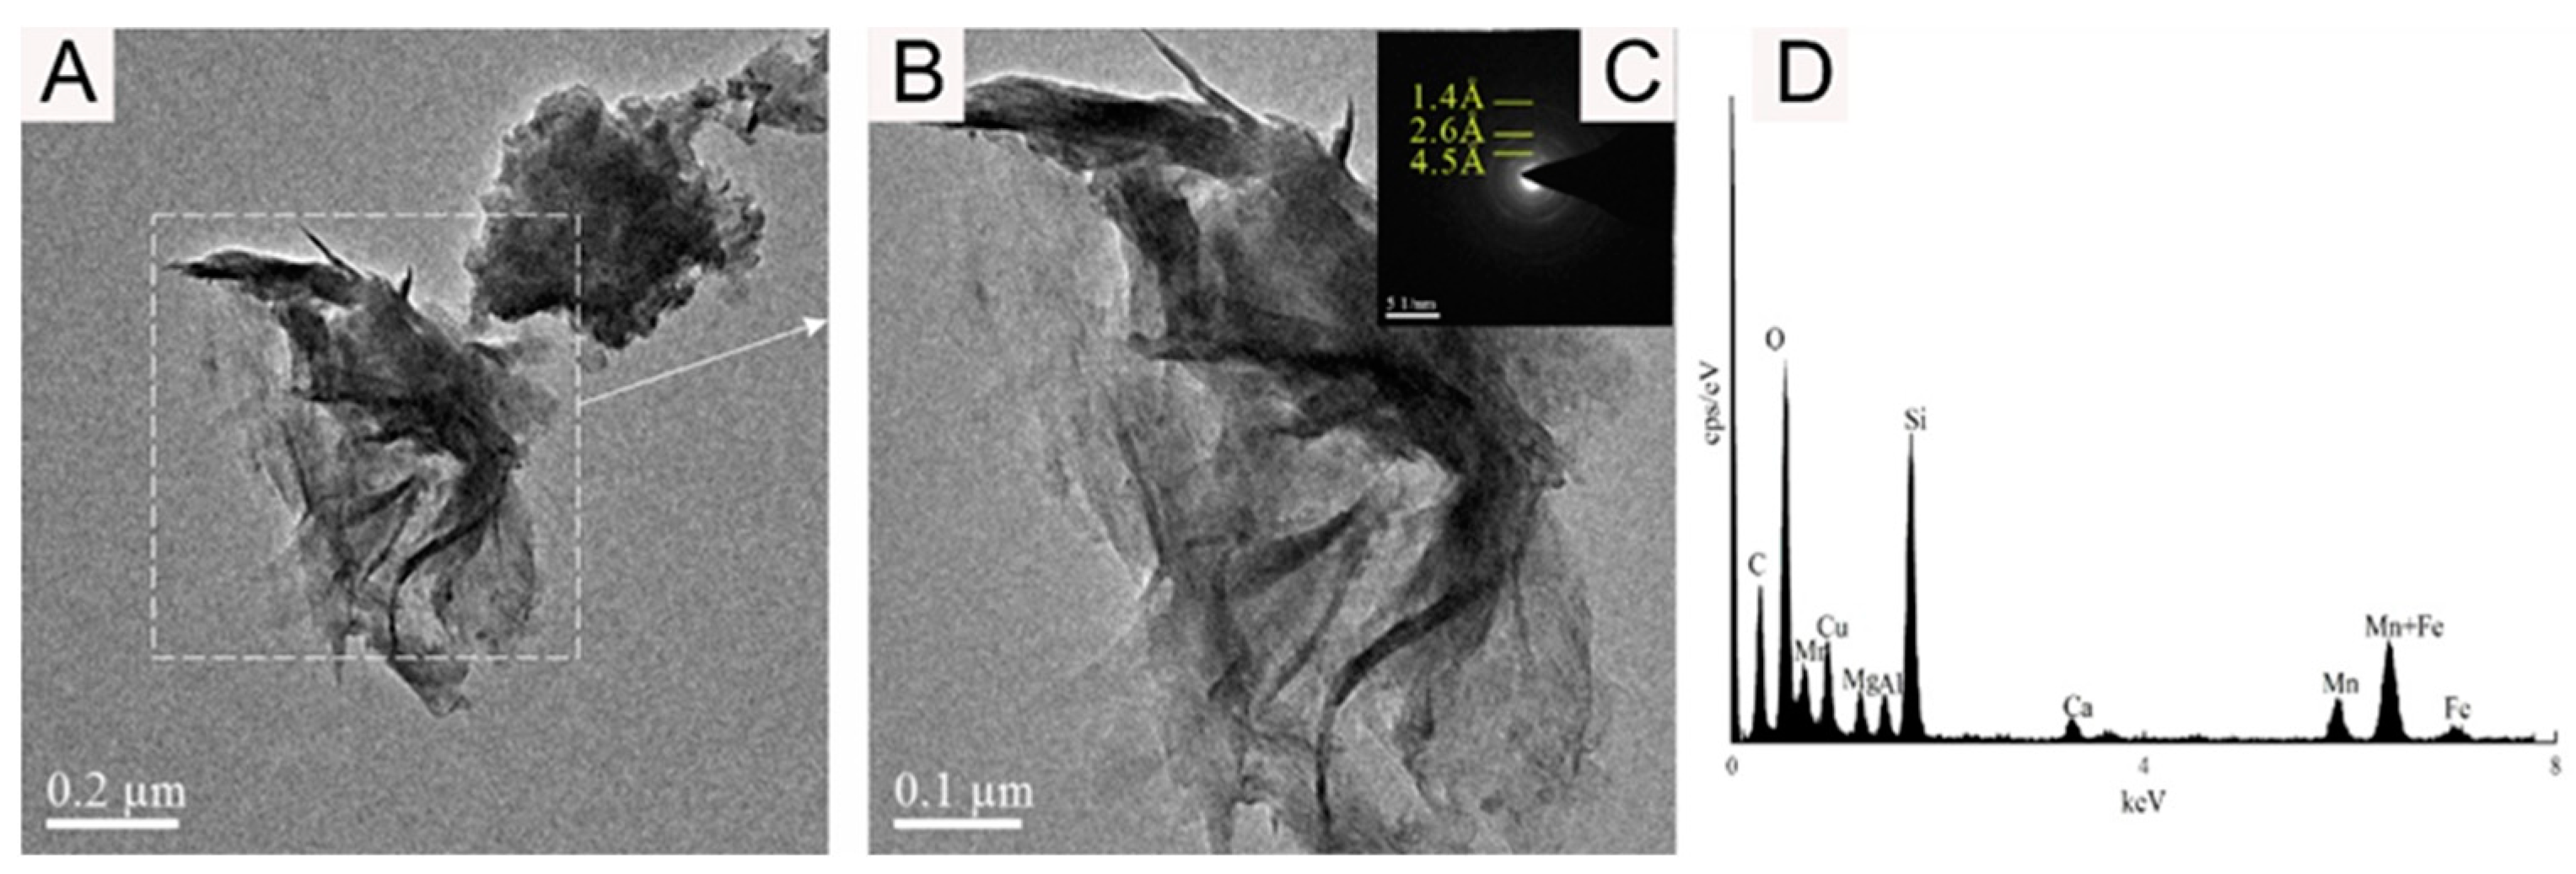
The TEM-EDS results are shown in Figure 6, Figure 7, Figure 8 and Figure 9. The analysis shows that the mineral micromorphology mainly presents the micrometer or even the nanometer particles, and the Fe-Mn minerals consist mainly of layered and fibrous nanoscale minerals. According to the EDS spectroscopy, in addition to the Fe-Mn minerals, there may also be colloidal minerals of Al or Si. The prominent signal peak of the Cu element in the EDS spectroscopy is commonly attributed to the presence of the copper mesh carrier in transmission electron microscopy experiments.
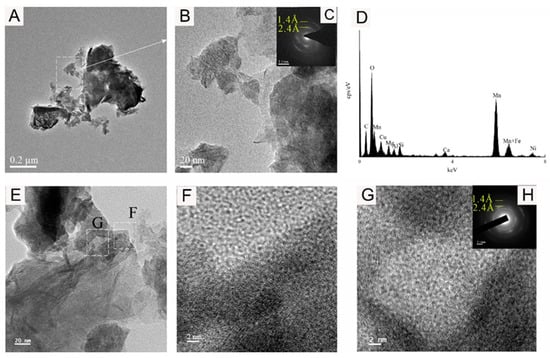
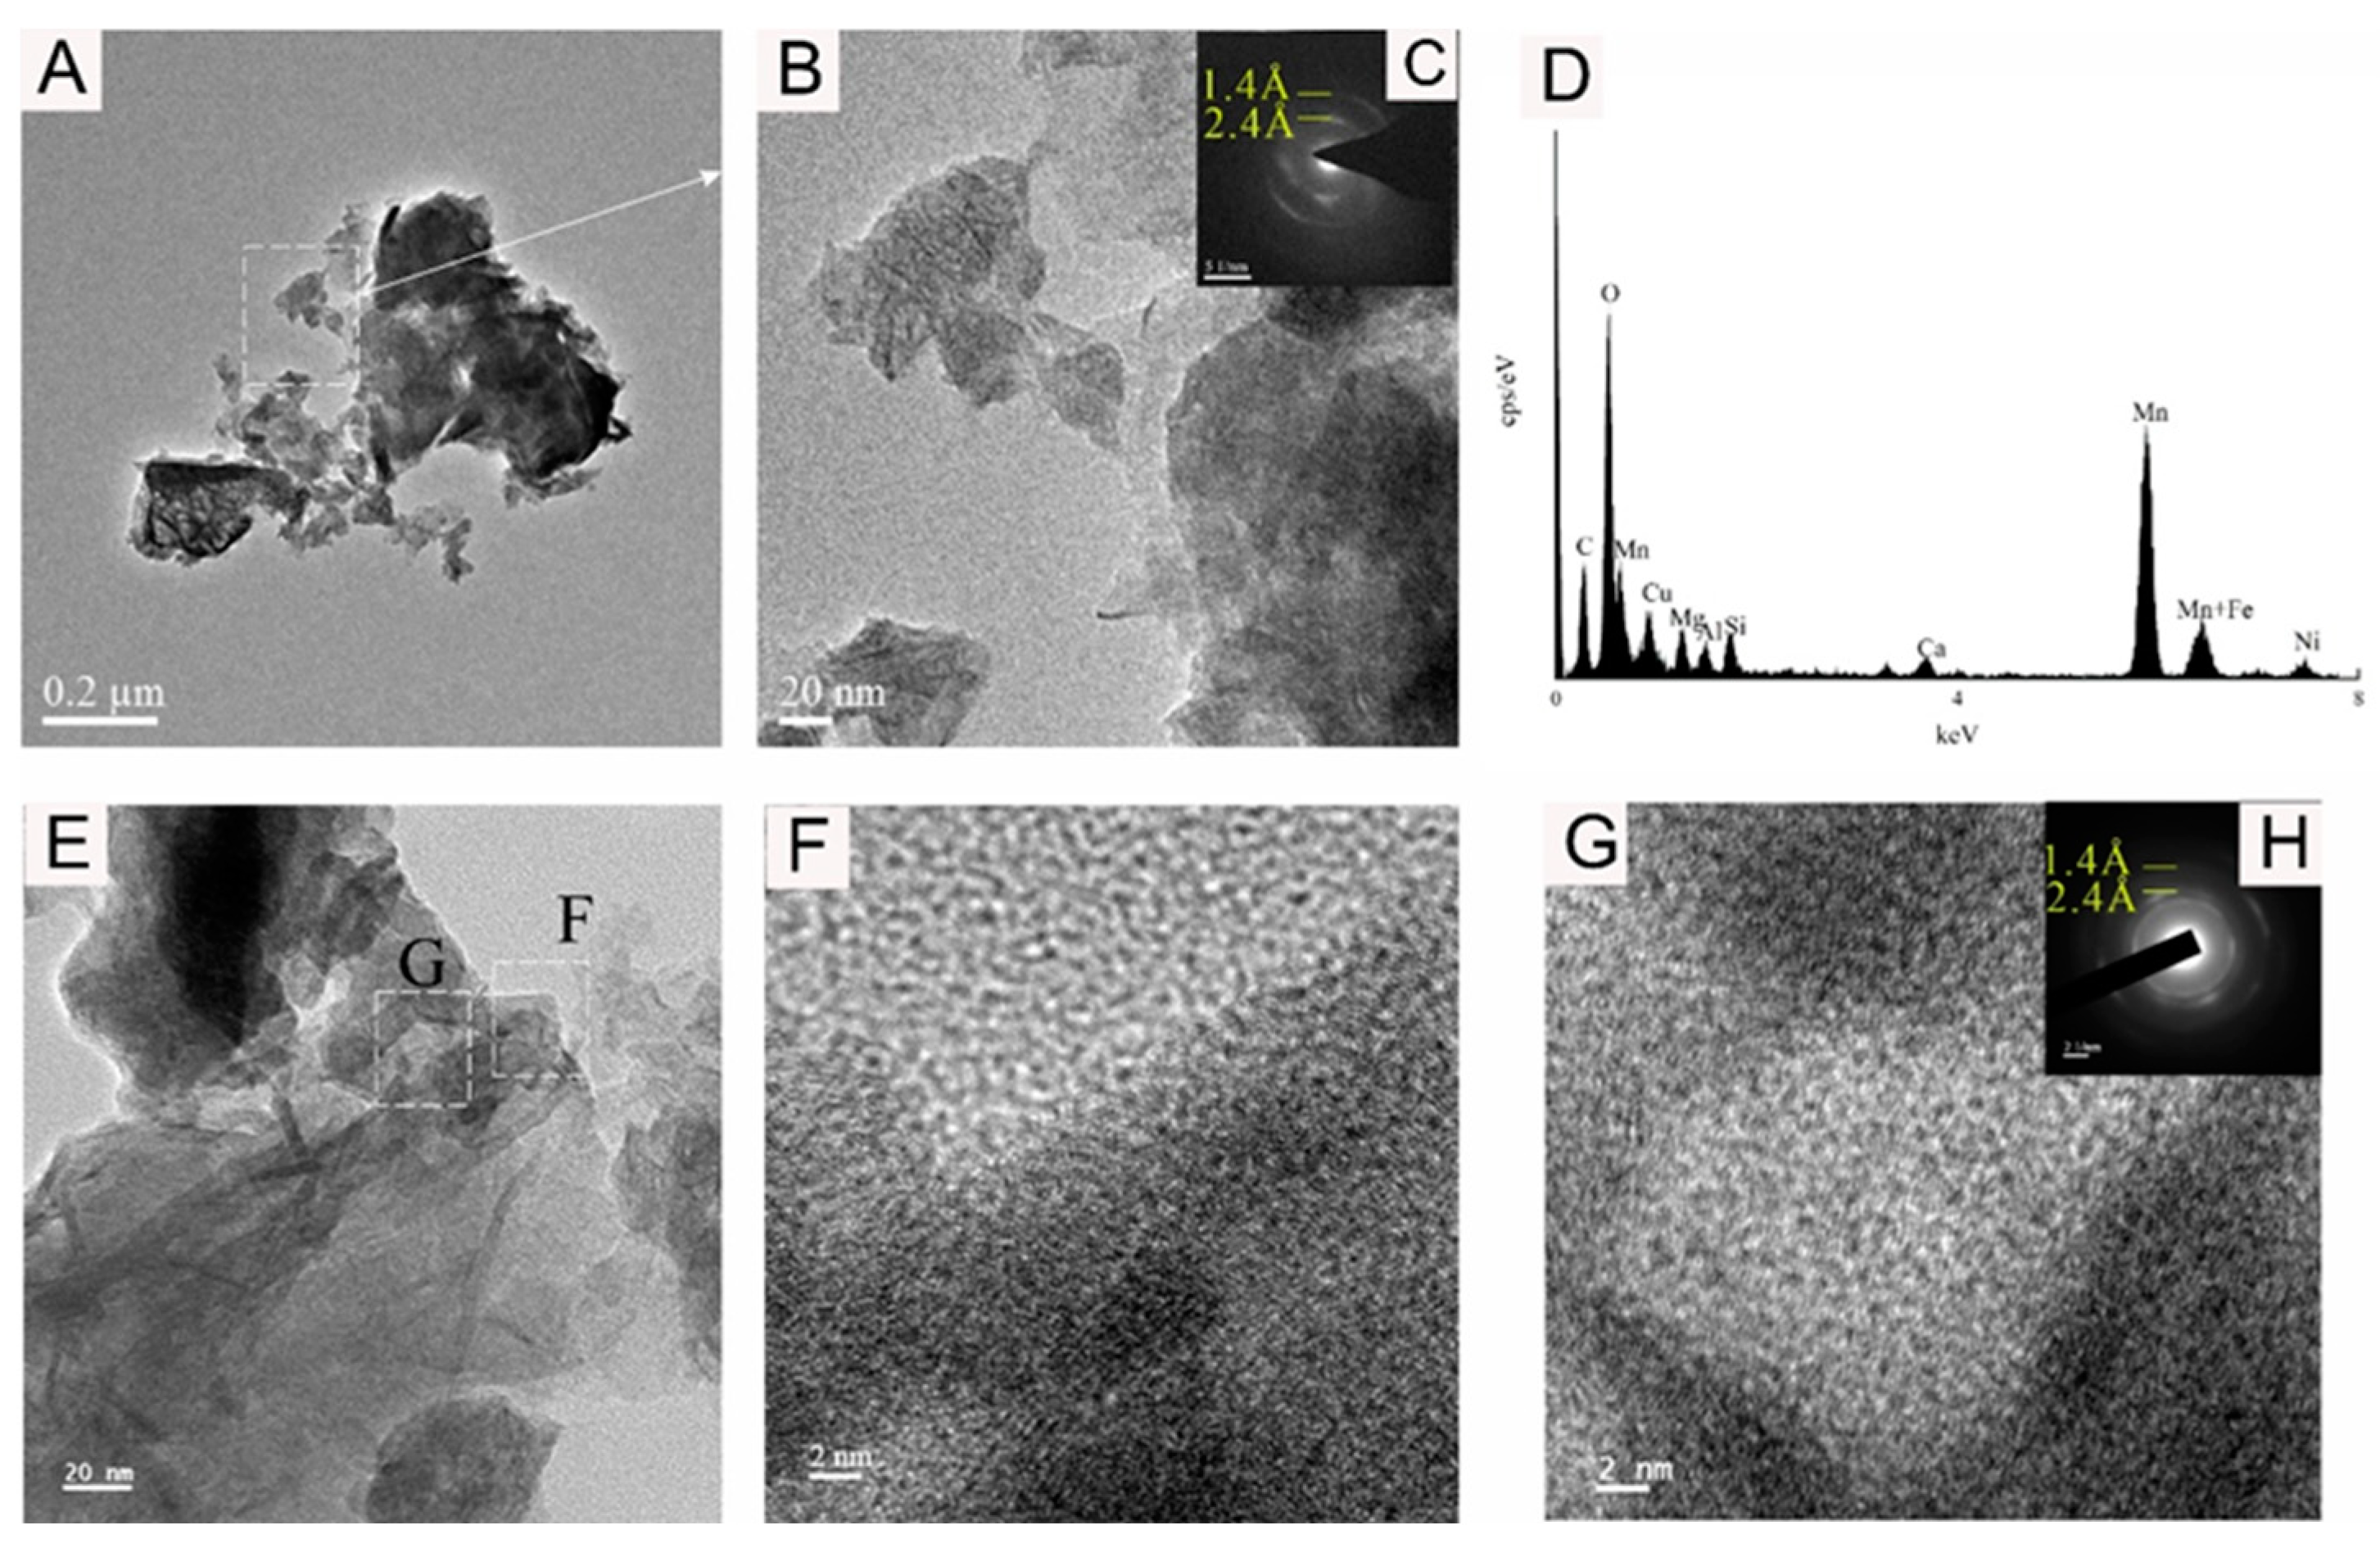
Figure 6.
Bright-field TEM (A,B,E–G), SAED (C,H), and EDS images (D) showing the vernadite nanoparticle of sample WPNBC1404-1.
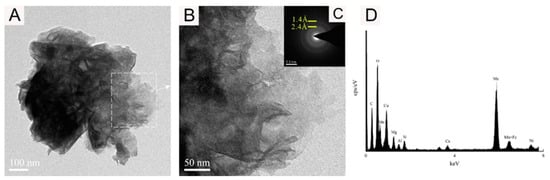
Figure 7.
Bright-field TEM (A,B), SAED images (C), and EDS images (D) showing the vernadite nanoparticle of sample WPNBC1404-2.
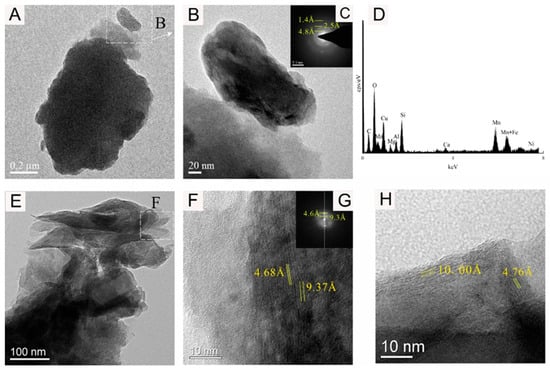
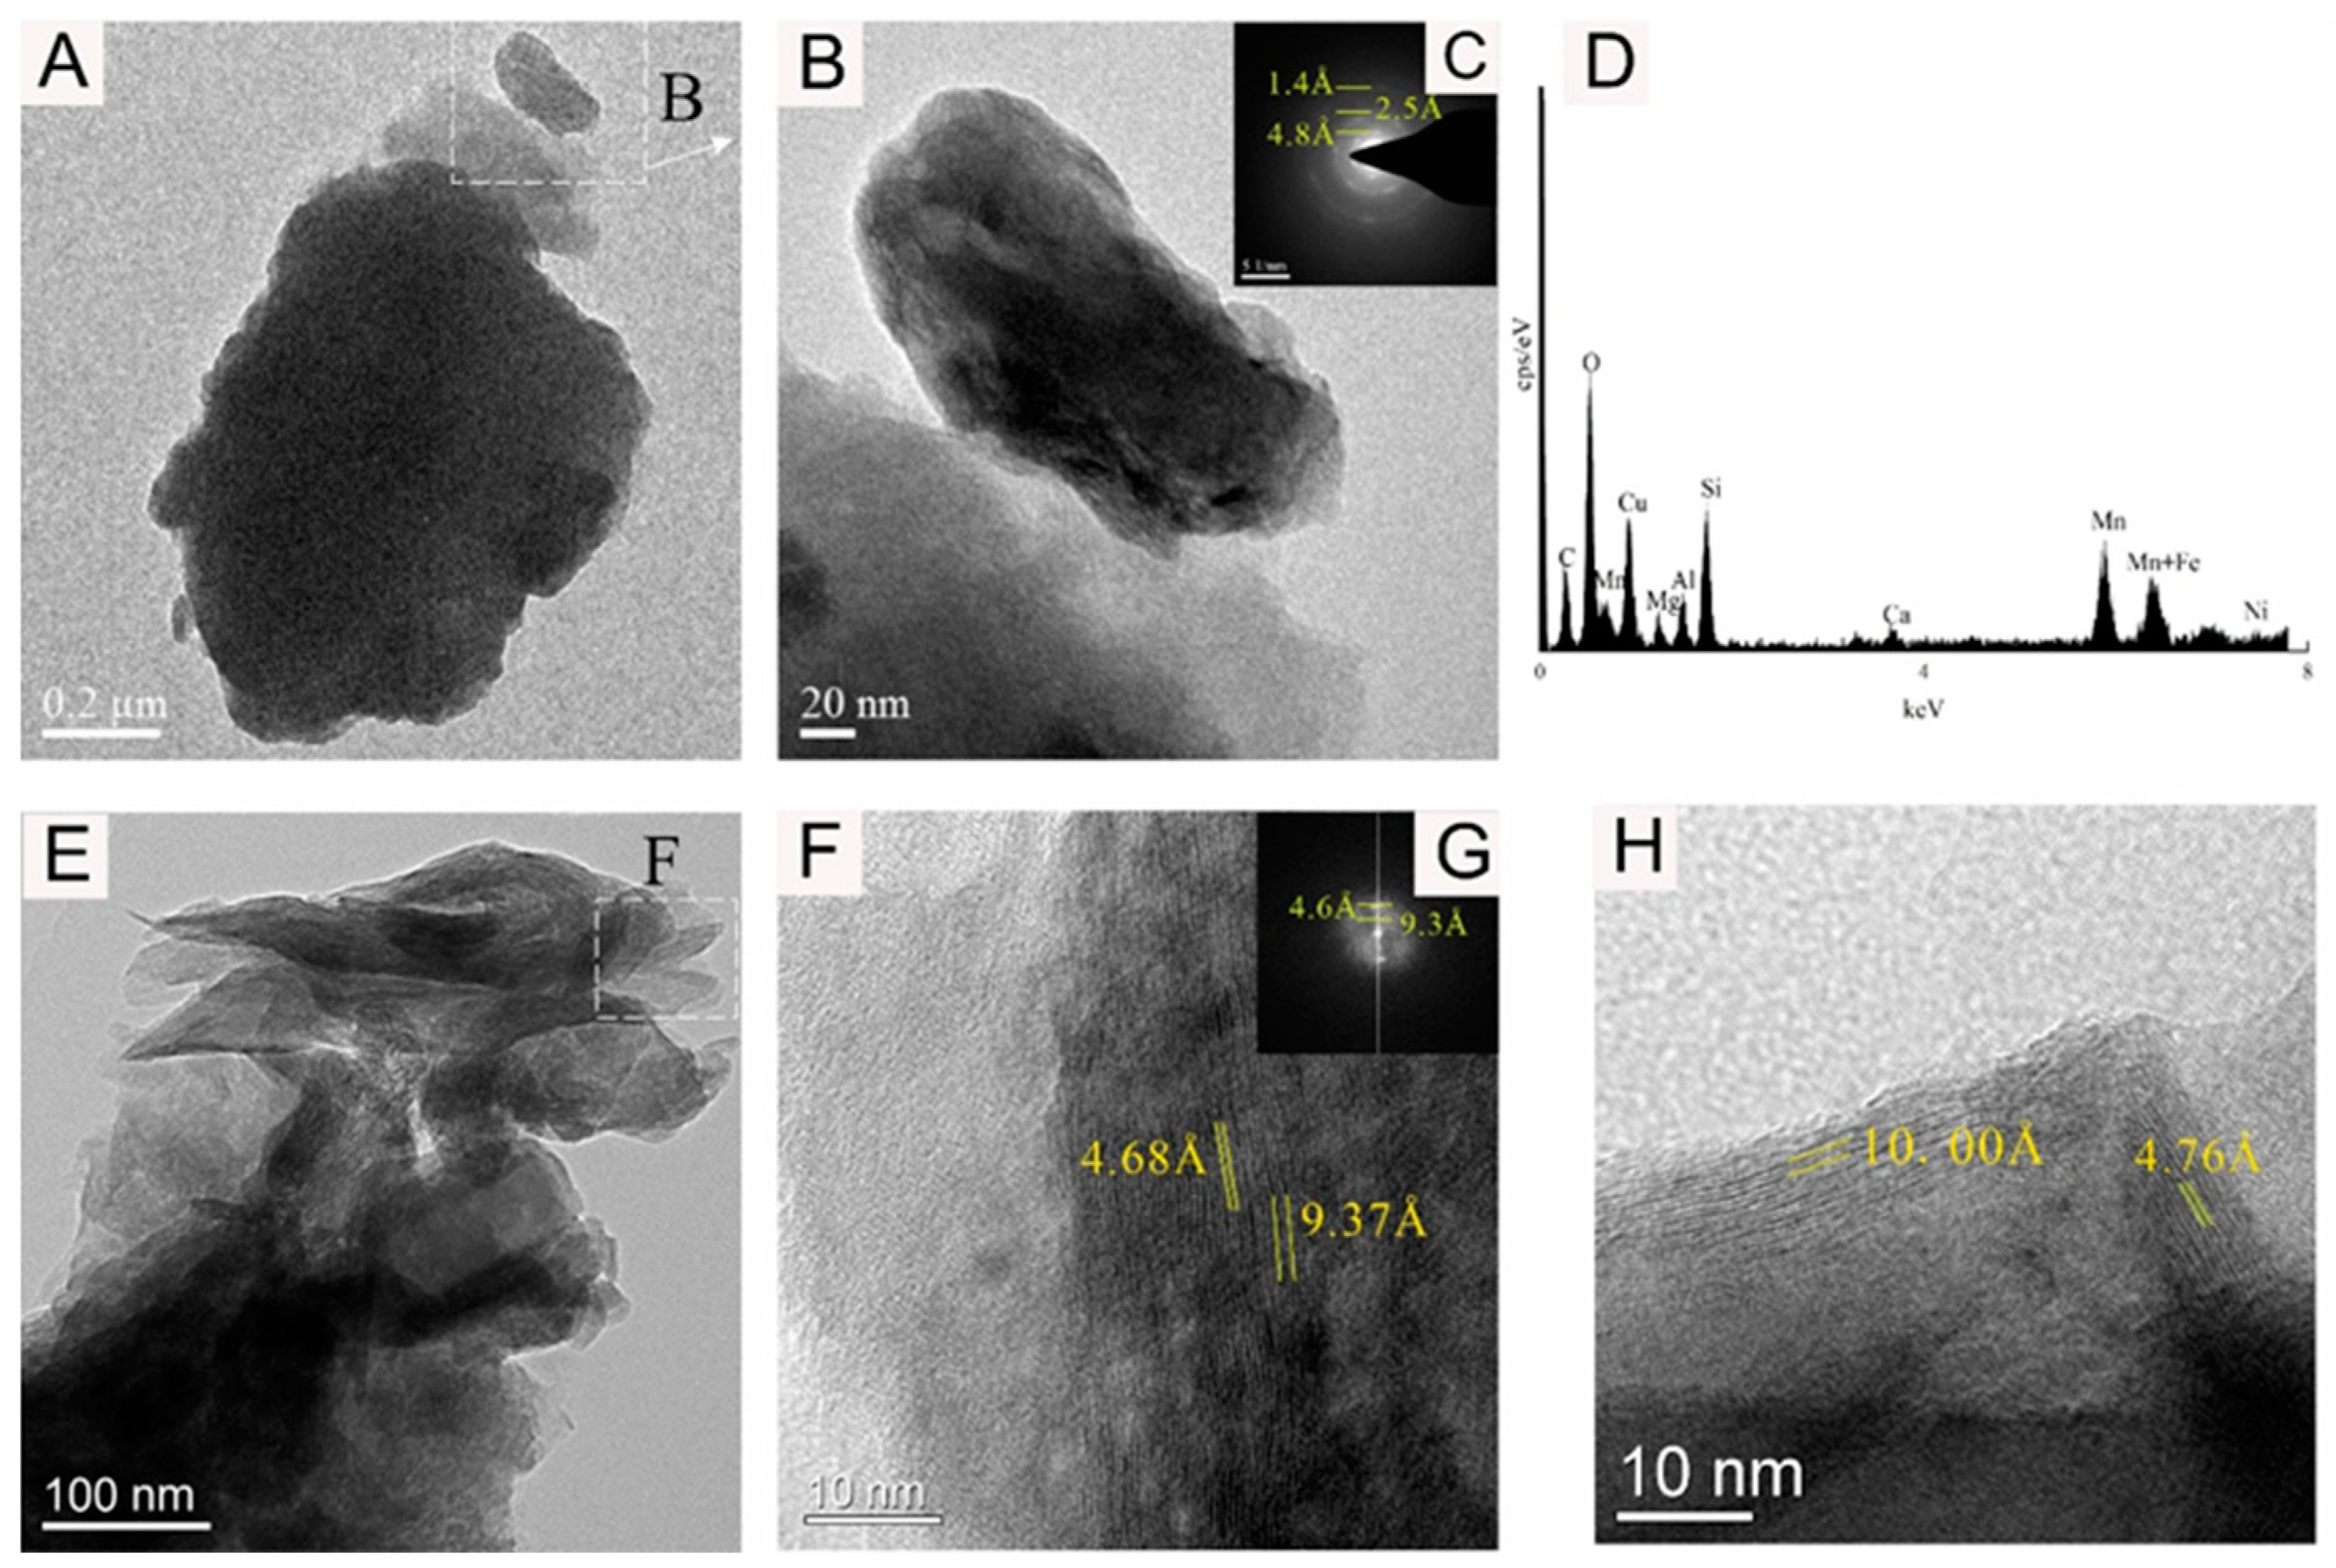
Figure 8.
Bright-field TEM (A,B,E–H), FFT images (C,G), and EDS images (D) showing the 10 Å Mn-phase mineral nanoparticle of sample WPNBC1408-1.
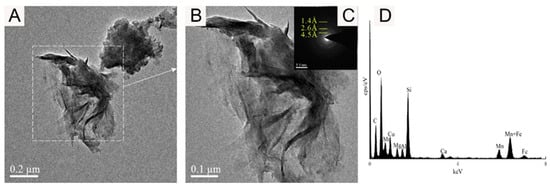
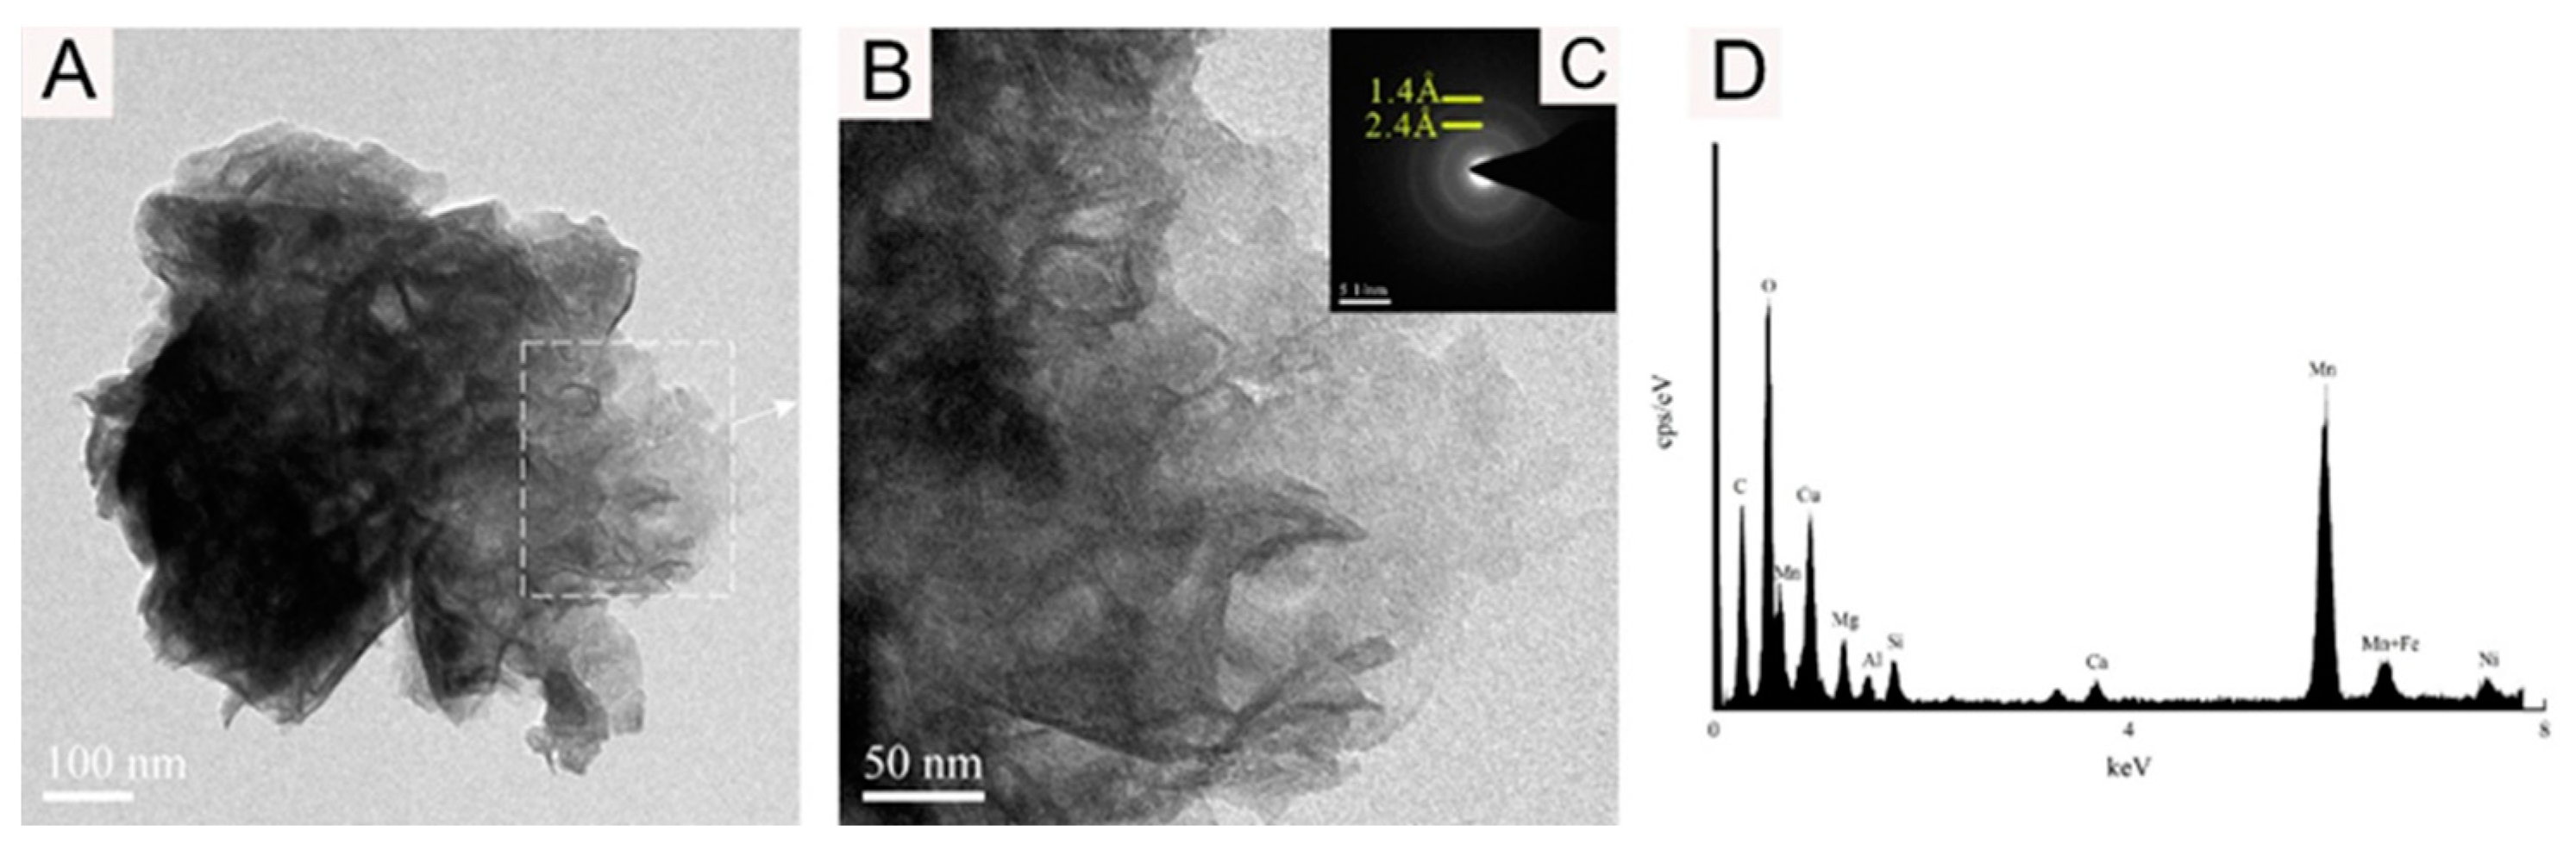
Figure 9.
Bright-field TEM (A,B), SAED images (C), and EDS images (D) showing the FeOOH nanoparticle of sample WPNBC1404-1.
4.5. Nanoporous Structure
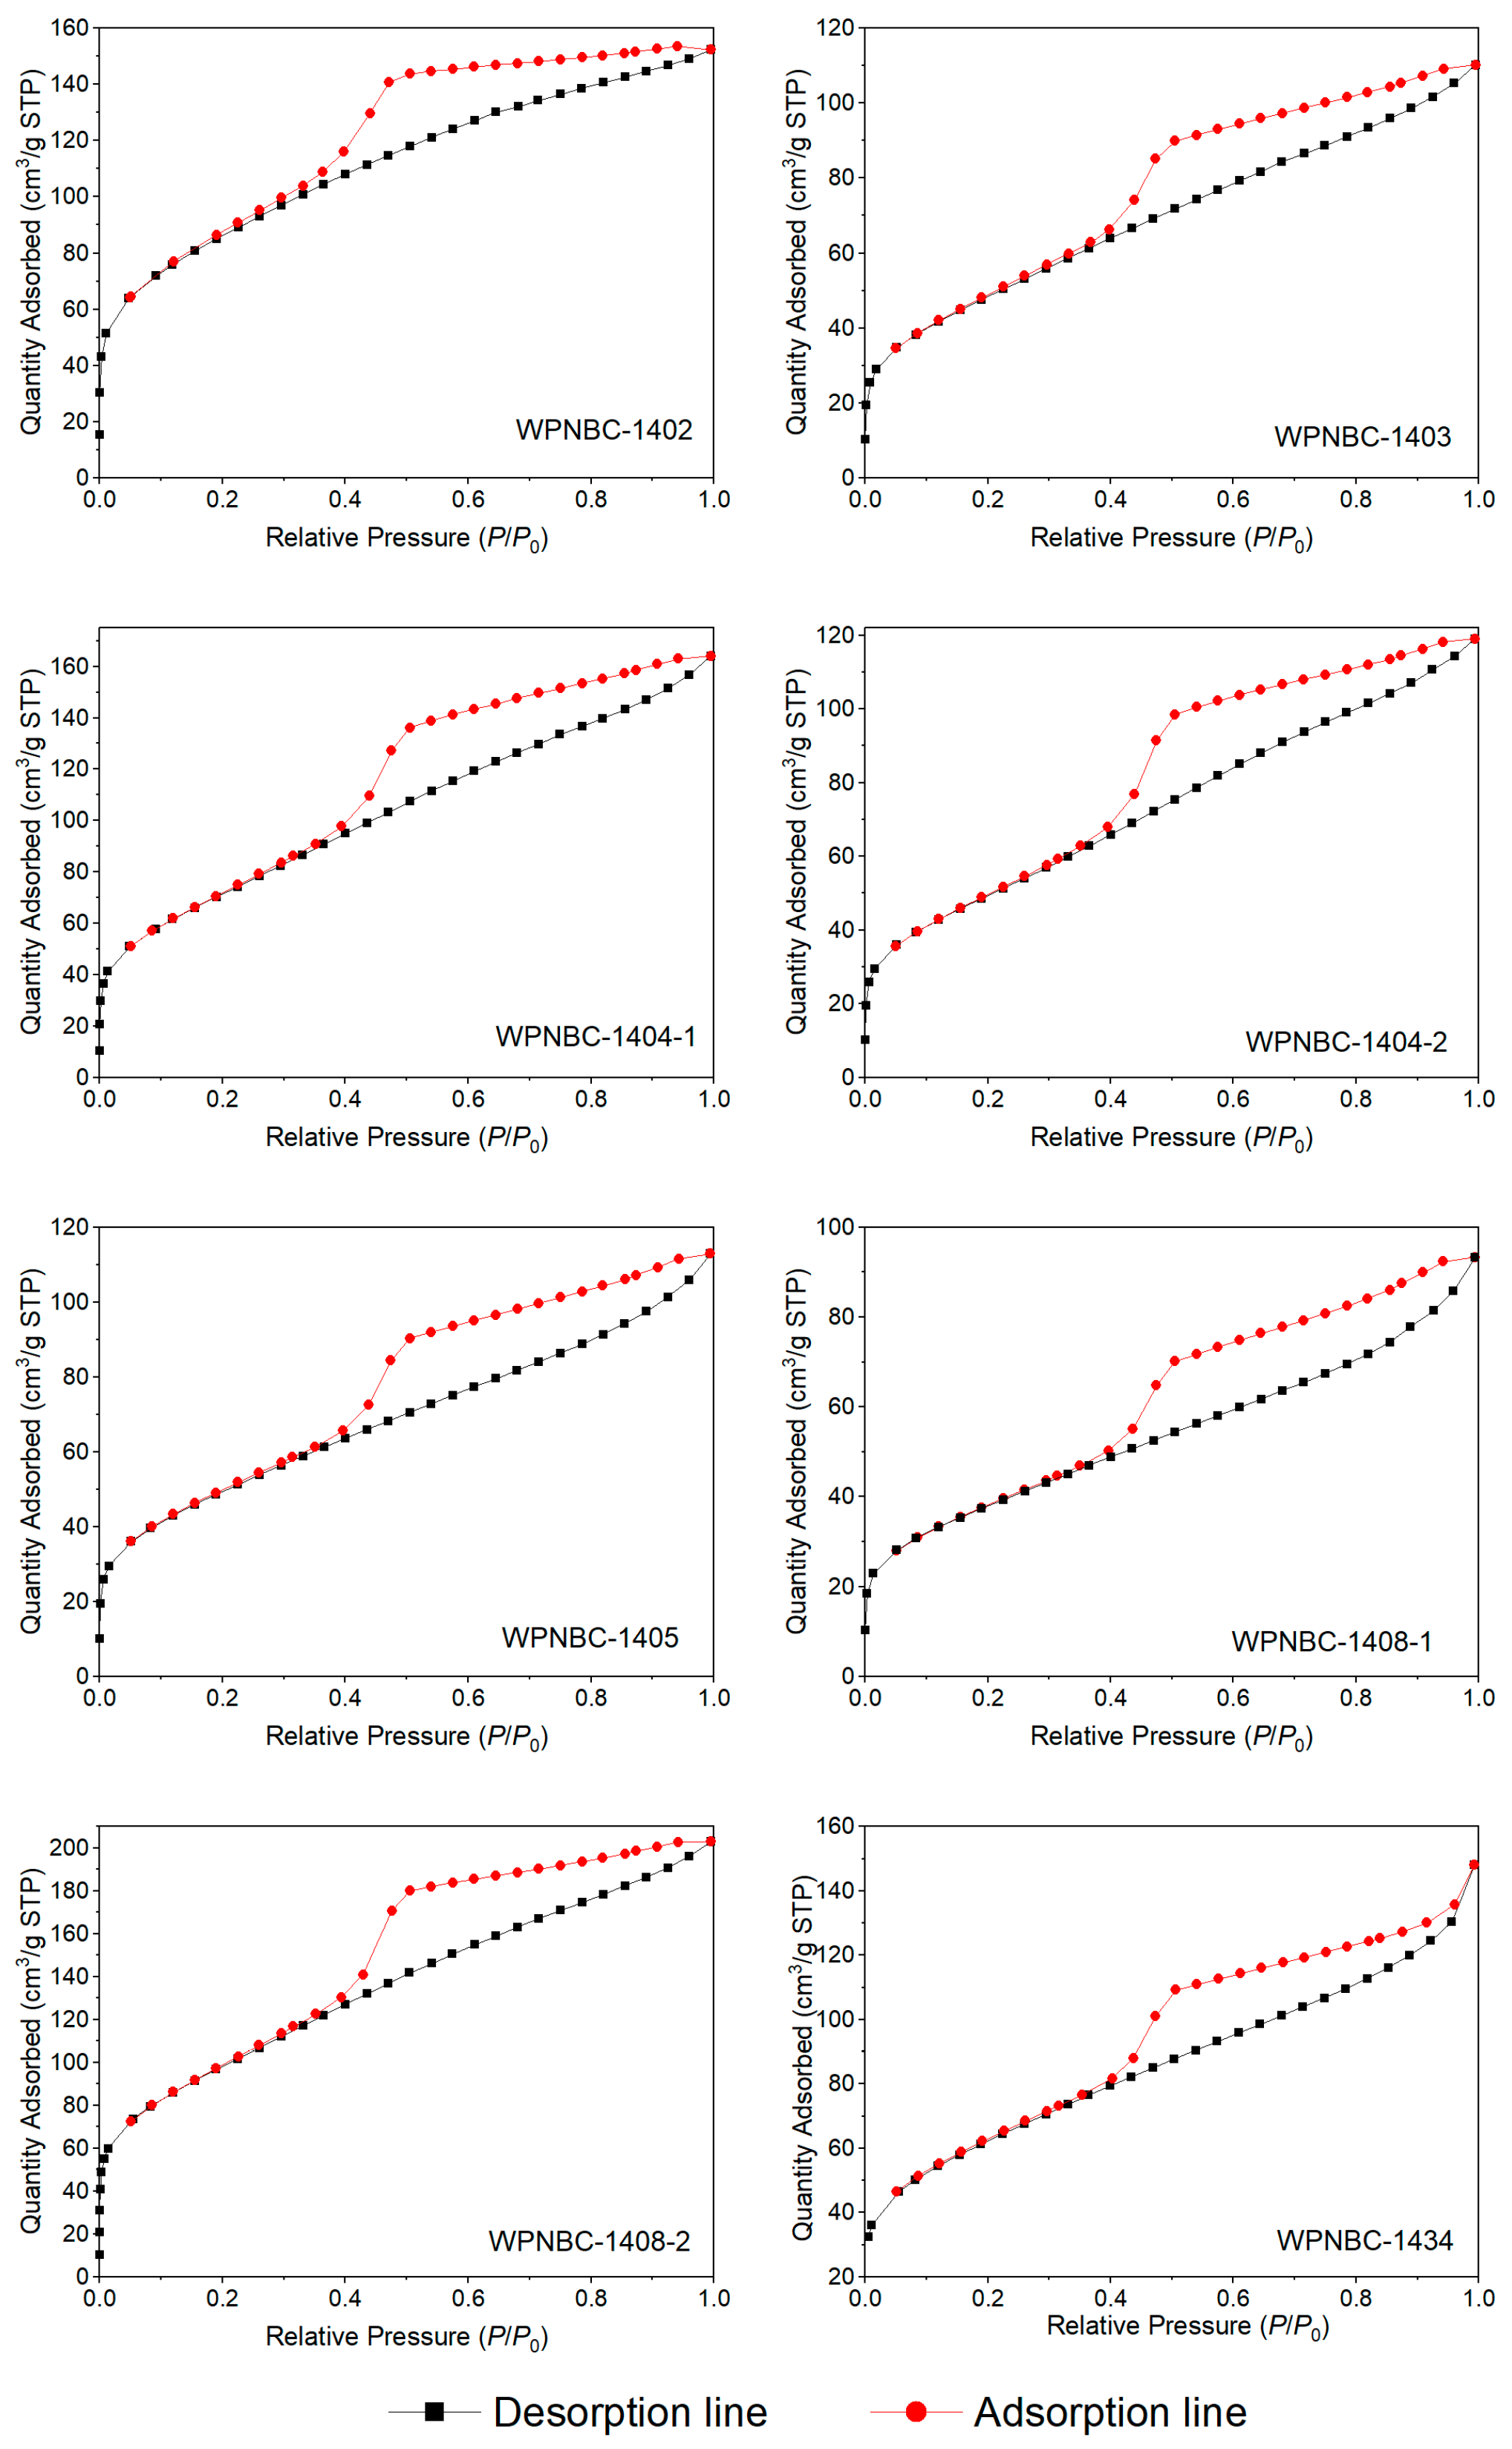
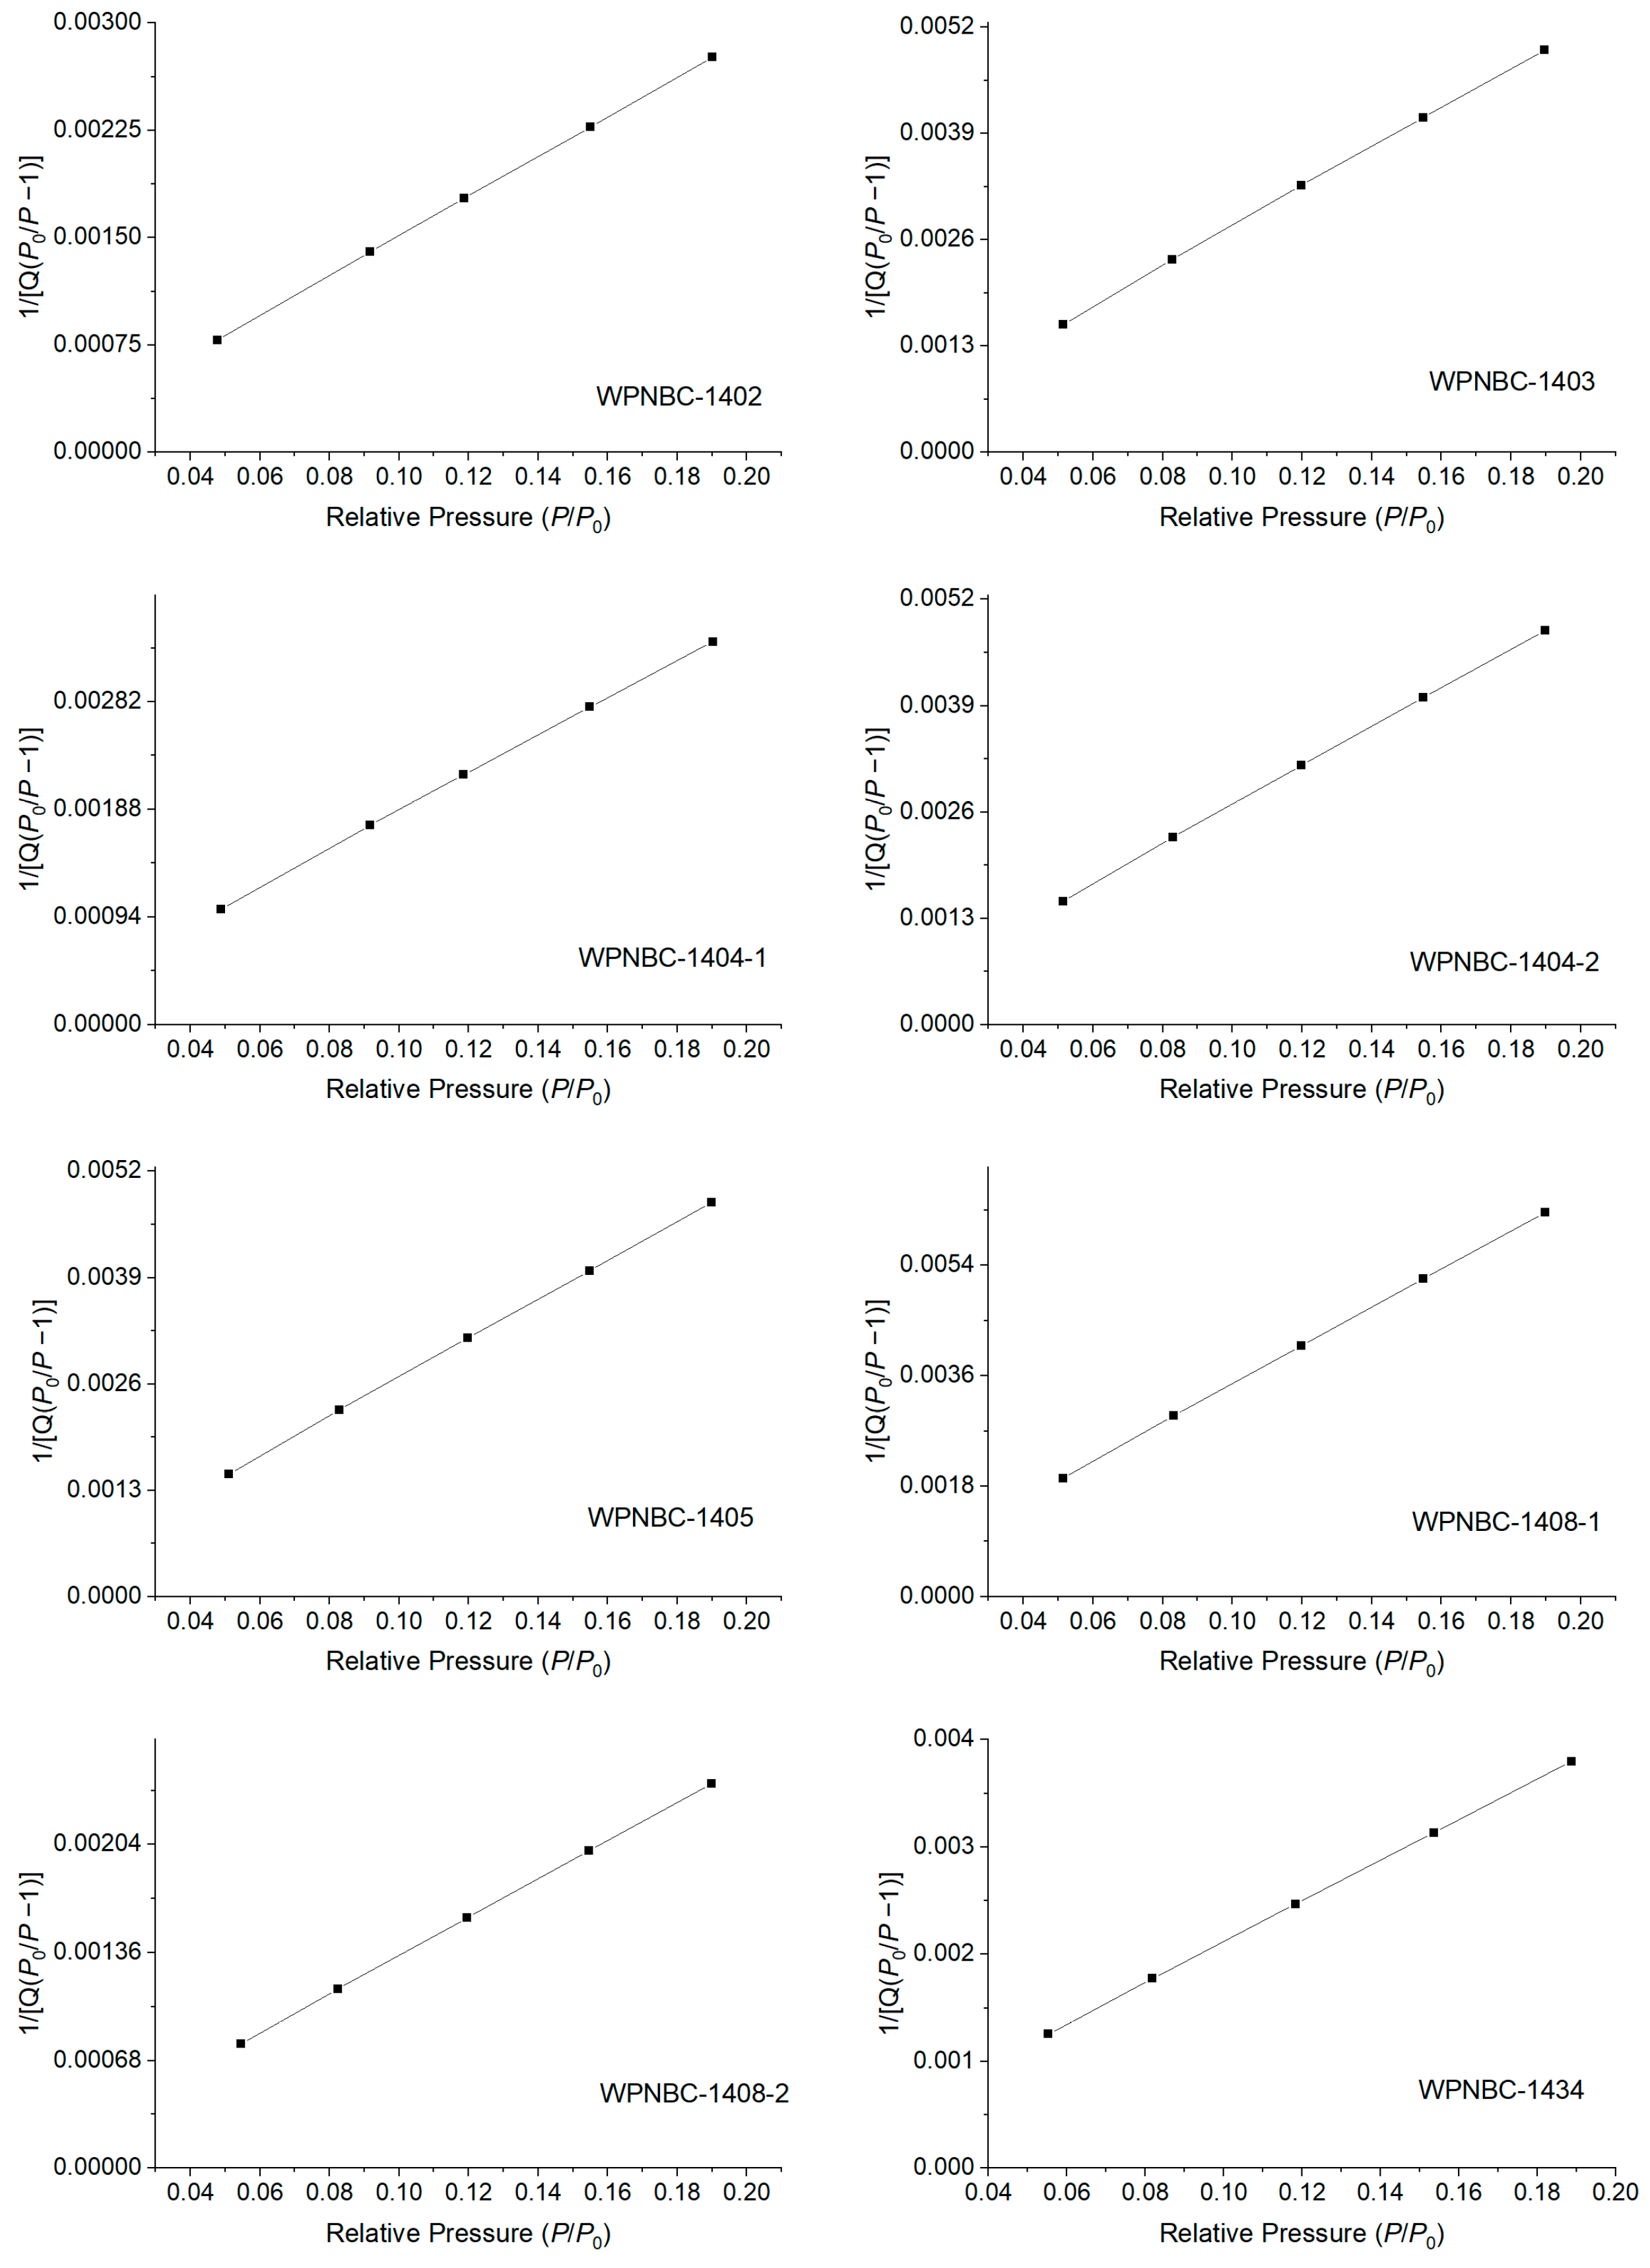
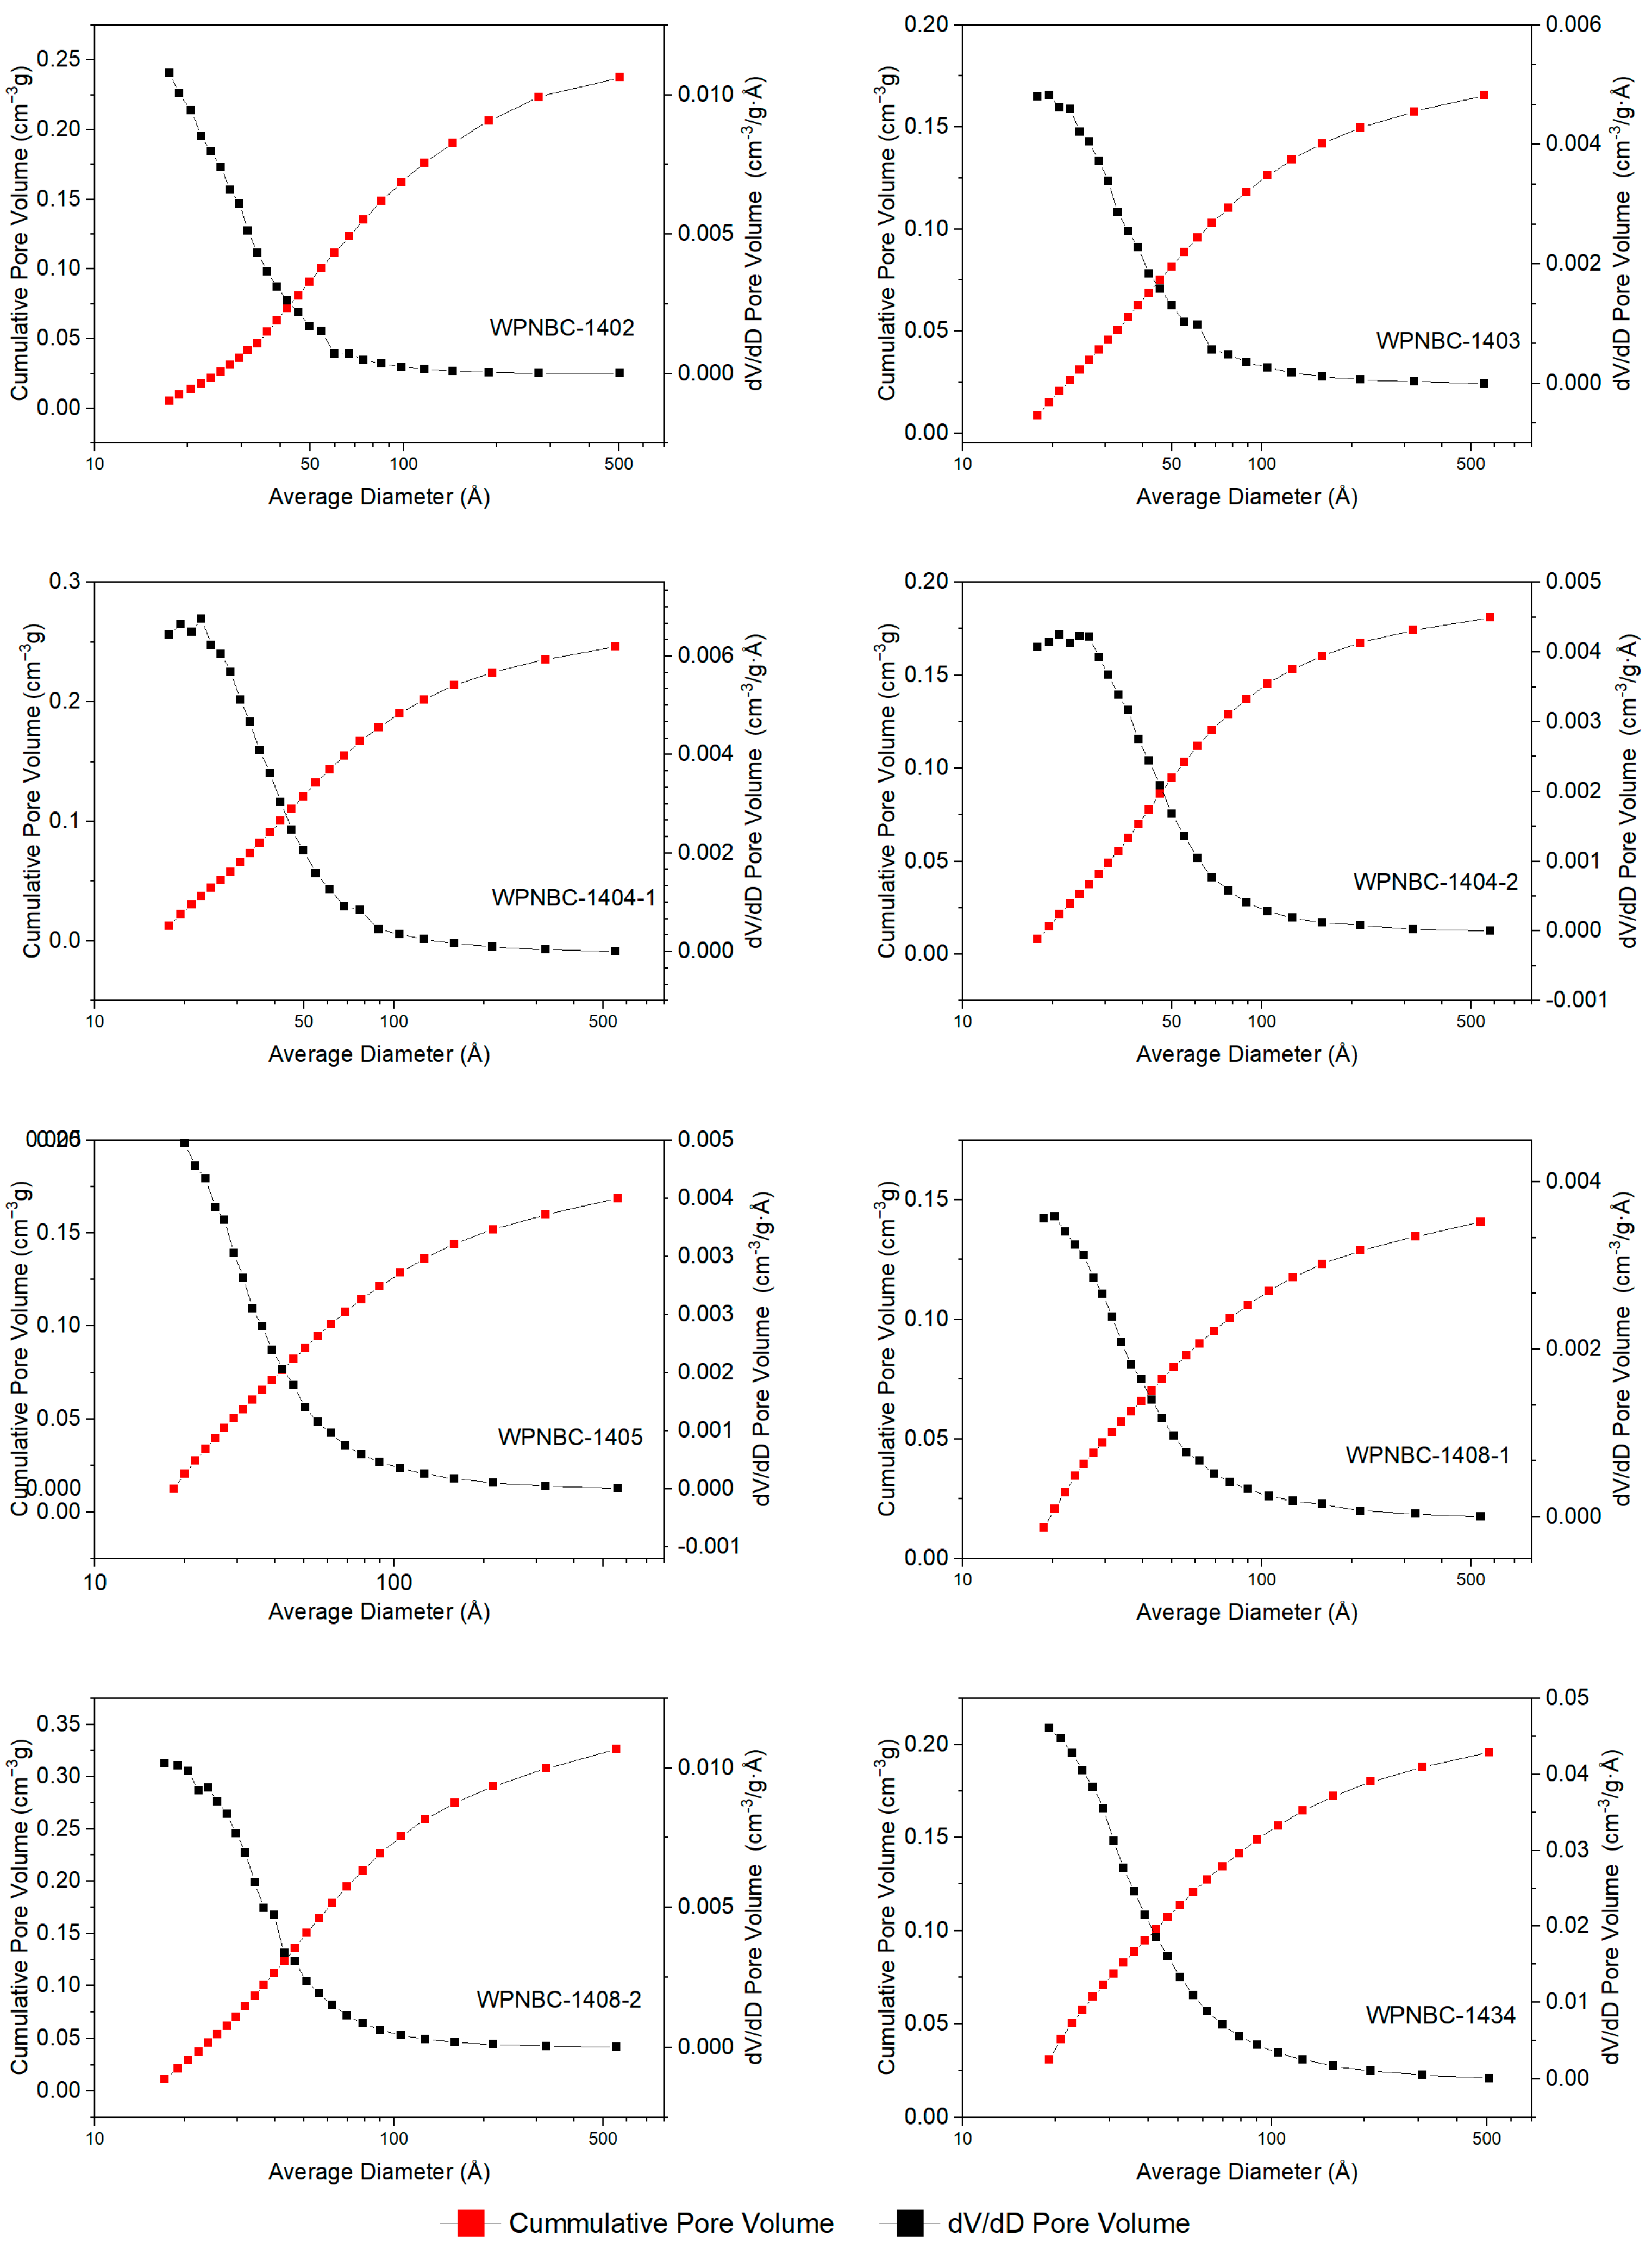
The adsorption and desorption isotherms of the Fe-Mn nodules from the IBSWP are shown in Figure 10. The BET surface areas of the nodules at various points are depicted in Figure 11. The specific areas and porous volumes of the nodules are presented in Table 2. The pore size distribution curves of the nodules calculated using the BJH method are shown in Figure 12. The histogram in Figure 13 shows the pore volume and the pore-specific surface area distribution of the samples, as well as the distribution of pore volume and the pore-specific surface areas of the Fe-Mn nodules.
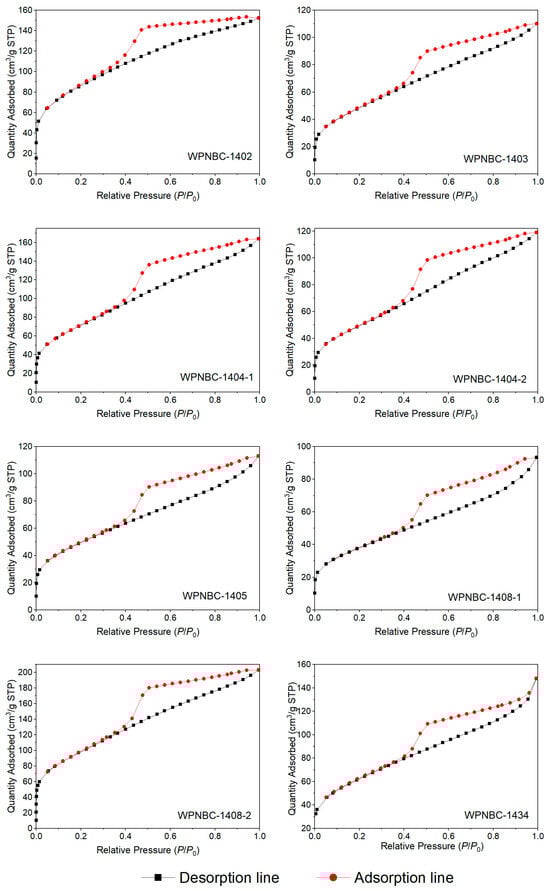
Figure 10.
Adsorption and desorption isotherms of the Fe-Mn nodules from the IBSWP.
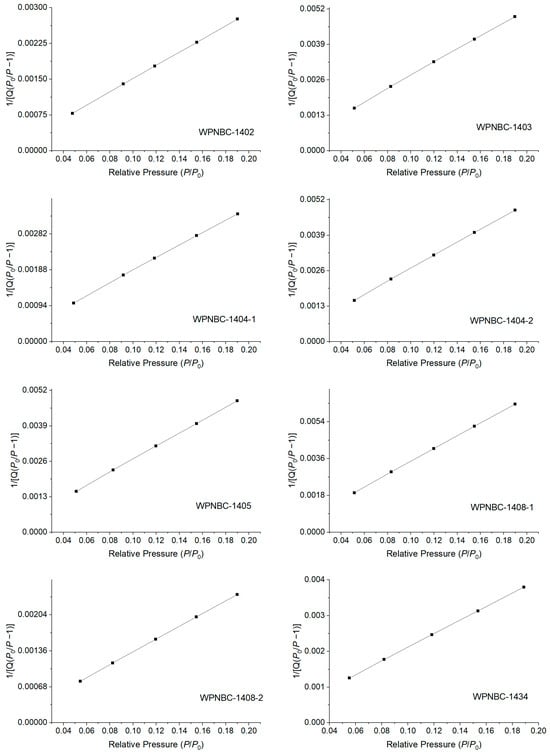
Figure 11.
BET surface area of the Fe-Mn nodules from the IBSWP.
Table 2.
Specific areas and porous volumes of the Fe-Mn nodules from the IBSWP.
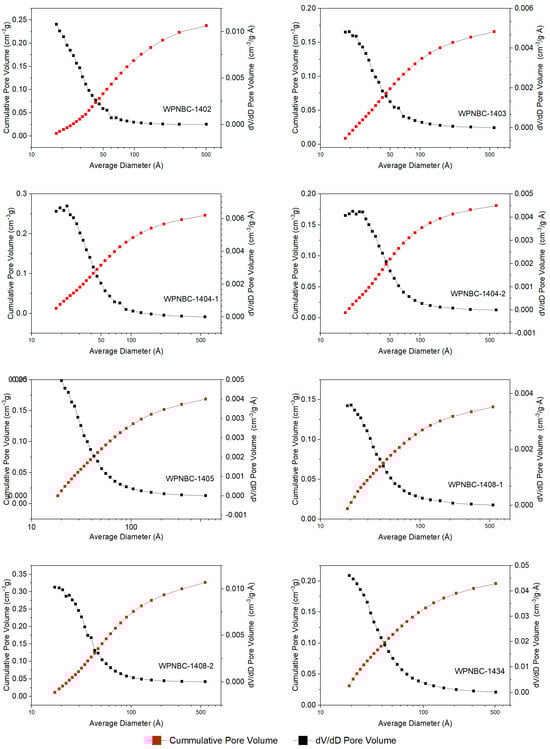
Figure 12.
The BJH pore size distribution curves of the Fe-Mn nodules from the IBSWP.

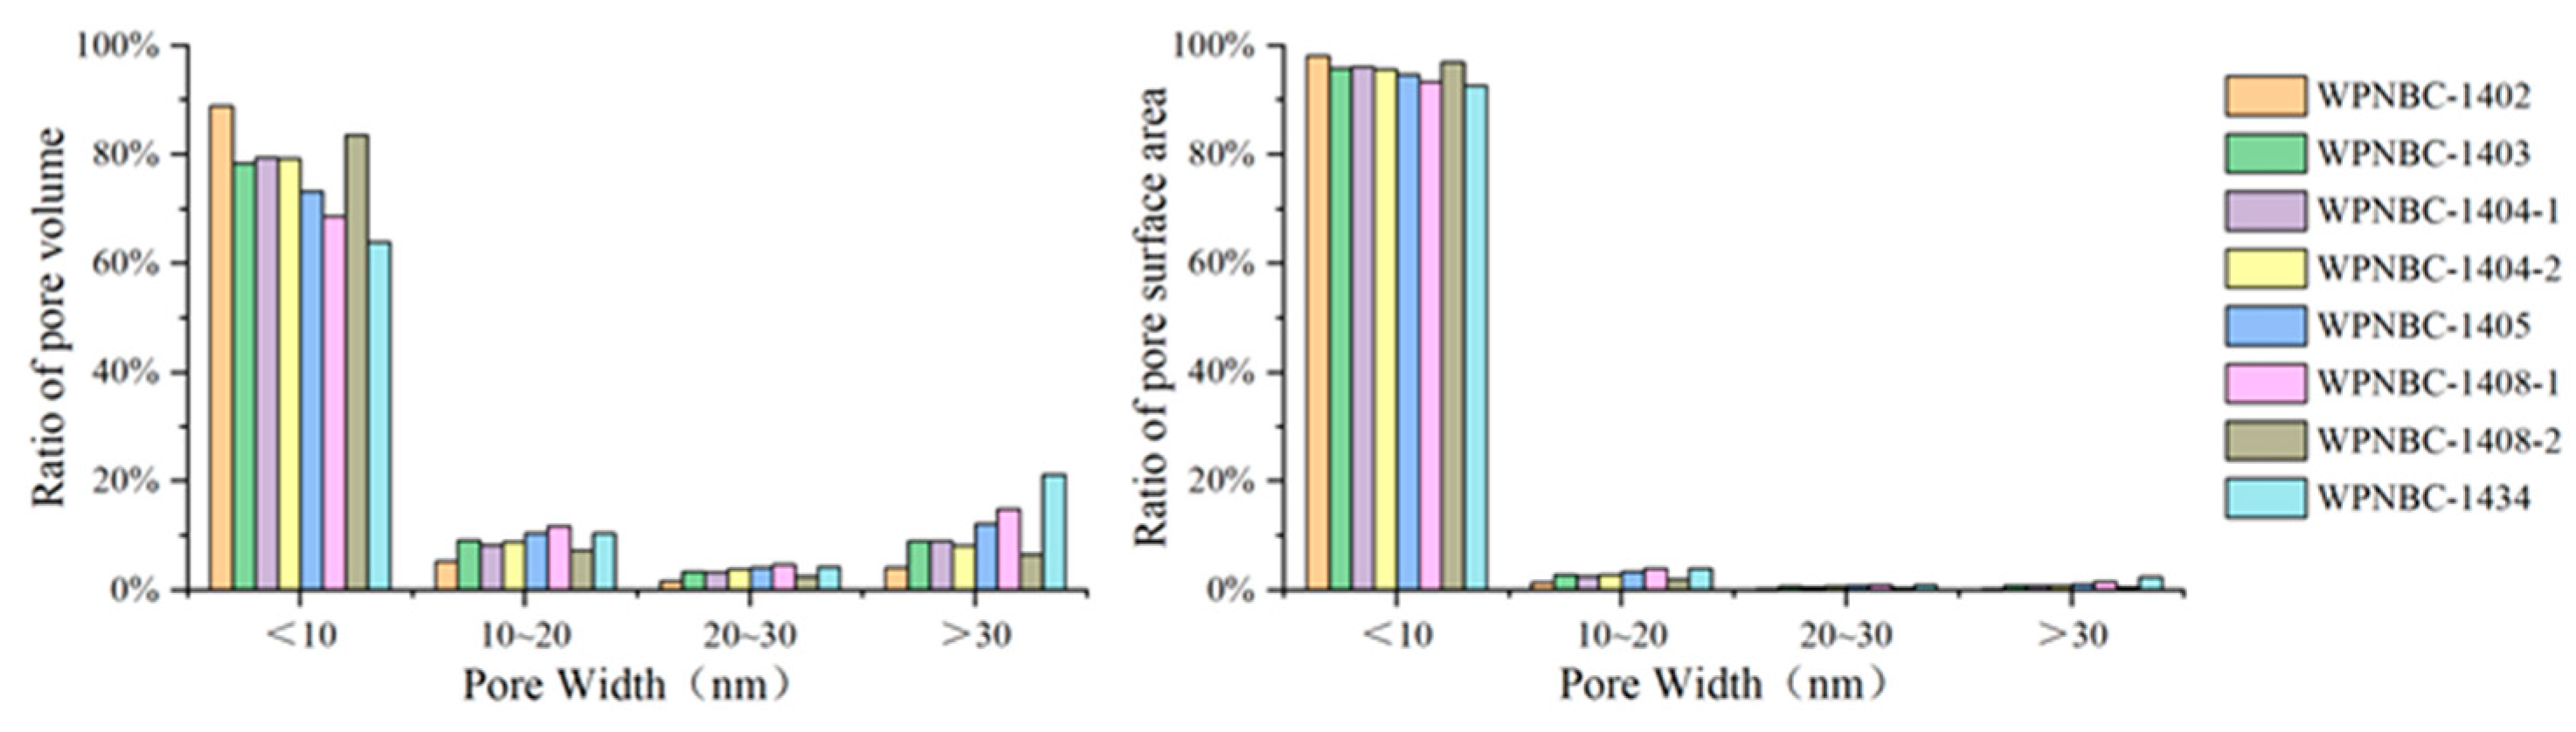
Figure 13.
Pore volume and the pore specific surface area distribution histogram of the Fe-Mn nodules from the IBSWP.
5. Discussion
5.1. Mineral Compositions and Depositional Environment
The XRD analysis shows that (Figure 4) the minerals of the Fe-Mn nodules from the IBSWP are primarily composed of vernadite, todorokite, buserite, birnessite, phillipsite, quartz, etc. In addition, while the Fe-Mn nodules have high Fe contents, the XRD analysis did not reveal any obvious diffraction peaks characteristic of Fe-phase mineral. This may be attributed to the low crystallinity of Fe oxides/hydroxides or their finely dispersed phases (Shi et al., 1995; Guan, 2016) [22,30]. Previous studies have suggested that the two prominent peaks at 2.5 Å and 1.5 Å in the XRD spectra of the Fe-Mn nodules are indicative of the existence of amorphous Fe-phase minerals or vernadite (Lee et al., 2016) [34].
Mn-phase minerals in the Fe-Mn nodules can be categorized into layered Mn oxide minerals (phyllomanganates) and tunnel-structured Mn oxide minerals (tectomanganates) (Kuhn et al., 2017) [35]. Phyllomanganates include vernadite, birnessite, buserite, and asbolite, while tectomangates are todorokite. The difference between phyllomanganates and tectomangates lies in the composition of the octahedron of MnO6 in the phyllomanganate layer, which is connected by a common edge. In contrast, the octahedron of MnO6 in the tectomanganate layer is formed by connected edges and sharp top corners, resulting in a three-dimensional tunnel structure. Conventional XRD testing methods are unable to distinguish todorokite, asbolite and buserite, all of which are 10 Å manganese minerals. Generally, in-situ heating is used to convert buserite and asbolite into 7 Å Mn minerals for identification (Qiao et al., 2016; Wu, 2019; Kfouri et al., 2021) [36,37,38]. Therefore, the classification of 10 Å Mn minerals will be further elucidated by integrating Fourier transform infrared spectroscopy experiments.
Fourier transform infrared spectroscopy (FT-IR) is an effective method for analyzing the functional groups of molecules in minerals. The position and intensity of the absorption band in the infrared spectrum are simultaneously related to the chemical composition, crystal structure characteristics, and content of the measured minerals. Therefore, Fourier transform infrared spectroscopy plays a crucial role in mineralogy research. In this study, Fourier transform infrared spectroscopy (FT-IR) was employed to analyze the functional group characteristics of the minerals in the Fe-Mn nodules from the IBSWP, and to subsequently obtain mineralogy data.
Peng et al. (1982) [39] pointed out that the stretching vibrational bands of OH- groups range from 3700 to 3500 cm−1, indicating that water in the Fe-Mn nodules mainly exists as neutral H2O molecules rather than in the form of OH groups. The chemical structures of Mn minerals identified using XRD show that they contain neutral H2O molecules including birnessite ((Na, Ca)0.5 (Mn4+, Mn3+)2O4·1.5H2O), todorokite ((Mn2+, Ca, Na, K) (Mn4+, Mn2+, Mg)6O12·3H2O), buserite (Na4Mn14O27·21H2O), and vernadite (δ-MnO2·n H2O); therefore, it is believed that the neutral H2O molecules identified by infrared spectroscopy mainly exist within the Mn mineral structure mentioned above.
In the fingerprint area (1300~400 cm−1), the absorption peaks are numerous and complex. This is mainly caused by the stretching vibration of some single bonds and the bending vibration of groups containing hydrogen. The absorption peaks are highly sensitive to changes in the molecular structure of minerals. Each compound possesses a distinctive infrared spectrum, which is crucial for identifying mineral phases. Fe-Mn nodules contain a variety of minerals, including Fe-Mn minerals and various clay minerals. The absorption band in the fingerprint area is the overlap zone of the absorption peaks from various minerals, making it difficult to distinguish individual peaks. For example, the absorption band at 1029~1024 cm−1 peak in the spectrum can be interpreted as the stretching vibration of Fe-O in the FeO6 octahedron of the amorphous Fe-phase minerals in the Fe-Mn nodule (Novikov et al., 2006) [40]. It can also be interpreted as the vibration absorption band of Mn (III)–OH in the Mn-phase minerals (Marino et al., 2019) [29]. The strong absorption peak at 459 cm−1 corresponds to the vibration absorption of the Mn-O octahedron. The characteristic absorption peak exhibits a wide absorption peak and a low degree of splitting. This suggests that the structural arrangement of the Mn-phase minerals in the Fe-Mn nodules is not well defined, and the degree of crystallization is low. Previous researchers have suggested that the distinct infrared spectral characteristics of various Mn-phase minerals are attributed to the high level of crystal structure order. Additionally, the infrared spectra of the same Mn-phase minerals show variations based on the degrees of crystallization (Chukhrov et al., 1987) [41]. In addition, unlike Mn-phase minerals that have layered structures, there is no absorption band for the Mn-phase minerals with a chain structure at the 400~450 cm−1 section (Yang, 2008) [42]. However, the Mn-phase minerals with a tunnel structure, such as todorokite, typically exhibit an absorption peak at 760 cm−1 on the FT-IR spectrum. This indicates the asymmetric stretching vibration of the Mn-O bond in its MnO6 octahedron triple chain and adjacent MnO6 octahedron chain (Wu, 2019; Wegorzewski et al., 2020; Dekov et al., 2021) [37,43,44]. The FT-IR spectrum of the sample does not show this absorption peak, indicating that the content of todorokite in the sample is very low. The 10 Å Mn-phase minerals in the sample should be mainly buserites.
Hydrogenetic and diagenetic precipitation occur under oxic and suboxic conditions, respectively (Hein and Koschinsky, 2014) [2]. Different Mn minerals can be formed under different oxidation conditions. Meanwhile, diagenesis can also result in Mn-mineral transformation (Atkins et al., 2016) [45]. Vernadite is primarily formed through intense hydrogenesis in an oxidizing environment, while the 10 Å Mn minerals are formed through diagenesis in a sub-oxidizing environment. The three characteristic diagenetic components of manganates are phyllomanganate, birnessite, and buserite. Together with tectomanganate todorokite, they are typically poorly crystalline and are intergrown with Fe(-Ti) oxyhydroxides in the Fe-Mn nodules (Burns and Burns, 1977; Baturin, 1988; Von Stackelberg, 1997; Usui and Someya, 1997; Post, 1999) [46,47,48,49,50]. The coexistence of vernadite and the 10 Å Mn mineral, primarily buserite, suggests that the Fe-Mn nodules from the IBSWP may experience alternating phases of hydrogenesis and diagenesis during the mineralization process.
5.2. Nano-Mineralogy
5.2.1. Nano-Mineral Characteristics
XRD and FT-IR analyses revealed that the mineral particles in the Fe-Mn nodules were satisfactory, but the degree of crystallization was low. Therefore, transmission electron microscopy (TEM) and energy-dispersive X-ray spectroscopy (EDS) were further used to conduct a more detailed mineralogical analysis of the Fe-Mn nodules on a smaller scale.
Figure 6 and Figure 7 display the identified vernadite in samples WPNBC1404-1 and WPNBC1404-2. The nanoscale vernadite particles are layered, as shown in Figure 6A–C and Figure 7A–C. However, at higher resolutions, it is still difficult to distinguish the stacking of the crystal components, leading to an apparent increase in thickness. In the selected-area electron diffraction (SAED) diffraction pattern, only diffraction rings at 1.4 Å and 2.4 Å were identified (Figure 6F,G). After performing the fast Fourier transform (FFT), the diffraction patterns also revealed 1.4 Å and 2.4 Å diffraction rings (Figure 6H), indicating low crystallinity.
Figure 8 shows the 10 Å Mn-phase minerals identified in sample WPNBC1408-1. The nano-mineral particles vernadite, forming dense-layered aggregates (Figure 8A,B), and convoluted aggregates (Figure 8E). In the SAED pattern (Figure 8C), diffraction rings at 1.4 Å, 2.4 Å, and 4.8 Å can be identified. In the higher-resolution photos, lattice stripes measuring 4.68 Å, 4.76 Å, 9.37 Å, and 10.00 Å can be distinguished (Figure 9F–H). This indicates a higher level of crystallinity compared to vernadite. The presence of the Ni element can be detected in the EDS spectra of the Mn-phase minerals (Figure 6D, Figure 7D and Figure 8D), suggesting that Ni may primarily occur in the Mn-phase minerals.
Figure 9 shows the amorphous Fe oxide identified in sample WPNBC1408-1, with the mineral particles forming thin tubular aggregates (Figure 9A,B). In the SAED pattern (Figure 9C), diffraction at 1.4 Å, 2.6 Å, and 4.5 Å can be identified, indicating a higher degree of crystallization as compared to vernadite. The EDS spectrum (Figure 9D) does not show the presence of the Ni element, suggesting that Fe-phase minerals may not be the main occurrence minerals of Ni.
The TEM analysis provides compelling evidence of the widespread presence of nanoscale Fe-Mn minerals in the Fe-Mn nodules. Nanoscale minerals differ from typical crystalline and amorphous minerals in properties such as the specific surface areas and pore structures, which can impact the accumulation of elements by the Fe-Mn minerals.
5.2.2. Nano-Mineral Properties
Pore Structure
The adsorption surface areas, pore volumes, and pore size distributions of the Fe-Mn nodules from the IBSWP can be determined by analyzing the isothermal adsorption and desorption isotherms. The adsorption and desorption isotherms of the samples are shown in Figure 10. All eight Fe-Mn nodules exhibit similar isotherm trends. In the range of 0 < P/P0 < 0.02, the adsorption isotherms (shown as the black line in Figure 10) exhibit a tendency to approach the y-axis with a steep slope. This indicates that the sample initially deviates from the fast adsorption isotherms (the black line in Figure 10) towards the y-axis with a high slope, suggesting that the sample initially adsorbs nitrogen at a rapid rate, leading to a quick increase in nitrogen adsorption capacity. This phenomenon indicates the presence of a large number of microporous structures in the sample (Zou, 2018) [51]. When the P/P0 approaches 1.0, the nitrogen adsorption capacity still does not show saturation, indicating that the sample may have large pores that cannot be characterized by nitrogen adsorption (Huang et al., 2022) [52]. During the subsequent nitrogen desorption process, the nitrogen adsorption amount in the desorption isotherms (the red line in Figure 10) decreased as the pressure decreased. However, the desorption isotherms did not align with the adsorption isotherms until the P/P0 reached 0.4. The desorption isotherms and adsorption isotherms formed a hysteresis loop at P/P0 = 0.4~1.0, indicating that the sample powder exhibited capillary condensation during the nitrogen adsorption process. The phenomenon of capillary condensation is typically associated with the shape and size of the pores in the sample. The relative pressure of the P/P0 at the separation point of the adsorption and desorption isotherms in the hysteresis loop ranges between 0.3 and 0.4, indicating a relatively low pressure. This reflects the smaller pore structure of the sample. The nitrogen adsorption capacity of each sample exhibits significant differences, with the following order: WPNBC1408-2 > WPNBC1404-1 > WPNBC1402 > WPNBC1404-2 > WPNBC1405 > WPNBC1403 > WPNBC1408-1. Among them, the nitrogen adsorption capacities of WPNBC1403, WPNBC1404-2, and WPNBC1405 are nearly identical, suggesting that these three samples have similar pore structures. However, sample WPNBC1408-1 has the lowest nitrogen adsorption capacity, indicating its reduced porosity. The pore structure of the porous materials can be characterized by analyzing the adsorption and desorption isotherms of the samples and the shape of the hysteresis loop.
The nitrogen adsorption–desorption isotherms of the Fe-Mn minerals exhibit a shape like that of mesoporous adsorbent materials. The most common characteristic is the presence of an obvious hysteresis loop. This suggests that the Fe-Mn minerals are also influenced by the interaction among the molecules in the condensed state within the pores during the nitrogen monolayer adsorption to multilayer adsorption process. In addition, the desorption isotherms of the sample exhibit steeper slopes in the hysteresis loop as compared to the adsorption isotherms, and there is a notable decrease in the inflection point. The hysteresis loop is generally wide, indicating that the sample contains complex and diverse pore types, including special inkwell-type pores. The pore size distribution range is wide, and the pore connectivity is poor. The pore structure values of the Fe-Mn nodules are similar to those of known mesoporous adsorbent materials, indicating that the Fe-Mn minerals are nano-minerals, and the nanostructure properties play a significant role in the enrichment of the Fe-Mn nodules.
Specific Surface Area
The specific surface areas of the Fe-Mn nodules from the IBSWP, calculated based on the BET model, varied significantly (refer Figure 11 and Table 2), ranging from 137.536 to 355.990 m2/g, with an average of 228.337 m2/g. Compared with previous research data, the specific surface area of the sample in this study was lower than that of the spherical nodules in the South China Sea (258.397 m2/g; see Table 2). Compared to certain artificial nanomaterials like macroporous pseudo-boehmite, mesoporous macroporous-activated alumina, and macroporous-special pseudo-boehmite (with a surface area of 201–220 m2/g as shown in Table 2), the samples also exhibit a specific surface area that is comparable or even larger. It is evident that the Fe-Mn minerals consist of nano-minerals, with nanopores contributing to over 90% of the overall surface area. These nanopores play a crucial role in the adsorption and enrichment of metal mineralization. Previous studies have indicated that the specific surface area of vernadite is 290–340 m2/g (Yao et al., 1996) [53], while the oxide/hydroxide of amorphous Fe is 200–300 m2/g (Dzombak et al., 1990) [54]. The specific surface area of the Fe-Mn nodules from the IBSWP falls between that of vernadite and amorphous Fe-phase minerals. This supports the earlier conclusion that the Fe-Mn minerals consist mainly of vernadite and amorphous Fe-phase minerals.
Pore Size Distribution
The pore size distribution curve of the Fe-Mn nodules from the IBSWP, calculated using the BJH method, is depicted in Figure 12. The experiment recorded a pore size range that fell mainly between 1.7 and 58.0 nm, as indicated in Table 2. The samples’ pore size ranged from 3.028 to 4.196 nm, with an average of 3.82 nm, and the pore volumes range from 0.144 to 0.314 cm3/g, with an average of 0.213 cm3/g. The sample was divided into four pore size distribution ranges, with a boundary set every 10 nm. The pore-specific surface area and pore volume ratio within each pore size range of the sample were then calculated. The distribution histogram results are depicted in Figure 13. It is evident that the predominant pore size in the sample was less than 10 nm, and its associated pore volume accounted for 63.95%~88.90% of the total pore volume observed, with an average of 76.92%. The corresponding pore-specific surface area accounted for 92.60%~98.07% of the total specific surface area, with an average of 95.82%. It is evident that the pore size of the Fe-Mn nodules is on the nanoscale and is even smaller than the pore size of known mesoporous adsorbent nanomaterials. The stronger the adsorption of metal on the nanopores with a very small pore size, the more favorable the environment is for enrichment and mineralization.
5.3. Nano-Mineral Mineralization
The size of nano-mineral particles ranges from 1 to 100 nm. Unlike general crystalline and amorphous minerals, nanosized minerals with smaller particles exhibit unique physical properties, including larger specific surface areas and pore volumes. The specific surface area of a substance is directly proportional to its surface adsorption capacity (Zhu et al., 2002) [55]. The small size characteristic of nanoscale minerals results in stronger electrostatic attraction which, combined with a large specific surface area, can accelerate the process of element adsorption by these minerals. Nanosized minerals with smaller particles have a higher surface energy and surface atomic number, as well as a greater surface area, leading to the faster surface reactions of nanoscale minerals (Gao, 2001; Ning, 2001; Zhang, 2020) [56,57,58].
The TEM results confirm the presence of nanoscale minerals in the Fe-Mn nodules from the IBSWP. The primary minerals responsible for ore formation are vernadite and amorphous Fe-phase minerals, both of which exist at the nanoscale. This structure provides Fe-Mn minerals with an extremely large specific surface area and pore volume. These nano-minerals play a crucial role in the fixation and adsorption process of essential metal ions from ambient seawater. The pores of the Fe-Mn minerals consist mainly of micropores with a size of less than 10 nm. The interaction between the micropores and adsorbed metal elements is stronger than that of wider pores (Lozano-Castellò et al., 2002) [59]. The micropores, along with other large pores, form a complex and diverse pore system within the nano Fe-Mn minerals. They continuously adsorb seawater and pore water to acquire minerals and metal elements, while also influencing the migration of metal elements within the Fe-Mn nodules. Adsorption and occurrence even determine the types of metal elements that are adsorbed. The unique properties of nanomaterials, such as the exceptionally large specific surface areas and distinct nanopore structures found in the Fe-Mn nodules from the IBSWP, are the reasons behind their exceptional enrichment of essential metal elements. This is also one of the important factors that leads to their selective enrichment and mineralization with key metal ions (Guan et al., 2017b) [26].
6. Conclusions
- The Fe-Mn encrusts of the Fe-Mn nodules from the IBSWP grow in a certain pattern. The primary growth structures inside the Fe-Mn nodules mainly include laminated, stromatolithic, columnar, and mottled structures.
- The crystallinity of Mn-phase minerals in the Fe-Mn nodules from the IBSWP is low, primarily consisting of vernadite as well as 10 Å Mn-phase minerals and birnessite. Using FT-IR analysis, it was found that the 10 Å Mn-phase minerals in the sample were mainly todorokite and buserites, while the Fe-phase minerals were amorphous aqueous Fe-phase minerals (FeOOH). Other detrital minerals, such as phillipsite and quartz, were also detected with good crystallinity. The coexistence of vernadite and 10 Å Mn-phase minerals indicates that the nodules were precipitated in alternating hydrogenetic and diagenetic conditions.
- The Fe-Mn minerals found in the Fe-Mn nodules from the IBSWP all exist in the form of nanoscale minerals. The nanoscale Fe-Mn minerals contributethe great specific surface areas and unique pore structures to the Fe-Mn nodules, which are crucial factors in the selective enrichment of key metal ions in the nano Fe-Mn minerals.
Author Contributions
L.X., Y.G. and X.S. conceived and designed the experiments; L.X. and Y.D. analyzed the data and wrote the paper; X.S., Y.G. and D.L. substantially revised the original manuscript; W.H. contributed materials/analysis tools; Y.R. and Z.X. made significant contributions to the sample preparation. All authors have read and agreed to the published version of the manuscript.
Funding
This study was financially supported by National Natural Science Foundation of China (42003040, 92262304), and the Guangxi Natural Science Foundation Youth Science Foundation (2019GXNSFBA185030).
Data Availability Statement
Data are contained within the article.
Acknowledgments
We thank the Guangzhou Marine Geological Survey for supplying the samples. We would also like to thank the editor and reviewers for their valuable advice.
Conflicts of Interest
The authors declare no conflict of interest.
References
- Hein, J.R.; Mizell, K.; Koschinsky, A.; Conrad, T.A. Deep-ocean mineral deposits as a source of critical metals for high- and green-technology applications: Comparison with land-based resources. Ore Geol. Rev. 2013, 51, 1–14. [Google Scholar] [CrossRef]
- Hein, J.R.; Koschinsky, A. Deep-ocean ferromanganese crusts and nodules. In Treatise on Geochemistry, 2nd ed.; Holland, H.D., Turekian, K.K., Eds.; Elsevier: Gainesville, FL, USA, 2014; Volume 13, pp. 273–291. [Google Scholar]
- Guan, Y.; Sun, X.; Ren, Y.; Jiang, X. Mineralogy, geochemistry and genesis of the polymetallic crusts and nodules from the South China Sea. Ore Geol. Rev. 2017, 86, 206–207. [Google Scholar] [CrossRef]
- Sun, C.; Tan, X.; Zhou, X.; Wang, F. Review of Research on Mineral Materials of Ocean Polymetallic Nodules and Cobalt Rich Crusts(I). Met. Ore Dress. Abroad 2003, 9, 4–11. [Google Scholar]
- Hein, J.R.; Spinardi, F.; Okamoto, N.; Mizell, K.; Thorbum, D.; Tawake, A. Critical metals in manganese nodules from the Cook Islands EEZ, abundances and distributions. Ore Geol. Rev. 2015, 68, 97–116. [Google Scholar] [CrossRef]
- Ren, J.; Deng, Y.; Lai, P.; He, G.; Wang, F.; Yao, H.; Deng, X.; Liu, Y. Geochemical characteristics and genesis of the polymetallic nodules in the Pacific survey area. Earth Sci. Front. 2021, 28, 412–425. [Google Scholar]
- Ma, J.; Yang, Y.; Deng, X.; He, G.; Yang, S.; Yu, Z. Relation of the distribution of bottom polymetallic manganese nodules to multibeam backscatter in West Pacific. Geol. Bull. Chin. 2021, 40, 392–400. [Google Scholar]
- Guo, S. Mineralogy of Polymetallic Nodules in the Central Pacific Ocean; China Ocean Press: Beijing, China, 1992. [Google Scholar]
- Liang, D. Collection of Research on Polymetallic Nodules in the Central Pacific(I), 1st ed.; Geological Publishing House: Beijing, China, 1992. [Google Scholar]
- Xu, D.; Jin, Q.; Liang, D. Polymetallic Nodules and Their Formation Environment in the Central Pacific Ocean, 1st ed.; Geological Publishing House: Beijing, China, 1994. [Google Scholar]
- Wu, G.; Zhou, H.; Yang, S.; Chen, H. Variation in Fe-Mn oxide mineral assemblage in Co-rich crust during growth. Acta Mineral. Sinica. 2001, 21, 137–143. [Google Scholar]
- He, G.; Sun, X.; Xue, T. A Comparative Study of the Geology, Geochemistry and Metallogenetic Mechanism of Polymetallic Nodules and Cobalt-Rich Crust from the Pacific Ocean, 1st ed.; Geological Publishing House: Beijing, China, 2011. [Google Scholar]
- Aplin, A.C.; Cronan, D.S. Ferromanganese oxide deposits from the Central Pacific Ocean, I. Encrustations from the Line Islands Archipelago. Geochim. Cosmochim. Acta 1985, 49, 427–436. [Google Scholar] [CrossRef]
- Xu, D.; Jin, Q.; Liang, H. Paleomarine Environment Formed by Polymetallic Nodules; Geological Publishing House: Beijing, China, 1994. [Google Scholar]
- Xu, D. Characteristics and Genesis of Polymetallic Nodules; Geological Publishing House: Beijing, China, 1993. [Google Scholar]
- Bian, L.; Lin, C.; Zhang, F.; Du, D.; Chen, J.; Shen, H. Pelagic manganese nodules—A new type of oncolite. Acta Geol. Sin. 1996, 70, 232–236. [Google Scholar]
- Chen, J.; Zhang, F.; Bian, Z. Supermicroorganisms are the builders of oceanic polymetallic nodule mineralization. Chin. Sci. Bull. 1997, 42, 337–343. [Google Scholar]
- Bau, M.; Schmidt, K.; Koschinsky, A.; Hein, J.; Kuhn, T.; Usui, A. Discriminating between different genetic types of marine ferro–manganese crusts and nodules based on rare earth elements and yttrium. Chem. Geol. 2014, 381, 1–9. [Google Scholar] [CrossRef]
- Luo, S.; Ren, J.; He, G.; Deng, X. Geochemical characteristics of polymetallic nodules and adjacent sediments in the western Pacific Ocean: Effects of sedimentary environments on nodules. Mar. Geol. Quat. Geol. 2023, 43, 119–131. [Google Scholar]
- Halbach, P.; Kriete, C.; Prause, B.; Puteanus, D. Mechanisms to explain the platinum concentration in ferromanganese seamount crusts. Chem. Geol. 1989, 76, 95–106. [Google Scholar] [CrossRef]
- Stüben, D.; Glasby, G.P.; Eckhardt, J.D.; Berner, Z.; Mountain, B.W.; Usui, A. Enrichments of platinum-group elements in hydrogenous, diagenetic and hydrothermal marine manganese and iron deposits. Explor. Min. Geol. 1999, 8, 233–250. [Google Scholar]
- Shi, N.; Ma, Z.; He, W.; Luo, J. Research on Nanosolids in manganese nodules in the northern Pacific Ocean--Nanosolids in minerals and their application prospects. Sci. China Ser. B Chem. 1995, 25, 778–784. [Google Scholar]
- Bai, Z.; Liu, X.; Yin, C.; Jiang, X.; Wang, S. Nano properties of leaching residue from ocean polymetallic nodules and rich drilling crusts. Chin. Sci. Bull. 2002, 47, 869–872. [Google Scholar] [CrossRef]
- Huang, Q.; He, B.; Cai, Z.; Huang, Q. The Significance of Nanomineral Particles during the Growth Process of Polymetallic Nodules in the Western Pacific Ocean. Int. J. Environ. Res. Public Health 2022, 19, 13972. [Google Scholar] [CrossRef]
- Liu, R.; Qin, S.; Lu, A.; Zheng, X.; Wang, L.; Zhao, D. The tunnel structure of manganese oxides and hydroxides and environmental significance. Mineral. Petrol. 2003, 23, 28–33. [Google Scholar]
- Guan, Y.; Sun, X.; Jiang, X.; Sa, R.; Zhou, L.; Huang, Y.; Liu, Y.; Li, X.; Lu, R.; Wang, C. The effect of Fe-Mn minerals and seawater interface and enrichment mechanism of ore-forming elements of polymetallic crusts and nodules from the South China Sea. Acta Oceanol. Sin. 2017, 36, 34–36. [Google Scholar] [CrossRef]
- Li, D.; Fu, Y.; Sun, X.; Wei, Z. Critical metal enrichment mechanism of deep-sea hydrogenetic nodules: Insights from mineralogy and element mobility. Ore Geol. Rev. 2020, 118, 1–13. [Google Scholar] [CrossRef]
- He, G.; Zhao, Z.; Zhu, K.; Chen, S.; Liang, D.; Zhu, B.; Zeng, R.; Tao, J. Cobalt Rich Crust Resources in the Western Pacific Ocean; Geological Publishing House: Beijing, China, 2001. [Google Scholar]
- Marino, G.; González, F.J.; Kuhn, T.; Wegorzewski, A.; Mirao, J.; Medialdea, T.; Madureira, P.; Oeser, M.; Miguel, C.; Reyes, J.; et al. Hydrogenetic, diagenetic and hydrothermal processes forming ferromanganese crusts in the canary island seamounts and their influence in the metal recovery rate with hydrometallurgical methods. Miner 2019, 9, 439. [Google Scholar] [CrossRef]
- Guan, Y. Geology, Geochemistry and Genesis of Polymetallic Crusts and Nodules from the South China Sea. Ph.D. Thesis, Sun Yat-sen University, Guangzhou, China, 2016. [Google Scholar]
- Su, A.; Du, H.; Yao, Y.; Zhou, Y. The effect of hydrothermal conditions on the properties of pseudo-boehmite synthesized by homogeneous precipitation method. Pet. Process. Petrochem. 2012, 43, 34–38. [Google Scholar]
- Zhang, J.; Xuan, L.; Wang, H.; Wang, H. Preparation and characterization of active aluminum oxide with mesoporous—macroporous pore size distribution. Contemp. Chem. Ind. 2012, 41, 934–936+949. [Google Scholar]
- Wang, C. Development and application of special pseudo boehmite using alcohol aluminum method. Petrochem. Ind. Technol. 2020, 11, 189–190. [Google Scholar]
- Lee, S.; Xu, H. XRD and TEM studies on nanophase manganese oxides in freshwater ferromanganese nodules from Green Bay, Lake Michigan. Chin. J. Nat. 2016, 64, 523–526. [Google Scholar] [CrossRef]
- Kuhn, T.; Wegorzewski, A.; Rühlemann, C.; Vink, A. Composition, formation, and occurrence of polymetallic nodules. In Deep-sea Mining, 1st ed.; Cui, W., Fu, S., Hu, Z., Eds.; Springer: Cham, Switzerland, 2017; pp. 23–63. [Google Scholar]
- Qiao, Z.; Tu, X.; Zhou, H. Microscopic characteristics of manganates in deep sea ferromanganese nodules. Chin. J. Nat. 2016, 38, 263–270. [Google Scholar]
- Wu, C. Effects of Co and Ni on the Transformation of Phyllo- into Tecto-Manganate and Their Geochemical Behavior during Such Process. Ph.D. Thesis, Huazhong Agricultural University, Wuhan, China, 2019. [Google Scholar]
- Kfouri, L.O.; Millo, C.; Lima, A.E.; Silveira, C.S.; Sant’Anna, L.C.; Marino, E.; González, F.J.; Sayeg, I.J.; Hein, J.R.; Jovane, L.; et al. Growth of ferromanganese crusts on bioturbated soft substrate, Tropic Seamount, northeast Atlantic Ocean. Deep Sea Res. Part I 2021, 175, 103586. [Google Scholar] [CrossRef]
- Peng, S.; Liu, G. Mineral Infrared Spectral Atlas, 1st ed.; Science Press: Beijing, China, 1982. [Google Scholar]
- Novikov, G.V.; Kulikova, L.N.; Bogdanova, O.Y.; Sychkova, G.I. Layered hydrous manganese dioxide saturated with alkaline-earth cations: Synthesis and sorption properties. Russ. J. Inorg. Chem. 2006, 51, 177–188. [Google Scholar] [CrossRef]
- Chukhrov, F.V.; Drits, V.A.; Gorshkov, A.I. Structural transformations of manganese oxides in oceanic nodules. Int. Geol. Rev. 1987, 29, 110–121. [Google Scholar] [CrossRef]
- Yang, H. Study on the Composition and Structure of Manganese Rich Minerals in Cobalt Rich Crusts of Western Pacific Seamounts. Master’s Thesis, China University of Geosciences, Beijing, China, 2008. [Google Scholar]
- Wegorzewski, A.V.; Sylvain, G.; Samuel, M.W.; Christina, H.; Thomas, K. Mineralogical transformations in polymetallic nodules and the change of Ni, Cu and Co crystal-chemistry upon burial in sediments. Geochim. Cosmochim. Acta 2020, 282, 19–37. [Google Scholar] [CrossRef]
- Dekov, V.M.; Rouxel, O.; Gu’eguen, B.; Wegorzewski, A.V.; Khripounoff, A.; Menot, L. Mn-micronodules from the sediments of the Clarion-Clipperton zone (Pacific Ocean): Origin, elemental source, and Fe-Cu-Zn-isotope composition. Chem. Geol. 2021, 580, 120388. [Google Scholar] [CrossRef]
- Atkins, A.L.; Shaw, S.; Peacock, C.L. Release of Ni from birnessite during transformation of birnessite to todorokite: Implication for Ni cycling in marine sediments. Geochin. Cosmochim. Acta. 2016, 189, 158–183. [Google Scholar] [CrossRef]
- Burns, R.G.; Burns, V.M. Mineralogy of ferromanganese nodules. In Marine Manganese Deposits; Glasby, G.P., Ed.; Elsevier: Amsterdam, The Netherlands, 1997. [Google Scholar]
- Baturin, G.N. The Geochemistry of Manganese and Manganese in the Oceans; D. Reidel Publishing Company: Dordrecht, The Netherlands, 1988. [Google Scholar]
- Von Stackelberg, U. Growth history of manganese nodules and crusts of Peru Basin. In Manganese Mineralization: Geochemistry and Mineralogy of Terrestrial and Marine Deposits; Geological Society, Special Publication: London, UK, 1997; Volume 119, pp. 153–176. [Google Scholar]
- Usui, A.; Someya, M. Distribution and composition of marine hydrogenetic and hydrothermal manganese deposits in the Northwest Pacific. In Manganese Mineralization: Geochemistry and Mineralogy of Terrestrial and Marine Deposits; Nicholson, K., Hei, J.R., Bühn, B., Dsgupta, S., Eds.; Geological Society, Special Publication: London, UK, 1997; Volume 119, pp. 177–198. [Google Scholar]
- Post, J.E. Manganese oxide minerals: Crystal structure and economic and environmental significance. Proc. Natl. Acad. Sci. USA 1999, 96, 3447–3454. [Google Scholar] [CrossRef] [PubMed]
- Zou, X. Preparation and Modification of Mesoporous Fe-Mn Binary Oxide for Pb2+ Adsorption and Its Mechanisms. Ph.D. Thesis, Guangdong University of Technology, Guangzhou, China, 2018. [Google Scholar]
- Huang, W.; Zhou, X.; Liu, J.; He, T.; Tao, H.; Li, S.; Hao, L. Characteristics and controlling factors of pore structure of shale in the seventh member of Yanchang Formation in Huachi area, Ordos Basin. J. Nat. Gas Geosci. 2022, 33, 1951–1968. [Google Scholar]
- Yao, W.S.; Millero, F.J. Adsorption of phosphate on manganese dioxide in seawater. Environ. Sci. Technol. 1996, 30, 536–541. [Google Scholar] [CrossRef]
- Dzombak, D.A.; Morel, F.M. Surface Complexation Modeling-Hydrous Ferric Oxide; Wiley: New York, NY, USA, 1990; pp. 81–95. [Google Scholar]
- Zhu, X.; Wang, Z. Nanometer-sized Particles, Colloidal Solution and Adsorption-Exploration on the Genesis of Some Metal Deposits. Geol. Chin. 2002, 29, 82–85. [Google Scholar]
- Gao, C. Effects of nanometer material and their application. J. Jiangsu Univ. Sci. Technol. (Nat. Sci.) 2001, 22, 45–49. [Google Scholar]
- Ning, Y. The magical surface effect of nanomaterials. Nonferrous Met. 2001, 53, 90. [Google Scholar]
- Zhang, J. Experimental Study on Removal of Se (IV) from Water by Nanometer Iron and Manganese Oxide. Master’s Thesis, Taiyuan University of Science and Technology, Taiyuan, China, 2020. [Google Scholar]
- Lozano-Castellò, D.; Alcaniz-Monge, J.; de la Casa-Lillo, M.A.; Cazorla-Amoròs, D.; Linares-Solano, A. Advances in the study of methane storage in porous carbonaceous materials. Fuel 2002, 81, 1777–1803. [Google Scholar] [CrossRef]
Disclaimer/Publisher’s Note: The statements, opinions and data contained in all publications are solely those of the individual author(s) and contributor(s) and not of MDPI and/or the editor(s). MDPI and/or the editor(s) disclaim responsibility for any injury to people or property resulting from any ideas, methods, instructions or products referred to in the content. |
© 2023 by the authors. Licensee MDPI, Basel, Switzerland. This article is an open access article distributed under the terms and conditions of the Creative Commons Attribution (CC BY) license (https://creativecommons.org/licenses/by/4.0/).