Article

A Temperature Perturbation Infrared Spectroscopy Comparison of HY and NaY Zeolite Dehydration/Rehydration

Department of Chemistry & Biochemistry, University of Oklahoma, Norman, OK 73069, USA
Minerals 2024, 14(1), 104; https://doi.org/10.3390/min14010104
Submission received: 30 October 2023 / Revised: 12 January 2024 / Accepted: 16 January 2024 / Published: 18 January 2024

Abstract

:
Temperature step infrared spectroscopy is used to monitor vibrations associated with water molecules and zeolite framework during thermal dehydration and rehydration of HY and NaY. Temperature-dependent HY and NaY infrared spectrum intensity and wavenumber trends for O-H stretching vibrations, H-O-H bending vibrations, and zeolite framework vibrations are compared. Changes in hydroxyl stretching and water bending vibration bands confirm that HY has a stronger hydrogen bonding network. The intensity of a band at 3700 cm−1 in NaY spectra varies with temperature and can be correlated with Na+ migration and zeolite water content. Spectral subtractions reveal complex intensity variations in the framework vibration band wavenumber region. Spectrum differences indicate the presence of at least four overlapping contributions in this wavenumber region. The intensities and wavenumbers of these constituents vary with temperature differently for HY and NaY. For both zeolites, infrared spectrum changes detected during thermal dehydration were mostly reversed when water re-adsorbed to the sample after cooling.

1. Introduction

First introduced in 1964 by Breck et al. [1], the faujasite (FAU) zeolite Y is employed in the petroleum industry [2,3,4], for gas adsorption [5,6,7], and in green chemistry applications [8,9]. It comprises (Si,Al)O4 tetrahedra that combine to form sodalite cages and supercages joined by hexagonal prisms. The unit cell consists of eight sodalite cages and eight supercages [10]. Void spaces within the zeolite structure are filled by water and charge balancing counterions, which play important roles in determining its properties [11,12]. When fully hydrated, four water molecules occupy each sodalite cage and 26–28 water molecules are typically found in each supercage. The sodalite cage water molecules are the most stable and may persist at temperatures as high as 400 °C [13]. The number and distribution of water molecules affect the zeolite framework structure [14,15,16] and can alter catalytic and adsorption properties [17,18]. The counterion sizes and charges [5,19], their distributions within the framework [20,21,22], and how they move due to temperature and water content variations also impact zeolite Y properties [23,24].
Zeolite Y counterions move out of the sodalite cages when water is removed and preferentially reside within the larger supercages, where positive charge repulsions are minimized [20,25]. When anhydrous NaY is exposed to water vapor, water first fills the supercages. After entering the zeolite structure, water molecules can interact with other water molecules, charge-balancing counterions, and framework oxygens and hydroxyl groups. Supercage water molecules may organize into layers that are stabilized by interactions with framework oxygens [21,25]. Na+ migration is facilitated by water molecules, leading to additional supercage filling and access to sodalite cages [13,26,27].
Hu et al. employed temperature-dependent X-ray spectroscopy to obtain detailed information regarding Na+ movements and changes in water molecule distributions as a function of sample temperature [28]. Additional insights into the temperature-dependent behaviors of NaY water molecules were subsequently obtained by using variable temperature infrared spectroscopy to detect subtle vibration band changes while heating the zeolite at 2 °C min−1 [29]. Vibrational band shape and position changes were attributed to interactions between Na+, water, and the zeolite framework. Findings from the variable-temperature X-ray and infrared spectroscopy studies of NaY are augmented by results obtained from the temperature perturbation infrared spectroscopy studies of HY and NaY described here. By using a unique sample heating and cooling apparatus [30], subtle infrared spectrum changes caused by heating and cooling HY and NaY were compared. By rapidly (i.e., 2 °C s−1) heating and cooling samples to pre-selected temperatures prior to isothermal spectrum measurements, vibrational band changes associated with loss or gain of small quantities of water were distinguished from those attributed to the thermal expansion and contraction of the crystalline zeolite. In addition, correlations between temperature-dependent hydroxyl stretching and water bending vibration band changes and Si-O-Si and Al-O-Si framework vibration variations provide insight into interactions between water molecules and the aluminosilicate zeolite structure.

2. Materials and Methods

NaY and HY designations are employed here to distinguish between the sodium and hydrogen forms of the zeolite. NaY zeolite with a Si/Al ratio of 5.30 was obtained from Universal Oil Products (Des Plaines, IL, USA). Because the Si/Al ratio exceeds 5, this zeolite can also be characterized as ultrastable Y (i.e., USY) [31]. HY was derived from the NaY form by using a modification of the procedure outlined by Warner et al. [32]. Ion exchange was used to replace sodium ions in NaY with ammonium ions. A 1 g NaY sample was mixed with 50 mL of a 2 M ammonium nitrate solution. The mixture was heated to 80 °C and stirred for two days. The liquid was then separated and removed from the solid and replaced with 50 mL of fresh ammonium nitrate solution. This mixture was stirred at 80 °C for an additional two days. The ammonium ion-exchanged zeolite Y was collected via filtration, thoroughly rinsed with distilled water, and dried in an oven for one day at 100 °C. The HY form was obtained by heating NH4Y in a furnace at ca. 50 °C/h from ambient temperature to 400 °C. The 400 °C temperature was maintained for 4 h under a continuous nitrogen purge to prevent dealumination [33].
The apparatus and methodologies employed for temperature step infrared spectrum measurements are described in detail elsewhere [30,34]. The infrared spectrophotometer was purged with dry air to reduce spectral artifacts caused by fluctuations in water vapor concentration. The relative humidity (RH) in the room containing the spectrophotometer was about 15%. Water vapor absorbance measured when the spectrophotometer sample compartment was exposed to room air was about 50 times higher than when it was purged. Therefore, samples were exposed to ca. 0.3% RH during infrared spectrum measurements. Previous benchmark studies revealed the importance of good thermal contact between solid samples and the bottom of the button sample holder to achieve accurate temperature measurements [30]. For this reason, samples were deposited in the button sample holder as water slurries. Excess water was allowed to evaporate at room temperature prior to infrared spectroscopy measurements. By using this approach, thin layers of zeolite were deposited on the bottom surface of the sample holder and air gaps were avoided.
Thermogravimetry measurements were made with a DuPont Instruments (Wilmington, DE, USA) 951 Thermogravimetric Analyzer. About 6 mg of NaY and HY powders were heated by using a 2 °C min−1 temperature ramp from ambient temperature to 200 °C while purging with nitrogen at a rate of 40 mL min−1.

3. Results

When heated to temperatures below 200 °C, HY and NaY powders lose water contained within the zeolite cage system [35,36,37,38]. The temperature dependencies of these water desorptions were compared by using thermogravimetry. Mass loss thermograms obtained by heating 6 mg samples from 25 to 200 °C are shown in Figure 1. The HY and NaY curves were nearly identical between 25 and 70 °C. At higher temperatures, the NaY sample exhibited a greater mass loss rate than the HY sample. Both curves tended to level off above 150 °C, signifying a near complete loss of adsorbed water. The HY and NaY samples lost 19.0 and 22.4 percent of their initial masses at 150 °C and 20.8 and 23.3 percent at 200 °C, respectively.
Variable temperature infrared spectra were obtained for HY and NaY neat powders by using a modified button sample holder incorporating a thermocouple [34,39]. Figure 2a shows the infrared spectra of the HY (red) and NaY (blue) samples obtained at 25 °C prior to heating. Figure 2b shows infrared spectra measured when the samples were heated to 150 °C. Spectra were normalized by scaling the largest band intensity to 1.0. The band profiles in these spectra are consistent with previously published results [12,33,40,41]. As shown in Figure 2a, each spectrum can be divided into three functional group-specific regions. Intensity above 2200 cm−1 can be primarily attributed to O-H stretching vibrations. These vibrations may be associated with SiOH and AlOH functional groups or water molecules [42]. Band broadening in this region is primarily due to effects of hydrogen bonding on overlapping O-H stretching vibration bands. Compared to the NaY spectra, the HY O-H stretching vibration bands extend to lower wavenumbers and maximize at lower wavenumbers, indicating the presence of stronger hydrogen bonding interactions. Water H-O-H bending vibrations resulted in bands near 1640 cm−1 for both materials. The intensity and wavenumber of these bands depended on water intermolecular hydrogen bonding, interactions between water molecules and the zeolite framework, and interactions between water molecules and the zeolite counterion (i.e., H+ or Na+). Several overlapping bands below 1250 cm−1 can be assigned to Si-O-Si and Al-O-Si stretching vibrations [33]. Asymmetric stretching vibrations occurred in the 1250–850 cm−1 range and symmetric vibrations occurred below 850 cm−1 [43]. Overlapping asymmetric stretching vibration bands for HY resulted in a slightly broader intensity distribution compared to NaY. The symmetric stretching vibration band near 800 cm−1 was sharper in the NaY spectrum. The HY spectrum contained intensity near 900 cm−1 that was not present in the NaY spectrum. Figure 2b shows that the relative intensities of O-H stretching and H-O-H bending vibration bands diminished when samples were heated to 150 °C. The persistence of the ca. 1640 cm−1 bands in Figure 2b indicates that some water remained in the HY and NaY samples at 150 °C, which is consistent with the sample mass-versus-temperature plots in Figure 1. Comparing the plots in Figure 2a,b shows that sample heating resulted in slight changes to the shapes of the framework vibration bands. In general, the vibration band changes depicted in Figure 2 provide little information regarding subtle zeolite structure changes that occurred during sample heating. The sample perturbation approach described here was employed to enhance the sensitivity for detecting structure-specific low-intensity bands that are not readily apparent in the infrared spectra shown in Figure 2.
Information regarding water molecule interactions within the HY and NaY zeolites was obtained by comparing infrared spectra acquired at different temperatures. Samples were perturbed by heating them to increasingly higher temperatures prior to infrared spectrum measurements. After each heating step increment, samples were cooled to ambient temperature before measuring another spectrum. Figure 3 shows the temperature step program employed for analyses. The program began by signal-averaging 64 interferogram scans, which required ca. 30 s, while maintaining the sample temperature at 25 °C. The sample temperature was then increased at a rate of 2 °C s−1 to 30 °C, which required 2.5 s. The temperature exceeded 30 °C by about 2 °C, but then quickly equilibrated at the setpoint. Interferogram data acquisition at 30 °C began after a 5 s temperature equilibration period. Temperatures recorded before and after interferogram acquisition deviated at most by ±0.1 °C from the 30 °C setpoint. The sample was then cooled back to 25 °C at the highest rate that could be achieved with the variable temperature heating/cooling apparatus (e.g., >2 °C s−1). The temperature briefly dropped below the setpoint before stabilizing at 25 °C. After a 5 s equilibration period, a third infrared spectrum was obtained. As shown in Figure 3, this process was repeated while increasing the step temperature in 5 °C increments. Fifty-one infrared spectra (one at each isothermal temperature) were obtained, requiring a total of 25.5 min of interferogram signal averaging. Thus, data acquisition constituted about 40% of the total time required for the temperature step program.

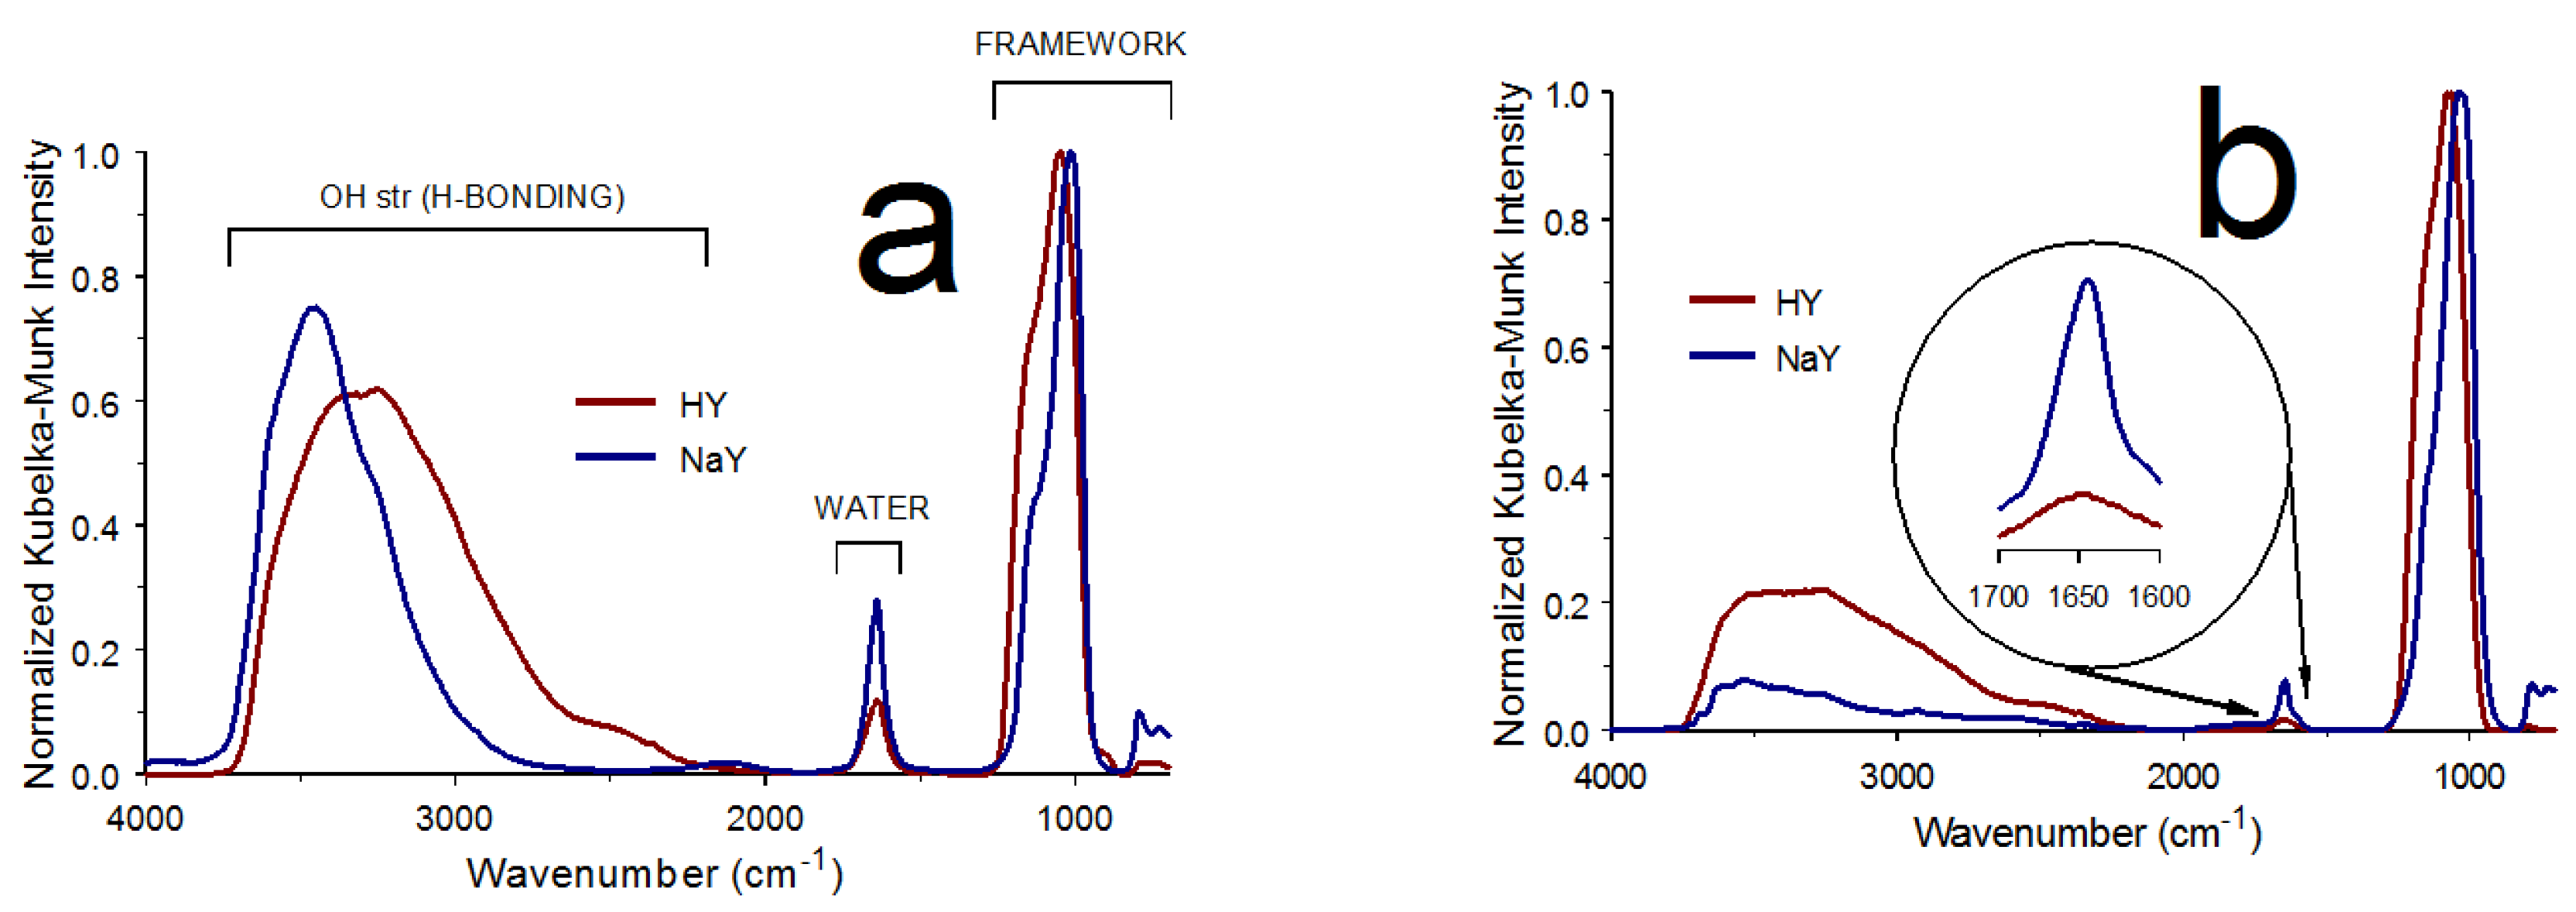
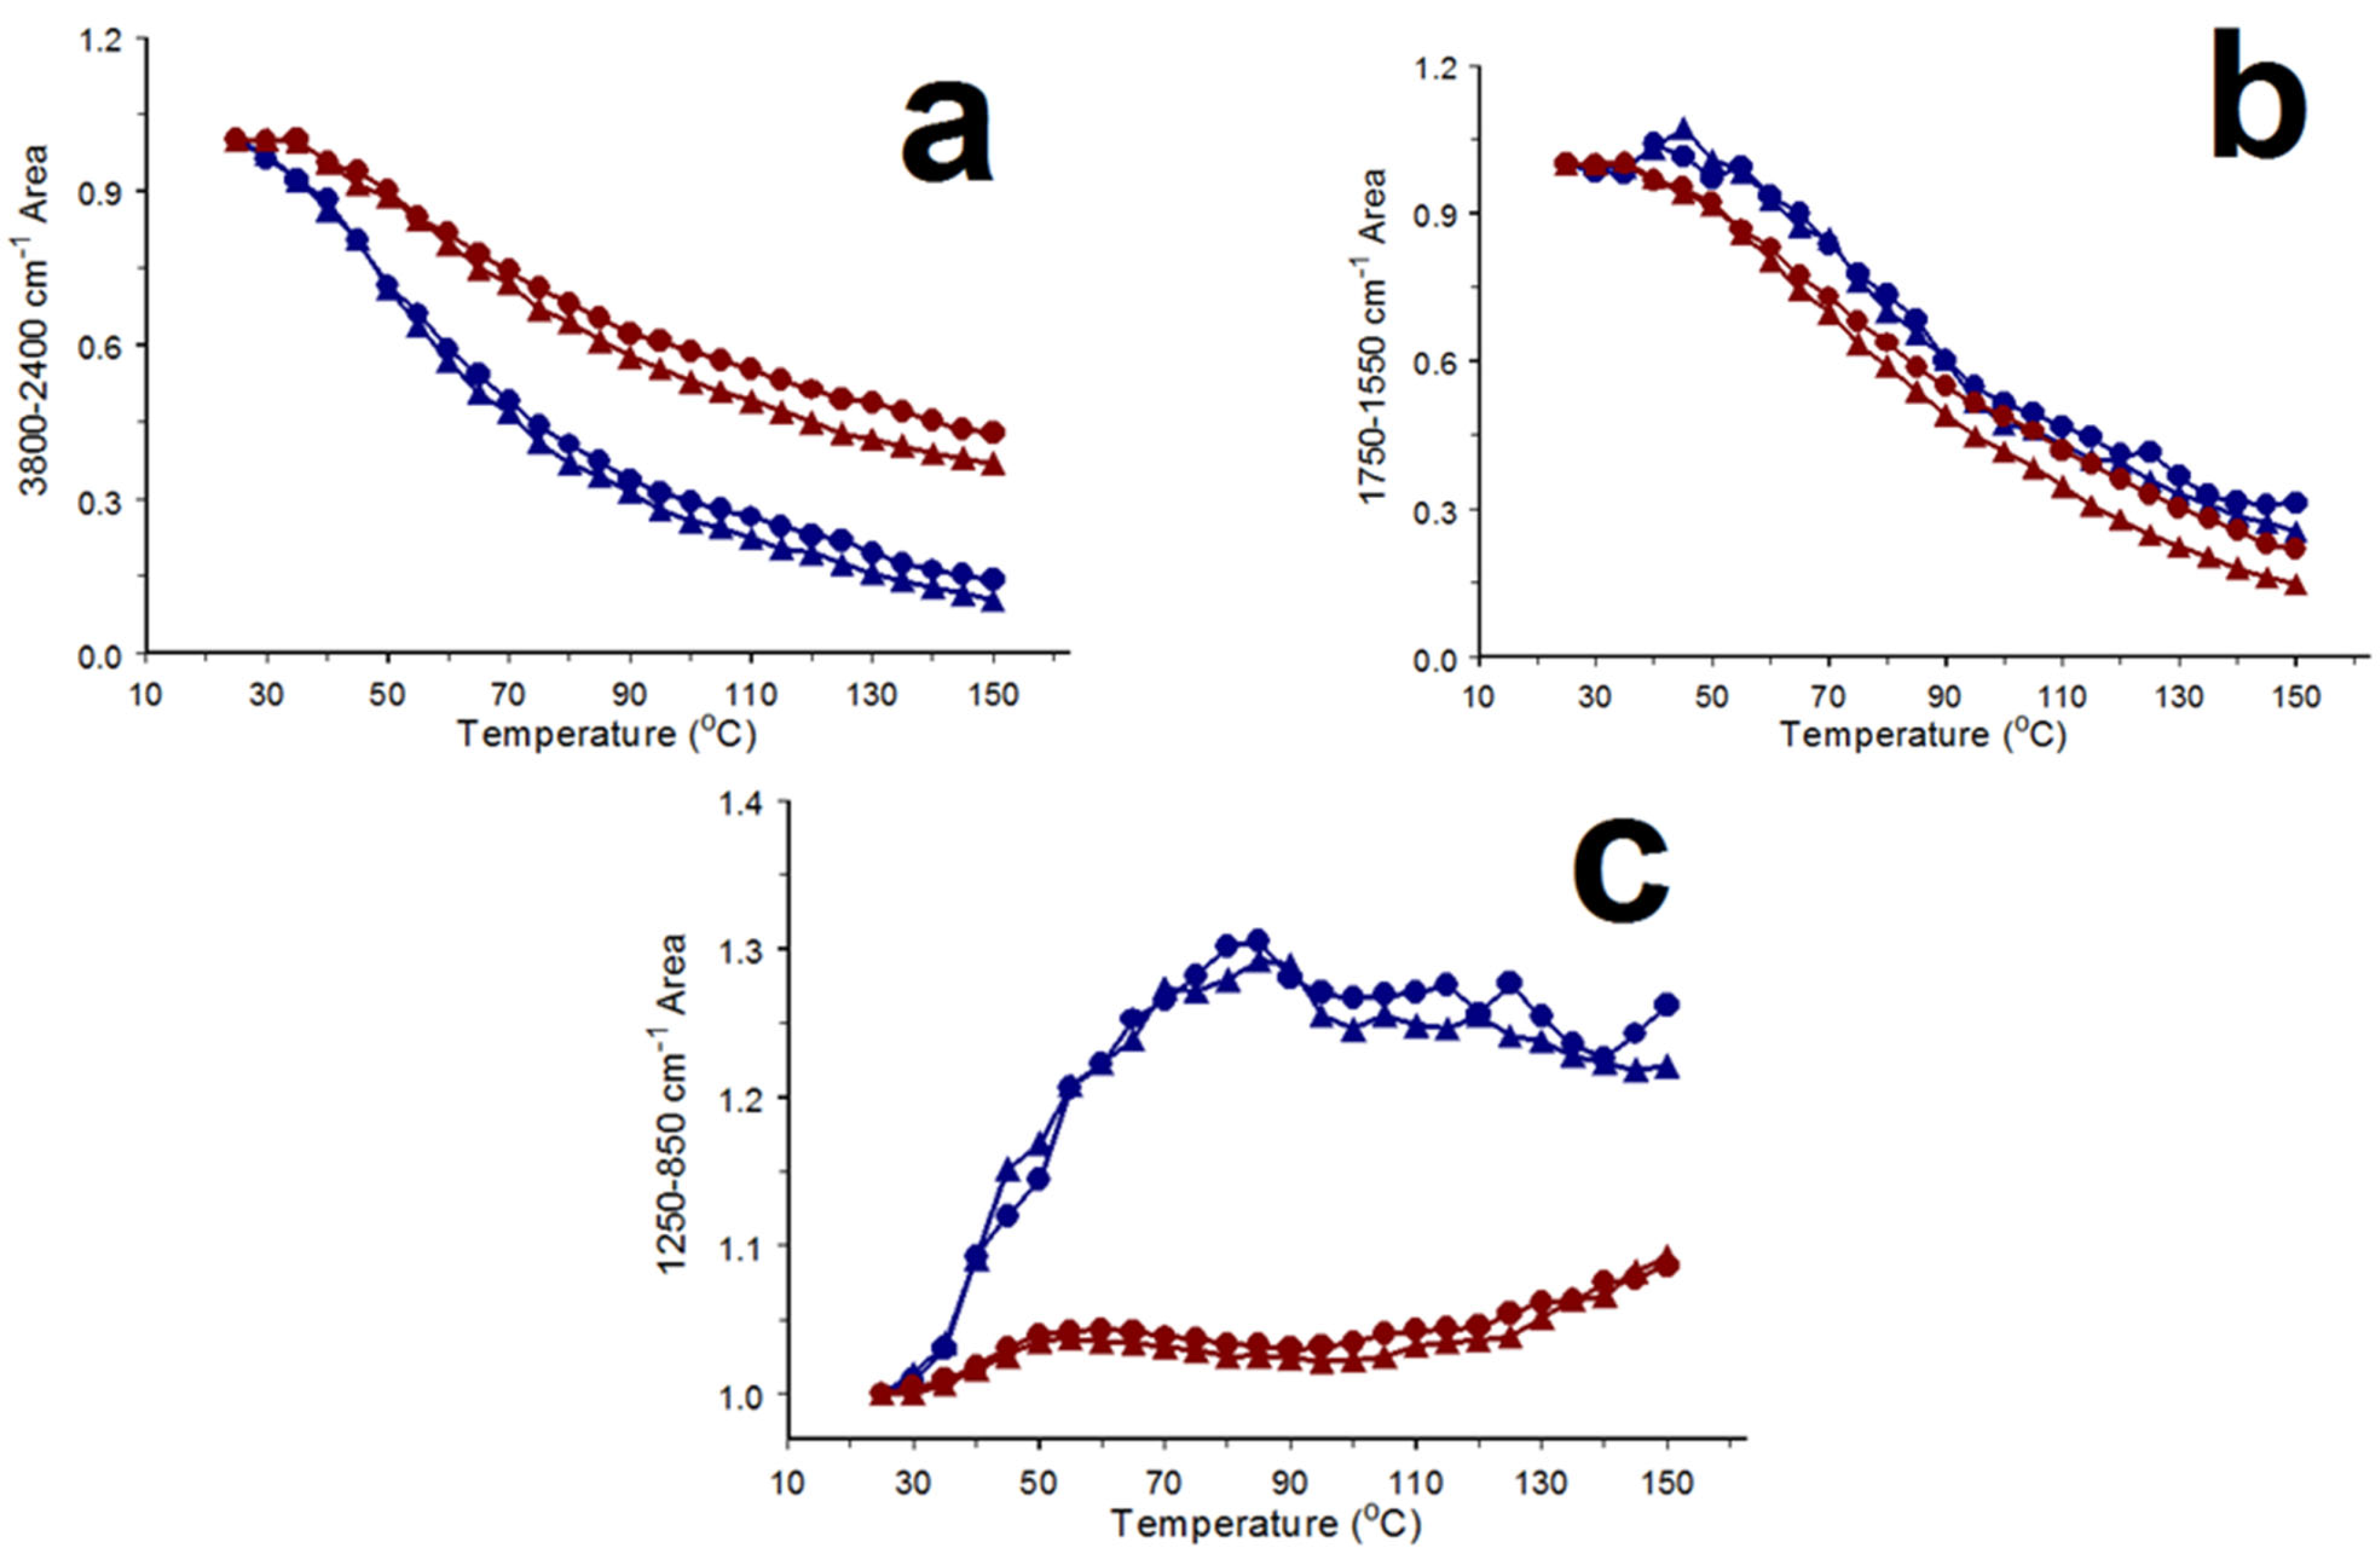
3.1. Functional Group Band Intensity Variations

Figure 4 shows infrared spectrum band area-versus-temperature trends for the HY (red) and NaY (blue) samples. Areas were normalized by ratioing them to the area calculated from the infrared spectrum acquired prior to sample heating. Triangles denote areas derived from spectra obtained at each step temperature, whereas circles represent areas in spectra measured at 25 °C after cooling from the step temperature. In most instances, areas derived from spectra obtained after cooling (circles) were slightly larger than those measured at the step temperatures (triangles). Typically, differences in these areas were smaller for the lower step temperatures.
The O-H stretching vibration band areas (3800–2400 cm−1) for HY and NaY in Figure 4a exhibited gradual decreasing trends. At higher step temperatures, areas decreased more rapidly for the NaY sample. For each sample, circle and triangle plots diverged at higher step temperatures with circles representing larger areas, indicating that some of the 3800–2400 cm−1 O-H stretching vibration band intensity area lost by step heating was regained after cooling to 25 °C. This can be attributed to the re-adsorption of water by the cooled sample. Figure 4b shows temperature-dependent trends for H-O-H bending vibration band intensity areas. The HY and NaY plots exhibit similar trends, except that the NaY areas increased slightly below 50 °C. Like Figure 4a, the circle plots diverged from the triangle plots at higher step temperatures. Unlike the O-H stretching and H-O-H bending vibration band area-versus-temperature plots, the graph in Figure 4c shows significantly different HY and NaY trends for the framework asymmetric stretching vibration band areas (1250–850 cm−1). The NaY framework vibration band area increased by about 30%, whereas the HY increase was less than 10%. Most of the NaY band intensity increases occurred below 80 °C.

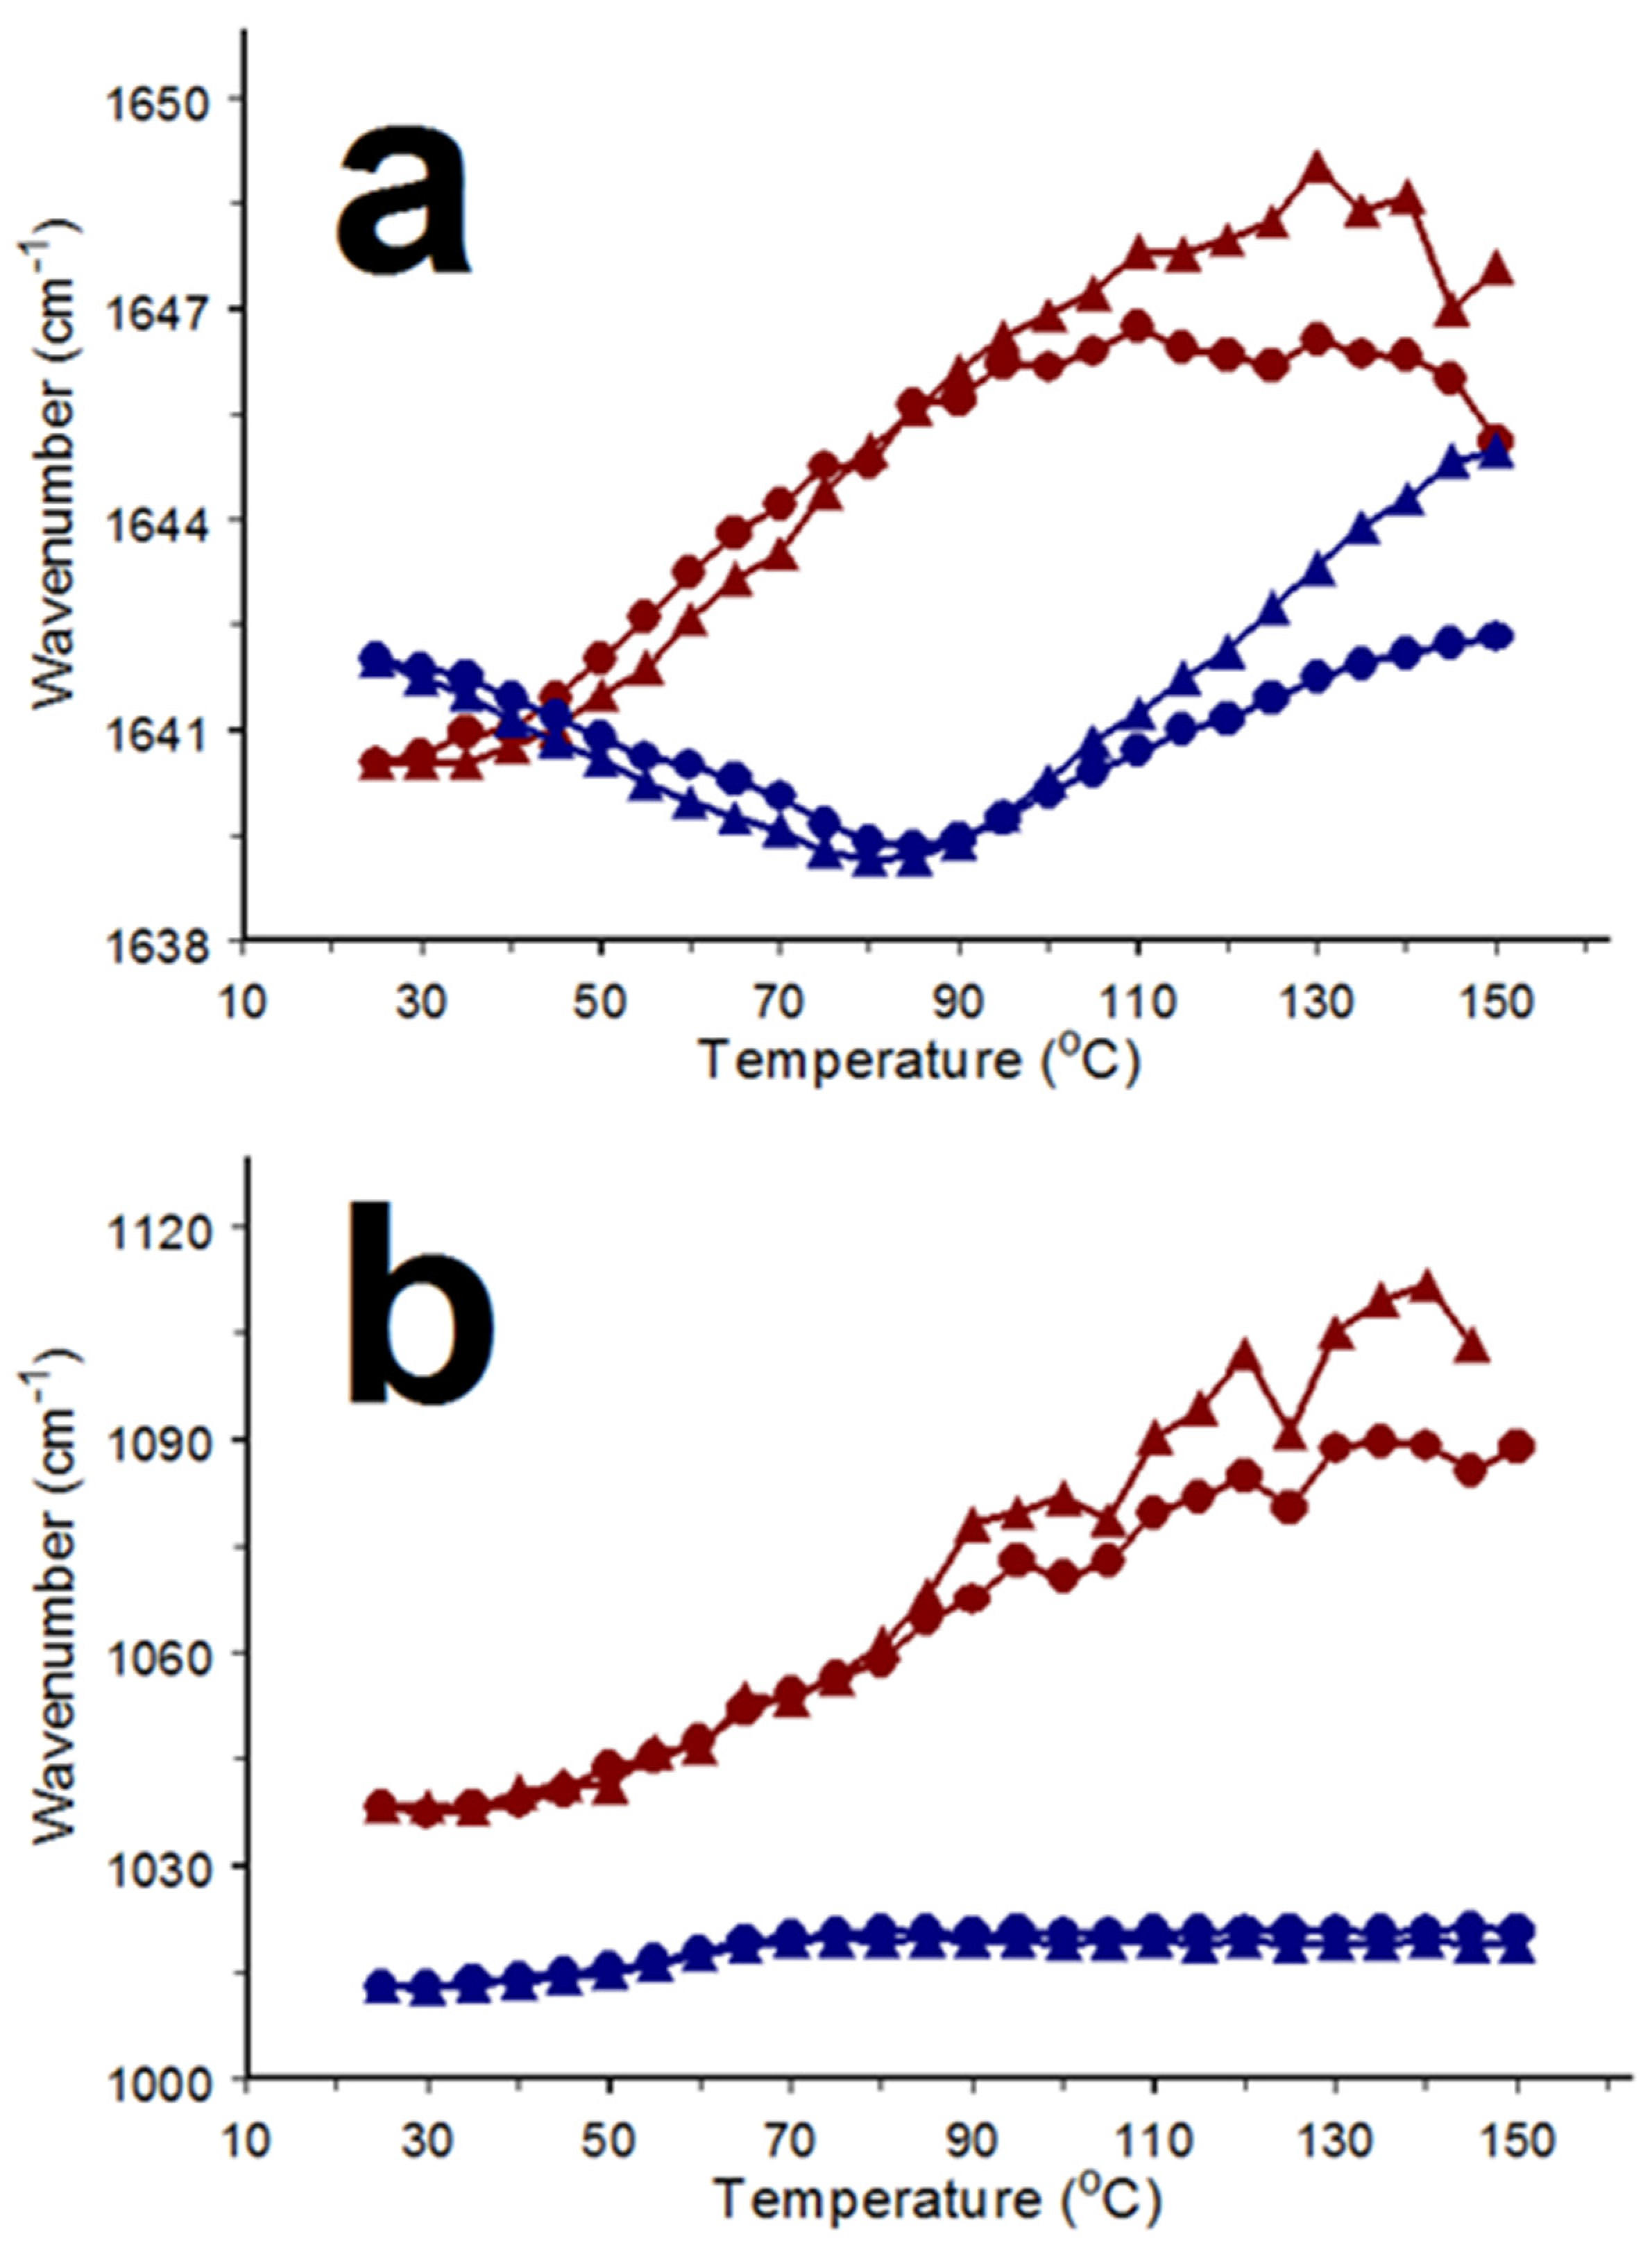
3.2. Functional Group Band Maximum Wavenumber Variations

Figure 5 shows temperature-dependent band maximum wavenumber variations for the H-O-H bending and framework asymmetric stretching vibration bands. The H-O-H bending vibration band wavenumber trends differed for HY and NaY (Figure 5a). Initially, the H-O-H vibration band wavenumbers in the HY and NaY spectra differed by about 2 cm−1. Below 80 °C, the NaY band gradually shifted to a lower wavenumber with increasing temperature. In contrast, HY spectra exhibited a gradual increasing wavenumber trend over this temperature range. Above 90 °C, the NaY H-O-H bending vibration band maximum began to shift to higher wavenumbers, whereas the HY wavenumber continued to increase, but at a slower rate. For both samples, band maxima wavenumbers in spectra obtained at each step temperature and after cooling to 25 °C diverged above 100 °C. At these temperatures, band maxima wavenumbers were consistently lower in spectra obtained at 25 °C (circles).
Figure 5b compares framework vibration band wavenumber trends as a function of temperature for HY and NaY. Initially, the HY band maximum was about 15 cm−1 higher than the NaY band maximum. The NaY band initially shifted to slightly higher wavenumbers and then remained relatively constant above 70 °C. In contrast, the HY band maximum exhibited a larger shift with temperature. In addition, HY band maxima wavenumbers in spectra measured at the step temperatures and after cooling to 25 °C diverged above 80 °C, with the 25 °C spectrum exhibiting a lower wavenumber.

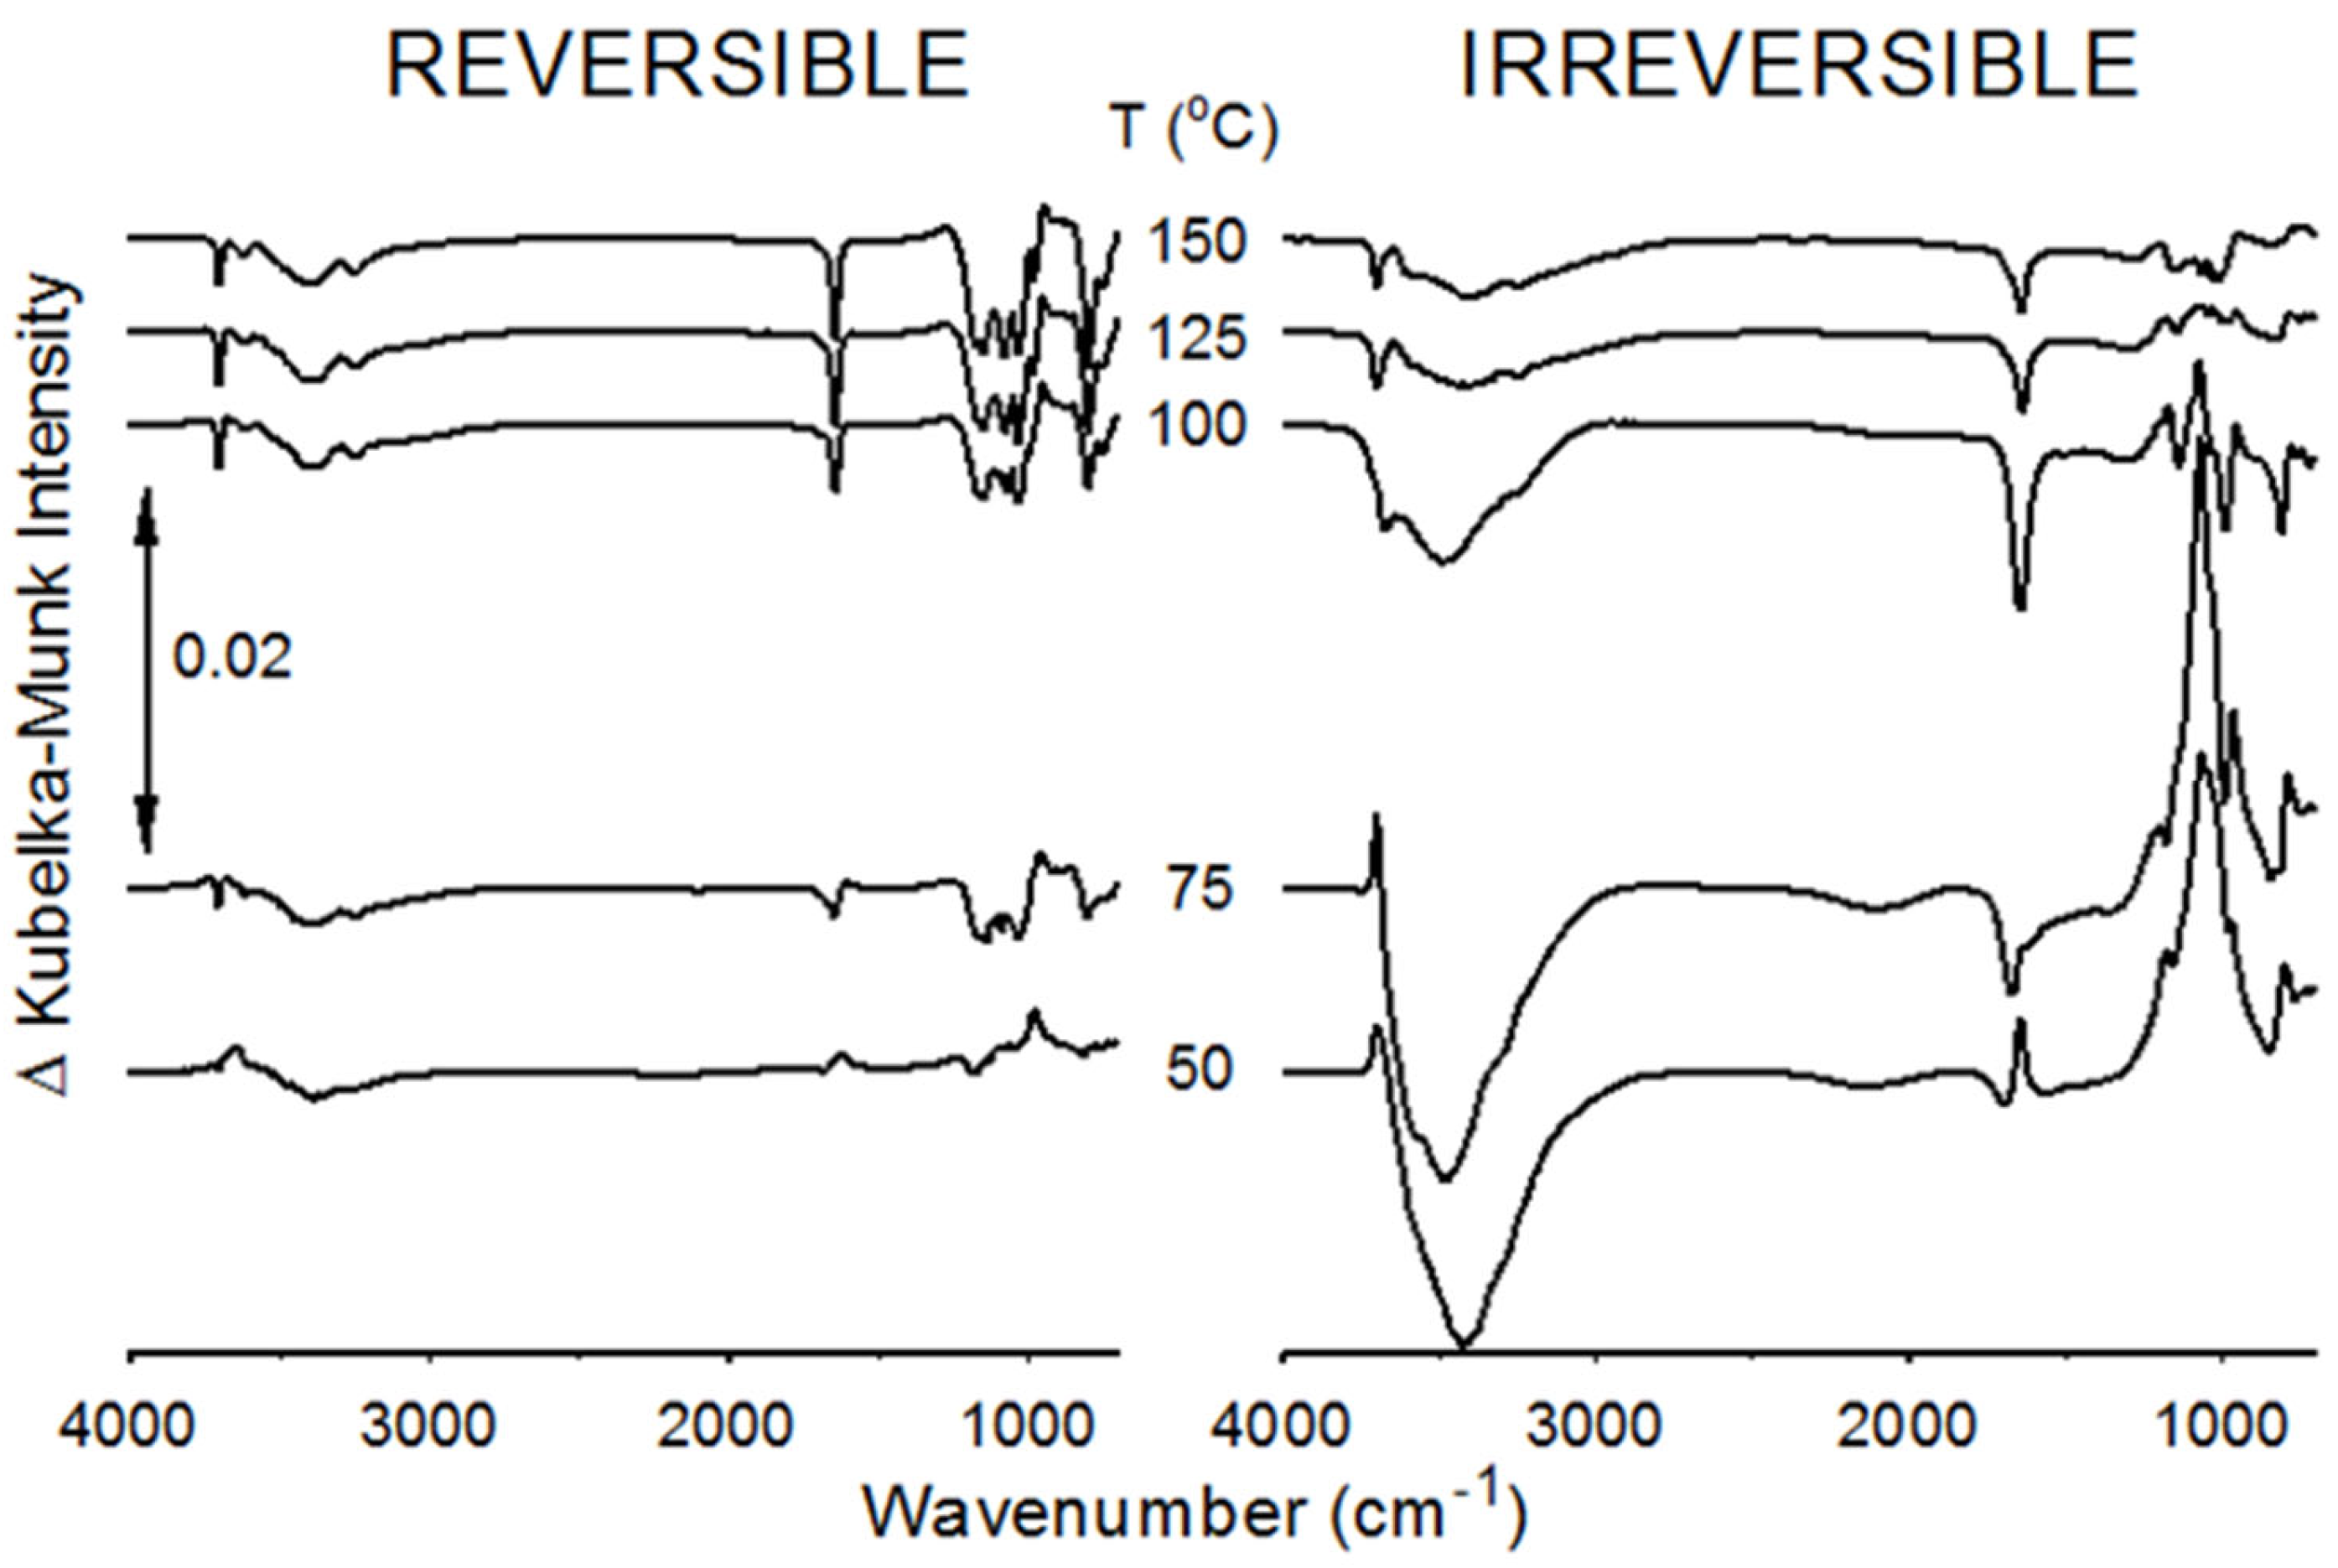
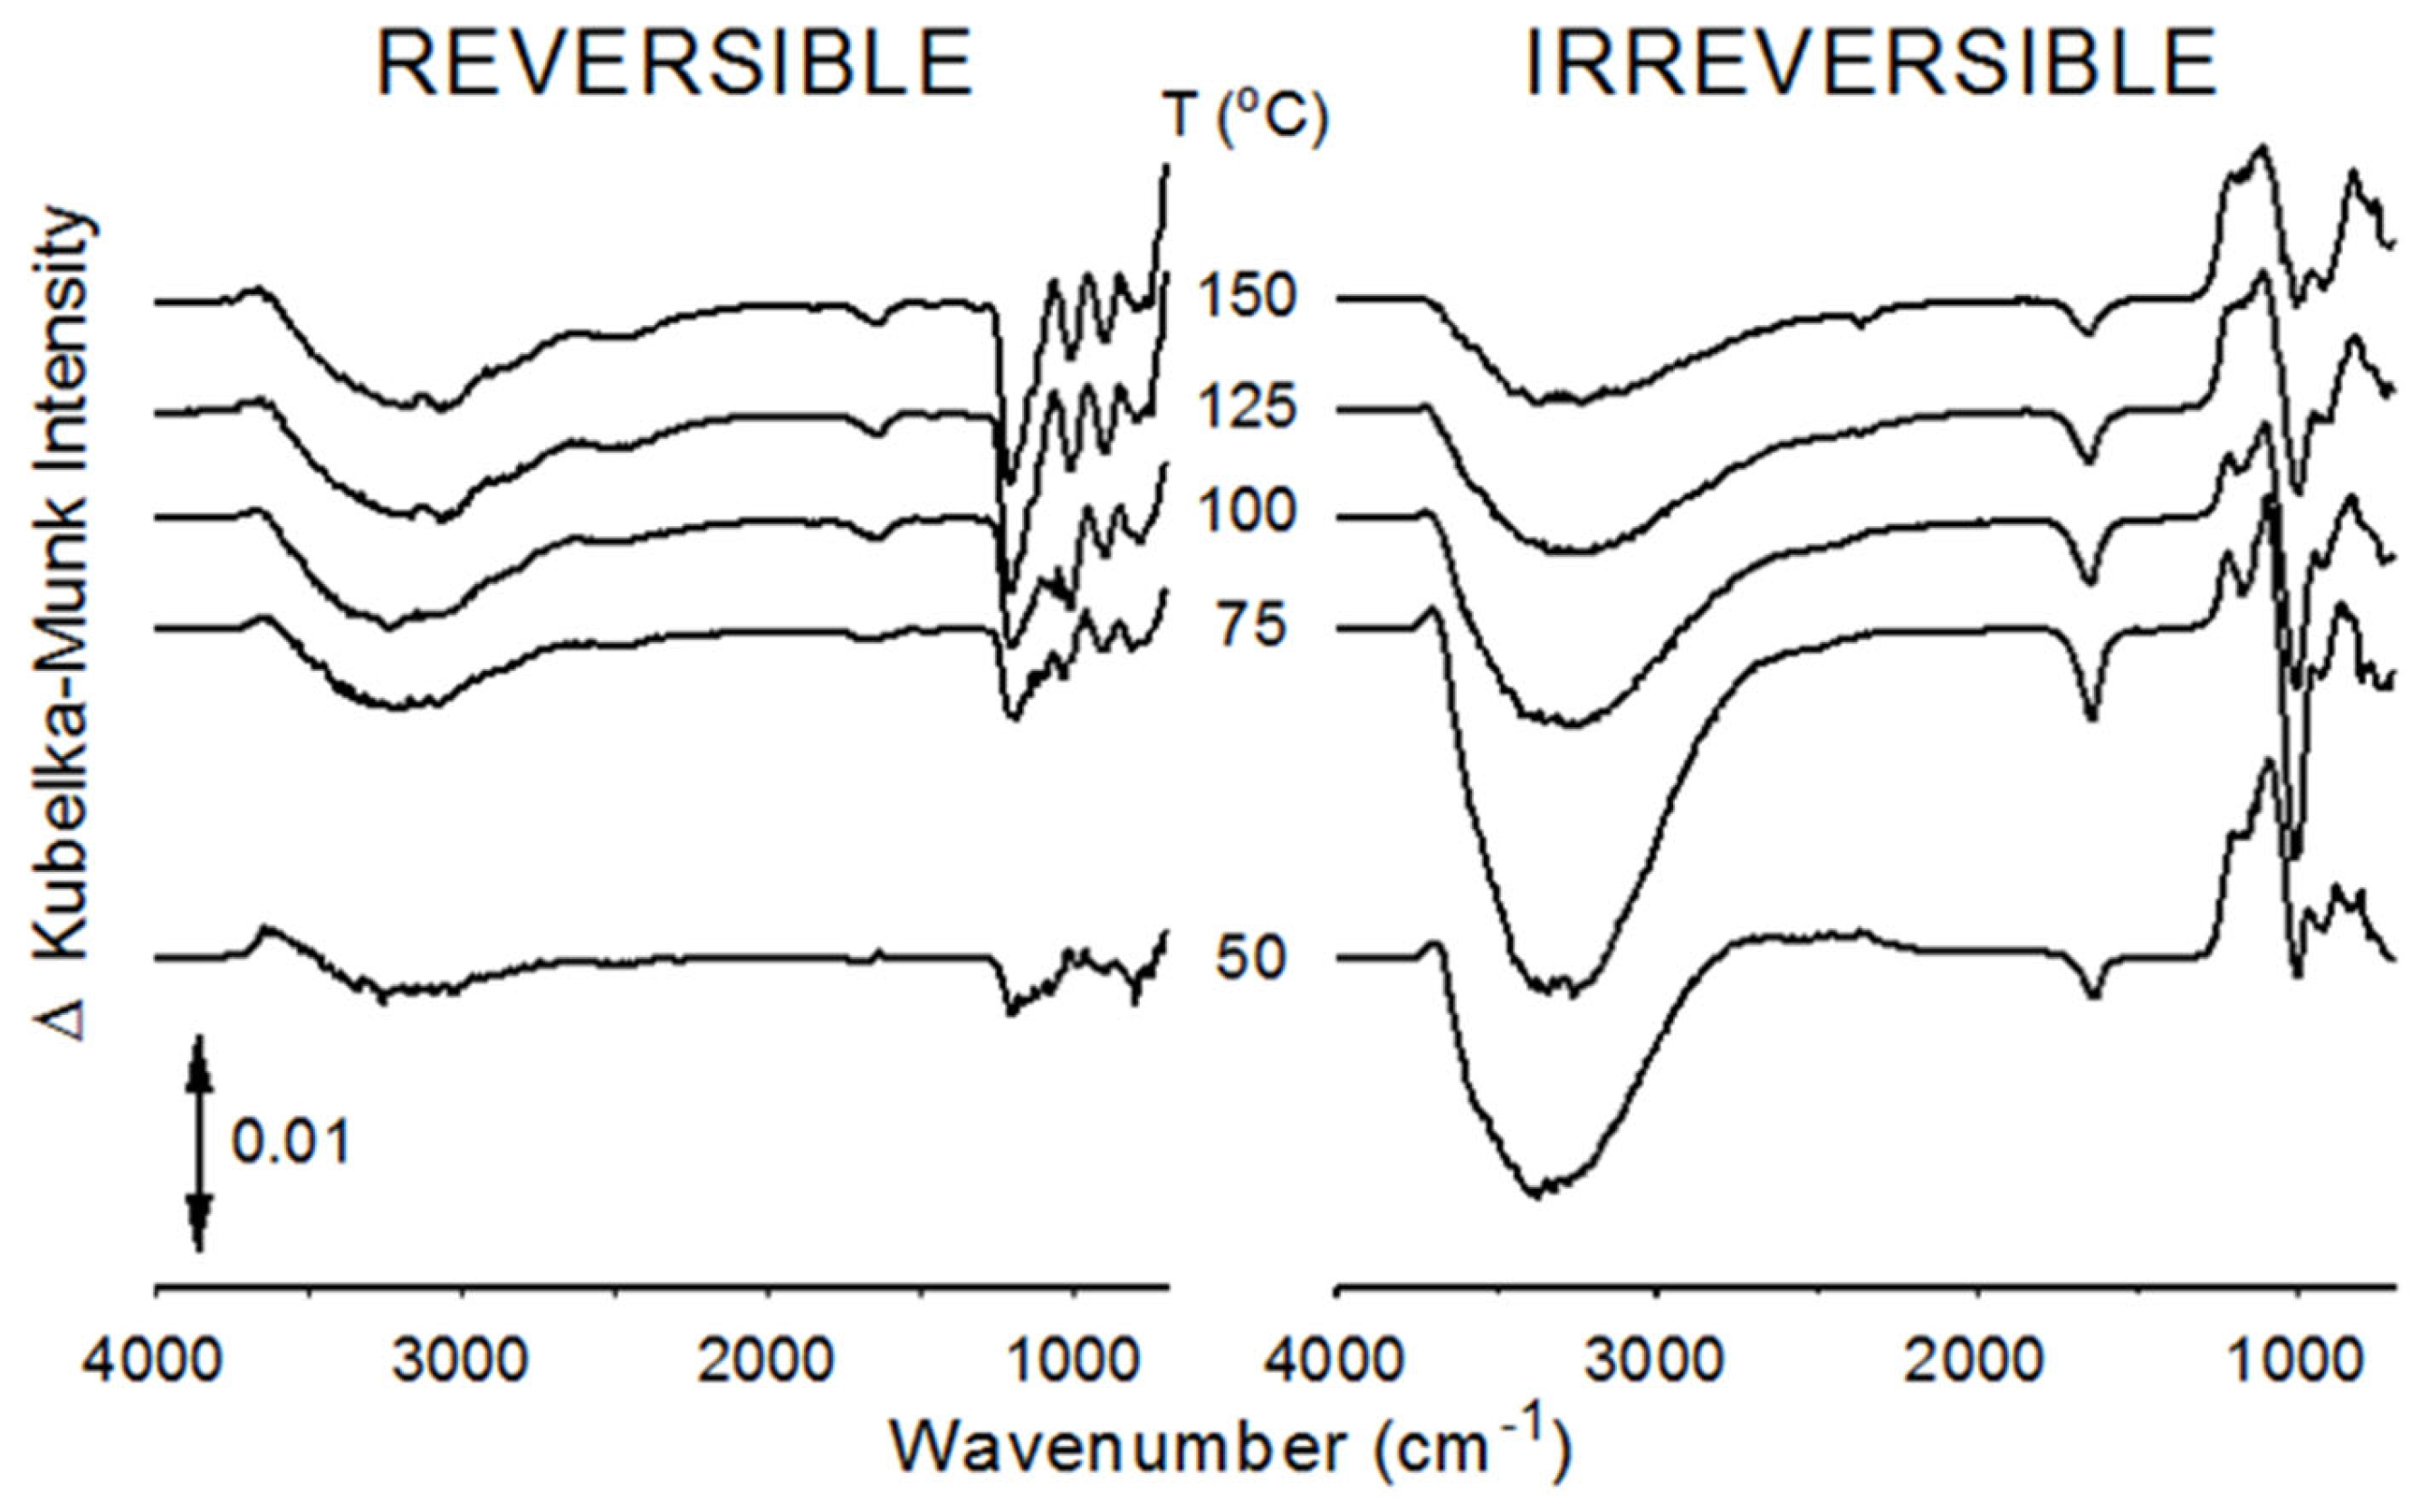
3.3. Reversible and Irreversible Spectrum Changes

Information regarding the reversibility of temperature-dependent vibration band intensity changes was derived from the infrared spectra acquired during the temperature step heating profile [34,39]. As shown by the temperature program depicted in Figure 3, each spectrum obtained between 30 and 150 °C was preceded and followed by a spectrum measured at 25 °C. Reversible spectrum changes were revealed by subtracting the spectrum obtained at 25 °C after cooling from the spectrum measured at the step temperature. Subtracting the 25 °C spectrum acquired prior to the step temperature from the 25 °C spectrum obtained after cooling revealed spectrum changes caused by the temperature increase that were not reversed upon cooling the sample (i.e., irreversible).
Figure 6 shows infrared spectrum changes detected when the NaY sample temperature increased in 25 °C increments. The subtracted spectra were selected from those acquired during the temperature step program shown in Figure 3. The 50 °C residuals in Figure 6 represent spectrum changes that occurred between 25 and 50 °C, whereas the 75 °C results denote changes that occurred between 50 and 75 °C. The 50 °C reversible difference spectrum was the result of subtracting the spectrum measured at 50 °C from the next spectrum, which was obtained at 25 °C. Because these two infrared spectra contained the same heating-induced irreversible variations, the subtraction revealed only those changes that were reversed upon cooling. The 50 °C irreversible spectrum differences were identified by subtracting the 25 °C spectrum measured after cooling from 50 °C from an earlier-acquired reference spectrum. In this case, that reference was the 25 °C infrared spectrum acquired prior to the first heating step. Because these two spectra were obtained at the same temperature, the subtraction revealed the cumulative irreversible changes resulting from heating the sample to the 30, 35, 40, 45, and 50 °C steps. The other reversible and irreversible difference spectra in Figure 6 were calculated by using the same procedure. Reference spectra employed for irreversible change subtractions were the 25 °C infrared spectra measured immediately after cooling the sample from the prior temperature increment. Thus, the reference employed for the 75 °C irreversible subtraction was the 25 °C spectrum acquired after cooling the sample from the 50 °C step. Consequently, Figure 6 differences did not represent total spectrum changes, but rather those that occurred following the previous 25 °C temperature increment.
The largest Figure 6 spectral differences corresponded to irreversible NaY sample changes. Because the spectrophotometer was purged with dry air and 25 °C spectra were acquired about 5 s after cooling, there was insufficient time and water vapor concentration for significant sample rehydration. Thus, irreversible NaY spectrum changes were dominated by the effects of water desorption. The broad negative bands between 3600 and 3200 cm−1 denote O-H stretching vibration band intensity losses caused by sample heating. The positive peak above 3600 cm−1 in the 50 and 75 °C difference spectra likely represents framework hydroxyl groups that lost hydrogen bonding interactions. The broad positive features near 1000 cm−1 represent increases in asymmetric Si-O-Si and Al-O-Si stretching vibration band intensities.
Near 1640 cm−1, the NaY H-O-H bending vibration band changes in the 50 °C irreversible difference spectrum were denoted by a small negative offset adjacent to a larger positive offset at a lower wavenumber. This “derivative” shape is indicative of a red shift (i.e., to a lower wavenumber) coupled with an increase in band absorptivity. For the most part, the irreversible O-H and framework stretching vibration band trends in the 75 °C difference spectrum resembled those in the 50 °C spectrum. However, the H-O-H band intensity was completely negative, confirming that water desorption occurred between 50 and 75 °C. The 100 °C NaY irreversible difference spectrum exhibits the largest water bending vibration band intensity loss, suggesting that the highest water desorption rates occurred between 75 and 100 °C. The negative O-H stretching vibration band consists of at least three overlapping peaks. Unlike the 50 and 75 °C irreversible results, the band near 3700 cm−1 is negative and the framework band intensity changes are different. Sharp positive intensity offsets occurred above 1000 cm−1, whereas sharp negative features were found at lower wavenumbers. Irreversible intensity variations above 1600 cm−1 in the 125 and 150 °C difference spectra were like those in the 100 °C irreversible spectrum, but lower in magnitude. Intensity variations in the framework wavenumber region were small and trends differed from those in the subtractions calculated from spectra obtained at lower step temperatures.
The features of the reversible 50 °C difference spectrum were like those in the corresponding irreversible spectrum, but the magnitudes of the spectrum changes were much smaller. NaY subtraction residuals in the reversible 75–150 °C difference spectra were similar. Like the irreversible changes, these difference spectra contained negative H-O-H bands. Instead of the mostly positive offset near 1000 cm−1, reversible difference spectra exhibit intensity losses adjacent to gains, suggesting red shifting of overlapping framework vibration bands. These reversible difference spectra also contain negative peaks near 3700 cm−1 that are sharper than those in the irreversible changes.
Figure 7 shows the reversible and irreversible spectrum changes for the HY sample. Difference spectrum band shapes differ from those in the NaY subtractions for the same temperature increment. Like Figure 6, the largest subtraction residuals were attributed to irreversible infrared spectrum changes. The HY 50 °C irreversible difference spectrum contains a broad negative O-H stretching vibration band and mostly positive peaks in the framework vibration band region. All HY irreversible difference spectra exhibited negative peaks for H-O-H bending vibration bands that were broader than the corresponding NaY peaks. This indicates that the effects of hydrogen bonding on H-O-H bending vibrations were greater for the HY sample.
The reversible HY difference spectra profiles were similar and differed substantially from the corresponding NaY results. The sharp negative 3700 cm−1 bands in the NaY reversible difference spectra were absent in the HY spectral subtractions. The overlapping framework vibration band profiles in HY reversible spectra differed from the irreversible changes associated with the same temperature ranges.

3.4. Band Variations near 3700 cm−1

The HY reversible and irreversible difference spectra in Figure 7 contain small positive peaks that maximize at 3694 cm−1 and span the 3757–3663 cm−1 range. The NaY reversible difference spectra in Figure 6 contain sharper negative peaks maximizing at 3695 cm−1 and spanning a narrower 3716–3682 cm−1 range. Figure 8 compares temperature-dependent variations in the 3730–3660 cm−1 region of the HY and NaY spectra, which include these ca. 3700 cm−1 peaks. The HY areas increased slightly with increasing step temperature. In contrast, the NaY areas exhibited a roughly 40% increase between 25 and 70 °C and then decreased at higher step temperatures.

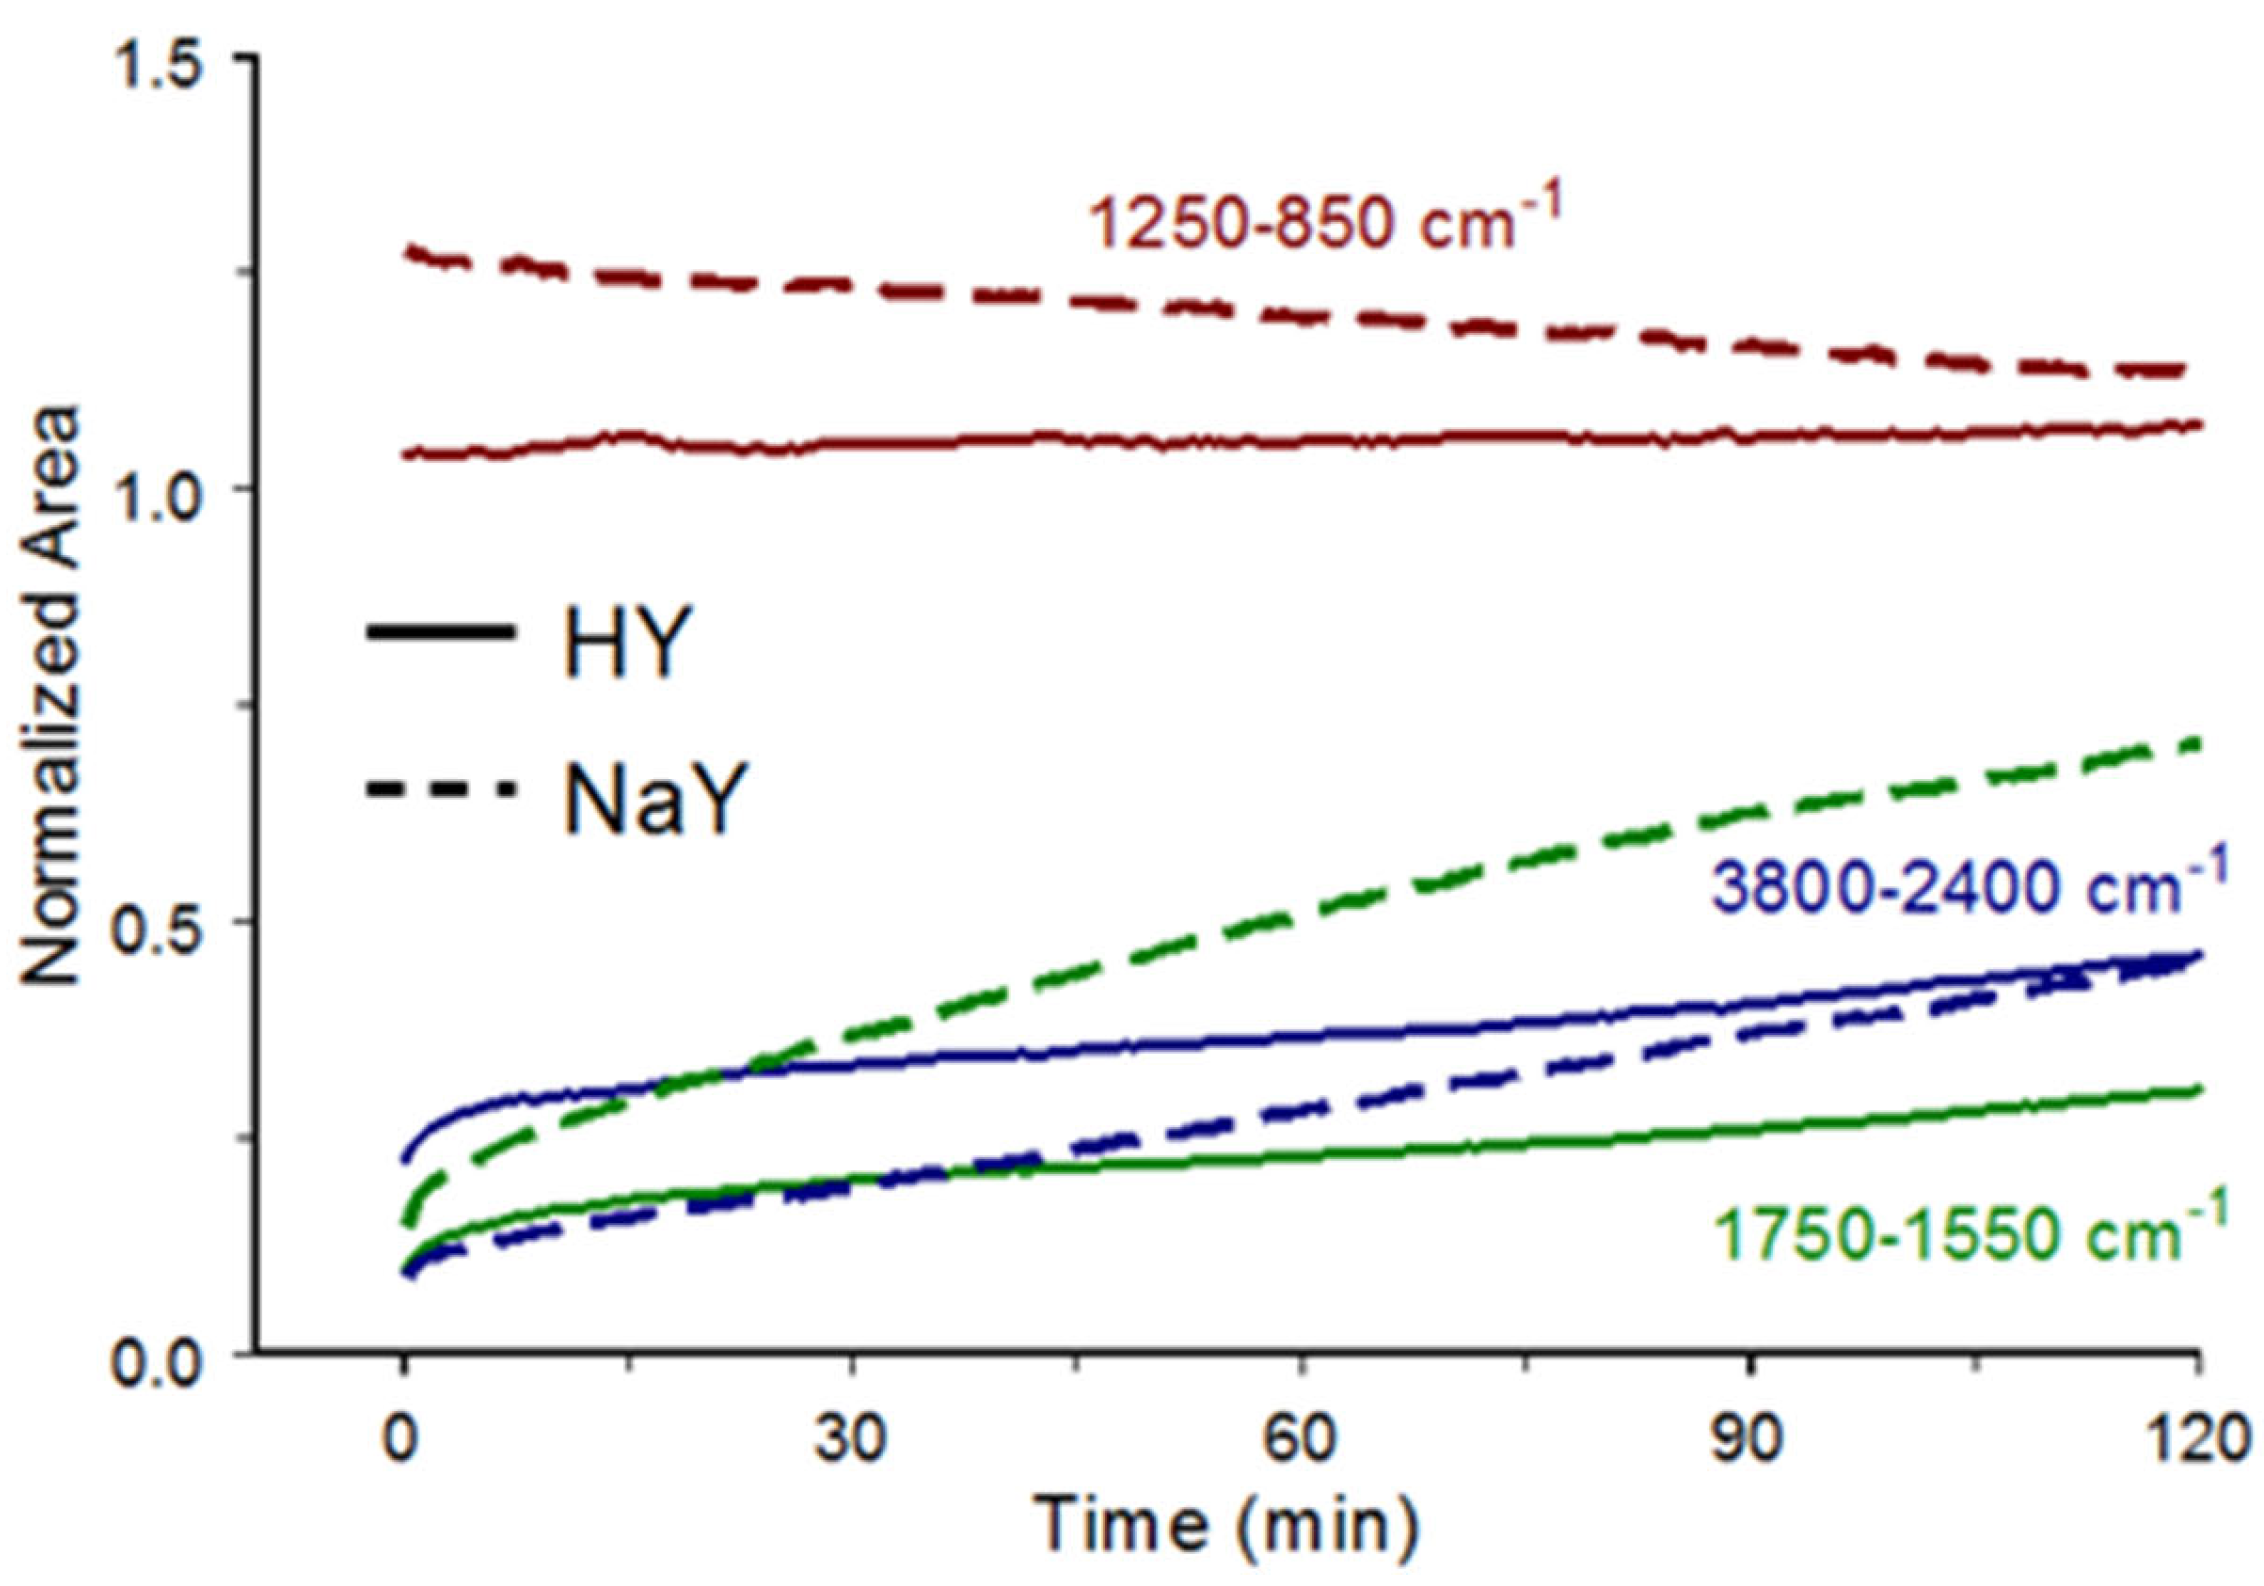
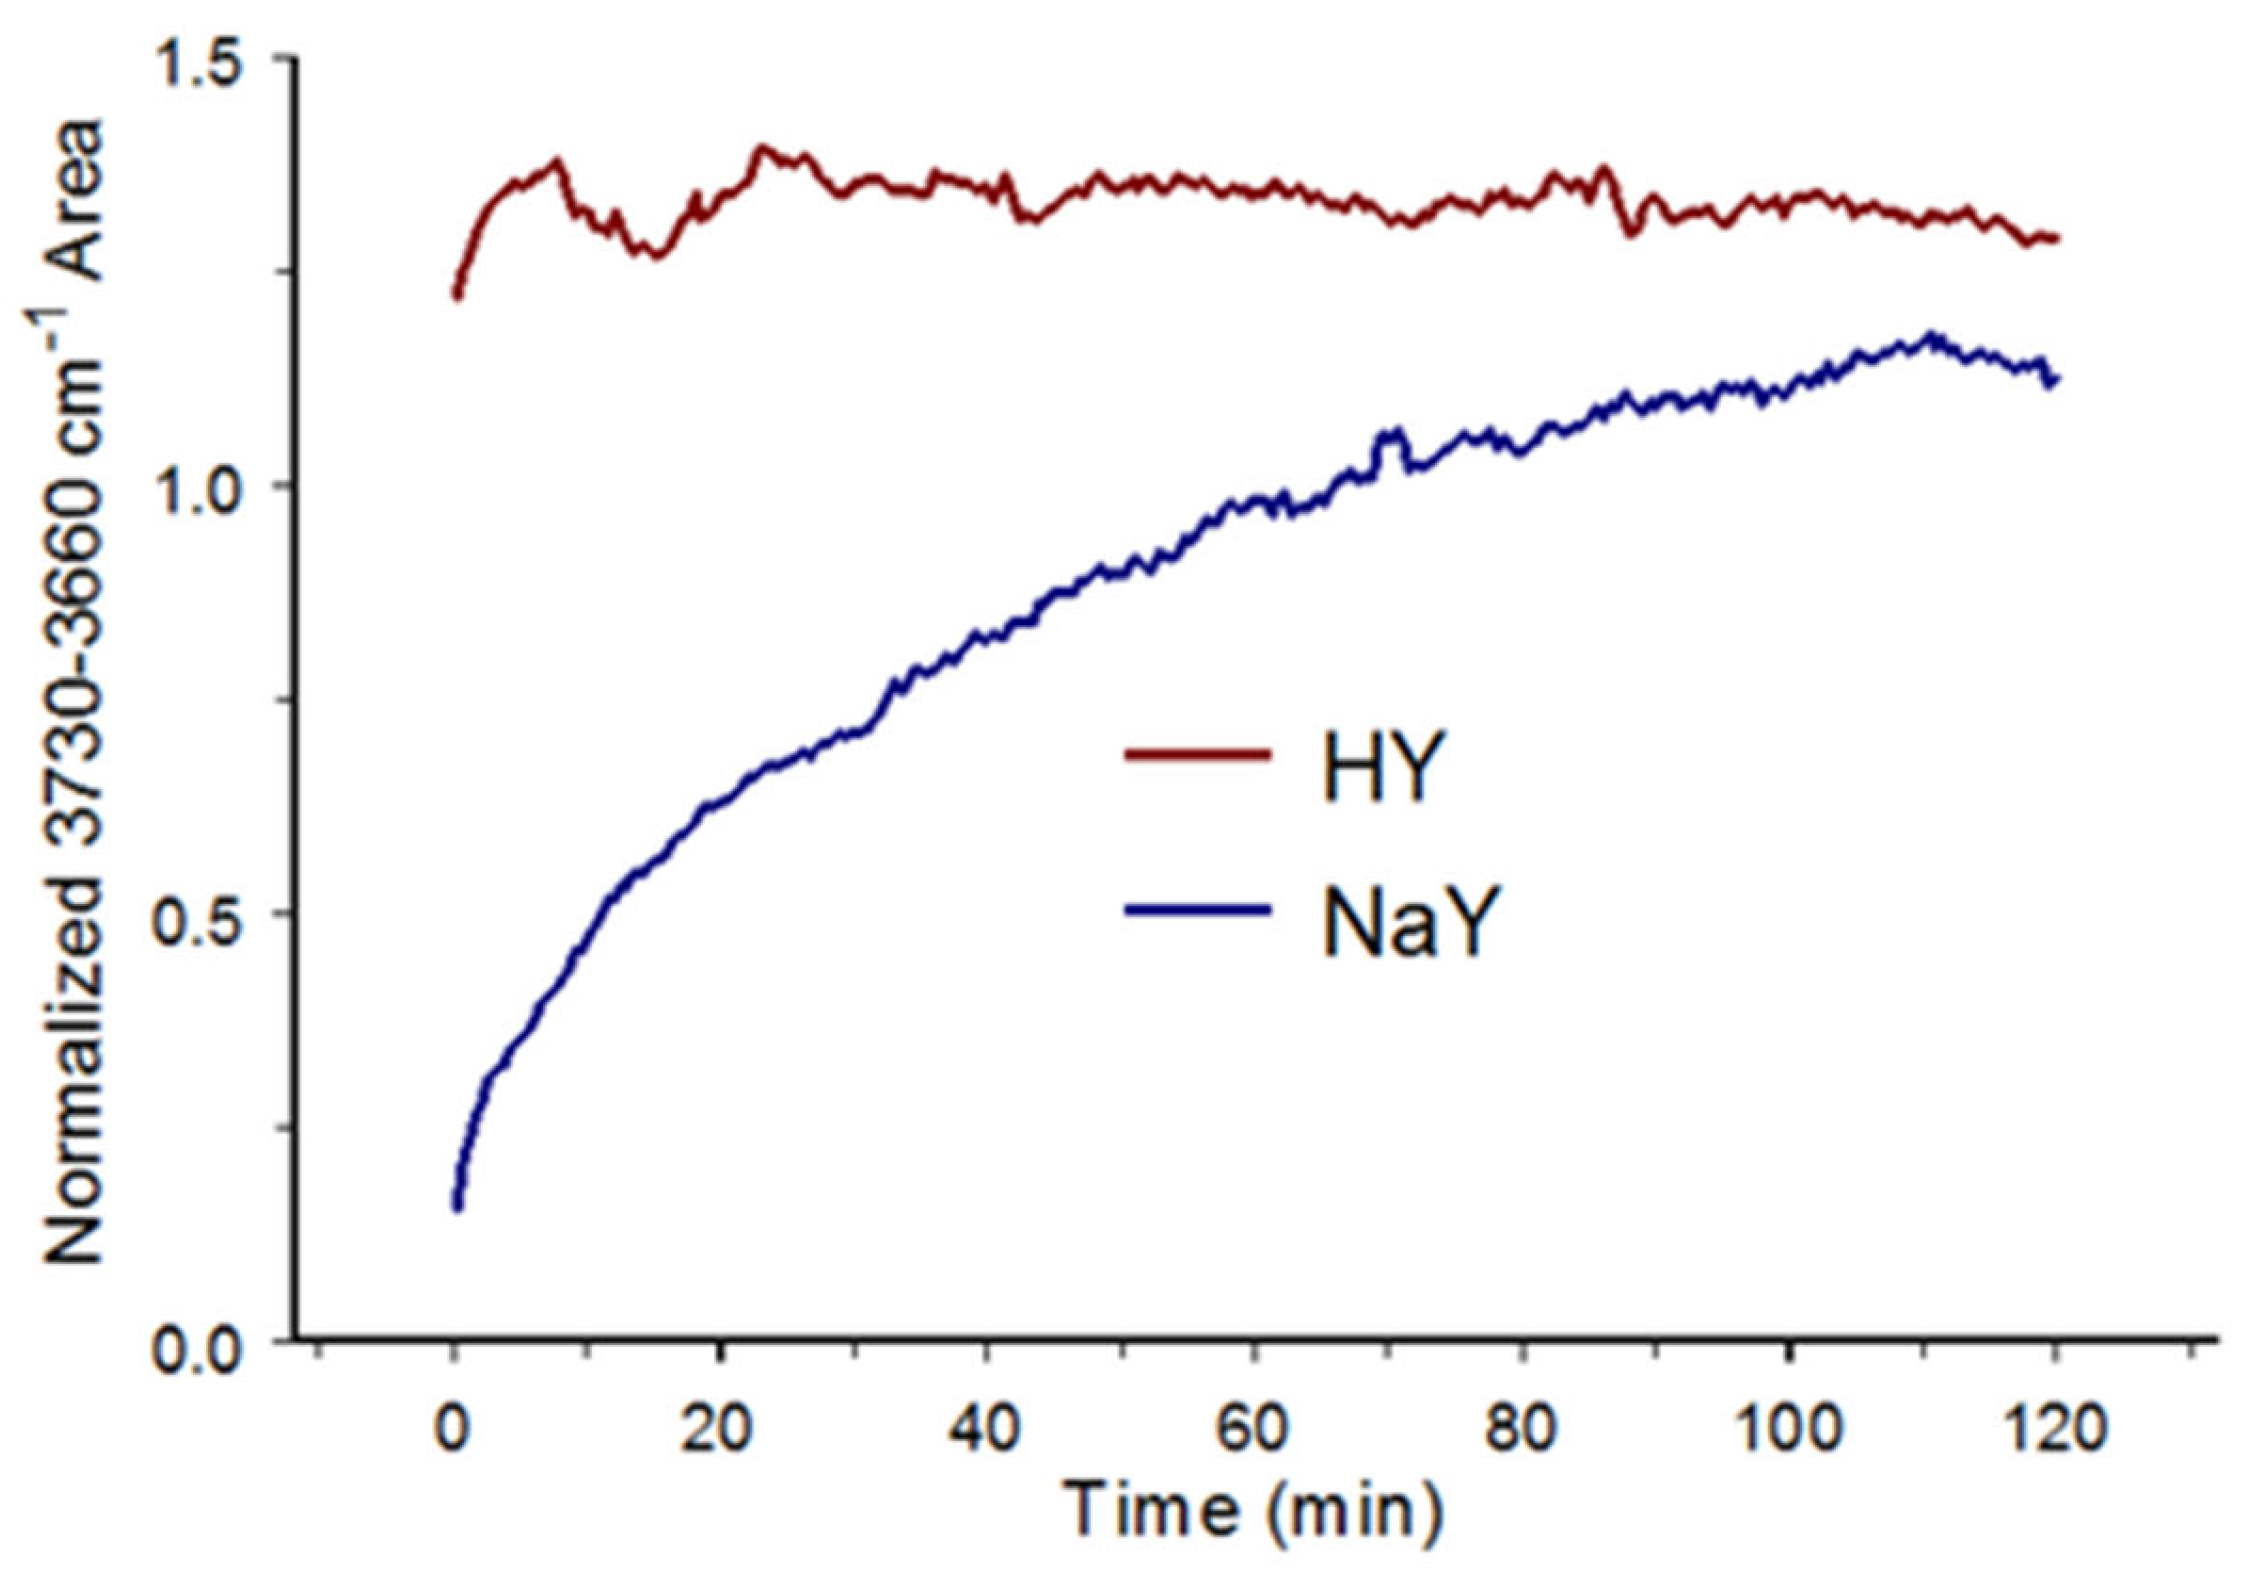
3.5. HY and NaY Sample Rehydration

Rapid cooling after temperature steps and low water vapor concentrations within the spectrophotometer minimized water re-adsorption when samples were cooled to 25 °C. To investigate the impact of water re-adsorption, infrared spectra of dehydrated HY and NaY samples were obtained while exposing them to water vapor within the spectrophotometer. Samples were first dehydrated by heating them to 150 °C and holding at this temperature for 5 min. Water adsorption began after rapidly cooling samples to 10 °C. The 10 °C rehydration temperature was preferred over higher temperatures because the water adsorption rate was greater. Figure 9 shows an overlay of HY (red) and NaY (blue) difference spectra calculated by subtracting the initially acquired spectrum from the spectrum obtained after 2 h at 10 °C. These spectra resemble the inverse of the 75 °C irreversible difference spectra in Figure 6 and Figure 7.
Figure 10 shows functional group-specific band area profiles for the 3800–2400 cm−1 O-H stretching vibration band (blue), the 1750–1550 cm−1 H-O-H bending vibration band (green), and the 1250–850 cm−1 overlapping framework asymmetric stretching vibration bands (red). Solid lines denote HY trends and dashed lines represent NaY trends. Band areas were normalized by dividing them by the band area in the same spectral region of infrared spectra obtained prior to heating the samples (i.e., Figure 2a). All normalized band areas approached 1.0, representing a return to the fully hydrated infrared spectrum. NaY areas for H-O-H bending and O-H stretching vibration bands increased with elapsed time, whereas framework band intensity decreased with time. Similar trends were observed for HY, but the rates of area changes were much lower. The 3800–2400 cm−1 areas increased to 46% for HY and 45% for NaY, whereas the 1750–1550 cm−1 areas after 2 h at 10 °C were 30% and 71%, respectively. These trends were the opposite of those detected while heating these samples (Figure 4).
Figure 11 depicts the H-O-H bending and framework stretching vibration band maximum wavenumber trends during the 2 h isothermal period. Both graphs indicate shifts from the initial wavenumbers, which are listed for each curve. The HY H-O-H band wavenumber exhibited a gradual increasing red shift, whereas the NaY band initially exhibited a red shift followed by a blue shift after 30 min (Figure 11a). Infrared spectra for both samples exhibited red shifts for the framework vibration band wavenumber (Figure 11b). However, the wavenumber shifts were much larger in the HY spectra.
Figure 12 shows plots of HY (red) and NaY (blue) 3730–3660 cm−1 integrated areas-versus-time derived from spectra obtained at 10 °C. HY areas initially exceeded the fully hydrated spectrum area by about 25% and then exhibited a slight negative slope. The area decrease can be attributed to a loss of isolated SiOH and AlOH functional group vibration band intensities due to the red shifting of these bands by hydrogen bonding. The blue curve in Figure 12 indicates that the NaY 3700 cm−1 band area increased dramatically with time. The area exceeded the fully hydrated spectrum area after 60 min and continued to increase until 100 min was reached. Between 100 and 120 min, the area decreased slightly.

4. Discussion

Subtle variations in HY and NaY infrared spectra may be attributed to temperature-dependent zeolite expansion and contraction, the loss/gain of water, and reorganization of zeolite constituents to compensate for water loss/gain. Water molecules can hydrogen-bond with other water molecules and the framework, particularly where SiOH and AlOH functionalities are located. Because the HY sample was derived from the NaY material by replacing Na+ with H+, the zeolite structure and number of extra-framework SiOH and AlOH moieties should have been preserved. Thus, at 150 °C and below, differences in HY and NaY temperature-dependent sample behaviors can be attributed to effects caused by the different counterions (i.e., H+ and Na+). Because these effects impacted zeolite constituent vibrations, they could be characterized by infrared spectral subtractions and band intensity trends.

4.1. Water Bending Vibrations

The ca. 1640 cm−1 H-O-H bending vibration band can be uniquely assigned to water molecules within the zeolite Y cage structure [44]. The mass loss curves in Figure 1 suggest that slightly more water (i.e., 2.4%) was removed from the NaY sample at 150 °C. Surprisingly, the normalized NaY H-O-H bending vibration band intensity in Figure 2a was about double that of HY. The intensity and wavenumber of this vibration band depended on water molecule local environments, so the greater-than-expected NaY band intensity may be attributed to Na+–water molecule interactions. Although the mass loss curves indicate that water desorption began as soon as samples were heated, the H-O-H bending vibration band area did not change significantly for either sample below 40 °C (Figure 4b). This could be an indication that the infrared detector was less sensitive than the thermogravimetric balance or that band intensity losses associated with water desorption were offset by absorptivity increases. In fact, a slight increase in area for the NaY bending vibration band is evident in Figure 4b at 45 °C. In addition, the NaY 50 °C irreversible difference spectrum in Figure 6 exhibits an intensity gain along with a smaller intensity loss. A similar derivative-shaped feature in H-O-H spectrum differences at these temperatures was previously reported [29]. Interestingly, a comparable increase in band area at 45 °C was not found in the HY H-O-H band area plot in Figure 4b, and the HY 50 °C irreversible difference spectrum in Figure 7 contained a single negative peak near 1640 cm−1. The greater H-O-H vibration band areas in NaY spectra obtained at 40 and 45 °C (Figure 4b triangles) compared to the spectra obtained after cooling to 25 °C (Figure 4b circles) and the positive offset near 1640 cm−1 in the NaY 50 °C irreversible difference spectrum confirm that a net band absorptivity increase occurred during the initial dehydration of NaY. The lack of significant H-O-H bending vibration band area changes in the HY spectra below 40 °C and the slight band area increases in NaY spectra obtained at 40 and 45 °C may result from reorganizations of the water molecules remaining within the zeolite after partial dehydration.
Above 50 °C, Figure 4b shows that the HY and NaY H-O-H vibration band areas decreased, with trends that followed their corresponding mass loss curves (Figure 1). For both samples, areas derived from measurements made after cooling to 25 °C were larger than those obtained at the step temperatures. The negative peaks near 1640 cm−1 in the reversible difference spectra in Figure 6 and Figure 7 indicate that some water re-adsorbed while cooling samples from step temperatures greater than 50 °C. Although Figure 1 confirms that more water was lost from NaY than HY at 150 °C, the normalized H-O-H vibration band area in Figure 4b was consistently greater for the NaY sample. Thus, either more water molecules remained in the NaY zeolite at 150 °C, or the net absorptivity for the remaining water molecules was greater when Na+ was present. The fact that the growths of the HY and NaY O-H stretching vibration band areas at 10 °C reached similar levels (46 and 45%) after 2 h but the NaY H-O-H bending vibration band area was more than double that for HY (i.e., 71% vs. 30%) suggests that Na+ interactions resulted in significant absorptivity enhancements for the water bending vibration.
The H-O-H band wavenumber shifts during HY and NaY dehydrations in Figure 5a were the opposite of the rehydration trends in Figure 11a. Band intensity variations were likely due to zeolite water molecule reorganizations in response to water loss/gain. For HY, the increasing blue shift at higher temperature (Figure 5a) and the increasing red shift with time at 10 °C (Figure 11a) are consistent with the behavior of pure water. The blue shifts in Figure 5a can be attributed to a weakening of the water hydrogen bonding network due to increased temperature [44] and sample water loss, whereas the red shifting as a function of time at 10 °C in Figure 11a reflects a strengthening of this network due to new hydrogen bonds, which are contributed by re-adsorbed water molecules. The initial red shift in the NaY H-O-H bending vibration band in Figure 5a can be attributed to Na+–water molecule interactions. Seki et al. found that Na+–water interactions caused red shifts in the H-O-H bending vibration band that were proportional to Na+ concentration [44]. Apparently, below 80 °C, red shifts associated with new Na+–water interactions offset blue shifting associated with a weakening of the hydrogen bonding network. The slope change in the plot above 80 °C in Figure 5a suggests that factors that resulted in a weakening of the water molecule hydrogen bonding network were dominant. The NaY H-O-H bending vibration band wavenumber-versus-time plot in Figure 11a suggests that water re-adsorption reversed these effects. Consequently, the HY and NaY bending vibration band wavenumbers both exhibited red shifts during the first 30 min. After that, the NaY band began to exhibit a blue shift, whereas the HY band continued to display a red shift. The divergence of the triangle and circle plots above 100 °C for HY and NaY in Figure 5a is consistent with a strengthening of water molecule hydrogen bonding networks in both samples after cooling to 25 °C.

4.2. Hydroxyl Stretching Vibrations

Figure 2 shows that the O-H stretching vibration band profiles in NaY and HY infrared spectra were significantly different. In addition, the O-H stretching vibration band area-versus-temperature plots for HY and NaY differ between 25 and 35 °C in Figure 4a. The HY band area remained relatively constant until 35 °C, whereas the NaY band area began to diminish immediately. Above 35 °C, both plots exhibited band area losses, but with different slopes. Band area losses occurred at a higher rate for NaY, and the residual band area at 150 °C was less for NaY (10%) than HY (37%). For both curves, the O-H stretching vibration band areas in spectra measured at step temperatures (triangles) and immediately after cooling (circles) were more similar at lower temperatures. The larger areas derived from NaY and HY spectra measured at 25 °C after cooling from step temperatures (circles) were the result of water re-adsorption. This is confirmed by the negative O-H stretching vibration band features in the 100–150 °C reversible difference spectra (Figure 6 and Figure 7).
Figure 8 shows that the NaY 3730–3660 cm−1 area maximized at about 70 °C. For HY, this area increased slightly and then leveled off above 70 °C. These dramatically different trends and the lack of sharp negative 3700 cm−1 peaks in the reversible HY difference spectra in Figure 7 suggests that the presence of Na+ was responsible for these trends. A similar temperature dependence of the 3700 cm−1 band intensity was previously correlated with Na+ movements within zeolite Y cage structure [29].

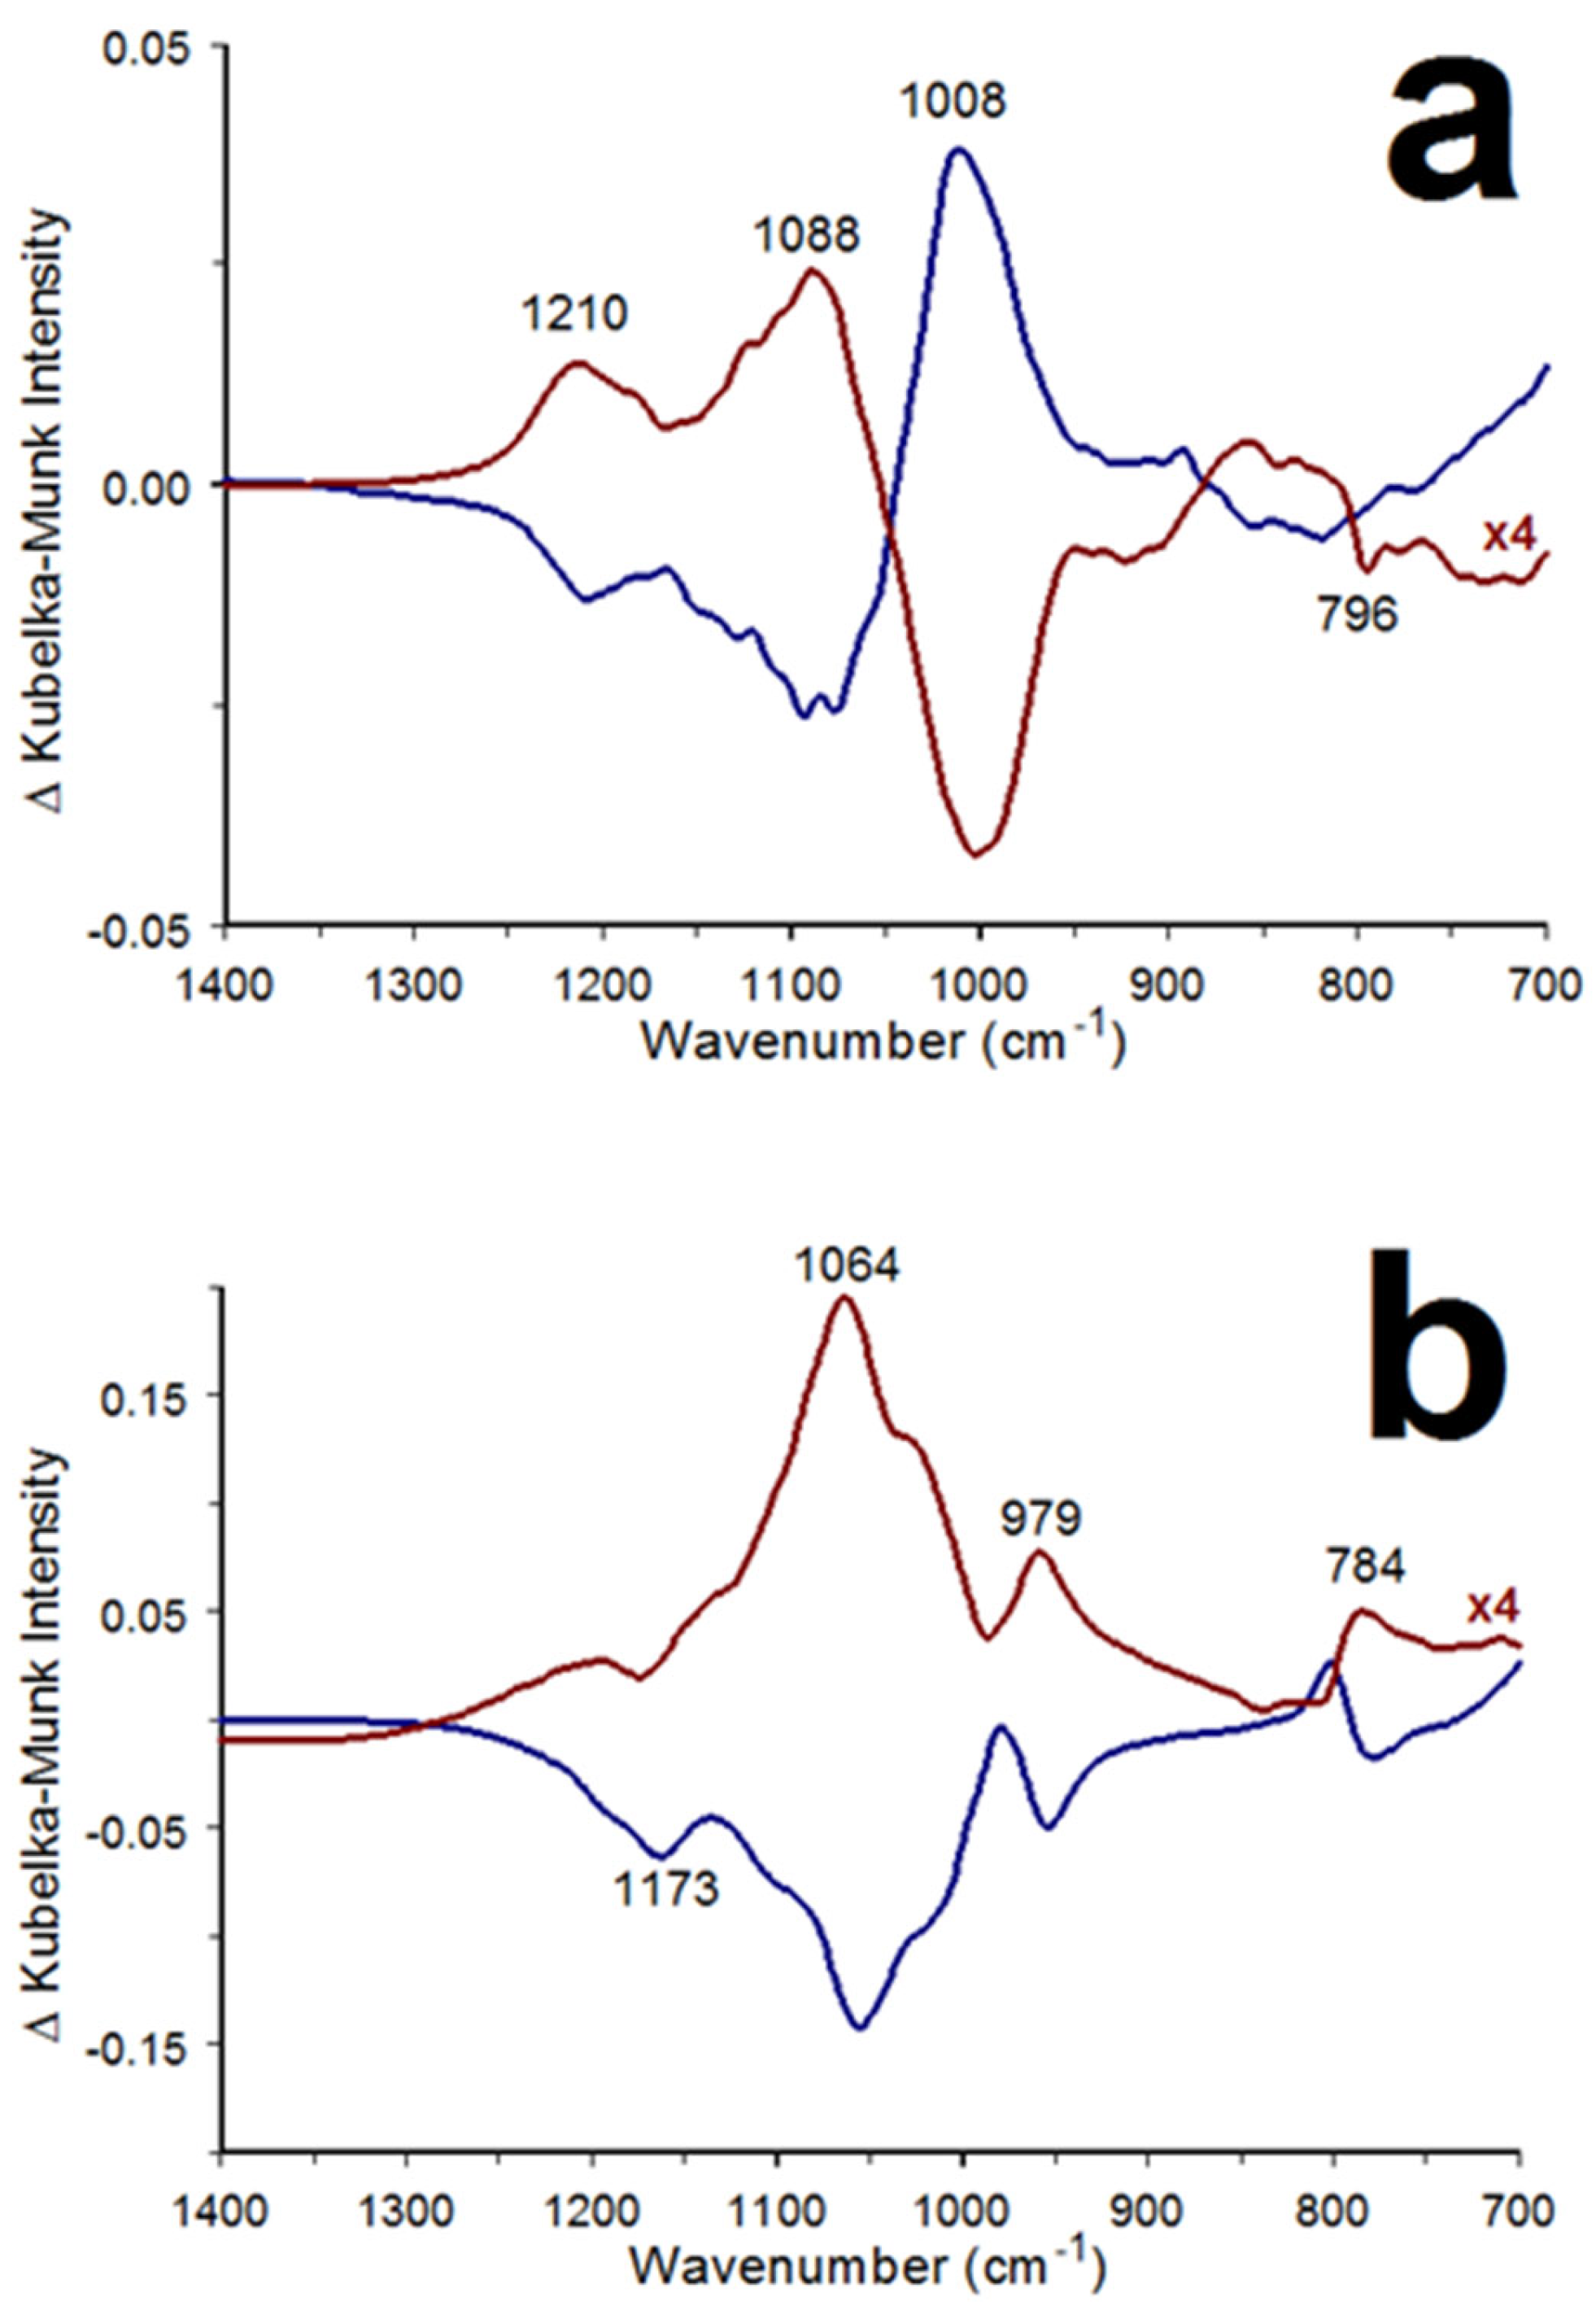
4.3. Zeolite Framework Vibrations

The significant difference in the 1250–850 cm−1 band area temperature profiles in Figure 4c was most likely associated with Na+ interactions. Because the zeolite Y structure should have been the same for HY and NaY, these differences were likely due to framework distortions associated with bond length and/or angle variations. The HY band intensity trends may be due to framework thermal expansion and/or water molecule–framework interaction changes. In addition to these factors, movements of Na+ within the NaY zeolite may also alter the framework structure. Hu et al. postulated that cation migration during NaY heating resulted in stronger interactions between Na+ cations and framework oxygens, leading to an overall disruption of unit cell-stabilizing interactions linking the framework, Na+ cations, and water molecules, and resulting in unit cell expansion [28].
The 1250–850 cm−1 regions in the reversible and irreversible difference spectra in Figure 6 and Figure 7 differ due to the zeolite counterions. For each, temperature-dependent difference spectrum band intensities comprised multiple overlapping contributions that differed in reversible and irreversible spectra. Reversible framework vibration band intensity changes were primarily negative for both materials. Irreversible differences in NaY spectra were mostly positive, whereas the HY irreversible difference spectra contained both positive and negative components. NaY areas in the plots in Figure 4c were larger because intensity differences were always positive.
Figure 13 compares HY and NaY difference spectrum patterns for overlapping framework vibration band variations detected during the 2 h 10 °C isothermal measurements (blue) and in the 75 °C irreversible difference spectra (red). The plots in Figure 13a for HY are nearly mirror images, suggesting that the 75 °C irreversible difference spectrum in Figure 7 represents the impact of water loss on framework vibrations. The curves in Figure 13b mirror each other below 1100 cm−1. However, the 1173 cm−1 negative band in the 10 °C isothermal spectrum subtraction result is also negative in the 75 °C irreversible difference spectrum. Thus, the 1173 cm−1 intensity changes were not correlated with water loss/gain. The band shapes and peak locations in the HY and NaY difference spectra differed substantially, suggesting different mechanisms. Apparently, temperature-dependent Na+ interactions resulted in band intensity changes, whereas HY differences included both intensity and wavenumber variations.

4.4. Counterion Effects

Even though thermogravimetric mass loss curves for HY and NaY were nearly identical between 25 and 70 °C (Figure 1), temperature perturbation infrared spectroscopy revealed significant differences between these zeolites over this temperature range. The H-O-H bending vibration band maximum wavenumbers shifted in opposite directions for HY and NaY below 80 °C (Figure 5a); the 1250–850 cm−1 framework asymmetric stretching vibration band intensity between 25 and 80 °C increased much more for NaY than HY (Figure 4c), and the band maximum wavenumbers for these vibrations blue-shifted more for HY than NaY (Figure 5b). The sharp 3700 cm−1 band intensity, which was only detected for NaY, maximized near 70 °C (Figure 8). These trends in temperature-dependent infrared spectrum variations can be attributed to differing impacts from the H+ and Na+ counterions.
Total sample mass losses at 200 °C were 20.8% for HY and 23.3% for NaY (Figure 1), which are within the typical range for faujasite zeolites [38,45]. The slower HY mass loss rate exhibited above 70 °C likely reflects the effects of strong hydrogen bonding between water molecules and HY Brønsted acid sites. In contrast, primarily electrostatic interactions would be expected between Na+ and water molecules. Previous X-ray diffraction measurements revealed that Na+ cations migrate within zeolite cages during NaY thermal dehydration [28]. These movements would be expected to impact framework vibrations and alter water molecule local environments, affecting the vibration bands of these functionalities. NaY band area changes observed while heating samples and during rehydration at 10 °C can be correlated with trends in the O-H stretching vibration band area. For example, the area of this band decreased the most for the NaY sample between 25 and 80 °C and the NaY 1250–850 cm−1 integrated area increased dramatically over this temperature range. The O-H stretching vibration band area increase was approximately linear during the 2 h isothermal period (Figure 10). Similarly, the 1250–850 cm−1 band area loss was also linear.
Irreversible difference spectrum changes detected while heating HY and NaY (Figure 6 and Figure 7) were primarily caused by water loss. These temperature-dependent spectrum variations included intensity fluctuations in framework vibration bands that differed for the two zeolites. The complex patterns in the 1250–850 cm−1 framework region of difference spectra indicated that there were at least four overlapping band contributions. Variations in this region included band shifting and intensity changes. Differences in the intensity patterns for HY and NaY can be attributed to different counterion interactions with water molecules and the zeolite framework.
Hu et al. reported that zeolite Y unit cell volumes increased with temperature [28]. Because the thermal expansion of the zeolite framework should be temperature-dependent, these effects should appear in reversible difference spectra. Thus, the 1250–850 cm−1 band profiles exhibited by reversible difference spectra in Figure 6 and Figure 7 primarily represent the thermal expansion of the zeolite framework, whereas water loss dictated the band profiles in irreversible spectra. The framework vibration band features in reversible difference spectra differed for HY and NaY, indicating that the H+ and Na+ counterions affected these expansions and contractions differently.
Because the HY and NaY frameworks should have been nearly identical, the numbers of extra-framework SiOH and AlOH functionalities should have been similar. Small positive offsets above 3600 cm−1 in the 50 and 75 °C irreversible difference spectra for both zeolites were likely caused by a loss of hydrogen bonding interactions between these functionalities and water molecules. The NaY sample spectra exhibited sharp reversible features near 3700 cm−1. Carion et al. determined that this band could not be attributed to water molecules because it persisted when water bending vibration bands were absent from infrared spectra [46,47,48]. Figure 8 shows that the 3730–3660 cm−1 integrated intensity-versus-temperature profiles differed for the HY and NaY samples. When the NaY sample was heated, this intensity maximized near 70 °C and then decreased rapidly at higher temperatures. Figure 12 shows that intensity in this region increased as soon as the dehydrated NaY sample was exposed to the 0.3% relative humidity within the spectrophotometer, suggesting that water was required to create the moiety responsible for the 3700 cm−1 band. This functionality was prone to decomposition when the sample was thermally dehydrated but was regenerated after cooling in the presence of water vapor. These findings are consistent with a postulated mechanism in which water molecules that are hydrogen bonded to framework oxygens while simultaneously interacting with Na+ cations dissociate, resulting in protons that remain with framework oxygens [29]. The hydroxyl anions that would be generated by this process would most likely be electrostatically bound to Na+ cations. The NaY 3700 cm−1 O-H stretching vibration band intensity may be associated with the stretching vibrations of these OH groups. This hypothesis is supported by Hermansson, who reported that the OH stretching vibration frequency varies depending on the electrostatic environment and can occur near 3700 cm−1 [49].

5. Conclusions

The temperature step sample heating/cooling methodology described here was employed as a perturbation spectroscopy technique to compare the dehydration and rehydration processes for HY and NaY zeolites. By using rapid sample heating and cooling and isothermal infrared spectrum measurements in a dry-air purged environment, the effects of water losses and gains on zeolite structure were characterized. Infrared spectral subtractions were employed to distinguish between changes that were reversed by cooling the sample and those that were permanent. By using this approach, subtle infrared spectrum trends were identified that provided insight into complex temperature-dependent sample changes. The zeolite Y counterions (H+ or Na+) were found to have a significant influence on both the water molecule and framework vibrations.
The infrared spectrum variations identified in this study can provide complementary structural information for X-ray spectroscopy and neutron activation analyses. For instance, changes in oxygen–oxygen distances in zeolitic water hydrogen bonds can be derived from difference spectra O-H stretching vibration band frequencies by employing the Libowitzky equation [50]. The framework vibration band regions in HY and NaY difference spectra indicated contributions from at least four Si-O-Si and Al-O-Si vibration bands. Additional studies are needed to better characterize the vibrations associated with these overlapping bands and to determine how they change with sample temperature and zeolite water content. Due to complexities of the underlying mechanisms, complementary analysis methodologies and molecular modeling techniques will likely be required to provide greater insight into these functional group changes.

Funding

This research received no external funding.

Data Availability Statement

Data available on request.

Conflicts of Interest

The author declares no conflicts of interest.

References

  1. Breck, D.W. Crystalline Zeolite Y. U.S. Patent 3130007A, 21 April 1964. [Google Scholar]
  2. Babitz, S.M.; Williams, B.A.; Miller, J.T.; Snurr, R.Q.; Haag, W.O.; Kung, H.H. Monomolecular cracking of n-hexane on Y, MOR, and ZSM-5 zeolites. Appl. Catal. A Gen. 1999, 179, 71–86. [Google Scholar] [CrossRef]
  3. Vogt, E.T.C.; Weckhuysen, B.M. Fluid catalytic cracking: Recent developments on the grand old lady of zeolite catalysis. Chem. Soc. Rev. 2015, 44, 7342–7370. [Google Scholar] [CrossRef]
  4. Degnan, T.F. Applications of zeolites in petroleum refining. Top. Catal. 2000, 13, 349–356. [Google Scholar] [CrossRef]
  5. Djeffal, N.; Benbouzid, M.; Boukoussa, B.; Sekkiou, H.; Bengueddach, A. CO2 adsorption properties of ion-exchanged zeolite Y prepared from natural clays. Mater. Res. Express 2017, 4, 035504. [Google Scholar] [CrossRef]
  6. Langmi, H.W.; Walton, A.; Al-Mamouri, M.M.; Johnson, S.R.; Book, D.; Speight, J.D.; Edwards, P.P.; Gameson, I.; Anderson, P.A.; Harris, I.R. Hydrogen adsorption in zeolites A, X, Y and RHO. J. Alloys Compd. 2003, 356–357, 710–715. [Google Scholar] [CrossRef]
  7. Shao, W.; Zhang, L.; Li, L.; Lee, R.L. Adsorption of CO2 and N2 on synthesized NaY zeolite at high temperatures. Adsorption 2009, 15, 497–505. [Google Scholar] [CrossRef]
  8. Gomes, G.J.; Dal Pozzo, D.M.; Zalazar, M.F.; Costa, M.B.; Arroyo, P.A.; Bittencourt, P.R.S. Oleic acid esterification catalyzed by zeolite Y-model of the biomass conversion. Top. Catal. 2019, 62, 874–883. [Google Scholar] [CrossRef]
  9. Rizkiana, J.; Guan, G.; Widayatno, W.B.; Yang, J.; Hao, X.; Matsuoka, K.; Abudula, A. Mg-modified ultra-stable Y type zeolite for the rapid catalytic co-pyrolysis of low-rank coal and biomass. RSC Adv. 2015, 6, 2096–2105. [Google Scholar] [CrossRef]
  10. Boddenberg, B.U.; Rakhmatkariev, G.; Hufnagel, S.; Salimov, Z. A calorimetric and statistical mechanics study of water adsorption in zeolite NaY. Phys. Chem. Chem. Phys. 2002, 4, 4172–4180. [Google Scholar] [CrossRef]
  11. Julbe, A.; Drobek, M. Zeolite Y Type. In Encyclopedia of Membranes; Drioli, E., Giorno, L., Eds.; Springer: Berlin/Heidelberg, Germany, 2016; pp. 2060–2061. [Google Scholar]
  12. Lutz, W. Zeolite Y: Synthesis, modification, and properties—A case revisited. Adv. Mater. Sci. Eng. 2014, 2014, 724248. [Google Scholar] [CrossRef]
  13. Bellat, J.-P.; Paulin, C.; Jeffroy, M.; Boutin, A.; Paillaud, J.-L.; Patarin, J.; Di Lella, A.; Fuchs, A. Unusual hysteresis loop in the adsorption−desorption of water in NaY zeolite at very low pressure. J. Phys. Chem. C 2009, 113, 8287–8295. [Google Scholar] [CrossRef]
  14. Bushuev, Y.G.; Sastre, G.; de Julián-Ortiz, J.V. The structural directing role of water and hydroxyl groups in the synthesis of beta zeolite polymorphs. J. Phys. Chem. C 2010, 114, 345–356. [Google Scholar] [CrossRef]
  15. Cruciani, G. Zeolites upon heating: Factors governing their thermal stability and structural changes. J. Phys. Chem. Solids 2006, 67, 1973–1994. [Google Scholar] [CrossRef]
  16. Huang, Y.; Wang, K.; Dong, D.; Li, D.; Hill, M.R.; Hill, A.J.; Wang, H. Synthesis of hierarchical porous zeolite NaY particles with controllable particle sizes. Micropor. Mesopor. Mat. 2010, 127, 167–175. [Google Scholar] [CrossRef]
  17. Farrell, J.; Manspeaker, C.; Luo, J. Understanding competitive adsorption of water and trichloroethylene in a high-silica Y zeolite. Micropor. Mesopor. Mat. 2003, 59, 205–214. [Google Scholar] [CrossRef]
  18. Kraus, M.; Trommler, U.; Holzer, F.; Kopinke, F.-D.; Roland, U. Competing adsorption of toluene and water on various zeolites. Chem. Eng. J. 2018, 351, 356–363. [Google Scholar] [CrossRef]
  19. Deng, C.; Zhang, J.; Dong, L.; Huang, M.; Li, B.; Jin, G.; Gao, J.; Zhang, F.; Fan, M.; Zhang, L.; et al. The effect of positioning cations on acidity and stability of the framework structure of Y zeolite. Sci. Rep. 2016, 6, 23382. [Google Scholar] [CrossRef]
  20. Frising, T.; Leflaive, P. Extraframework cation distributions in X and Y faujasite zeolites: A review. Micropor. Mesopor. Mat. 2008, 114, 27–63. [Google Scholar] [CrossRef]
  21. Perez, C.A.C.; de Resende, N.S.; Salim, V.M.M.; Schmal, M. Water interaction in faujasite probed by in situ X-ray powder diffraction. J. Phys. Chem. C 2017, 121, 2755–2761. [Google Scholar] [CrossRef]
  22. Lim, K.H.; Grey, C.P. Characterization of extraframework cation positions in zeolites NaX and NaY with very fast 23Na MAS and multiple quantum MAS NMR spectroscopy. J. Am. Chem. Soc. 2000, 122, 9768–9780. [Google Scholar] [CrossRef]
  23. Norby, P.; Poshni, F.I.; Gualtieri, A.F.; Hanson, J.C.; Grey, C.P. Cation migration in zeolites:  an in situ powder diffraction and MAS NMR study of the structure of zeolite Cs(Na)−Y during dehydration. J. Phys. Chem. B 1998, 102, 839–856. [Google Scholar] [CrossRef]
  24. Ramsahye, N.A.; Bell, R.G. Cation mobility and the sorption of chloroform in zeolite NaY:  molecular dynamics study. J. Phys. Chem. B 2005, 109, 4738–4747. [Google Scholar] [CrossRef]
  25. Kirschhock, C.E.A.; Hunger, B.; Martens, J.; Jacobs, P.A. Localization of residual water in alkali-metal cation-exchanged X and Y type zeolites. J. Phys. Chem. B 2000, 104, 439–448. [Google Scholar] [CrossRef]
  26. Beauvais, C.; Boutin, A.; Fuchs, A.H. Adsorption of water in zeolite sodium-faujasite: A molecular simulation study. CR Chim 2005, 8, 485–490. [Google Scholar] [CrossRef]
  27. Shirono, K.; Endo, A.; Daiguji, H. Molecular dynamics study of hydrated faujasite-type zeolites. J. Phys. Chem. B 2005, 109, 3446–3453. [Google Scholar] [CrossRef] [PubMed]
  28. Hu, M.; Hanson, J.C.; Wang, X. Structure and thermal stability of (H2O)4 tetrahedron and (H2O)6 hexagon adsorbed on NaY zeolite studied by synchrotron-based time-resolved X-ray diffraction. Ind. Eng. Chem. Res. 2018, 57, 4988–4995. [Google Scholar] [CrossRef]
  29. Singh, J.; White, R.L. A variable temperature infrared spectroscopy study of NaY zeolite dehydration. Spectrochim. Acta A Mol. Biomol. Spectrosc. 2020, 231, 118142. [Google Scholar] [CrossRef]
  30. White, R.L. Precise temperature control and rapid heating/cooling of infrared spectroscopy samples with a two-stage thermoelectric device. Anal. Meth. 2023, 15, 6706–6715. [Google Scholar] [CrossRef]
  31. Kerr, G.T. Hydrogen zeolite Y, ultrastable zeolite Y and aluminum-deficient zeolites. Adv. Chem. 1973, 121, 219–229. [Google Scholar] [CrossRef]
  32. Warner, T.E.; Klokker, M.G.; Nielsen, U.G. Synthesis and characterization of zeolite Na-Y and its conversion to the solid acid zeolite H-Y. J. Chem. Ed. 2017, 94, 781–785. [Google Scholar] [CrossRef]
  33. Salman, N.; Ruscher, C.H.; Buhl, J.C.; Lutz, W.; Toufar, H.; Stocker, M. Effect of temperature and time in the hydrothermal treatment of HY zeolite. Micropor. Mesopor. Mat. 2006, 90, 339–346. [Google Scholar] [CrossRef]
  34. White, R.L. Thermal analysis by variable vemperature infrared spectroscopy with a button sample holder and peltier heating/cooling. Talanta 2023, 258, 124474. [Google Scholar] [CrossRef]
  35. Aainaa, N.; Ramli, S.; Amin, N.A.S. Fe/HY zeolite as an effective catalyst for levulinic acid production from glucose: Characterization and catalytic performance. Appl. Catal. B Environ. 2015, 163, 487–498. [Google Scholar] [CrossRef]
  36. Li, Z.; Xie, K.; Slade, R.C.T. Studies of the interaction between CuCl and HY zeolite for preparing heterogeneous Cu(I) catalyst. Appl. Catal. A Gen. 2001, 209, 107–115. [Google Scholar] [CrossRef]
  37. Heshmatollah, A.; Abarghouei, F.; Reza, M.; Mahmood, T.; Khodabakhsh, N. Application of MEA, TEPA, and morpholine grafted NaY zeolite as CO2 capture. Iran. J. Chem. Chem. Eng. 2021, 40, 581–592. [Google Scholar]
  38. Padamurthy, A.; Nandanavanam, J.; Rajagopalan, P. Thermal stability evaluation of selected zeolites for sustainable thermochemical energy storage. Energ. Source Part A 2021, 1–14. [Google Scholar] [CrossRef]
  39. White, R.L. Infrared spectroscopy investigations of calcium oxalate monohydrate (whewellite) dehydration/rehydration. Minerals 2023, 13, 783. [Google Scholar] [CrossRef]
  40. Krol, M.; Mozgawa, W.; Jastrzebski, W.; Barczyk, K. Application of IR spectra in the studies of zeolites from D4R and D6R structural groups. Micropor. Mesopor. Mat. 2012, 156, 181–188. [Google Scholar] [CrossRef]
  41. Faghihian, H.; Godazandeha, N. Synthesis of nano crystalline zeolite Y from bentonite. J. Porous Mat. 2009, 16, 331–335. [Google Scholar] [CrossRef]
  42. Parker, L.M.; Bibby, D.M.; Burns, G.R. Interaction of water with the zeolite HY, studied by FTi.r. Zeolites 1991, 11, 293–297. [Google Scholar] [CrossRef]
  43. Mofrad, A.M.; Peixoto, C.; Blumeyer, J.; Liu, J.; Hunt, H.K.; Hammond, K.D. Vibrational spectroscopy of sodalite: Theory and experiments. J. Phys. Chem. C 2018, 122, 24765–24779. [Google Scholar] [CrossRef]
  44. Seki, T.; Chiang, K.Y.; Yu, C.C.; Yu, X.; Okuno, M.; Hunger, J.; Nagata, Y.; Bonn, M. The bending mode of water: A powerful probe for hydrogen bond structure of aqueous systems. J. Phys. Chem. Lett. 2020, 11, 8459–8469. [Google Scholar] [CrossRef] [PubMed]
  45. Porter, A.J.; O’Malley, A.J. A classical molecular dynamics study on the effect of Si/Al ratio and silanol nest defects on water diffusion in zeolite HY. J. Phys. Chem. C 2021, 125, 11567–11579. [Google Scholar] [CrossRef]
  46. Cairon, O.; Thomas, K.; Chevreau, T. FTIR studies of unusual OH groups in steamed HNaY zeolites: Preparation and acid properties. Micropor. Mesopor. Mat. 2001, 46, 327–340. [Google Scholar] [CrossRef]
  47. Cairon, O.; Loustaunau, A.; Gautier, M. FTIR studies of unusual OH groups in steamed HNaY zeolites: Influence of Na insertion. J. Phys. Chem. Solids 2006, 67, 994–997. [Google Scholar] [CrossRef]
  48. Cairon, O. Impacts of composition and post-treatment on the brønsted acidity of steam-treated faujasite: Insights from FTIR spectroscopy. ChemPhysChem 2013, 14, 244–251. [Google Scholar] [CrossRef]
  49. Hermansson, K. Coordination effects on the stretching vibration of the OH ion. Chem. Phys. 1993, 170, 177–184. [Google Scholar] [CrossRef]
  50. Libowitzky, E. Correlation of 0-H Stretching Frequencies and 0-H· · ·0 Hydrogen Bond Lengths in Minerals. Monatsh. Chem. 1999, 130, 1047–1059. [Google Scholar] [CrossRef]
Figure 1. Relative mass loss-versus-temperature plots for the HY (red) and NaY (blue) samples.
Minerals 14 00104 g001
Figure 2. (a) Ambient temperature and (b) 150 °C infrared spectra for HY (red) and NaY (blue).
Minerals 14 00104 g002
Figure 3. Sample temperatures measured during the 5 °C increment step heating/cooling program.
Minerals 14 00104 g003
Figure 4. Band area-versus-temperature plots for (a) O-H stretching, (b) H-O-H bending, and (c) framework vibrations for HY (red) and NaY (blue). Triangles represent measurements at step temperatures and circles represent 25 °C measurements.
Minerals 14 00104 g004
Figure 5. Infrared band maximum wavenumber-versus-temperature plots for (a) H-O-H bending and (b) framework vibration bands for HY (red) and NaY (blue). Triangles represent measurements at step temperatures and circles represent 25 °C measurements.
Minerals 14 00104 g005
Figure 6. Reversible and irreversible difference spectra for the NaY sample in 25 °C increments.
Minerals 14 00104 g006
Figure 7. Reversible and irreversible difference spectra for the HY sample in 25 °C increments.
Minerals 14 00104 g007
Figure 8. Integrated intensity spanning the 3700 cm−1 peak-versus-temperature plots for HY (red) and NaY (blue). Triangles represent measurements at step temperatures and circles represent 25 °C measurements.
Minerals 14 00104 g008
Figure 9. Infrared spectrum changes caused by exposing dehydrated HY (red) and NaY (blue) samples to the spectrophotometer purge at 10 °C for 2 h.
Minerals 14 00104 g009
Figure 10. Band areas for O-H stretching (blue); H-O-H bending (green) and framework (red) vibrations at 10 °C as a function of time for HY (solid lines) and NaY (dashed lines) samples.
Minerals 14 00104 g010
Figure 11. Band maximum wavenumber shifts in HY (red) and NaY (blue) infrared spectra measured at 10 °C as a function of time for the (a) H-O-H bending and (b) framework vibration bands. Starting wavenumbers are indicated near the beginning of each plot.
Minerals 14 00104 g011
Figure 12. Integrated intensity area spanning the 3700 cm−1 peak-versus-time plots for HY (red) and NaY (blue).
Minerals 14 00104 g012
Figure 13. Overlays of difference spectra representing the 75 °C irreversible changes while heating (red) and during the 2 h 10 °C isothermal measurements (blue) for (a) HY and (b) NaY. Curves representing 75 °C irreversible difference spectra were multiplied by a factor of 4.
Minerals 14 00104 g013
Disclaimer/Publisher’s Note: The statements, opinions and data contained in all publications are solely those of the individual author(s) and contributor(s) and not of MDPI and/or the editor(s). MDPI and/or the editor(s) disclaim responsibility for any injury to people or property resulting from any ideas, methods, instructions or products referred to in the content.

