Abstract
Quasi-equilibrium directional crystallization was performed on a melt composition (at. %): 18.50 Cu, 32.50 Fe, 48.73 S, 0.03 Pt, Pd, Ag, Au, Te, As, Bi, Sb, and Sn, which closely resembles the Cu-rich massive ores found in the platinum-copper-nickel deposits of Norilsk. Base metal sulfides (BMS) such as pyrrhotite solid solution (Fe,Cu)S1±δ (Poss), non-stoichiometric cubanite Cu1.1Fe1.9S3 (Cbn*), and intermediate solid solution Cu1.0Fe1.2S2.0 (Iss) are progressively precipitated from the melt during the crystallization process. The content of noble metals and semimetals in the structure of BMS is below the detection limit of SEM-EDS analysis. Only tin exhibits significant solubility in Cbn* and Iss, meanwhile Pt, Pd, Au, Ag, As, Bi, Sb, and Te are present as discrete composite inclusions, comprising up to 11 individual phases, within their matrices. These microphases correspond to native Au, native Bi, hessite Ag2Te, sperrylite Pt(As,S)2, hedleyite Bi2Te, michenerite PdTeBi, froodite PdBi2, a solid solution of sudburite-sobolevskite-kotulskite Pd(Sb, Bi)xTe1−x, geversite PtSb2, and a multicomponent solid solution based on geversite Me(TABS)2, where Me = Σ(Pt, Pd, Fe, Cu) and TABS = Σ(Te, As, Bi, Sb, Sn). Most of the inclusions occur as thin layers between BMS grain boundaries or appear drop-shaped and subhedral to isometric grains within the sulfide matrix. Only a small fraction of the trace elements form mineral inclusions of sizes ≤ 0.5 μm in Poss, most likely including PtAs2 and (Pt,Pd)S. It is likely that the simultaneous presence of noble metals (Pt, Pd, Au, Ag) and semimetals (As, Te, Bi, Sb) in the sulfide melt leads to the appearance of liquid droplets in the parent sulfide melt after pyrrhotite crystallization. The solidification of droplets during the early stages of Cbn* crystallization may occur simultaneously with the cooling of later fractions of the sulfide melt, resulting in the formation of Iss. In addition, abundant gas voids containing micro-inclusions were observed in Cbn* and Iss. These inclusions showed similar chemical and mineral compositions to those in BMS matrices, i.e., the presence of gas bubbles did not affect the main features of noble metal fractionation and evolution. Therefore, it is reasonable to assume that ore particles suspended in the melt are either trapped by defects at the crystallization front or transported towards gas bubbles via the Marangoni effect.
1. Introduction
The ore-bearing intrusions of the Norilsk-Talnakh camp have the world’s largest reserves of base metals and PGE (platinum group elements), making them a strategic resource for the future energy transition. Various studies have been carried out on specific deposits within this intrusive complex, resulting in the development of some genetic models [1,2,3,4,5,6,7,8,9,10,11,12,13,14], where physicochemical processes have played a key role in the formation of massive and disseminated ores. Interestingly, these models were primarily based on the spatial distribution of elements and minerals within the ore body. The key idea underlaying this is that zoned ore bodies are formed by fractional crystallization of sulfide melts in magma chambers, e.g., [2,3,4,5,8]. However, alternative models, such as crystallization with fluid participation [6] or multiple-stage crystallization in flowing magma chambers have been proposed [9].
A particularly useful model for describing ore bodies is the quasi-equilibrium directional crystallization of a cylindrical sample, which satisfies the following conditions: (a) the melt has a uniform and defined composition, (b) diffusion within the solid phase is absent, (c) thermodynamic equilibrium is achieved at the melt-solid interface, and (d) the melt and solid phase do not interact with the external environment, forming a closed system, i.e., the system is conservative [15]. The gradual change in melt composition and temperature heterogeneity leads to the formation of ore bodies with characteristic mineral zones. The model assumes a flat crystallization front perpendicular to the crystallization trend axis, with the fraction of crystallized melt (g) serving as the process coordinator. Directional crystallization may be considered as analogous for describing the distribution of components within a solidified volume. Such experiments on multicomponent sulfide melts greatly improve the modeling of the ore-forming components determined by the phase equilibria in the Cu-Fe-Ni-S system and its boundary systems.
While ore minerals generally show a relatively consistent and simple zoning based on major elemental components, the heterogeneous distribution of noble metals and semimetals, which can form complex compounds, shows a more complicated chemistry and mineralogy. Investigating the origin of such phases within the broad framework of magmatic sulfides formation is an important challenge. However, we have focused on a specific aspect of this problem—the effects of semimetals on the concentration of noble metals during the fractional crystallization of copper-rich sulfide melts.
Various studies on the mineral and chemical composition of copper-rich ores have shown significant amounts of Pt, Pd, Au, Ag, and chalcophile elements (Te, As, Bi, Sb) compared to the concentrations in pyrrhotite-rich ores [2,3,6,10,16,17,18,19,20,21,22,23,24]. Particularly, mineral inclusions in major ores shows a close association with these elements, forming multi-phase intergrowths or globules within the Fe-Cu sulfide matrix. Phase diagrams involving noble metals and semimetals such as As, Sb, Te, or Bi have been studied to identify minor phases and understand the physicochemical conditions leading to their formation. Binary, ternary, and more complex phase diagrams have been constructed, based on previous studies investigating Fe-Ni-Cu-S-Pd-Pt-Te sulfide systems, Fe-Cu-S-Se-As-Sb-Te or Bi, Fe-Ni-Cu-Pt-Pd-As-S, Fe-Cu-Pt-As-S, and Fe-Ni-Cu-S-(Pd, Pt, Bi, Sb) [25,26,27,28,29,30,31,32]. According to the results of several experimental studies involving annealed samples over a wide range of temperatures, the immiscibility between the sulfide liquid and a Pt, Pd-semimetallic melt is evident. The formation of PGE minerals is attributed to the crystallization of a residual semi-metallic melt located in the interstices between base metal sulfide (BMS) grains during the final stages of sulfide melt crystallization [5,7,21,28,29,32,33].
Experiments on fractional crystallization of multicomponent sulfide melts, such as Fe-Ni-Cu-S-(Pt, Pd, Rh, Ru, Ir, Au, Ag, As, Co) [34], Fe-Cu-S-(Pt, Pd, Au, As, Bi, Te, Sn) [35,36], Fe-Ni-Cu-S-(Pt, Pd, Rh, Ru, Ag, Au, Se, Te, Bi, Sb, Sn, As) [37,38], Fe-Ni-Cu-S-(Pt, Pd, Rh, Ir, Ru, Ag, Au, Te) [39], and Fe-Cu-S-(Ag, Pd, Ru, Rh, Au, Pt) [40], also support the immiscibility of the parental sulfide liquid into two distinct melts: (1) Fe-Ni-Cu-sulfide and (2) semimetal, enriched in noble metals.
Experimental modeling was conducted to simulate the formation of pyrrhotite-cubanite-intermediate solid solution associations during the fractional crystallization of a sulfide melt with a composition (in at. %) of 32.5 Fe, 18.5 Cu, and 49.0 S [41]. This sequence of BMS crystallization follows the complex zoning observed in the massive PGE-copper-nickel ore bodies of the Norilsk camp [4,6,42]. The main goal of this study is to investigate the behavior of Pt, Pd, Ag, and Au impurities in the presence of Te, As, Bi, Sb, and Sn during the directional crystallization process of this sample. The experimental procedures were carried out under controlled conditions in a closed system to simulate the magmatic processes involved in the formation of ore bodies.
2. Experimental
2.1. Sample Preparation
The initial composition of the sample (at. %) was carefully prepared using high-purity Cu, Fe, Pt, Pd, Ag, Au, Te, As, Bi, Sb, and Sn (99.99%), along with S (99.99%) obtained via vacuum distillation. The specific composition used was 18.50% Cu, 32.50% Fe, 48.73% S, and trace amounts of Pt, Pd, Ag, Au, Te, As, Bi, Sb, and Sn. The synthesis and directional crystallization procedures are described in detail in [41]. The multi-component mixture was gradually heated at a rate of 100 °C/day until reaching around 1050 °C. It was held in a molten state for 48 h, and then allowed to cool in a turned-off furnace. Directional crystallization was performed using the Bridgman-Stockbarger technique in a two-zone vertical furnace. The ampoule containing the sample was placed in the hot zone of the furnace and left for 2 days to homogenize the melt. The ampoule was then moved from the hot zone to the cold zone at a rate of 2 mm/day. Under these conditions, diffusion in the solid is absent while diffusion and convection in the melt are sufficient to ensure its homogeneity. It should be noted that such a regime provides quasi-equilibrium conditions during the directional crystallization [15]. The temperature in the lower part of the quartz ampoule was 1019 °C at the beginning of crystallization and 835 °C at the end. After crystallization, the ampoule was quenched in air for 10 min. The resulting ingot, measuring approximately 70 mm in length and 7 mm in diameter, was cut into 14 parts perpendicular to the longitudinal axis. The fragments were weighed, and the fraction of crystallized melt (g) was determined. Twelve fragments were used to prepare polished sections for microscopic and chemical analysis.
2.2. Sample Investigation
The composition of individual phases and the average chemical composition of the ingot were determined by scanning electron microscopy and energy-dispersive X-ray spectrometry (SEM/EDS) using a high-resolution scanning electron microscope MIRA 3 LMU (Tescan Orsay Holding, Brno, Czech Republic) equipped with an X-ray microanalysis system AZtec Energy XMax 80 (Oxford Instruments Nanoanalysis Ltd., Buckinghamshire, UK) at the Analytical Center for multi-elemental and isotope research SB RAS (Novosibirsk, Russia). The measurements were performed with an electron beam energy of 20 keV, an electron beam current of 1.5 nA, and a live spectrum acquisition time of 15 s (total square of the spectrum is about 3 × 10⁵ counts). In this case, the size of the X-ray generation zone (spatial resolution of the analysis) was 2–3 μm with a beam spot size of 8–9 nm. The X-ray intensity of the K-family S, Fe, Cu and L-family As, Pd, Ag, Sn, Sb, Te, Pt, Au and Bi. FeS2 (for S), PtAs2 (for As), PbTe (for Te) and pure metals were used as standards. Under these analytical conditions, the lower detection limit was 0.7–0.9 wt.% for Pt, Au, Bi, and 0.2–0.3 wt.% for the other elements. The measurement error was no greater than 1–2% relative for the major constituents and 2–8% relative for the minor ones. A point probe was used instead for phases smaller than 5 μm. To reduce the surface effect of mineral micro-relief on the quality of the analysis, the acquisition of spectra on phases with a linear size greater than 10 μm was performed by scanning the area of interest up to 100 μm2. To estimate the average composition of multi-phase areas, the total spectrum obtained by scanning areas of up to 1.5 mm2 was used. In order to lower the detection limit by about 4 times the different concentrations, the acquisition time of the spectra was increased to 300 s. The average composition of phase mixtures was calculated on the basis of 3–5 analyses from different areas of each section along the ingot, with an error in the determination of the main components of 1–2% relative.
The solidified ingot consisted of three zones corresponding to the crystallization of high-temperature phases from the melt: pyrrhotite solid solution, cubanite, and intermediate solid solution. Upon cooling to room temperature, the pyrrhotite solid solution partially decomposed to form secondary phases that appeared as large inclusions. To calculate the average composition of this mixture, the fractions of each phase were determined using a microscope MIRA 3 LMU (Tescan Orsay Holding), as well as their chemical composition. The average composition of the ingot in the studied section was determined using Formula (1) [43].
where ψj is the fraction of the j-th phase in the cross section, -concentration of the i-th component in the j-th phase.
The composition of the melt at a specific point of crystallization was calculated using the average chemical composition of the ingot and the material balance Equation (2) [44].
Here, the concentration of the i-th component in the initial ingot is represented by [i], the average concentration of the i-th component in the layer of the ingot with a thickness of dg, adjacent to the liquid-solid interface is denoted by [i]g, and [i] represents the average concentration of the i-th component in the melt.
3. Results and Discussion
3.1. Behavior of Macro-Components
The ingot consists of three primary zones with different chemical compositions: pyrrhotite solid solution (Poss), non-stoichiometric high-temperature cubanite (Cbn*), and intermediate solid solution (Iss), as observed in the melting diagram of the Cu-Fe-S [41]. During the crystallization of Poss, the melt undergoes Fe depletion and a significant Cu enrichment due to the component distribution ratios (k) of Fe and S > 1 and Cu < 1. The composition of zone II, Fe32.2±0.1Cu18.8±0.1S49.07±0.1, corresponds to the formula Cu1.1Fe1.9S3, which represents the non-stoichiometric high-temperature cubanite (Cbn*) within the experimental error. Cbn* starts to crystallize from the melt composition (at. %): 30.2 Fe, 21.4 Cu, 48.4 S by the peritectic reaction Poss + L → Cbn* at 970 °C. The third zone (0.83 ≤ g ≤ 1) consists of a single-phase Iss (Cu23.4±0.2Fe28.2±0.2S48.4±0.1) obtained from a melt composition of 22.3 Fe, 31.8 Cu, 45.9 S, by the peritectic reaction L + Cbn* → Iss at 930 °C.
The microstructure of the sample after cooling to room temperature is shown in Figure 1. In zone I, lamellar inclusions were observed within the Poss matrix, with an average composition corresponding to stoichiometric cubanite CuFe2S3. These inclusions were likely formed by decomposition of the Poss solid solution due to a decrease in copper solubility to 0.6–1.0 at. %. The CuFe2S3 sheets show heterogeneity and consist of two closely-composed phases: the matrix and oriented lamellae ≤ 1 μm wide (Figure 2). In zones II and III, the cooled samples remained single-phase. Gas inclusions in the form of small pores and large voids were present in the ingot, with their average size and number increasing towards the end of the ingot.
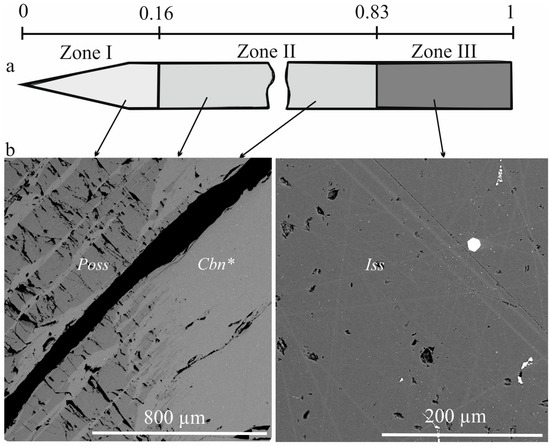
Figure 1.
Zones and features developed in the directionally crystallized sample (a) and backscatter electron (BSE) images of the different zones (b). The microphotograph on the left shows the region near the boundary of zones I (Poss) and II (Cbn*) at g = 0.16, while the microphotograph on the right shows zone III (Iss) at g = 0.96. Abbreviations are as follows: Poss pyrrhotite solid solution, Cbn* nonstoichiometric cubanite Cu1.1Fe1.9S3, and Iss intermediate solid solution Cu1.0Fe1.2S2.0. The black spots represent cracks and pores, while the bright inclusions represent noble metal mineral phases.
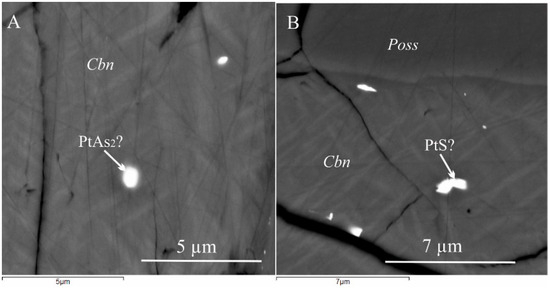
Figure 2.
Microphotograph of samples at g = 0.04 (A) and at g = 0.09 (B). The light gray heterogeneous phase of CuFe2S3 average composition contains inclusions of PtAs2 and PtS. The gray grain consists of Poss. Black areas correspond to cracks and voids in the sample.
3.2. Behavior of Microcomponents
3.2.1. Solid Solution in Base Metal Sulfides (BMS)
In the zone I of the crystallized sample, the level of impurities in Poss is below the limits of SEM/EDS determination. Previously, the quantity of each impurity in Poss was measured using laser ablation, and their distribution coefficients between Poss and the melt were calculated. The following values were obtained: kPd 0.1–0.7 [45,46], kPt 0.004–0.03 [30,46], kAu~0.006 [47], kAg 0.01–0.11 [23], kAs~0.01, kBi~0.003, kTe 0.015–0.07 [29], kSb 0.002–0.017 [48], kSn < 0.03–0.009 [23]. Thus, demonstrating that these impurities are almost completely expelled into the melt.
In zones II and III, only Sn is dissolved in Cbn* (~0.2 at. %) and Iss (0.3–0.5 at. %). The content of other impurities in BMS is below the detection limit of SEM/EDS. According to the data summarized in [23], the impurity distribution ratios between Iss and the melt have the following values: kPd 0.3–0.7, kPt 0.125–0.03, kAu 0.21–1, kAg 0.19–1.2, kAs 0.11–0.24, kBi 0.026–0.13, kTe 0.31–0.822, kSb~0.029–0.148. Experimental studies in [49] also indicate very low solubility of PGMs in Cu-Fe sulfides.
3.2.2. Inclusions of Minor Phases in BMS
We examined the composition of 130 mineral inclusions in the ingot, including 16 in four thin sections from zone I, 90 in four thin sections from zone II, and 24 in one thin section from zone III. These inclusions contain noble metals and TABS, except Sn, which form 11 minor phases within the BMS matrix (Table 1). The composition of these phases closely resembles that of natural noble metals compounds and their corresponding isomorphic series. The identified minor phases include native Au, native Bi, hessite Ag2Te, cooperite (Pt,Pd)S, sperrylite Pt(As,S)2, geversite PtSb2, hedleyite Bi2Te, michenerite PdTeBi, froodite PdBi2, the sudburite-sobolevskite-kotulskite solid solution Pd(Sb,Bi)xTe1−x, and the multicomponent solid solution Me(TABS)2, where Me = Pt + Pd + Fe + Cu and TABS = Sb + Te + As + Bi.

Table 1.
List identified of microphases, with ideal formulas, common substitutions, and maximum temperature stability according to literature data.
Within zone I, single-phase inclusions with sizes ≤ 0.5 μm, were observed. These inclusions were found within isocubanite lamellae in the pyrrhotite matrix. Although the exact composition of these inclusions could not be determined, they are probably composed of PtAs2 sperrylite due to the significant presence of Pt (approximately 10 at. %) and As (about 12 at. %). The isocubanite lamellae most likely contained cooperite (Pt,Pd)S (about 21 at. % Pt and 4 at. % Pd) (Figure 2).
Most impurity inclusions were observed in the Cbn* matrix of zone II and the Iss matrix of zone III. These inclusions occur in BMS as mineral composites of various compositions, occasionally as single-phase grains, and could be classified into two types: (1) isolated inclusions ranging in size from <1 to 15 μm, unrelated to gas bubbles (Figure 3, Figure 4, Figure 5, Figure 6 and Figure 7C). (2) Inclusions associated with voids, varying in size from a few μm to 150 μm (Figure 7A,B,D–L).
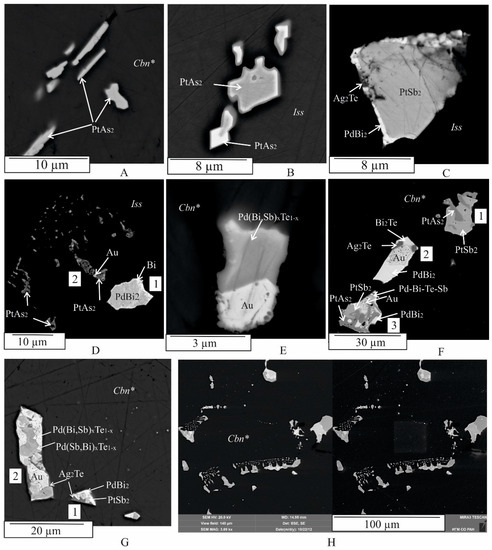
Figure 3.
BSE images showing the typical morphology of noble metal inclusions in Cbn* and Iss. Single-phase inclusions of PtAs2 in Icb* (A) and in Iss (D). Two-phase inclusions of (PtAs2 + PtSb2) in Iss (B) and in Cbn* ((F) inclusion 1), and of (PdBi2 + Bi) in Iss (D). Three-phase inclusions of (PtSb2 + PdBi2 + Ag2Te) in Iss (C) and in Icb* ((F), inclusion 2), and of (Au + Pd(Bi,Sb)xTe1−x + ?) in Cbn* (E). Four-phase inclusion of (Pd(Bi,Sb)xTe1−x + Pd(Sb,Bi)xTe1−x + Ag2Te + Au) in Icb* ((G), inclusion 2). Five-phase inclusion of (PtAs2 + PdBi2 + PtSb2 + Pd-Bi-Te-Sb + Au) in Cbn* (F). Aggregate of microcrystalline inclusions in the Cbn* matrix (H): in BSE (left), in secondary electrons (right). 1,2,3 are numbers of inclusions in the Cbn* matrix.
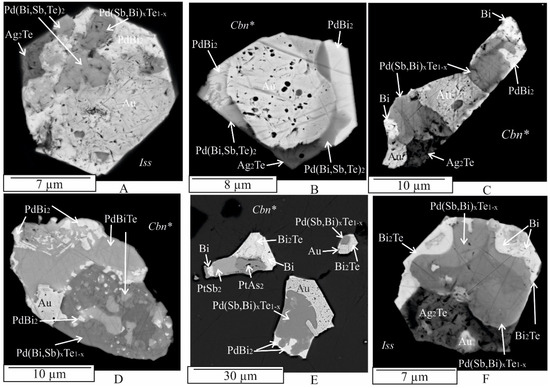
Figure 4.
BSE images showing the typical microstructures in polyphase inclusions (PGM composites) in Cbn* and Iss. Isometric subhedral (A,B,F), oval-shaped (D), irregular subhedral (C,E).
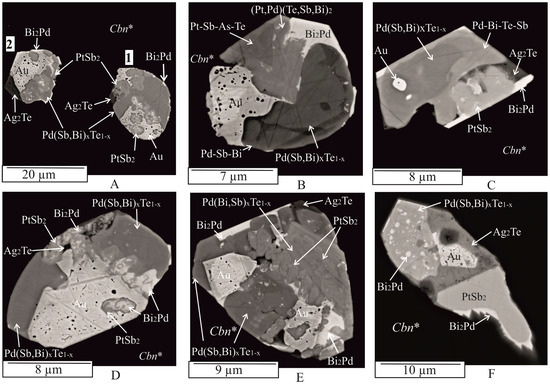
Figure 5.
BSE images showing the characteristic microstructure of polyphase inclusions in Cbn*. Drop-shaped ((A), inclusion 1), euhedral (C), oval-shaped (D), isometric subhedral (B), irregular subhedral ((A), inclusion 2),E,F).
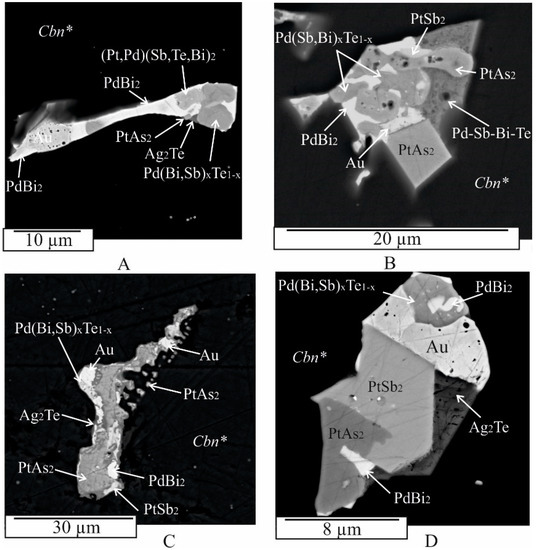
Figure 6.
BSE images showing the wide variety of microstructures in polyphase inclusions in Cbn*. Six-phase irregular inclusion of (Pd(Bi,Sb)xTe1−x + (Pt, Pd)(Sb,Te,Bi)2 + Ag2Te + Au + PtAs2 + PdBi2 (A). Faceted crystal and round shaped grain of PtAs2 in five-phase inclusion of (PtAs2+ PdBi2 + PtSb2 + Pd(Bi,Sb)xTe1−x + Au) (B). Six-phase irregular inclusion of (Pd(Bi,Sb)xTe1−x + Ag2Te + Au + PtAs2 + PdBi2 + PtSb2 (C). Six-phase subhedral inclusion of (Pd(Bi,Sb)xTe1−x + PtSb2 + Ag2Te + Au + PtAs2 + PdBi2 (D).
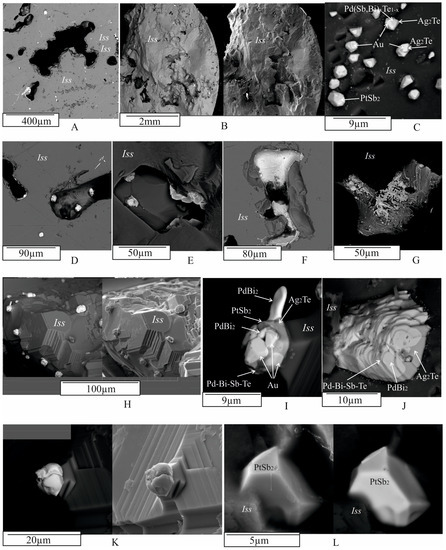
Figure 7.
Different styles of PGE minerals in the Iss matrix and voids within zones II and III using BSE images. (A) Microstructure of zone II at g = 0.83. Gray—Iss matrix, white—noble metal microphases, black—pores and voids in the polished plane filled with epoxy resin. (B) Characteristic surface relief of a fracture in zone III at g = 0.96. Gas voids also occur in the Iss matrix. Bright inclusions on the left side of the microphotograph represent noble metal microphases. (C) Close-up of (B), showing a multiphase euhedral agglomerate of platinum minerals and euhedral cores in the Iss matrix. (D–G) Typical inclusions of platinum phases hosted in pores within the Iss matrix. (H) Microstructure of the interior of a pore. Euhedral crystals of Iss are visible, on the surface of which there are multiphase agglomerates of platinum phases. (I–K) Close-up of fragments from (H), taken at the highest magnification. The multiphase structure of micro-inclusions of platinum metals is visible. (L) Euhedral crystal of PtSb2 in a pore, grown on an Iss crystal. The left and right microphotographs were obtained via BSE and SE (secondary electrons), respectively.
Many inclusions of the first type have a complex phase composition and show varying degrees of crystal forms among them (Figure 3F, Figure 4, Figure 5 and Figure 6). The number of phases within an inclusion is independent of its size. Typically, inclusions consist of three to five phases of different shapes (Figure 3F (inclusion 2, 3),G, Figure 4, Figure 5 and Figure 6), including drop-shaped (Figure 5A, 1), oval (Figure 4D and Figure 5D), lamellar (Figure 3A), euhedral (Figure 3B, Figure 4A, Figure 5C and Figure 7C), subhedral (Figure 4B,E, Figure 5A (inclusion 2),B,E,F and Figure 6B,D), and irregular shapes (e.g., Figure 3D–H and Figure 7). The outer surface of the aggregates may consist of a combination of spherical surfaces (Figure 4E and Figure 5E), and individual aggregates, which may appear as rounded apophyses extending from larger individuals (Figure 6A). Groups of inclusions belonging to noble metal micro-phases, apparently associated with grain boundaries, are often observed (e.g., Figure 3D,H and Figure 6C). Solitary grains and two-phase aggregates are less common (Figure 3A,B,D,F (inclusion 1)).
Gold (Au, ~Au3Ag): native gold occurs as abundant anhedral, subhedral, or euhedral crystallites and rounded grains with sizes ranging from about 1 μm to 15 μm. It is found in intergrowths with Pd(Sb,Bi)xTe1−x, Ag2Te, PdBi2, PtAs2, and PtSb2 (Figure 3, Figure 4, Figure 5 and Figure 6). Additionally, it forms single globules ≤ 1 μm within the grains of the sudburite-sobolevskite-kotulskite solid solution Pd(Sb,Bi)xTe1−x (Figure 5C), Ag2Te (Figure 4F), and PdBi2 (Figure 6A). The Au inclusions show both nonzonal (Figure 3E,F, Figure 4A,C,D,F, Figure 5A (inclusion 1),C,F and Figure 6A–C) and zonal structures (Figure 5A (inclusion 2),B,E and Figure 6D). EDS analysis revealed that unzoned inclusions contain 60–65 at. % Au and 29–32 at. % Ag (Table A1). The central part of the zoned inclusions is composed of high-grade gold (ranging from 75 to 80 at. % Au), while the marginal zone has a composition close to Au3Ag (Table A1). In addition, Au may dissolve the following amounts (at. %): ~3 Pd, 3–4 Fe, 4–7 Cu. These results are consistent with the phase diagrams of binary systems such as Au-Ag, Au-Pd, Au-Cu, and ternary systems such as Au-Ag-Cu, Ag-Au-Fe, which indicate wide regions of solid solutions based on the components at high temperatures [51,59].
Ag2Te: Ag2Te is a compound in the Ag-Te binary system that crystallizes from the melt at 960 °C [59]. The resulting phase is a synthetic analog of the naturally occurring mineral hessite. Xenomorphic grains of hessite, ranging in size from 3 to 10 μm, are found in multiphase assemblages (consisting of three to five mineral phases) and are directly adjacent to the Au, Pd(Sb,Bi)xTe1−x, and Bi2Pd phases (Figure 3F,G, Figure 4A–C,F, Figure 5E,F and Figure 6A,D). In addition, hessite is closely associated with PtSb2 (Figure 4A,C,D and Figure 5D) and PtAs2 (Figure 6A,D) and contains approximately 3 at. % Fe, 2 at. % Cu, and 1 at. % S (Table A1).
Platinum and palladium form multicomponent phases that include Bi, Sb, Te, and As. The primary Pd-containing compounds in the Pd-Bi-Sb-Te system are the sudburite-sobolevskite-kotulskite solid solution Pd(Bi,Sb)xTe1−x, froodite PdBi2, michenerite PdTeBi, and the Me(TABS)2−x solid solution, which typically contains up to eight components: Me = Σ (Pd, Pt, Fe, Cu), TABS = Σ (Te, As, Bi, Sb) (Table A1).
Pd(Bi,Sb)xTe1−x: The composition of the sudburite-sobolevskite-kotulskite solid solution Pd(Bi,Sb)xTe1−x varies within the following atomic percent ranges: Pd from 39 to 46, Bi from 12 to 25, Sb from 12 to 31, Te from 0 to 16 (Table A1). This solid solution contains up to ~2 at. % Pt, up to 3 at. % Ag, and 2–4 at. % Fe and Cu. In particular, the Pd-Te-Bi and Pd-Te-Sb systems exhibit continuous regions of PdTe-PdBi, PdTe-PdSb, and PdSb-PdTe-PdTe2 solid solutions [25,27,62,63]. The Pd(Bi,Sb)xTe1−x solid solution is often found in multiphase composites immediately adjacent to native gold (Figure 3E,G (inclusion 2), Figure 4A,B,D,E, Figure 5F and Figure 6D), Ag2Te (Figure 4F and Figure 5C,F), PdBiTe (Figure 4D), (Pt,Pd)(TeBiSb)2 (Figure 4A and Figure 6A), PtSb2 (Figure 6A,D), Bi (Figure 5E), and PtAs2 (Figure 6B) phases. A few inclusions show close intergrowths of Pd(Bi,Sb)xTe1−x with PtSb2 (Figure 5C) and upon cooling, this solid solution fractionates to form Bi- and Sb-rich phases (Figure 3G (inclusion 2) and Figure 5E, Table A1). A few Pd(Bi,Sb)xTe1−x grains contain small non-spherical particles of PdBi2 froodite and PdBiTe michenerite (Figure 4D), which likely formed during the decomposition of the solid solution at lower temperatures, consistent with the phase diagram of the Pd-Bi-Te system [57]. Pd(Bi,Sb)xTe1−x also contains hessite (Ag2Te) inclusions, associated with Ag, froodite Bi2Pd (Figure 5F). Ag2Te inclusions likely formed when the solubility of Ag in Pd(Bi,Sb)xTe1−x decreased at higher temperatures. Micron-sized Au inclusions are also present in the Pd(Bi,Sb)xTe1−x matrix.
PdBi2: in the Pd-Bi binary system, PdBi2 crystallizes from the melt at 485 °C in the tetragonal high-temperature modification βPdBi2 [56]. Below 380 °C, the monoclinic phase α PdBi2 becomes stable. αPdBi2 serves as a synthetic analog of the mineral froodite. Froodite may contain up to 4 at. % Fe and 5 at. % Cu (Table A1). Euhedral to subhedral inclusions of froodite ranging in size from 1 to 10 μm, are observed in various associations, such as PdBi2 + Bi (Figure 3D), PdBi2 + Pd(Bi,Sb)xTe1−x + Au (Figure 4E, inclusion 2), PdBi2 + Ag2Te + PtSb2 (Figure 3C), PdBi2 + Au + Bi2Te (Figure 3F, inclusion 2), PdBi2 + PtAs2 + Ag2Te (Figure 3G, inclusion 1), PdBi2 + Pd(Bi,Sb)xTe1−x + Au + Ag2Te (Figure 4B), PdBi2 + Pd(Bi,Sb)xTe1−x + Au + PtSb2 (Figure 5A), PdBi2 + Pd(Bi,Sb)xTe1−x + Au + Ag2Te + PtSb2 (Figure 5C,D,E), PdBi2 + Pd(Bi,Sb)xTe1−x + Au + PtAs2 + PtSb2 (Figure 5F, inclusion 3), and PdBi2 + (Pt,Pd)(Bi,Sb,Te)2 + Pd(Bi,Sb)xTe1−x + Au + Ag2Te + PtAs2 (Figure 6A). It also occurs in the matrix of the sudburite-sobolevskite-kotulskite solid solution Pd(Bi,Sb)xTe1−x as small inclusions (<1 μm) and rims as well as in grains of geversite PtSb2 (Figure 3C and Figure 5F).
PdBiTe: the synthetized PdBiTe is analogous to the mineral michenerite. It occurs as irregularly shaped grains, about 15 μm in size, with an Sb content of 5–8 at. %, as aggregates in paragenesis with PdBi2, Au, and Pd(Bi,Sb)xTe1−x. Meanwhile, grains ranging from less than 1 μm to about 3 μm in size are commonly observed in the sudburite-sobolevskite-kotulskite solid solution Pd(Bi,Sb)xTe1−x (Figure 4D, Table A1).
Me(TABS)2: the Me(TABS)2 solid solution, containing Pt and Pd, presents more chemical complexity with significant variations established in platinum and palladium (Pt > Pd) and TABS concentration (in at. %): 18–31 Pt, 0–12 Pd, 50–22 Sb, 9–20 Te, 0–14 Bi, 2–24 As (Table A1), as well as subordinate Fe and Cu, up to 3 at. %. The extreme composition of PtSb2, containing about 9 at. % Te and As each, corresponds to the Te,As-containing synthetic analogue of the natural mineral geversite (PtSb2). According to [53], PtTe2 and PtSb2 may dissolve about 28.5 at. % of the opposite anion in the Pt-Sb-Te system, at 1000 °C. At 800 °C, PtSb2 may yield up to 28.5 at. % Te in equilibrium with Sb-Te liquid and PtTe2. At 600 °C, PtSb2 contains 27.0 to 28.5 at. % Te in equilibrium with PtTe2 and liquid. Geversite crystals form 2 μm aggregates with Pt(As,S)2 grains (Figure 3B). Triangular PtSb2 crystals, of about 10 μm, are surrounded by PdBi2 with inclusions of Ag2Te (Figure 3C). PtSb2 and the Me(TABS)2 solid solution frequently form multiphase aggregates with Pt(As,S)2, PdBi2, Au, Ag2Te, and Pd(Bi,Sb)xTe1−x (Figure 3F (inclusion 3) and Figure 5A,C,E,F), as well as with Bi, PtBi2, Bi2Te, Pt(As,S)2, and Au (Figure 4E, inclusion 3). Compact intergrowths of PtSb2 and Pd(Bi,Sb)xTe1−x grains were observed in these assemblages (Figure 5E). PtSb2 inclusions in the intergrowths range in size from 3 μm to 10 μm. Me(TABS)2 is associated with Pd(Bi,Sb)xTe1−x, Au, and Ag2Te (Figure 4A), as well as Au, PdBi2, and Pd(Bi,Sb)xTe1−x, and other unidentified multicomponent phases of the Pt-Sb-Te-As system due to the lack of a phase diagram for this system (Figure 5B).
Pt(As,S)2: the most common Pt-bearing phase in the experimental sulfide ores is Pt(As,S)2. In the Pt-As binary system, PtAs2 crystallizes from the melt at 1472 °C [51] and it is considered a synthetic analog of the mineral sperrylite. In the sample, sperrylite occurs as single-phase inclusions forming of laths as well as subhedral and anhedral grains ranging in size from <1 to 5 μm in the Cbn* and Iss matrix (Figure 3A,D). Intergrowths of Pt(As,S)2 with euhedral and subhedral PtSb2 crystals are typomorphic (Figure 3B,F, inclusion 1). Sperrylite is also widely distributed as fragments of composite inclusions, appearing as irregularly shaped grains and euhedral crystals in association with PdBi2, PtBi2, and Bi (Figure 4E, inclusion 3), as well as with Pd(Bi,Sb)xTe1−x, (Pt,Pd)(SbTeBi)2, PdBi2, Au, and Ag2Te (Figure 7A). Sperrylite contains 5 to 10 at. % sulfur, which is consistent with data from [64,65], indicating that sulfur solubility in PtAs2 may reach up to 25 at. %. In addition, Pt(As,S)2 dissolves of Cu, Fe, Sb, and Te (Table A1).
Bismuth, (Bi): native bismuth forms rims around grains of froodite PdBi2 (Figure 5E). The grains are about 2 μm in size and are commonly found adjacent to Pd(Bi,Sb)xTe1−x in aggregates consisting of Pd(Bi,Sb)xTe1−x, PdBi2, Au, and Ag2Te (Figure 4C), as well as Pd(Bi,Sb)xTe1−x, Bi2Te, Au, and Ag2Te (Figure 4F). In the Bi2Te, Pt(As,S)2, and PtSb2 complex, bismuth is present in all phases (Figure 4E, inclusion 3). Bi dissolves about 11 at. % and 12 at. % Fe, although in Bi-Fe and Bi-Cu systems the solid and liquid solubilities of the components are very limited [59,66].
Bi2Te: Bi2Te, an analog of the mineral hedleite, occurs in paragenesis with Pd(Bi,Sb)xTe1−x and Au (Figure 4E, inclusion 1), as well as with Ag2Te (Figure 4F). According to [61], the maximum temperature stability of Bi2Te is 392 °C. It is also closely associated with native bismuth occurring nearby PtSb and Pt(As,S)2 (Figure 4E, inclusion 3). Bi2Te contains negligible amounts of Fe and Cu (Table A1).
In general, our results show that only a small fraction of elements form mineral inclusions in the pyrrhotite solid solution during crystallization of a sulfide melt (Table 2). A significantly higher fraction is found in the copper-rich sulfides—cubanite and in the intermediate solid solution. The composition of inclusions does not change within a particular zone and remains consistent throughout the Zones II and III. The relative proportions of inclusions in zone II are shown in Figure 8. Additionally, platinum and palladium form a variety of minerals with chalcophile elements, with palladium preferring Bi and Te, and platinum associating with As. Sb is present in both palladium and platinum phases, while Au and Ag tend to occur as single native phases.
Table 2.
Distribution of micron-size inclusions along a directionally crystallized sulfide melt, including pyrrhotite matrix (Zone I), Cbn* matrix (Zone II), and Iss matrix (Zone III). “+” marks the presence of mineral in micron-size inclusions in the matrixes of basic sulfides.
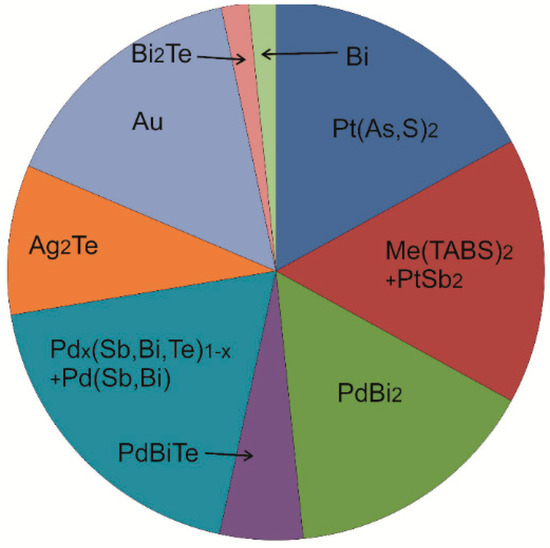
Figure 8.
Pie diagram showing the relative proportions (%) of different microphases in Cbn* from zone II.
Most of the inclusions in the experiment occur as either between grains of base metal sulfides, drop-shaped or subhedral isometric grains within Cbn* and Iss grains (Figure 4, Figure 5 and Figure 6) containing Sb, Te, As, Bi, and noble metals. The different inclusion styles suggest that the formation of semimetallic melt droplets occur near the crystallization front within the sulfide liquid, their subsequent capture by the crystallization front, and solidification as the temperature decreases. This hypothesis is supported by the observed immiscibility of sulfide and Pt, Pd-bearing semimetal melts in binary and several ternary and quaternary systems, including Te, As, Bi, Sb, and noble metals [25,59], as well as that obtained by classical synthesis techniques [19,28,29,30,67]. In addition, the presence of semimetal inclusions in the sulfide mineral matrix in copper-nickel ores has been extensively reported in the literature [6,10,16,68,69,70,71,72].
The average composition of typical inclusions (Table 3) was determined via SEM-EDS by scanning their entire occupied area. This estimation revealed that the micro inclusions are composed of Bi, Sb, Te, As, sulfur-free, and act as main concentrators of Au, Ag, Pd, and Pt.
Table 3.
EDS microanalyses showing the average composition of inclusions.
Variations in the average composition of inclusions depend on their phase composition. Inclusions enriched in Au and Ag (27–54 at. % Au and 19–21 at. % Ag) contain up to 12 at. % Pd and are rich in Bi (ranging from 11 to 30 at. %). Most of these inclusions are Ag-bearing Au, with minor amounts of Pd-containing phases such as froodite PdBi2, sudburite-sobolevskite-kotulskite solid solution Pd(Bi,Sb)xTe1−x, and hessite Ag2Te (Figure 3F, inc. 2 and Figure 4A,B). Inclusions enriched in Pd and Ag (25 at. % Pd and 21 at. % Ag) contain practically no Au. They contain equal amounts of Bi and Sb (~16 at. % each), slightly less Te (13 at. %) and are completely free of As. The microstructure mainly consists mainly of sudburite-sobolevskite-kotulskite solid solution Pd(Sb,Bi)xTe1−x, hessite Ag2Te, froodite PdBi2, Bi2Te, and Bi (Figure 4F). The presence of Pt in the inclusions correlates well with the As and Sb contents.
The most common type of inclusions are those where almost all microphases form a composite. These inclusions are formed from refractory phases melting at 1475 °C for PtAs2, 1226 °C for PtSb2, ~1000 °C for Au, 960 °C for Ag2Te, which is above the liquidus temperature of the sulfide melt, and fusible phases with estimated melting temperatures below 750 °C for Pd(Bi,Sb)xTe1−x, below 485 °C for PdBiTe, PdBi2, 392 °C for Bi2Te, and 271 °C for Bi (Table 1). Single crystals of PtAs2 and aggregates of PtAs2 with PtSb2 in Cbn* and Iss are compounds with melting temperatures above the liquidus temperature in the phase diagram of the Cu-Fe-S system. It may be assumed that near the crystallization front, the platinum content in the sulfide melt is sufficient for their formation. Therefore, they crystallize in the sulfide melt and are then captured during BSM crystallization (Figure 3A,B,D,F,H).
Gold and silver compounds are also refractory but they do not form independent inclusions. The content of these elements in the sulfide melt near the liquidus is expected to be low. It is possible that at this temperature the sulfide melt contains droplets of fusible Pd-bearing compounds with traces of Au, Ag and Pt. Upon cooling, these droplets are captured by the crystallizing mass of BMS. Progressive solidification of semimetal melt droplets releases compounds with gradually lower melting temperatures. First, crystals and grains of PtAs2, a solid solution based on PtSb2, Au, Ag2Te are formed, and then Pd(Bi,Sb)xTe1−x, PdBiTe, PdBi2, Bi2Te, Bi solidify (see, for example, Figure 6D). The obtained data are in agreement with the results of the annealing experiments performed by Helmy et al. [28,30,32], which indicate that the Pt-Te, Pt-As, and Pt-Sb melts appear at temperatures higher than the Pd-Te, Pd-As, and Pd-Sb melts. They also confirmed that Pt-semimetallic phases have a higher thermal stability (1230–780 °C) compared to all Pd-semimetallic phases (below 750 °C). The possible influence of trace amounts of Pd on the crystallization process of sulfide melts has been demonstrated in [70].
In samples of the FexNi0.49−xS0.51 pseudo-binary section, the addition of Pd impurities after annealing at 900 °C and 800 °C led to the detection of a Pd-enriched liquid in the matrix of monosulfide solid solution. This was observed at 600 °C, i.e., 450–500 °C below the solidus temperature of the studied section. This suggests a significant decrease in the temperature of existence of the last droplets of Pd- and Ni-rich sulfide melt, from which Pd-pentlandite, Pd16S7, and Pd-bearing heazlewoodite-type phases eventually crystallize. We found that the composition of BMS, either Cbn* or Iss, does not affect the formation of noble metal phases and their intergrowths during the solidification of the semimetal liquid. These droplets are uniformly distributed in the Cbn* and Iss matrices.
Our experiment confirmed the assumption that the formation of minor phases of noble metals should not be considered as the final stage of fractional crystallization of multicomponent sulfide melts. Table 4 shows the complex nature of the separation of parental sulfide melts with the formation of semimetallic droplets of different compositions in cubanite and intermediate solid solution.
Table 4.
Types of immiscible melt droplets formed during the fractional crystallization of multicomponent sulfide melts.
3.2.3. Pore-Hosted Inclusions in the Zones II and III
Numerous small (<20 μm) and large (up to 1 mm) gas inclusions were present in Cbn* and Iss (Figure 7A). For illustration, Figure 8B shows a cross-section of this sample at g = 0.96 (zone III, Iss). The average size and number of pores increased toward the end of the ingot. Euhedral BMS crystals often grow on the inner surface of these voids, consisting of Cbn* and Iss with characteristic steps of crystal growth (Figure 7H,I,K). Micro inclusions of complex phase composition are present on the surface of these crystals (Figure 7H–K) or adhering to the inner walls of pores (Figure 7F,G). Both euhedral (Figure 7H,I,K,L) and anhedral microphase inclusions (Figure 7E–G,J) are present in the pores. The X-ray elemental maps (Figure 9) illustrate the complex chemical composition of inclusions in pores, similar to that of inclusions in BMS. The phase composition of the inclusions associated with the gas pores is also identical to that of the inclusions in the BMS (Figure 7I,J).
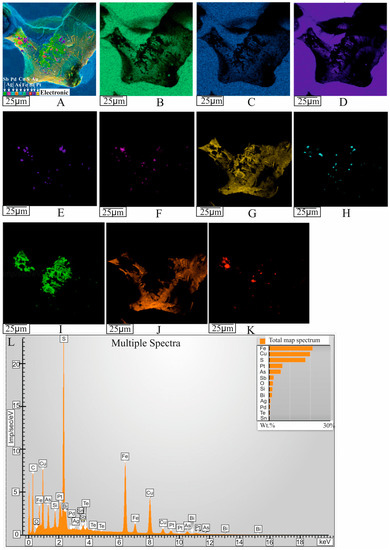
Figure 9.
X-ray distribution maps of the major and impurity components, illustrating the complex chemical composition of micromineral inclusions in a pore. (A) Layered image of the inclusion in the Iss matrix (see Figure 8G). X-ray images: (B) Fe K-series, (C) Cu K-series, (D) S K-series, (E) Au M-series, (F) Ag L-series, (G) Pt M-series, (H) Pd L-series, (I) Sb L-series, (J) As L-series, (K) Bi M-series. (L) Sample combined spectrum.
The reasons for the association of microparticles with gas cavities may be qualitatively described as follows. The majority of the chalcophile components forms the immiscible enrichment of noble metal melts. An excess of these components may be expected to accumulate in the melt near the crystallization front. When their concentration reaches saturation, gas bubbles nucleate at the crystallization front. The bubbles adhering to the crystal-melt interface are fed by impurities of chalcophile components, and increase in size to be subsequently captured by the growing crystal as spherical inclusions or elongated voids, if their trapping is associated with microdefects occurring at the crystallization front. Note that during the crystallization of a multiphase ingot, the melt at the crystallization front is heterogeneous in composition, resulting in a difference in surface tension near the solid and bubbles trapped by the crystallization front and away from it. This in turn may trigger Marangoni convection in the surface layer of the melt. The surface flux in the liquid film is directed from areas of high surface energy to areas of lower surface energy.
The newly formed mass transfer flux causes microparticles to drift toward the surface of gas bubbles, where they adhere and then enter the volume of the crystal. The inclusions are thus trapped together with the bubbles. This leads to the commonly observed associations of microparticles with gas cavities. The outlined scenario provides a comprehensive explanation for the observed behavior of noble metal during the fractional crystallization of a sulfide melt containing chalcophile elements in a conservative system, under the pressure of its own chalcophile element gases.
It should be noted that the presence of gas vacancies in the sulfide matrix of Cu-Ni ores may be associated with micro components introduced into the sulfide melt by an external agent. In particular, PGE, Au, Ag, Sn, Te, As, Sb, and Bi are thought to be introduced by fluids generated during the crystallization of sulfide melts [6,71,72]. In contrast, some researchers, e.g., [5,16,18,22,33,42] propose that the sulfide melt initially contains all the ore micro-components. Our data are consistent with this hypothesis.
4. Conclusions
Directional crystallization of pyrrhotite, cubanite, and intermediate solution containing minor amounts of Pt, Pd, Au, Ag, Sn, Te, As, Bi, and Sb confirmed that only a small fraction of these elements form micro-inclusions of their corresponding phases within pyrrhotite. In contrast, the majority of noble metal microphases were found to be concentrated in copper-rich sulfides. Additionally, we showed that Pt, Pd, Au, and Ag have a tendency to interact with Te, As, Bi, and Sb, leading to the formation of droplet-like inclusions in the cubanite matrix and Iss. This suggests the possibility of sulfide-semimetal immiscibility, resulting in the concentration of noble metal semimetal melts. Crystallization of microphases within polyphase complexes was observed, indicating the formation of minerals when immiscible melt droplets are cooled to room temperature. Te, As, Bi and Sb along with Pt and Pd in cubanite and Iss are represented by native Bi, hessite, sperrylite, hedleyite, michenerite, froodite, a solid solution of sudburite-sobolevskite-kotulskite, geversite. There are fewer single-phase inclusions than poly-phase ones. However, polyphase (3–4) inclusions in cubanite are revealed with the occurrence of grains of native Au and Ag.
Gas-derived voids containing micro-inclusions of noble metal phases were abundant in Cu-Fe-sulfides. Inclusions found within pores have comparable chemical compositions and closely resemble those not associated with voids. Therefore, the presence of such voids does not significantly affect the behavior of noble metals.
The formation of platinum mineral inclusions during the solidification of the model melt is similar to that observed in isothermal experiments and natural ore samples from Norilsk. This further support the hypothesis that the endowment of noble metals and chalcophile elements may already be present in the parent sulfide melt that is transported along the magma conduits after its separation from the silicate melt.
It is important to note that these experimental results may not be in perfect agreement with data obtained directly from natural occurring ore bodies. This is primarily due to the fact that these melts encompass a greater number of components, the addition of which significantly alters the phase equilibrium and crystallization sequence. Thus, natural multicomponent systems may form phases that are not present in systems with fewer constituents, also leading to more complex geochemical behavior, e.g., zoning. Finally, the methodology used in this study assumes a conservative system, ignoring potential interactions between the melt and solid phases with the external environment. In natural systems, the possibility of external sources influencing on the crystallization process always remains open. Therefore, when characterizing the evolution of ore-magmatic systems, it is imperative to consider both the magmatic and post-magmatic (fluid) stages, recognizing their respective roles.
Author Contributions
E.F.S. conceptualization, interpreted the results, wrote and editing the paper; N.A.G. conceptualization, editing the paper; K.A.K. performed the experiments and editing the paper; N.S.K. analyzed the compositions of phases and wrote the paper, V.A.G. performed data treatment. All authors have read and agreed to the published version of the manuscript.
Funding
This work was supported by the Russian Federation state assignment of Sobolev Institute of Geology and Mineralogy of SB RAS (No.122041400237-8, No.122041400171-5, No.122041400031-2), by the Russian Federation state assignment of A.P. Vinogradov Institute of Geochemistry, Siberian Branch of the Russian Academy of Sciences (No.121031700301-5), and by Russian Foundation of Basic Research project (No.20-35-90088).
Data Availability Statement
No applicable.
Conflicts of Interest
The authors declare no conflict of interest.
Appendix A
Table A1.
Representative SEM/EDS analyses of typical noble metal phases in Cbn* and Iss.
Table A1.
Representative SEM/EDS analyses of typical noble metal phases in Cbn* and Iss.
| Ideal Formula | Total | Fe | Cu | Au | Ag | Pt | Pd | Bi | Sb | Te | As | S |
|---|---|---|---|---|---|---|---|---|---|---|---|---|
| Au 1 | 99.96 | 1.29 | 1.61 | 75.38 | 21.67 | <LD | <LD | <LD | <LD | <LD | <LD | <LD |
| 3.65 | 4.01 | 60.55 | 31.79 | <LD | <LD | <LD | <LD | <LD | <LD | <LD | ||
| Au 1 | 99.84 | 1.08 | 2.4 | 76.61 | 19.75 | <LD | <LD | <LD | <LD | <LD | <LD | <LD |
| 3.07 | 6.00 | 61.82 | 29.10 | <LD | <LD | <LD | <LD | <LD | <LD | <LD | ||
| Au 2 | 100.46 | 1.23 | 2.73 | 91.12 | 5.38 | <LD | <LD | <LD | <LD | <LD | <LD | <LD |
| 3.81 | 7.44 | 80.11 | 8.64 | <LD | <LD | <LD | <LD | <LD | <LD | <LD | ||
| Au 2 | 100.40 | 1.17 | 2.52 | 90.99 | 5.71 | <LD | <LD | <LD | <LD | <LD | <LD | <LD |
| 3.64 | 6.89 | 80.27 | 9.20 | <LD | <LD | <LD | <LD | <LD | <LD | <LD | ||
| Au 2 | 100.59 | 1.87 | 3.3 | 84.72 | 10.7 | <LD | <LD | <LD | <LD | <LD | <LD | <LD |
| 5.45 | 8.45 | 69.97 | 16.14 | <LD | <LD | <LD | <LD | <LD | <LD | <LD | ||
| Au 2 | 100.04 | 1.12 | 2.55 | 86.59 | 9.78 | <LD | <LD | <LD | <LD | <LD | <LD | <LD |
| 3.4 | 6.8 | 74.45 | 15.36 | <LD | <LD | <LD | <LD | <LD | <LD | <LD | ||
| Au 3 | 100.25 | 1.46 | 1.66 | 72.94 | 24.19 | <LD | <LD | <LD | <LD | <LD | <LD | <LD |
| 4.04 | 4.04 | 57.25 | 34.67 | <LD | <LD | <LD | <LD | <LD | <LD | <LD | ||
| Au 3 | 98.01 | 1.69 | 1.92 | 67.77 | 24.51 | <LD | 2.12 | <LD | <LD | <LD | <LD | <LD |
| 4.64 | 4.64 | 52.8 | 34.87 | <LD | 3.06 | <LD | <LD | <LD | <LD | <LD | ||
| Pd(Sb.Bi) | 98.15 | 1.46 | 1.67 | <LD | <LD | <LD | 37.97 | 27.77 | 29.28 | <LD | <LD | <LD |
| 3.35 | 3.36 | <LD | <LD | <LD | 45.59 | 16.97 | 30.73 | <LD | <LD | <LD | ||
| Pd(Sb.Bi)xTe1−x | 100.82 | 1.13 | 2.14 | 0.9 | <LD | 2.49 | 37.27 | 20.66 | 28.73 | 7.49 | <LD | <LD |
| 2.48 | 4.13 | 0.56 | <LD | 1.57 | 42.98 | 12.13 | 28.95 | 7.2 | <LD | <LD | ||
| Pd(Sb.Bi)xTe1−x | 101.37 | 0.78 | 1.18 | <LD | <LD | 1.71 | 38.46 | 22.33 | 28.22 | 8.68 | <LD | <LD |
| 1.73 | 2.29 | <LD | <LD | 1.08 | 44.66 | 13.2 | 28.64 | 8.4 | <LD | <LD | ||
| Pd(Sb.Bi)xTe1−x | 101.57 | 0.96 | 1.3 | 0.92 | <LD | <LD | 37.67 | 28.89 | 27.19 | 4.65 | <LD | <LD |
| 2.16 | 2.58 | 0.59 | <LD | <LD | 44.57 | 17.4 | 28.11 | 4.59 | <LD | <LD | ||
| Pd(Sb.Bi)xTe1−x | 100.8 | 1.05 | 2.04 | 0.83 | <LD | 2.35 | 36.94 | 24.99 | 26.00 | 6.59 | <LD | <LD |
| 2.35 | 4.02 | 0.53 | <LD | 1.51 | 43.45 | 14.96 | 26.72 | 6.46 | <LD | <LD | ||
| Pd(Sb.Bi)xTe1−x | 98.08 | 1.26 | 1.27 | <LD | <LD | <LD | 37.29 | 24.92 | 24.53 | 8.8 | <LD | <LD |
| 2.88 | 2.55 | <LD | <LD | <LD | 44.78 | 15.24 | 25.74 | 8.81 | <LD | <LD | ||
| Pd(Bi.Sb)xTe1−x | 99.33 | 1.23 | 1.4 | <LD | <LD | 2.38 | 35.5 | 25.07 | 19.53 | 14.23 | <LD | <LD |
| 2.82 | 2.82 | <LD | <LD | 1.56 | 42.68 | 15.34 | 20.52 | 14.26 | <LD | <LD | ||
| Pd(Bi.Sb)xTe1−x | 99.97 | 1.7 | 1.4 | <LD | <LD | 2.66 | 35.14 | 24.48 | 18.95 | 15.63 | <LD | <LD |
| 3.85 | 2.78 | <LD | <LD | 1.72 | 41.72 | 14.8 | 19.66 | 15.47 | <LD | <LD | ||
| Pd(Bi.Sb)xTe1−x | 101.23 | 1.13 | 1.51 | <LD | <LD | 0 | 31.73 | 39.29 | 16.94 | 7.96 | <LD | <LD |
| 2.68 | 3.14 | <LD | 3.26 | 0 | 39.43 | 24.86 | 18.39 | 8.25 | <LD | <LD | ||
| Pd(Bi.Sb)xTe1−x | 100.45 | 1.89 | 1.82 | <LD | <LD | 2.13 | 34.33 | 33.62 | 11.03 | 15.63 | <LD | <LD |
| 4.4 | 3.72 | <LD | <LD | 1.42 | 41.9 | 20.89 | 11.77 | 15.91 | <LD | <LD | ||
| PdBi2 | 98.74 | 1.4 | 2.03 | <LD | <LD | <LD | 14.11 | 81.21 | <LD | <LD | <LD | <LD |
| 4.34 | 5.52 | <LD | <LD | <LD | 22.93 | 67.21 | <LD | <LD | <LD | <LD | ||
| PdBiTe | 100.52 | 0.99 | 1.01 | <LD | <LD | 2.29 | 23.68 | 41.1 | 4.83 | 26.61 | <LD | <LD |
| 2.49 | 2.23 | <LD | <LD | 1.65 | 31.22 | 27.59 | 5.57 | 29.26 | <LD | <LD | ||
| PdBiTe | 99.62 | 1.38 | 1 | <LD | <LD | <LD | 23.78 | 42.08 | 4.28 | 27.1 | <LD | <LD |
| 3.47 | 2.21 | <LD | <LD | <LD | 31.35 | 28.25 | 4.93 | 29.79 | <LD | <LD | ||
| PdBiTe | 104.19 | 1.62 | 1.71 | <LD | <LD | 2.19 | 24.7 | 40.68 | 4.18 | 29.11 | <LD | <LD |
| 3.83 | 3.56 | <LD | <LD | 1.48 | 30.69 | 25.73 | 4.54 | 30.16 | <LD | <LD | ||
| PdBiTe | 103.62 | 0.99 | 0.77 | 0.75 | <LD | 3.12 | 23.18 | 43.64 | 6.81 | 24.37 | <LD | <LD |
| 2.45 | 1.68 | 0.53 | <LD | 2.21 | 30.12 | 28.87 | 7.73 | 26.41 | <LD | <LD | ||
| PtSb2 | 101.26 | 0.90 | 1.22 | <LD | <LD | 43.81 | <LD | <LD | 44.59 | 7.95 | 2.79 | <LD |
| 2.22 | 2.65 | <LD | <LD | 30.95 | <LD | <LD | 50.47 | 8.59 | 5.13 | <LD | ||
| PtSb2 | 100.21 | 1.44 | 1.35 | <LD | <LD | 43.72 | <LD | <LD | 41.95 | 8.27 | 3.48 | <LD |
| 3.55 | 2.92 | <LD | <LD | 30.83 | <LD | <LD | 47.4 | 8.92 | 6.39 | <LD | ||
| PtSb2 | 100.65 | 1.65 | 1.56 | <LD | <LD | 43.23 | <LD | <LD | 39.78 | 10.09 | 3.96 | 0.36 |
| 3.96 | 3.29 | <LD | <LD | 29.72 | <LD | <LD | 43.82 | 10.61 | 7.09 | 1.51 | ||
| PtSb2 | 96.78 | 1.03 | 1.07 | <LD | <LD | 40.1 | <LD | 2.93 | 39.59 | 7.99 | 4.07 | <LD |
| 2.65 | 2.42 | <LD | <LD | 29.49 | <LD | 2.01 | 46.66 | 8.98 | 7.79 | 65.44 | ||
| Me(TABS)2 | 101.42 | 1.75 | 1.55 | <LD | <LD | 39.46 | 2.00 | 3.42 | 40.97 | 9.4 | 2.87 | <LD |
| 4.23 | 3.29 | <LD | <LD | 27.27 | 2.53 | 2.21 | 45.37 | 9.93 | 5.17 | 62.68 | ||
| Me(TABS)2 | 97.67 | 0.89 | <LD | <LD | <LD | 40.7 | 1.27 | 6.32 | 35.13 | 7.89 | 5.46 | <LD |
| 2.31 | <LD | <LD | <LD | 30.24 | 1.73 | 4.38 | 41.82 | 8.96 | 10.56 | 65.72 | ||
| Me(TABS)2 | 99.04 | 1.78 | 1.32 | <LD | <LD | 39.34 | 1.25 | 6.68 | 34.18 | 9.13 | 5.36 | <LD |
| 4.42 | 2.88 | <LD | <LD | 27.94 | 1.63 | 4.43 | 38.89 | 9.91 | 9.91 | 63.14 | ||
| Me(TABS)2 | 102.46 | 1.05 | 0.85 | <LD | <LD | 42.7 | 1.16 | 7.38 | 32.55 | 8.72 | 8.05 | <LD |
| 2.54 | 1.81 | <LD | <LD | 29.56 | 1.47 | 4.77 | 36.11 | 9.23 | 14.51 | <LD | ||
| Me(TABS)2 | 100.12 | 0.75 | <LD | <LD | <LD | 26.89 | 8.90 | 20.84 | 24.25 | 16.4 | 2.08 | <LD |
| 1.95 | <LD | <LD | <LD | 19.97 | 12.12 | 14.45 | 28.86 | 18.62 | 4.02 | <LD | ||
| Me(TABS)2 | 100.96 | 1.29 | 1.14 | <LD | <LD | 25.7 | 9.11 | 19.05 | 25.11 | 18.44 | 1.12 | <LD |
| 3.23 | 2.51 | <LD | <LD | 18.42 | 11.97 | 12.74 | 28.83 | 20.2 | 2.09 | <LD | ||
| Me(TABS)2 | 99.18 | 1.71 | 1.37 | <LD | <LD | 42.06 | 2.53 | 6.79 | 25.92 | 5.11 | 13.68 | <LD |
| 4.03 | 2.84 | <LD | <LD | 28.38 | 3.13 | 4.28 | 28.03 | 5.27 | 24.04 | <LD | ||
| Me(TABS)2 | 101.53 | 1.83 | 1.73 | <LD | <LD | 37.52 | 4.12 | 8.47 | 20.16 | 12.63 | 13.1 | 0.44 |
| 4.11 | 3.41 | <LD | <LD | 24.12 | 4.86 | 5.08 | 22.35 | 12.41 | 21.93 | 1.72 | ||
| Bi | 97.5 | 3.89 | 3.95 | <LD | <LD | <LD | <LD | 89.66 | <LD | <LD | <LD | <LD |
| 12.42 | 11.08 | <LD | <LD | <LD | <LD | 76.5 | <LD | <LD | <LD | <LD | ||
| Ag2Te | 100.98 | 1.42 | 1.34 | <LD | 61.17 | <LD | <LD | <LD | <LD | 36.76 | <LD | 0.29 |
| 2.79 | 2.32 | <LD | 62.27 | <LD | <LD | <LD | <LD | 31.63 | <LD | 0.99 | ||
| Bi2Te | 99.14 | 1.34 | 1.22 | <LD | <LD | <LD | <LD | 70.7 | <LD | 25.89 | <LD | <LD |
| 4.11 | 3.29 | <LD | <LD | <LD | <LD | 57.89 | <LD | 34.72 | <LD | <LD | ||
| Pt(As,S)2−x | 104.5 | 2.93 | 3.54 | <LD | <LD | 55.58 | <LD | <LD | 2.47 | <LD | 36.65 | 3.34 |
| 5.21 | 5.53 | <LD | <LD | 28.3 | <LD | <LD | 2.02 | <LD | 48.59 | 10.35 | ||
| Pt(As,S)2−x | 100.37 | 2.96 | 2.57 | <LD | <LD | 51.13 | <LD | <LD | 6.06 | <LD | 35.75 | 1.89 |
| 5.63 | 4.3 | <LD | <LD | 27.84 | <LD | <LD | 5.29 | <LD | 50.69 | 6.26 | ||
| Pt(As,S)2−x | 99.52 | 2.16 | 2.17 | <LD | <LD | 52.85 | <LD | <LD | 2.5 | <LD | 38.46 | 1.36 |
| 4.2 | 3.71 | <LD | <LD | 29.45 | <LD | <LD | 2.23 | <LD | 55.8 | 4.61 | ||
| Pt(As,S)2−x | 101.82 | 3.33 | 3.29 | <LD | <LD | 53.6 | <LD | <LD | 3.56 | <LD | 35.32 | 2.72 |
| 6.14 | 5.33 | <LD | <LD | 28.28 | <LD | <LD | 3.01 | <LD | 48.52 | 8.73 | ||
| Pt(As,S)2−x | 100.23 | 1.22 | 1.05 | <LD | <LD | 55.13 | <LD | <LD | 4.53 | 1.27 | 34.51 | 2.52 |
| 2.41 | 1.82 | <LD | <LD | 31.14 | <LD | <LD | 4.10 | 1.10 | 50.77 | 8.66 | ||
| Pt(As,S)2−x | 100.94 | 1.39 | 1.30 | <LD | <LD | 54.61 | <LD | <LD | 3.49 | <LD | 38.63 | 1.52 |
| 2.71 | 2.23 | <LD | <LD | 30.53 | <LD | <LD | 3.13 | <LD | 56.23 | 5.17 | ||
| Pt(As,S)2−x | 101.08 | 1.09 | 1.09 | <LD | <LD | 55.82 | <LD | <LD | 3.32 | 1.19 | 36.22 | 2.34 |
| 2.13 | 1.87 | <LD | <LD | 31.24 | <LD | <LD | 2.98 | 1.02 | 52.79 | 7.97 | ||
| Pt(As,S)2−x | 98.86 | 1.3 | 1.13 | <LD | <LD | 55.45 | <LD | <LD | 3.06 | 0.90 | 34.91 | 2.11 |
| 2.62 | 2.00 | <LD | <LD | 31.96 | <LD | <LD | 2.83 | 0.79 | 52.4 | 7.4 |
For each phase, the compositions are expressed in wt. % (first row) and in mol. % (second row). 1—non-zonal Au grain, 2—central part of the zoned Au grain, 3—Au- outer part of the zoned grain. Me(TABS)2: Me = (Pt + Pd + Fe + Cu), TABS = Sb + Te + As + Bi. The detection limit (LD) varied within 0.4–0.5 wt. % for Pt and Bi, and 0.1–0.2 wt. % for the remaining elements.
References
- Godlevsky, M.N. Magmatic deposits. In Genesis of Endogenous Ore Deposits; Nedra: Moscow, Russia, 1968; p. 73. (In Russian) [Google Scholar]
- Genkin, A.D.; Distler, V.V.; Gladyshev, G.D.; Filimonova, A.A.; Evstigneeva, T.L.; Kovalenker, V.A.; Laputina, I.P.; Smirnov, A.V.; Grokhovskaya, T.L. Copper–Nickel Sulfide Ores of the Noril’sk Deposits; Nauka: Moscow, Russia, 1981; p. 234. (In Russian) [Google Scholar]
- Distler, V.V.; Grokhovskaia, T.L.; Evstigneyeva, T.L.; Sluzhenikin, S.F.; Filimonova, A.A.; Dyuzhikov, O.A.; Laputina, I.P. Petrology of the Sulphide Magmatic Ore-Formation; Nauka: Moscow, Russia, 1988; p. 230. (In Russian) [Google Scholar]
- Naldrett, A.J. Magmatic Sulfide Deposits: Geology, Geochemistry and Exploration; Springer: Berlin, Germany, 2004; p. 727. [Google Scholar]
- Barnes, S.-J.; Cox, R.A.; Zientek, M.L. Platinum-group element, gold, silver and base metal distribution in compositionally zoned sulfide droplets from the Medvezky Creek mine, Noril’sk, Russia. Contrib. Mineral. Petrol. 2006, 152, 187–200. [Google Scholar] [CrossRef]
- Spiridonov, E.M.; Gritsenko, Y.D. Epigenetic Low-Grade Metamorphism and Co-Ni-Sb-As Mineralization in the Norilsk Ore Field; Nauchnyi Mir: Moscow, Russia, 2009; p. 218. (In Russian) [Google Scholar]
- Holwell, D.A.; Mcdonald, I. A review of the behaviour of platinum group elements within natural magmatic sulfide ore systems. Platinum Met. Rev. 2010, 54, 26–36. [Google Scholar] [CrossRef]
- Kosyakov, V.I.; Sinyakova, E.F.; Distler, V.V. Experimental simulation of phase relationships and zoning of magmatic nickel–copper sulfide ores, Russia. Geol. Ore Depos. 2012, 54, 179–208. [Google Scholar] [CrossRef]
- Radko, V.A. The Facies of Intrusive and Effusive Magmatism in the Noril’sk Region; Cartographic Factory VSEGEI Press: St. Petersburg, Russia, 2016; p. 226. (In Russian) [Google Scholar]
- Duran, C.J.; Barnes, S.-J.; Pleše, P.; Kudrna Prašek, M.; Zientek, M.L.; Pagé, P. Fractional crystallization-induced variations in sulfides from the Noril’sk-Talnakh mining district (polar Siberia, Russia). Ore Geol. Rev. 2017, 90, 326–351. [Google Scholar] [CrossRef]
- Sluzhenikin, S.F.; Yudovskaya, M.A.; Barnes, S.J.; Abramova, V.D.; Vaillant, M.L.; Petrenko, D.B.; Grigor’eva, A.V.; Brovchenko, V.D. Low-Sulfide Platinum Group Element Ores of the Norilsk-Talnakh Camp. Econ. Geol. 2020, 115, 1267–1303. [Google Scholar] [CrossRef]
- Helmy, H.M.; Botcharnikov, R.; Ballhaus, C.; Deutsch-Zemlitskaya, A.; Wirth, R.; Schreiber, A.; Buhre, S.; Häger, T. Evolution of magmatic sulfide liquids: How and when base metal sulfides crystallize? Contrib. Mineral. Petrol. 2021, 176, 107. [Google Scholar] [CrossRef]
- Sittner, J.; Brovchenko, V.; Siddique, A.; Buyse, F.; Boone, M.; Renno, A.D.; Cnudde, V.; Merkulova, M.; Sluzhenikin, S.F. Three-dimensional distribution of platinum group minerals in natural MSS-ISS ores from the Norilsk One Deposit, Russia. Front. Earth Sci. 2022, 23, 860751. [Google Scholar] [CrossRef]
- Gorbachev, N.S.; Kostyuk, A.V.; Gorbachev, P.N.; Nekrasov, A.N.; Soultanov, D.M. Metal-Sulfide liquation of ore-forming melt in the Fe-Fe(NiCu)S-C system and its role in the genesis of magmatic sulfide deposits in the Norilsk Region (by experimental and geological data). Geol. Ore Depos. 2023, 65, 56–71. [Google Scholar] [CrossRef]
- Kosyakov, V.I.; Sinyakova, E.F. Physicochemical prerequisites for the formation of primary orebody zoning at copper-nickel sulfide deposits (by the example of the systems Fe–Ni–S and Cu–Fe–S). Russ. Geol. Geoph. 2012, 53, 861–882. [Google Scholar] [CrossRef]
- Genkin, A.D.; Evstigneyeva, T.L. Associations of platinum-group minerals of the Noril’sk cooper-nickel sulfide ores. Econ. Geol. 1986, 81, 1203–1212. [Google Scholar] [CrossRef]
- Leblanc, M.; Gervilla, F.; Jedwab, J. Noble metals segregation and fractionation in magmatic ores from Ronda and Beni Bousera lherzolite massifs (Spain, Morroco). Miner. Petrol. 1990, 42, 233–248. [Google Scholar] [CrossRef]
- Czamanske, G.K.; Kunilov, V.E.; Zientek, M.L.; Cabri, L.J.; Likchachev, A.P.; Calk, L.C.; Oscarson, R. A proton-microprobe study of magmatic sulfide ores from the Noril’sk-Talnakh district, Siberia. Can. Mineral. 1992, 30, 249–287. [Google Scholar]
- Gervilla, F.; Leblanc, M.; Torres-Ruiz, J.; Hach-Ali, P.F. Immiscibility between arsenide and sulfide melts: A mechanism for the concentration of noble metals. J. Mineral. Assoc. Can. 1996, 34, 485–502. [Google Scholar]
- Gervilla, F.; Papunen, H.; Kojonen, K.; Johanson, B. Platinum, palladium and gold-rich arsenic ores from the Kylmakoski Ni-Cu deposit. Mineral. Petrol. 1998, 64, 163–185. [Google Scholar] [CrossRef]
- Dare, S.A.S.; Barnes, S.-J.; Prichard, H.M.; Fisher, P.C. Chalcophile and platinum-group element (PGE) concentrations in the sulfide minerals from the McCreedy East deposit, Sudbury, Canada, and the origin of PGE in pyrite. Mineral. Depos. 2011, 46, 381–407. [Google Scholar] [CrossRef]
- Dare, S.A.S.; Barnes, S.-J.; Prichard, H.M.; Fisher, P.C. Mineralogy and geochemistry of Cu-Rich ores from the McCreedy East Ni-Cu-PGE deposit (Sudbury, Canada): Implications for the behavior of platinum group and chalcophile elements at the end of crystallization of a sulfide liquid. Econ. Geol. 2014, 109, 343–366. [Google Scholar] [CrossRef]
- Barnes, S.-J.; Ripley, E.M. Highly siderophile and strongly chalcophile elements in magmatic ore deposits. Rev. Miner. Geochem. 2016, 81, 725–774. [Google Scholar] [CrossRef]
- Dare, S.A.S.; Barnes, S.J.; Prichard, H.M. The distribution of platinum group elements (PGE) and other chalcophile elements among sulfides from the Creighton Ni-Cu-PGE sulfide deposit, Sudbury, Canada, and the origin of palladium in pentlandite. Mineral. Depos. 2010, 45, 765–793. [Google Scholar] [CrossRef]
- Makovicky, E. Ternary and quaternary phase systems with PGE. In The Geology, Geochemistry, Mineralogy and Mineral Beneficiation of Platinum-Group Elements; Canadian Institute of Mining, Metallurgy and Petroleum: Montreal, QC, Canada, 2002; Volume 54, pp. 131–175. [Google Scholar]
- Vymazalova, A.; Laufek, F.; Kristavchuk, A.V.; Drabek, M. The system Ag–Pd–Te phase relation and mineral assemblages. Mineral. Mag. 2015, 79, 1813–1832. [Google Scholar] [CrossRef]
- Evstigneeva, P.; Nickolsky, M.S.; Geringer, N.; Vymazalova, A.; Nekrasov, A.N.; Chareev, D.A. Pt- and Pd-bismuthotellurides: Phase relations in the Pt-Bi-Te and Pd-Bi-Te systems. In Life with Ore Deposits on Earth, Proceedings of the 15th SGA Biennial Meeting; Society for Geology Applied to Mineral Deposits (SGA): Glasgow, Scotland, 2019; pp. 1804–1807. [Google Scholar]
- Helmy, H.M.; Ballhaus, C.; Berndt, J.; Bockrath, C.; Wohlgemuth-Ueberwasser, C. Formation of Pt, Pd and Ni tellurides: Experiments in sulfide-telluride systems. Contrib. Mineral. Petrol. 2007, 153, 557–591. [Google Scholar] [CrossRef]
- Helmy, H.M.; Ballhaus, C.; Wohlgemuth-Ueberwasser, C.; Fonseca, R.O.C.; Laurenz, V. Partitioning of Se, As, Sb, Te and Bi between monosulfide solid solution and sulfide melt—Application to magmatic sulfide deposits. Geochim. Cosmochim. Acta 2010, 74, 6174–6179. [Google Scholar] [CrossRef]
- Helmy, H.M.; Ballhaus, C.; Fonseca, R.O.C.; Wirth, R.; Nagel, T.J.; Tredoux, M. Noble metal nanoclusters and nanoparticles precede mineral formation in magmatic sulfide melts. Nat. Commun. 2013, 4, 2405. [Google Scholar] [CrossRef] [PubMed]
- Helmy, H.M.; Ballhaus, C.; Fonseca, R.O.C.; Nagel, T.J. Fractionation of platinum, palladium,nickel, and copper in sulfide-arsenide system at magmatic temperature. Contrib. Mineral. Petrol. 2013, 166, 1725–1737. [Google Scholar] [CrossRef]
- Helmy, M.; Botcharnikov, R. Experimental determination of the phase relations of Pt and Pd antimonides and bismuthinides in the Fe-Ni-Cu sulfide systems between 1100 and 700 °C. Am. Mineral. 2020, 105, 344–352. [Google Scholar] [CrossRef]
- Holwell, D.A.; McDonald, I. Distribution of platinum-group elements in the Platreef at Overysel, northern Bushveld Complex: A combined PGM and LA-ICP-MS study. Contr. Miner. Petrol. 2007, 154, 171–190. [Google Scholar] [CrossRef]
- Sinyakova, E.F.; Kosyakov, V.I. The behavior of noble-metal admixtures during fractional crystallization of As- and Co-containing Cu–Fe–Ni sulfide melts. Russ. Geol. Geophys. 2012, 53, 1055–1076. [Google Scholar] [CrossRef]
- Distler, V.V.; Sinyakova, E.F.; Kosyakov, V.I. Behavior of noble metals upon fractional crystallization of copper-rich sulfide melts. Dokl. Earth Sci. 2016, 469, 811–814. [Google Scholar] [CrossRef]
- Sinyakova, E.; Kosyakov, V.; Distler, V.; Karmanov, N. Behavior of Pt, Pd, and Au during crystallization of Cu-rich magmatic sulfides. Can. Mineral. 2016, 54, 491–509. [Google Scholar] [CrossRef]
- Sinyakova, E.F.; Kosyakov, V.I.; Goryachev, N.A. Formation of drop-shaped inclusions based on Pt, Pd, Au, Ag, Bi, Sb, Te, and As under crystallization of an intermediate solid solution in the Cu–Fe–Ni–S system. Dokl. Earth Sci. 2019, 489, 1301–1305. [Google Scholar] [CrossRef]
- Sinyakova, E.; Kosyakov, V.; Palyanova, G.; Karmanov, N. Experimental modeling of noble and chalcophile elements fractionation during solidification of Cu-Fe-Ni-S melt. Minerals 2019, 9, 531. [Google Scholar] [CrossRef]
- Sinyakova, E.F.; Kosyakov, V.I.; Borisenko, A.S.; Karmanov, N.S. Behavior of noble metals during fractional crystallization of Cu–Fe–Ni–(Pt, Pd, Rh, Ir, Ru, Ag, Au, Te) sulfide melts. Russ. Geol. Geophys. 2019, 60, 642–651. [Google Scholar] [CrossRef]
- Sinyakova, E.F.; Vasilyeva, I.G.; Oreshonkov, A.S.; Goryainov, S.V.; Karmanov, N.S. Formation of noble metal phases (Pt, Pd, Rh, Ru, Ir, Au, Ag) in the process of fractional crystallization of the CuFeS2 melt. Minerals 2022, 12, 1136. [Google Scholar] [CrossRef]
- Kosyakov, V.I.; Sinyakova, E.F. Study of crystallization of nonstoichiometric isocubanite Cu1.1Fe2.0S3.0 from melt in the system Cu–Fe–S. J. Therm. Anal. Calorim. 2017, 129, 623–628. [Google Scholar] [CrossRef]
- Distler, V.V. Platinum mineralization of the Noril’sk deposits. In Book Geology and Genesis of Platinoid Deposits; Nauka: Moscow, Russia, 1994; pp. 7–35. (In Russian) [Google Scholar]
- Kosyakov, V.I.; Sinyakova, E.F. Directional crystallization of Fe–Ni sulfide melts within the crystallization field of monosulfide solid solution. Geochem. Int. 2005, 43, 372–385. [Google Scholar]
- Kosyakov, V.I. Topological analysis of the melting diagram of the Cu-Fe-S system. Russ. J. Inorg. Chem. 2008, 53, 946–951. [Google Scholar] [CrossRef]
- Fleet, M.E.; Chryssoulis, S.L.; Stone, W.E.; Weisener, C.G. Partitioning of platinum-group elements and Au in the Fe-Ni-Cu-S system: Experiments on the fractional crystallization of sulfide melt. Contrib. Mineral. Petrol. 1993, 115, 36–44. [Google Scholar] [CrossRef]
- Ballhaus, C.; Tredoux, M.; Spath, A. Phase relations in the Fe–Ni–Cu–PGE–S system at magmatic temperature and application to massive sulphide ores of the Sudbury Igneous Complex. J. Petrol. 2001, 42, 1911–1926. [Google Scholar] [CrossRef]
- Mungall, J.E.; Andrews, D.R.A.; Cabri, L.J.; Sylvester, P.J.; Tubrett, M. Partitioning of Cu, Ni, Au, and platinum-group elements between monosulfide solid solution and sulfide melt under controlled oxygen and sulfur fugacities. Geoch. Cosmochim. Acta 2005, 69, 4349–4360. [Google Scholar] [CrossRef]
- Liu, Y.; Brenan, J. Partitioning of platinum-group elements (PGE) and chalcogens (Se, Te, As, Sb, Bi) between monosulfide-solid solution (MSS), intermediate solid solution (ISS) and sulfide liquid at controlled fO2–fS2 conditions. Geochim. Cosmoch. Acta 2015, 159, 139–161. [Google Scholar] [CrossRef]
- Lidsay, N.M.; Sellschop, J.P.F. Routine SIMS microanalysis: Trace Au and Pt sulphides. Nucl. Instr. Meth. Phys. Res. 1988, B35, 358–363. [Google Scholar] [CrossRef]
- Majzlan, J.; Makovicky, M.; Makovicky, E.; Rose-Hansen, J. The system Fe–Pt–S at 1100 °C. Can. Mineral. 2002, 40, 509–517. [Google Scholar] [CrossRef]
- Effenberg, G.; Ilyenko, S. (Eds.) Noble Metal Systems. Selected Systems from Ag-Al-Zn to Rh-Ru-Sc, Landolf-Börnstein—Group IV; Physical Chemistry; Springer: Berlin/Heidelberg, Germany, 2006; Volume 11B, Available online: https://www.springer.com/kr/book/9783540257721 (accessed on 20 October 2011).
- Durussel, P.; Feschotte, P. Les Systèmes Binaires Pd Sb et Pt Sb. J. Alloys Compd. 1991, 176, 173–181. [Google Scholar] [CrossRef]
- Kim, W.-S.; Chao, G.Y. Phase relations in the system Pt-Sb-Te. Canad. Mineral. 1990, 28, 675–685. [Google Scholar]
- Okamoto, H. The Bi-Pt (Bismuth-Platinum) System. J. Phase Equilib. 1991, 12, 207–210. [Google Scholar] [CrossRef]
- Okamoto, H. The Pd-Te System (Palladium-Tellurium). J. Phase Equilib. 1992, 13, 73–78. [Google Scholar] [CrossRef]
- Okamoto, H. The Bi-Pd (Bismuth-Palladium) System. J. Phase Equil. 1994, 15, 191–194. [Google Scholar] [CrossRef]
- Hoffman, E.; Maclean, W.H. Phase relation of micheneriteand merenskyite in the Pd-Bi-Te system. Econ. Geol. 1976, 71, 1461–1468. [Google Scholar] [CrossRef]
- Okamoto, H. Pd-Te (Palladium-Tellurium). J. Phase Equilib. Diffus. 2013, 34, 72–73. [Google Scholar] [CrossRef]
- Massalski, T.B. Binary Alloy Phase Diagrams, 2nd ed.; ASM International, Materials Park: Materials Park, OH, USA, 1990; p. 3589. [Google Scholar]
- Kracek, F.C.; Ksanda, C.J.; Cabri, L.J. Phase relations in the silver-tellurium system. Am. Mineralogist. 1966, 51, 14–28. [Google Scholar] [CrossRef]
- Hasanova, G.S.; Aghazade, A.I.; Imamaliyeva, S.Z.; Yusibov, Y.A.; Babanly, M.B. Refinement of the Phase Diagram of the Bi-Te System and the Thermodynamic Properties of Lower Bismuth Tellurides. Miner. Met. Mater. Soc. 2021, 73, 1511–1521. [Google Scholar] [CrossRef]
- Cabri, L.J. The platinum-group minerals. In The geology, geochemistry, mineralogy and mineral beneficiation of platinum-group elements. Can. Inst. Min. Metall. Pet. 2002, 54, 13–129. [Google Scholar]
- Makovicky, E.; Karup-Møller, S.; Makovicky, M.; Rose-Hansen, J. Experimental studies on the phase systems Fe–Ni–Pd–S and Fe–Pt–Pd–As–S applied to PGE deposits. Mineral. Petrol. 1990, 42, 307–319. [Google Scholar] [CrossRef]
- Makovicky, M.; Makovicky, E.; Rose-Hansen, J. The phase system Pt–Fe–As–S at 850 °C and 470 °C. Neues Jahrb. Mineral. Monatshefte 1992, 10, 441–453. [Google Scholar]
- Teppo, O.; Niemela, J.; Taskinen, P. An assessment of the thermodynamic properties and phase diagram of the system Bi-Cu. Thermochim. Acta 1990, 173, 137–150. [Google Scholar] [CrossRef]
- Cafagna, F.; Jugo, P.J. An experimental study on the geochemical behavior of highly siderophile elements (HSE) and metalloids (As, Se, Sb, Te, Bi) in a mss-iss-pyrite system at 650 °C: A possible magmatic origin for Co-HSE-bearing pyrite and the role of metalloid-rich phases in the fractionation of HSE. Geochim. Cosmochim. Acta 2016, 178, 233–258. [Google Scholar]
- Gervilla, F. The system Pd–Ni–As at 790 and 450 °C. Econ. Geol. 1994, 89, 1630–1639. [Google Scholar] [CrossRef]
- Hanley, J. The role of arsenidc-rich melts and mineral phases in the development of high-grade Pt-Pd mineralization within komatiite-associated magmatic Ni-Cu sulfide horizons at Dundonald Beach South, Abitibi Subprovince, Ontario, Canada. Econ. Geol. 2007, 102, 307–317. [Google Scholar] [CrossRef]
- Kozyrev, S.M.; Komarova, M.Z.; Emelina, L.N.; Oleshkevich, O.I.; Yakovleva, O.A.; Lyalinov, D.V.; Maximov, V.I. The mineralogy and behavior of PGM during processing of the Noril’sk-Talnakh PGE-Cu-Ni ores. In The Geology, Geochemistry, Mineralogy and Mineral Beneficiation of Platinum-Group Elements; Canadian Institute of Mining, Metallurgy and Petroleum: Montreal, QC, Canada, 2002; Volume 54, pp. 757–775. [Google Scholar]
- Sinyakova, E.F.; Kosyakov, V.I.; Kolonin, G.R. Behavior of PGE on crystallization of melts of the system Fe–Ni–S (FexNi0.49-xS0.51 section). Russ. Geol. Geophys. 2001, 9, 1287–1304. [Google Scholar]
- Ryabov, V.V.; Shevko AYa Gora, M.P. Magmatic Formations in the Noril’sk District. Vol. 1. of Trapp Petrology; Nonparel Publisher: Novosibirsk, Russia, 2001; p. 408. (In Russian) [Google Scholar]
- Marakushev, A.A.; Paneyakh, N.A.; Zotov, I.A. Petrological model for the formation of Noril’sk copper–nickel deposits. Petrologiya 2003, 11, 524–544. (In Russian) [Google Scholar]
Disclaimer/Publisher’s Note: The statements, opinions and data contained in all publications are solely those of the individual author(s) and contributor(s) and not of MDPI and/or the editor(s). MDPI and/or the editor(s) disclaim responsibility for any injury to people or property resulting from any ideas, methods, instructions or products referred to in the content. |
© 2023 by the authors. Licensee MDPI, Basel, Switzerland. This article is an open access article distributed under the terms and conditions of the Creative Commons Attribution (CC BY) license (https://creativecommons.org/licenses/by/4.0/).