
Native Gold and Unique Gold–Brannerite Nuggets from the Placer of the Kamenny Stream, Ozerninsky Ore Cluster (Western Transbakalia, Russia) and Possible Sources

 , , ,
, , ,
Abstract
1. Introduction
1.1. Brief Description of the Geological Structure of the Ozerninsky Ore Cluster
1.2. Geological Structure of the Kamenny Stream Placer Deposit
- Soil–vegetation layer with blocks, boulders, pebbles, crushed stone, gruss of volcanic rocks and granites (thickness—0–0.4 m);
- Boulder–block deposits with pebbles, crushed stone, gruss and gravel, cemented by dark brown, brown, reddish brown loam soil (thickness—1.0–2.5 m);
- Blocks, weakly rounded boulders, crushed stone in brown loam soil (thickness—0–2.5 m);
- Sand–gravel–pebble deposits in brown and dark brown loam soil, representing a productive layer (thickness—0.4–3.6 m).

2. Materials and Methods
2.1. Sampling
2.2. Optical and Scanning Electron Microscopy
2.3. Raman Spectroscopy
2.4. Measurement of δ13C Signatures
3. Results
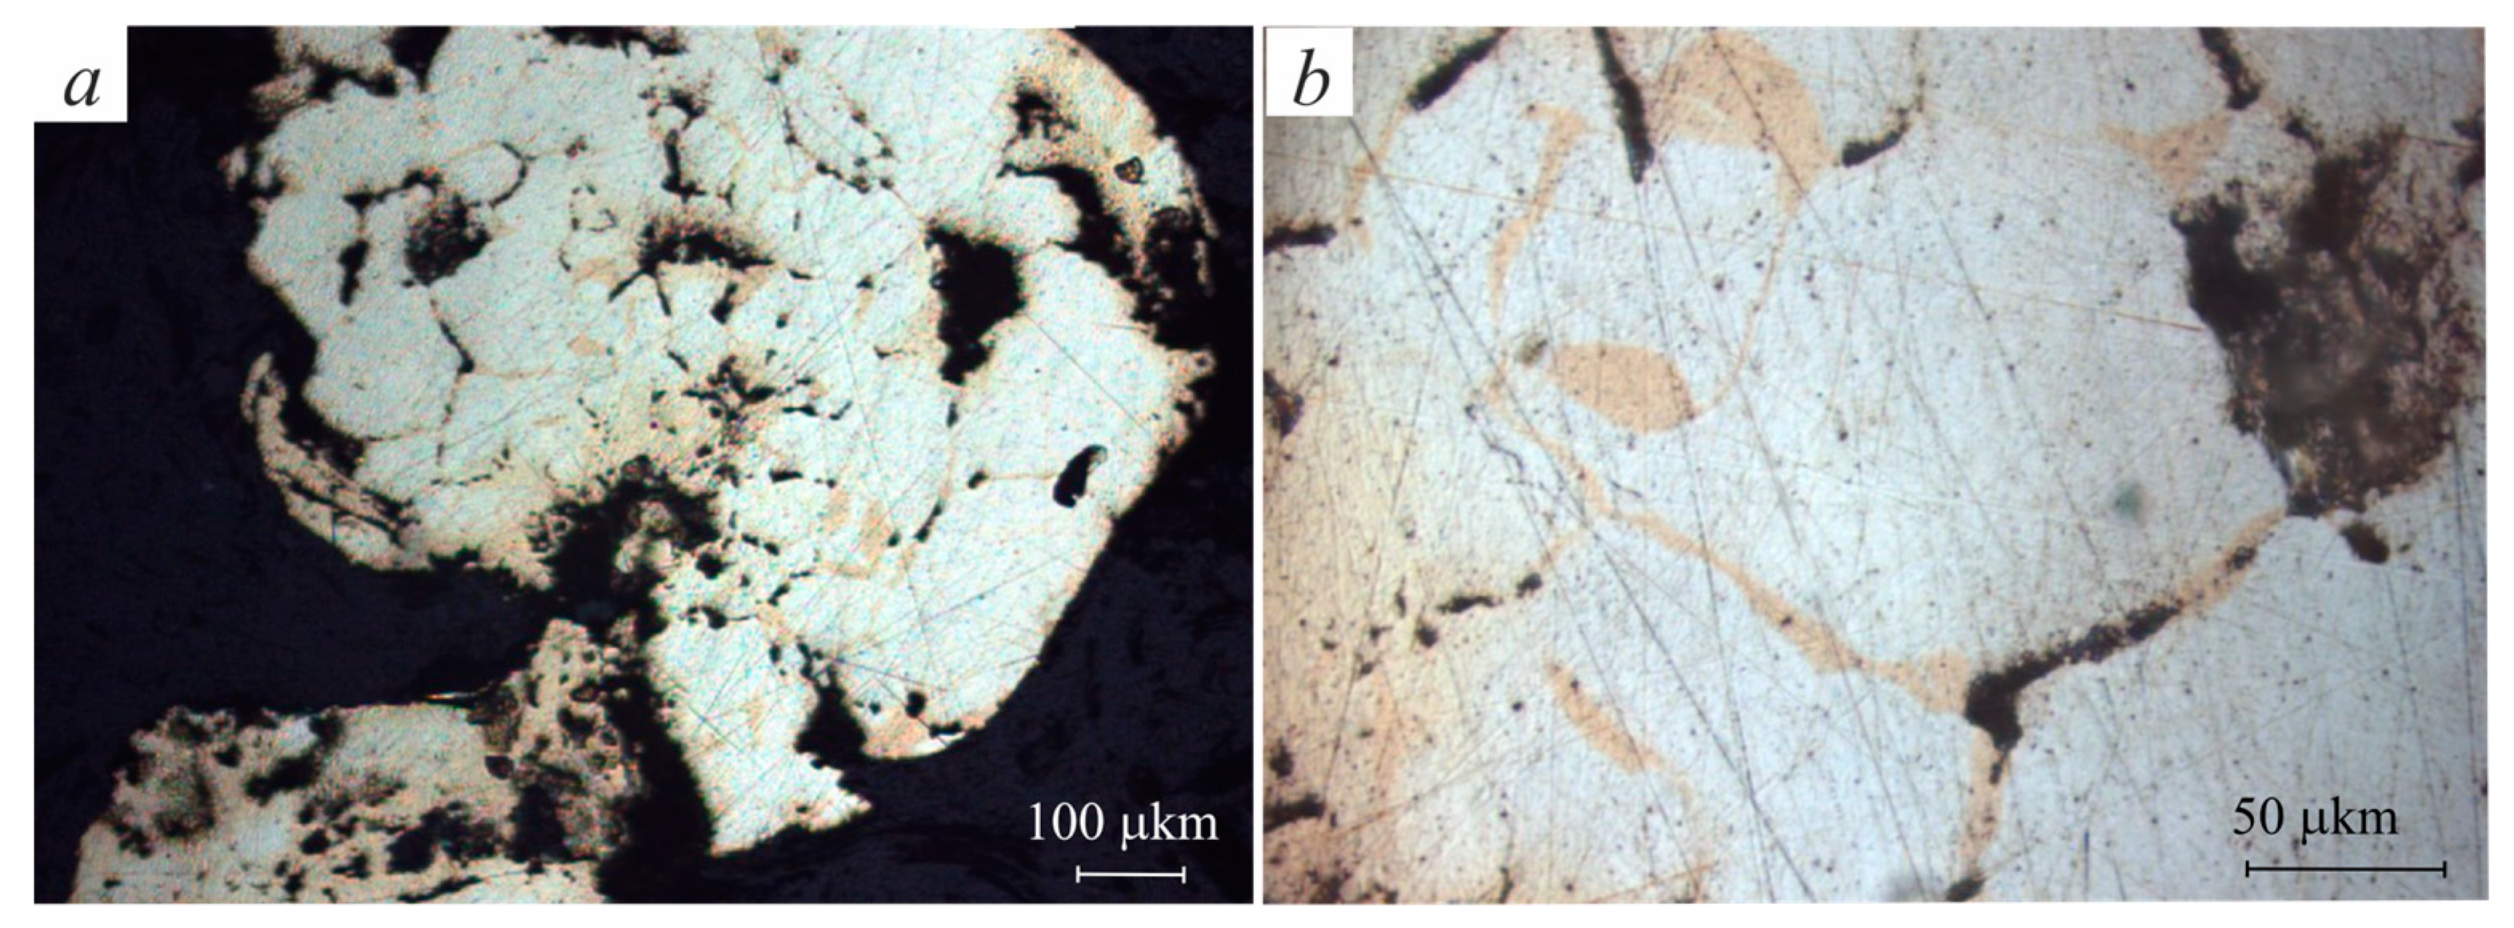
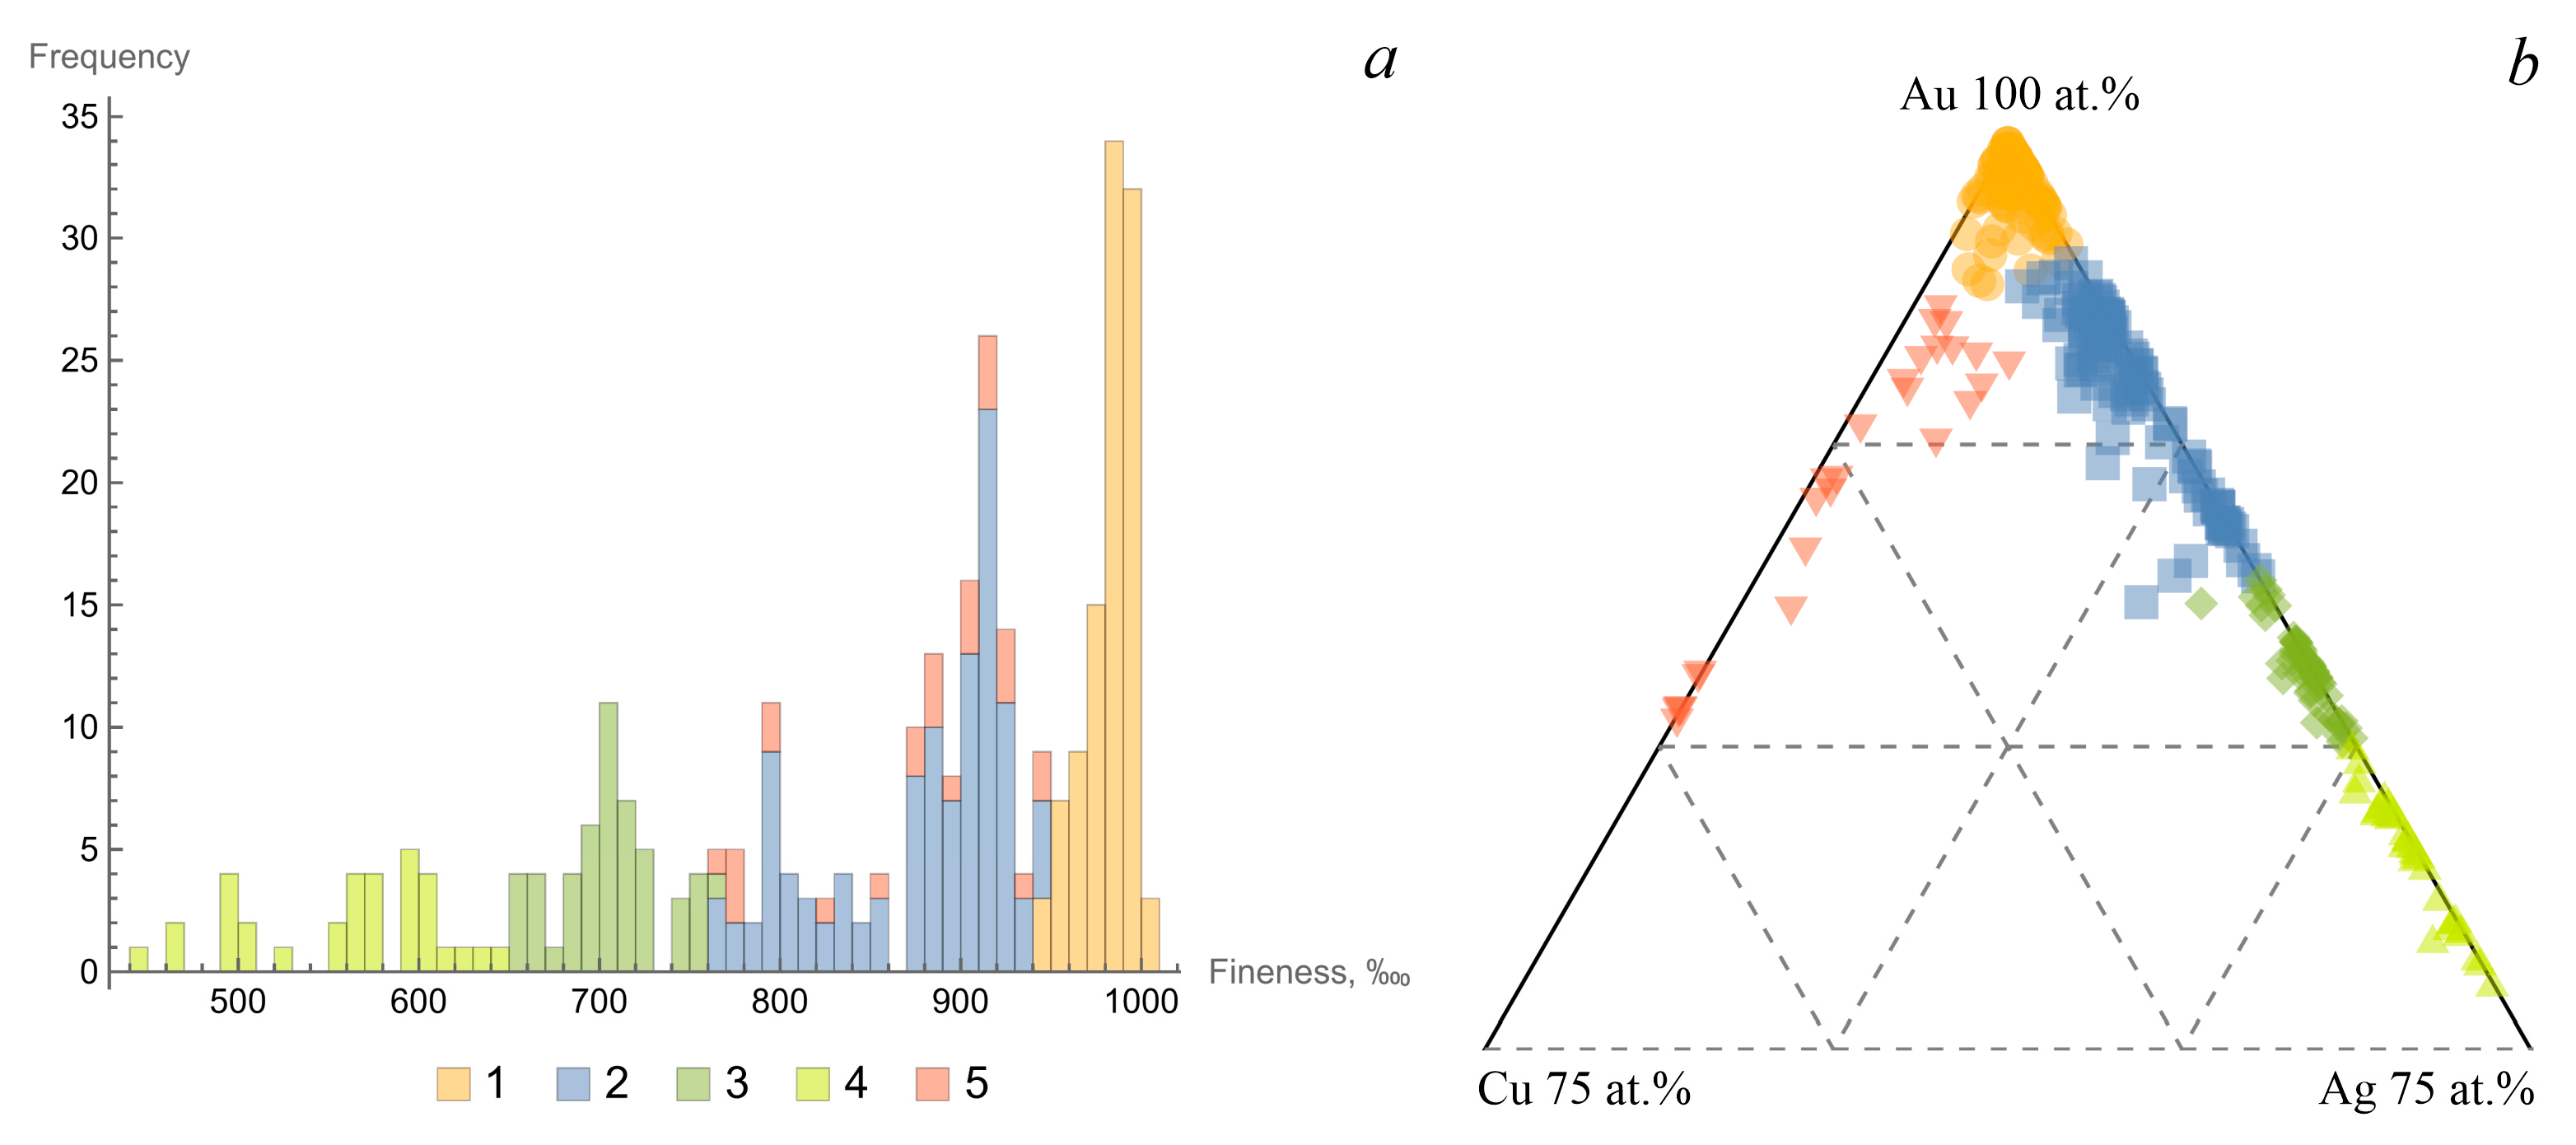
3.1. Typomorphic Features of Native Gold
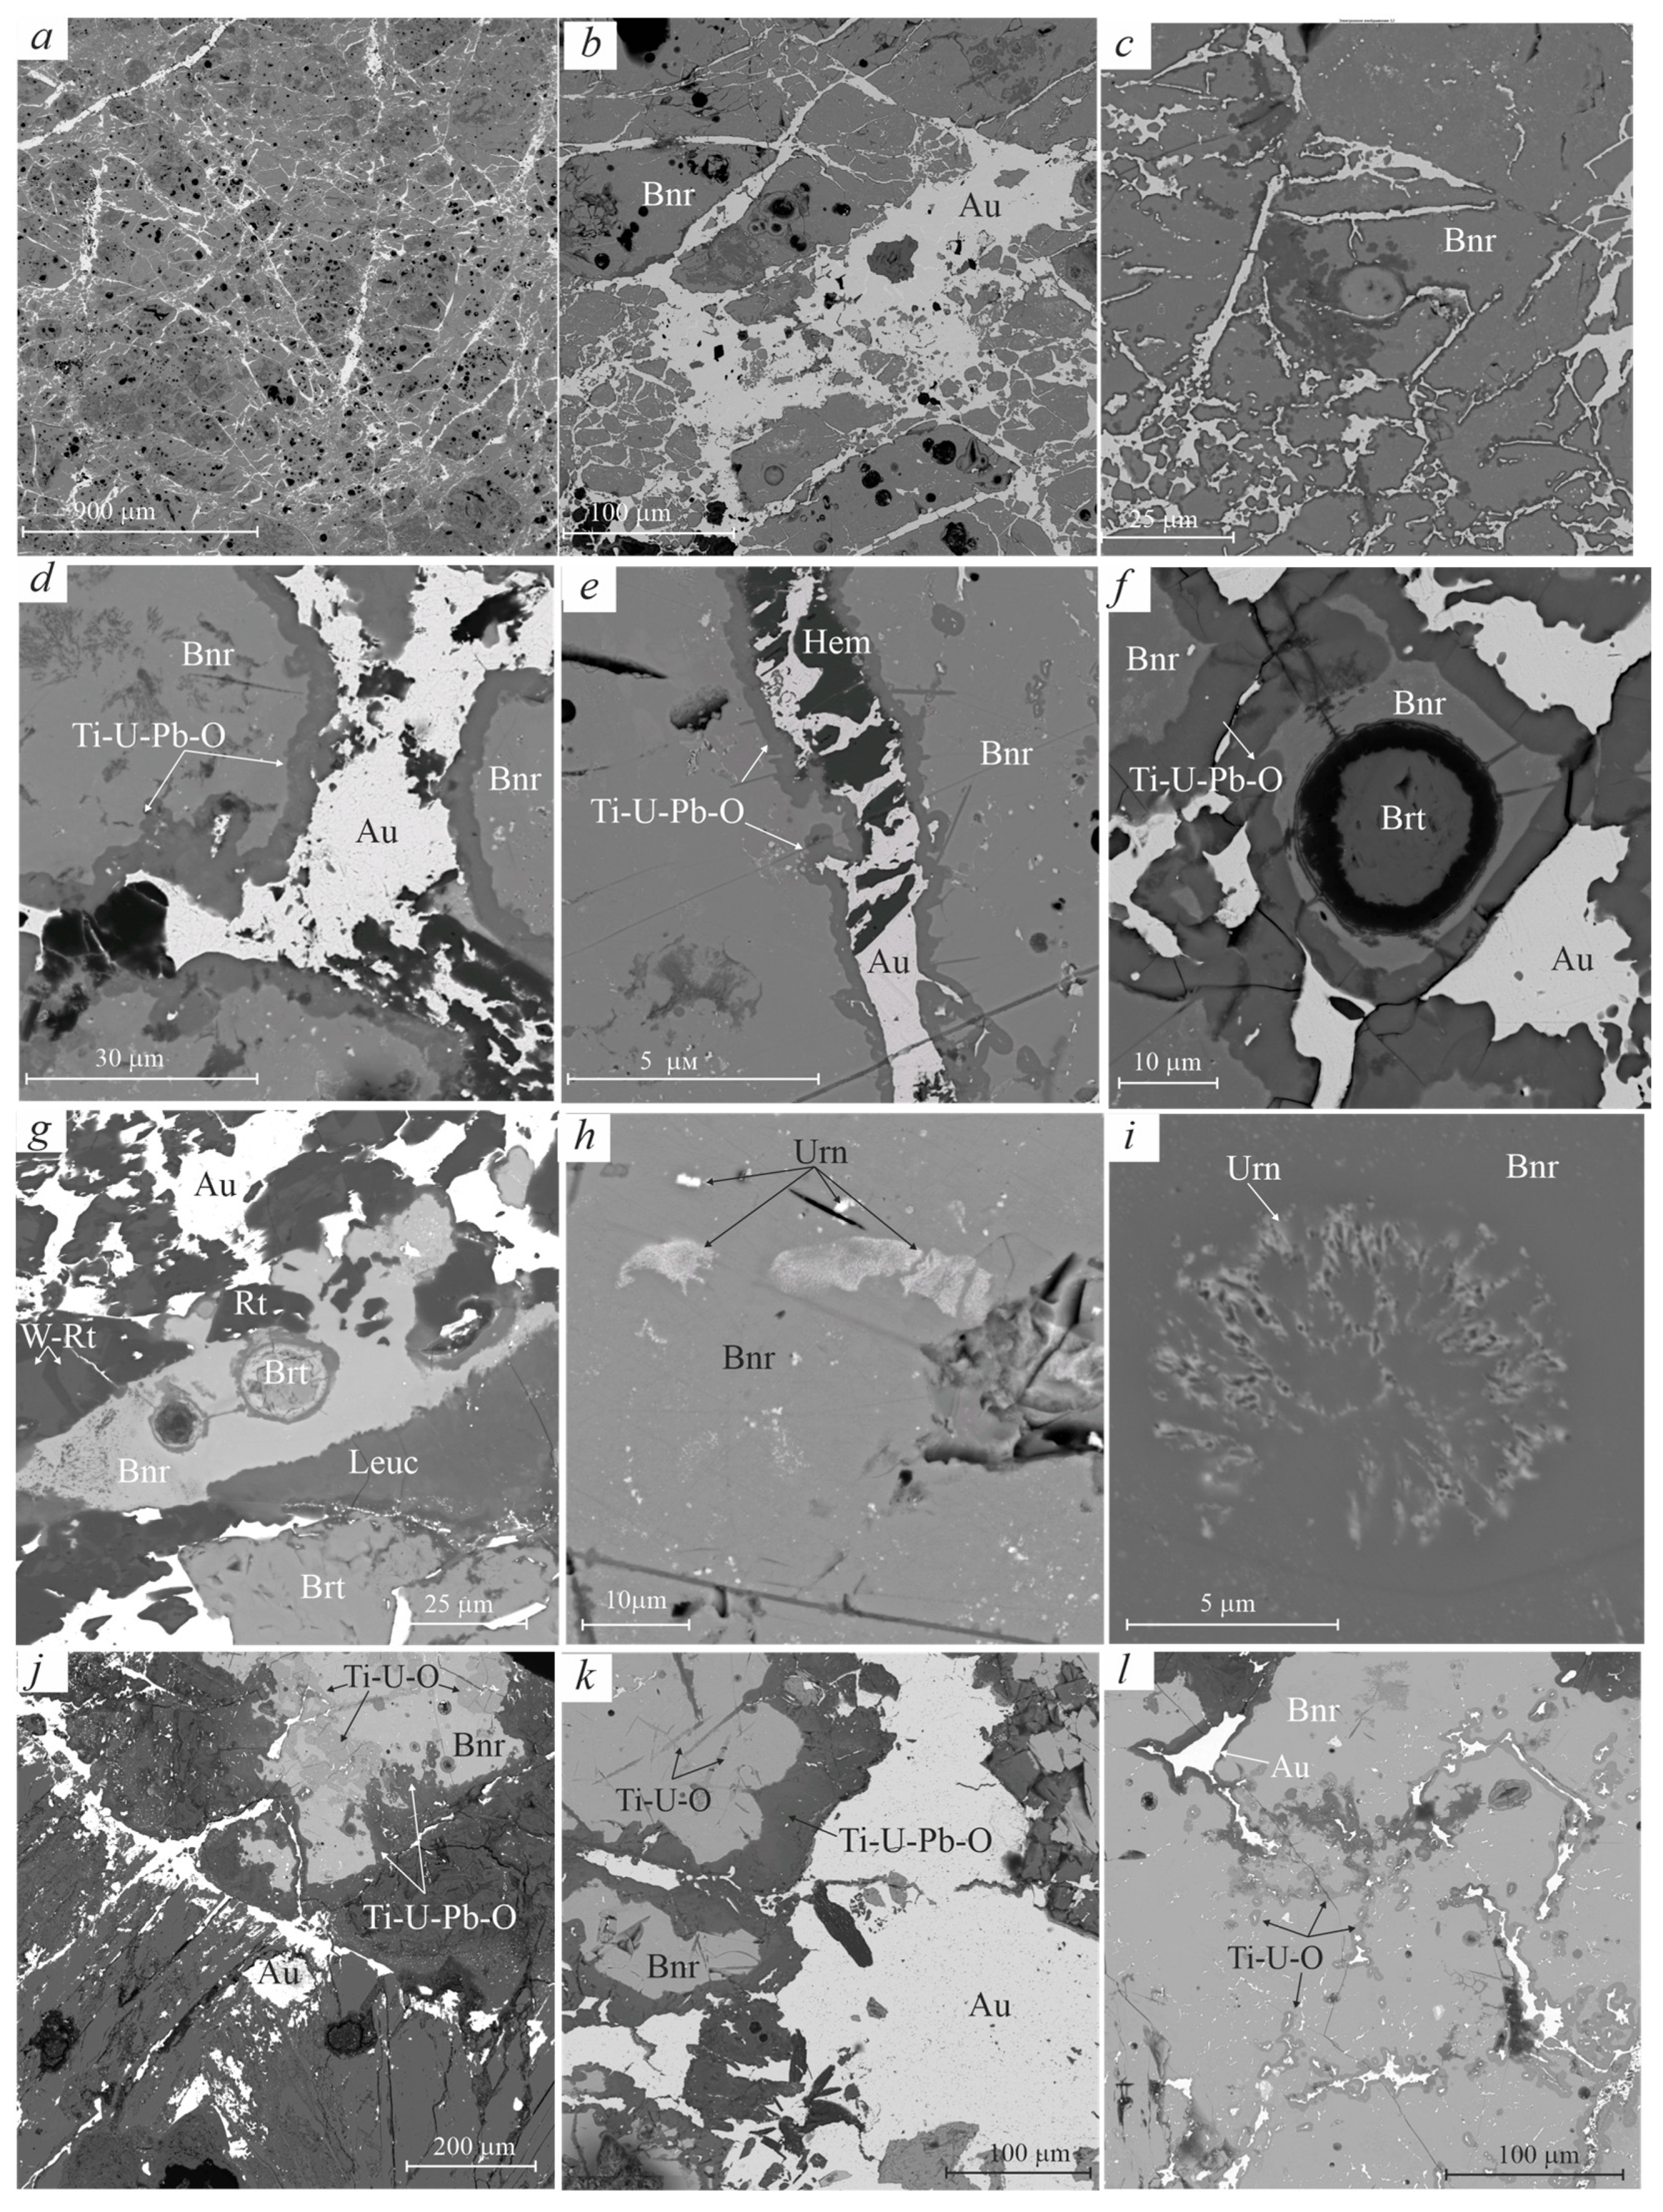
3.2. Morphologic Features of Gold-Brannerite Nuggets
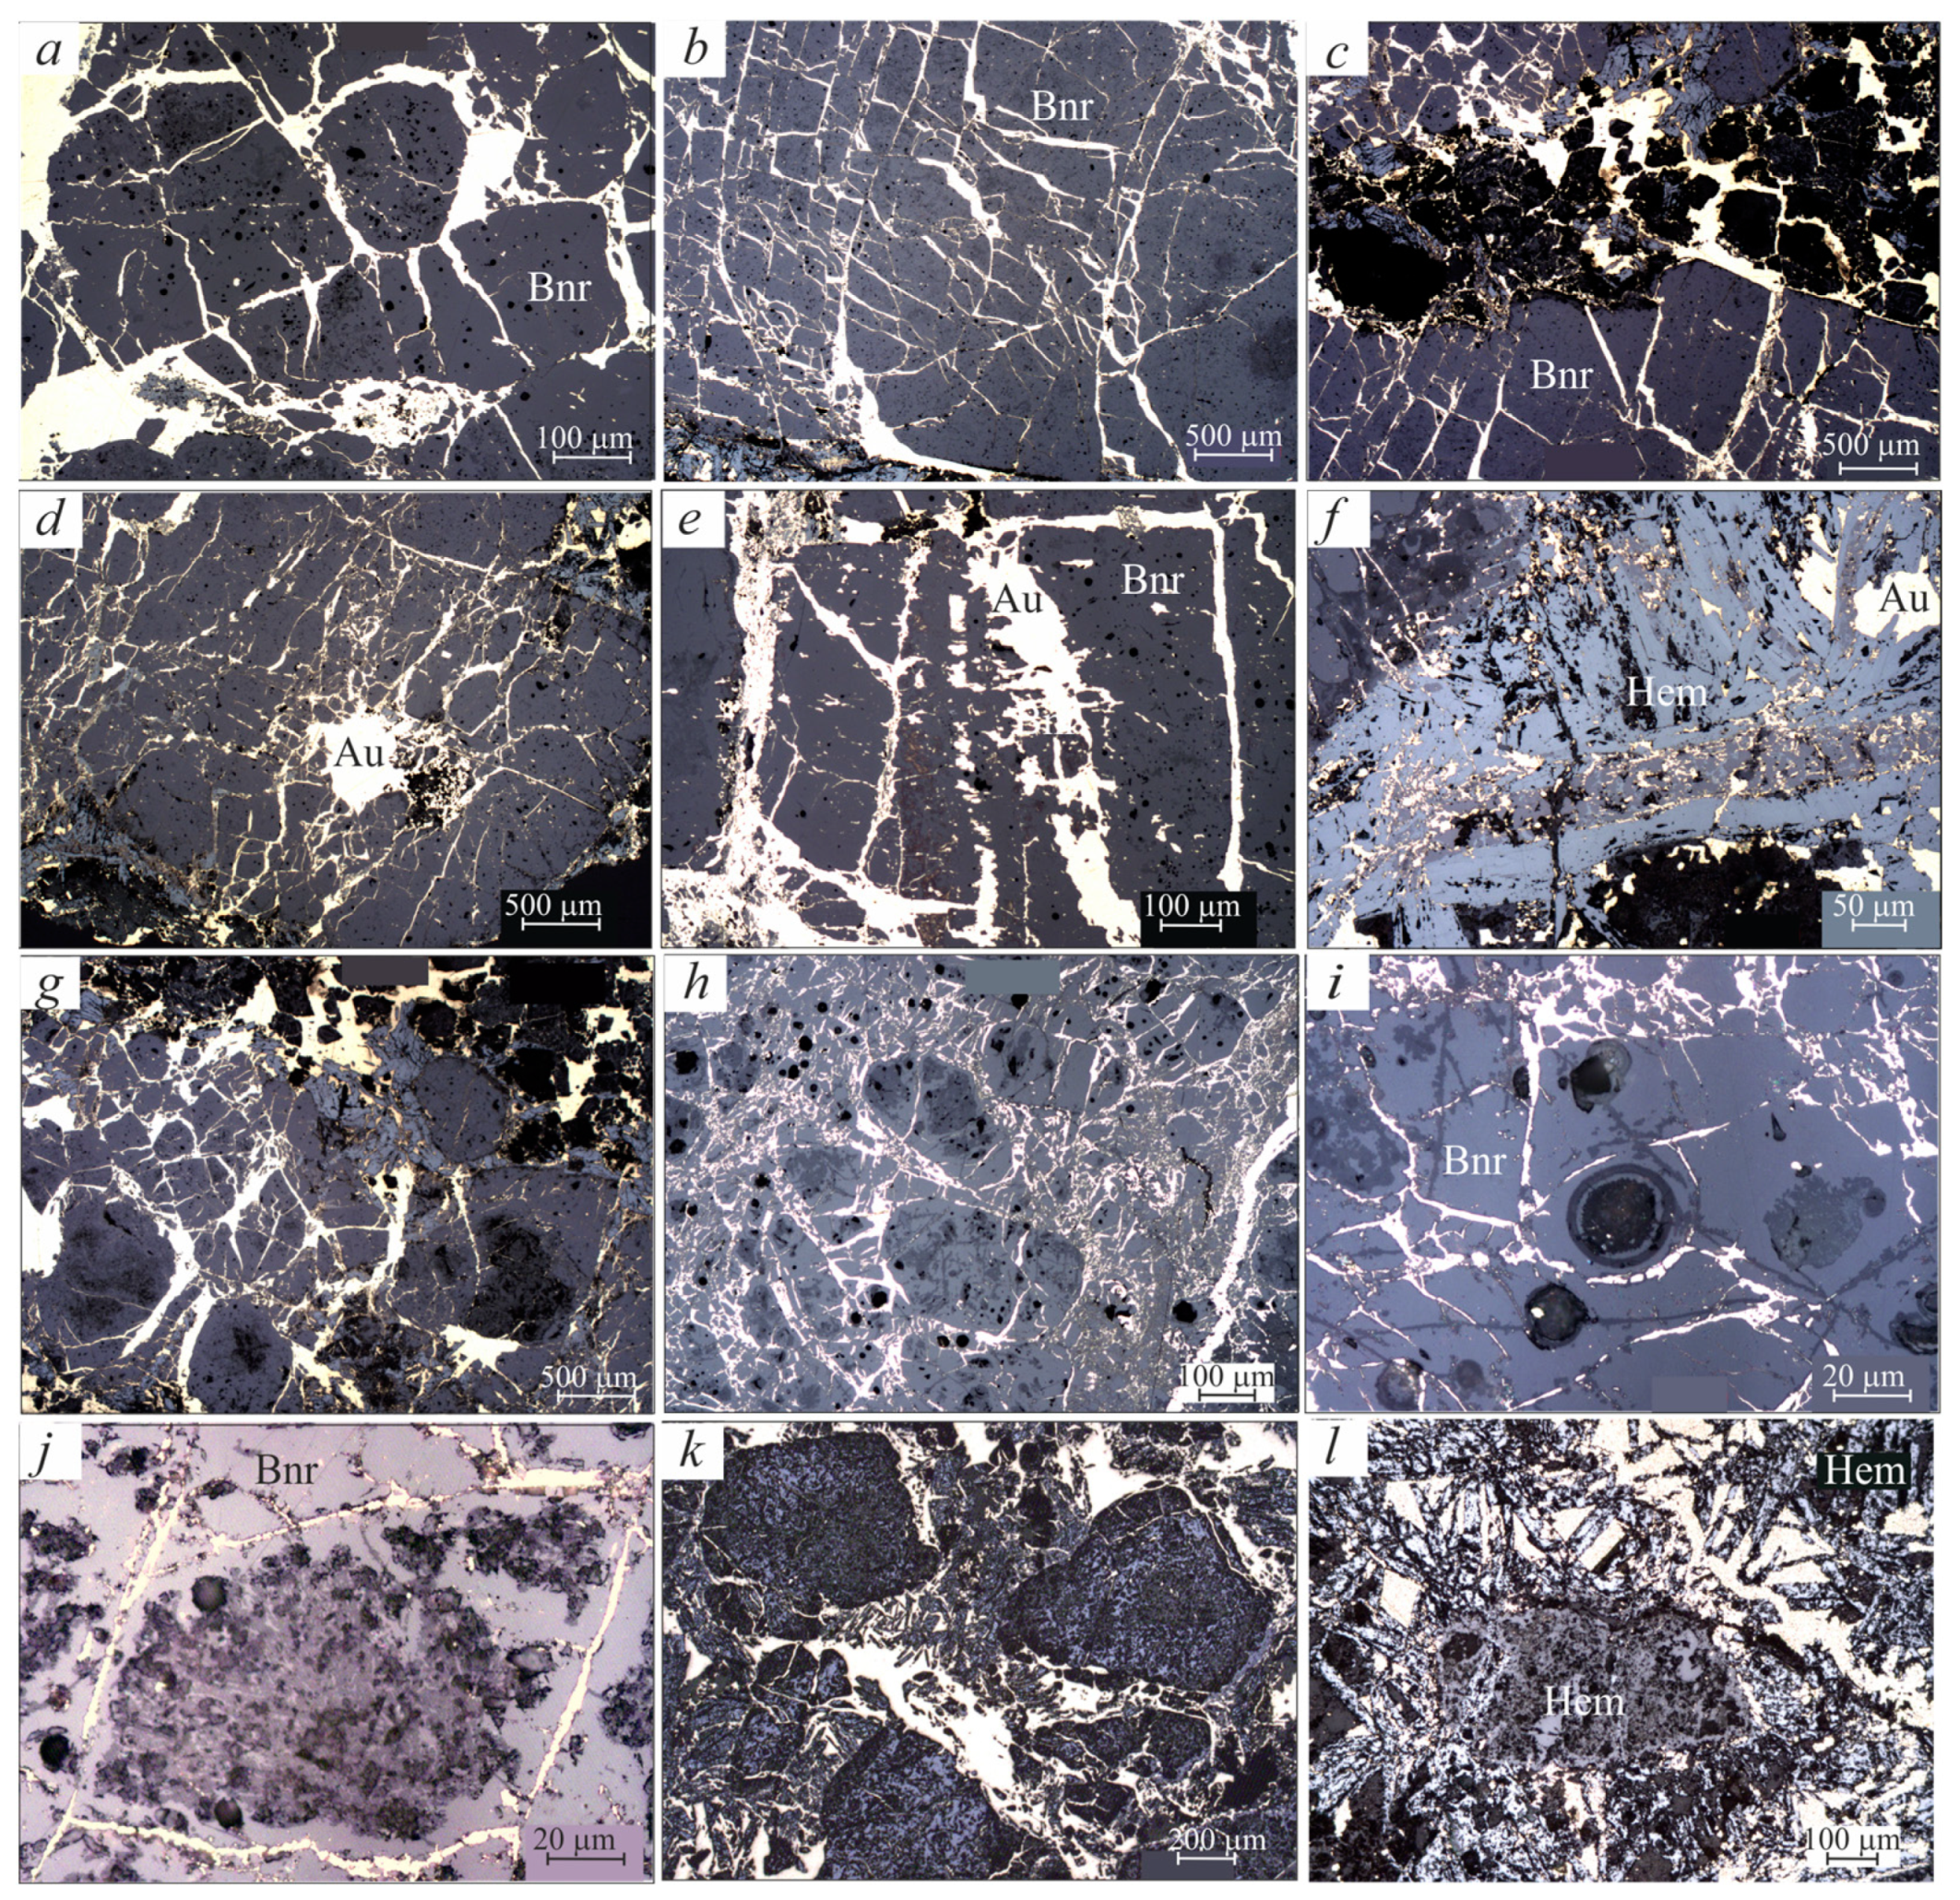
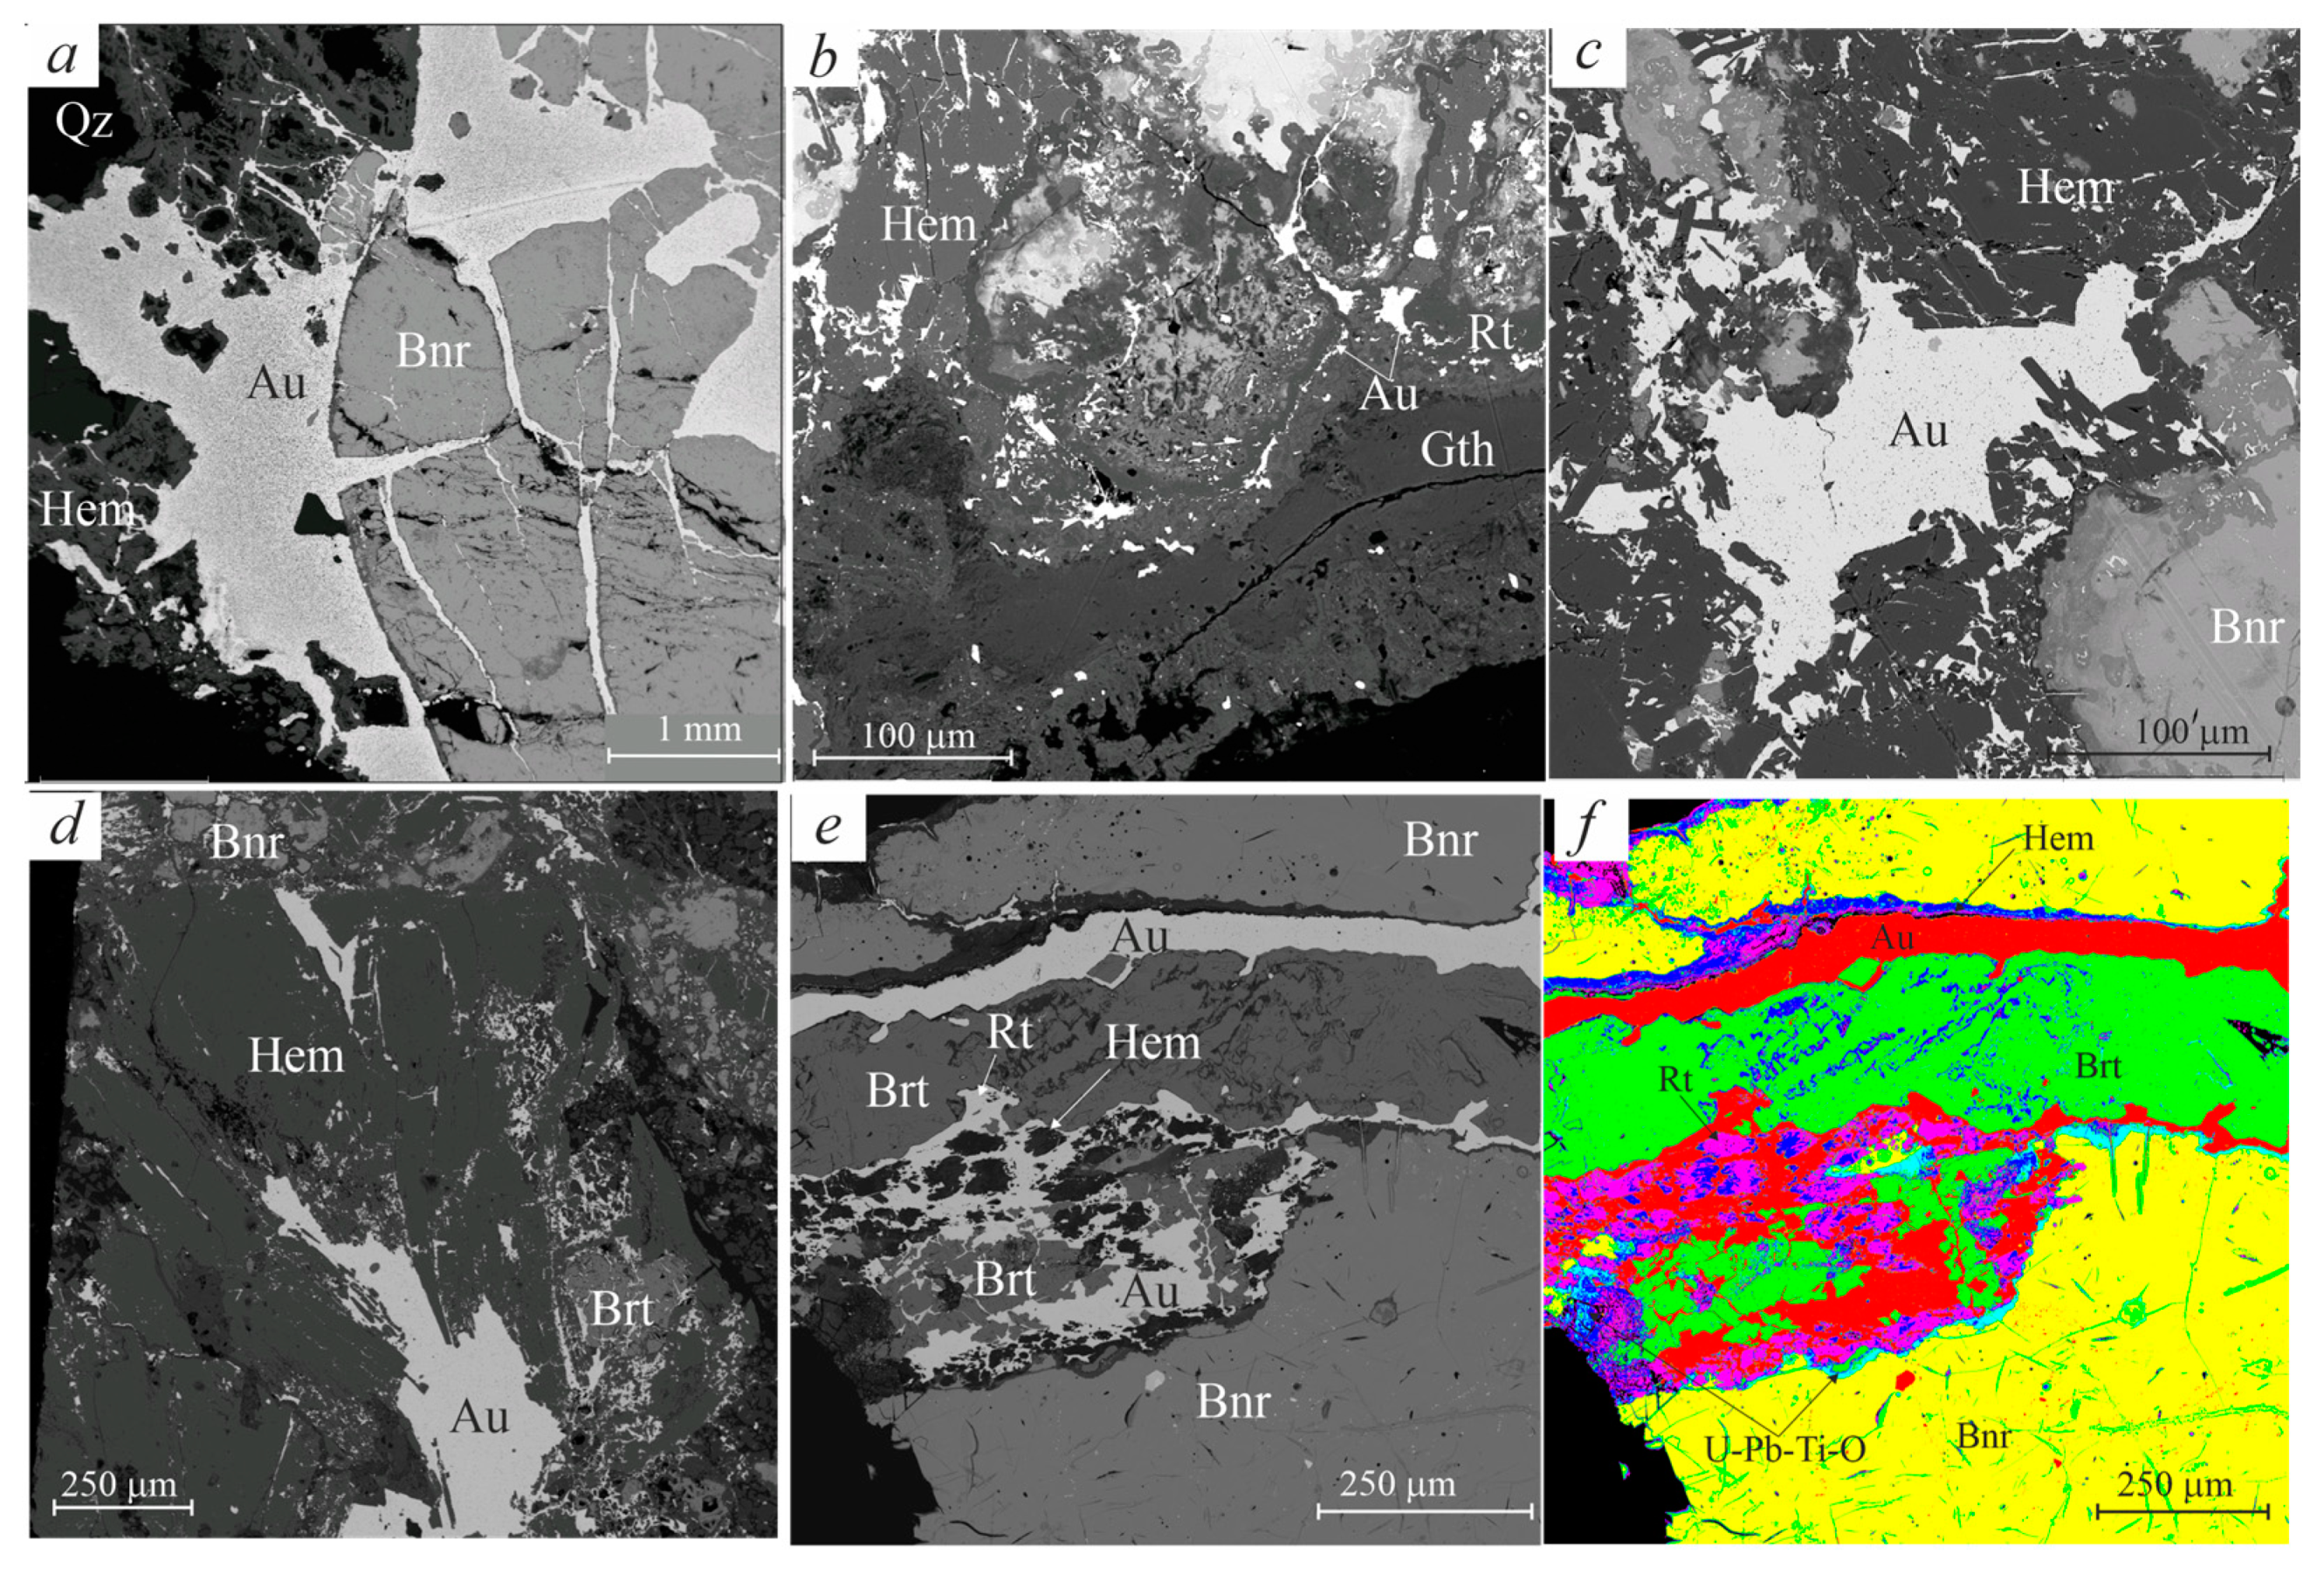
3.2.1. Gold
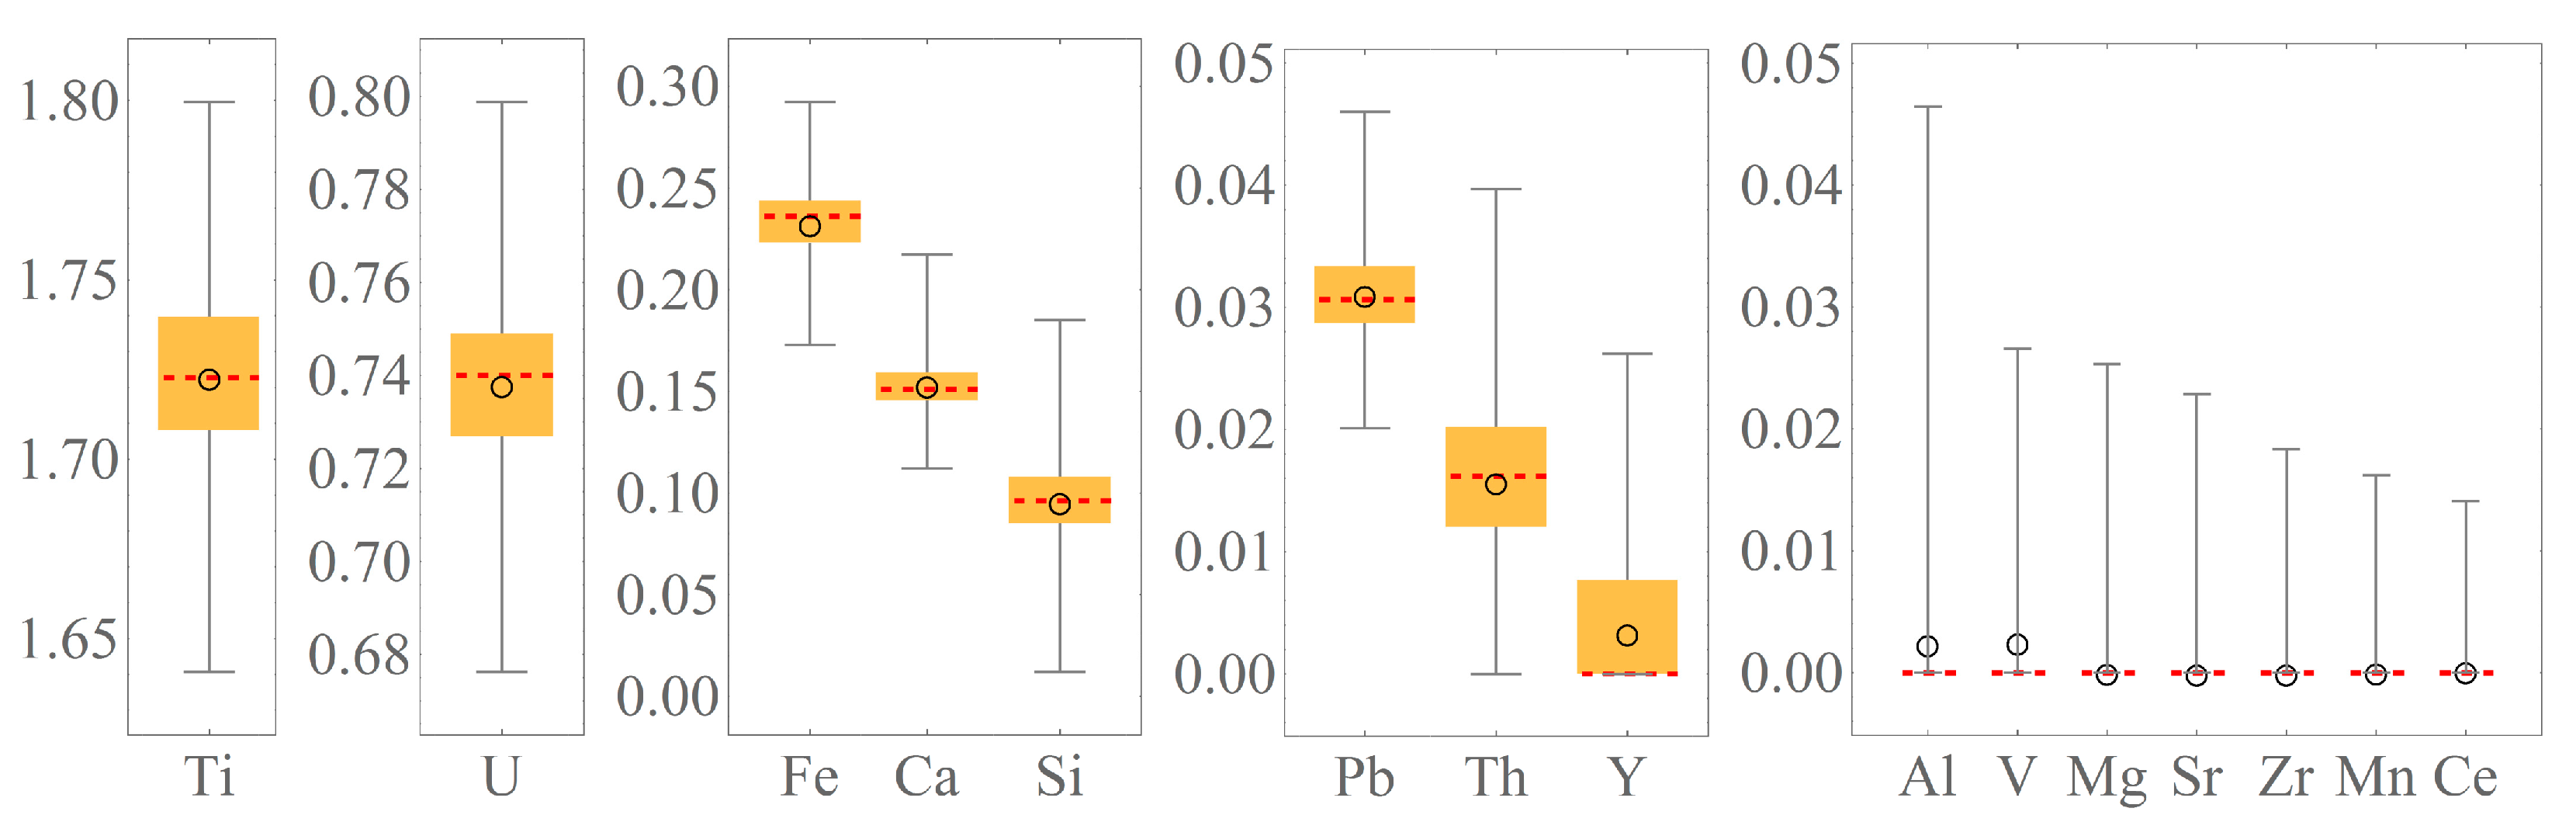
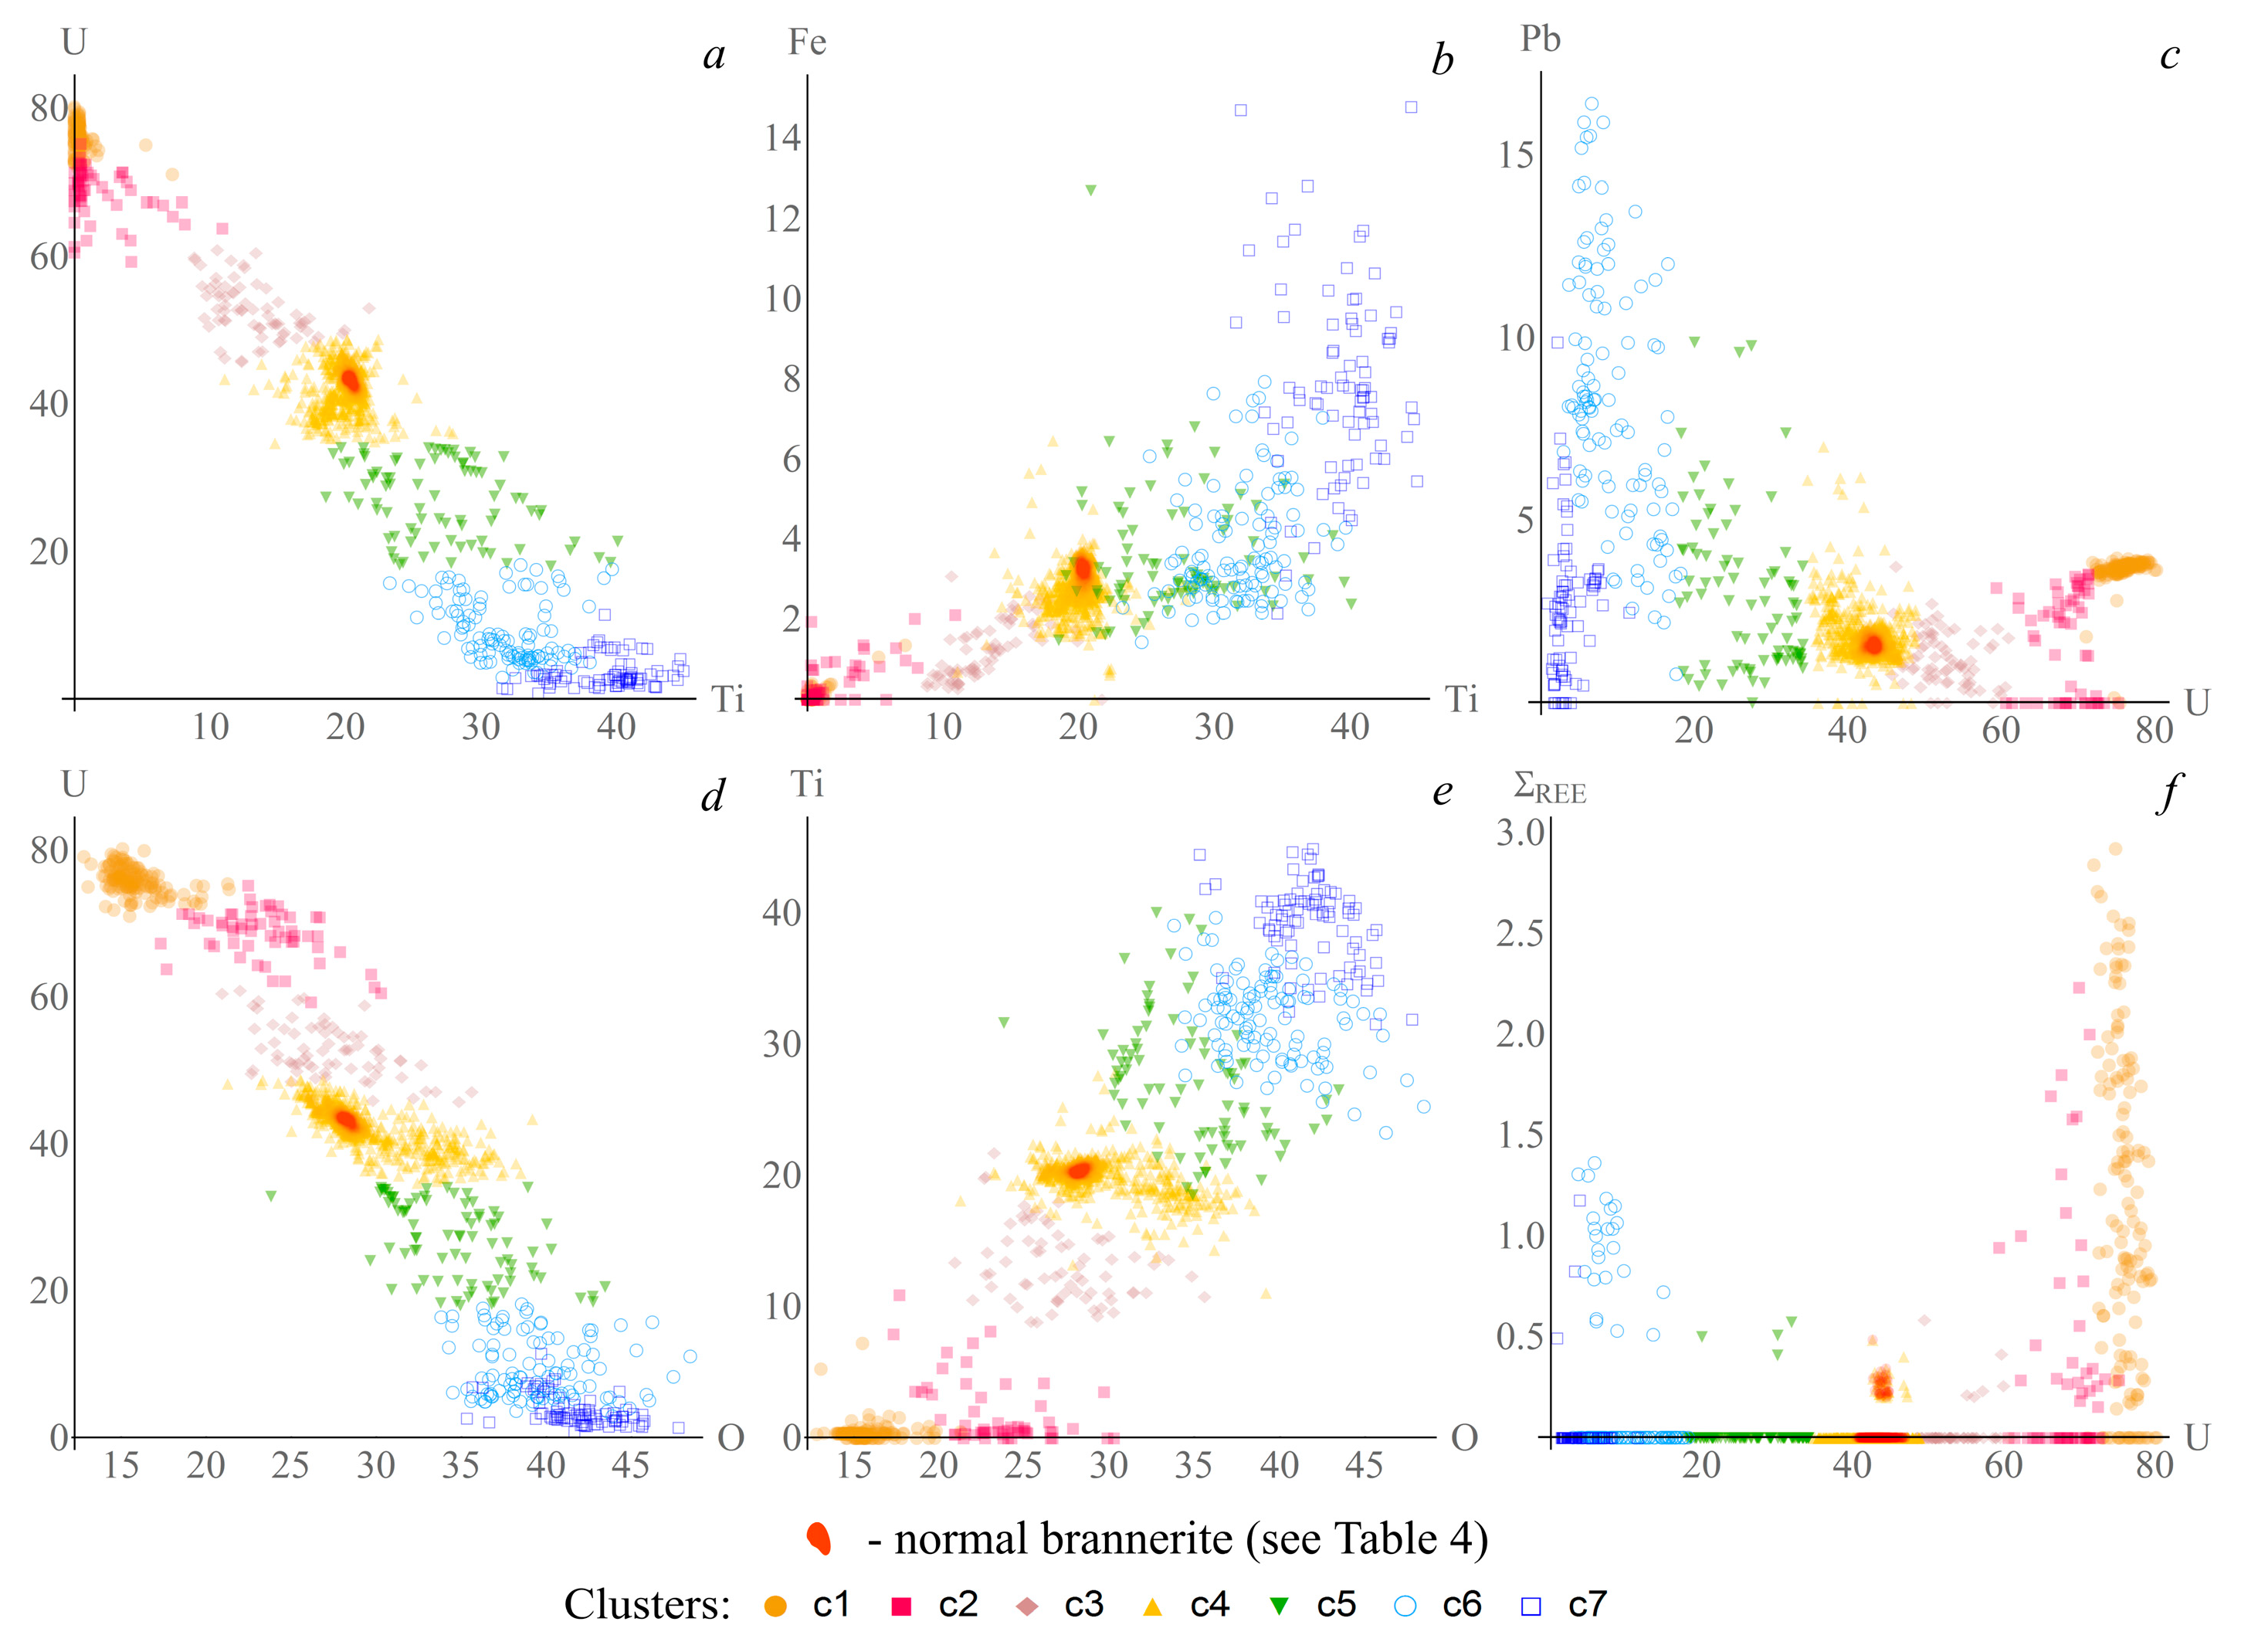
3.2.2. Brannerite
3.2.3. Uraninite
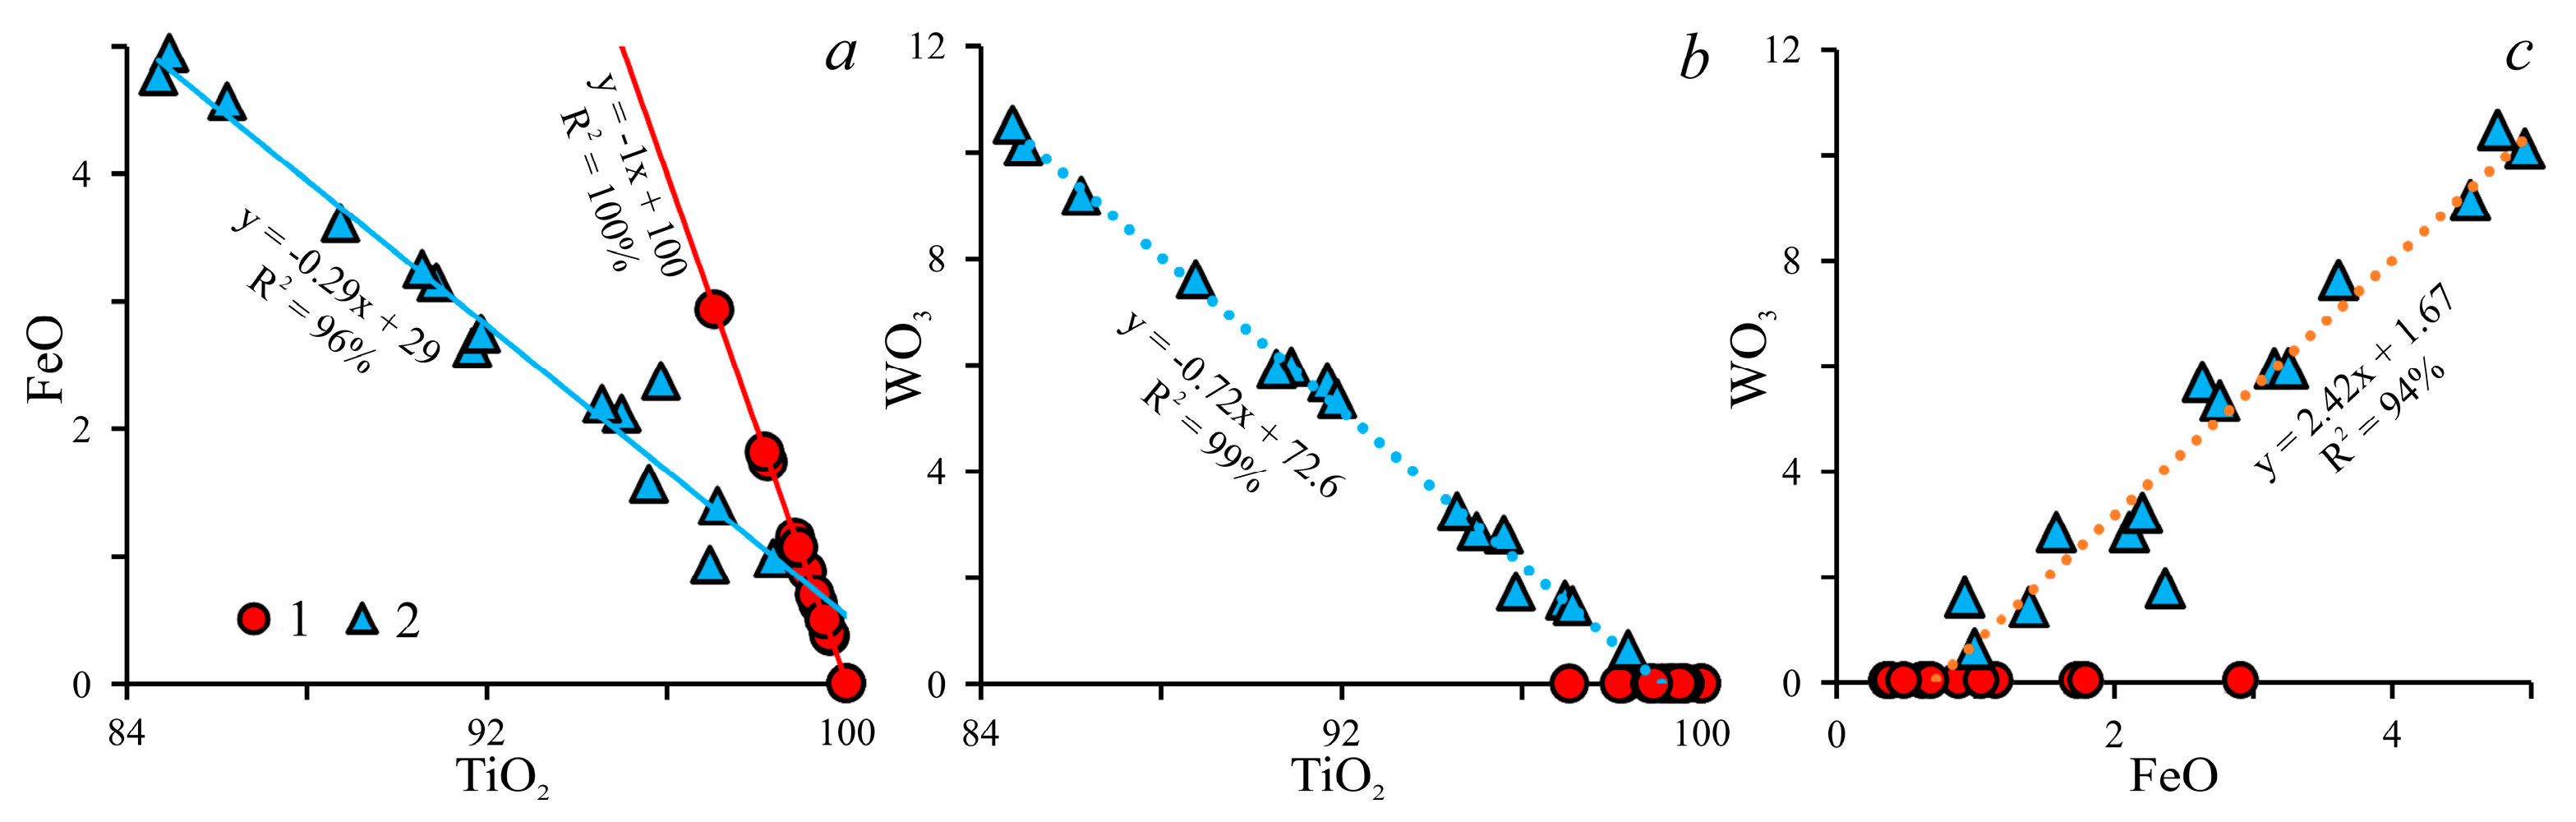
3.2.4. Rutile
3.2.5. Barite
3.2.6. Hematite–Magnetite
3.2.7. Goethite
3.2.8. K-Feldspar, Quartz and Chlorite
3.2.9. Organic Matter
4. Discussion
5. Conclusions
Author Contributions
Funding
Data Availability Statement
Acknowledgments
Conflicts of Interest
References and Note
- Tarasova, R.S.; Babkin, I.N.; Bliznyuk, M.V.; Filko, A.S.; Gorbunov, S.V.; Alkalaev, B.K. Lake Sulfide Lead-Zinc Deposit. Report for 1964–1969 with Inventory Count; Buryatia Geological Government: Ulan-Ude, Russia, 1969; 432p. (In Russian) [Google Scholar]
- Tarasova, R.S.; Bliznyuk, M.V.; Babkin, I.N. On the formational type and genesis of the Ozernoe lead-zinc sulfide deposit. In Geology and Genesis of Endogenous Ore Formations of Siberia; Nauka: Moscow, Russia, 1972; Volume 143, pp. 79–97. (In Russian) [Google Scholar]
- Kalinin, Y.A.; Nesterenko, G.V.; Khlybov, V.P.; Zhmodik, S.M.; Kolpakov, V.V.; Popov, V.D. Typomorphism of native gold and its role in the search for non-traditional types of gold ore concentrations within the Eravna depression (Buryatia). In Proceedings of the Noble and rare metals of Siberia and the Far East, Irkutsk, Russia, 24–27 September 2005; pp. 139–142. (In Russian). [Google Scholar]
- Nikolaeva, L.A.; Yablokova, S.V.; Shatilova, L.V.; Pozdnyakova, N.N. Results of the Study of Typomorphic Features of Native Gold in Order to Determine the Primary Source of the Ozerninsky Ore-Placer Node Inform. A Note; TsNIGRI: Moscow, Russia, 2008; 100p. (In Russian) [Google Scholar]
- Kozlov, A.V.; Savichev, A.; Nikitin, D.V.; Pechenkin, M.M.; Alekhina, V.V.; Pokrovskaya, N.V.; Bogatyrev, L.I.; Shelekhov, A.N. Report on the Results of Prospecting and Appraisal Work for Gold and Other Minerals within the Ozerninsky Ore Cluster and Adjacent Territory in 2008–2010; SPGGU: St. Petersburg, Russia, 2010; Volume 1, 300p. [Google Scholar]
- Mironov, A.G.; Karmanov, N.S.; Mironov, A.A.; Khodyreva, E.V. Gold-brannerite naggets in placers of the Ozernoe ore cluster. Russ. Geol. Geophys. 2008, 49, 743–748. [Google Scholar] [CrossRef]
- Zhmodik, S.M.; Belyanin, D.K.; Airiyants, E.V.; Karmanov, N.S.; Mironov, A.A.; Damdinov, B.B. Fe-Ti-Au-U-mineralization of the Ozerninsky ore node (Western Transbaikalia, Russia). Dokl. Earth Sci. 2022, 507, 1050–1056. [Google Scholar] [CrossRef]
- Vasiliev, I.L. Geology of the Eravna Ore Field; Nauka: Novosibirsk, Russia, 1977; 126p. (In Russia) [Google Scholar]
- Distanov, E.G. Pyrite-Polymetallic Deposits of SIBERIA; Nauka: Novosibirsk, Russia, 1977; 351p. (In Russian) [Google Scholar]
- Distanov, E.G.; Kovalev, K.R. Textures and Structures of Hydrothermal-Sedimentary Pyrite-Polymetallic Ores of the Ozernoye Deposit; Nauka: Novosibirsk, Russia, 1975; 172p. (In Russian) [Google Scholar]
- Kovalev, K.R.; Buslenko, A.I. Hydrothermal-Sedimentary Ore Genesis and Polymetamorphism of Ores of the Ozerninsky Ore Node (Western Transbaikalia); VO “Nauka”; Siberian Publishing Company: Novosibirsk, Russia, 1992; 214p. (In Russian) [Google Scholar]
- Nefediev, M.A. Volumetric Model and Assessment of the Prospects of the Ozerninsky Ore Node Based on Geophysical Data (Western Transbaikalia); BSC SB RAS: Ulan-Ude, Russia, 2009; 184p. (In Russian) [Google Scholar]
- Gordienko, I.V.; Bulgatov, A.N.; Minina, O.R.; Klimuk, V.S.; Vetluzhskih, L.I.; Sitnikova, V.S.; Goneger, T.A.; Ruzhentsev, S.V.; Nekrasov, G.E.; Metelkin, D.V.; et al. The late Riphean-Paleozoic of the Uda-Vitim island arc system in the Transbaikalian sector of the Paleoasian ocean. Russ. Geol. Geophys. 2010, 51, 461–481. [Google Scholar] [CrossRef]
- Platov, E.V.; Ignatov, A.M.; Patrakhin, E.G.; Bolshakova, T.V.; Minina, O.R.; Lantseva, V.S. State geological map of the Russian Federation at a scale of 1:200 000. 2nd. Series Barguzino-Vitimskaya. Sheet N-49-XXVIII (Gunda). In Explanatory Letter; Cartographic Factory VSEGEI: St. Petersburg, Russia, 2016; 208p. (In Russian) [Google Scholar]
- Vikentiev, I.V.; Damdinov, B.B.; Minina, O.R.; Spirina, A.V.; Damdinova, L.B. Classification of polymetallic mining processes and transitional VMS–SEDEX–MV type example of a giant Ozernony Deposit in Transbaikal, Russia. Geol. Ore Depos. 2023, 65, 201–236. (In Russian) [Google Scholar] [CrossRef]
- Minina, O.R.; Gordienko, I.V.; Damdinov, B.B.; Tashlykov, V.S.; Goneger, T.A.; Skripnikov, M.S.; Lantseva, V.S.; Khubanov, V.B.; Kislov, E.V. New data on the age Ozernoe polymetallic deposi (Western Transbaikal). Lithol. Miner. Resour. 2023, 3, 299–314. (In Russian) [Google Scholar] [CrossRef]
- Damdinov, B.B.; Vikentiev, I.V.; Damdinova, L.B.; Minina, O.R.; Zhmodik, S.M.; Sobolev, I.D.; Tyukova, E.E.; Spirina, A.V.; Izvekova, A.D.; Moskvitina, M.L.; et al. Problems of the genesis of deposits of the Ozerninsky polymetallic ore cluster (Western Transbaikalia, Russia). Natl. Geol. 2023, 2, 73–90. (In Russian) [Google Scholar] [CrossRef]
- Tatkov, G.I.; Baderin, A.M. Structure and prospects of the Ozerninsky ore cluster according to the data of medium-scale modeling in a gravitational field. In Geological and Genetic Models and Local Prediction of Endogenous Mineralization in Transbaikalia: Collection of Scientific Papers GIN BSC SB AS USSR; OIGGM SB RAS: Novosibirsk, Russia, 1991; pp. 107–113. (In Russian) [Google Scholar]
- Kozlov, A.V.; Pechenkin, M.M.; Savichev, A.A.; Bambaev, T.S. New features of deep structure Ozerninskiy ore cluster based on magnetotelluric sounding. J. Min. Inst. 2011, 189, 260–263. (In Russian) [Google Scholar]
- Gordienko, I.V.; Nefed’ev, M.A. The Kurba-Eravna ore district of Western Transbaikalia: Geological and geophysical structure, types of ore deposits, predictive assessment, and mineral-resource potential. Geol. Ore Depos. 2015, 57, 101–110. [Google Scholar] [CrossRef]
- Ruzhentsev, S.V.; Aristov, V.A.; Golionko, B.G.; Nekrasov, G.E.; Minina, O.R.; Larionov, A.N.; Lykhin, D.A. Geodynamics of the Eravna zone (Uda-Vitim fold system of the Transbaikal region): Geological and geochronological data. Dokl. Earth Sci. 2010, 434, 1168–1171. [Google Scholar] [CrossRef]
- Ruzhentsev, S.V.; Minina, O.R.; Nekrasov, G.E.; Aristov, V.A.; Golionko, B.G.; Doronina, B.G.; Lykhin, V.A. The Baikal-Vitim Fold System: Structure and geodynamic evolution. Geotectonica 2012, 46, 87–110. [Google Scholar] [CrossRef]
- Tsarev, D.I.; Firsov, A.P. The Problem of the Formation of Pyrite Deposits; Nauka: Moscow, Russia, 1988; 141p. [Google Scholar]
- Litvinovsky, B.A.; Postnikov, A.A.; Zanvilevich, A.N.; Zeleny, E.N.; Zoricheva, L.L. New data on magmatism of the Ozerninsky ore cluster (Western Transbaikalia). Russ. Geol. Geophys. 1986, 8, 56–67. (In Russian) [Google Scholar]
- Gordienko, I.V.; Tsygankov, A.A. Magmatism and ore formation in various geodynamic settings of the Sayano-Baikal folded region and adjacent territories. Prospect. Prot. Miner. Resour. 2017, 9, 36–44. (In Russian) [Google Scholar]
- Moroz, T.N.; Edwards, H.G.M.; Ponomarchuk, V.A.; Pyryaev, A.N.; Palchik, N.A.; Goryainov, S.V. Raman spectra of a graphite nontronite association in marbles from Oltrek Island (Lake Baikal, Russia). J. Raman Spectrosc. 2020, 51, 1885–1893. [Google Scholar] [CrossRef]
- Petrovskaya, N.V. Native Gold (General Characteristics, Typomorphism, Problem of Genesis); Nauka: Moscow, Russia, 1973; 348p. [Google Scholar]
- Colella, M.; Lumpkin, G.R.; Zhang, Z.; Buck, E.C.; Smith, K.L. Determination of the uranium valence state in the brannerite structure using EELS, XPS, and EDX. Phys. Chem. Miner. 2005, 32, 52–64. [Google Scholar] [CrossRef]
- Dymkov, Y.M. The Nature of Uranium Resin Ore. Issues of Genetic Mineralogy; Atomizdat: Moscow, Russia, 1973; 240p. (In Russian) [Google Scholar]
- Betekhtin, A.G. Mineralogy; State Publishing House of Geological Literature: Moscow, Russia, 1950; 956p. (In Russian) [Google Scholar]
- Beattie, I.R.; Gilson, T.R. The single-crystal Raman spectra of nearly opaque materials. Iron(III) oxide and chromium(III) oxide. J. Chem. Soc. A Inorg. Phys. Theor. 1970, 980–986. [Google Scholar] [CrossRef]
- El Mendili, Y.; Bardeau, J.-F.; Randrianantoandro, N.; Gourbil, A.; Greneche, J.-M.; Mercier, A.-M.; Grasset, F. New evidences of in situ laser irradiation effects on γ-Fe2O3 nanoparticles: A Raman spectroscopic study. J. Raman Spectrosc. 2010, 42, 239–242. [Google Scholar] [CrossRef]
- Hanesch, M. Raman spectroscopy of iron oxides and (oxy)hydroxides at low laser power and possible applications in environmental magnetic studies. Geophys. J. Intern. 2009, 177, 941–948. [Google Scholar] [CrossRef]
- Shebanova, O.N.; Lazor, P. Raman study of magnetite (Fe3O4): Laser-induced thermal effects and oxidation. J. Raman Spectrosc. 2003, 34, 845–852. [Google Scholar] [CrossRef]
- Almuslet, N.A.; Ahmed, M.M.; Hassen, S.H. Usage of laser Raman spectroscopy to indentify the unstable compounds of iron oxide. Int. J. Curr. Adv. Res. 2017, 6, 3470–3473. [Google Scholar] [CrossRef][Green Version]
- Marshall, C.P.; Dufresne, W.J.B.; Rufledt, C.J. Polarized Raman spectra of hematite and assignment of external modes. J. Raman Spectrosc. 2020, 51, 1522–1529. [Google Scholar] [CrossRef]
- Moroz, T.N.; Edwards, H.G.M.; Zhmodik, S.M. Detection of carbonate, phosphate minerals and cyanobacteria in rock from the Tomtor deposit, Russia, by Raman spectroscopy. Spectrochim. Acta Part A Mol. Biomol. Sppectroscopy 2021, 250, 119372. [Google Scholar] [CrossRef] [PubMed]
- Zhang, Y.; Karatchevtseva, I.; Qin, M.; Middleburgh, S.C.; Lumpkin, G.R. Raman spectroscopic study of natural and synthetic brannerite. J. Nucl. Mater. 2013, 437, 149–153. [Google Scholar] [CrossRef]
- Lafuente, R.T.B.; Downs, H.; Yang, N. Stone, The power of databases: The RRUFF project. In Highlights in Mineralogical Crystallography; Armbruster, T., Danisi, R.M., Eds.; Walter de Gruyter: Berlin, Germany, 2015; pp. 1–30. [Google Scholar]
- Kovalev, K.R.; Baulina, M.V.; Akimtsev, V.A.; Anoshin, G.N. Stratiform zinc-pyrite ores and gold mineralization at the Nazarovskoye deposit. Russ. Geol. Geophys. 2003, 44, 963–978. (In Russian) [Google Scholar]
- Chapman, R.J.; Banks, D.A.; Styles, M.T.; Walshaw, R.D.; Piazolo, S.; Morgan, D.J.; Grim-shaw, M.R.; Spence-Jones, C.P.; Matthews, T.J.; Borovinskaya, O. Chemical and physical heterogeneity within native gold: Implications for the design of gold particle studies. Miner. Depos. 2021, 56, 1563–1588. [Google Scholar] [CrossRef]
- Gammons, C.H.; Williams-Jones, A.E. Hydrothermal geochemistry of electrum; thermodynamic constraints. Econ. Geol. 1995, 90, 420–432. [Google Scholar] [CrossRef]
- Doroshkevich, G.I. Project for conducting prospecting and appraisal work for gold and other minerals within the Ozerninsky ore cluster and adjacent territory, for 2007–2011, Ulan-Ude. 2007. [Google Scholar]
- Murzin, V.V.; Kudryavtsev, V.I.; Berzon, R.O.; Sustavov, S.G. Peculiarities of mineralization with cuprous gold associated with rodingitization. Geol. Ore Depos. 1987, 5, 96–99. (In Russian) [Google Scholar]
- Spiridonov, E.M.; Pletnev, P.A. Copper Gold Deposit Zolota Hora (o “Gold-Rodingite” Formation); Scientific World: Moscow, Russia, 2002; 220p. (In Russian) [Google Scholar]
- Nesterenko, G.V. Prediction of Gold Mineralization from Placers (on the Example of Regions of Southern Siberia); Publisher “Science”; Siberian Branch: Novosibirsk, Russia, 1991; 191p. (In Russian) [Google Scholar]
- Tarkhanov, A.V.; Bugrieva, E.P. The largest uranium deposits of the World. In Mineral Raw Materials; VIMS: Moscow, Russia, 2012; Volume 27, pp. 1–118. (In Russian) [Google Scholar]
- Mineeva, I.G.; Makarov, A.I.; Oderova, A.V. New methodology for deep prospecting of U and Au-U deposits in paleoriftogenic structures. Prospect. Prot. Miner. Resour. 2013, 7, 3–11. (In Russian) [Google Scholar]
- Boitsov, V.E.; Pilipenko, G.N. Gold and uranium in the Mezozoic hydrothermal deposits of the Central Aldan region (Russia). Geol. Ore Depos. 1998, 40, 315–328. (In Russian) [Google Scholar]
- Terentiev, V.M.; Kazansky, V.I. Elkon uranium ore region on the Aldan shield. Reg. Geol. Metallog. 1999, 8, 47–58. (In Russian) [Google Scholar]
- Corriveau, L. Iron oxide copper-gold (±Ag±Nb±P±REE±U) deposits: A Canadian perspective. In Mineral Deposits of Canada: A Synthesis of Major Deposit-Types, District Metallogeny, The Evolution of Geological Provinces, and Exploration Methods; Special Publication; Goodfellow, W.D., Ed.; Geological Association of Canada, Mineral Deposits Division: St. John’s, NL, Canada, 2007; Volume 5, pp. 1–23. [Google Scholar]
- Pabst, A.; Stinson, M.C. Brannerite with gold from Plumas County, California. Bull. Geol. Soc. Amer. 1960, 71, 2071–2072. [Google Scholar]
- El Goresy, A.; Meixner, H. Brannerite from the iron spar deposits of Olsa near Friesach, Carinthia, Austria. Neues Jahrb. Für Mineral. Abh. 1965, 103, 94–98. [Google Scholar] [CrossRef]
- Steacy, H.R.; Plant, R.; Boyle, R.W. Brannerite associated with native gold at the Richardson Mine, Ontario. Canad. Miner. 1974, 12, 360–363. [Google Scholar]
- England, G.L. The origin of uraninite, bitumen and carbon seams in Witwatersrand gold-uranium-pyrite ore deposits, based on a Permo-Triassic analogue. Econ. Geol. 2001, 96, 1907–1920. [Google Scholar] [CrossRef]
- Kazansky, V.I. The unique Central Aldan gold-uranium ore district (Russia). Geol. Ore Depos. 2004, 46, 167–181. [Google Scholar]
- Ramdor, P. The Ore Minerals and Their Intergrowth; Pergamon Press: Oxford, UK, 1969; 1174p. [Google Scholar] [CrossRef]
- Bouabdellah, M.; Maacha, L.; Levresse, G.; Saddiqi, O. The Bou Azzer Co–Ni–Fe–As (–Au–Ag) District of Central Anti-Atlas (Morocco): A Long-Lived Late Hercynian to Triassic Magmatic-Hydrothermal to Low-Sulphidation Epithermal System. In Mineral Deposits of North Africa, Mineral Resource Reviews; Bouabdellah, M., Slack, J.F., Eds.; Springer International Publishing: Zurich, Switzerland, 2016; pp. 229–247. [Google Scholar] [CrossRef]
- Chapman, R.J.; Mortensen, J.K.; Crawford, E.C.; Lebarge, W. Microchemical studies of placer and lode gold in the Klondike District, Yukon, Canada: 1. Evidence for a small, gold-rich, oro-genic hydrothermal system in the Bonanza and Eldorado Creek area. Econ. Geol. 2010, 105, 1369–1392. [Google Scholar] [CrossRef]
- Turuani, M.; Choulet, F.; Eglinger, A.; Goncalves, P.; Machault, J.; Mercadier, J.; Seydoux-Guillaume, A.-M.; Reynaud, S.; Baron, F.; Beafort, D.; et al. Geochemical fingerprints of brannerite (UTi2O6): An integrated study. Mineral. Mag. 2020, 84, 313–334. [Google Scholar] [CrossRef]
- Suzuki, K.; Kato, T. CHIME Dating of Monazite, Xenotime, Zircon and Polycrase: Protocol, Pitfalls and Chemical Criterion of Possibly Discordant Age Data. Gondwana Res. 2008, 14, 569–586. [Google Scholar] [CrossRef]
- Sciuba, M.; Beaudoin, G. Texture and trace element composition of rutile in orogenic gold deposits. Econ. Geol. 2021, 116, 1865–1892. [Google Scholar] [CrossRef]
- Clark, J.R.; Williams-Jones, A.E. Rutile as a Potential Indicator Mineral for Metamorphosed Metallic Ore Deposits; Rapport Final de DIVEX, Sous-projet SC2: Montréal, QC, Canada, 2004; p. 17. [Google Scholar]
- Ryzhenko, B.N. System Au-UO2-aqueous fluid at 500C, 1 kbar: 2. fluid of the Elkon-type gold-uraniom mineralization. Geochem. Int. 2016, 54, 996–1004. [Google Scholar] [CrossRef]
- Kovalenko, N.I.; Ryzhenko, B.N.; Prisyagina, N.I.; Bychkova, Y.V. Experimental study of uraninite solubility in aqueous HCl solutions at 500 °C and 1 kbar. Geochemistry 2011, 49, 277–289. (In Russian) [Google Scholar] [CrossRef]
- Bannikova, L.A. Organic Matter in Hydrothermal Ore Formation; Galimov, E.M., Ed.; Nauka: Moscow, Russia, 1990; 206p. [Google Scholar]
- Poceluev, A.A. Carbonaceous substances in hydrothermal uranium and rare metal deposits. Bull. Tomsk. Polytech. Univ. 2010, 316, 16–23. (In Russian) [Google Scholar]
- Boitsov, V.E.; Vercheba, A.A.; Pilipenko, G.N.; Zhdanov, A.V. Metallogenic zoning of the Central Aldan ore region of the Republic of Sakha (Yakutia). Proc. High. Educ. Establishments. Geol. Explor. 2010, 5, 23–33. (In Russian) [Google Scholar]
- Aleshin, A.P.; Kozyr’kov, V.D.; Smirnov, K.M.; Ivanchenko, M.M.; Komarov, V.B.; Griboedova, I.G. Uranium-titanium-metagel mineralization of Au-U deposits of the Elkon ore district (Aldan, Russia) and features of its processing. Proceedings of higher educational establishments. Geol. Explor. 2016, 4, 50–57. (In Russian) [Google Scholar] [CrossRef]
- Terekhov, A.V.; Molchanov, A.V.; Shatova, N.V.; Belova, V.N. Two types of ore-bearing gumbeites of the Elkon gold-uranium cluster (South Yakutia). Reg. Geol. Metallog. 2014, 60, 71–86. (In Russian) [Google Scholar]
- Afanasiev, G.V. Prospects of the “Olympic Dam” type on the territory of Russia. In Proceedings of the III International Symposium “Uranus: Geology, Resources, Production”, VIMS, Moscow, Russia, 29–31 May 2013; pp. 17–18. [Google Scholar]
- Agangi, A.; Reddy, S.M.; Plavsa, D.; Fougerouse, D.; Clark, C.; Roberts, M.; Johnson, T.E. Antimony in rutile as a pathfinder for orogenic gold deposits. Ore Geol. Rev. 2019, 106, 1–11. [Google Scholar] [CrossRef]
- Maksarov, R.A.; Doroshkevich, A.G.; Prokopiev, I.R.; Redin, Y.O.; Potapov, V.V. V-NB-W-bearing rutile from Karalveem gold deposit as a potential indicator for ore deposit. Geosph. Res. 2020, 3, 50–59. [Google Scholar] [CrossRef]


| Type | I | II | III | IV |
|---|---|---|---|---|
| number of investigated grains | 20 | 15 | 5 | 5 |
| fineness (min–max) | 765–945 | 650–764 | 445–648 | 769–946 |
| average | 890 | 697 | 590 | 919 |
| Cu (min–max) | 0–3.78 | 0–2.06 | 0–1.14 | 3.3–22.83 |
| average | 0.38 | 0.19 | 0.28 | 4.88 |
| size (mm) | 0.1–2.5 | 0.5–2 | 0.5–1 | 0.5–3 |
| color | bright yellow | greenish yellow | grayish greenish white | reddish yellow |
| morphology | lamellar, amoeba-shaped, elongated | lamellar | flattened, isometric | ellipsoid-flattened, lamellar |
| roundness | low | weak to medium | medium | weak to medium |
| Cu | Ag | Au | Total | Au, ‰ |
|---|---|---|---|---|
| 0 | 5.62 | 92.38 | 98 | 943 |
| 0 | 5.86 | 93.84 | 99.7 | 941 |
| 0 | 21.87 | 79.6 | 101.47 | 784 |
| 0 | 21.8 | 78 | 99.8 | 782 |
| 0 | 22.36 | 77.42 | 99.78 | 776 |
| 0 | 11.89 | 89.2 | 101.09 | 882 |
| 0 | 5.9 | 93.82 | 99.72 | 941 |
| 0.25 | 5.93 | 94.04 | 100.22 | 938 |
| 0.3 | 5.83 | 93.88 | 100.01 | 939 |
| 0 | 9.74 | 87.49 | 97.23 | 900 |
| 0 | 13.09 | 85.41 | 98.5 | 867 |
| 0 | 11.14 | 86.95 | 98.09 | 886 |
| 0 | 1.05 | 99.21 | 100.26 | 990 |
| 0 | 1.74 | 99.32 | 101.06 | 983 |
| 0 | 21.88 | 76.73 | 98.61 | 778 |
| 0 | 22.25 | 76.44 | 98.69 | 775 |
| 0 | 22.11 | 77.59 | 99.7 | 778 |
| 0 | 11.58 | 86.28 | 97.86 | 882 |
| 0 | 13.31 | 84.14 | 97.45 | 863 |
| 0 | 3.23 | 94.62 | 97.85 | 967 |
| 0 | 11.85 | 87.77 | 99.62 | 881 |
| 0 | 4.87 | 93.64 | 98.51 | 951 |
| 0 | 0.38 | 100.05 | 100.43 | 996 |
| 0 | 4.63 | 94.39 | 99.02 | 953 |
| Name | Si | Ti | Al | Fe | Mn | Mg | Ca | Ba | V | Ce | Y | Th | U | W | Pb | P | O | Total |
|---|---|---|---|---|---|---|---|---|---|---|---|---|---|---|---|---|---|---|
| brn-1 | 0.61 | 20.54 | 0.1 | 3.34 | 1.55 | 0.22 | 0 | 0.19 | 1.07 | 43.96 | 1.45 | 28.16 | 101.19 | |||||
| brn-2 | 0.74 | 20.62 | 0 | 3.2 | 1.4 | 0.22 | 0 | 0.29 | 1.12 | 43.27 | 1.42 | 27.85 | 100.13 | |||||
| brn-3 | 0.71 | 20.6 | 0.1 | 3.34 | 1.5 | 0.2 | 0 | 0.25 | 1.35 | 42.68 | 1.29 | 27.9 | 99.92 | |||||
| brn-4 | 0.43 | 20.4 | 2.8 | 0 | 1.48 | 0.2 | 0.2 | 0.51 | 46.14 | 1.58 | 27.47 | 101.21 | ||||||
| brn-5 | 0.85 | 20 | 2.98 | 1.78 | 0 | 0.19 | 0.52 | 45.14 | 1.7 | 27.97 | 101.13 | |||||||
| brn-6 | 0.84 | 20.44 | 3.13 | 1.72 | 0 | 0.27 | 0.53 | 44.26 | 0 | 1.55 | 28.35 | 101.09 | ||||||
| brn-7 | 0.73 | 20.6 | 0.13 | 3.14 | 1.56 | 0.21 | 0 | 0 | 44.88 | 1.54 | 28.25 | 101.04 | ||||||
| brn-8 | 0.73 | 20.68 | 3.43 | 1.57 | 0 | 0 | 0.63 | 43.72 | 1.39 | 28.43 | 100.58 | |||||||
| brn-9 | 0.27 | 20.72 | 3 | 1.09 | 0.25 | 0 | 0.59 | 46.52 | 1.48 | 27.49 | 101.41 | |||||||
| brn-10 | 0.66 | 20.12 | 3.15 | 0.16 | 1.74 | 0 | 0 | 0.68 | 45.27 | 1.45 | 27.53 | 100.76 | ||||||
| brn-11 | 0.7 | 20.53 | 3.09 | 1.81 | 0 | 0 | 0.68 | 44.41 | 1.46 | 28.4 | 101.08 | |||||||
| brn-12 | 0.56 | 20.46 | 0.11 | 3.08 | 1.67 | 0.23 | 0.19 | 0.67 | 44.59 | 1.48 | 27.99 | 101.03 | ||||||
| brn-13 | 0.57 | 20.06 | 3.3 | 1.53 | 0.18 | 0.23 | 0.5 | 45.36 | 1.39 | 28.14 | 101.26 | |||||||
| U-(Ti)-1 | 0.59 | 8.25 | 0.31 | 1.19 | 1.99 | 0.16 | 0.24 | 0.09 | 0.32 | 55.95 | 0.2 | 24.04 | 93.33 | |||||
| U-(Ti)-2 | 0.59 | 8.36 | 0.39 | 0.09 | 1.26 | 2.06 | 0.16 | 0.39 | 0 | 0.42 | 56.23 | 0.32 | 23.94 | 93.66 | ||||
| U-(Ti)-3 | 0.49 | 10.7 | 0.66 | 1.15 | 2.37 | 0.55 | 49.76 | 0.62 | 30.38 | 96.68 | ||||||||
| U-(Ti)-4 | 0.53 | 9.44 | 0.64 | 0 | 1.14 | 1.44 | 0.1 | 0.21 | 0.53 | 51.69 | 0.31 | 24.34 | 89.45 | |||||
| U-(Ti)-5 | 0.35 | 10.51 | 0.06 | 1.13 | 1.13 | 1.81 | 0.13 | 0.19 | 0.3 | 49.45 | 1.72 | 0.34 | 22.59 | 88.88 | ||||
| U-(Ti)-6 | 0.62 | 8.78 | 0.34 | 1.1 | 2.44 | 0.1 | 0.19 | 0.47 | 52.24 | 1.61 | 0.28 | 0.18 | 24.82 | 90.67 | ||||
| U-(Ti)-7 | 0.58 | 8.82 | 0.13 | 0.56 | 1.31 | 2.2 | 0 | 1.61 | 47.61 | 1.13 | 0 | 0.24 | 27.85 | 89.45 | ||||
| U-(Ti)-8 | 0.29 | 9.05 | 0.61 | 1.49 | 0 | 0 | 0 | 57.38 | 0 | 28.54 | 94.71 | |||||||
| U-Ti-1 | 0.76 | 18 | 0.17 | 2.89 | 1.37 | 0 | 0 | 1.39 | 35.62 | 1.32 | 1.25 | 34.56 | 97.33 | |||||
| U-Ti-2 | 0.54 | 18.03 | 2.7 | 0.88 | 0 | 0 | 0.68 | 40.35 | 3.25 | 34.51 | 100.94 | |||||||
| U-Ti-3 | 0.63 | 17.3 | 0.11 | 2.5 | 1.5 | 0 | 0 | 0.73 | 35.94 | 34.31 | 93.02 | |||||||
| U-Ti-4 | 0.72 | 18.27 | 2.7 | 0.7 | 0 | 0.46 | 39.4 | 3.04 | 34.55 | 99.84 | ||||||||
| U-Ti-5 | 0.75 | 17.44 | 2.36 | 0.82 | 0 | 0.67 | 38.42 | 1.4 | 35.76 | 97.62 | ||||||||
| U-Ti-6 | 0.74 | 21.42 | 2.72 | 0.16 | 1.2 | 0 | 0 | 0.6 | 35.08 | 3.55 | 33.08 | 98.55 | ||||||
| U-Ti-7 | 0.55 | 19.14 | 0.11 | 4.58 | 0.62 | 0.19 | 0.88 | 1.78 | 0.27 | 0 | 0.89 | 30.39 | 0 | 1.35 | 33.7 | 94.45 | ||
| U-Ti-8 | 0.66 | 21.46 | 6.21 | 0.98 | 0.33 | 0.96 | 1.27 | 0 | 0.85 | 25.63 | 1.69 | 36.32 | 96.36 | |||||
| U-Ti-9 | 0.69 | 21.43 | 4.48 | 0.29 | 0.27 | 1.01 | 1.91 | 0.28 | 27.01 | 1.64 | 34.29 | 93.3 | ||||||
| U-Ti-Pb-1 | 1.05 | 33.28 | 4.15 | 0.18 | 0.58 | 0 | 1.04 | 14.61 | 4.19 | 37.61 | 96.69 | |||||||
| U-Ti-Pb-2 | 0.63 | 38.96 | 4.77 | 0.18 | 0.51 | 1.07 | 11.48 | 2.47 | 39.54 | 99.61 | ||||||||
| U-Ti-Pb-3 | 2.94 | 29.02 | 0.11 | 5.17 | 0.56 | 0.86 | 1.49 | 0.25 | 0.57 | 0.84 | 5.87 | 9.12 | 0.44 | 39.63 | 96.87 | |||
| U-Ti-Pb-4 | 1.35 | 24.48 | 7.31 | 0.99 | 0.21 | 0.88 | 0.79 | 1.21 | 4.68 | 0.27 | 35.39 | 77.56 | ||||||
| U-Ti-Pb-5 | 2.62 | 31.79 | 0.08 | 6.78 | 0.83 | 1.22 | 0 | 0.78 | 0.7 | 3.03 | 6.24 | 0.39 | 39.95 | 94.41 | ||||
| U-Ti-Pb-6 | 3.66 | 29.06 | 0.1 | 4.35 | 0.45 | 1.13 | 1.9 | 0.27 | 0.85 | 2.76 | 6.02 | 7.69 | 0.59 | 36.23 | 95.06 | |||
| Fe-Ti | 0.51 | 16.28 | 0.71 | 34.93 | 0.24 | 0 | 0.13 | 0.35 | 2.35 | 0 | 0.68 | 0.34 | 33.9 | 90.42 | ||||
| Ti-Fe | 0.45 | 41.1 | 0.28 | 11.69 | 0.2 | 0.09 | 0 | 0.37 | 1.28 | 2.76 | 1.01 | 0.79 | 0.28 | 40.72 | 101.02 | |||
| Ti-Fe | 1.18 | 32.53 | 0.13 | 11.92 | 1.41 | 0.3 | 1.62 | 0.2 | 0.47 | 2.11 | 0.82 | 2.6 | 0.22 | 39.62 | 95.13 |
| Min | Median | Max | Mean | S.D. | |
|---|---|---|---|---|---|
| Wt.% | |||||
| UO2 | 46.41 | 49.55 | 54.09 | 49.52 | 1.05 |
| TiO2 | 32.02 | 34.14 | 36.42 | 34.19 | 0.55 |
| CaO | 1.56 | 2.10 | 3.12 | 2.14 | 0.19 |
| SrO | 0.00 | 0.00 | 0.61 | 0.00 | 0.03 |
| MnO | 0.00 | 0.00 | 0.29 | 0.00 | 0.02 |
| MgO | 0.00 | 0.00 | 0.26 | 0.00 | 0.02 |
| PbO | 1.12 | 1.70 | 2.57 | 1.73 | 0.19 |
| ThO2 | 0.00 | 1.06 | 2.56 | 1.04 | 0.52 |
| Y2O3 | 0.00 | 0.00 | 0.74 | 0.10 | 0.17 |
| Ce2O3 | 0.00 | 0.00 | 0.59 | 0.01 | 0.06 |
| Al2O3 | 0.00 | 0.00 | 0.61 | 0.03 | 0.09 |
| Fe2O3* | 3.42 | 4.67 | 5.79 | 4.62 | 0.34 |
| SiO2 | 0.18 | 1.44 | 2.85 | 1.44 | 0.32 |
| V2O5 | 0.00 | 0.00 | 0.60 | 0.06 | 0.14 |
| ZrO2 | 0.00 | 0.00 | 0.57 | 0.00 | 0.02 |
| H2O* | 1.76 | 5.24 | 7.09 | 5.13 | 0.73 |
| Apfu (6 O) | |||||
| U | 0.68 | 0.74 | 0.80 | 0.74 | 0.02 |
| Ca | 0.11 | 0.15 | 0.22 | 0.15 | 0.01 |
| Sr | 0.00 | 0.00 | 0.02 | 0.00 | 0.00 |
| Mn | 0.00 | 0.00 | 0.02 | 0.00 | 0.00 |
| Mg | 0.00 | 0.00 | 0.03 | 0.00 | 0.00 |
| Pb | 0.02 | 0.03 | 0.05 | 0.03 | 0.00 |
| Th | 0.00 | 0.02 | 0.04 | 0.02 | 0.01 |
| Y | 0.00 | 0.00 | 0.03 | 0.00 | 0.01 |
| Ce | 0.00 | 0.00 | 0.01 | 0.00 | 0.00 |
| Sum(A) | 0.87 | 0.94 | 1.03 | 0.94 | 0.02 |
| (excl. U) | 0.16 | 0.20 | 0.26 | 0.20 | 0.01 |
| Ti | 1.64 | 1.72 | 1.80 | 1.72 | 0.03 |
| Al | 0.00 | 0.00 | 0.05 | 0.00 | 0.01 |
| Fe | 0.17 | 0.24 | 0.29 | 0.23 | 0.02 |
| Si | 0.01 | 0.10 | 0.19 | 0.10 | 0.02 |
| V | 0.00 | 0.00 | 0.03 | 0.00 | 0.01 |
| Zr | 0.00 | 0.00 | 0.02 | 0.00 | 0.00 |
| Sum(B) | 1.97 | 2.06 | 2.13 | 2.06 | 0.02 |
| (excl. Ti) | 0.24 | 0.33 | 0.44 | 0.33 | 0.03 |
| Av. U valency | 4.70 | 4.82 | 4.95 | 4.82 | 0.04 |
| U4+ | 0.36 | 0.44 | 0.51 | 0.44 | 0.02 |
| U6+ | 0.26 | 0.30 | 0.35 | 0.30 | 0.01 |
| n(H2O) | 0.38 | 1.17 | 1.58 | 1.15 | 0.17 |
| Name | Si | Ti | Fe | Ca | K | Ce | La | Dy | Y | Th | U | Pb | O | Total |
|---|---|---|---|---|---|---|---|---|---|---|---|---|---|---|
| u1-1 | 0.15 | 0.34 | 0 | 0.35 | 0.44 | 0.49 | 0 | 0.27 | 0.78 | 76.78 | 3.77 | 14.18 | 97.55 | |
| u1-2 | 0.13 | 0.34 | 0 | 0.4 | 0.5 | 0.49 | 0 | 0.24 | 1.27 | 76.41 | 3.62 | 14.65 | 98.05 | |
| u1-3 | 0.13 | 0.36 | 0 | 0.52 | 0.39 | 0.44 | 0 | 0.31 | 2.79 | 74.49 | 3.67 | 14.49 | 97.59 | |
| u1-4 | 0.14 | 0.34 | 0.07 | 0.53 | 0.4 | 0.44 | 0.18 | 0.35 | 0.49 | 76.68 | 3.68 | 14.8 | 98.1 | |
| u1-5 | 0.14 | 0.36 | 0.1 | 0.46 | 0.35 | 0.41 | 0 | 0.29 | 0.78 | 76.82 | 3.78 | 14.45 | 97.94 | |
| u1-6 | 0.13 | 0.35 | 0 | 0.13 | 0.36 | 0.41 | 0 | 0.3 | 0.47 | 77.88 | 3.76 | 14.13 | 97.92 | |
| u1-7 | 0.14 | 0.32 | 0 | 0.42 | 0.44 | 0.43 | 0 | 0.26 | 3.74 | 74.74 | 3.73 | 14.09 | 98.31 | |
| u1-8 | 0.13 | 0.34 | 0 | 0.32 | 0.44 | 0.45 | 0 | 0.27 | 3.64 | 75.58 | 3.77 | 14.58 | 99.52 | |
| u1-9 | 0.14 | 0.34 | 0 | 0.23 | 0.39 | 0.41 | 0 | 0.27 | 0.62 | 78 | 3.66 | 14.84 | 98.9 | |
| u1-10 | 0.12 | 0.32 | 0.08 | 0.2 | 0.36 | 0.45 | 0 | 0.29 | 0.57 | 78.35 | 3.78 | 14.55 | 99.07 | |
| u1-11 | 0.11 | 0.36 | 0 | 0.18 | 0.31 | 0.46 | 0 | 0.31 | 0.49 | 78.33 | 3.81 | 14.4 | 98.76 | |
| u1-12 | 0.16 | 0.35 | 0 | 0.07 | 0.41 | 0.49 | 0 | 0.25 | 2.08 | 77.06 | 3.69 | 14.13 | 98.69 | |
| u1-13 | 0.13 | 0.36 | 0.08 | 0.59 | 0.35 | 0.35 | 0.17 | 0.53 | 2.41 | 74.67 | 3.67 | 14.51 | 97.82 | |
| u1-14 | 0.12 | 0.35 | 0.07 | 0.42 | 0.43 | 0.44 | 0 | 0.46 | 2.23 | 76.04 | 3.72 | 14.75 | 99.03 | |
| u1-15 | 0.19 | 0.35 | 0.09 | 0.05 | 0.36 | 0.43 | 0 | 0.27 | 2.05 | 77.08 | 3.73 | 14.13 | 98.73 | |
| u2-1 | 0.1 | 0.49 | 0.1 | 1.67 | 0.33 | 1.55 | 68.88 | 0 | 22.86 | 95.98 | ||||
| u2-2 | 0.43 | 0.08 | 0.27 | 1.35 | 71 | 0 | 21.2 | 94.33 | ||||||
| u2-3 | 0.11 | 0.48 | 0.09 | 0.32 | 1.37 | 70.67 | 0 | 26.58 | 99.62 | |||||
| u2-4 | 0.07 | 0.41 | 0.1 | 1.92 | 0.29 | 1.19 | 72.89 | 0 | 22.42 | 99.29 | ||||
| u2-5 | 0.07 | 0.35 | 0 | 1.88 | 0.26 | 1 | 70.31 | 0.13 | 20.09 | 94.09 |
| Sample | Point | SiO2 | Al2O3 | FeOtot | Na2O | K2O | BaO | Total |
|---|---|---|---|---|---|---|---|---|
| C6-04 | 317 | 65.49 | 18.71 | 0.58 | 16.15 | 0.56 | 101.48 | |
| C6-04 | 322 | 68.01 | 17.72 | 0.26 | 0.19 | 15.92 | 102.10 | |
| C6-04 | 325 | 66.37 | 17.04 | 0.26 | 0.19 | 15.37 | 101.23 | |
| C6-04 | 315 | 99.03 | 1.21 | 1.25 | 0,23 | 101,72 | ||
| C6-04 | 326 | 100.06 | 0.70 | 0.41 | 0.23 | 101.40 |
| S_P | SiO2 | TiO2 | Al2O3 | FeOtot | MnO | MgO | CaO | K2O | ZnO | P2O5 |
|---|---|---|---|---|---|---|---|---|---|---|
| C6_313 | 26.02 | 0.22 | 17.77 | 35.61 | 0.26 | 2.58 | 0.2 | 4.04 | 0.62 | 0.69 |
| C6_316 | 29.48 | 0.3 | 19.27 | 33.54 | 0.42 | 1.02 | 0.7 | 2 | 0.31 | 0.86 |
| C6_318 | 31.42 | 0.29 | 18.31 | 25.14 | 0.37 | 8.11 | 0.3 | 2.97 | 0.68 | 0.29 |
| C6_323 | 30.45 | 17.7 | 26.47 | 0.45 | 10.83 | 0.22 | 0.97 | 0.49 | 0.32 | |
| C6_323 | 30.9 | 18.38 | 24.44 | 0.44 | 12.12 | 0.24 | 1.11 | 0.27 |
| Type | I | II | III | IV |
|---|---|---|---|---|
| fineness | 798–945 | 676–764 | 445–648 | 885–946 |
| Possible source | Nazarovskoe gold-zinc skarn deposit | Veins of chalcedony quartz with gold-silver mineralization | Serpentinization zones of basic and ultrabasic rocks | |
| Deposit/Ore Mineralization Type | Age, Geochemical Association | Geologic Setting | Secondary Alteration | Mineral Type of the Ores | Deposits, Ore District |
|---|---|---|---|---|---|
| Unconformity related deposits: (a)-Fracture controlled; (b)-Clay bounded; (c) endogenic, in zones of structural-stratigraphic unconformities; (d) Proterozoic base overlain by Mesozoic cover | Paleo-, Mezo-, Proterozoic (1700–1600 million years; 1600–900 million years) U, Au, Ni, Cu, Ag, As, Co, Pt, Pb | Paleoproterozoic metamorphic base (pelites, arcoses, metamorphosed in amphibolite facies carbonates); gneisses with graphite, often with weathering crust; overlain by Mesoproterozoic sediments; rocks deformed and brecciated: (a) ores in basement; (b) in overlying deposits | Chloritization, argillitization, seritization, carbonatization | Ore mineralization in breccias, veinlike breccias, disseminated in shales: Uraninite (Urn), Nasturan, rare coffinite (Cof), brannerite (Bnr), organic-uran minerals, gold, pyrite (Py), chalcopyrite (Ccp), graphite (Gr). | Athabasca Basin: McArthur River, Rabbit Lake, Eagle Point, McClean Lake, Dominique-Peter in Canada; Jabiluka, Ranger, Nabarlek, Koongarra (the Alligator River region) in Australia; Kuranah |
| «Brecciated» Hematite breccia complex deposits (IOCGU): (a) Granite-rich breccias; (b) Hematite-rich breccias | From ~2570 to 1000 million years. U, Au, Cu, Ag, REE, Fe. | They are found in a number of different tectonic settings (rift, subduction zones, basin collapse) | Sericitization, chloritization, hematitization | U-Au-Cu granite-derived matrix; hematite-quartz breccias, hematite breccias; Au, nasturan, bornite (Bn), chalcopyrite (Ccp) | Olympic Dam South Australia; Prominent Hill, Emest Henry, Starra, Osborne in Australia; Candelaria, Salobo, Sossego in South America; Michelin, Sue-Dianne in Canada, Igarapé Bahia Deposit (Brazil) |
| Deposit/ore mineralization type | Age, geochemical association | Geologic setting | Secondary alteration | Mineral type of the ores | Deposits, ore district |
| Endogenic in areas of tectonic-magmatic activity of the Precambrian craton Metasomatic U deposits: (a) alkaline metasomatites of sodium series; (b) potassium (elkonites) series; (c) albitization in black shales (shungites) | a–1900–1600 million years: U, Au, Ag, Th, Mo; b–155–123 million years: U, Au; c-Au, PGE, U, V? | a-stockworks and lenses in granites, migmatites and pegmatites; b–tabular-,veinlike-, lenslike-form body in crystalline schists, migmatites, granites; c–albitization zones in shungites | a-albitization, amphibolization, pyroxenitization (aceites); b–kalishpatization (elconites); c-albitization | a–U, Au, Ag, Th-U brannerite-uraninite, coffinite-brannerite; b–Au-U-brannerite, rare Au-U-uraninite | a–Yuzhnoye, Lozovatskoye (Ukraine), Rossing (Namibia), Itatiaia (Brasil), Kokchetavskiy massif; b-Druzhnoye, Kurung, Snezhnoye (Elconskiy ore district); c–Sr.Padma (Onezhskiy trough Baltic craton) |
| Endogenic in areas of tectonic-magmatic activity of the folded regions. Vein deposits (granite related deposits) | U, Au, Mo, Th, Zr, P2O5 | Column-shaped, lens- and veinlike deposits in sandstones, carbon shales, diabases, granites and limstones controlled by faulded and crushed zones | Low-temperature Na-metasomatism zones; lightening in black shales | U, P-U, Mo-U; arshinovite-molybdenite-brannerite-nasturan; F-apatite-uraninite | Manybayiskoe, Zaozernoe (Kazakhstan), Shinkolobwe (DR Congo) |
| Deposits in multiple phase alkaline intrusions Intrusive deposits | Au, U, Cu, Nb, REE, Fe | Disseminated uranothorianite occurs in cupriferous carbonatite complexes. | Sulfidization | REE, U, Th, Au | Palabora (South Africa) |
| Au-U conglomerates Quartz pebble conglomerate deposits | 3070–2200; 1900 million years Au, U, REE | Superimposed troughs in the marginal parts of ancient platforms; oligomictic quartz-pebble conglomerate horizons (termed reef), from 0.5 to >3.5 m thick | Sericitization, chloritization, pyritization | Au-U, Au, U-uraninite, PGM, uranthorite, uranthorianite, monazite, and xenotime are prevailing | Witwatersrand Basin, Jacobina (Brasil), Tarkva (Gana), Blind-River (Canada). |
Disclaimer/Publisher’s Note: The statements, opinions and data contained in all publications are solely those of the individual author(s) and contributor(s) and not of MDPI and/or the editor(s). MDPI and/or the editor(s) disclaim responsibility for any injury to people or property resulting from any ideas, methods, instructions or products referred to in the content. |
© 2023 by the authors. Licensee MDPI, Basel, Switzerland. This article is an open access article distributed under the terms and conditions of the Creative Commons Attribution (CC BY) license (https://creativecommons.org/licenses/by/4.0/).
Share and Cite
Zhmodik, S.M.; Airiyants, E.V.; Belyanin, D.K.; Damdinov, B.B.; Karmanov, N.S.; Kiseleva, O.N.; Kozlov, A.V.; Mironov, A.A.; Moroz, T.N.; Ponomarchuk, V.A. Native Gold and Unique Gold–Brannerite Nuggets from the Placer of the Kamenny Stream, Ozerninsky Ore Cluster (Western Transbakalia, Russia) and Possible Sources. Minerals 2023, 13, 1149. https://doi.org/10.3390/min13091149
Zhmodik SM, Airiyants EV, Belyanin DK, Damdinov BB, Karmanov NS, Kiseleva ON, Kozlov AV, Mironov AA, Moroz TN, Ponomarchuk VA. Native Gold and Unique Gold–Brannerite Nuggets from the Placer of the Kamenny Stream, Ozerninsky Ore Cluster (Western Transbakalia, Russia) and Possible Sources. Minerals. 2023; 13(9):1149. https://doi.org/10.3390/min13091149
Chicago/Turabian StyleZhmodik, Sergey M., Evgeniya V. Airiyants, Dmitriy K. Belyanin, Bulat B. Damdinov, Nikolay S. Karmanov, Olga N. Kiseleva, Alexander V. Kozlov, Alexander A. Mironov, Tatyana N. Moroz, and Victor A. Ponomarchuk. 2023. "Native Gold and Unique Gold–Brannerite Nuggets from the Placer of the Kamenny Stream, Ozerninsky Ore Cluster (Western Transbakalia, Russia) and Possible Sources" Minerals 13, no. 9: 1149. https://doi.org/10.3390/min13091149
APA StyleZhmodik, S. M., Airiyants, E. V., Belyanin, D. K., Damdinov, B. B., Karmanov, N. S., Kiseleva, O. N., Kozlov, A. V., Mironov, A. A., Moroz, T. N., & Ponomarchuk, V. A. (2023). Native Gold and Unique Gold–Brannerite Nuggets from the Placer of the Kamenny Stream, Ozerninsky Ore Cluster (Western Transbakalia, Russia) and Possible Sources. Minerals, 13(9), 1149. https://doi.org/10.3390/min13091149