
Study on Correlations between Tailings Particle Size Distribution and Rheological Properties of Filling Slurries

Abstract
:1. Introduction
2. Materials and Methods
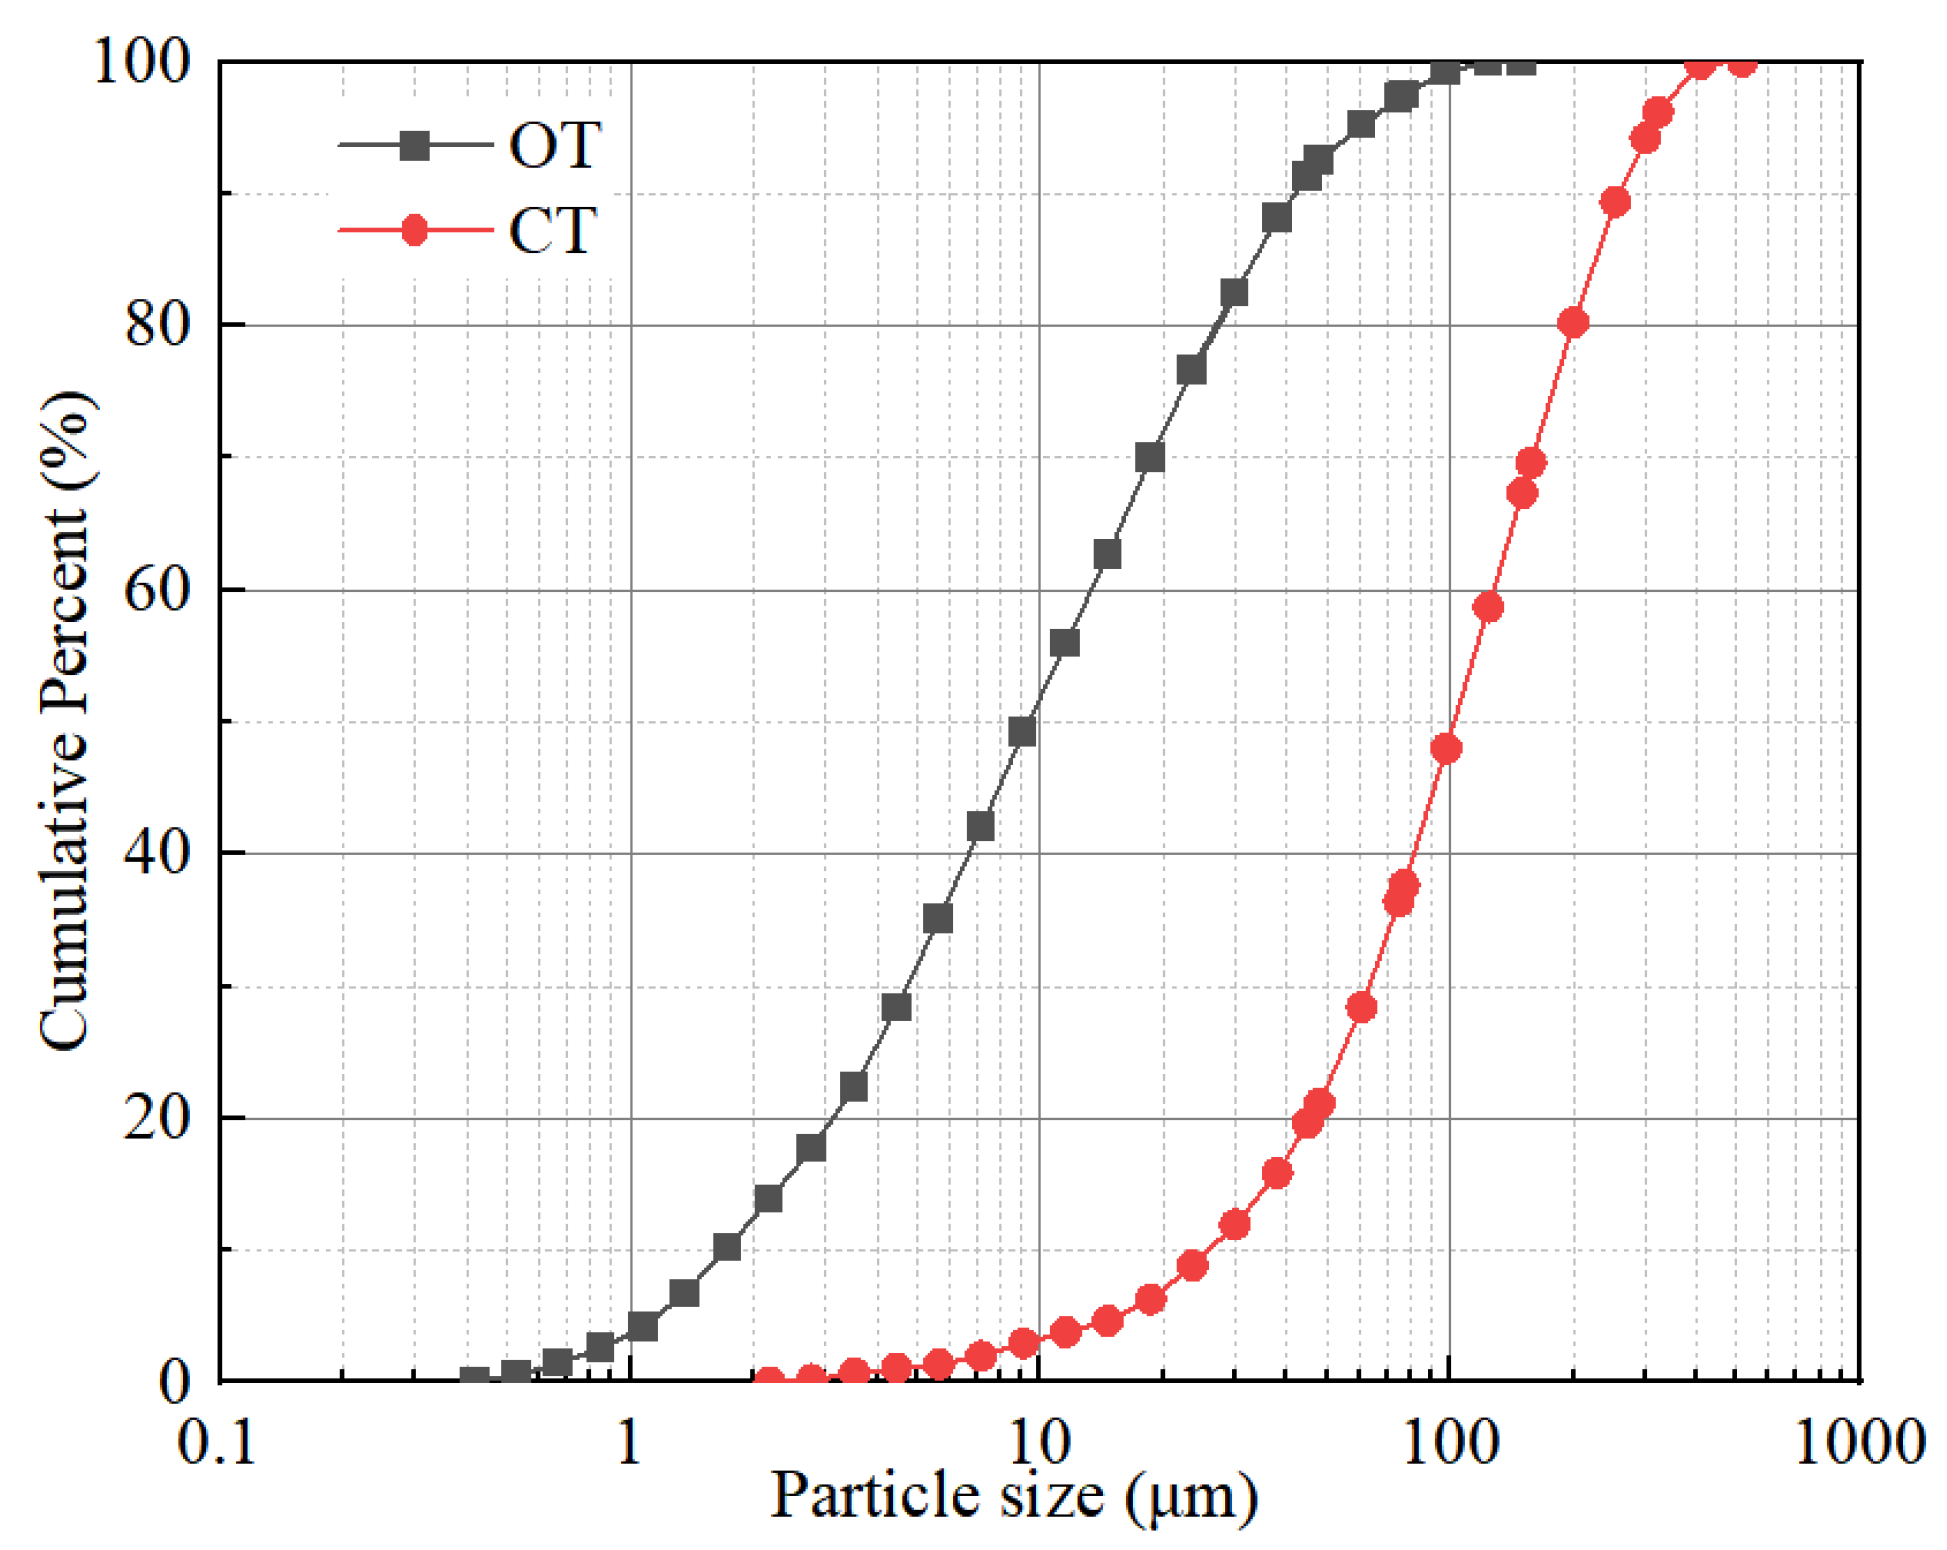
2.1. Materials
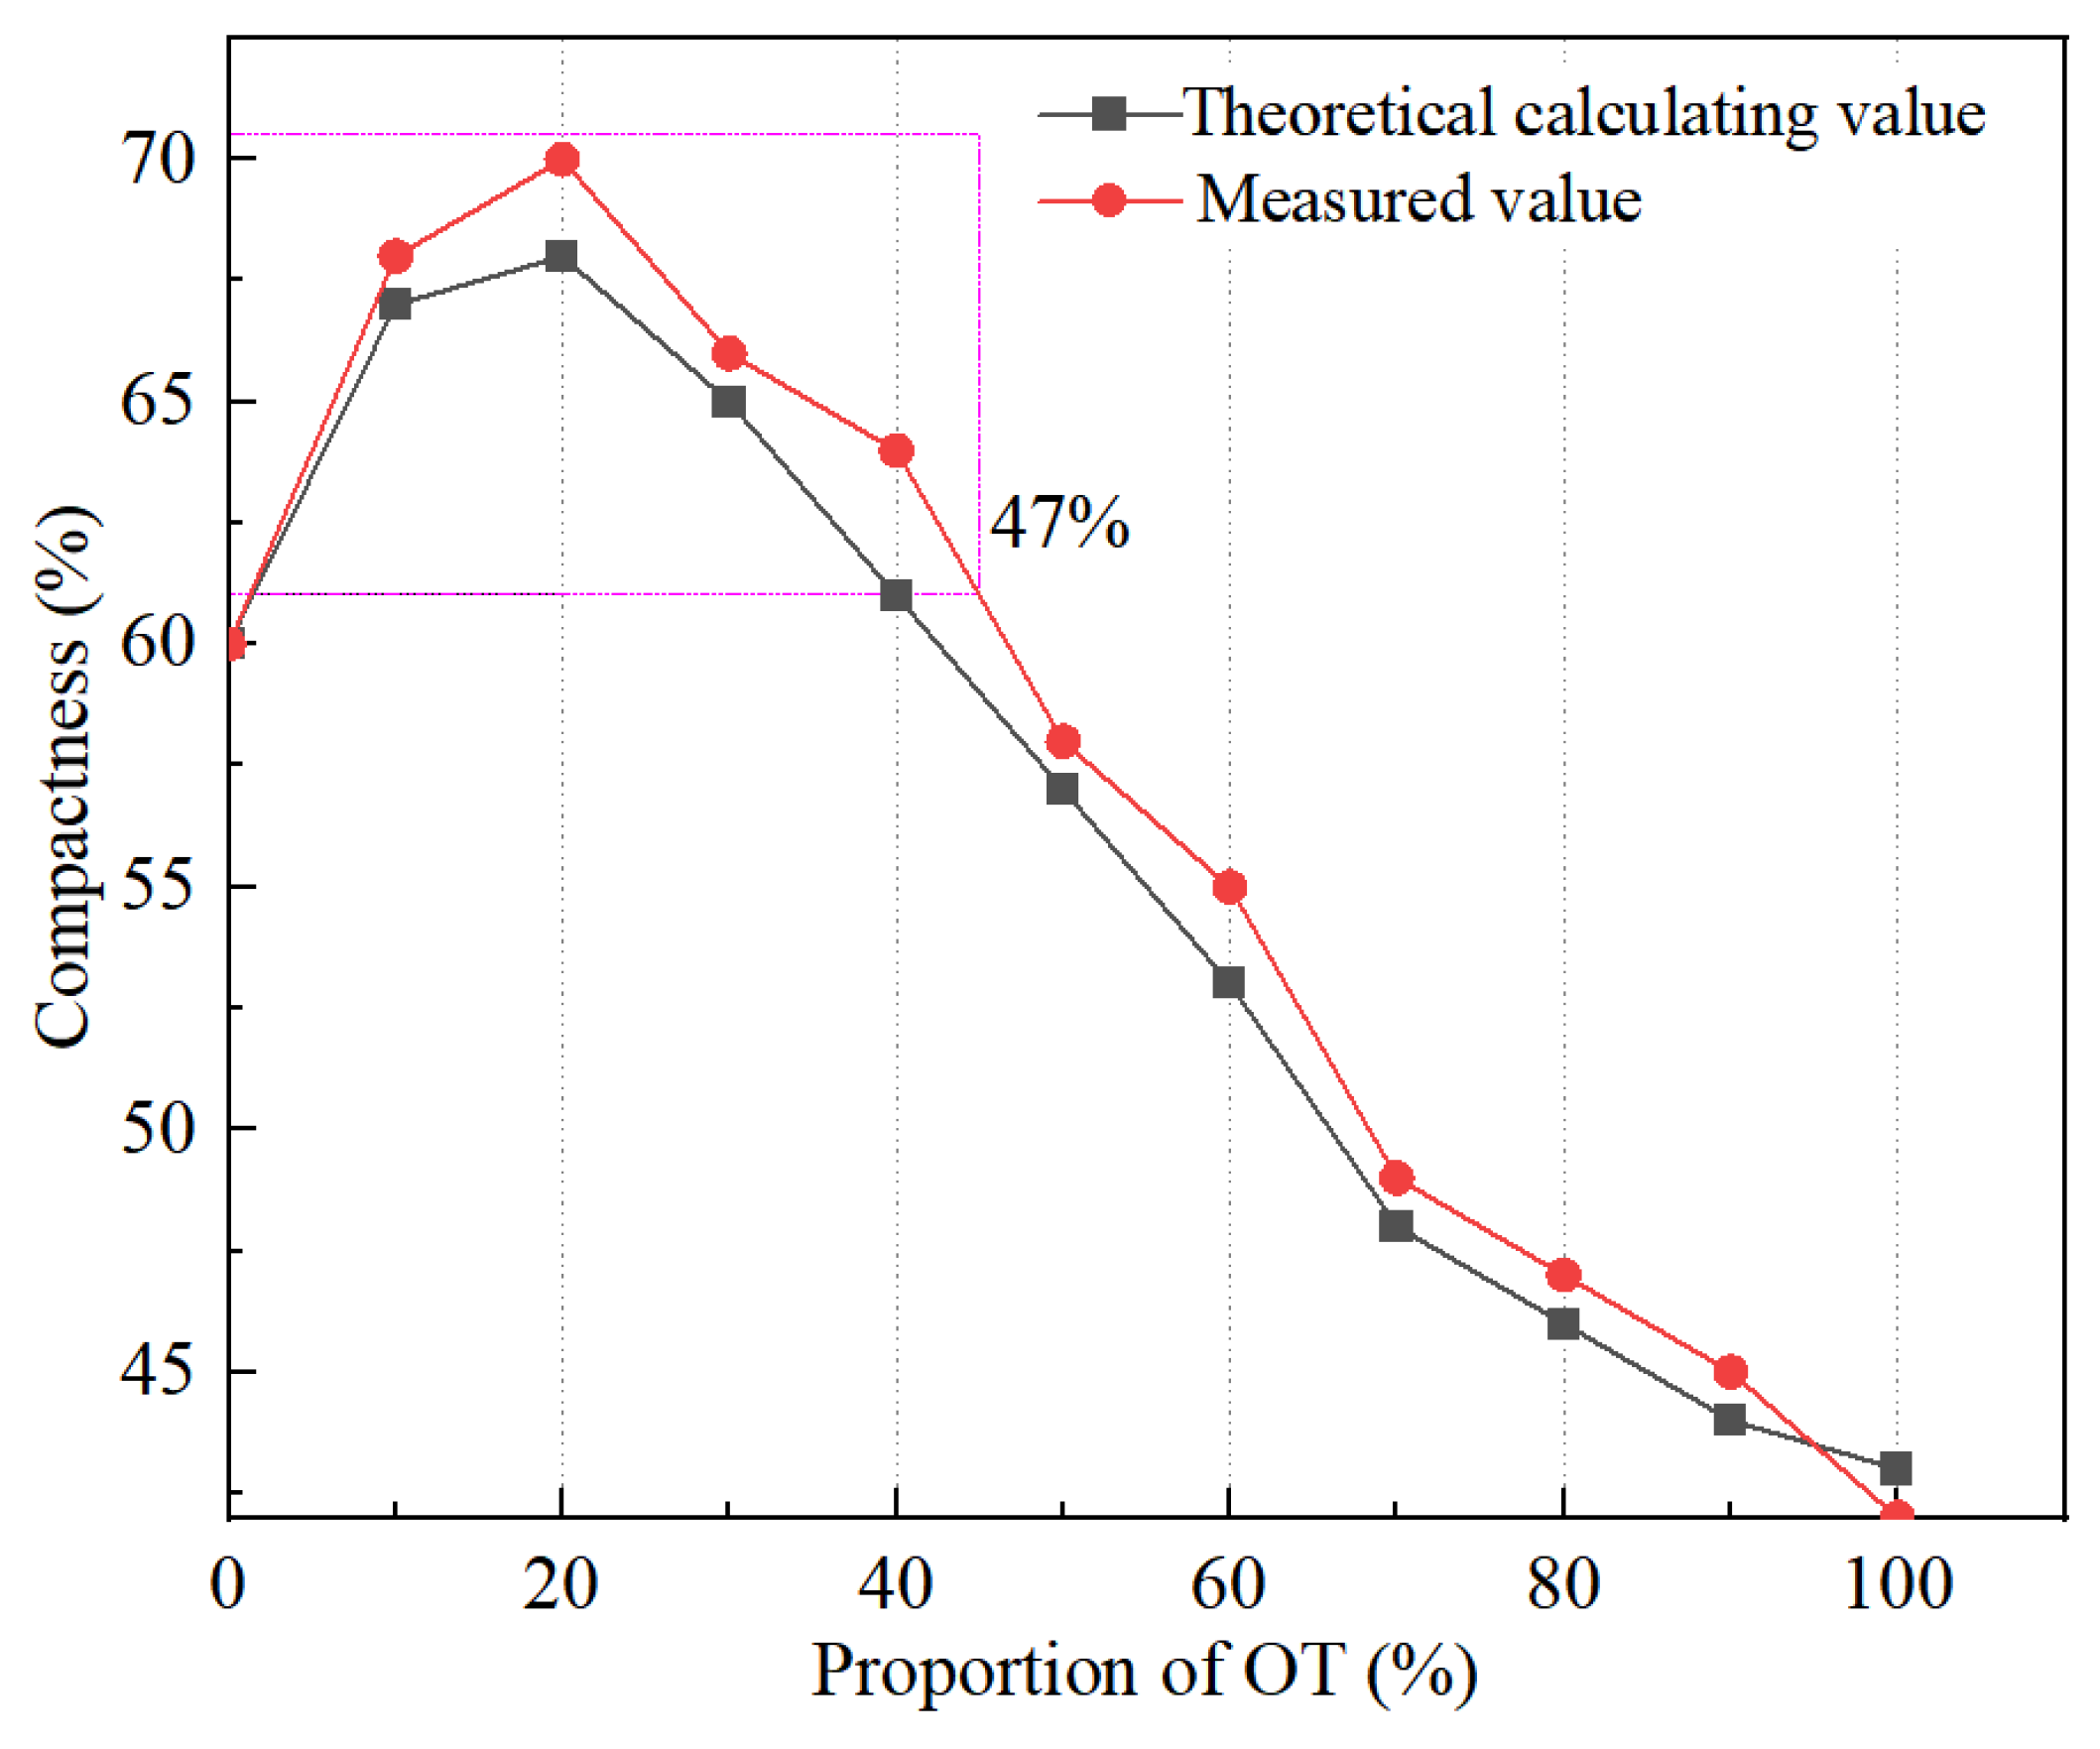
2.2. Mixing Tailings Aggregate Ratio and Particle Gradation Characteristics
2.3. Experimental Methods
3. Results and Discussion
3.1. Experimental Results
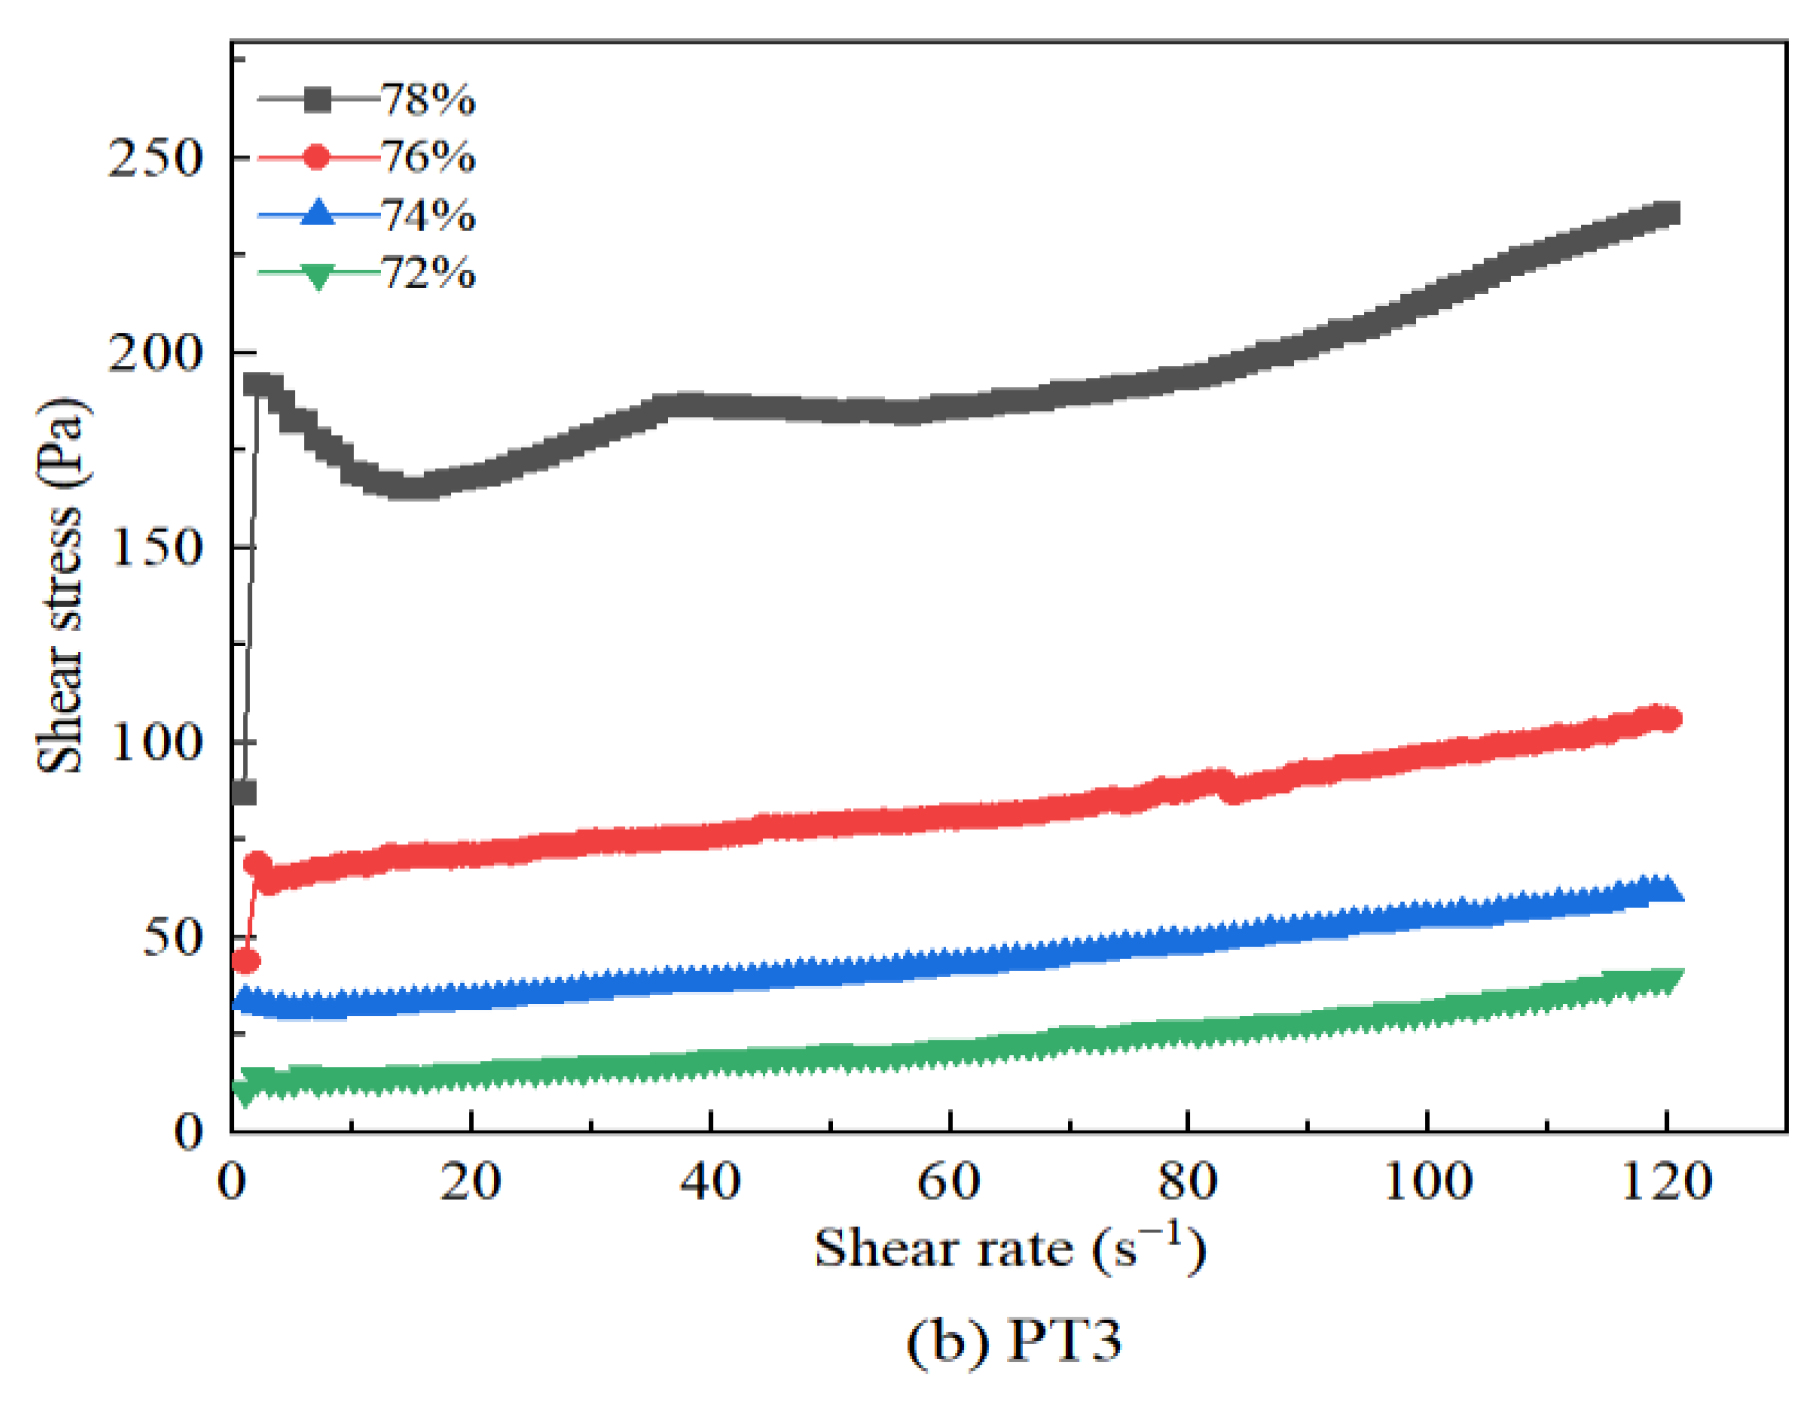
3.2. Analysis of the Rheological Properties of the Tailings Slurry
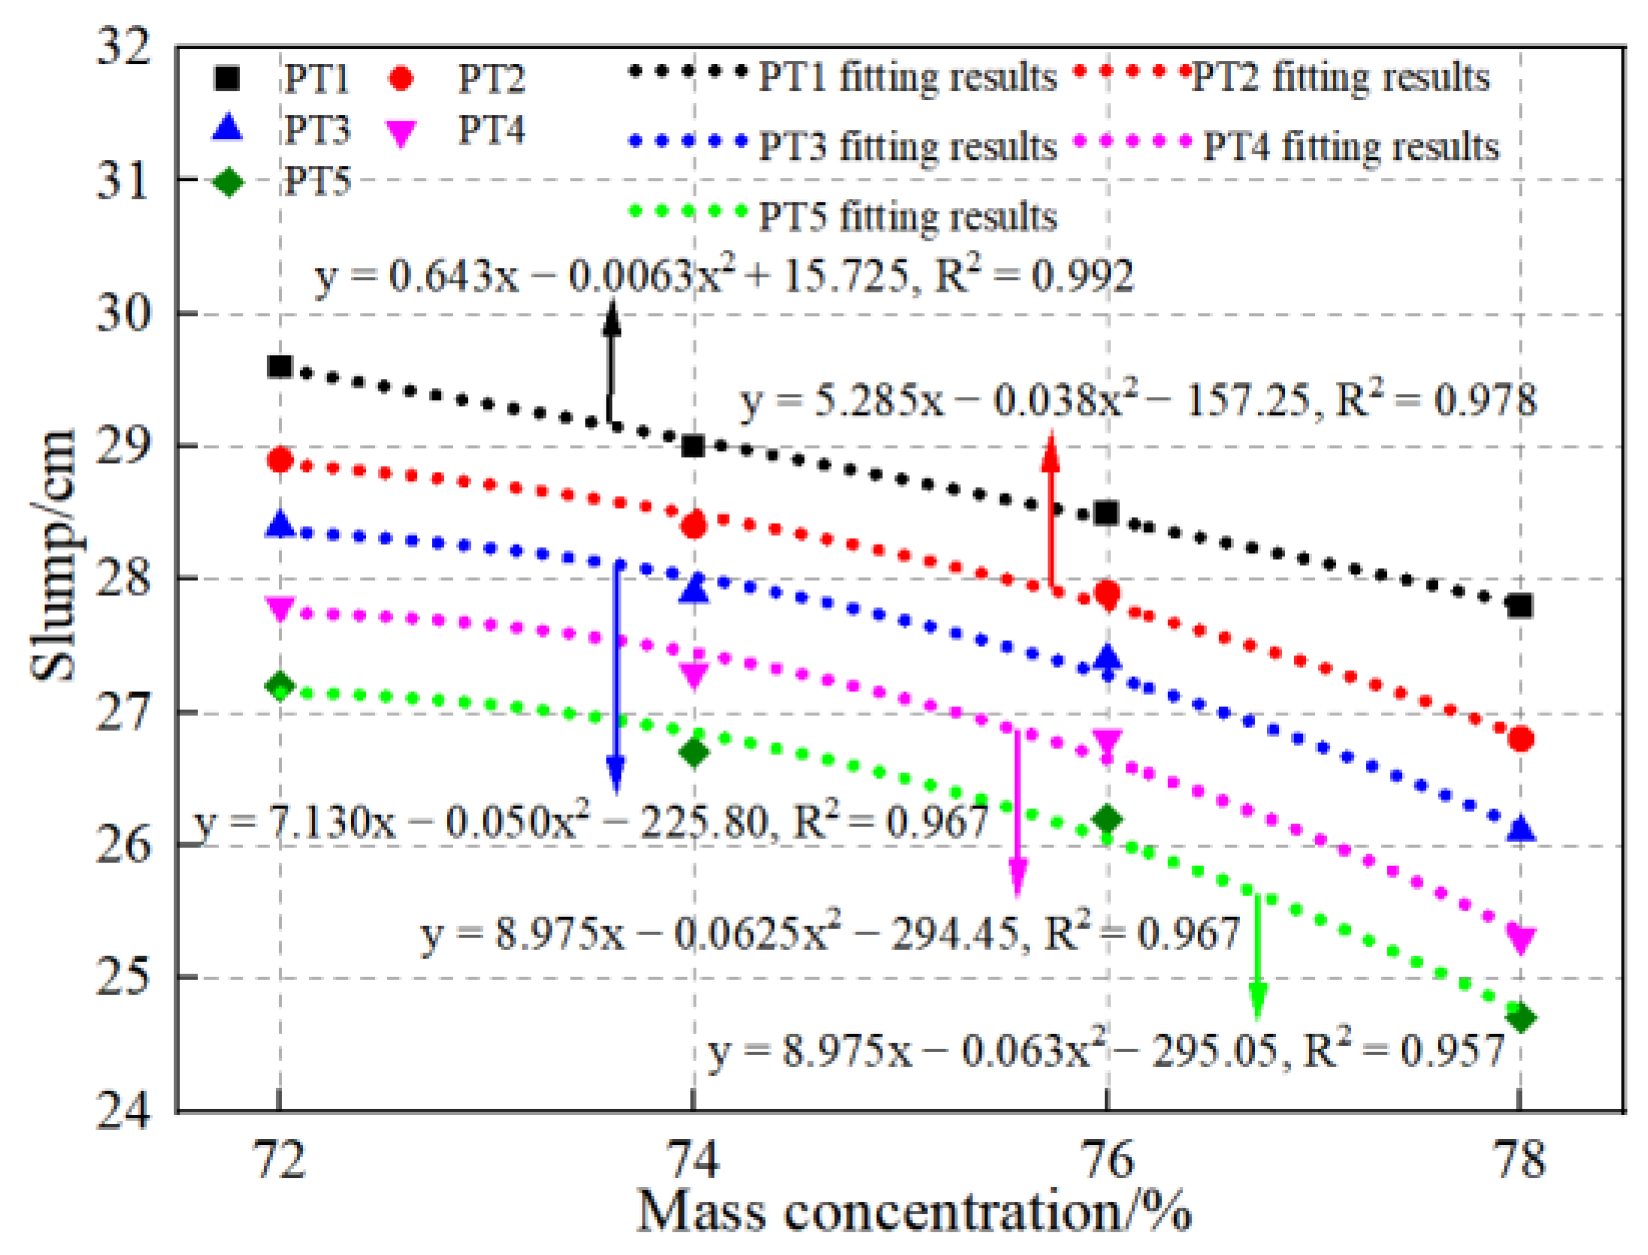
3.3. The Variation Characteristics of the Tailings Slurry Slump
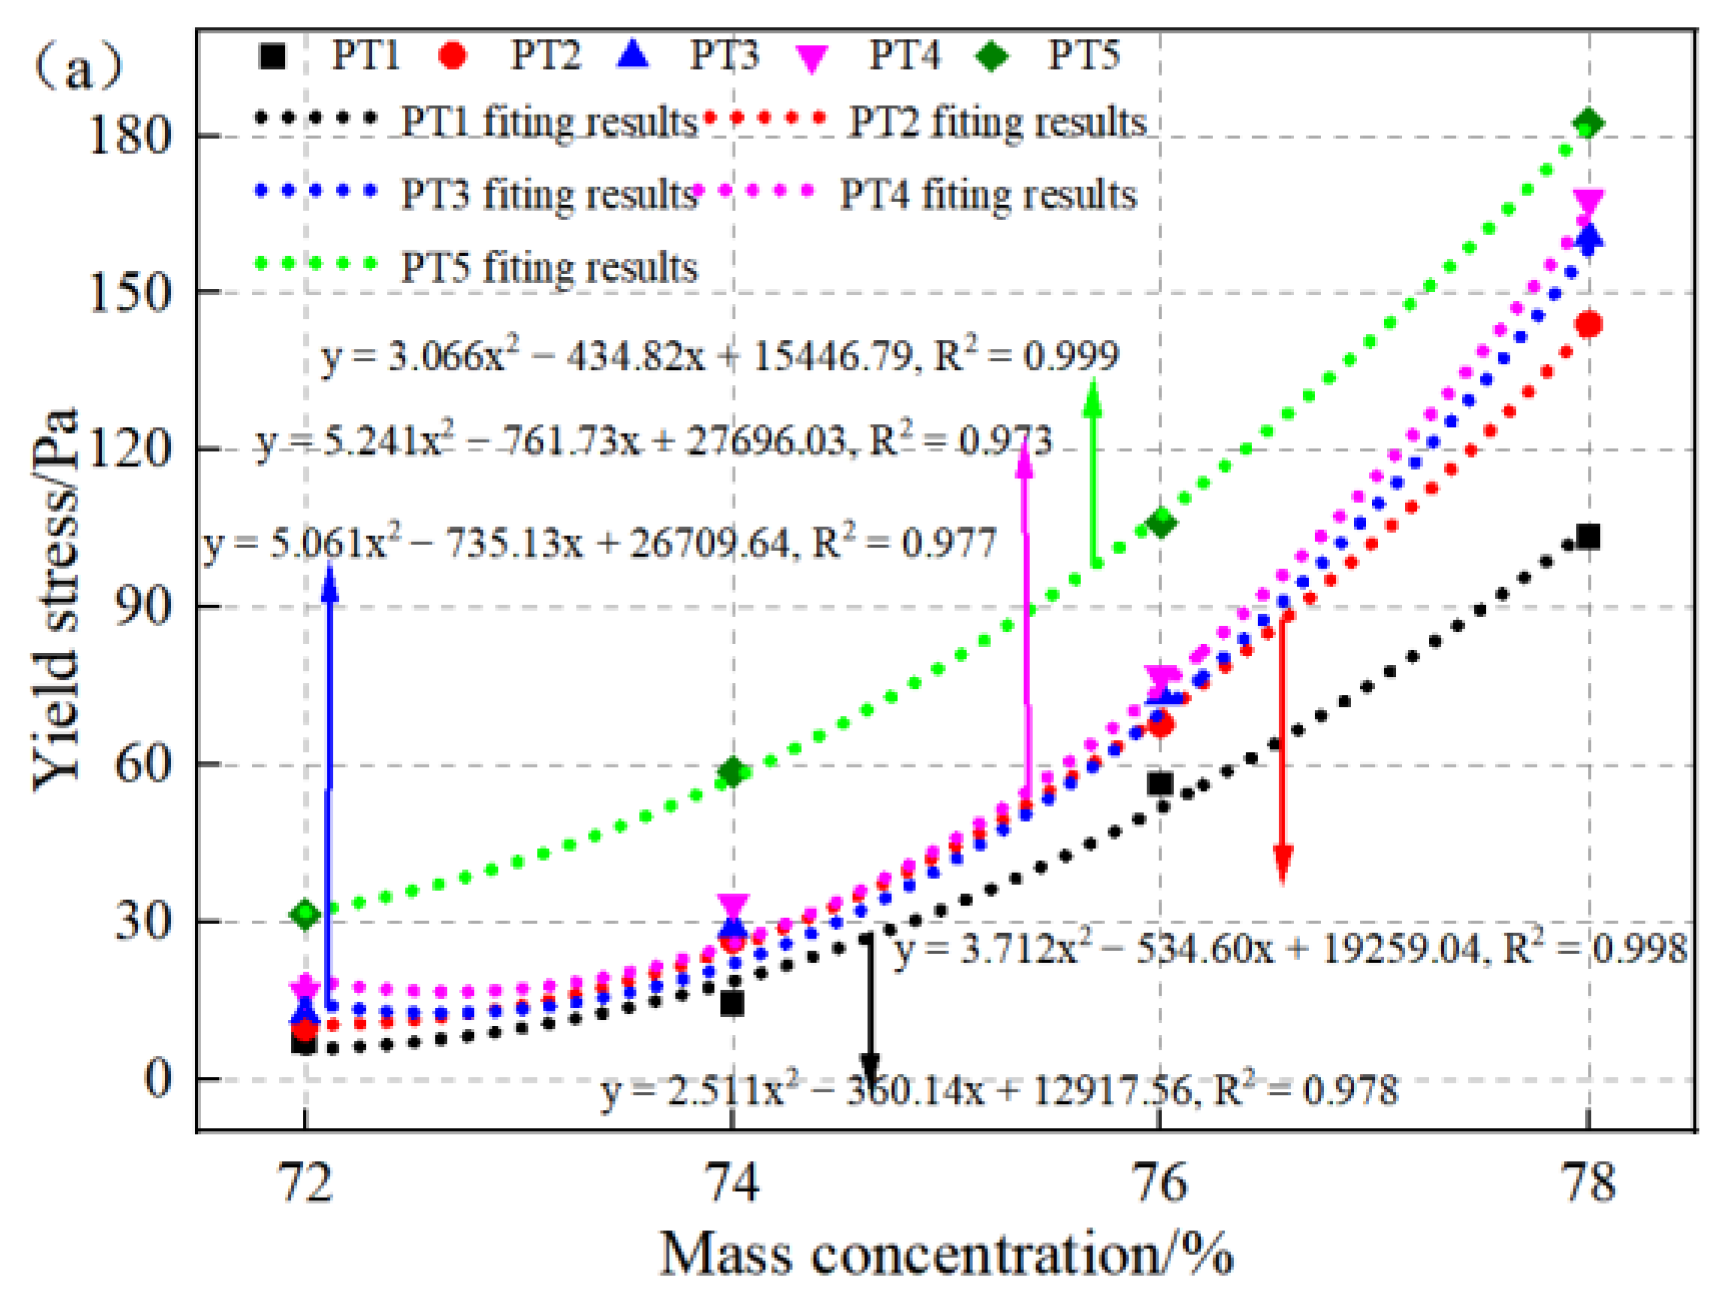
3.4. Variation Characteristics of the Rheological Parameters of the Tailings Slurry
4. The Correlation between the Rheological Parameters and Slump and Tailings Particle Gradation
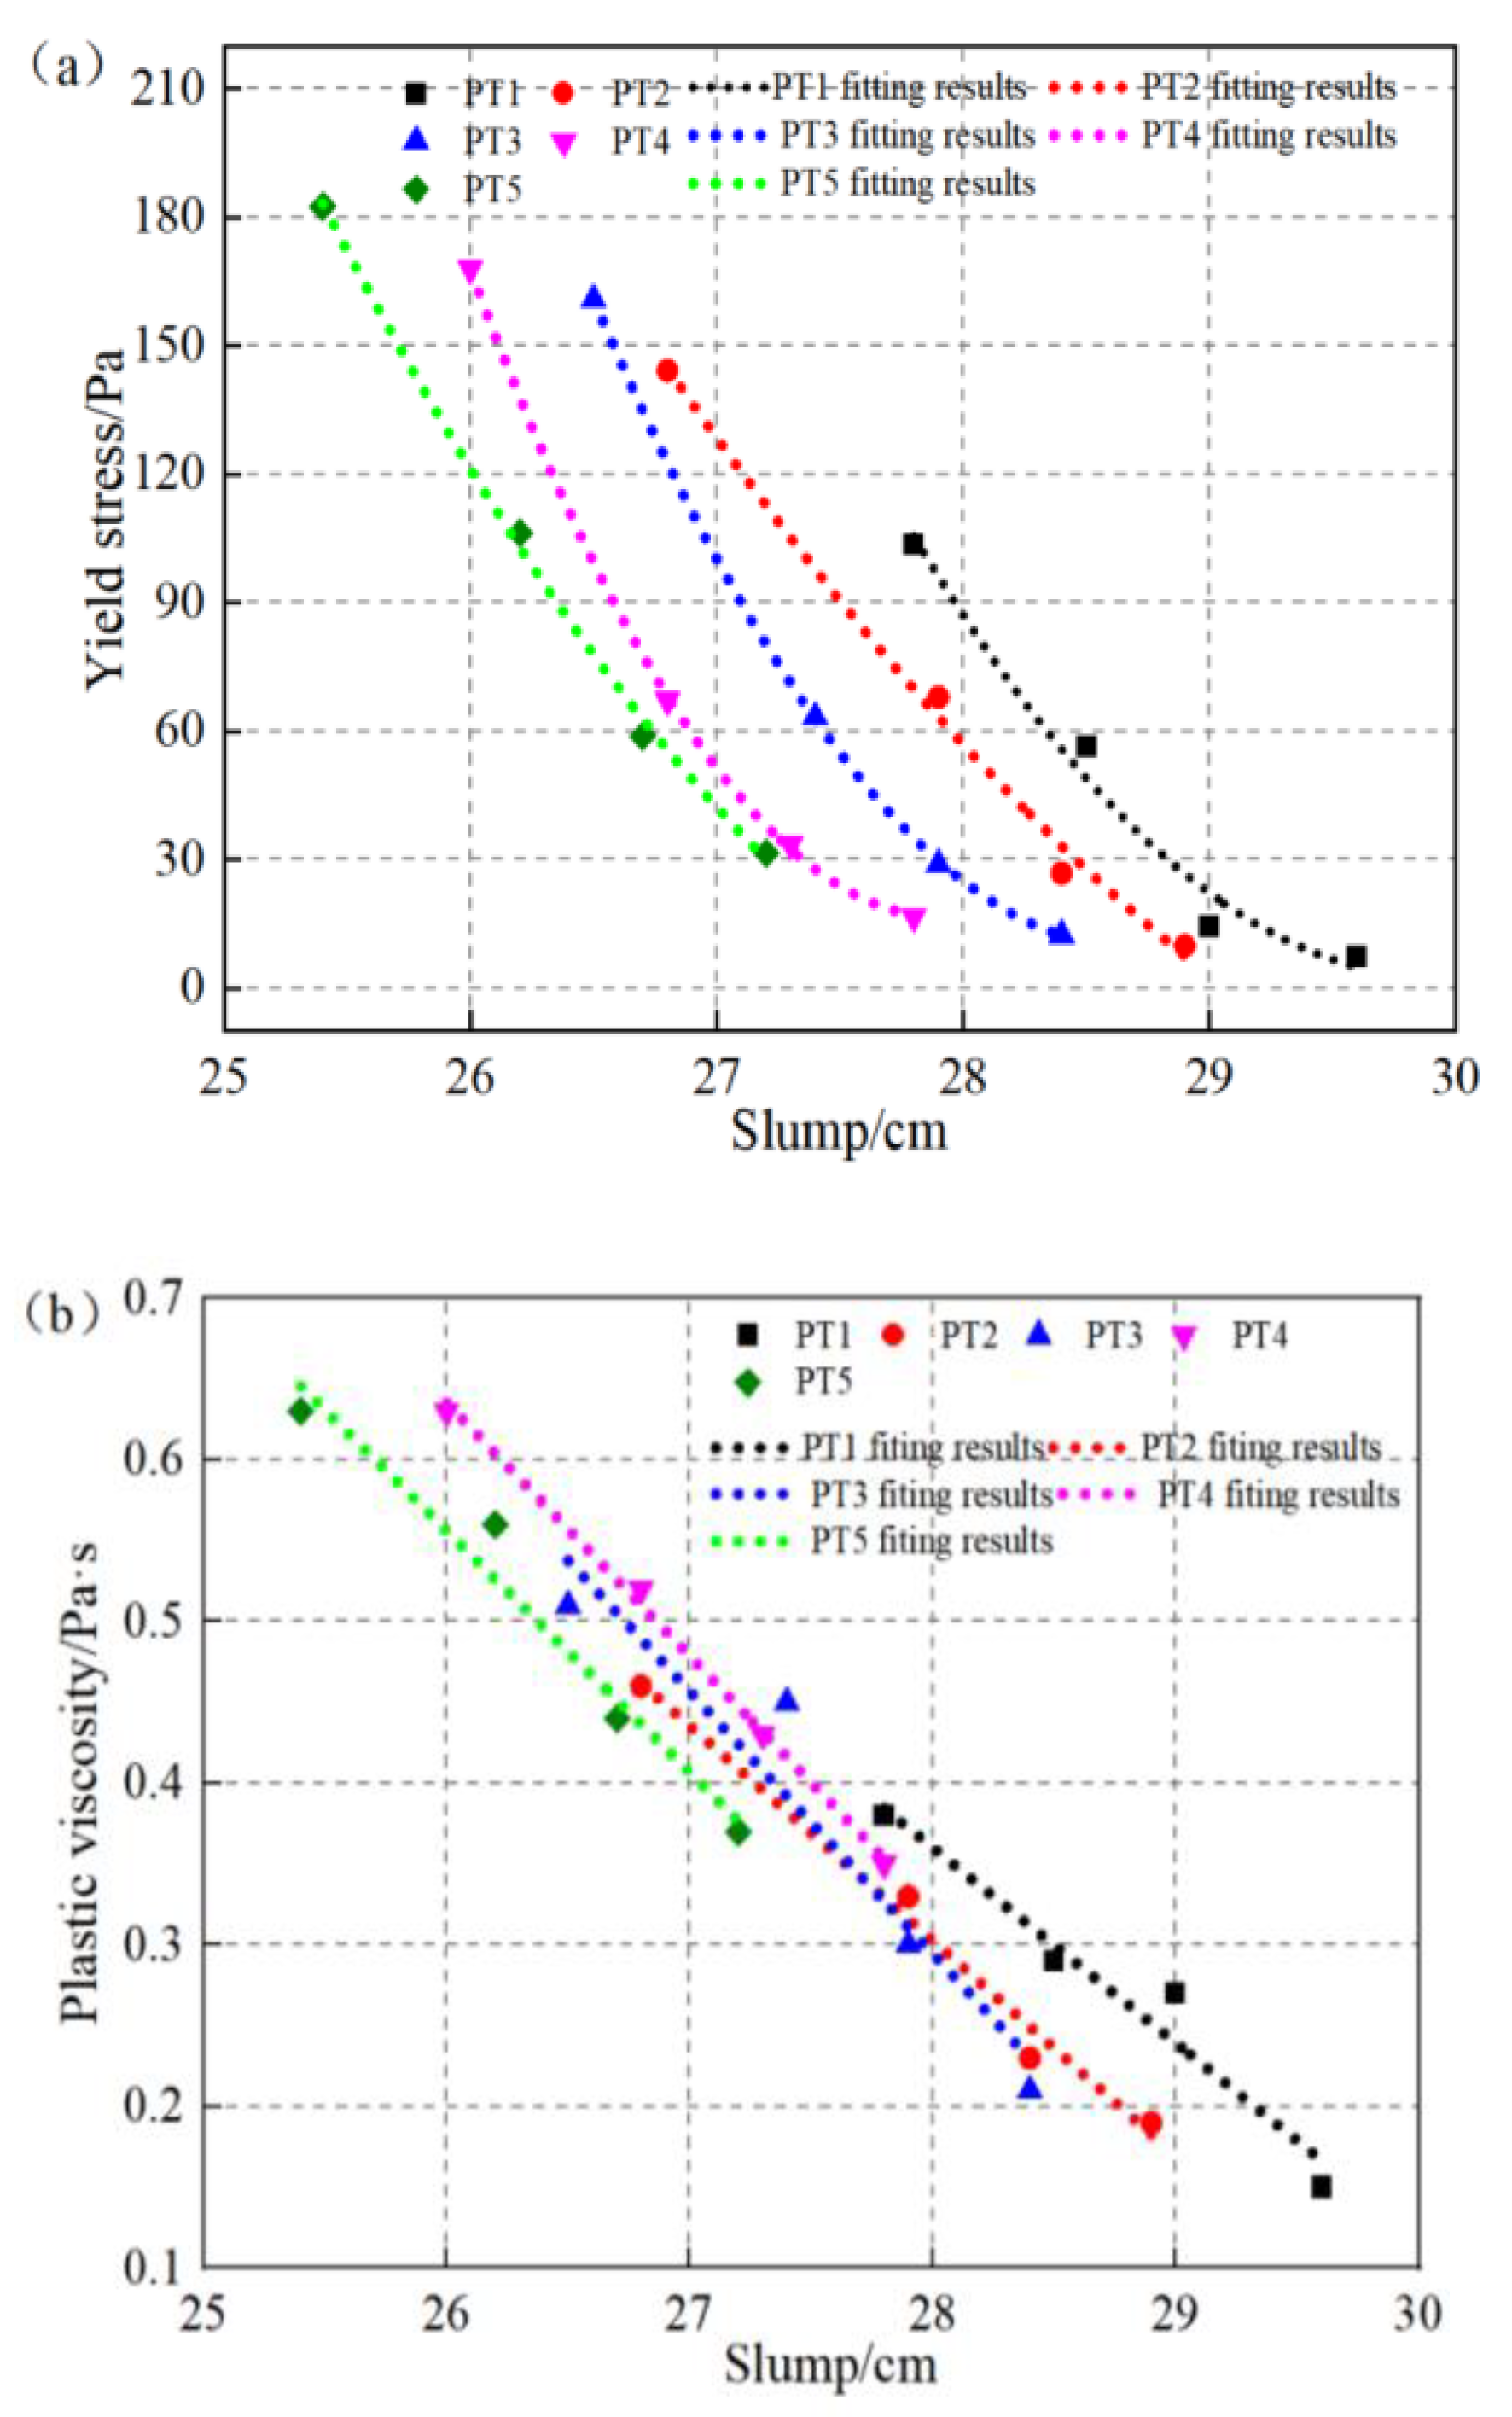
4.1. Relationship between the Rheological Parameters and Slump of Different Types of Tailings Slurries
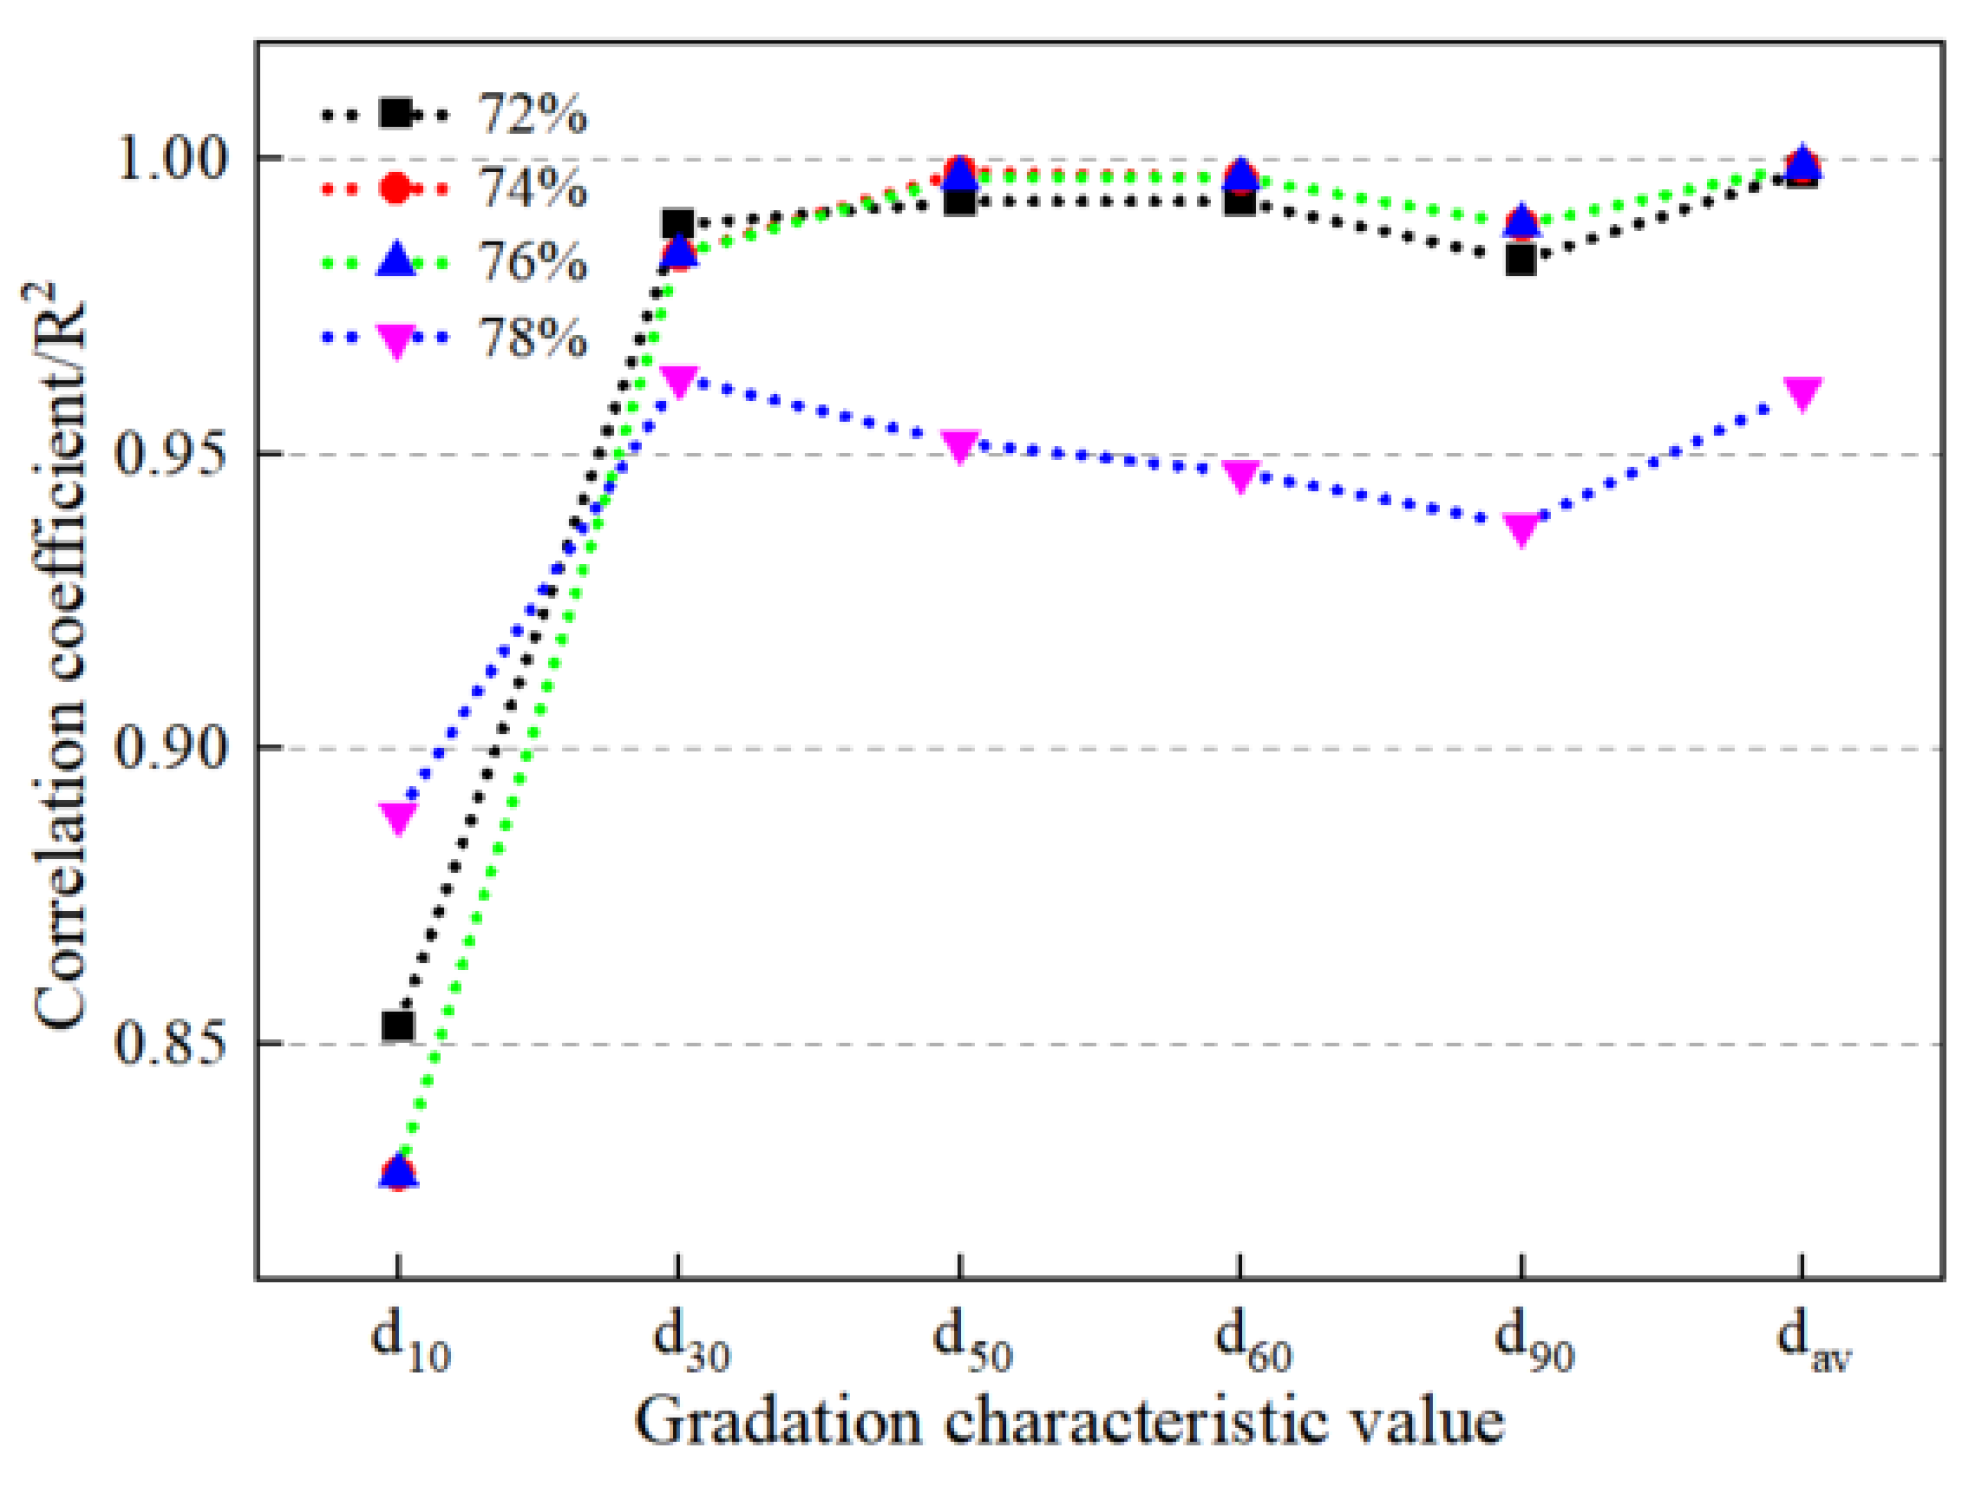
4.2. Correlation Analysis of the Slump and Particle Gradation
4.3. Correlation Analysis of Rheological Parameters and Particle Size Distribution
5. Tailings Ratio Optimization
6. Conclusions
- (1)
- The slump of the tailings slurry shows a quadratic function decreasing trend with the increase in the mass concentration, and the decrease in the slump increases with the decrease in the particle size. The sensitivity of the tailings slurry slump to the mass concentration increases with the decrease in the tailings particle size.
- (2)
- With the increase in the mass concentration, the yield stress of the tailings slurry basically follows the law of quadratic function increasing, while the plastic viscosity shows a linear growth law. The thicker the tailings particles are, the greater the increase in the yield stress and plastic viscosity is. The sensitivity of the yield stress and plastic viscosity to the mass concentration decreases with the increase in the fine particles of the tailings slurry.
- (3)
- The yield stress of different types of tailings slurries basically follows the trend of a quadratic function decreasing with the increase in the slump, while the plastic viscosity basically follows the linear growth law with the increase in the slump.
- (4)
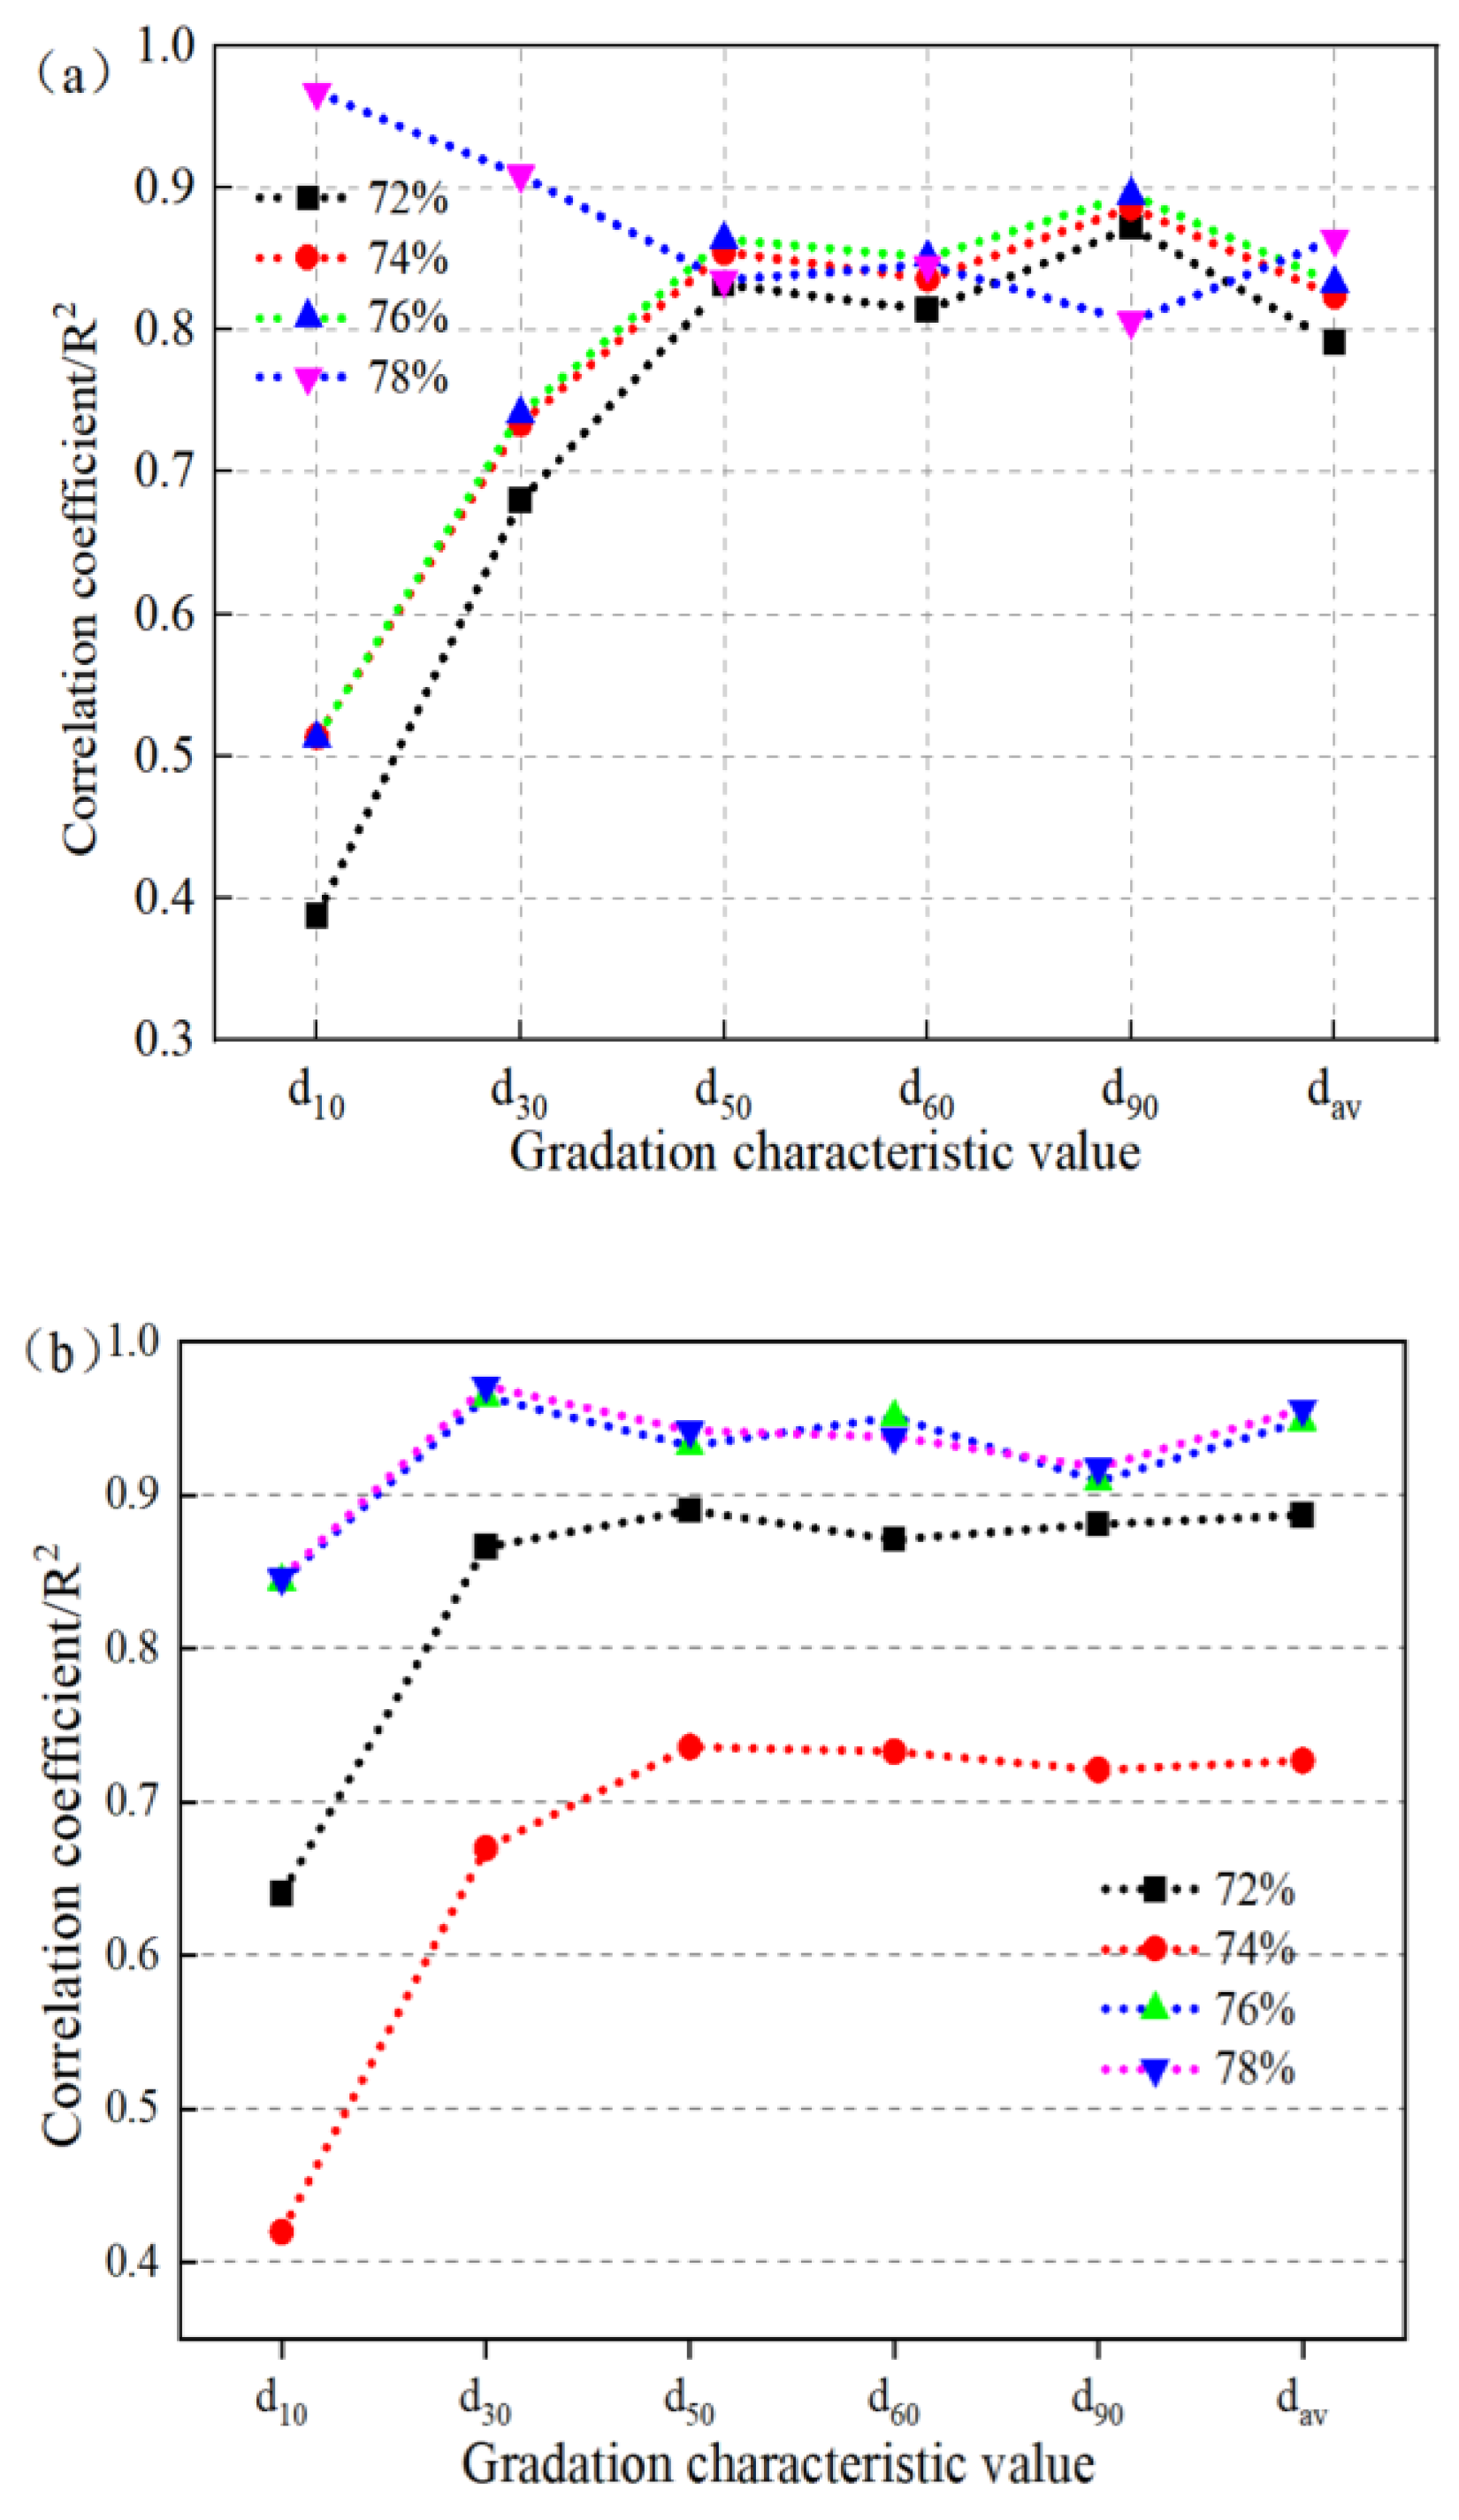
- At different mass concentrations, the slump of the tailings slurry is extremely correlated with the characteristic particle size of the particles, and the degree of correlation between the slump and the characteristic particle size also has a certain relationship with the mass concentration range of the slurry. The specific performance is as follows: when the mass concentration is low, the correlation between the slump and the aggregate size grading parameters gradually increases with the increase in the characteristic particle size, but when the concentration is high, the increase in the mass concentration will weaken the correlation between the slump of the tailings slurry and the characteristic particle size.
- (5)
- When the mass concentration is 72~76%, the correlation coefficient increases most obviously at d10~d50, and the increase in the particle size characteristic value will enhance the correlation between the yield stress and particle gradation. The correlation coefficient between the plastic viscosity and gradation parameters increases first and then tends to be stable with the increase in the characteristic particle size, and the correlation coefficient increases most significantly at d10~d50, indicating that the change in the particle size in this range can have a significant impact on the plastic viscosity of the slurry.
- (6)
- When the mass concentration of the mine is designed to be 72%, the amount of overflow tailings (OT) can reach 8~39%, and when the mass concentration is designed to be 74%, the amount of overflow tailings (OT) can reach 8~23%, and the maximum mass concentration of the slurry should be less than 76%.
Author Contributions
Funding
Institutional Review Board Statement
Informed Consent Statement
Data Availability Statement
Conflicts of Interest
References
- Zhai, Y.; Wu, A.; Wang, H.; Chen, Q.; Xiao, Y.; Shou, Z. Threshold mass fraction of unclassified-tailings paste for backfill mining. Chin. J. Eng. 2011, 33, 795–799. [Google Scholar] [CrossRef]
- Han, B.; Wu, A.X.; Deng, J.; Wang, X.L. Backfill technical analysis based on reliability theory in the underhand drift cut-and-filling stoping. J. Cent. South Univ. Sci. Technol. 2006, 37, 583–587. [Google Scholar]
- Cui, G.; Chen, W.; Duan, H. Choice of Component Ratio of Cemented Backfill Pulp. J. China Univ. Min. Technol. 2004, 33, 311–313. [Google Scholar]
- Wu, A.; Ruan, Z.; Wang, J. Rheological behavior of paste in metal mines. Int. J. Miner. Metall. Mater. 2022, 29, 717–726. [Google Scholar] [CrossRef]
- Wu, A. Fundamentals of Paste Rheology in Metal Mines. Rheology of Paste in Metal Mines; Springer: Singapore, 2022; pp. 25–76. [Google Scholar] [CrossRef]
- Jiang, H.; Ren, L.; Gu, X.; Zheng, J.; Cui, L. Synergistic effect of activator nature and curing temperature on time-dependent rheological behavior of cemented paste backfill containing alkali-activated slag. Environ. Sci. Pollut. Res. 2023, 30, 12857–12871. [Google Scholar] [CrossRef]
- Yang, L.H.; Li, J.C.; Liu, H.B.; Jiao, H.Z.; Yin, S.H.; Chen, X.M.; Yang, Y. Systematic review of mixing technology for recycling waste tailings as cemented paste backfill in mines in China. Int. J. Miner. Metall. Mater. 2023, 30, 1430–1443. [Google Scholar] [CrossRef]
- Yang, L.H.; Li, J.C.; Jiao, H.Z.; Wu, A.; Yin, S. Research on the Homogenization Evaluation of Cemented Paste Backfill in the Preparation Process Based on Image Texture Features. Minerals 2022, 12, 1622. [Google Scholar] [CrossRef]
- Yang, L.H.; Jia, H.W.; Jiao, H.Z.; Dong, M.M.; Yang, T.Y. The Mechanism of Viscosity-Enhancing Admixture in Backfill Slurry and the Evolution of Its Rheological Properties. Minerals 2023, 13, 1045. [Google Scholar] [CrossRef]
- Wu, A. Numerical Simulation of the Rheological Behavior of Paste. Rheology of Paste in Metal Mines; Springer: Singapore, 2022; pp. 311–366. [Google Scholar] [CrossRef]
- Liu, L.; Fang, Z.; Wang, M.; Qi, C.; Zhao, Y.; Huan, C. Experimental and numerical study on rheological properties of ice-containing cement paste backfill slurry. Powder Technol. 2020, 370, 206–214. [Google Scholar] [CrossRef]
- Zhao, Y.L.; Qiu, J.P.; Ma, Z.Y. Temperature-dependent rheological, mechanical and hydration properties of cement paste blended with iron tailings. Powder Technol. 2021, 381, 82–91. [Google Scholar] [CrossRef]
- Jiang, H.; Fall, M. Yield stress and strength of saline cemented tailings in sub-zero environments: Portland cement paste backfill. Int. J. Miner. Process. 2017, 160, 68–75. [Google Scholar] [CrossRef]
- Yang, L.H.; Wang, H.J.; Wu, A.X.; Li, H.; Bruno, T.A.; Zhou, X.; Wang, X.T. Effect of mixing time on hydration kinetics and mechanical property of cemented paste backfill. Constr. Build. Mater. 2020, 247, 118516. [Google Scholar] [CrossRef]
- Cheng, L. Effect of Tailings Particle Size on Rheological Properties and Mechanical Strength of Cement-Steel Slag-Based Composite Filling Slurry. Min. Res. Dev. 2022, 42, 113–118. [Google Scholar] [CrossRef]
- Zhou, H.; Zhang, X.; Jiang, H.; Xue, C.Y.; Wang, H.S. Relation between slump and yield stress of tailing slurry with different particle sizes. J. Guangxi Univ. 2022, 47, 103–111. [Google Scholar] [CrossRef]
- Zhang, L.F.; Wu, A.X.; Wang, H.J.; Cheng, H.; Wang, Y. Evolution law of yield stress in paste tailings. Chin. J. Nonferrous Met. 2018, 28, 1631–1636. [Google Scholar] [CrossRef]
- Liu, J.; Gao, Z.; Cheng, Q.; Yin, S. Effect of Temperature on the Rheological Properties of Paste Backfill. Min. Metall. Eng. 2020, 40, 24–26+33. [Google Scholar] [CrossRef]
- Li, C.; Yan, B.; Wang, S.; Huang, Z. Variability behavior of yield stress for unclassified tailings pasted under measurement time-velocity double factors. Chin. J. Eng. 2020, 42, 1308–1317. [Google Scholar] [CrossRef]
- Zhang, X.; Qiao, D. Rheological property and yield stress forecasting model of high-density slurry with waste rock-tailings. J. Saf. Environ. 2015, 15, 278–283. [Google Scholar] [CrossRef]
- Ruan, Z.; Wu, A.; Wang, Y.; Wang, Y. Effect of flocculation sedimentation on the yield stress of thickened ultrafine tailings slurry. Chin. J. Eng. 2021, 43, 1276–1282. [Google Scholar] [CrossRef]
- Chen, Q.; Tao, Y.; Zhang, Q.; Qi, C. The rheological, mechanical and heavy metal leaching properties of cemented paste backfill under the influence of anionic polyacrylamide. Chemosphere 2022, 286, 131630. [Google Scholar] [CrossRef]
- Jiang, G.; Wu, A.; Wang, Y.; Li, J. The rheological behavior of paste prepared from hemihydrate phosphogypsum and tailing. Constr. Build. Mater. 2019, 229, 116870. [Google Scholar] [CrossRef]
- Yan, Z.; Yin, S.; Chen, X.; Wang, L. Rheological properties and wall-slip behavior of cemented tailing-waste rock backfill (CTWB) paste. Constr. Build. Mater. 2022, 324, 126723. [Google Scholar] [CrossRef]
- Yue, Y.; Kun, C.; Bo, P. Rheological properties of high concentration cemented backfilling slurry. Ejge 2016, 21, 1611–1620. [Google Scholar]
- Deng, X.J.; Klein, B.; Hallbom, D.J.; de Wit, B.; Zhang, J.X. Influence of particle size on the basic and time-dependent rheological behaviors of cemented paste backfill. J. Mater. Eng. Perform. 2018, 27, 3478–3487. [Google Scholar] [CrossRef]
- Huynh, L.; Beattie, D.A.; Fornasiero, D.; Ralston, J. Effect of polyphosphate and naphthalene sulfonate formaldehyde condensate on the rheological properties of dewatered tailings and cemented paste backfill. Miner. Eng. 2006, 19, 28–36. [Google Scholar] [CrossRef]
- Simon, D.; Grabinsky, M. Apparent yield stress measurement in cemented paste backfill. Int. J. Min. Reclam. Environ. 2013, 27, 231–256. [Google Scholar] [CrossRef]
- Xu, W.; Zhang, Y.; Zuo, X.; Hong, M. Time-dependent rheological and mechanical properties of silica fume modified cemented tailings backfill in low temperature environment. Cem. Concr. Compos. 2020, 114, 103804. [Google Scholar] [CrossRef]
- Dong, H.; Aziz, N.A.; Shafri, H.Z.M.; Ahmad, K.A.B. Computational fluid dynamics study on cemented paste backfill slurry. Constr. Build. Mater. 2023, 369, 130558. [Google Scholar] [CrossRef]
- Sharma, M.; Bishnoi, S.; Martirena, F.; Scrivener, K. Limestone calcined clay cement and concrete: A state-of-the-art review. Cem. Concr. Res. 2021, 149, 106564. [Google Scholar] [CrossRef]
- GB/T 50080-2016; Standard for Test Method of Performance on Ordinary Fresh Concrete(s). Ministry of Housing and Urban-Rural Development, People’s Republic of China: Beijing, China, 2016.
- Adiguzel, D.; Bascetin, A. The investigation of effect of particle size distribution on flow behavior of paste tailings. J. Environ. Manag. 2019, 243, 393–401. [Google Scholar] [CrossRef]
- Qian, G.A.O.; Xiaobing, Y.A.N.G.; Zhenjiang, W.E.N.; Dexin, C.H.E.N.; Jianyuan, H.E. Optimization of Proportioning of Mixed Aggregate Filling Slurry Based on BBD Response Surface Method. J. Hunan Univ. 2019, 46, 47–55. [Google Scholar] [CrossRef]
- Wu, A.; Liu, X.; Wang, H. Calculation of resistance in total tailings paste piping transportation based on time-varying behavior. J. China Univ. Min. Technol. 2013, 42, 736–740. [Google Scholar] [CrossRef]
- Wang, S.; Wu, A. Rheological properties of paste slurry and influence factors based on pipe loop test. J. Cent. South Univ. 2018, 49, 2520–2525. [Google Scholar] [CrossRef]
- Belem, T.; Benzaazoua, M. Design and application of underground mine paste backfill technology. Geotech. Geol. Eng. 2008, 26, 147–174. [Google Scholar] [CrossRef]
- Kabashi, V.; Liberto, T.; Robisson, A. Shear-induced particle migration in a cement slurry under oscillatory pipe flow. J. Non-Newton. Fluid Mech. 2023, 319, 105071. [Google Scholar] [CrossRef]
- Jossic, L.; Magnin, A. Drag and stability of objects in a yield stress fluid. AIChE J. 2001, 47, 2666–2672. [Google Scholar] [CrossRef]
- Wang, S.; Zhang, Q.; Wang, X. Influence of APAM on rheological properties of unclassified tailings paste-like and its pipeline transportation. J. Cent. South Univ. 2017, 48, 3271–3277. [Google Scholar] [CrossRef]
- Xu, W.B.; Yang, B.G.; Yang, S.L.; Dang, P. Experimental study on correlativity between rheological parameters and grain grading of coal gauge backfill slurry. J. Cent. South Univ. 2016, 47, 1282–1289. [Google Scholar] [CrossRef]


| Category | Particle Density (g/cm³) | Dense Density (g/cm³) | Compactness (%) | Porosity (%) | Permeability Coefficient (cm/s) |
|---|---|---|---|---|---|
| OT | 3.06 | 1.27 | 42 | 58 | 3.6 × 10⁻⁷ |
| CT | 3.11 | 1.84 | 60 | 40 | 6.8 × 10⁻³ |
| Category | CaO | SiO2 | SO3 | Fe2O3 | Al2O3 | MgO | ZnO | PbO | Other |
|---|---|---|---|---|---|---|---|---|---|
| CT | 24.64 | 23.85 | 21.20 | 16.40 | 7.23 | 2.14 | 0.98 | 0.96 | 2.6 |
| OT | 20.68 | 26.69 | 18.32 | 10.23 | 16.57 | 2.28 | 1.12 | 0.84 | 3.27 |
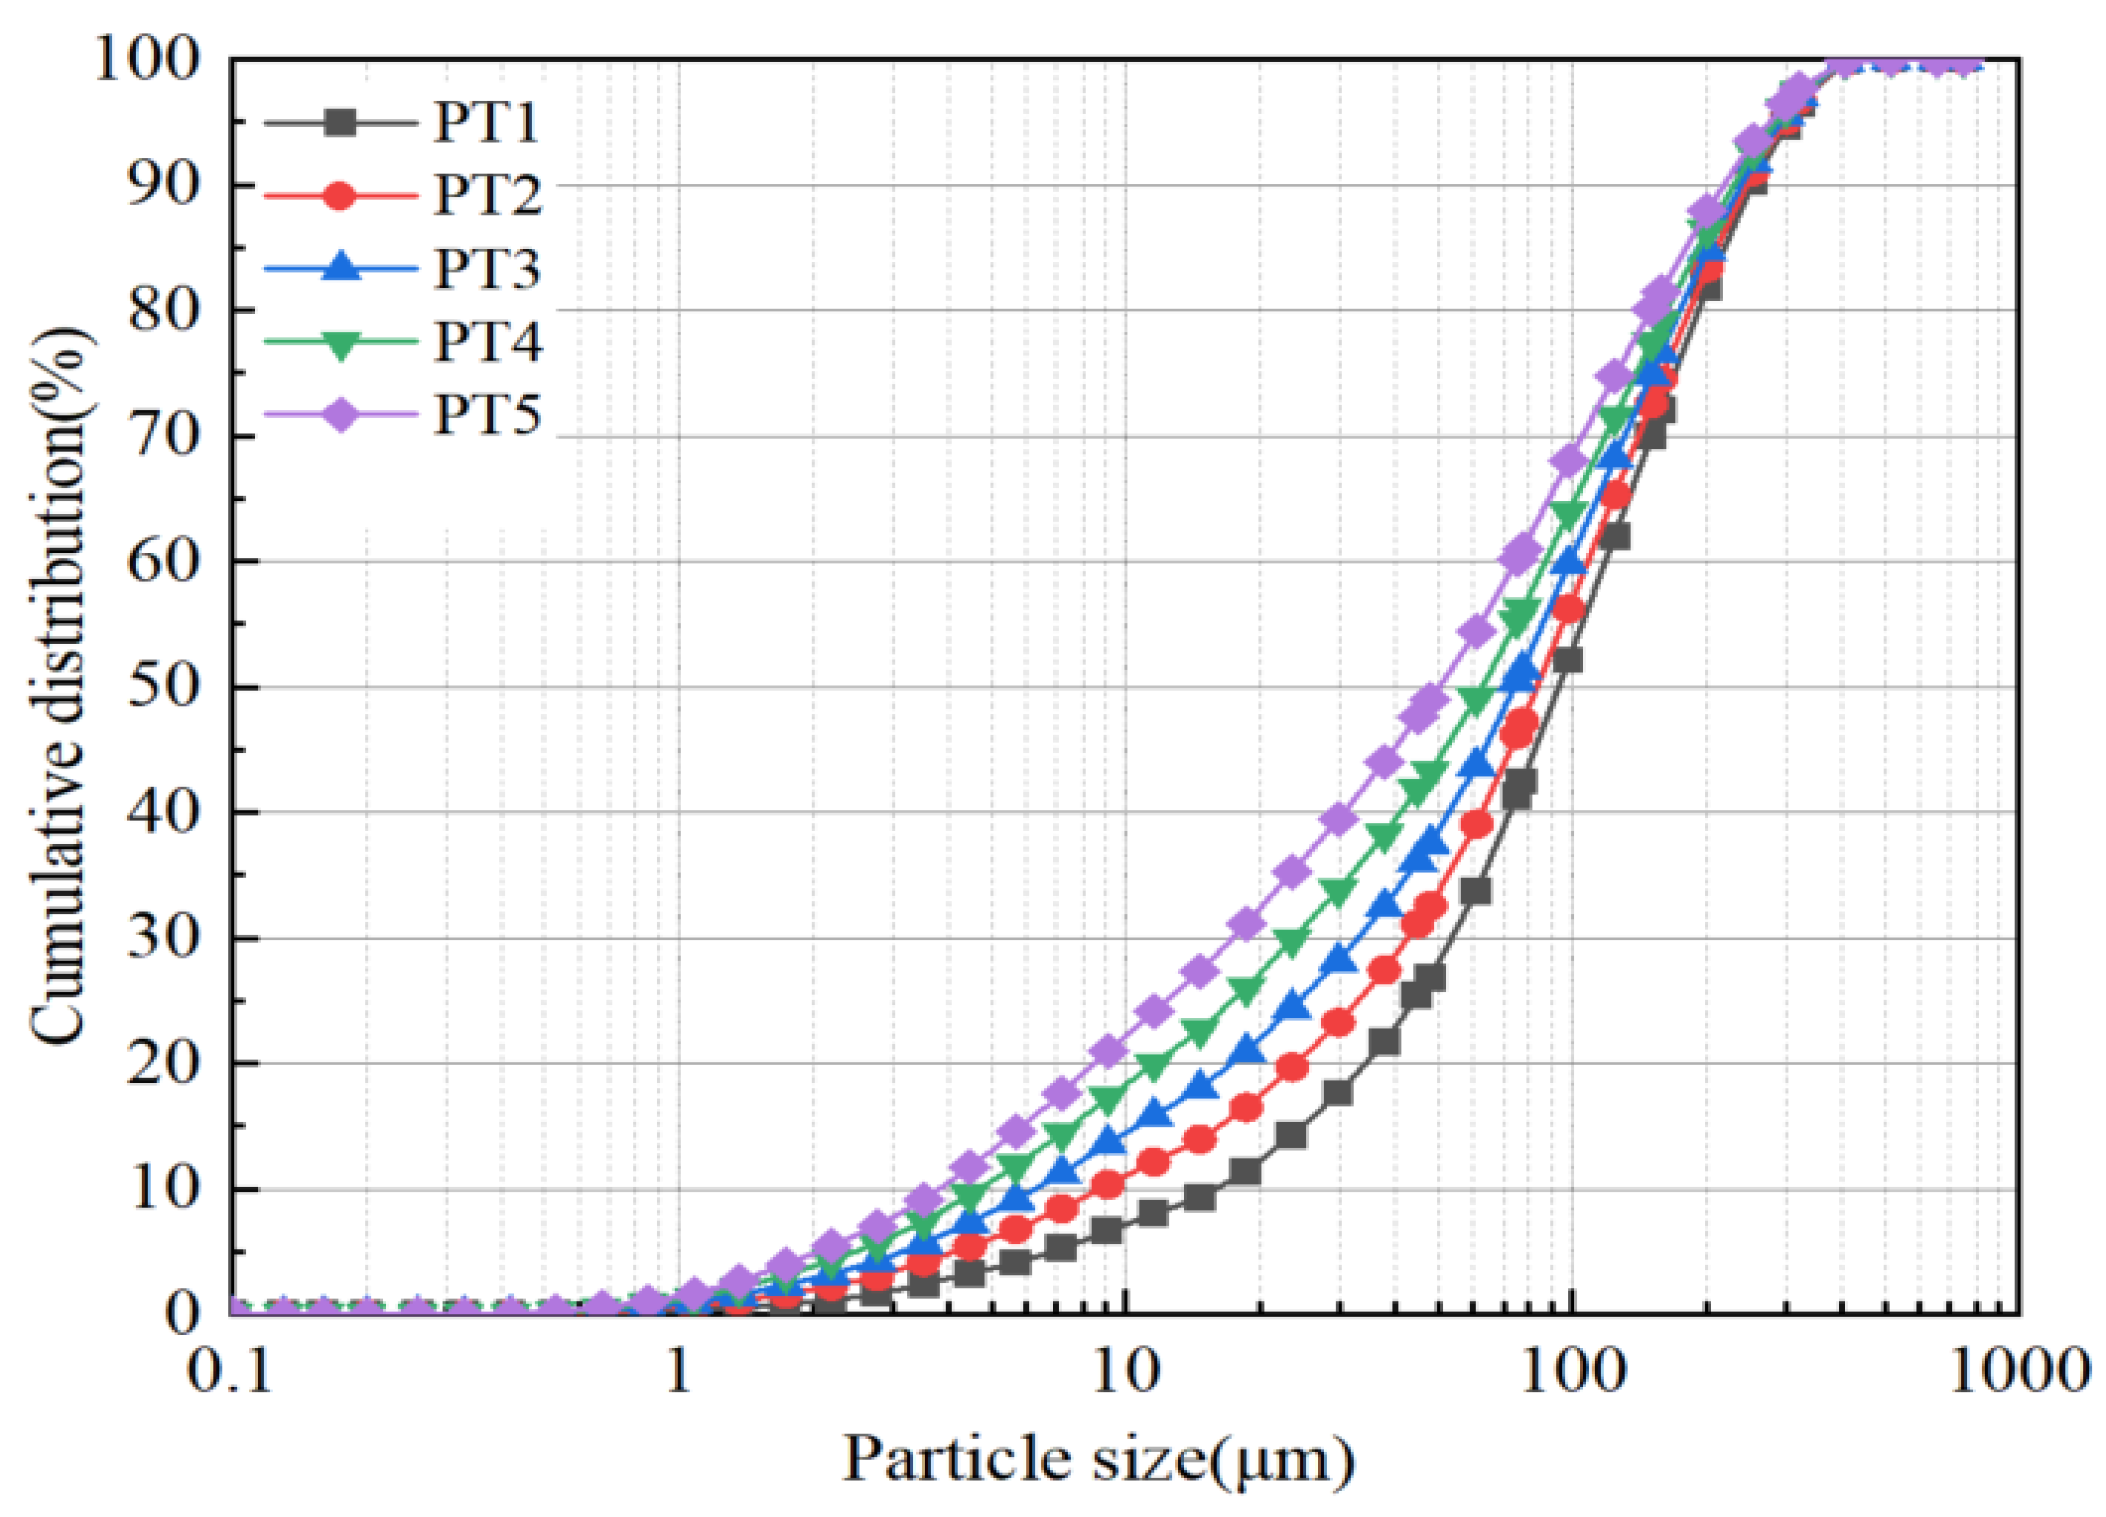
| Category | d10 (µm) | d30 (µm) | d50 (µm) | d60 (µm) | d90 (µm) | dav (µm) | Cu | Cc |
|---|---|---|---|---|---|---|---|---|
| PT1 | 16.6 | 54.07 | 93.77 | 118.81 | 253.62 | 55.20 | 7.16 | 1.48 |
| PT2 | 10.36 | 42.89 | 83.41 | 108.86 | 246.24 | 50.40 | 10.51 | 1.63 |
| PT3 | 6.43 | 33.24 | 74.38 | 97.47 | 239.88 | 46.20 | 15.16 | 1.76 |
| PT4 | 4.47 | 23.58 | 63.1 | 87.31 | 231.57 | 41.40 | 19.53 | 1.42 |
| PT5 | 4 | 17.33 | 50.38 | 74.49 | 220.49 | 36.60 | 18.62 | 1.01 |
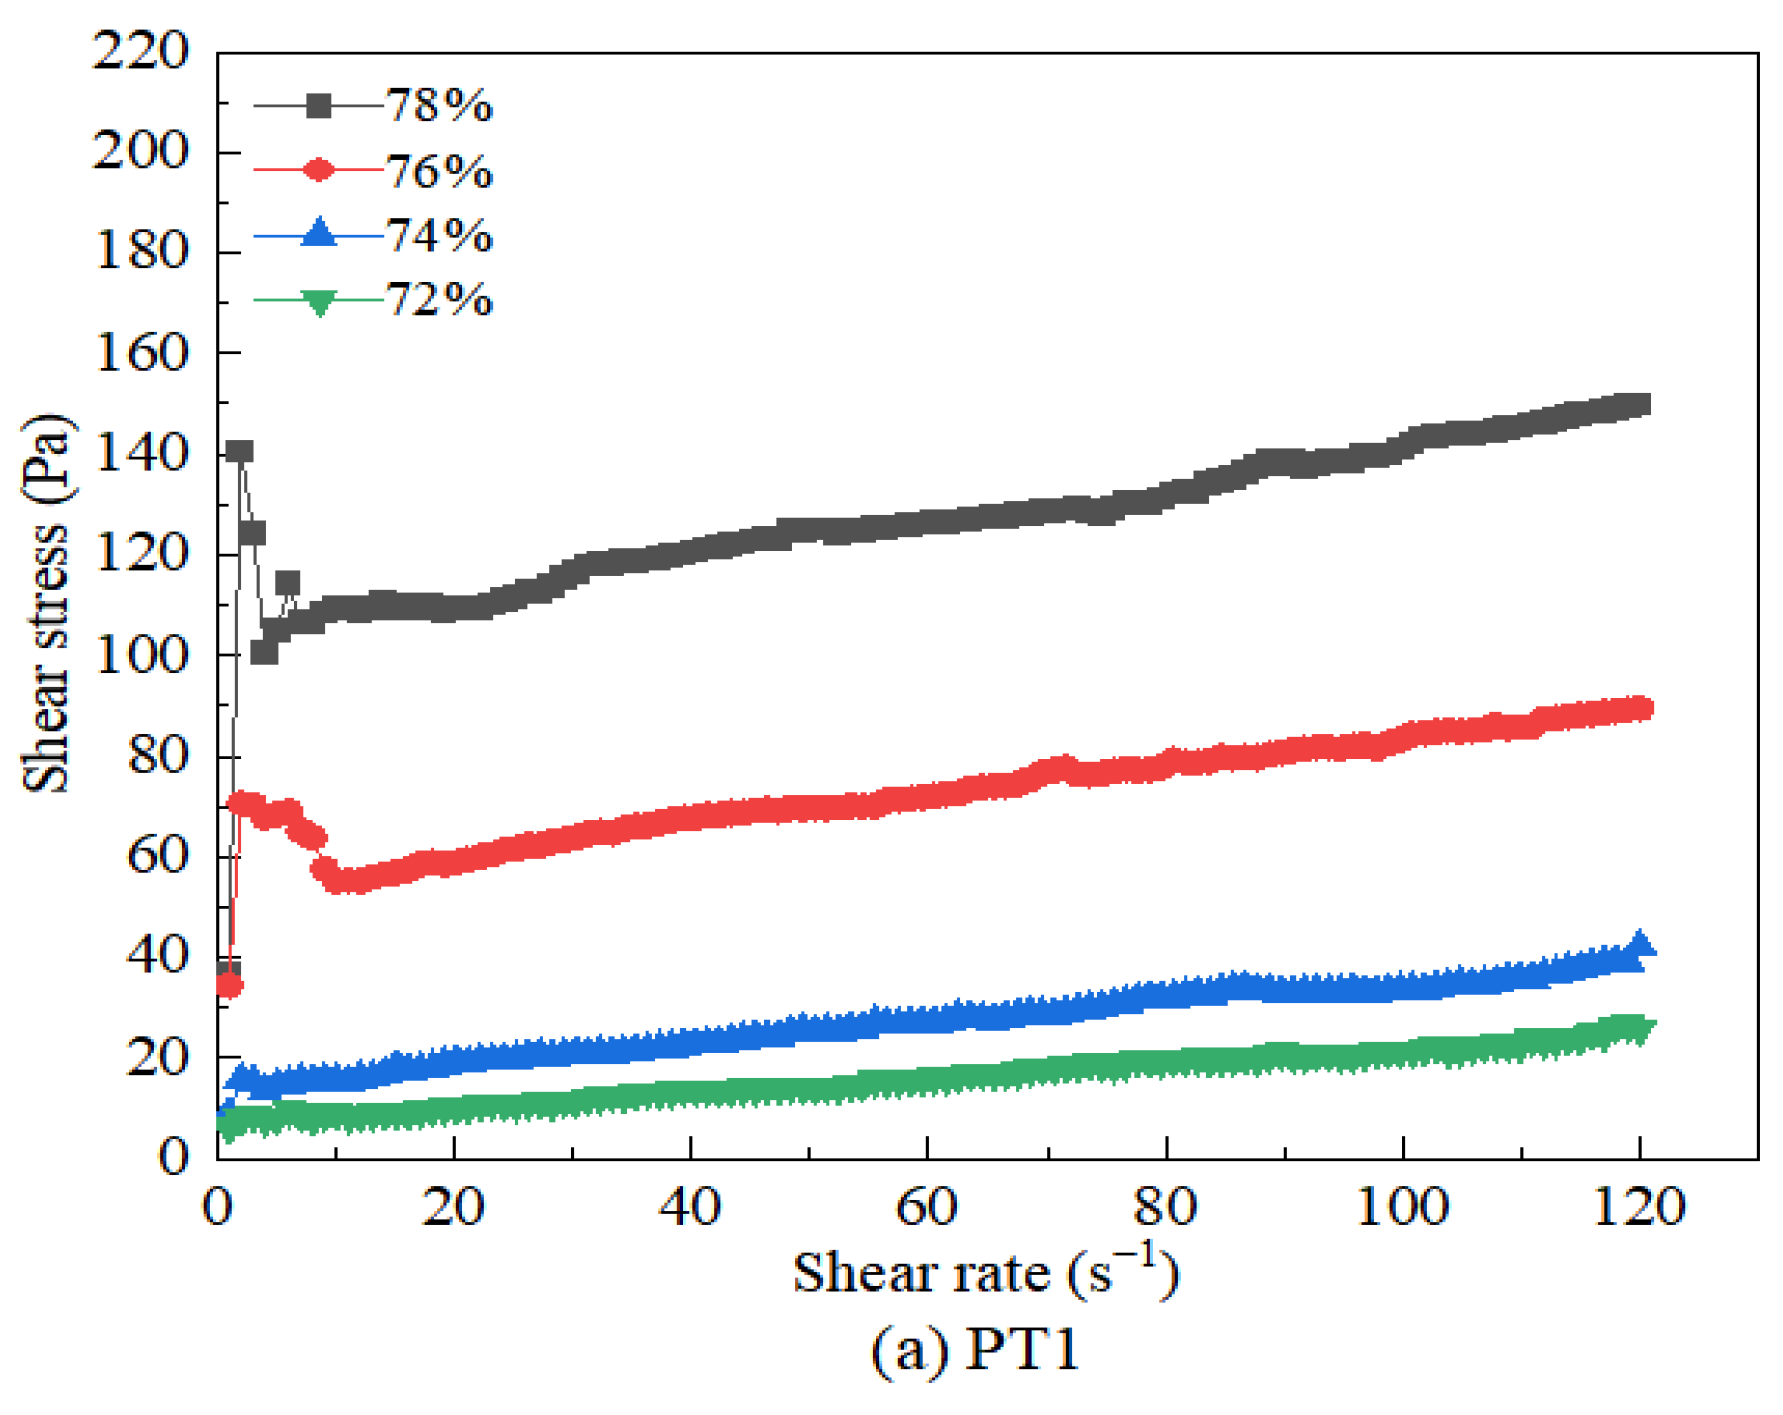
| Category | Mass Concentrations/% | τ0/Pa | µ/Pa·s | Slump/cm |
|---|---|---|---|---|
| PT1 | 72 | 7.240 | 0.15 | 29.6 |
| 74 | 14.32 | 0.27 | 29.0 | |
| 76 | 56.30 | 0.29 | 28.5 | |
| 78 | 103.56 | 0.38 | 27.8 | |
| PT2 | 72 | 9.89 | 0.19 | 28.9 |
| 74 | 26.75 | 0.23 | 28.4 | |
| 76 | 63.84 | 0.33 | 27.9 | |
| 78 | 144.09 | 0.46 | 26.8 | |
| PT3 | 72 | 12.42 | 0.21 | 28.4 |
| 74 | 28.92 | 0.30 | 27.9 | |
| 76 | 73.27 | 0.45 | 27.4 | |
| 78 | 160.74 | 0.51 | 26.5 | |
| PT4 | 72 | 16.62 | 0.35 | 27.8 |
| 74 | 33.50 | 0.43 | 27.3 | |
| 76 | 77.13 | 0.52 | 26.8 | |
| 78 | 167.86 | 0.63 | 26.0 | |
| PT5 | 72 | 31.49 | 0.37 | 27.2 |
| 74 | 58.77 | 0.44 | 26.7 | |
| 76 | 106.18 | 0.56 | 26.2 | |
| 78 | 182.51 | 0.65 | 25.4 |
| Category | a | b | c | R2 |
|---|---|---|---|---|
| PT1 | 22.533 | −1349.290 | 20,200.913 | 0.937 |
| PT2 | 8.755 | −554.168 | 8693.821 | 0.981 |
| PT3 | 30.823 | −1770.437 | 25,432.228 | 0.999 |
| PT4 | 40.812 | 2279.389 | 31,842.568 | 0.999 |
| PT5 | 15.206 | −884.882 | 12,849.213 | 0.994 |
| Category | a1 | b1 | R2 |
|---|---|---|---|
| PT1 | 3.745 | −0.121 | 0.925 |
| PT2 | 4.028 | −0.133 | 0.978 |
| PT3 | 4.836 | −0.162 | 0.878 |
| PT4 | 4.706 | −0.157 | 0.995 |
| PT5 | 4.439 | −0.149 | 0.943 |
| Mass Concentration/% | Fitting Results | a2 | b2 | R2 |
|---|---|---|---|---|
| 72 | s = a2 × d10 + b2 | 0.168 | 26.792 | 0.853 |
| s = a2 × d30 + b2 | 0.063 | 26.221 | 0.989 | |
| s = a2 × d50 + b2 | 0.055 | 24.372 | 0.993 | |
| s = a2 × d60 + b2 | 0.053 | 23.178 | 0.993 | |
| s = a2 × d90 + b2 | 0.072 | 11.198 | 0.983 | |
| s = a2 × dav + b2 | 0.128 | 22.510 | 0.998 | |
| 76 | s = a2 × d10 + b2 | 0.161 | 26.015 | 0.828 |
| s = a2 × d30 + b2 | 0.060 | 25.278 | 0.984 | |
| s = a2 × d50 + b2 | 0.053 | 23.488 | 0.997 | |
| s = a2 × d60 + b2 | 0.051 | 22.330 | 0.997 | |
| s = a2 × d90 + b2 | 0.069 | 10.727 | 0.989 | |
| s = a2 × dav + b2 | 0.123 | 21.686 | 0.999 |
| Mass Concentration/% | Fitting Results | a3 | b3 | R2 |
|---|---|---|---|---|
| 72 | y = a3 × d10 + b3 | −1.343 | 26.776 | 0.388 |
| y = a3 × d30 + b3 | −0.567 | 34.899 | 0.680 | |
| y = a3 × d50 + b3 | −0.572 | 54.023 | 0.832 | |
| y = a3 × d60 + b3 | −0.509 | 65.089 | 0.814 | |
| y = a3 × d90 + b3 | −0.707 | 183.960 | 0.872 | |
| y = a3 × dav + b3 | −1.202 | 70.787 | 0.791 | |
| 76 | y = a3 × d10 + b3 | −1.129 | 114.788 | 0.741 |
| y = a3 × d30 + b3 | −1.035 | 151.714 | 0.864 | |
| y = a3 × d50 + b3 | −1.001 | 173.684 | 0.851 | |
| y = a3 × d60 + b3 | −1.382 | 405.626 | 0.895 | |
| y = a3 × d90 + b3 | −2.372 | 185.162 | 0.833 | |
| y = a3 × dav + b3 | −1.129 | 114.788 | 0.741 |
| Mass Concentration/% | Fitting Results | a3 | b3 | R2 |
|---|---|---|---|---|
| 72 | y = a3 × d10 + b3 | −1.343 | 26.776 | 0.640 |
| y = a3 × d30 + b3 | −0.567 | 34.899 | 0.866 | |
| y = a3 × d50 + b3 | −0.572 | 54.023 | 0.890 | |
| y = a3 × d60 + b3 | −0.509 | 65.089 | 0.871 | |
| y = a3 × d90 + b3 | −0.707 | 183.960 | 0.881 | |
| y = a3 × dav + b3 | −1.202 | 70.787 | 0.887 | |
| 76 | y = a3 × d10 + b3 | −1.129 | 114.788 | 0.844 |
| y = a3 × d30 + b3 | −1.035 | 151.714 | 0.964 | |
| y = a3 × d50 + b3 | −1.001 | 173.684 | 0.932 | |
| y = a3 × d60 + b3 | −1.382 | 405.626 | 0.951 | |
| y = a3 × d90 + b3 | −2.372 | 185.162 | 0.909 | |
| y = a3 × dav + b3 | −1.129 | 114.788 | 0.948 |
| Category | Mass Concentration/% | τ0/Pa | u/Pa·s | hm/MPa | P/MPa |
|---|---|---|---|---|---|
| PT1 | 72 | 7.240 | 0.15 | 3.20 | 10.17 |
| 74 | 14.32 | 0.27 | 5.89 | 9.89 | |
| 76 | 56.30 | 0.29 | 10.72 | 9.62 | |
| 78 | 103.56 | 0.38 | 17.25 | 9.37 | |
| PT2 | 72 | 9.89 | 0.19 | 4.13 | 10.17 |
| 74 | 26.75 | 0.23 | 6.58 | 9.88 | |
| 76 | 63.84 | 0.33 | 12.18 | 9.62 | |
| 78 | 144.09 | 0.46 | 22.90 | 9.36 | |
| PT3 | 72 | 12.42 | 0.21 | 4.72 | 10.16 |
| 74 | 28.92 | 0.30 | 7.94 | 9.88 | |
| 76 | 73.27 | 0.45 | 15.13 | 9.61 | |
| 78 | 160.74 | 0.51 | 25.49 | 9.36 | |
| PT4 | 72 | 16.62 | 0.35 | 7.43 | 10.16 |
| 74 | 33.50 | 0.43 | 10.53 | 9.88 | |
| 76 | 77.13 | 0.52 | 16.67 | 9.61 | |
| 78 | 167.86 | 0.63 | 28.19 | 9.35 | |
| PT5 | 72 | 31.49 | 0.37 | 9.35 | 10.15 |
| 74 | 58.77 | 0.44 | 13.41 | 9.87 | |
| 76 | 106.18 | 0.56 | 20.44 | 9.60 | |
| 78 | 182.51 | 0.65 | 30.09 | 9.35 |
Disclaimer/Publisher’s Note: The statements, opinions and data contained in all publications are solely those of the individual author(s) and contributor(s) and not of MDPI and/or the editor(s). MDPI and/or the editor(s) disclaim responsibility for any injury to people or property resulting from any ideas, methods, instructions or products referred to in the content. |
© 2023 by the authors. Licensee MDPI, Basel, Switzerland. This article is an open access article distributed under the terms and conditions of the Creative Commons Attribution (CC BY) license (https://creativecommons.org/licenses/by/4.0/).
Share and Cite
Zhang, X.; Wang, H.; Wu, A. Study on Correlations between Tailings Particle Size Distribution and Rheological Properties of Filling Slurries. Minerals 2023, 13, 1134. https://doi.org/10.3390/min13091134
Zhang X, Wang H, Wu A. Study on Correlations between Tailings Particle Size Distribution and Rheological Properties of Filling Slurries. Minerals. 2023; 13(9):1134. https://doi.org/10.3390/min13091134
Chicago/Turabian StyleZhang, Xi, Hongjiang Wang, and Aixiang Wu. 2023. "Study on Correlations between Tailings Particle Size Distribution and Rheological Properties of Filling Slurries" Minerals 13, no. 9: 1134. https://doi.org/10.3390/min13091134
APA StyleZhang, X., Wang, H., & Wu, A. (2023). Study on Correlations between Tailings Particle Size Distribution and Rheological Properties of Filling Slurries. Minerals, 13(9), 1134. https://doi.org/10.3390/min13091134