1. Introduction
The special “trapiche” structure of various minerals has attracted considerable attention since its discovery. The most famous trapiche structure was first discovered in emerald [
1,
2,
3,
4]. Subsequently, similar phenomena were found in other gem materials, such as ruby [
5,
6,
7,
8,
9,
10,
11], sapphire [
12,
13,
14], tourmaline [
15,
16], aquamarine [
17,
18], quartz [
19,
20,
21,
22,
23], spinel [
24], rhodochrosite [
20], etc.
The trapiche-like phenomenon in Myanmar quartz was first mentioned by Win [
11]. So far, it has been verified that trapiche-like quartz is widely distributed in many areas. Krzemincki and Laurs [
19] observed a batch of trapiche-like quartz from Colombia and found many “fibrous” inclusions in its growth sectors. They believed that the trapiche-like pattern was formed by the incomplete dissolution of the elongated fibrous inclusions, which are contemporaneous with the crystal body. Kawasaki et al. reported a light yellow trapiche-like quartz produced in Japan, formed in stages by dendrite growth and layer growth [
25]. Chen [
26] proposed that the trapiche-like pattern in the smoke quartz of the Huanggangliang area was formed by the regular distribution of chromogenic elements along a certain crystallographic direction, while the trapiche structure of the transparent quartz of Dongwuqi was caused by the parallel growth of crystals. Gabriela et al. [
22] studied the trapiche-like quartz formed by inclusions of primary clay (ferrosaponite or nontronite) from Inner Mongolia in depth. In addition, there have been many reports on trapiche-like quartz, most of which just describe trapiche-like phenomena. The growth mechanism has not been discussed in detail. Therefore, the formation mechanism of trapiche-like quartz is still an open question.
To enrich the studies of trapiche-like minerals, six samples of trapiche-like quartz from Dongwuqi area were selected. Their structures, compositions, and spectral characteristics were obtained by microscopy, cathodoluminescence spectra (CL), electron probe microanalysis (EPMA), Laser Ablation-Inductively Coupled Plasma-Mass Spectrometry (LA-ICP-MS), Raman spectroscopy, and infrared spectroscopy. Combined with the crystal growth theories and previous research results on trapiche-like phenomena, the possible formation environments and mechanisms of trapiche-like quartz were deduced.
2. Materials and Methods
Six different quartz crystals, obtained from the Dongwuqi area of Xilin Gol League, Inner Mongolia, China, were used as the original samples. All samples were cut along the direction perpendicular to the
c-axis, with water being used as a lubricant during cutting. A chromium trioxide and alumina polishing solution was adopted to polish all sections, and an ultrasonic cleaning machine with alcohol was used to clean for microscopic examination and other experiments. The six slices were labeled as q1, q2, q3, q4, q5, and q6, respectively (
Figure 1). These samples’ diameters varied from approximately 3.8 cm to 5.0 cm, and their thicknesses from 0.3 cm to 0.7 cm. The q3 and q6 were selected for CL. The q3, q4, and q6 were later carbon-coated for EPMA, and q3 for LA-ICP-MS analysis.
Conventional gemological properties and structural characteristics were studied in the Gem Laboratory of the School of Gemmology, China University of Geosciences, Beijing (CUGB).
EPMA experiments were carried out at the State Key Laboratory of Tibetan Plateau Earth System, Environment and Resources at the Institute of Tibetan Plateau Research, Chinese Academy of Sciences (CAS) (JXA-8230 electron probe, JEOL Ltd., Tokyo, Japan), using a 5 μm beam spot diameter, a 20 nA beam current, and a 15 kV accelerating voltage. The measurement time of all element characteristic peaks was 10 s, and the measurement time of the upper and lower background was half of the peak measurement time. All test data were processed by ZAF correction. The microprobe analytical standards were albite for Na, corundum for Al, olivine for Mg, diopside for Si and Ca, orthoclase for K, rutile for Ti, rhodonite for Mn, hematite for Fe, chromium oxide for Cr, and nickel oxide for Ni. The detection limit was ~100 ppm. The diffraction crystals were TAPL and PET crystals. Before the experiment, a carbon film 20 nm thick was uniformly plated on the samples.
Trace elements were analyzed at the Beijing Zhongkekuangyan Testing Technology Co., Ltd., Beijing, China, using the Agilent 7500 ICP-MS instrument (Agilent Technologies, Co., Ltd., Palo Alto, CA, USA), which was equipped with an ESI NWR 193 laser ablation system. The size of the laser spot was 30 μm, and the laser frequency was 6 Hz. Glasses of BHVO-2G, BCR-2G, and BIR-1G were used as external standards for trace element calibration. Trace element analytical data were processed using the software ICPMSDataCal [
27]. Each time-resolved analysis included approximately 20–30 s of blank signal and 50 s of sample signal.
Raman spectra was collected with a Horiba HR (Horiba, Ltd., Tokyo, Japan) Evolution-type micro laser Raman spectrometer at the Gem Laboratory at the School of Gemmology, CUGB, with a 532 nm laser, 10–30 mW laser power, and 4 cm−1 resolution. The spot-size of the Raman spectra was approximately 1 μm. The transverse and vertical spatial resolution were better than 1 μm and 2 μm, respectively. All data were recorded from 400 to 4000 cm−1. The scan time was 20 s. A single crystal silicon wafer, with a 520.7 cm−1 single Raman displacement, was used to correct the Raman spectrum before conducting the experiments.
The infrared spectra were obtained using a Tensor 27 Fourier transform infrared spectrometer (Bruker Co., Ltd., Karlsruhe, Germany) of the Gem Laboratory at the School of Gemmology, CUGB, with a scanning range of 4000–400 cm−1 and a resolution of 4 cm−1 by 16 scans.
3. Gemological Properties and Internal Texture
3.1. Gemological Properties
All quartz samples, which were surrounded by country rocks, had transparent cores and arms, as well as opaque growth sectors (
Figure 1). The refractive indices of the samples were measured by a refractometer as Nω = 1.544, Nε = 1.553, and DR = 0.009. The samples were shown to be uniaxial (+) under a polarizer. There was no dichroism. The microhardness of the samples was measured using a microhardness tester and converted to a Mohs hardness value of 6–7 by the formula Hv = 3.25 Hm
3. Higher amounts of impurities in the crystals may have been the cause of samples with hardness values below 7. The specific gravity was not measured because of the country rock. The samples did not show twinning. White-colored fibrous inclusions in the quartz slices, i.e., component parts of the trapiche-like pattern, could be clearly seen by the naked eye.
3.2. Internal Texture of Trapiche-like Quartz
3.2.1. Massive Texture of Trapiche-like Quartz
The cross-section of the trapiche-like quartz was hexagonal, which is in good agreement with its symmetrical characteristics; it had six transparent arms running from the core to six corners of the hexagonal growth structure, as well as clear boundaries of six crystallographic sectors (
Figure 1).
According to the crystal shape and symmetry of the six transparent arms, their symmetrical grades can be divided into three types: better, good, and worse. The symmetry of the q1 sample was good, with six arms and a more transparent hexagram in the center (
Figure 2a). The crystal symmetries of the q3, q4, and q6 samples were better. Six thin arms were averagely distributed and intersected at a point in the core. The intersection angle of the adjacent arms was about 60° (
Figure 2c,d,f). The symmetry of q2 and q5 was relatively worse, because the growth of crystal was uneven, resulting in irregular thickness and length and an uneven intersection angle among the arms (
Figure 2b,e). The fibrous inclusions, the primary cause of the trapiche-like pattern, were concentrated along the diagonal axis of the crystal and oriented in the growth sectors, showing gradual dense to sparse changes from the core to the edge (
Figure 2g).
It can be seen that the colors of the six samples were not uneven (
Figure 1). The q1, q2, and q3 samples were white, while the q4 sample was yellow with many dark inclusions appearing in the growth sectors. The q5 sample was colorless in the middle and yellow on the edges. There were brown-colored inclusions in the middle and a light red color near the edges of the q6 sample. All samples showed obvious wavy extinction under cross-polarized light. By comparing their images under plane-polarized light, it was found that the obvious wavy extinction only appeared in the area where fibrous inclusions were densely and directionally arranged, and the interface in this area was relatively rough (
Figure 2h,i). The wavy extinction in the growth sections indicated that there was dislocation glide during the crystal growth process [
28]. The color of the country rock under plane-polarized light was darker than that of the quartz (
Figure 2h), and it appeared bright white under cross-polarized light (
Figure 2i), which is consistent with the characteristics of carbonate.
Cathodoluminescence Features
The CL images of the samples were blue-purple in color, with white cracks or orange carbonate present as well (
Figure 3).
Compared to under polarization (
Figure 3a), growth bands parallel to the hexagonal cylinder (dash lines in
Figure 3c) were faintly visible when observed under CL. The formation of the growth band reflects a relatively stable growth environment for deep magmatic reservoirs [
29]. Impurity elements in the quartz are generally contained in solid inclusions or fluid inclusions, and the fluid inclusions are mostly distributed along the cracks [
30]. Therefore, the cracks in samples had brighter CL images (
Figure 3b,d). Orange impurities could also be seen in the cracks under CL (
Figure 3g); this was caused by the carbonate surrounding the rock. Concave corners caused by parallel grouping also appeared more clearly under CL (
Figure 3f,h). The CL images demonstrate that the growth environment of the samples changes periodically, and the color under CL is affected by impurity elements during the growth process.
Raman Spectra
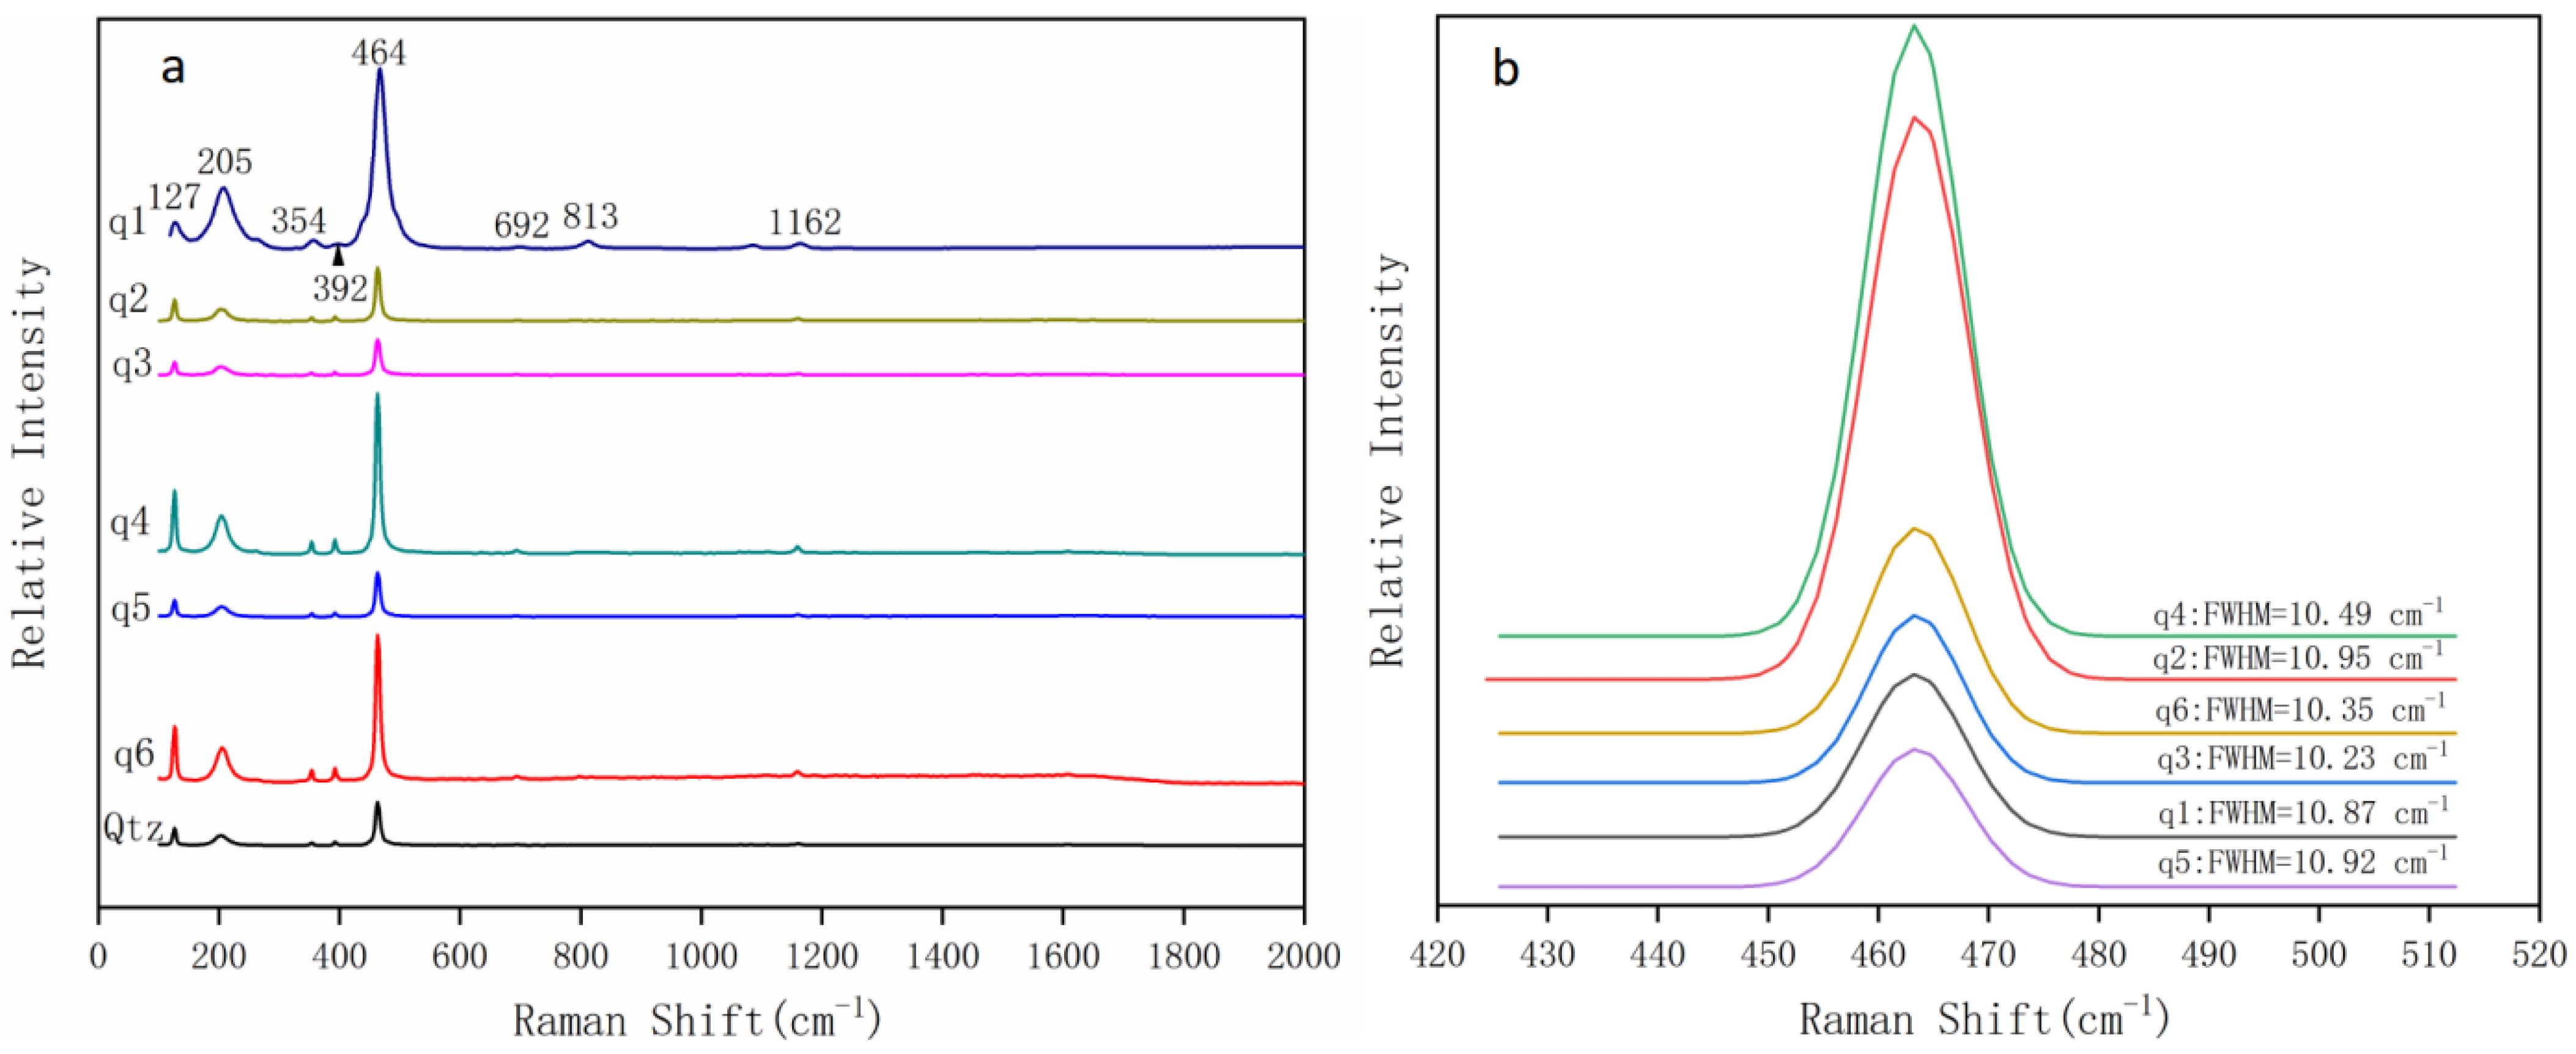
Raman spectra of six samples after subtracting the background are illustrated in
Figure 4a. The characteristic peaks of the samples are located at 127 cm
−1, 205 cm
−1, 354 cm
−1, 392 cm
−1, 464 cm
−1, 692 cm
−1, 813 cm
−1, and 1162 cm
−1, respectively. According to relevant research, the characteristic peaks of Si-O are mainly divided into four ranges, namely, the low-frequency peak band of 300–100 cm
−1, the symmetric stretching vibration of Si-O at 600–300 cm
−1, the symmetric stretching vibration of Si-O-Si at 800–600 cm
−1, and the asymmetric stretching vibration of Si-O-Si at 1200–1000 cm
−1 [
31]. Therefore, Raman shifts at 692 cm
−1, 813 cm
−1, and 1162 cm
−1 are, respectively, caused by the symmetric stretching vibration and asymmetric stretching vibration of Si-O-Si. The peaks at 354 cm
−1, 392 cm
−1, and 464 cm
−1 are due to the bending vibration of Si-O.
It has been verified that the FWHM of the characteristic peak is related to the minerals’ crystallization degrees, which also indicate the growth process of the minerals [
32,
33,
34]. The smaller the FWHM of the 464 cm
−1 peak is, the higher its crystallinity [
35,
36].
Gaussian fitting was used to calculate the FWHM of the 464 cm
−1 shift in six samples (q1 to q6 in
Figure 4b), resulting in values of 10.87 cm
−1, 10.95 cm
−1, 10.23 cm
−1, 10.49 cm
−1, 10.92 cm
−1, and 10.35 cm
−1, respectively. These values are close to each other, indicating that the crystallinity of each sample was similar. However, it still can be found that the lowest FWHM value among the six samples was 10.26 cm
−1 (
Figure 4b), which is in good agreement with the most symmetrical shape of the q3 sample (
Figure 1 and
Figure 2c).
Infrared Spectra
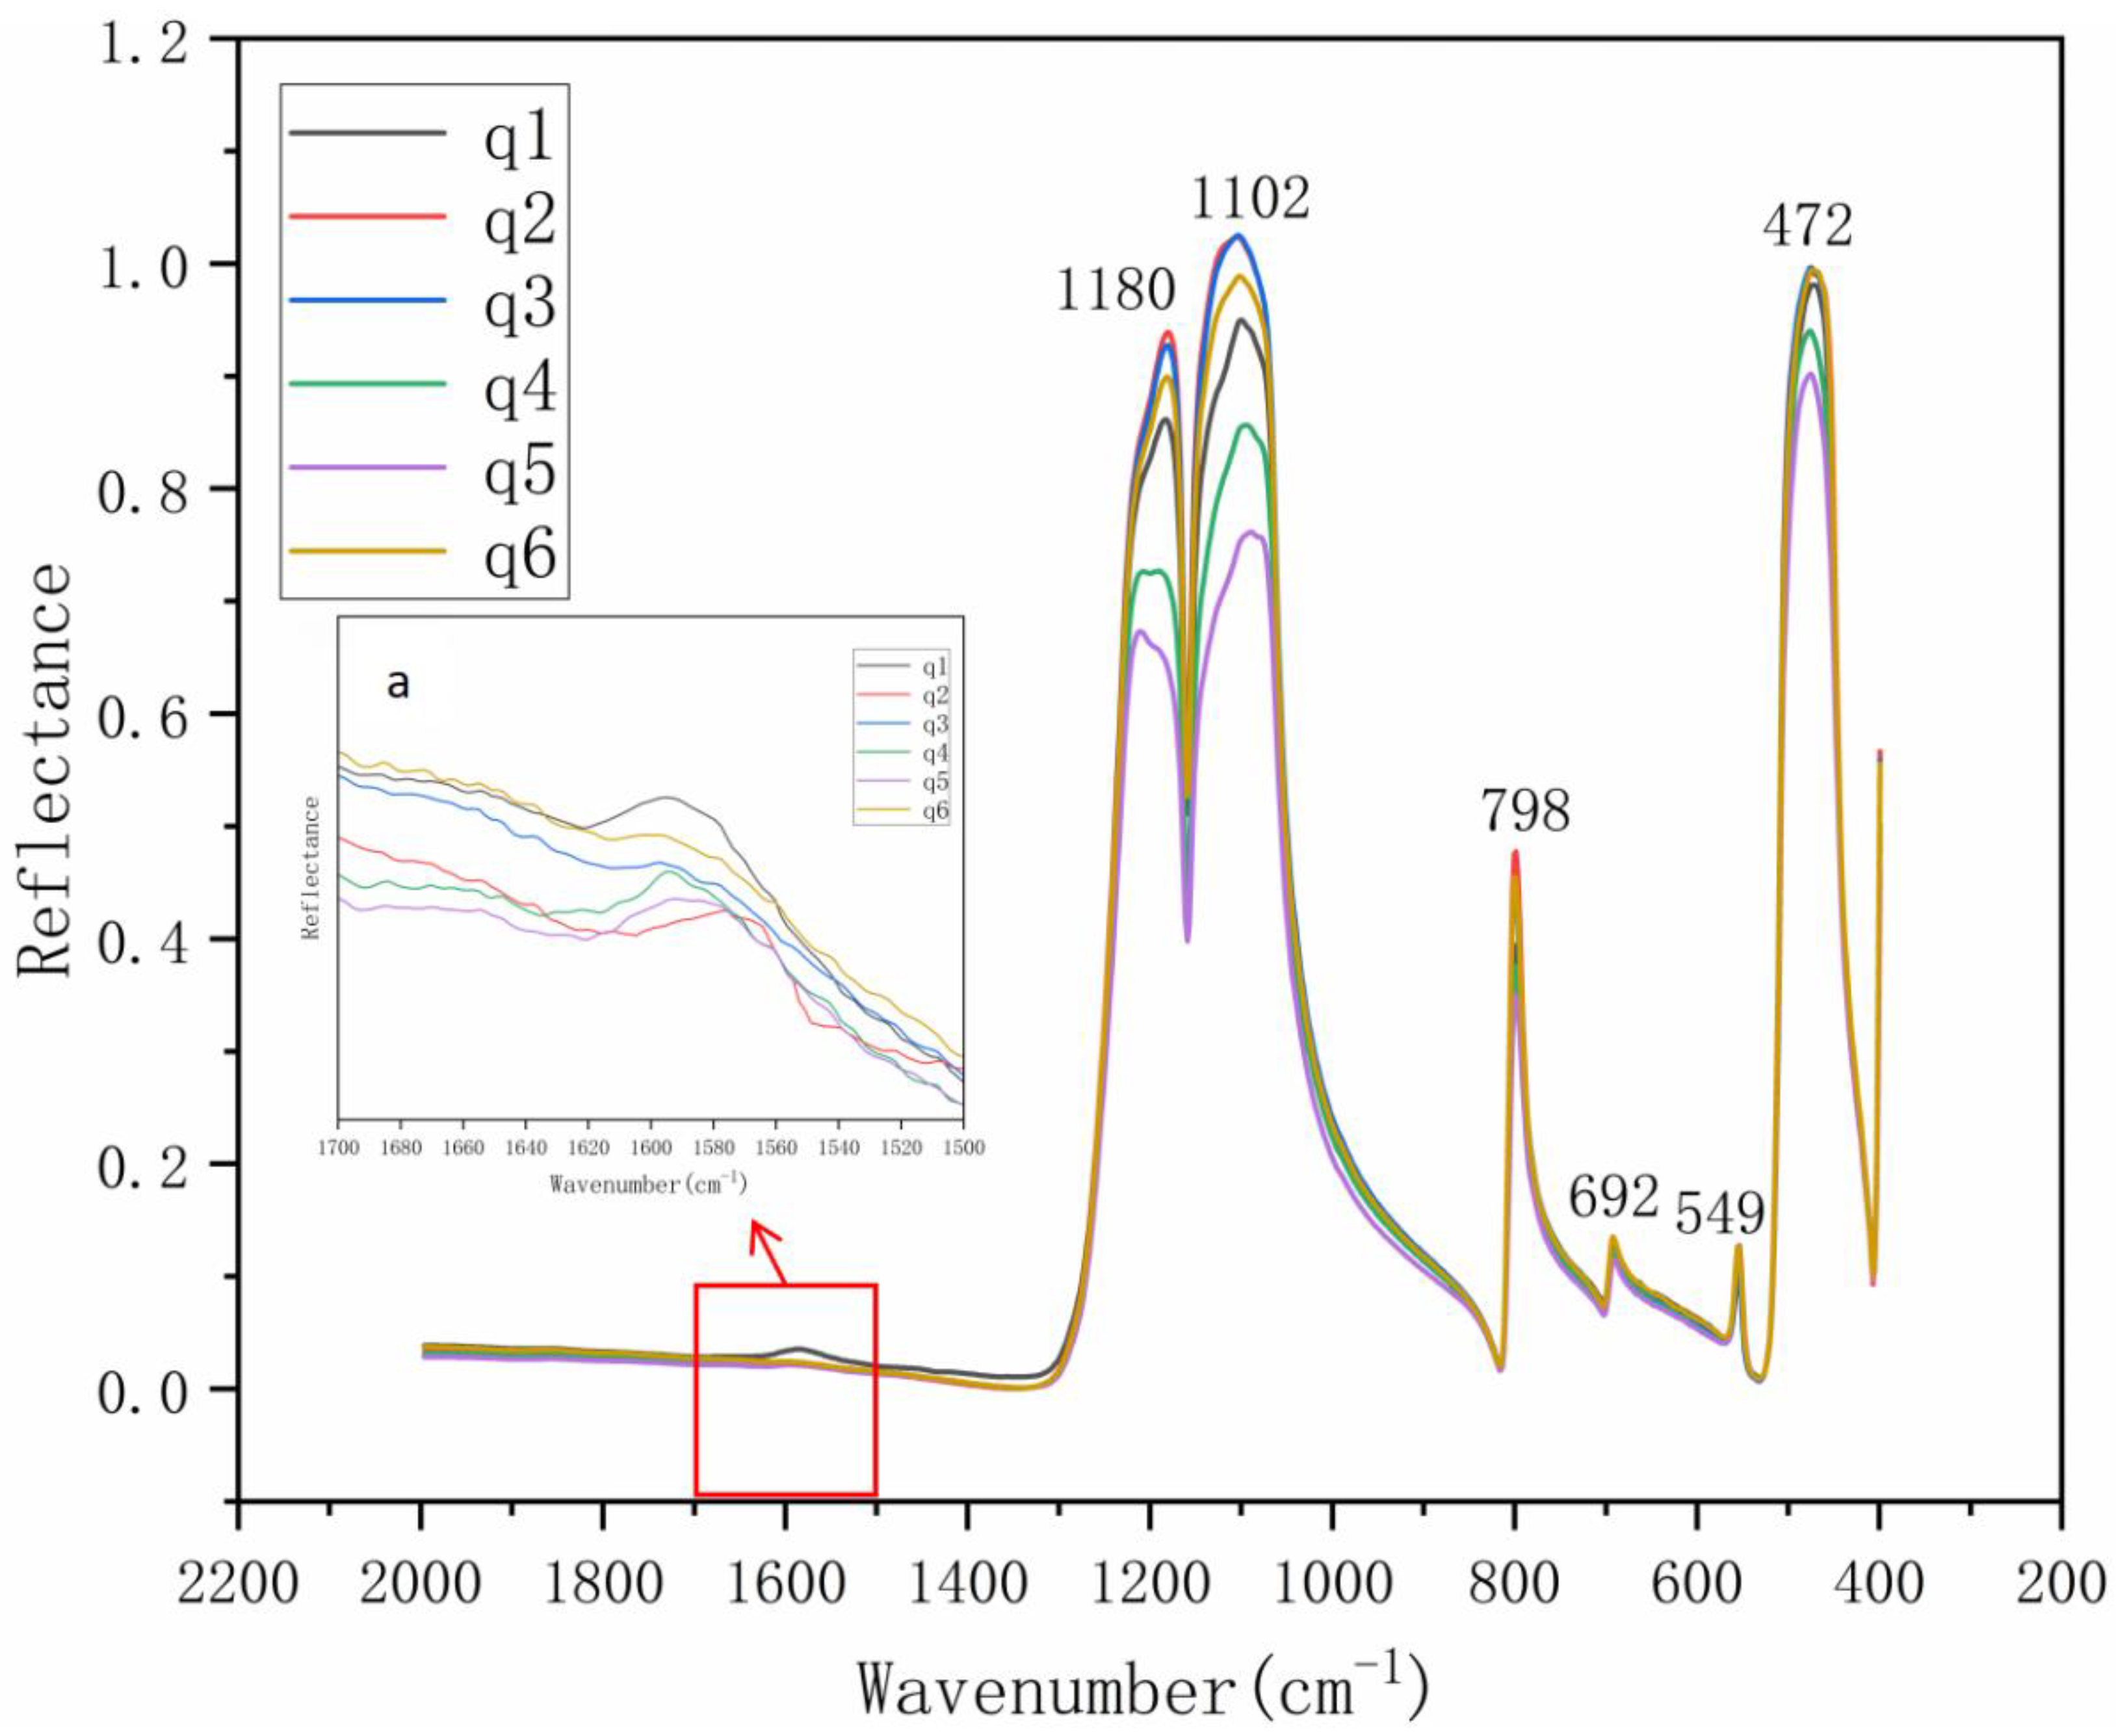
Infrared spectra of the q1–q6 samples are illustrated in
Figure 5. The characteristic peaks of the samples are located at 472 cm
−1, 549 cm
−1, 692 cm
−1, 798 cm
−1, 1102 cm
−1, and 1180 cm
−1, respectively, which is consistent with the absorption peaks of natural quartz. The samples also show absorption peaks between 1500 cm
−1 and 1700 cm
−1. According to previous research [
37], 1200 cm
−1–900 cm
−1 are related to the telescopic vibrations of Si-O, 798 cm
−1 is due to symmetric telescopic vibrations of Si-O, 472 cm
−1 and 549 cm
−1 are the Si-O bending vibrations, and the peaks located in the range of 1500 cm
−1 to 1700 cm
−1 represent the bending vibration of H
2O. This indicates that the crystal contains H
2O.
3.2.2. Inclusions in Trapiche-like Quartz
Inclusions in the sample consisted of fibrous inclusions, spherical inclusions, and other inclusions.
Fibrous Inclusions
The fibrous inclusions, which were densely arranged in the parallel direction to the diagonal axis, were white-colored and formed the trapiche-like pattern. When observed under the polarizing microscope, their color was grayish-black (
Figure 6a). When the magnification was strong enough, we found that these “fibrous” inclusions were composed of many intermittent elongated inclusions (
Figure 6b–d). The Raman results showed this to be consistent with quartz (
Figure 6e). This fibrous (with grain size of 1–50 μm) quartz is called chalcedony [
38].
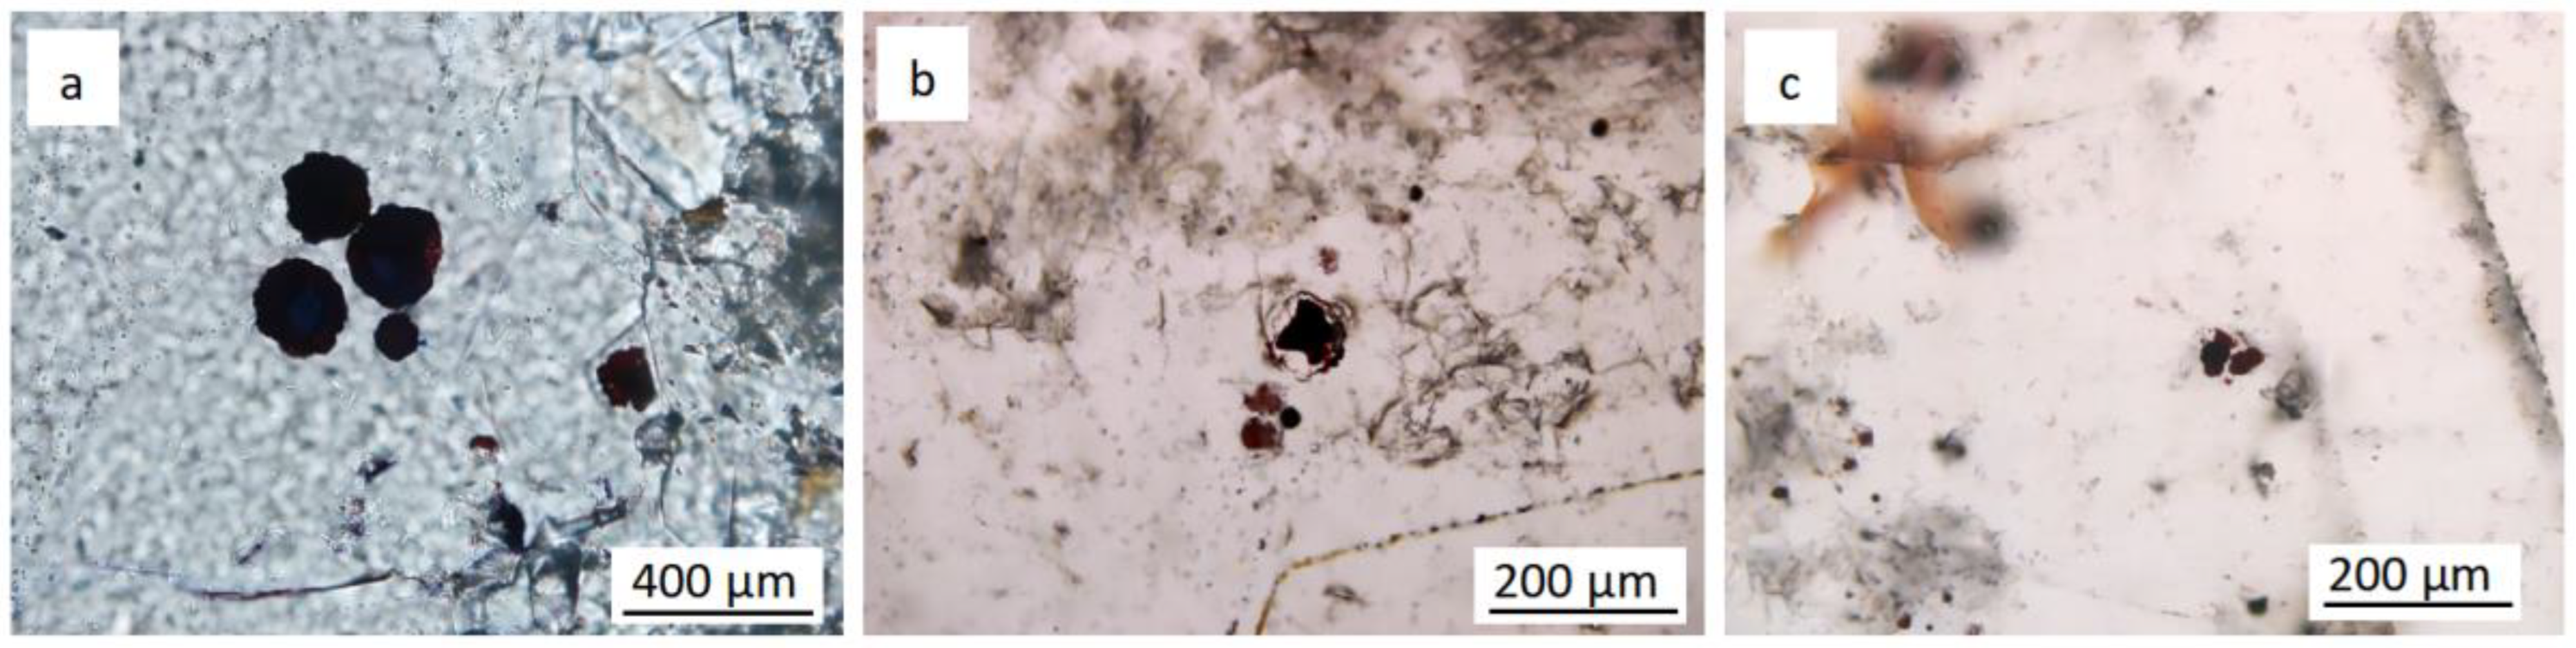
Spherical Inclusions
Spherical inclusions could be found in the interior of the crystal (
Figure 7a), the country rock (
Figure 7b), and the boundary between them (
Figure 7c). These red irregular spherical inclusions were shown to have rough surfaces, red edges, and black insides under the polarizing microscope (
Figure 7). According to their appearance characteristics, it is speculated that these spherical inclusions may be iron oxides.
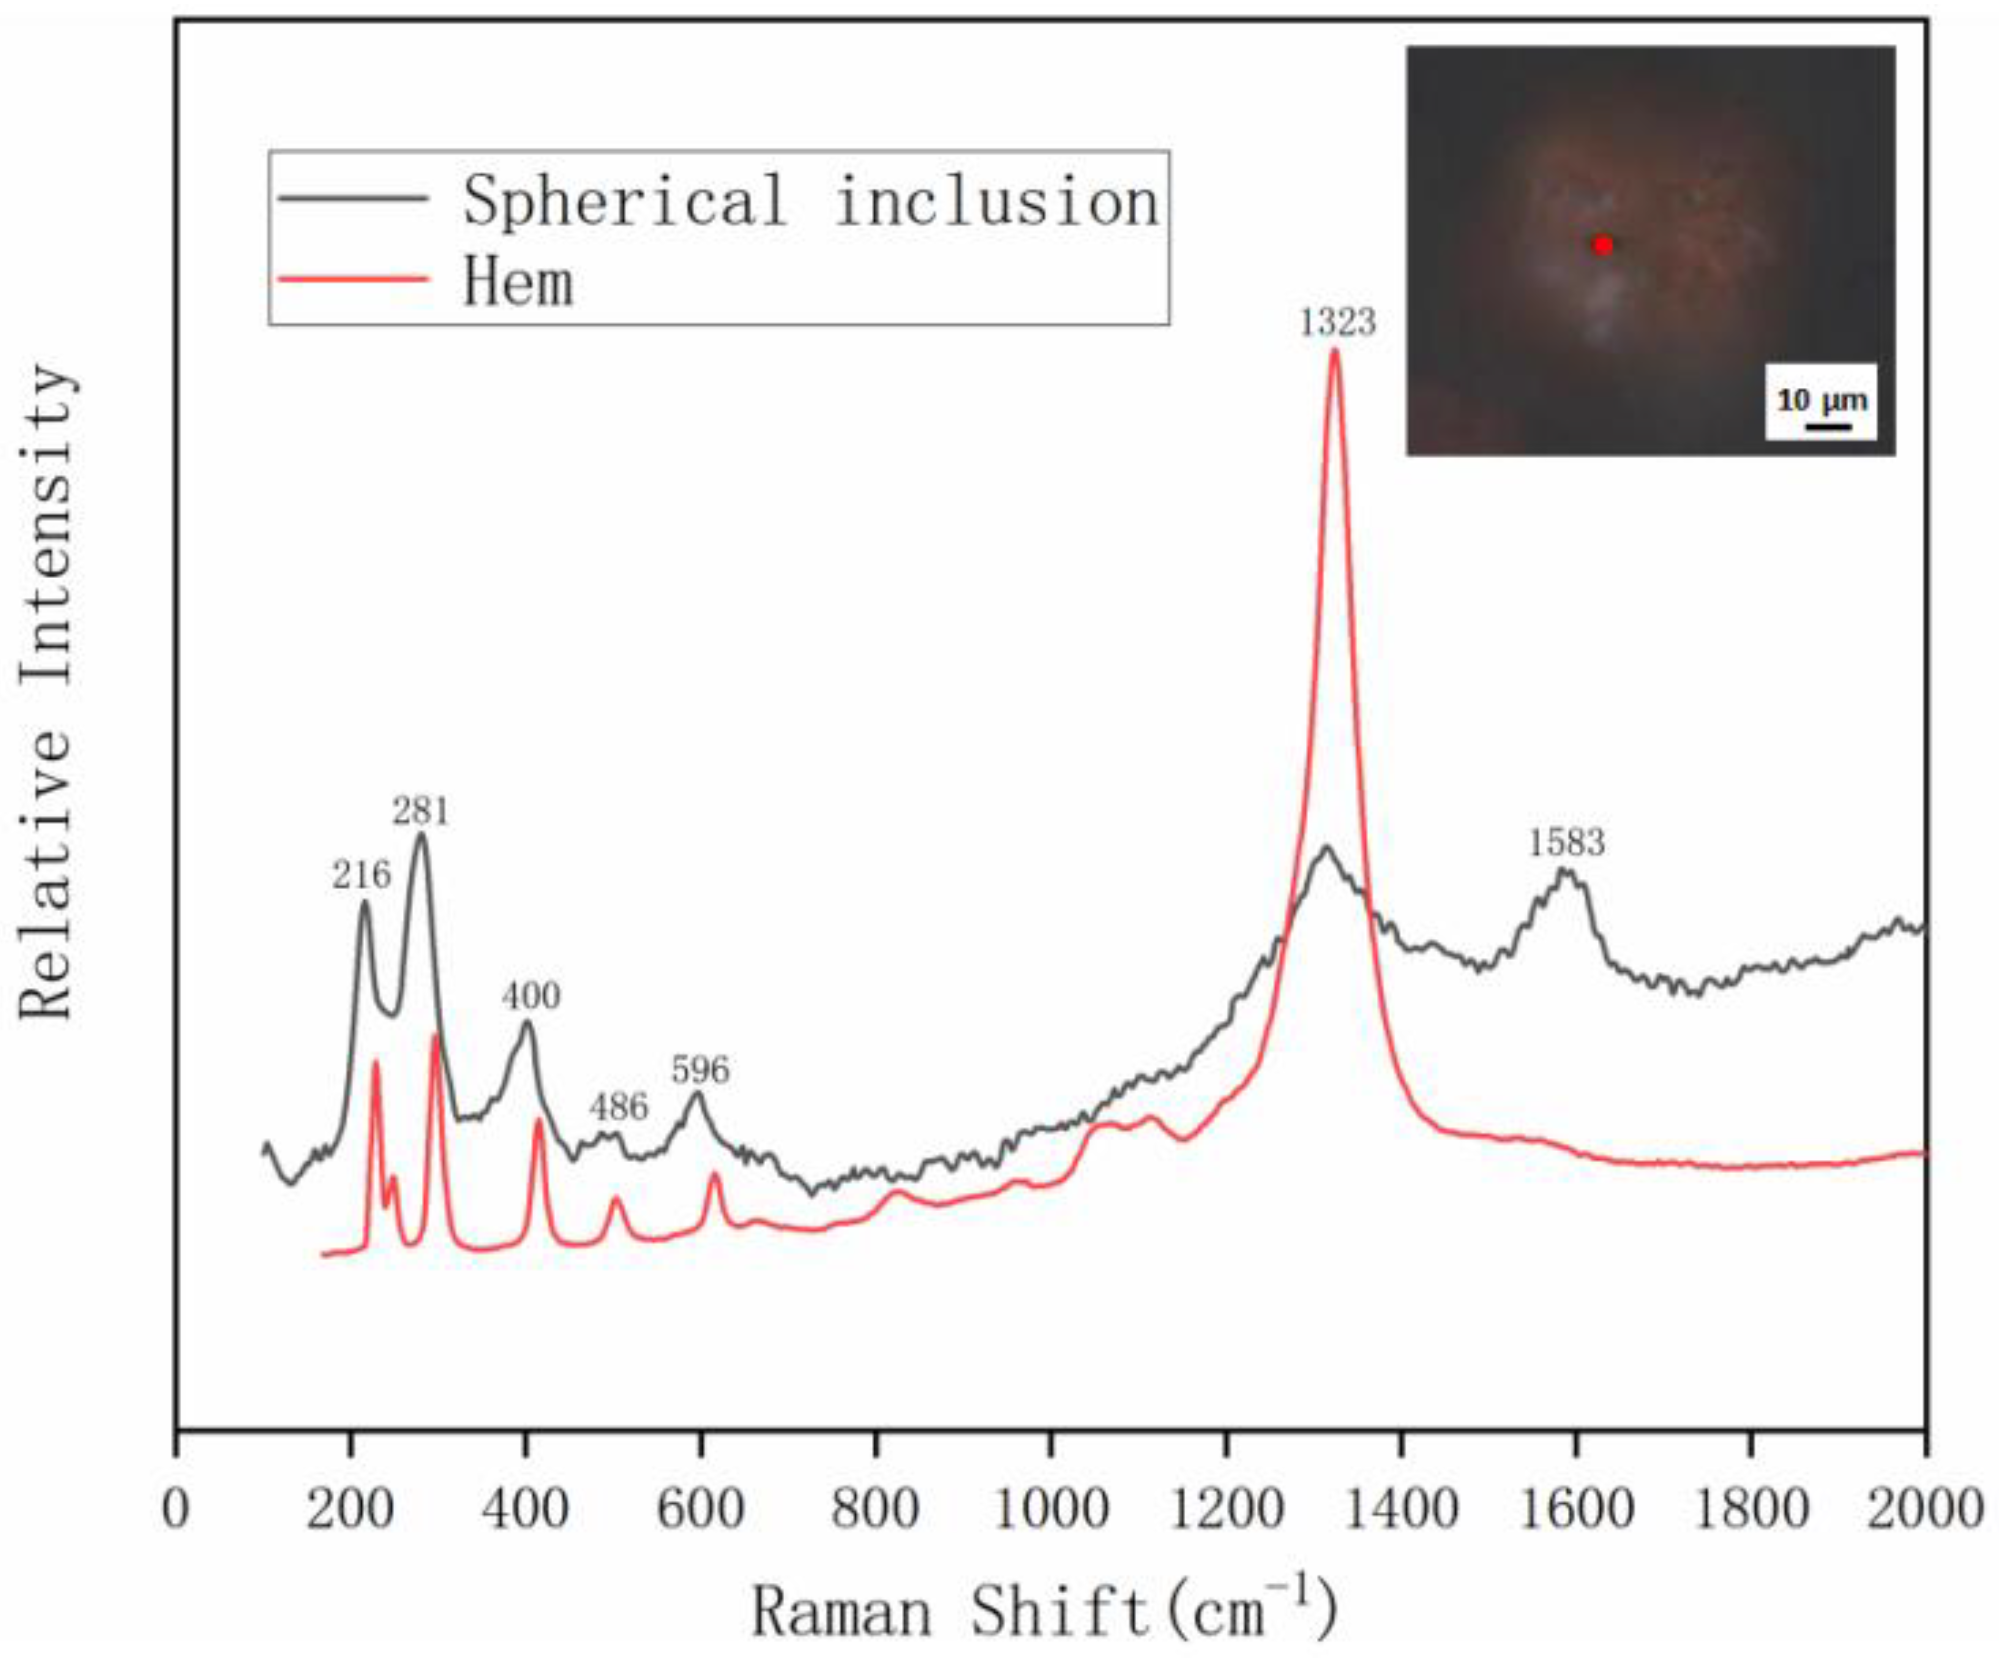
The speculation was verified by Raman spectra of spherical inclusions in q4 (
Figure 8). The Raman shifts of spherical inclusions were located around 216 cm
−1, 281 cm
−1, 400 cm
−1, 486 cm
−1, 596 cm
−1, 1323 cm
−1, and 1583 cm
−1, almost identical to the vibration modes of iron oxides.
Other Inclusions
In addition to fibrous and spherical inclusions, some other inclusions could also be found in the samples (
Figure 9). The impurity inclusions were composed of two kinds; yellowish-brown inclusions were distributed in the quartz, and were often accompanied by directional fluid inclusions (
Figure 9a). The black-brown impurities were mainly distributed in the cracks (
Figure 9b).
The interiors and the edges of the black mineral inclusions had different colors. It is clear that the main bodies were black, and the edges were brown-red (
Figure 9c), which may have been caused by their different thicknesses. The Raman shifts of the black mineral inclusions were almost identical to the vibration modes of hematite (
Figure 10). Some small quartz crystals could also be observed in the sample (
Figure 9d).
Figure 11 illustrates the detailed spot positions (the red spots) where EPMA data were taken. The chemical compositions of the black mineral inclusions are shown in
Table 1.
The total chemical composition amounts of the black inclusions, obtained by EPMA tests, were about 87%, which may be due to the alteration. According to the test results, the content of FeO accounted for about 97%, which is consistent with the hematite value reported in the reference (FeOT: 92.58%–99.47%) [
39]. Therefore, it was deduced that these inclusion consisted of hematite, which is in line with the previous Raman results.
4. Trace Elements of Trapiche-like Quartz
4.1. Electron Probe Microanalysis
In order to verify whether there were differences among their chemical compositions, the q3, q4, and q6 samples were used to perform line scanning of EMPA.
Figure 12 illustrates the detailed line positions (the red lines). The detailed chemical compositions of q3, q4, and q6 are shown in
Table 2.
The main composition of the three samples was SiO
2. There were some trace elements present, such as K, Ca, Na, Mg, Al, Fe, Ti, Mn, Cr, and Ni. The content of Al
2O
3 was the highest among all of the impurity elements. The changes of Al
2O
3, TiO
2, and FeO in the quartz are illustrated in
Figure 13 and analyzed in detail. The contents of Al
2O
3, TiO
2, and FeO were unevenly distributed on the cross-section of the whole slice. The content of Al
2O
3 experienced multiple increases and decreases from the core to the edge. According to previous studies, Al and Ti are activators of CL [
40,
41,
42,
43,
44]. The trapiche-like quartz studied in this paper was α-quartz, which is a pure silica crystal that rarely contains structural defects or impurity ions. It is stable under natural conditions. Therefore, it has few luminescent centers, and its CL is very weak. The blue-purple CL (
Figure 3) is attributed to the impurity element Al, which produces an A1
3+ + O hole color center after irradiation. When compensation ions enter the hole color center, they cause the crystal to show blue violet light under CL.
The total Al content of q4 was lower than that of q3 and q6 (
Table 2). Some studies have shown that the change in pH can affect the distribution of Al in quartz lattice. For example, at 200 °C, the lower the pH value, the higher the solubility of Al in hydrothermal fluid [
45]. According to the substitution mechanism Si
4+ = Al
3+ + H
+, the solubility of Al increases correspondingly with the decrease in pH. Compared with q3 and q6, the impurity in q4 were widely and unevenly distributed with lower Al content, which may have been caused by the increase in pH, making the impurity in the crystallization solution more stable and decreasing the solubility of Al. Based on the interaction between pH and Al concentrations, it is speculated that the uneven distribution of Al in quartz crystal can reflect the changes in formation fluid chemistry.
There was no Fe content in points 1–5 of q6 (
Table 2), while the Fe content from point 6 to point 15 was higher than that in the same areas of q3 and q4. Previous studies have shown that pink in the quartz is caused by the high content of Fe and Ti in the quartz lattice [
46,
47], which explains the change in Fe content in q6.
4.2. Laser Ablation-Inductively Coupled Plasma-Mass Spectrometry
The detailed positions (the red circles) where LA-ICP-MS data were taken are illustrated in
Figure 13. Trace elements of the core (point 1), arm (point 6), and growth sector (points 2–5) in q3 are shown in
Table 3.
It can be seen from the LA-ICP-MS results that the geochemical composition of the q3 sample was uneven. The concentration of Al varied greatly from 330 to 2300 ppm, and the concentration of other elements also changed in a large range, such as Mg (30–490 ppm), Na (10–620 ppm), Ca (30–830 ppm), Li (11–235 ppm), Cr (1–1287 ppm), Sb (2–130 ppm), S (319–700 ppm), and Cl (190–716 ppm).
Previous studies have shown that the sharp changes in the concentrations of trace elements in quartz may be caused by changes in fluid composition [
48,
49,
50]. The concentration of Cr in the core area was high, reaching an anomalous peak of 1287 ppm at point 4. Flem et al. [
51] believed that Cr existed in the form of fluid inclusions or extremely small solid inclusions in quartz. According to the internal structural characteristics of the sample (
Figure 2h), there were fewer solid inclusions in the q3 sample. Therefore, the highest Cr content is speculated to have been caused by the presence of a large number of fluid inclusions. The change in Al concentration may reflect the change in its solubility in the ore-forming fluid, which is obviously controlled by the pH of the fluid [
48,
49]. According to the substitution mechanism, Si
4+ = Al
3+ + H
+ shows that Al concentration is negatively correlated with pH [
52]. Combined with the coupling substitution relationship of Al
3+ + Li
+ → Si
4+, it was found that Li and Al showed a good linear correlation (
Figure 14). Quartz contains Sb with higher concentrations of S, which may be due to the fact that the fluid contains more S [
53]. Some studies have stated that fluids rich in Li, Al, and Sb have lower pH values and stronger acidity [
54]. A large amount of Ca and a small amount of Bi were also detected in the sample. The abundance value of Bi in intermediate acid magma is 0.01 ppm [
55]. Because Bi
3+ has a large ion radius (1.16 Å), which is close to Ca
2+ (1.01 Å), it tends to be enriched in minerals with high Ca content, and the abundance of Bi in acid magma is slightly higher. This effectively explains that the Bi content is between 0.01–0.03 ppm. In the Dongwuqi area, Inner Mongolia, except for the alkaline granite type Nb-Y deposit, other deposits can be regarded as belonging to the Yanshanian deep source intermediate acid hypabyssal-ultrahypabyssal porphyry copper polymetallic metallogenic series [
56]. Based on the above analysis, it is speculated that our sample grew in an acidic, magmatic environment.
5. Discussion
5.1. Formation Temperature of Trapiche-like Quartz
Ti
4+ easily replaces Si
4+ in the form of isomorphism in a quartz structure. Based on this, our predecessors established a Ti geothermometer through a series of experiments to calculate the formation temperature of quartz. At present, Ti geothermometers have been widely used to calculate the formation temperature of quartz. Wark and Watson established a geological thermometer which is widely used to calculate the formation temperature of magmatic quartz [
57,
58,
59]. The expression of the geological thermometer (Titani Q) [
60] is:
in the formula represents the content of Ti in quartz (ppm). represents the activity coefficient of TiO2, which is expressed as 1 for calculation. Because the value of cannot be determined, the calculation results are only for reference and need to be further verified by other test methods.
Kawasaki and Osanai derived another Ti geothermometer (Formula (2)) [
61] from natural rocks of granulite origin in Antarctica. Where
is the mole fraction of TiO
2:
Through EPMA line scanning, we obtained the Ti content of q3, q4, and q6 from the center to the edge. It was found that the concentration of Ti in the whole sample was high and unstable, indicating that the formation temperature was relatively high. The calculated temperature is shown in
Table 4, and was obtained by taking different TiO
2 contents into account, such as 1, 3, 7, 8, and 9 EPMA points in q3; 2, 5, 8, 10, 11, 13, and 15 EPMA points in q4; and 1, 3, 7, 8, 9, 10, and 15 EPMA points in q6.
The calculated results show that the temperature periodically changed from the core to the edge. The temperature difference calculated by Formulas (1) and (2) was about 130 °C. Since the value of
in Formula (1) could not be determined, the temperature calculated by Formula (2) is more believable. The content ranges of Ti in the growth zones of a single crystal were 20–190 ppm, 60–620 ppm, and 30–260 ppm, respectively. The calculated temperatures corresponded to 448–706 °C, 552–944 °C, and 479–760 °C, respectively. In the process of crystal formation, it is impossible to have such a large temperature fluctuation, because the thermal quality of the surrounding rock will inhibit the temperature change and the quartz will dissolve when the temperature rises [
48].
The LA-ICP-MS result shows that the main chemical components of the core, arms, and growth sectors in q3 were SiO
2. The contents of Al
2O
3, TiO
2 and FeO were unevenly distributed on the cross-section; this is in line with the EPMA test results. We took the TiO
2 contents (keeping four decimal places of raw data, ppm, the second row in
Table 5) of points 1, 3, 4, 5, and 6 into Formulas (1) and (2) to calculate the quartz formation temperature, as shown in
Table 5.
It can be seen from
Table 5 that the growth environment of the sample had a medium-high temperature, and the average crystallization temperatures of the sample were 461 °C and 325 °C, respectively. Rusk et al. [
48] believed that Al concentrations formed at temperatures <350 °C consistently in the range of several thousand ppm in all quartz, and rarely in quartz that formed at >400 °C. The Al concentration of the sample was between 330–2300 ppm. Therefore, the second calculated temperature (325 °C from ICP-MS results and Formula (2)) is more reliable.
5.2. Growth Mechanism of Trapiche-like Quartz
Based on the microstructure characteristics, it can be proposed that the white-colored fibrous inclusions, which form the trapiche-like patterns in the samples, consist of many elongated grains. The core was smoother under orthogonal polarization, which indicates that the quartz was crystallized during the nucleation of ordinary quartz at the beginning. The growth sectors showed obvious wavy extinction, indicating that the crystal growth environment changed greatly in a certain period, resulting in a dislocation slip of the crystal. The temperature, differential stress, and activity of chemical components (such as water) led to the initiation of the slip system [
62]. According to the EPMA and LA-ICP-MS data, the crystallization temperature was medium-high and changed periodically. It is speculated that this is an important factor leading to dislocation slip. The infrared spectrum data show that the samples contained H
2O, and previous studies have shown that the presence of water in the environment can cause hydrolysis weakening of Si-O bonds, thereby reducing the Peierls stress (the stress required for dislocation intergranular slip) in the slip system and providing a driving force for dislocation slip and particle boundary migration [
63,
64]. When the subgrains generated by the dislocation slip rotate and recrystallize [
65], the newly formed grains are pushed outward, layer by layer, in the direction of the diagonal axis. They then grow into intermittent elongated inclusions, forming fibrous inclusions which are densely arranged in the direction of the diagonal axis and can be observed by the naked eye.
6. Conclusions
Trapiche-like quartz from the Dongwuqi area has six transparent arms that run from the core to the six corners of the hexagonal growth structure. Trapiche-like patterns in quartz samples are caused by the white fibrous chalcedony distributed in the growth sectors. According to the magnification results, white fibrous chalcedony was formed by a large number of elongated inclusions arranged in a dense orientation. Besides chalcedony, other inclusions were also observed in the quartz crystals, such as spherical inclusions, impurity inclusions, and secondary crystals. The spherical inclusions were iron oxides, according to Raman spectra. There was also some water in the sample crystals, according to the infrared results.
The results of EPMA and LA-ICP-MS demonstrated that there were no differences in chemical composition among the core, arms, and growth sectors, indicating that the texture of trapiche-like quartz is irrelevant to its chemical composition. The high concentration of the Cr element indicated that there were a large number of fluid inclusions. Combined with the content of Bi and the metallogenic characteristics of the Dongwuqi deposit, it is speculated that the samples grew in an acidic environment. Coupled with the CL results, the blue-purple color was attributed to the Al2O3 content. According to the TiO2 content, it was calculated that the samples’ crystallization occurred in a medium-high temperature environment, at an average temperature of 325 °C.
The formation of a trapiche-like texture is related to dislocation glide. Wavy extinction and a rough interface were observed in the growth sectors under cross-polarized light, indicating that dislocation glide had occurred in the crystal. The periodic changes in environmental temperature and the decrease in Peierls stress inside the crystal led to the activation of the slip system, resulting in the occurrence of dislocation slip. The subgrains generated by dislocation glide were recrystallized, forming new grains that continuously grew along the diagonal axis direction. Thus, a large number of elongated inclusions were formed in the diagonal axis direction of the crystal, forming the trapiche-like pattern in the quartz.
Author Contributions
Conceptualization, L.J. and Y.L.; methodology, L.J. and Y.L.; validation, L.J. and Y.L.; formal analysis, L.J.; investigation, L.J.; resources, Y.L.; writing—original draft preparation, L.J.; writing—review and editing, Y.L. All authors have read and agreed to the published version of the manuscript.
Funding
This research was funded by the Fundamental Research Funds for the Central Universities (grant number 2652017090) to Y.L.
Data Availability Statement
The data presented in this study are available within the article.
Acknowledgments
We thank the editor and reviewers for constructive comments which helped in improving our paper.
Conflicts of Interest
The authors declare no conflict of interest.
References
- Bertrand, E. Compte-rendu de la séance du 13 Février 1879. Bull. Société Française Minéralogie Crystallogr. 1879, 2, 31. [Google Scholar]
- McKague, H.L. Trapiche emeralds from Colombia. Gems Gemol. 1964, 11, 210–223. [Google Scholar]
- Pignatelli, I.; Giuliani, G.; Ohnenstetter, D.; Agrosi, G.; Mathieu, S.; Morlot, C.; Branquet, Y. Colombian Trapiche Emeralds: Recent Advances in Understanding Their Formation. Gems Gemol. 2015, 51, 222–259. [Google Scholar] [CrossRef]
- Schmetzer, K. Trapiche emerald from Colombia. Gems Gemol. 2019, 55, 156–158. [Google Scholar]
- Müllenmeister, H.J.; Zang, J. Ein Trapiche-Rubin aus Myanmar (Burma). Lapis 1995, 20, 50. [Google Scholar]
- Henn, U.; Bank, H. Trapicheartige Korunde aus Myanmar. Gemmologie. Z. Der Dtsch. Gemmol. Ges. 1996, 45, 23–24. [Google Scholar]
- Schmetzer, K.; Hanni, H.A.; Bernhardt, H.J.; Dietmar, S. Trapiche Rubies. Gems Gemol. 1996, 32, 242–250. [Google Scholar] [CrossRef]
- Schmetzer, K.; Beili, Z.; Yan, G.; Bernhardt, H.J. Element mapping of trapiche rubies. J. Gemmol. 1998, 26, 289–301. [Google Scholar] [CrossRef]
- Sunagawa, I.; Bernhardt, H.J.; Schmetzer, K. Texture formation and element partitioning in trapiche ruby. J. Cryst. Growth 1999, 206, 322–330. [Google Scholar] [CrossRef]
- Garnier, V.; Ohnenstetter, D.; Giuliani, G.; Blanc, P.; Schwarz, D. Trace-element contents and cathodoluminescence of “trapiche” rubies from Mong Hsu, Myanmar (Burma): Geological significance. Mineral Petrol. 2002, 76, 179–194. [Google Scholar] [CrossRef]
- Win, K.K. Trapiche of Myanmar. Aust. Gemmol. 2005, 22, 269–270. [Google Scholar]
- Koivula, J.I.; Kammerling, R.C.; Fritsch, E. Gem news: “Trapiche” purple-pink sapphire. Gems Gemol. 1994, 30, 197. [Google Scholar]
- Beaton, D. A rare yellow trapiche sapphire. Gems Gemol. 2008, 44, 259–260. [Google Scholar]
- Khotchanin, K.; Thanasuthipitak, K.; Thanasuthipitak, T. The structure and chemical composition of trapiche blue sapphire from Southern Vietnam and Cambodia. J. Gemmol. Assoc. Hong Kong 2009, 30, 25–35. [Google Scholar]
- Hainschwang, T.; Notari, F.; Ancckar, B. Trapiche Tourmaline from Zambia. Gems Gemol. 2007, 43, 36–46. [Google Scholar] [CrossRef]
- Schmetzer, K.; Bernhardt, H.J.; Hainschwang, T. Chemical and growth zoning in trapiche tourmaline from Zambia-a re-evaluation. J. Gemmol. 2011, 32, 151. [Google Scholar] [CrossRef]
- Koivula, J.I. Two unusual aquamarines. Gems Gemol. 2008, 44, 275–276. [Google Scholar]
- Befi, R. Trapiche aquamarine from Namibia. Gems Gemol. 2012, 48, 143–144. [Google Scholar]
- Krzemincki, M.S.; Laurs, B.M. Quartz with Radiating Fibres, Sold as Trapiche Quartz. J. Gemmol. 2014, 34, 296–298. [Google Scholar]
- Beaton, D. African rhodochrosite and Colombian quartz with trapiche patterns. Gems Gemol. 2016, 52, 218. [Google Scholar]
- Sun, Z.; Muyal, J.; Hand, D. Trapiche-like amethyst from Brazil. Gems Gemol. 2018, 54, 237–238. [Google Scholar]
- Farfan, G.; Rakovan, J.; Ackerson, M.; Andrews, B.; Post, J. The origin of trapiche-like inclusion patterns in quartz from Inner Mongolia, China. Am. Mineral. 2021, 106, 1797–1808. [Google Scholar] [CrossRef]
- Jiang, L.; Chen, Z.; Liu, Y.X. The Chemical Composition of Trapiche-like Quartz from Huanggangliang Area, Inner Mongolia, China. Crystals 2022, 12, 122. [Google Scholar] [CrossRef]
- Moe, K. Trapiche spinel from Mogok, Myanmar. Gems Gemol. 2011, 47, 329–330. [Google Scholar]
- Masayuki, K.; Mutsumi, K.; Mikuni, H.; Ritsuro, M.; Hiroyuki, K.; Hiroyuki, I.; Toshiro, N. Kinetic roughening of tapered quartz and formation of trapiche quartz from Goyomatsu mine, Nara prefecture. Hist. Caribe 2016, 32, 41. [Google Scholar]
- Chen, Z. Gemmological and Mineralogical Study on Trapiche-like Quartz in Inner Mongolia. Master’s Thesis, China University of Geosciences, Beijing, China, 3 June 2019. [Google Scholar]
- Liu, Y.S.; Hu, Z.C.; Gao, S.; Günther, D.; Xu, J.; Gao, C.G.; Chen, H.H. In situ analysis of major and trace elements of anhydrous minerals by LA-ICP-MS without applying an internal standard. Chem. Geol. 2008, 257, 34–43. [Google Scholar] [CrossRef]
- Wei, Y.Y. Microstructure and Inclusion Characteristics of Vein Quartz and Its’ Relationship of Making High Purity Quartz. Master’s Thesis, Chengdu University of Technology, Chengdu, China, 15 June 2015. [Google Scholar]
- Peng, H.J.; Wang, X.W.; Tang, J.X.; Qin, Z.P.; Hou, L.; Zhou, Y. The Characteristics of Cathodoluminescence-Visualized Microstructure in Quartz: A Case Study from the Jiama Igneous Rock in Tibeta. Bull. Mineral. Petrol. Geochem. 2010, 29, 279–283. [Google Scholar]
- Guo, P. The Crystaland Synthetics under Cathode Luminescence Characteristic’s Research. Master’s Thesis, China University of Geosciences, Beijing, China, 5 May 2011. [Google Scholar]
- Noons, R.E.; Devonshire, R.; Clapp, T.V.; Ojha, S.M.; McCarthy, O. Analysis of waveguide silica glasses using Raman microscopy. J. Non-Cryst. Solids 2007, 354, 3059–3071. [Google Scholar] [CrossRef]
- Zeng, C.Y.; Zhao, M.Z.; Li, H.Z.; Niu, J.; Zhang, J.T.; He, J.G.; Zhou, Y.Z.; Yang, Z.J. Study on Mineralogical Characteristics of Quartz and Calcite from Feieling Skarn-Type Pb-Zn Deposit in Southwest Margin of Yunkai Massif. Spectrosc. Spectr. Anal. 2015, 35, 2558–2562. [Google Scholar]
- Li, H.Z.; Zhai, M.G.; Zhang, L.G.; Yang, Z.J.; Zhou, Y.Z.; He, J.G.; Liang, J.; Zhou, L.Y.; Voudouris, P.C. Distribution, Microfabric, and Geochemical Characteristics of Siliceous Rocks in Central Orogenic Belt, China: Implications for a Hydrothermal Sedimentation Model. Sci. World J. 2014, 2014, 780910. [Google Scholar] [CrossRef]
- Yang, Z.J.; Li, H.Z.; Peng, M.S.; Chen, J.; Lin, F. Study on the HPHT synthetic diamond crystal from Fe-C(H) system and its significance. Chin. Sci. Bull. 2008, 53, 137–144. [Google Scholar] [CrossRef]
- Champagnon, B.; Panczer, G.; Chemarin, C.; Humbert, L.B. Raman study of quartz amorphization by shock pressure. J. Non-Cryst. Solids 1996, 196, 221–226. [Google Scholar] [CrossRef]
- Arguirov, T.; Mchedlidze, T.; Akhmetov, V.D.; Kouteva, A.S.; Kittler, M.; Rölver, R.; Berghoff, B.; Först, M.; Bätzner, D.L.; Spangenberg, B. Effect of laser annealing on crystallinity of the Si layers in Si/SiO2 multiple quantum wells. Appl. Surf. Sci. 2008, 254, 1083–1086. [Google Scholar] [CrossRef]
- Che, X.J. Study on Color Mechanism and Testing Technology of Rock Crystal. Master’s Thesis, East China University of Science and Technology, Shanghai, China, 2011. [Google Scholar]
- Yu, L.G. Study on colorin gme chanism of coffee color quartzite jade from Myanmar. Super Hard Mater. Eng. 2023, 35, 52–56. [Google Scholar]
- Wang, P.; Pan, Z.L.; Weng, L.B. Systematic Mineralogy; Geological Publishing House: Beijing, China, 1984; Volume 1, p. 422. [Google Scholar]
- Rusk, B.G.; Reed, M.H.; Dilles, J.H.; Kent, A.J. Intensity of quartz cathode luminescence and trace-element content in quartz from the porphyry copper deposit at Butte, Montan. Am. Mineral. 2006, 91, 1300–1312. [Google Scholar] [CrossRef]
- Rusk, B.G.; Reed, M.H. Scanning electron microscope cathode luminescence analysis of quartz reveals complex growth histories in veins from the Butte porphyry copper deposit, Montana. Geology 2002, 30, 727–730. [Google Scholar] [CrossRef]
- Seyedolali, A.; Krinsley, D.H. Provenance interpretation of quartz by scanning electron microscope cathode luminescence fabric analyze. Geology 1997, 25, 787–790. [Google Scholar] [CrossRef]
- Bernet, M.; Bassett, K. Procenance analysis by single-quartz-grain SEM-CL/optical microscopy. J. Sediment. Res. 2005, 75, 492–500. [Google Scholar] [CrossRef]
- Li, Y.Q.; She, Z.B.; Ma, C.Q. SEM-CL Analysis of Quartz and Its Application in Petrology. Adv. Earth Sci. 2011, 26, 325–331. [Google Scholar]
- Chen, J.F.; Zhang, H. Trace Elements in Quartz Lattice and Their Implications for Petrogenesis and Mineralization. Geol. J. China Univ. 2011, 17, 125–135. [Google Scholar] [CrossRef]
- Hassan, F.; Cohen, A.J. Biaxial color-centers in amethyst quartz. Am. Mineral. 1974, 59, 709–718. [Google Scholar]
- Cohen, A.J.; Makar, L.N. Dynamic biaxial absorption spectra of Ti3+ and Fe2+ in a natural rose quartz crystal. Mineral. Mag. 1985, 49, 709–715. [Google Scholar] [CrossRef]
- Rusk, B.G.; Lowers, H.A.; Reed, M.H. Trace elements in hydrothermal quartz: Relationships to cathodoluminescent textures and insights into vein formation. Geology 2008, 36, 547–550. [Google Scholar] [CrossRef]
- Perny, B.; Eberhardt, P.; Ramseyer, K.; Mullis, J.; Pankrathet, R. Microdistribution of Al, Li, and Na in α quartz: Possible causes and correlation with short Jived cathodoluminescence. Am. Mineral. 1992, 77, 534–544. [Google Scholar]
- Jourdan, A.L.; Venneman, T.W.; Mullis, J.; Spiers, C.J. Evidence of growth and sector zoning in hydrothermal quartz from Alpine veins. Eur. J. Mineral. 2009, 21, 219–231. [Google Scholar] [CrossRef]
- Flem, B.; Larsen, R.B.; Grimstvedt, A.; Mansfeld, J. In situ analysis of trace elements in quartz by using laser ablation inductively coupled plasma mass spectrometry. Chem. Geol. 2002, 182, 237–247. [Google Scholar] [CrossRef]
- Goldfarb, R.J.; Groves, D.I. Orogenic gold: Common or evolving fluid and metal sources through time. Lithos 2015, 233, 2–26. [Google Scholar] [CrossRef]
- He, Z.X.; Chen, Y.L.; Chang, D.; Wei, J.; Hu, X.G. Geochemical Characteristics of Trace Element of Calcite, Quartz of the No. 510-1 Uranium Ore Deposit in Zoige. Acta Geol. Sin.-Engl. Ed. 2014, 88, 1105–1106. [Google Scholar] [CrossRef]
- Michel, C.M.; Alain, W. The Beauvoir topaz-lepidolite albite granite (Massif Central, France): The disseminated magmatic tin-lithium-tantalum-niobium-beryllium mineralization. Econ. Geol. 1992, 87, 1766–1794. [Google Scholar]
- Turekian, K.K.; Wedepohl, K.H. Distribution of the elements in some major units of the earth’ s crust. Geol. Soc. Am. Bull. 1961, 72, 175–191. [Google Scholar] [CrossRef]
- Zhao, S.M. Polymetallic metallogenic geological characteristics in Dongwuqi area of Inner Mongolia copper. Geol. Prospect. 2017, 23, 177–179. [Google Scholar]
- Larsen, R.B.; Henderson, I.; Ihlen, P.M.; Francois, J. Distribution and petrogenetic behaviour of trace elements in granitic pegmatite quartz from South Norway. Contrib. Mineral Petrol. 2004, 147, 615–628. [Google Scholar] [CrossRef]
- Wark, D.A.; Hildreth, W.; Spear, F.S.; Cherniak, D.; Watson, E.B. Pre-eruption recharge of the Bishop magma system. Geology 2007, 35, 235–238. [Google Scholar] [CrossRef]
- Wiebe, R.A.; Wark, D.A.; Hawkins, D.P. Insights from quartz cathodoluminescence zoning into crystallization of Vinalhaven granite, Coastal Mine. Contrib. Mineral Petrol. 2007, 154, 439–453. [Google Scholar] [CrossRef]
- Wark, D.A.; Watson, E.B. Titani Q: A titanium-in-quartz geothermometer. Contrib. Mineral Petrol. 2006, 152, 743–752. [Google Scholar] [CrossRef]
- Kawasaki, T.; Osanai, Y. Empirical thermometer of TiO2 in quartz for ultrahigh-temperature granulites of East Antarctica. Geol. Soc. Lond. Spec. Publ. 2008, 308, 419–430. [Google Scholar] [CrossRef]
- Xia, H.R.; Liu, J.L. The crystallographic preferred orientation of quartz and its applications. Geol. Bull. China 2011, 30, 58–70. [Google Scholar]
- Griggs, D.T. Hydrolytic weakening of quartz and other silicates. Geophys. J. R. Astron. 1967, 14, 19–31. [Google Scholar] [CrossRef]
- Tullis, J.; Yund, R.A. Hydrolytic weakening of quartz aggregates: The effects of water and pressure on recovery. Geophys. Res. Lett. 1989, 16, 1343–1346. [Google Scholar] [CrossRef]
- Hirth, G.; Tullis, J. Dislocation creep regimes in quartz aggregates. J. Struct. Geol. 1992, 14, 145–159. [Google Scholar] [CrossRef]
Figure 1.
Quartz slices from the Dongwiqi area.
Figure 1.
Quartz slices from the Dongwiqi area.
Figure 2.
Optical images of trapiche-like quartz. (a–f) The core and arms of q1–q6 in trapiche-like quartz under transmitted light. (g) The growth sectors under transmitted light. (h) Image of q3 under single polarized light. (i) Image of q3 under cross-polarized light.
Figure 2.
Optical images of trapiche-like quartz. (a–f) The core and arms of q1–q6 in trapiche-like quartz under transmitted light. (g) The growth sectors under transmitted light. (h) Image of q3 under single polarized light. (i) Image of q3 under cross-polarized light.
Figure 3.
Polarized and CL images of samples. (a,c) Compared to the image under a polarizer of q3, the growth band is displayed in the orange lines under CL. (b,d) Characteristics of cracks in q3. (e,g) The carbonate filled in the crack (q6). (f,h) Characteristics of concave angle caused by parallel grouping (q6).
Figure 4.
Raman spectra of the samples and FWHM of the 464 cm−1 shift. (a) Raman spectra of six samples, compared with the quartz spectrum in the RRUFF database (RRUFF ID: R040031); (b) FWHM of 464 cm−1 in the q1–q6 sample.
Figure 4.
Raman spectra of the samples and FWHM of the 464 cm−1 shift. (a) Raman spectra of six samples, compared with the quartz spectrum in the RRUFF database (RRUFF ID: R040031); (b) FWHM of 464 cm−1 in the q1–q6 sample.
Figure 5.
Infrared spectra of quartz samples: insert (a) is the peaks at 1500 cm−1–1700 cm−1 of the samples.
Figure 5.
Infrared spectra of quartz samples: insert (a) is the peaks at 1500 cm−1–1700 cm−1 of the samples.
Figure 6.
Different magnifications of fibrous inclusions in q5 under plane-polarized light. (a) 12.5× magnification; (b) 50× magnification; (c) 100× magnification; (d) 200× magnification; (e) Raman peaks of fibrous inclusions.
Figure 6.
Different magnifications of fibrous inclusions in q5 under plane-polarized light. (a) 12.5× magnification; (b) 50× magnification; (c) 100× magnification; (d) 200× magnification; (e) Raman peaks of fibrous inclusions.
Figure 7.
Images of spherical inclusions. (a) Spherical inclusions in quartz crystal (q4); (b) spherical inclusions in country rock (q2); (c) spherical inclusions at the boundary between crystal and country rock (q4).
Figure 7.
Images of spherical inclusions. (a) Spherical inclusions in quartz crystal (q4); (b) spherical inclusions in country rock (q2); (c) spherical inclusions at the boundary between crystal and country rock (q4).
Figure 8.
Raman peaks of spherical inclusions in q4 (
Figure 7a), compared with those of hematite (RRUFF ID: R050300).
Figure 8.
Raman peaks of spherical inclusions in q4 (
Figure 7a), compared with those of hematite (RRUFF ID: R050300).
Figure 9.
Images of other inclusions in the samples. (a) Image of yellowish-brown minerals in q5; (b) cracks filled with yellowish-brown impurities; (c) black mineral inclusions in quartz; (d) small quartz crystals and fluid inclusions (in the red closed curve).
Figure 9.
Images of other inclusions in the samples. (a) Image of yellowish-brown minerals in q5; (b) cracks filled with yellowish-brown impurities; (c) black mineral inclusions in quartz; (d) small quartz crystals and fluid inclusions (in the red closed curve).
Figure 10.
Raman peaks of black mineral inclusions (
Figure 9c), compared with those of hematite (RRUFF ID: R050300).
Figure 10.
Raman peaks of black mineral inclusions (
Figure 9c), compared with those of hematite (RRUFF ID: R050300).
Figure 11.
EPMA spot positions (the red spots) of black mineral inclusions.
Figure 11.
EPMA spot positions (the red spots) of black mineral inclusions.
Figure 12.
Histogram of TiO2, FeO, and Al2O3 contents in three EPMA lines. Insets in (a–c) are the locations of detailed detected lines in q3, q4, and q6, respectively.
Figure 12.
Histogram of TiO2, FeO, and Al2O3 contents in three EPMA lines. Insets in (a–c) are the locations of detailed detected lines in q3, q4, and q6, respectively.
Figure 13.
Location of points where LA-ICP-MS was performed.
Figure 13.
Location of points where LA-ICP-MS was performed.
Figure 14.
Positive correlation between Li and Al.
Figure 14.
Positive correlation between Li and Al.
Table 1.
Chemical compositions of black inclusions, obtained by EPMA (wt%).
Table 1.
Chemical compositions of black inclusions, obtained by EPMA (wt%).
| No. | K2O | CaO | TiO2 | Na2O | MgO | Al2O3 | SiO2 | Cr2O3 | MnO | FeO | NiO | Total |
|---|
| 1 | 0.023 | 0.007 | 0.018 | 0.021 | 0.067 | 0.204 | 0.756 | - | 0.395 | 86.307 | - | 87.798 |
| 2 | 0.037 | 0.068 | 0.004 | 0.103 | 0.066 | 2.985 | 0.752 | - | 0.346 | 82.360 | 0.060 | 86.781 |
| 3 | 0.027 | 0.031 | 0.033 | 0.058 | 0.030 | 0.099 | 0.472 | 0.036 | 0.421 | 87.357 | - | 88.553 |
Table 2.
Chemical compositions of q3, q4, and q6 from core to edge, obtained by EPMA (wt%).
Table 2.
Chemical compositions of q3, q4, and q6 from core to edge, obtained by EPMA (wt%).
| Sample | No. | K2O | CaO | TiO2 | Na2O | MgO | Al2O3 | SiO2 | Cr2O3 | MnO | FeO | NiO | Total |
|---|
| q3 | 1 | - | - | - | - | 0.012 | 0.230 | 99.056 | - | - | - | - | 99.333 |
| 2 | 0.035 | 0.025 | - | - | 0.014 | 0.226 | 98.722 | - | - | - | - | 99.032 |
| 3 | - | - | - | 0.013 | - | 0.208 | 98.745 | - | - | - | 0.021 | 98.991 |
| 4 | - | - | - | - | - | 0.190 | 99.153 | 0.042 | - | - | - | 99.389 |
| 5 | - | - | 0.002 | 0.012 | - | 0.172 | 99.087 | - | 0.024 | - | - | 99.314 |
| 6 | - | - | - | - | - | 0.144 | 99.035 | - | - | 0.027 | 0.019 | 99.233 |
| 7 | 0.015 | - | 0.019 | - | - | 0.188 | 98.948 | - | - | - | - | 99.190 |
| 8 | - | 0.022 | - | 0.022 | - | 0.201 | 98.577 | - | - | - | - | 98.831 |
| 9 | 0.018 | 0.014 | - | 0.035 | - | 0.233 | 98.758 | 0.017 | 0.016 | - | - | 99.094 |
| 10 | - | 0.026 | 0.013 | - | - | 0.065 | 99.086 | - | 0.027 | 0.018 | - | 99.252 |
| 11 | - | - | - | - | - | 0.031 | 98.499 | 0.017 | - | - | 0.030 | 98.587 |
| 12 | - | - | - | - | - | 0.019 | 98.997 | - | - | 0.033 | 0.034 | 99.101 |
| 13 | 0.024 | - | - | 0.024 | - | 0.014 | 99.348 | - | 0.037 | - | - | 99.455 |
| 14 | - | - | 0.008 | - | - | - | 99.209 | - | - | - | - | 99.220 |
| 15 | 0.022 | - | - | - | 0.024 | 0.057 | 98.628 | - | - | 0.079 | - | 98.819 |
| q4 | 1 | 0.023 | 0.015 | - | 0.036 | - | 0.196 | 98.522 | - | - | 0.018 | - | 98.823 |
| 2 | - | - | 0.007 | - | - | - | 99.530 | - | - | - | 0.046 | 99.605 |
| 3 | - | - | - | - | - | 0.081 | 99.163 | - | - | - | 0.029 | 99.294 |
| 4 | - | - | - | - | 0.023 | 0.163 | 98.891 | 0.019 | - | 0.020 | - | 99.135 |
| 5 | 0.011 | - | 0.021 | - | - | 0.064 | 99.707 | 0.024 | - | - | - | 99.849 |
| 6 | - | - | - | - | - | 0.090 | 99.555 | - | - | - | - | 99.676 |
| 7 | - | 0.018 | - | - | - | 0.192 | 99.074 | - | - | 0.020 | - | 99.322 |
| 8 | - | - | 0.062 | 0.015 | 0.010 | 0.139 | 99.607 | - | - | - | - | 99.833 |
| 9 | - | - | - | - | - | 0.186 | 99.943 | - | - | - | - | 100.144 |
| 10 | - | 0.017 | 0.006 | - | - | 0.131 | 98.883 | - | - | - | 0.043 | 99.102 |
| 11 | 0.020 | 0.034 | 0.008 | 0.034 | - | 0.208 | 99.520 | - | 0.029 | - | - | 99.869 |
| 12 | - | 0.030 | - | - | - | 0.158 | 99.139 | - | - | - | - | 99.355 |
| 13 | - | - | 0.040 | - | 0.013 | - | 99.316 | - | 0.017 | - | - | 99.390 |
| 14 | - | - | - | - | - | 0.258 | 99.035 | - | - | - | - | 99.342 |
| 15 | - | - | 0.020 | - | - | 0.200 | 99.011 | 0.026 | - | - | - | 99.292 |
| q6 | 1 | - | - | 0.026 | 0.036 | 0.015 | 0.032 | 99.228 | - | - | - | - | 99.362 |
| 2 | - | 0.013 | - | 0.025 | - | 0.251 | 98.579 | - | - | - | - | 98.883 |
| 3 | - | 0.014 | 0.006 | 0.015 | - | 0.242 | 98.769 | - | - | - | - | 99.065 |
| 4 | 0.032 | - | - | 0.037 | - | 0.312 | 97.860 | - | - | - | - | 98.251 |
| 5 | 0.017 | - | - | 0.014 | - | 0.266 | 98.229 | - | - | - | - | 98.549 |
| 6 | - | - | - | 0.063 | - | 0.240 | 97.558 | - | - | - | - | 97.873 |
| 7 | - | 0.014 | 0.012 | - | 0.027 | 0.252 | 98.716 | - | 0.039 | 0.161 | - | 99.239 |
| 8 | 0.015 | 0.020 | 0.010 | 0.016 | 0.012 | 0.136 | 99.139 | - | - | - | - | 99.362 |
| 9 | - | - | 0.016 | - | - | 0.015 | 99.550 | - | - | - | - | 99.595 |
| 10 | - | 0.018 | 0.004 | 0.014 | - | 0.180 | 99.433 | - | - | 0.033 | - | 99.682 |
| 11 | 0.025 | - | - | - | - | 0.168 | 99.124 | - | - | - | - | 99.360 |
| 12 | - | - | - | 0.034 | - | 0.081 | 99.187 | - | - | - | - | 99.317 |
| 13 | - | - | - | - | - | 0.062 | 99.433 | - | - | 0.042 | - | 99.555 |
| 14 | 0.019 | 0.014 | - | - | - | 0.020 | 99.453 | - | - | - | - | 99.522 |
| 15 | 0.015 | - | 0.003 | - | - | 0.059 | 99.981 | - | - | 0.030 | - | 100.088 |
Table 3.
Trace element concentrations of the investigated samples, analyzed by LA-ICP-MS.
Table 3.
Trace element concentrations of the investigated samples, analyzed by LA-ICP-MS.
| | | 1 | 2 | 3 | 4 | 5 | 6 |
|---|
| Na2O | wt% | 0.062 | 0.000 | 0.000 | 0.007 | 0.001 | 0.000 |
| MgO | wt% | 0.049 | 0.003 | 0.000 | 0.000 | 0.006 | 0.003 |
| Al2O3 | wt% | 0.033 | 0.078 | 0.127 | 0.115 | 0.230 | 0.122 |
| SiO2 | wt% | 99.510 | 99.748 | 99.707 | 99.490 | 99.467 | 99.723 |
| P2O5 | wt% | 0.004 | 0.006 | 0.005 | 0.004 | 0.004 | 0.006 |
| K2O | wt% | 0.007 | 0.001 | 0.000 | 0.002 | 0.001 | 0.000 |
| CaO | wt% | 0.083 | 0.003 | 0.006 | 0.011 | 0.000 | 0.003 |
| TiO2 | wt% | 0.001 | 0.000 | 0.001 | 0.000 | 0.000 | 0.000 |
| MnO | wt% | 0.001 | 0.003 | 0.000 | 0.000 | 0.007 | 0.001 |
| FeO | wt% | 0.000 | 0.008 | 0.001 | 0.000 | 0.024 | 0.002 |
| Total | wt% | 99.750 | 99.850 | 99.846 | 99.629 | 99.739 | 99.859 |
| Li | ppm | 11.214 | 73.334 | 125.007 | 138.775 | 235.210 | 114.830 |
| Be | ppm | 0.000 | 0.000 | 0.712 | 0.349 | 0.000 | 0.000 |
| B | ppm | 3.098 | 3.852 | 3.001 | 1.635 | 2.597 | 2.490 |
| S | ppm | 516.220 | 439.509 | 501.207 | 510.244 | 700.310 | 318.969 |
| Cl | ppm | 716.168 | 385.817 | 189.653 | 253.920 | 477.981 | 451.262 |
| Sc | ppm | 0.991 | 1.075 | 1.245 | 0.761 | 1.113 | 1.501 |
| V | ppm | 0.069 | 0.009 | 0.000 | 0.086 | 0.010 | 0.000 |
| Cr | ppm | 439.624 | 3.216 | 1.428 | 1286.984 | 0.000 | 0.901 |
| Co | ppm | 0.099 | 0.017 | 0.004 | 0.073 | 0.129 | 0.000 |
| Ni | ppm | 4.283 | 6.575 | 2.554 | 0.000 | 2.909 | 3.312 |
| Cu | ppm | 29.118 | 0.170 | 0.023 | 85.279 | 0.416 | 0.000 |
| Zn | ppm | 12.260 | 0.179 | 1.065 | 34.728 | 1.339 | 0.101 |
| Ga | ppm | 0.068 | 0.049 | 0.104 | 0.000 | 0.043 | 0.179 |
| Ge | ppm | 0.283 | 0.438 | 0.940 | 2.419 | 0.921 | 0.569 |
| As | ppm | 0.437 | 2.098 | 4.935 | 5.237 | 11.719 | 4.838 |
| Se | ppm | 0.566 | 0.000 | 0.027 | 0.000 | 1.329 | 0.000 |
| Rb | ppm | 0.185 | 0.000 | 0.000 | 0.074 | 0.131 | 0.000 |
| Sr | ppm | 0.511 | 0.058 | 0.151 | 0.038 | 0.134 | 0.113 |
| Y | ppm | 0.000 | 0.000 | 0.000 | 0.043 | 0.050 | 0.000 |
| Zr | ppm | 0.791 | 0.000 | 0.009 | 0.000 | 0.000 | 0.000 |
| Nb | ppm | 0.019 | 0.000 | 0.000 | 0.000 | 0.013 | 0.024 |
| Mo | ppm | 0.000 | 0.000 | 0.012 | 0.000 | 0.000 | 0.026 |
| Rh | ppm | 0.009 | 0.007 | 0.000 | 0.009 | 0.007 | 0.003 |
| Pd | ppm | 0.000 | 0.000 | 0.000 | 0.064 | 0.081 | 0.000 |
| Ag | ppm | 0.040 | 0.042 | 0.085 | 0.006 | 0.055 | 0.066 |
| Cd | ppm | 0.407 | 0.227 | 0.061 | 0.050 | 0.000 | 0.000 |
| In | ppm | 0.000 | 0.000 | 0.009 | 0.000 | 0.018 | 0.000 |
| Sn | ppm | 0.659 | 0.723 | 0.000 | 0.783 | 0.880 | 0.405 |
| Sb | ppm | 1.671 | 32.542 | 35.814 | 58.389 | 129.545 | 37.531 |
| Cs | ppm | 0.010 | 0.034 | 0.021 | 0.342 | 0.014 | 0.072 |
| Ba | ppm | 2.345 | 0.000 | 0.220 | 0.062 | 0.000 | 0.000 |
| La | ppm | 0.141 | 0.267 | 0.000 | 0.034 | 0.006 | 0.543 |
| Eu | ppm | 0.017 | 0.012 | 0.026 | 0.000 | 0.007 | 0.036 |
| Gd | ppm | 0.267 | 0.295 | 0.101 | 0.479 | 0.091 | 0.101 |
| Tb | ppm | 0.000 | 0.000 | 0.000 | 0.000 | 0.006 | 0.000 |
| Dy | ppm | 0.000 | 0.000 | 0.000 | 0.050 | 0.013 | 0.058 |
| Ho | ppm | 0.009 | 0.000 | 0.007 | 0.000 | 0.000 | 0.022 |
| Er | ppm | 0.068 | 0.038 | 0.060 | 0.010 | 0.000 | 0.000 |
| Tm | ppm | 0.012 | 0.009 | 0.016 | 0.003 | 0.000 | 0.000 |
| Yb | ppm | 0.000 | 0.011 | 0.000 | 0.000 | 0.012 | 0.000 |
| Lu | ppm | 0.000 | 0.000 | 0.004 | 0.000 | 0.000 | 0.000 |
| Hf | ppm | 0.000 | 1.362 | 0.033 | 0.011 | 0.000 | 0.000 |
| Ta | ppm | 0.000 | 0.000 | 0.000 | 0.002 | 0.010 | 0.000 |
| W | ppm | 0.000 | 0.000 | 0.000 | 0.000 | 0.011 | 0.000 |
| Re | ppm | 0.004 | 0.000 | 0.000 | 0.004 | 0.009 | 0.000 |
| Pt | ppm | 0.036 | 0.000 | 0.019 | 0.000 | 0.000 | 0.022 |
| Au | ppm | 0.000 | 0.000 | 0.028 | 0.000 | 0.029 | 0.012 |
| Tl | ppm | 0.003 | 0.000 | 0.007 | 0.003 | 0.000 | 0.008 |
| Pb | ppm | 1.362 | 0.071 | 0.086 | 4.100 | 0.000 | 0.000 |
| Bi | ppm | 0.000 | 0.016 | 0.000 | 0.000 | 0.029 | 0.017 |
Table 4.
Titanium concentration at each point, measured by EPMA, and temperature calculated using a Ti geothermometer.
Table 4.
Titanium concentration at each point, measured by EPMA, and temperature calculated using a Ti geothermometer.
| Sample | No. | Ti/ppm | Ti (p.f.u. O = 2) | Temperature/°C |
|---|
| Wark and Watson (2006) [60] | Kawasaki and Osanai (2008) [61] |
|---|
| q3 | 5 | 20 | 0.00005 | 585 | 448 |
| 7 | 190 | 0.00043 | 831 | 706 |
| 10 | 130 | 0.00030 | 780 | 651 |
| 14 | 80 | 0.00018 | 721 | 582 |
| q4 | 2 | 70 | 0.00016 | 706 | 568 |
| 5 | 210 | 0.00047 | 845 | 720 |
| 8 | 620 | 0.00140 | 1026 | 944 |
| 10 | 60 | 0.00014 | 689 | 552 |
| 11 | 80 | 0.00018 | 721 | 582 |
| 13 | 400 | 0.00091 | 946 | 845 |
| 15 | 200 | 0.00045 | 838 | 713 |
| q6 | 1 | 260 | 0.00059 | 877 | 760 |
| 3 | 60 | 0.00014 | 689 | 552 |
| 7 | 120 | 0.00027 | 770 | 636 |
| 8 | 100 | 0.00023 | 747 | 614 |
| 9 | 160 | 0.00036 | 807 | 678 |
| 10 | 40 | 0.00009 | 648 | 504 |
| 15 | 30 | 0.00007 | 621 | 479 |
Table 5.
Titanium concentration at each point, measured by LA-ICP-MS, and temperature, calculated using a Ti geothermometer.
Table 5.
Titanium concentration at each point, measured by LA-ICP-MS, and temperature, calculated using a Ti geothermometer.
| No. | Ti/ppm | Ti (p.f.u. O = 2) | Temperature/°C |
|---|
| Wark and Watson (2006) [60] | Kawasaki and Osanai (2008) [61] |
|---|
| 1 | 10 | 0.000025 | 529 | 392 |
| 3 | 7 | 0.000017 | 502 | 364 |
| 4 | 1 | 0.000003 | 398 | 263 |
| 5 | 3 | 0.000008 | 451 | 316 |
| 6 | 2 | 0.000005 | 423 | 290 |
| average | - | - | 461 | 325 |
| Disclaimer/Publisher’s Note: The statements, opinions and data contained in all publications are solely those of the individual author(s) and contributor(s) and not of MDPI and/or the editor(s). MDPI and/or the editor(s) disclaim responsibility for any injury to people or property resulting from any ideas, methods, instructions or products referred to in the content. |
© 2023 by the authors. Licensee MDPI, Basel, Switzerland. This article is an open access article distributed under the terms and conditions of the Creative Commons Attribution (CC BY) license (https://creativecommons.org/licenses/by/4.0/).


