Article

Bioaccumulation and Human Health Risk Assessment of Arsenic and Chromium Species in Water–Soil–Vegetables System in Lephalale, Limpopo Province, South Africa

by
Bennett Siphiwe Dintsi
1,
Mokgehle Refiloe Letsoalo
1,2 and
Abayneh Ataro Ambushe
1,*
1
Department of Chemical Sciences, University of Johannesburg, Auckland Park, Johannesburg 2006, South Africa
2
Analytical Chemistry Division, Mintek, 200 Malibongwe Drive, Randburg 2194, South Africa
*
Author to whom correspondence should be addressed.
Minerals 2023, 13(7), 930; https://doi.org/10.3390/min13070930
Submission received: 9 June 2023 / Revised: 5 July 2023 / Accepted: 8 July 2023 / Published: 11 July 2023

Abstract

:
The accumulation of potentially toxic elements (PTEs) in water, soil and vegetables can pose a severe threat to the respective organisms and lead to human health risks upon exposure. Water, soil and vegetable samples were collected from the Mokolo River and its vicinity. Total concentration quantification and speciation analysis of chromium (Cr) and arsenic (As) were performed using inductively coupled plasma-mass spectrometry (ICP-MS) and high-performance liquid chromatography hyphenated to inductively coupled plasma-mass spectrometry (HPLC-ICP-MS), respectively. The total concentrations of Cr and As were below the maximum permissible levels (MPLs) set by the World Health Organization (WHO) and South Africa’s Department of Water Affairs and Forestry (DWAF) for drinking water. The soil quality guideline value of 64.0 µg/g for Cr was surpassed in most sites and posed a great risk to the vegetables growing in it, whereas the guideline value of 12.0 µg/g for As was surpassed in one sampling site. The observed high concentrations in soil could be linked to the use of fertilizers and atmospheric deposits introduced through coal burning by power stations. In vegetables, the total Cr concentration surpassed the recommended MPL of 0.5 µg/g, rendering the vegetables unsafe for human consumption. Concentrations ranging from 197 to 1180 ng/g and 374 to 17400 ng/g were detected for Cr(VI) and Cr(III), respectively. The consumption of vegetables containing high levels of Cr and As would result in health risks in adults and children as the total hazard quotient (THQ) exceeded 1. The consumption of some vegetables particularly by children could cause serious health risks as the THQ > 10 was observed for some Cr-contaminated vegetables. The incremental lifetime cancer risk (ILCR) threshold of 1 × 10⁻⁴ was exceeded, indicating that the overall consumption of vegetables had high cancer risks for adults and children. This study suggests that the consumption of vegetable samples would lead to health risks in the population.

1. Introduction

Potentially toxic elements (PTEs) occur naturally in the environment, and their levels are increasing globally due to various human activities, which include the development of mineral resources, the processing of valuable minerals, pesticide and fertilizer application, paint, pigment, pulp and paper production, metallurgy, tanning, chrome-plating and the preservation of wood [1,2,3]. Natural origins such as the weathering of bedrock, rock leaching and atmospheric fallouts are gradually accelerating the high presence of PTEs in the aquatic and terrestrial environment. The accumulation of PTEs leads to the degradation of water and soil quality when their concentrations are above the threshold. Rapid bioaccumulation of high levels of PTEs and long-term exposure through the food chain pose a human health risk and negative environmental impacts [4]. The primary exposure of PTEs to humans, in particular to those residing in the proximity of the emission sources, is generally through ingestion, dermal contact and inhalation, which may lead to an acute or moderate toxicity effect [5].
Arsenic (As) and chromium (Cr) species are the selected PTEs of interest for investigation since their prevalence in the environment has been considered a global concern by the scientific community. The toxicity effects of distinct chemical species of As and Cr are dependent on the predominant species, thus leading to the urgent need for transportation and environmental fate assessment to determine health risks. The higher toxicity of hexavalent Cr (Cr(IV)) relative to its counterpart species is favored by extreme solubility, bioaccumulation and mobility in the aquatic environment and biological systems [2,6,7]. Hexavalent Cr is mutagenic and carcinogenic, approximately 500 to 1000 times higher than trivalent Cr (Cr(III)), an essential micronutrient required for the support of growth and metabolism in some organisms. However, prolonged exposure to high Cr(III) levels can affect human skin and lungs [8,9,10]. Species of As occurring in organic forms (monomethylarsonic acid (MMA) and dimethylarsinic acid (DMA)) are generally less toxic when compared to the inorganic forms (arsenite (As(III)) and arsenate (As(V)). Baig et al. (2010) [11] and Jang, Somanna and Kim (2016) [12] outlined that inorganic species of As are categorized as class A human carcinogens and As(V) is ten times less toxic than As(III). Health risks associated with As species intoxication may include acute effects such as failure of the gastrointestinal, upper respiratory, cardiovascular and pulmonary systems. Chronic effects such as the formation of hyperpigmentation, lesions of the skin and cancer of internal organs and the skin can also result from As exposure [13].
With the above-raised concerns and the great variation in the toxicity of As and Cr species, speciation analysis is vital for toxicological assessments to determine the environmental impacts and health risks [11,14]. The prevalence of inorganic As and Cr(V) in the environment is a debilitating issue, particularly for communities relying on contaminated river water for their daily needs, including the irrigation of crops, especially in dry seasons.
The human health risk assessment (HHRA) [15] is a tool for estimating the nature and severity of health effects in populations that may be exposed to chemically contaminated environmental media [16]. It can be used to evaluate and estimate exposure to chemicals present in food, water, consumer products, soil, air and other materials emanating from the past, present and future. The outcomes of the HHRA can be used to limit chemical emissions from various human activities such as agricultural and industrial exposure and food and consumer products [17]. To the best of our knowledge, there is little work on understanding the transport and fate of PTEs in the soil–water–plant environment in Mokolo River, South Africa. This instigated a need to evaluate the source and understand the transport and fate mechanisms of As and Cr. This, in turn, allowed the determination of the environmental exposure of these PTEs, which are of concern [18,19].
This study aimed to determine different species of Cr and As present in water, soil and vegetables from Mokolo River and its vicinity using high-performance liquid chromatography (HPLC) hyphenated to inductively coupled plasma-mass spectrometry (ICP-MS). This study also focused on the determination of the total concentrations of As and Cr present in water, soil and vegetable samples, evaluation of the effect of seasonal variation on the concentration of PTEs in all samples and assessment of the associated health risks to humans via the consumption of vegetables in adults and children.

2. Experiment

2.1. Study Area and Sample Collection

Lephalale is home to various industrial activities including Grootegeluk coal mine and Matimba and Medupi power stations which are in operation for production of electricity [20]. Coal mining and its combustion used for the production of electricity generate PTEs such as U, Pb, Mn, Cr, As and Cu, which may accumulate to toxic levels in the environment [21]. Mokolo River is a perennial river with in-house dam, which serves as a source of water for Lephalale community for domestic use. Furthermore, it is used for recreation, sand mining, fishing, irrigation of crops and drinking water for farm animals. In this study, twenty-four water samples, twenty-two vegetable samples (chomolia (C), mochina (M), onion (O), spinach (S), pumpkin (P) and thepe (T)), and ten loam soil samples were collected from Mokolo River and farms in the vicinity of the river during different seasonal flows of the river. Sample locations of soil and vegetables were formatted as F1S1, where F represents farm, the number adjacent to it refers to the farm number, and S represents the site on the farm. Water and sediment samples were collected from ten sampling sites within the river, whereas soil and vegetables were collected from two farms adjacent to Mokolo River as shown in Figure 1. All collected samples were transported to the laboratory stored in an icebox.

2.2. Sample Pre-Treatment

Water samples were filtered using filtration system fitted with 0.45 µm disk filter paper and kept in a refrigerator set at 4 °C. A portion of filtered samples was acidified with 1% HNO3 for total concentration determination, whereas unacidified water samples were kept for speciation analysis. Soil and vegetable samples were dried and ground with an agate mortar and pestle to fine powder. Speciation analysis and total quantification methods were performed using HPLC hyphenated to ICP-MS and ICP-MS to monitor analytes at 53Cr and 75As isotopes. The analysis of water samples, digested soil and vegetables and SRMs were performed in triplicates.

2.3. Instrumentation

Prior to each analysis, instruments were optimized to obtain optimum operating conditions. A quadrupole Sciex Elan 6100 ICP-MS (PerkinElmer, Rodgau, Germany) was employed to determine the total concentration and speciation analysis by coupling to HPLC. Solid samples were dried using a BK-FD10S freeze dryer (Biobase Biodustry, Jinan, China). Digestion and extraction of solid samples were carried out using embedded 16HF 100 rotor Microwave system (Anton Paar, Midrand, South Africa). Chemical species separation was achieved using Flexar Solvent Manager HPLC (PerkinElmer, Shelton, Singapore).

2.4. Chemicals, Standards and Certified Reference Materials

Chemicals of high purity, which include 65% suprapur HNO3 (Merck, Darmstadt, Germany), 40% HF (Merck, Modderfontein, South Africa) and H3BO3 (Sigma-Aldrich, Taufkirchen, Germany), were utilized for digestion of samples. Stock solutions of 1000 mg/L As (Inorganic ventures, Christiansburg, VA, USA), 1000 mg/L Cr (PerkinElmer, Shelton, WA, USA), 1000 mg/L As(III) (Inorganic ventures, Christiansburg, VA, USA), 1000 mg/L As(V) (Inorganic ventures, Christiansburg, VA, USA), 1000 mg/L Cr(VI) (Inorganic ventures, Christiansburg, VA, USA), 1000 mg/L Cr (III) (Inorganic ventures, Christiansburg, VA, USA), 500 mg analytical-grade MMA (Supelco, Bellefonte, PA, USA) and 500 mg analytical-grade DMA (Supelco, Bellefonte, PA, USA) were utilized to prepare standard solutions. An ACS reagent > 98% NH4NO3 (Thembane chemicals, Johannesburg, South Africa), 28%–30% NH3 basis NH4OH (Sigma Aldrich, Taufkirchen, Germany), 99% dibasic (NH4)2HPO4 (Merck, Darmstadt, Germany) and analytical grade > 99% EDTA (Merck, Modderfontein, South Africa) were used for preparation of mobile phase and extraction of As and Cr species. Standard reference materials (SRMs) of trace elements in natural water (SRM 1640a) (NIST, Gaithersburg, MD, USA), San Joaquin soil (SRM 2709a) (NIST, Gaithersburg, MD, USA) and tomato leaves (SRM 1573a) (NIST, Gaithersburg, MD, USA) were used to evaluate methods utilized for the determination of trace elements in water, soil and vegetables, respectively. The test and correction of interferences by polyatomic ions were carried out using NaCl solution (Promark chemicals, Benoni, South Africa).

2.5. Preparation of Samples

Acid digestion procedure for soil samples was conducted using a method adopted from Mekonnen et al. [22] with slight modifications. Briefly, homogenized samples were digested using the microwave digestion system in two stages of digestion. In the first stage of digestion, 4 mL of 65% HNO3 and 500 µL of HF were added to a vessel containing a 100 mg sample and heated at power of 700 W for 20 min. After cooling, a second stage of digestion was carried out by adding 1 mL of H3BO3 to each vessel and further heating for 10 min to achieve complete dissolution of the samples. Standard reference material 2709a was prepared following the same procedure as the samples. A total of 200 mg of homogenized vegetable samples and SRM 1573a were transferred to Teflon vessels and digested using 6 mL of 65% HNO3 to achieve a complete dissolution in one-stage digestion. Digested samples were transferred into a 50 mL volumetric flask and diluted with ultra-pure water prior to analysis. Blank samples were prepared following each preparation method.
Extraction method adopted from Letsoalo et al. (2021) was used for extraction of elemental species in vegetable and soil samples for speciation analysis. Briefly, a buffer prepared using 0.375 M (NH4)2HPO4 and 50 mM EDTA was used for extraction of As and Cr species in soil and vegetables collected during high- and low-flow seasons from Mokolo River. A total of 500 mg of sample was transferred into Teflon vessels, and 15 mL extraction solution was added to each vessel. The extracts were filtered with a syringe fitted with a 0.22 µm syringe filter without further dilutions. Filtered water samples were injected into HPLC column without any further pre-treatment. A gradient mode of elution using 10 mM NH4NO3 and 70 mM NH4H2PO4 at pH 8.7 mobile phase solutions was adopted for simultaneous separation of As(III), DMA, MMA, As(V) and Cr(VI) [23]. Prior to speciation analysis, a test solution of 50 mg/L Cl was prepared and injected for monitoring of polyatomic ions interferences. The HPLC-ICP-MS operating conditions are presented in Table 1.

2.6. Analytical Figures of Merit

Limit of detection and limit of quantification for total quantification and speciation procedures were determined as 3 times and 10 times standard deviation (3σ) using reagent blank measurement [20]. The external calibration method was used to determine the linearity of As, As(III), As(V), MMA, DMA and Cr(VI) standards. The coefficient of determination (R2) was used to assess the linearity, and linear equations determined from calibration curves were used for quantification of the species of interest in the samples. Accuracy of total quantification methods for water, soil and vegetables was evaluated using SRMs; SRM 1640a, SRM 2709a and SRM 1573a, respectively. In speciation analysis, accuracy of the method was evaluated by spiking soil and vegetable samples at 3× LOQ and 20× LOQ with As(III), As(V), MMA, DMA and Cr(VI) before extraction and extracts analyzed using HPLC-ICP-MS. The percent relative standard deviation (%RSD) was employed to assess repeatability and precision of the methods.

2.7. Statistical Analysis

The analysis of variance (ANOVA) incorporated into Microsoft Excel as an add-in was used to evaluate variations occurring seasonally. The variations were determined using one-way ANOVA. The variation was considered statistically insignificant if p > 0.05 and significant if p < 0.05 at a 95% confidence level.

2.8. Human Health Risk Assessment

The HHRA was employed to determine the possibility that consuming vegetable samples would result in carcinogenic health effects for adults and children. The estimation of carcinogenic health effects was determined using the ILCR, a product of EDI and CFS expressions presented in Equations (1) and (2). The CFS used for As and Cr were 0.50 and 1.50 (mg/kg/day)−1, respectively [24,25]. The EDI parameters employed were ingestion rate, exposure frequency and duration, oral reference dosage, average body weight and exposure time which are indicated in Table 2.
I L C R = E D I × C F S
E D I = E F × E D × F I R × C A B W × A T

3. Results and Discussion

3.1. Evaluation of Analytical Figures of Merit

3.1.1. Total Quantification Method

The analytical figures of merit assessment of total quantification and speciation analysis methods were in the acceptable range as recommended by the United States Environmental Protection Agency (US EPA) for method assessment and validations. The R2 values in the range of 0.997 to 0.999 affirmed the linearity of calibration curves and accurate detector response for the concentration determination of each analyte [9]. The lowest concentration level at which analytes were reliably detected or quantitatively meaningful with established accuracy and precision were comparable with other studies. The obtained LODs and LOQs of the methods indicate high sensitivity of the analytical techniques and were comparable to other reported studies [10,11,31]. The accuracy was evaluated using SRMs of different matrices with obtained percentage recoveries in the range from 99.9 to 107% for Cr and 96.3 to 116% for As. These percentage recoveries are acceptable for each analyte within 75 to 125% as recommended by the US EPA [32]. The precision of the methods determined as %RSD in the range from 0.849 to 13.3% shows acceptable repeatability [33]. Analytical figures of merit for the total quantification method are presented in Table 3.

3.1.2. Speciation Analysis Method

Retention time identification for each species and the evaluation of analytical figures of merit were conducted as reported in the literature [20,23]. The R2 values greater than 0.999 obtained for calibration curves constructed for different species quantification indicate a high degree of correlation between the concentrations of the species and the peak area [34]. The LODs and LOQs obtained using reagent blanks were comparable to other reported studies, which shows that the method employed is sensitive. The LODs higher than those observed in this study have been reported for Cr(VI) [35,36]. The accuracy of the speciation method was assessed using the spiking-and-recovery procedure due to a lack of SRMs that contain certified concentrations of As and Cr species. The accuracy of the speciation analysis method was confirmed by determining acceptable percentage recoveries which were in the range from 91.9 to 114% and 85.3 to 113% when spiked with 3 and 20× LOQ concentrations, respectively [32]. The %RSD values of 0.00603 to 12.4% for the speciation analysis procedure showed high repeatability and reliability of the method [33]. The analytical figures of merit for the speciation method are presented in Table 4.

3.2. Species Identification and Correction of Polyatomic Interferences

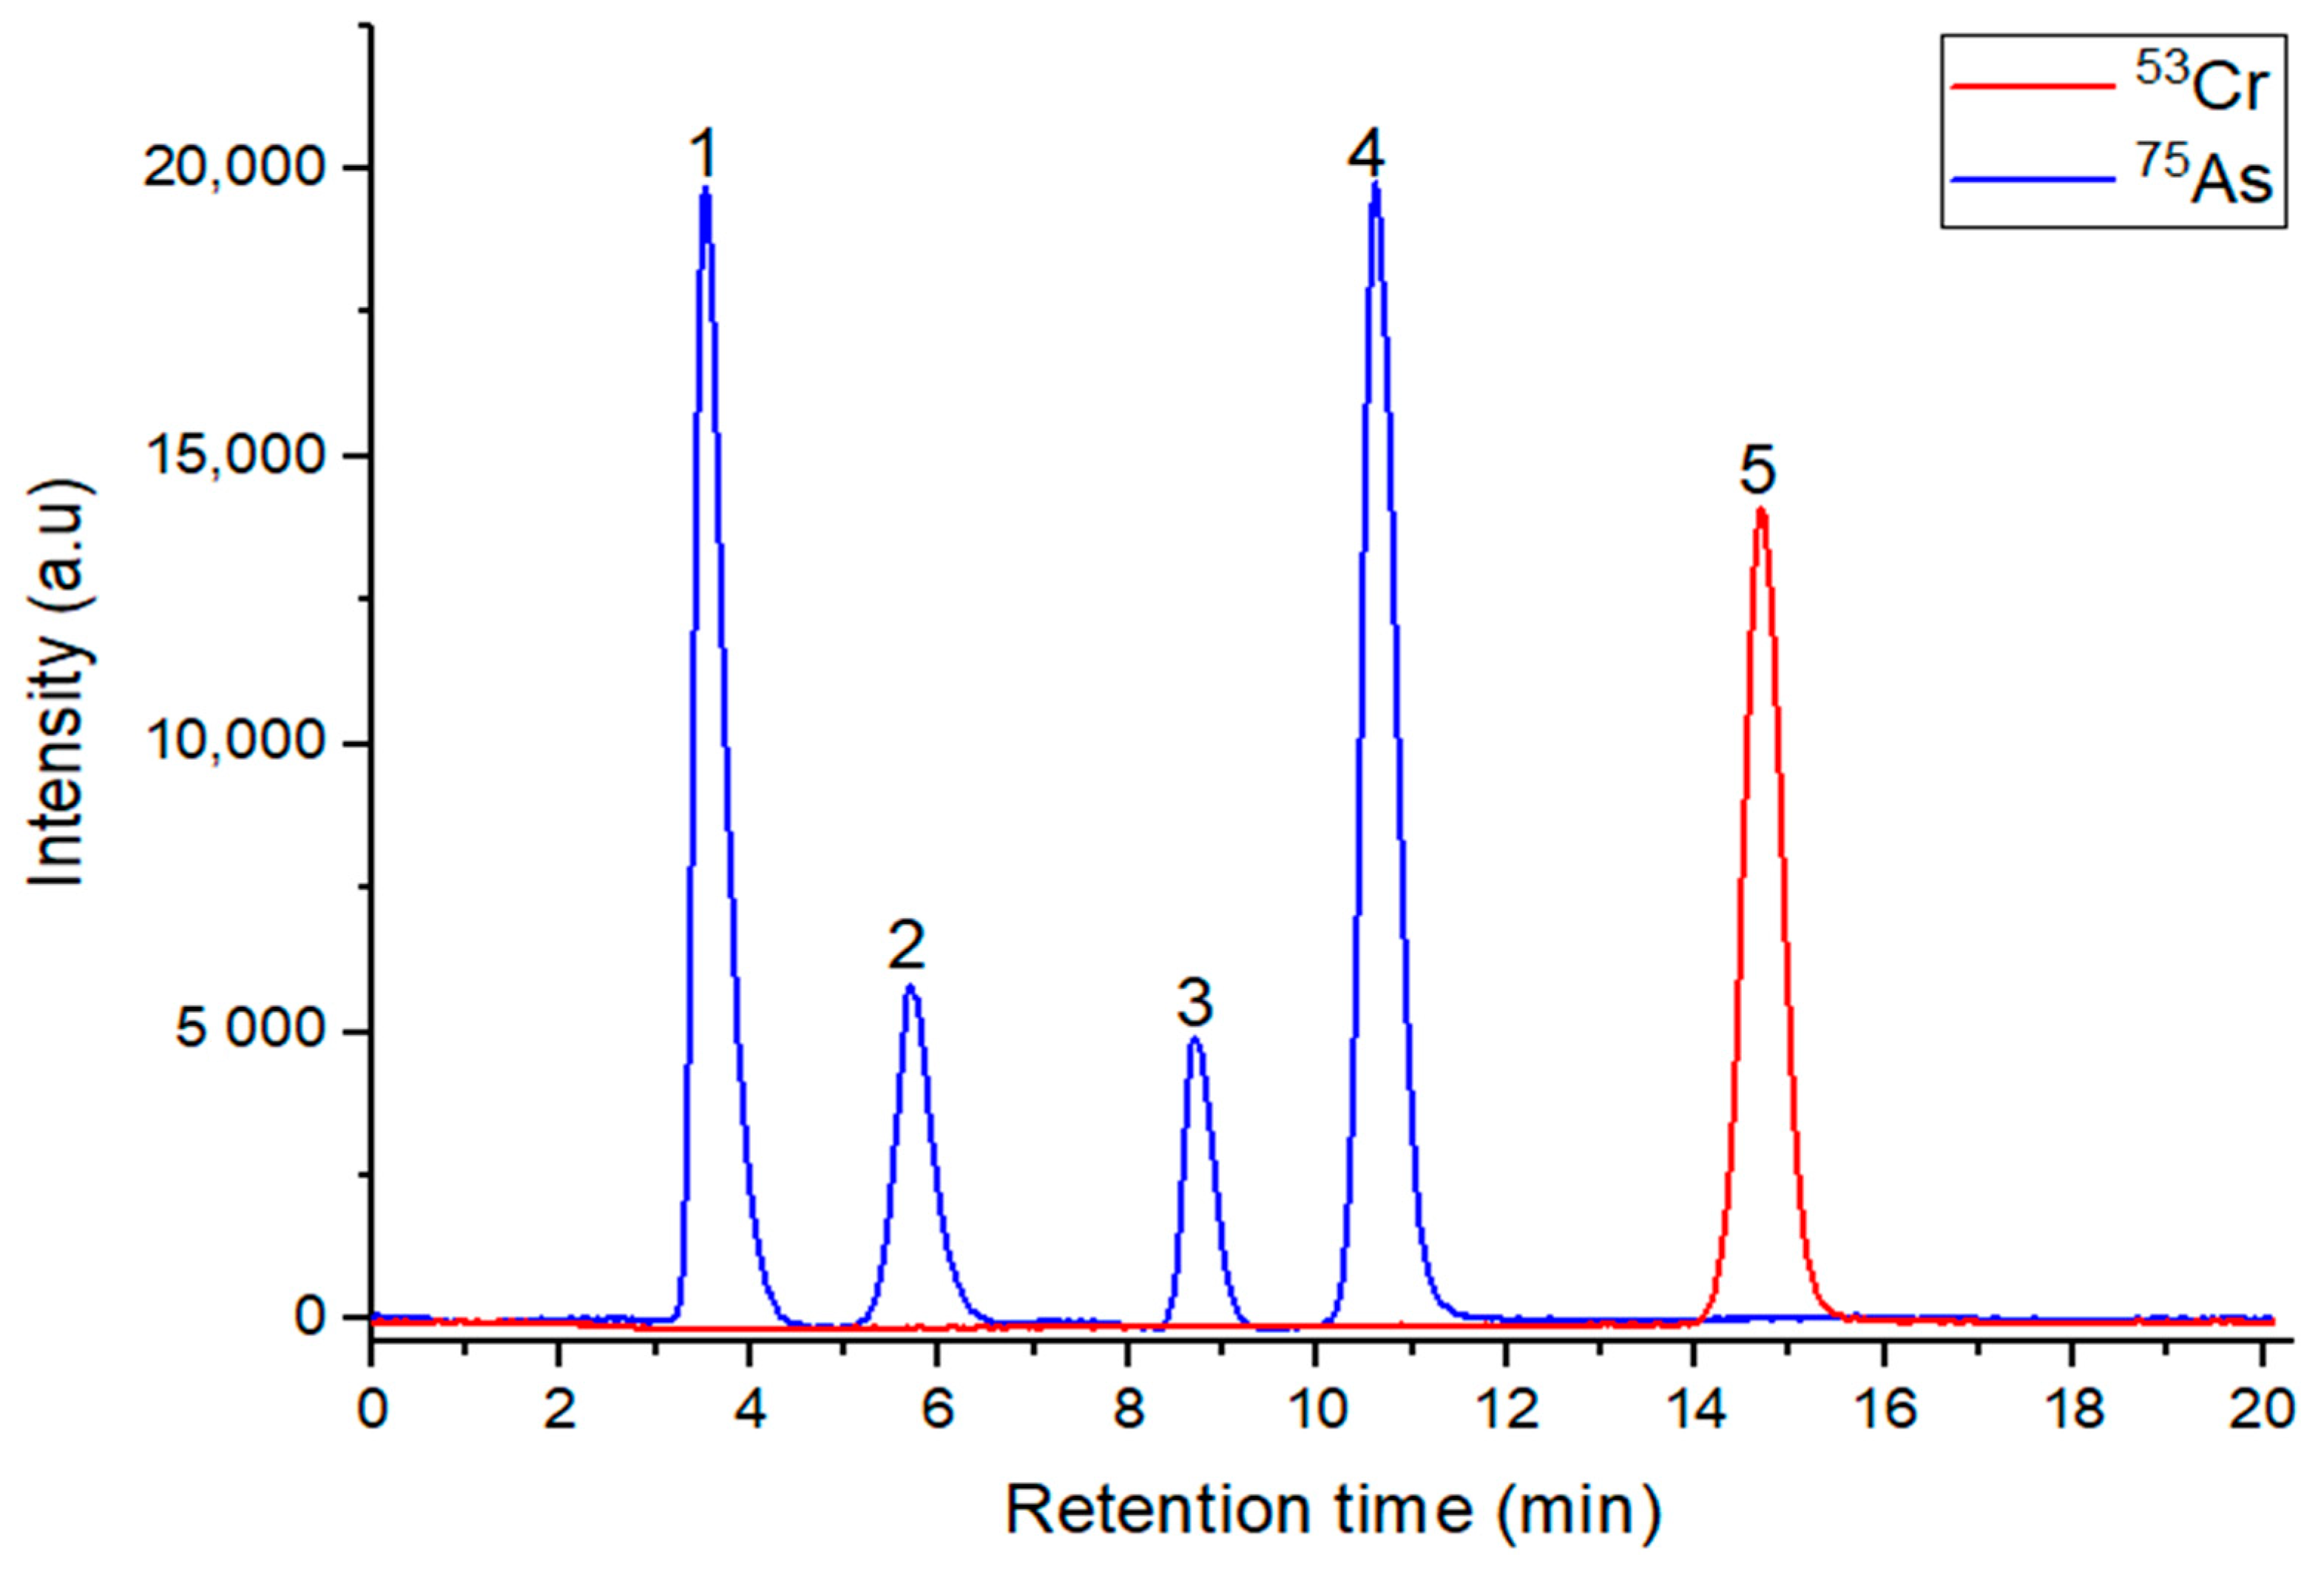
The retention time is a qualitative analysis parameter and is recorded at the apex of a chromatographic peak [37,38]. Single analyte standards were used in order to identify the retention time of each analyte and then a mixture of standards to correlate retention time with the identified species in a single analytical run. The resulting chromatogram of the individual species of As and Cr is presented in Figure 2. The detection of As and Cr species in environmental samples can be interfered with by the presence of high concentrations of Cl, resulting in polyatomic ion interferences of Ar40Cl35 on 75As and O16Cl37 on 53Cr. Polyatomic ion interferences were identified overlapping with MMA, As(V) and Cr(VI). Interference at MMA, As(V) and Cr(VI) peaks affected by Cl content was corrected daily prior to analysis as recommended by Letsoalo et al. [39] and Low et al. [40]. The elimination of these interferences was achieved through an inter-elemental procedure using mathematical correction expressions [23]. In this procedure, a correction factor (CF) for species affected by polyatomic ion interference is determined as the ratio of the signal intensity of the interference peak at analyte mass to its signal intensity at the interference-free m/z and is formulated as follows:
C F = s i g n a l   i n t e n s i t y   o f   i s o b a r i c   i o n s   a t   a n a l y t e   m / z s i g n a l   i n t e n s i t y   o f   i n t e r f e r e n c e   f r e e   i o n   a t   i t s   m / z
Once the correction factor was determined, the correction of the signals of analytes was carried out using the following equation:
C o r r e c t e d   s p e c i e s   a r e a = A ( B × C F )
where A is the measured species area, and B is the area of the interfering ion [23].

3.3. Total Concentrations of As and Cr in Water Samples

3.3.1. Chromium in Water Samples

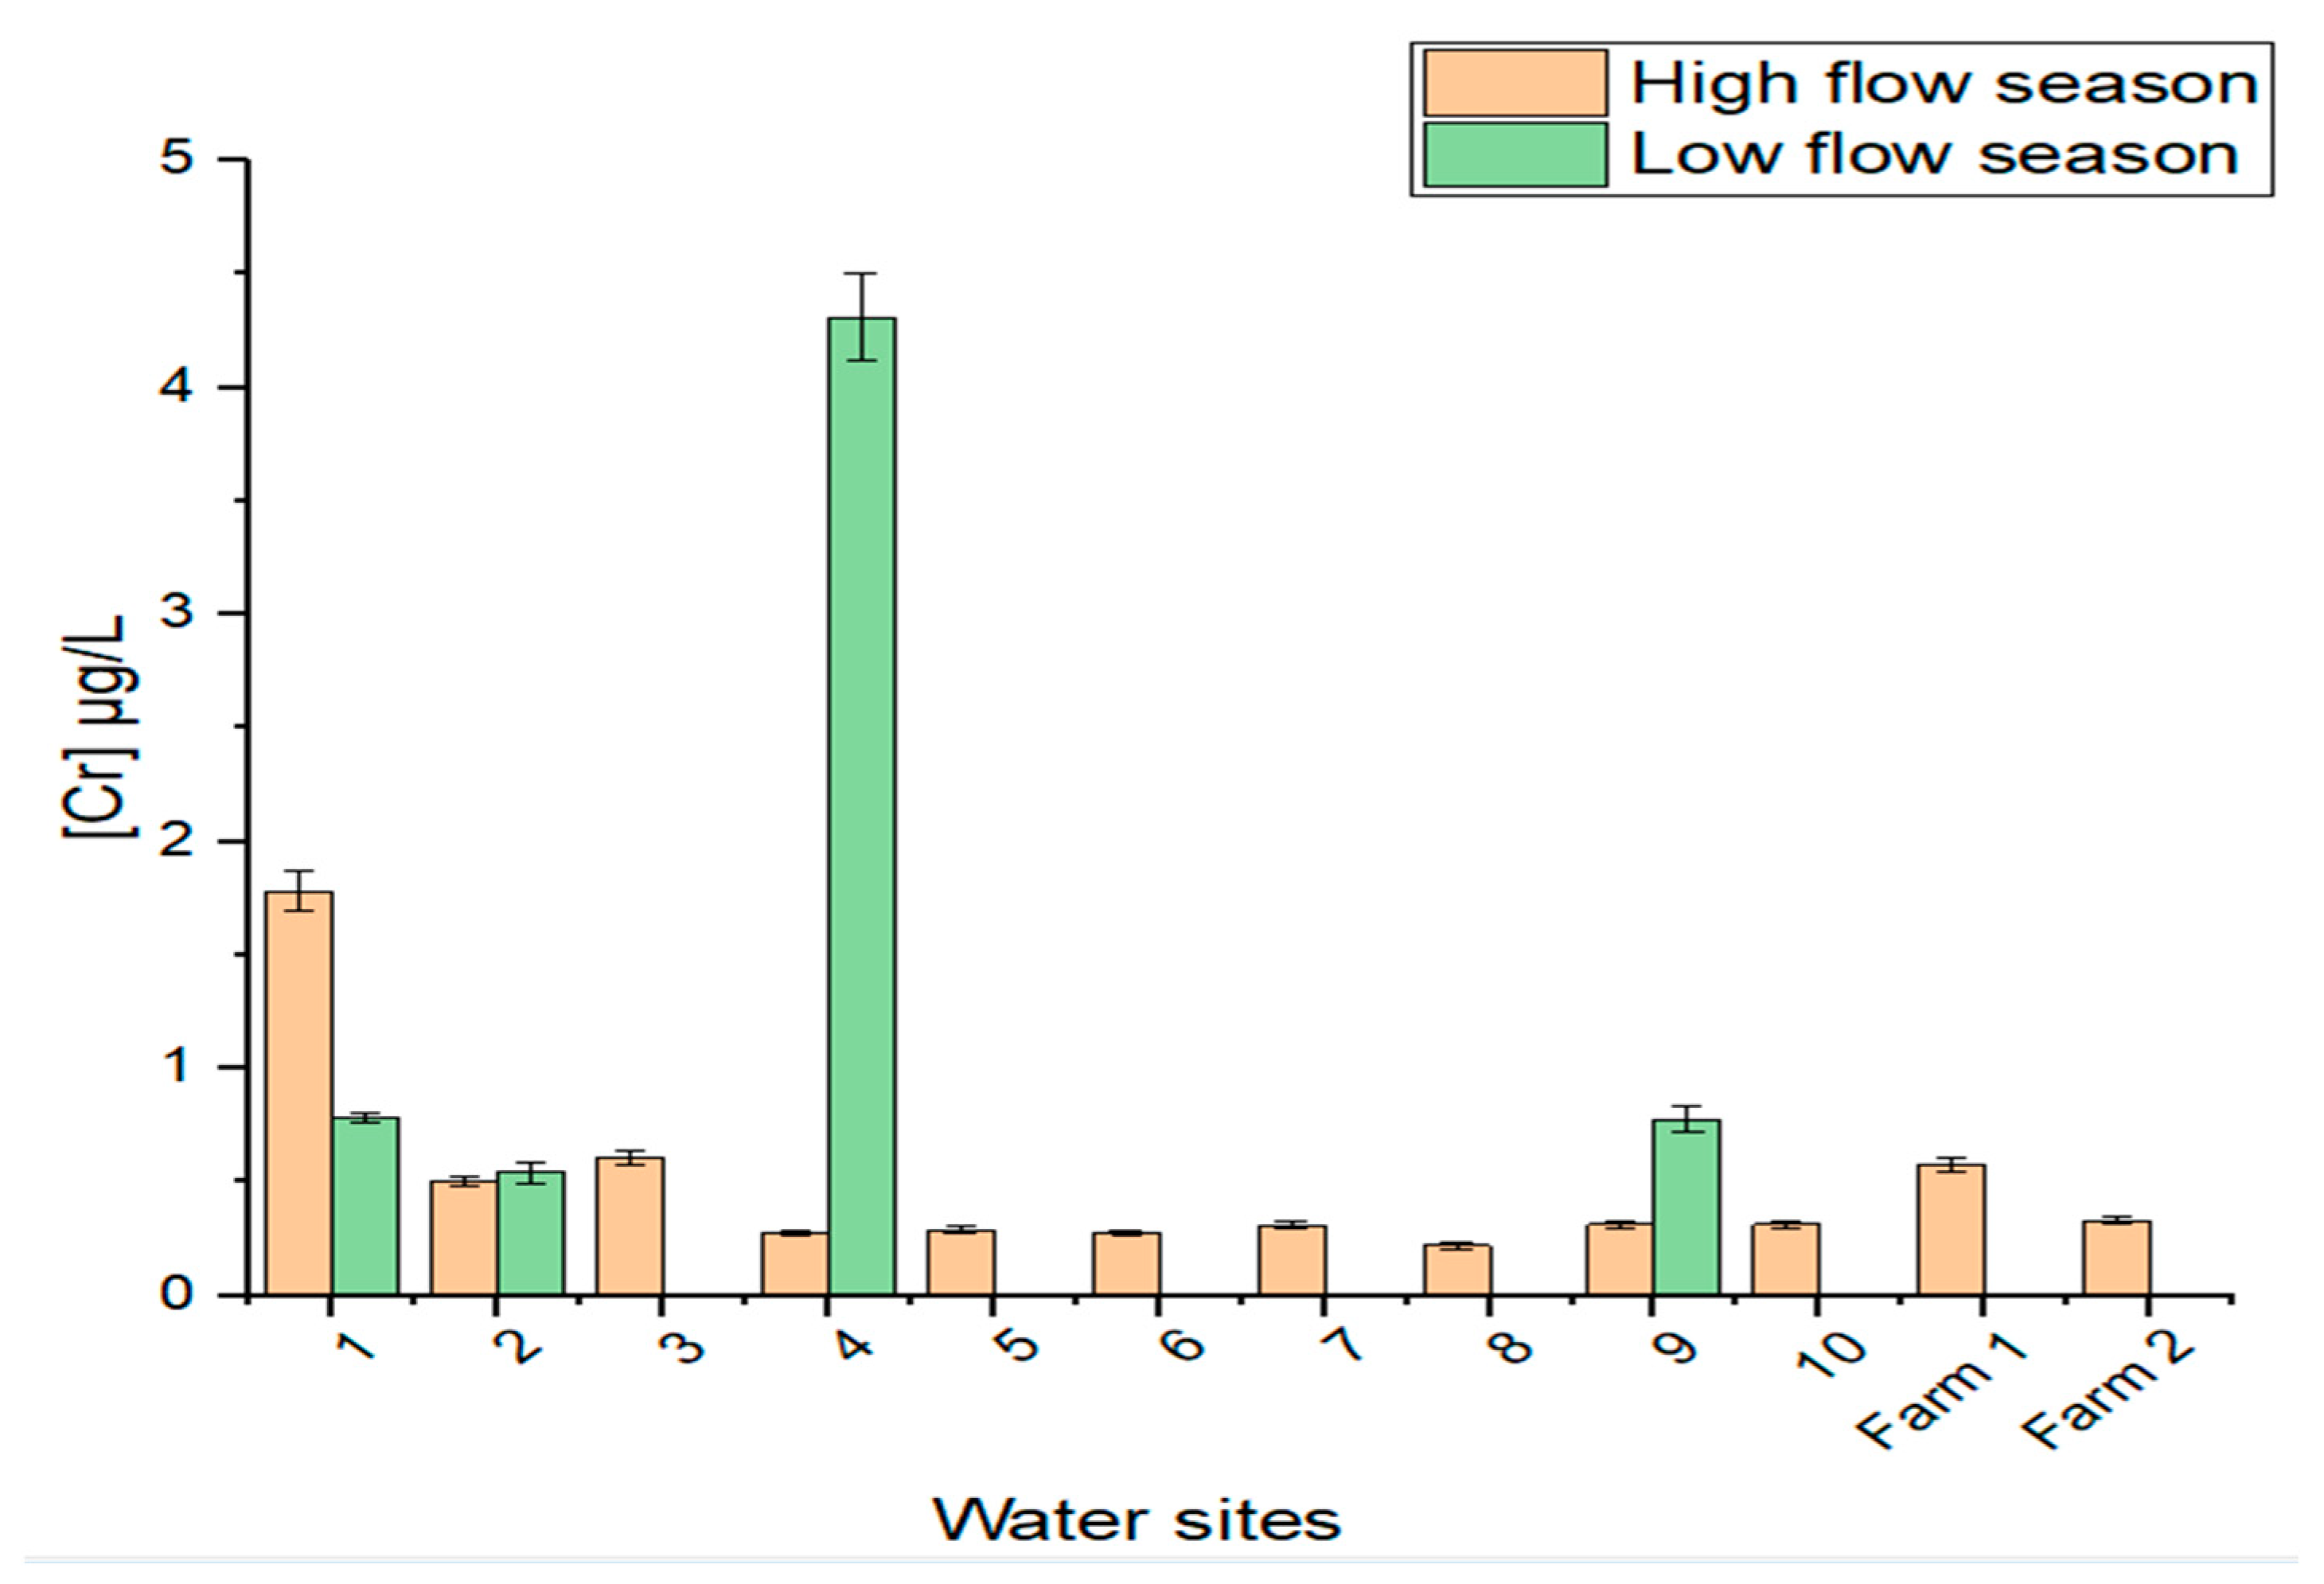
In this study, the analysis of each sample was carried out in triplicates, and the standard deviations are included as the error bars in the figures. The concentration of Cr ranged from 0.220 to 1.78 µg/L in the high-flow season, whereas in the low-flow season, the range was between 0.545 and 4.31 µg/L (as observed in Figure 3), where a majority of the site concentrations were lower than the LOD value of 0.193 µg/L. It is observed that Cr content was higher in the high-flow season than in the low-flow season, except for sites 2, 4 and 7, where Cr content is high during the low-flow season. The overall concentrations observed are lower than the MPL in drinking water set by the WHO, SANS and DWAF, which is 50 µg/L for Cr [41,42,43]. The observed concentrations were less than the MPL (100 µg/L) set for irrigation water [44]. Therefore, the water meets the standard for consumption and use in agricultural activities. The high Cr content in certain sites of the Mokolo River in the high-flow season indicates that the river experienced more contamination which could be from anthropogenic activities, sewerage water and effluents [45]. It is expected that metal content in low-flow seasons will be high (as observed with sites 2, 4 and 7) due to less dilution observed with low water levels and an increased rate of the evaporation of water bodies. However, this was not the case for most sites, as Cr is observed to dominate during the high-flow season. A contributing factor to the high metal content could be storm water run-off from river catchment surroundings contaminated with Cr [46]. Statistically, the seasonal variation was insignificant (p = 0.893) at the 95% confidence level.

3.3.2. Arsenic in Water Samples

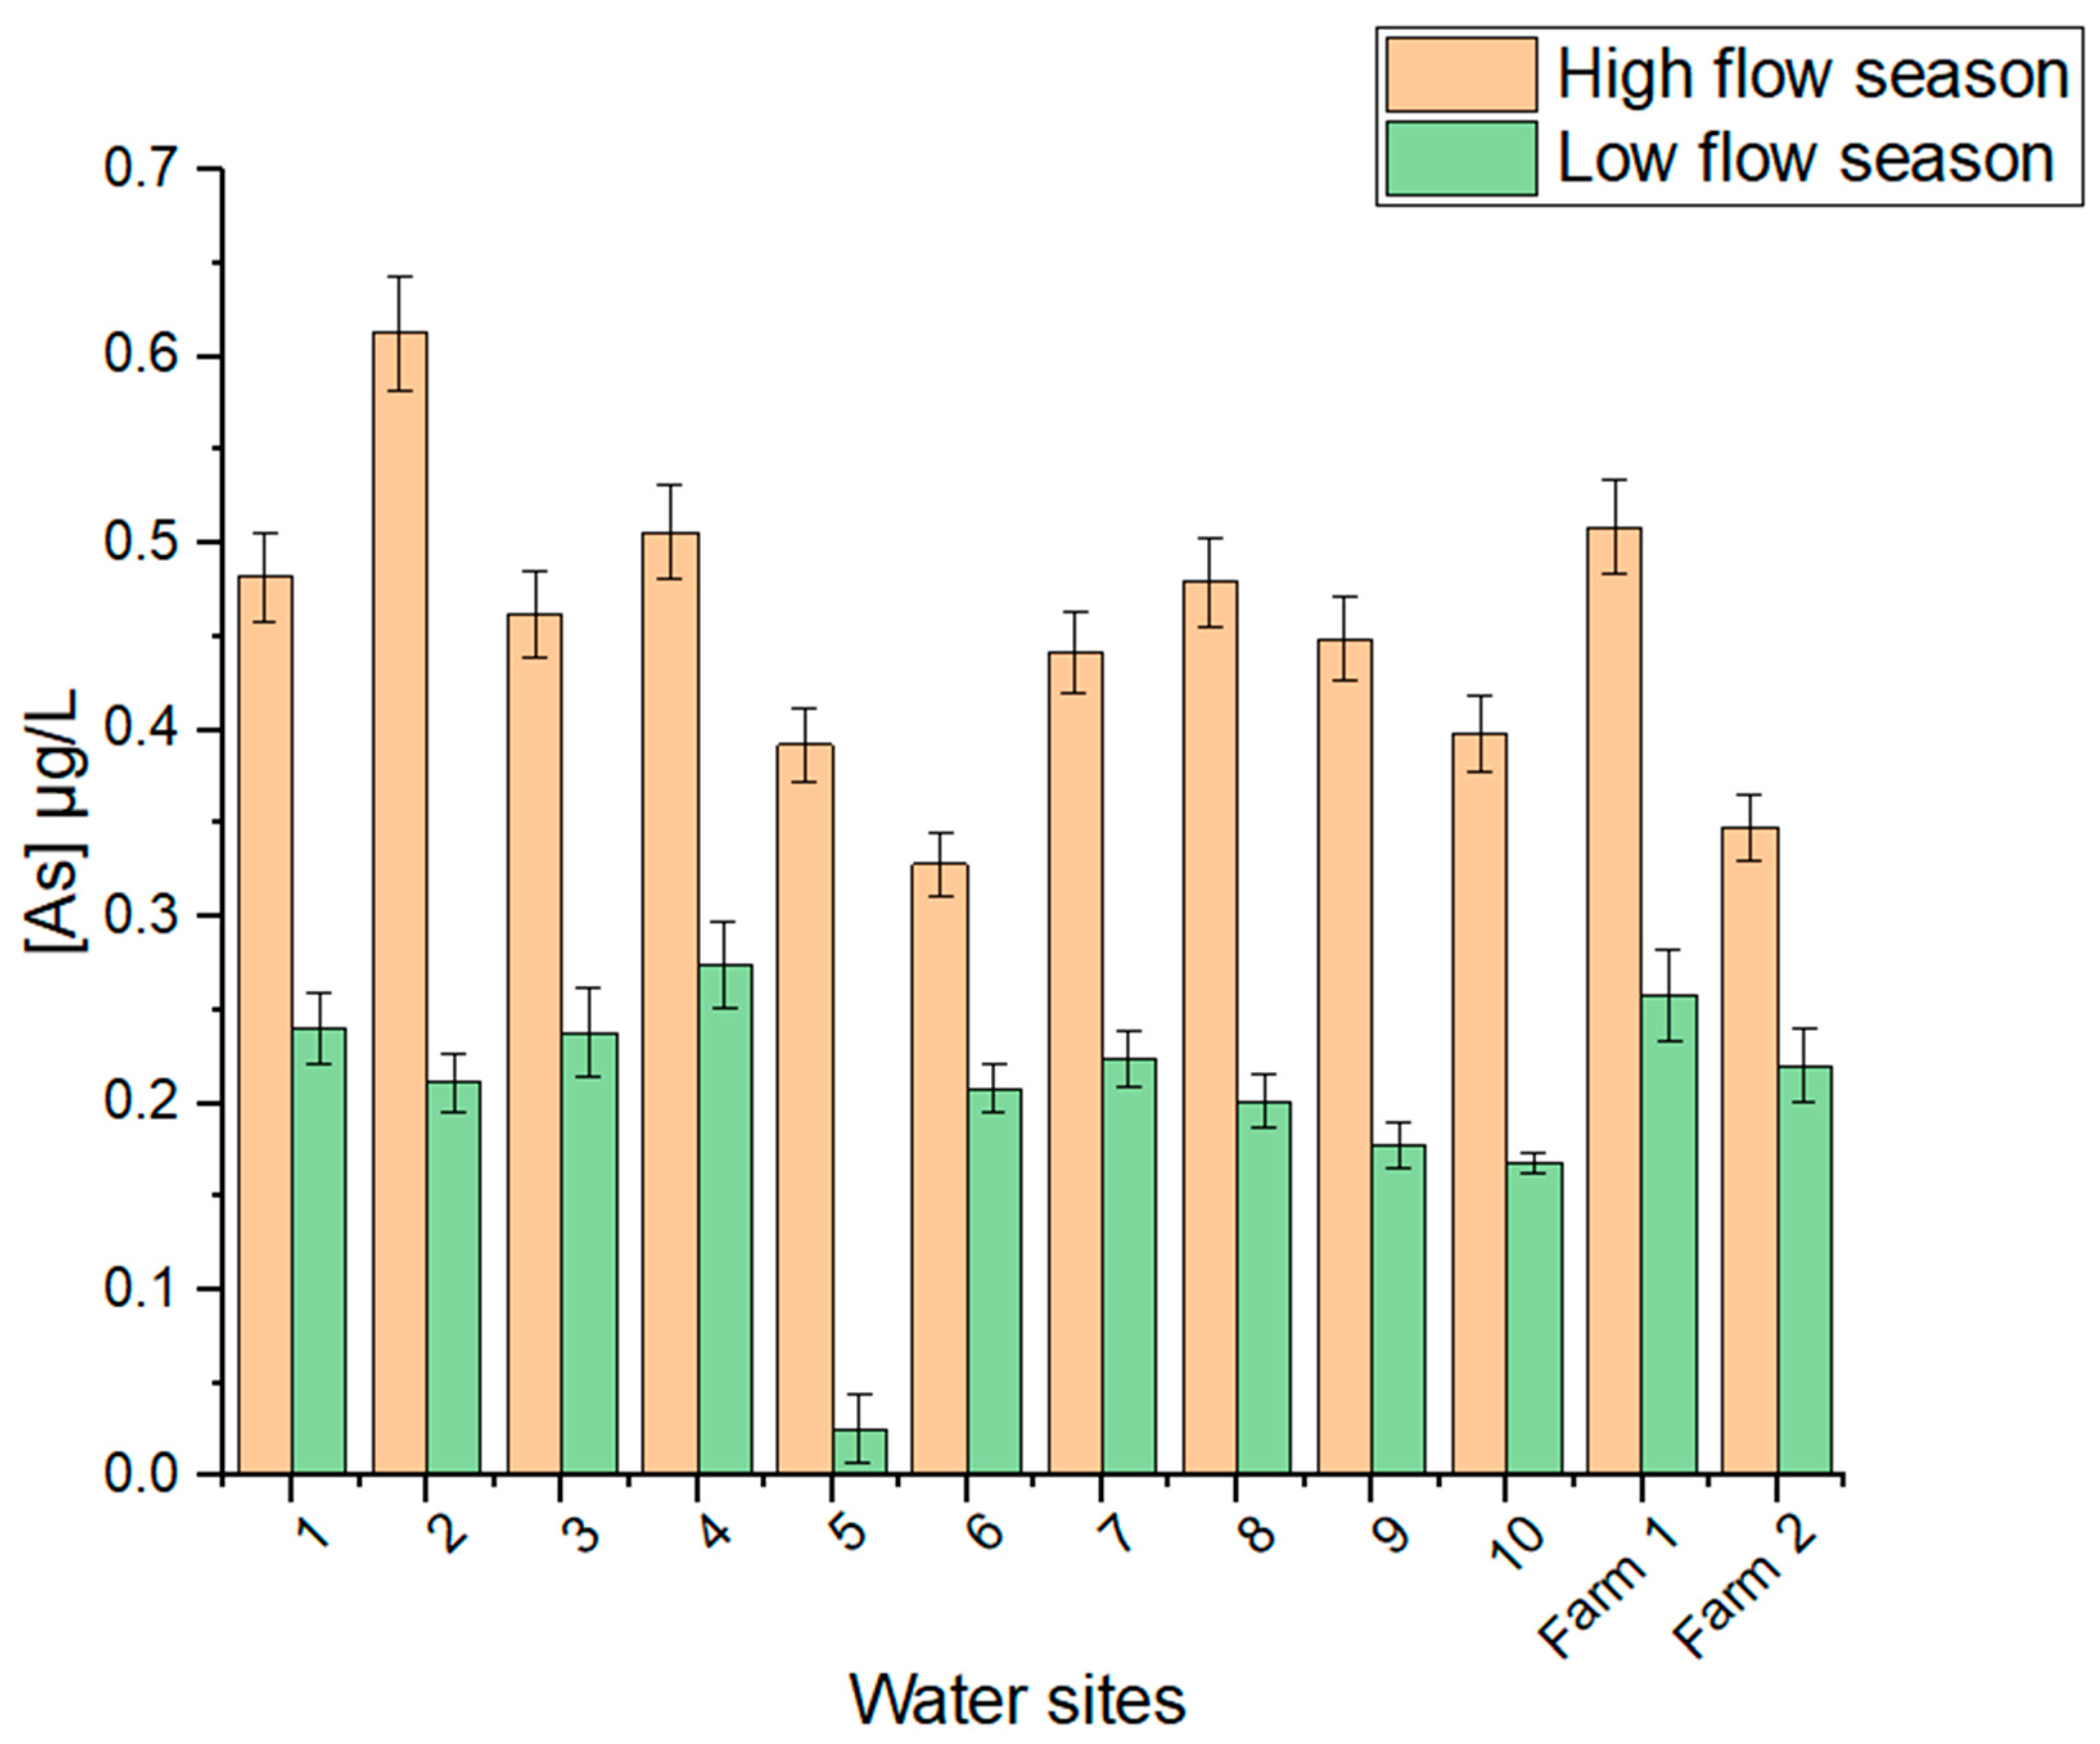
The concentration of As in water samples ranged between 0.328 and 0.612 µg/L during the high-flow season, whereas in the low-flow season, it was observed to be ranging between 0.168 and 0.274 µg/L. These results are shown in Figure 4. It is observed that high As content in water samples was detected in the high-flow season in all the water samples. Overall low concentrations were observed for As which is an indication that the bedrock is As-poor and discharge from industrial and agricultural activities is low. High concentrations of As are often observed in areas where sulfide ores associated with PTEs such as Pb, Ag and Cu are present. The associated As can be released by the effects of high evaporation rates, mineral weathering, mineral oxide desorption and the reductive dissolution of Fe oxides in reducing conditions [47]. Statistical analysis revealed that the variation in As concentration between the two seasons was significant (p = 2.13 × 10⁻⁸). This variation may be associated with slightly low industrial and agricultural discharge observed during the low-flow season [47].
The overall concentrations observed are lower than the MPL in drinking water recommended by the WHO, SANS and DWAF (10 µg/L) [41,42,43], whereas 100 µg/L is the MPL for agricultural water by the DWAF [44]. Thus, the water meets the standards for consumption and the irrigation of plants relative to the analyzed element. Speciation studies were not carried out due to the low concentration of total Cr and As observed in water. The Cr(VI) possible cancer risk is only observed for total concentrations over 50 µg/L. In this study, the overall concentration of Cr is less than 2 µg/L [41]. The overall As content was lower than 0.700 µg/L in this study.

3.4. Total Concentrations of As and Cr in Soil Samples

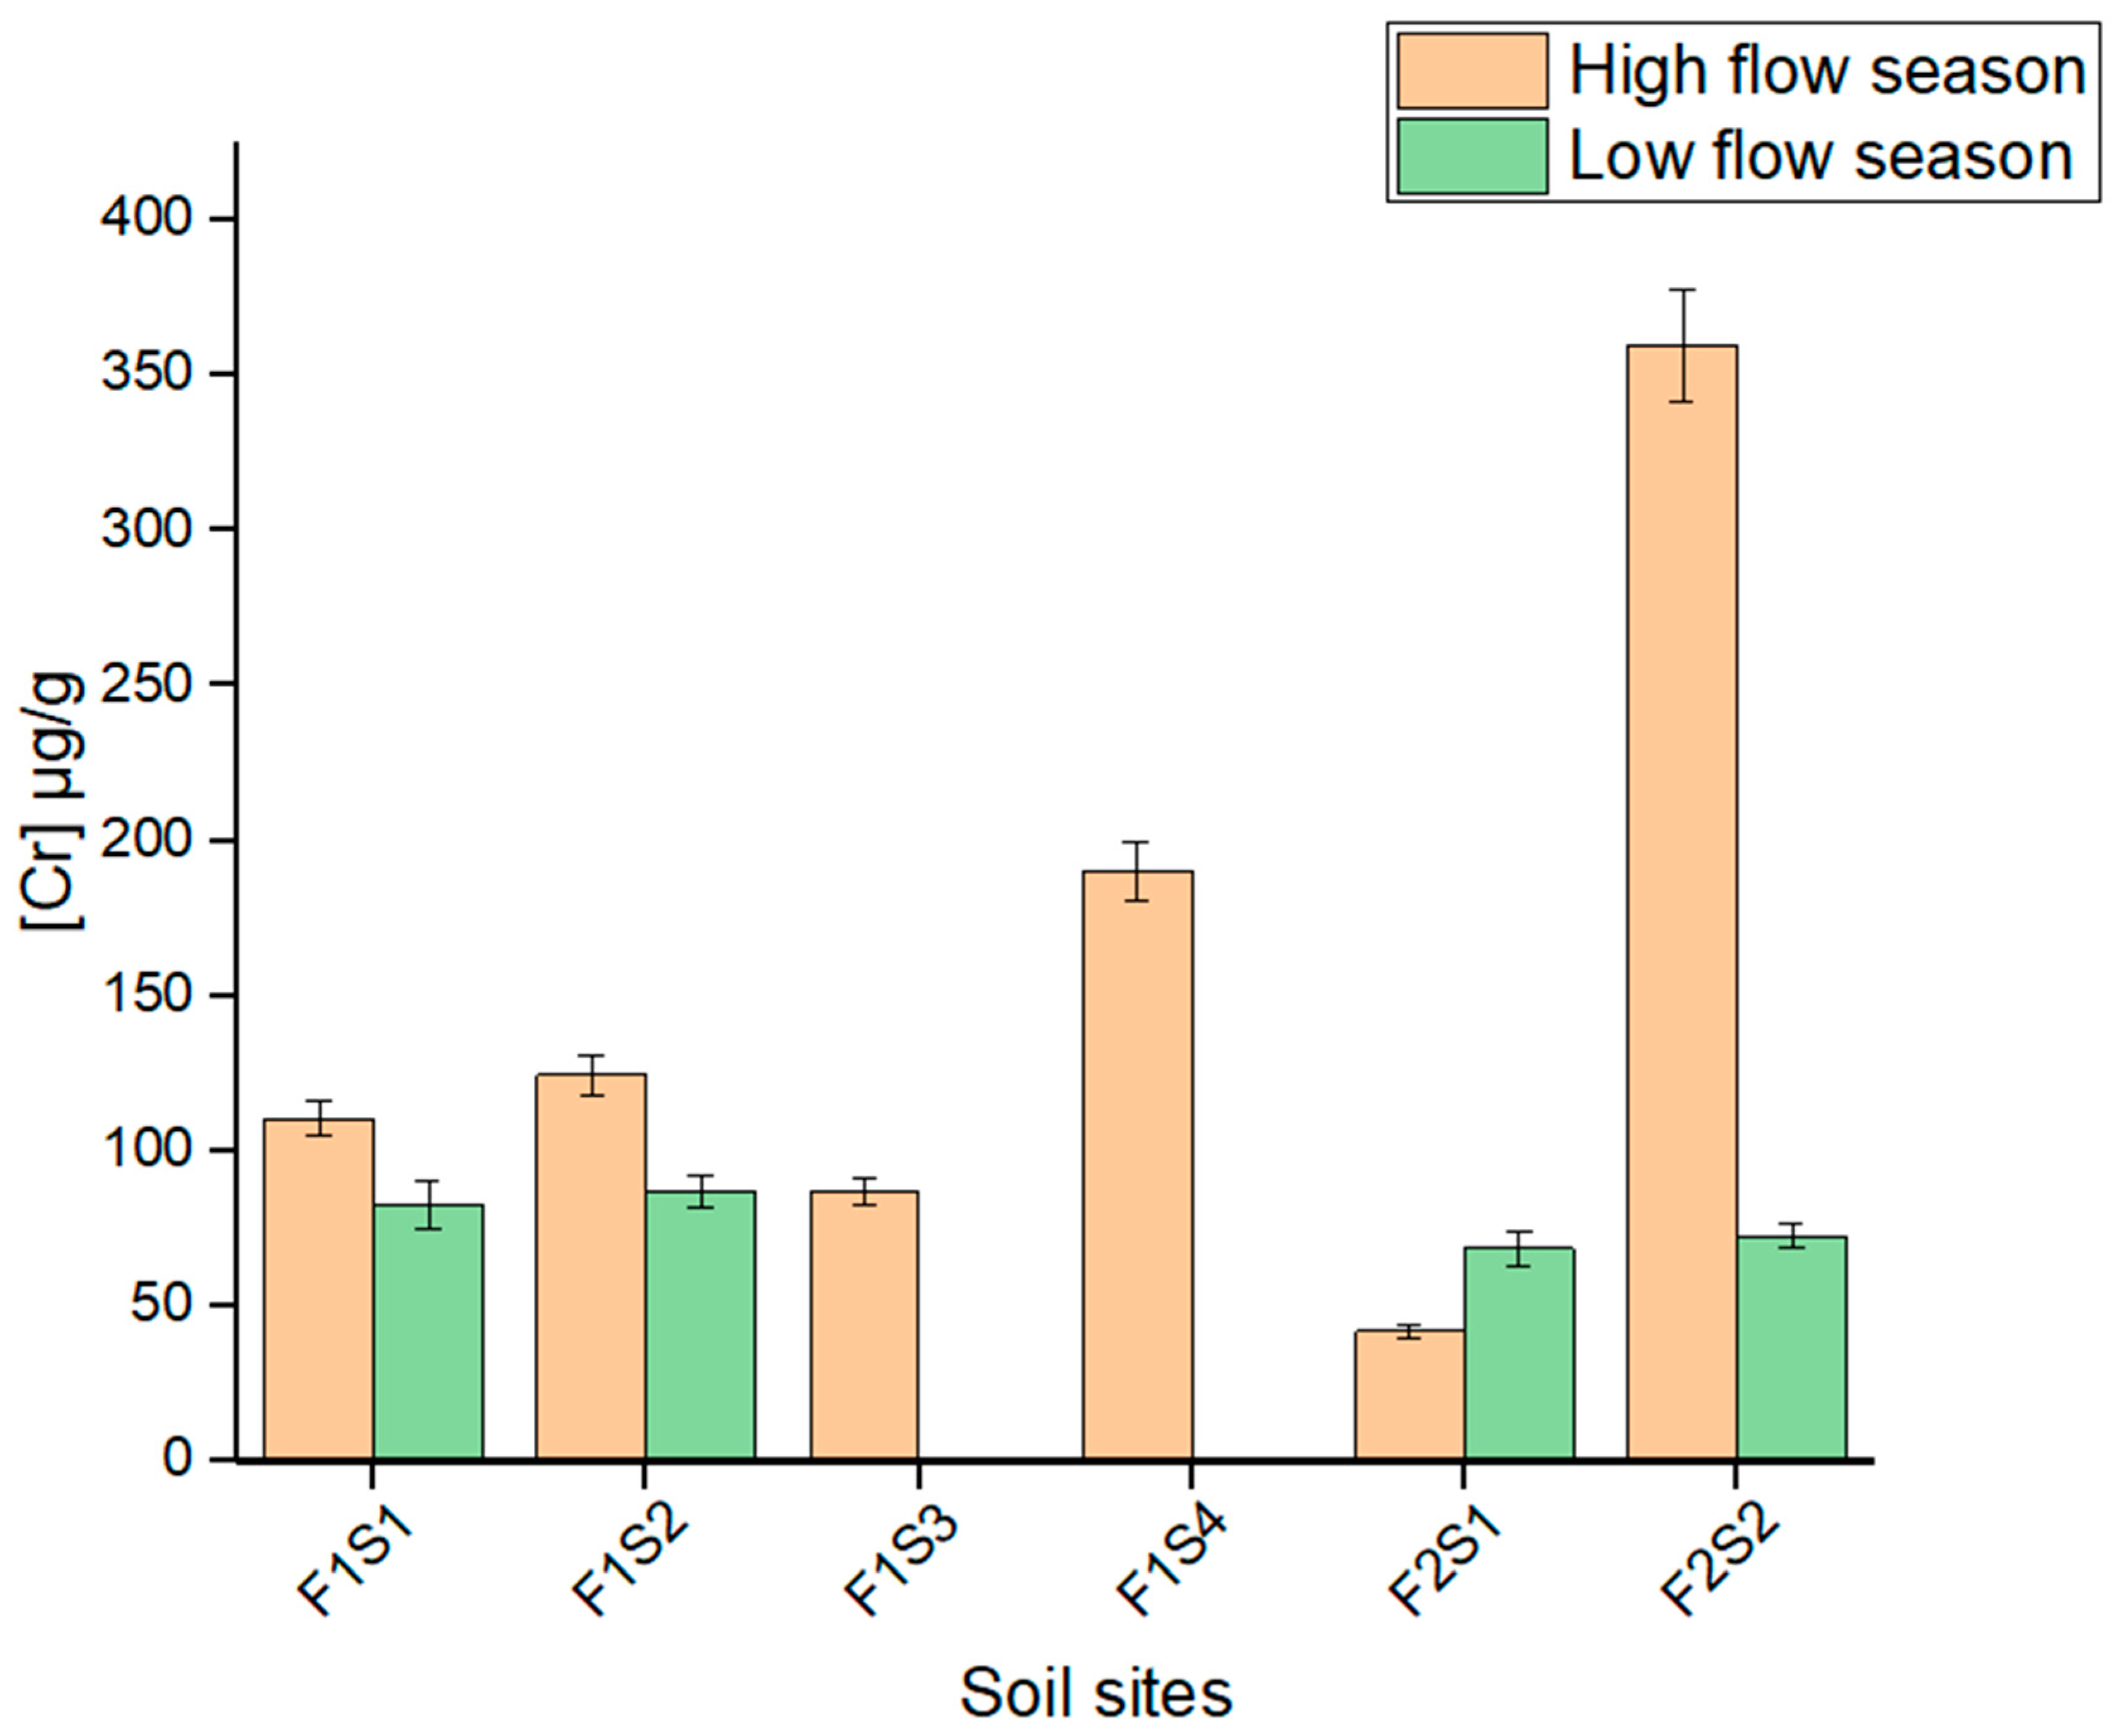
The presence of Cr was detected in soil samples obtained from farms 1 and 2 during both sampling seasons, and the results are displayed in Figure 5. The levels of Cr in farm 1 ranged from 86.7 to 125 µg/g and 82.6 to 87.0 µg/g in the high- and low-flow seasons, respectively. In farm 2, it ranged from 41.8 to 360 µg/g and 68.5 to 72.5 µg/g, respectively. It was observed that with most farm sites, the high-flow season had higher Cr content than the low-flow season except for F2S1. In the low-flow season, samples of soil in F1S3 and F1S4 were not collected; hence, no Cr content was reported as the sites did not have any vegetables growing during that season. The observed Cr content in most sites exceeded the Canadian soil quality guideline value of 64.0 µg/g. Exceeding the guideline value can result in discolored leaves, chlorosis, ailing root systems and stunted growth in vegetables grown in the soil, affecting food security negatively [48]. Only F2S1 Cr content was lower than the soil quality guideline value. The introduction of Cr into the soil may be through the use of fertilizers (confirmed by residents of the farm), atmospheric deposits introduced through the burning of coal by power stations in proximity and irrigation water [21,49,50]. The contribution of Cr by irrigation water was likely to be very low as it was observed during analysis that the concentrations were extremely low in the high-flow season and not detected in the low-flow season. Seasonally, statistical variation in Cr was insignificant (p = 0.0670).
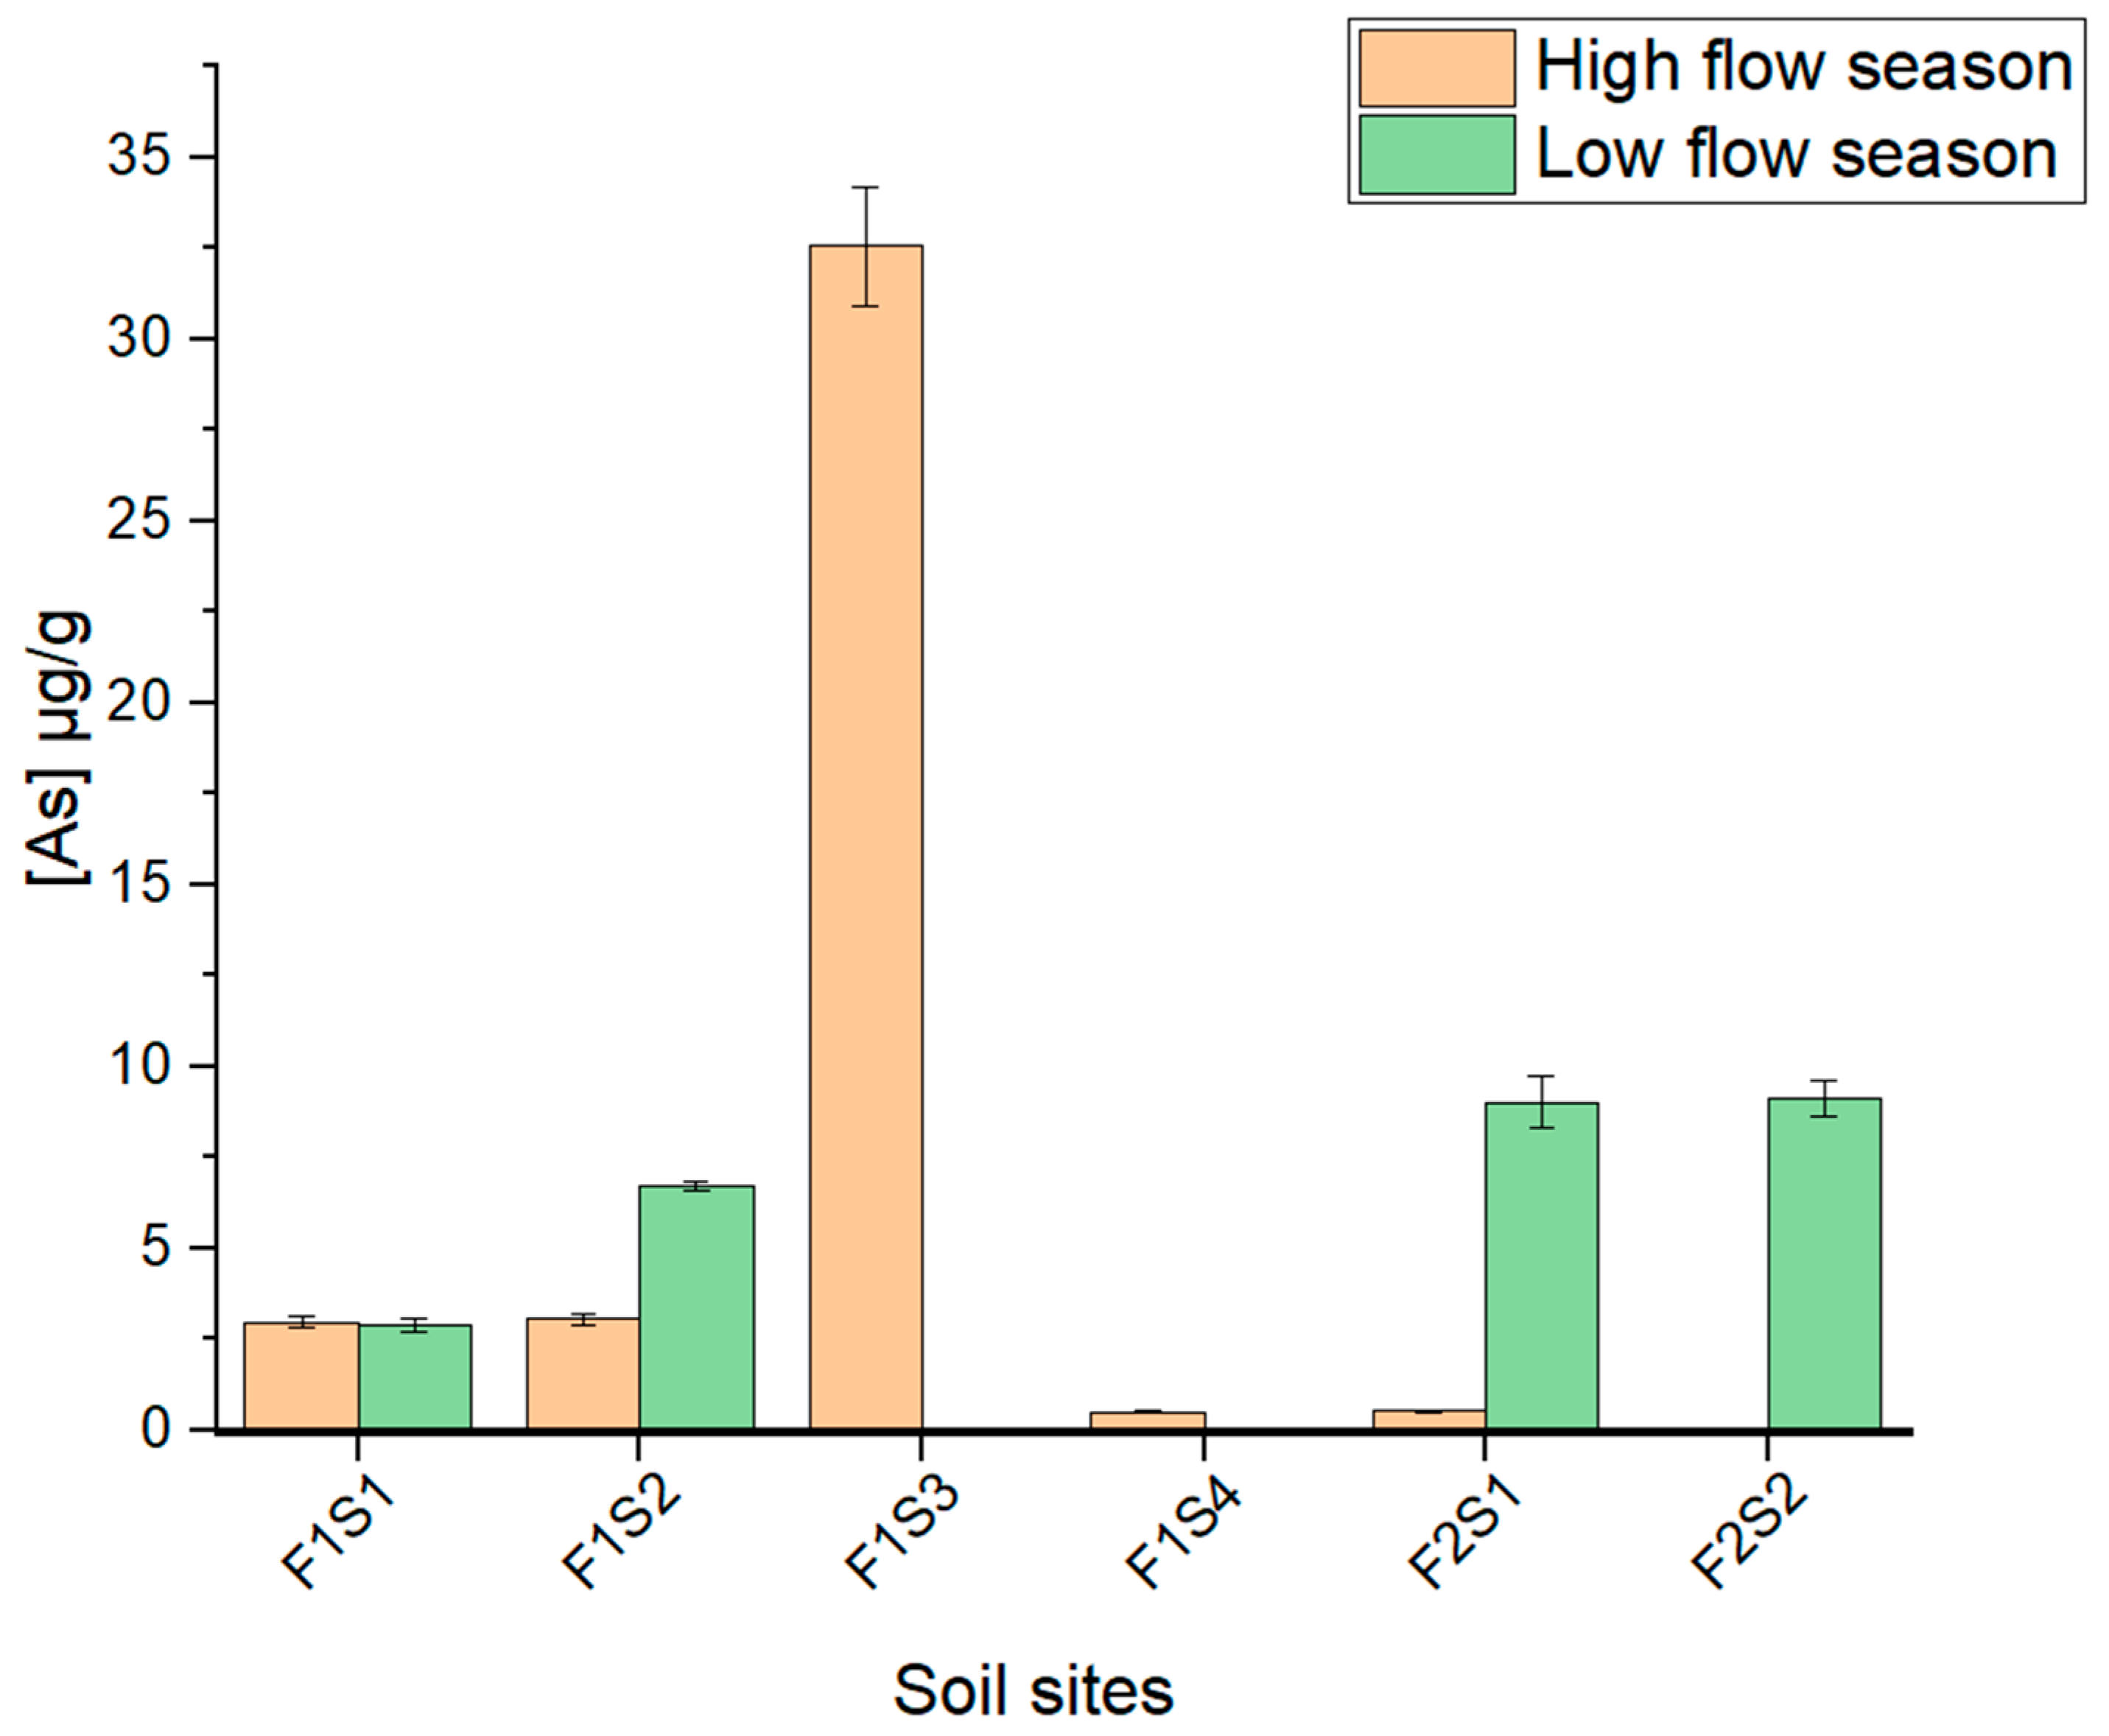
The As concentrations in soil ranged from 0.50 to 32.6 µg/g and 2.89 to 6.74 µg/g in farm 1 in the high- and low-flow seasons, respectively. In farm 2, 0.0453 to 0.520 µg/g and 9.03 to 9.14 µg/g As concentrations were observed, as shown in Figure 6. The As content observed in each site differed and decreased from the high-flow season to the low-flow season. Similar observations have been observed in a study by Lombard et al. [51], and this was attributed to an inverse relationship observed between the amount of precipitation linked to a season and total As levels. This is due to the lowering of the water level in seasons of less precipitation and processes such as the dissolution and oxidation of sulfide and oxide-bearing minerals containing As [51]. The statistical variation in As in both seasons was statistically insignificant (p = 0.726). The total As content in soil samples was less than 48 µg/g, which is the soil screening value [28], and also less than the soil quality guideline value of 12 µg/g [52], with the exception of F1S3, which was greater than 12 µg/g. The observed concentrations were well within the recommended guidelines as phytotoxic effects (reduction in various vegetable yields) have been observed where the As content in soil is only greater than 10 µg/g [52].

3.5. Speciation Analysis of As and Cr in Soil Samples

The speciation analysis of As and Cr species in soil samples is presented in Table 5 and Table 6. In the high-flow season, the site with high levels of As and Cr species was F1S3 with 3960, 20,600, 3110, 4850, 3000 and 30,500 ng/g for As(III), DMA, MMA, As(V), Cr(VI) and Cr(III), respectively. The species with the highest concentration among the six was Cr(III). Amongst the As species, DMA displayed a higher average concentration in both seasons under study, which suggests the presence of anaerobic bacteria. The bacteria convert the more toxic species (As(III) and As(V)) into less toxic species such as DMA. This process normally occurs in soil chemically and biologically and is known as As volatilization [53,54]. The accumulation of DMA and MMA in soil could be attributed to the past use of methylated As compounds and DMA and MMA sodium salts as pesticides [54]. High concentrations of As(III) in sites F1S1 (2010 ng/g) and F2S1 (3960 ng/g) indicate reducing soil environments that favor As(III) presence. The reducing environments promote increased solubility, toxicity and mobility of As(III) than As(V) [54]. In the low-flow season, As(V) dominates sites such as F1S1 (1130 ng/g), F1S2 (2570 ng/g) and F2S2 (3570 ng/g), while it predominates in F1S2 (1190 ng/g in the high-flow season), which shows the soil conditions are aerobic and favor As(V) presence [55]. The overall trend of species amongst both seasons is observed as MMA < As(III) < As(V) < DMA and As(III) < MMA < DMA < As(V) in the high- and low-flow seasons, respectively. The seasonal variation was found to be insignificant as p > 0.05 for As(III) (p = 0.342), DMA (p = 0.691), MMA (p = 0.906) and As(V) (p = 0.797).
During Cr speciation studies, Cr(III) was 100% of total Cr in the high-flow season and 75% of total Cr in the low-flow season. Similar observations were noted in South African studies where Cr(III) was recorded at higher levels than Cr(VI) in soil [56]. Often, high Cr(III) levels are observed in soil sites with microbial organisms that can result in the bio-reduction of Cr(VI) directly. The indirect reduction can also occur in the presence of metabolites from bacteria, which results in Cr immobilization in soil and thus the high concentrations [57]. With the proximity of power stations in the Lephalale areas, emissions from coal-fueled power stations are reported to be major contributors of Cr species to the atmosphere, which ultimately ends up being deposited in the soil of the area. In another study, Cr(VI) in particular was observed to surpass the regional background in air, and these were released through combustion [58]. The soil quality guideline value for Cr(VI) in agricultural land use set by the Ontario Ministry of Environment (OME) is 660 ng/g [59]. In the high-flow season, this value was exceeded only in F1S2 and F1S3, while in the low-flow season, the value was exceeded in all sites. At a 95% confidence level, the seasonal statistical variation in Cr(VI) (p = 0.387) and Cr(III) (p = 0.597) was insignificant as p > 0.05.

3.6. Total Concentrations of Cr in Vegetable Samples

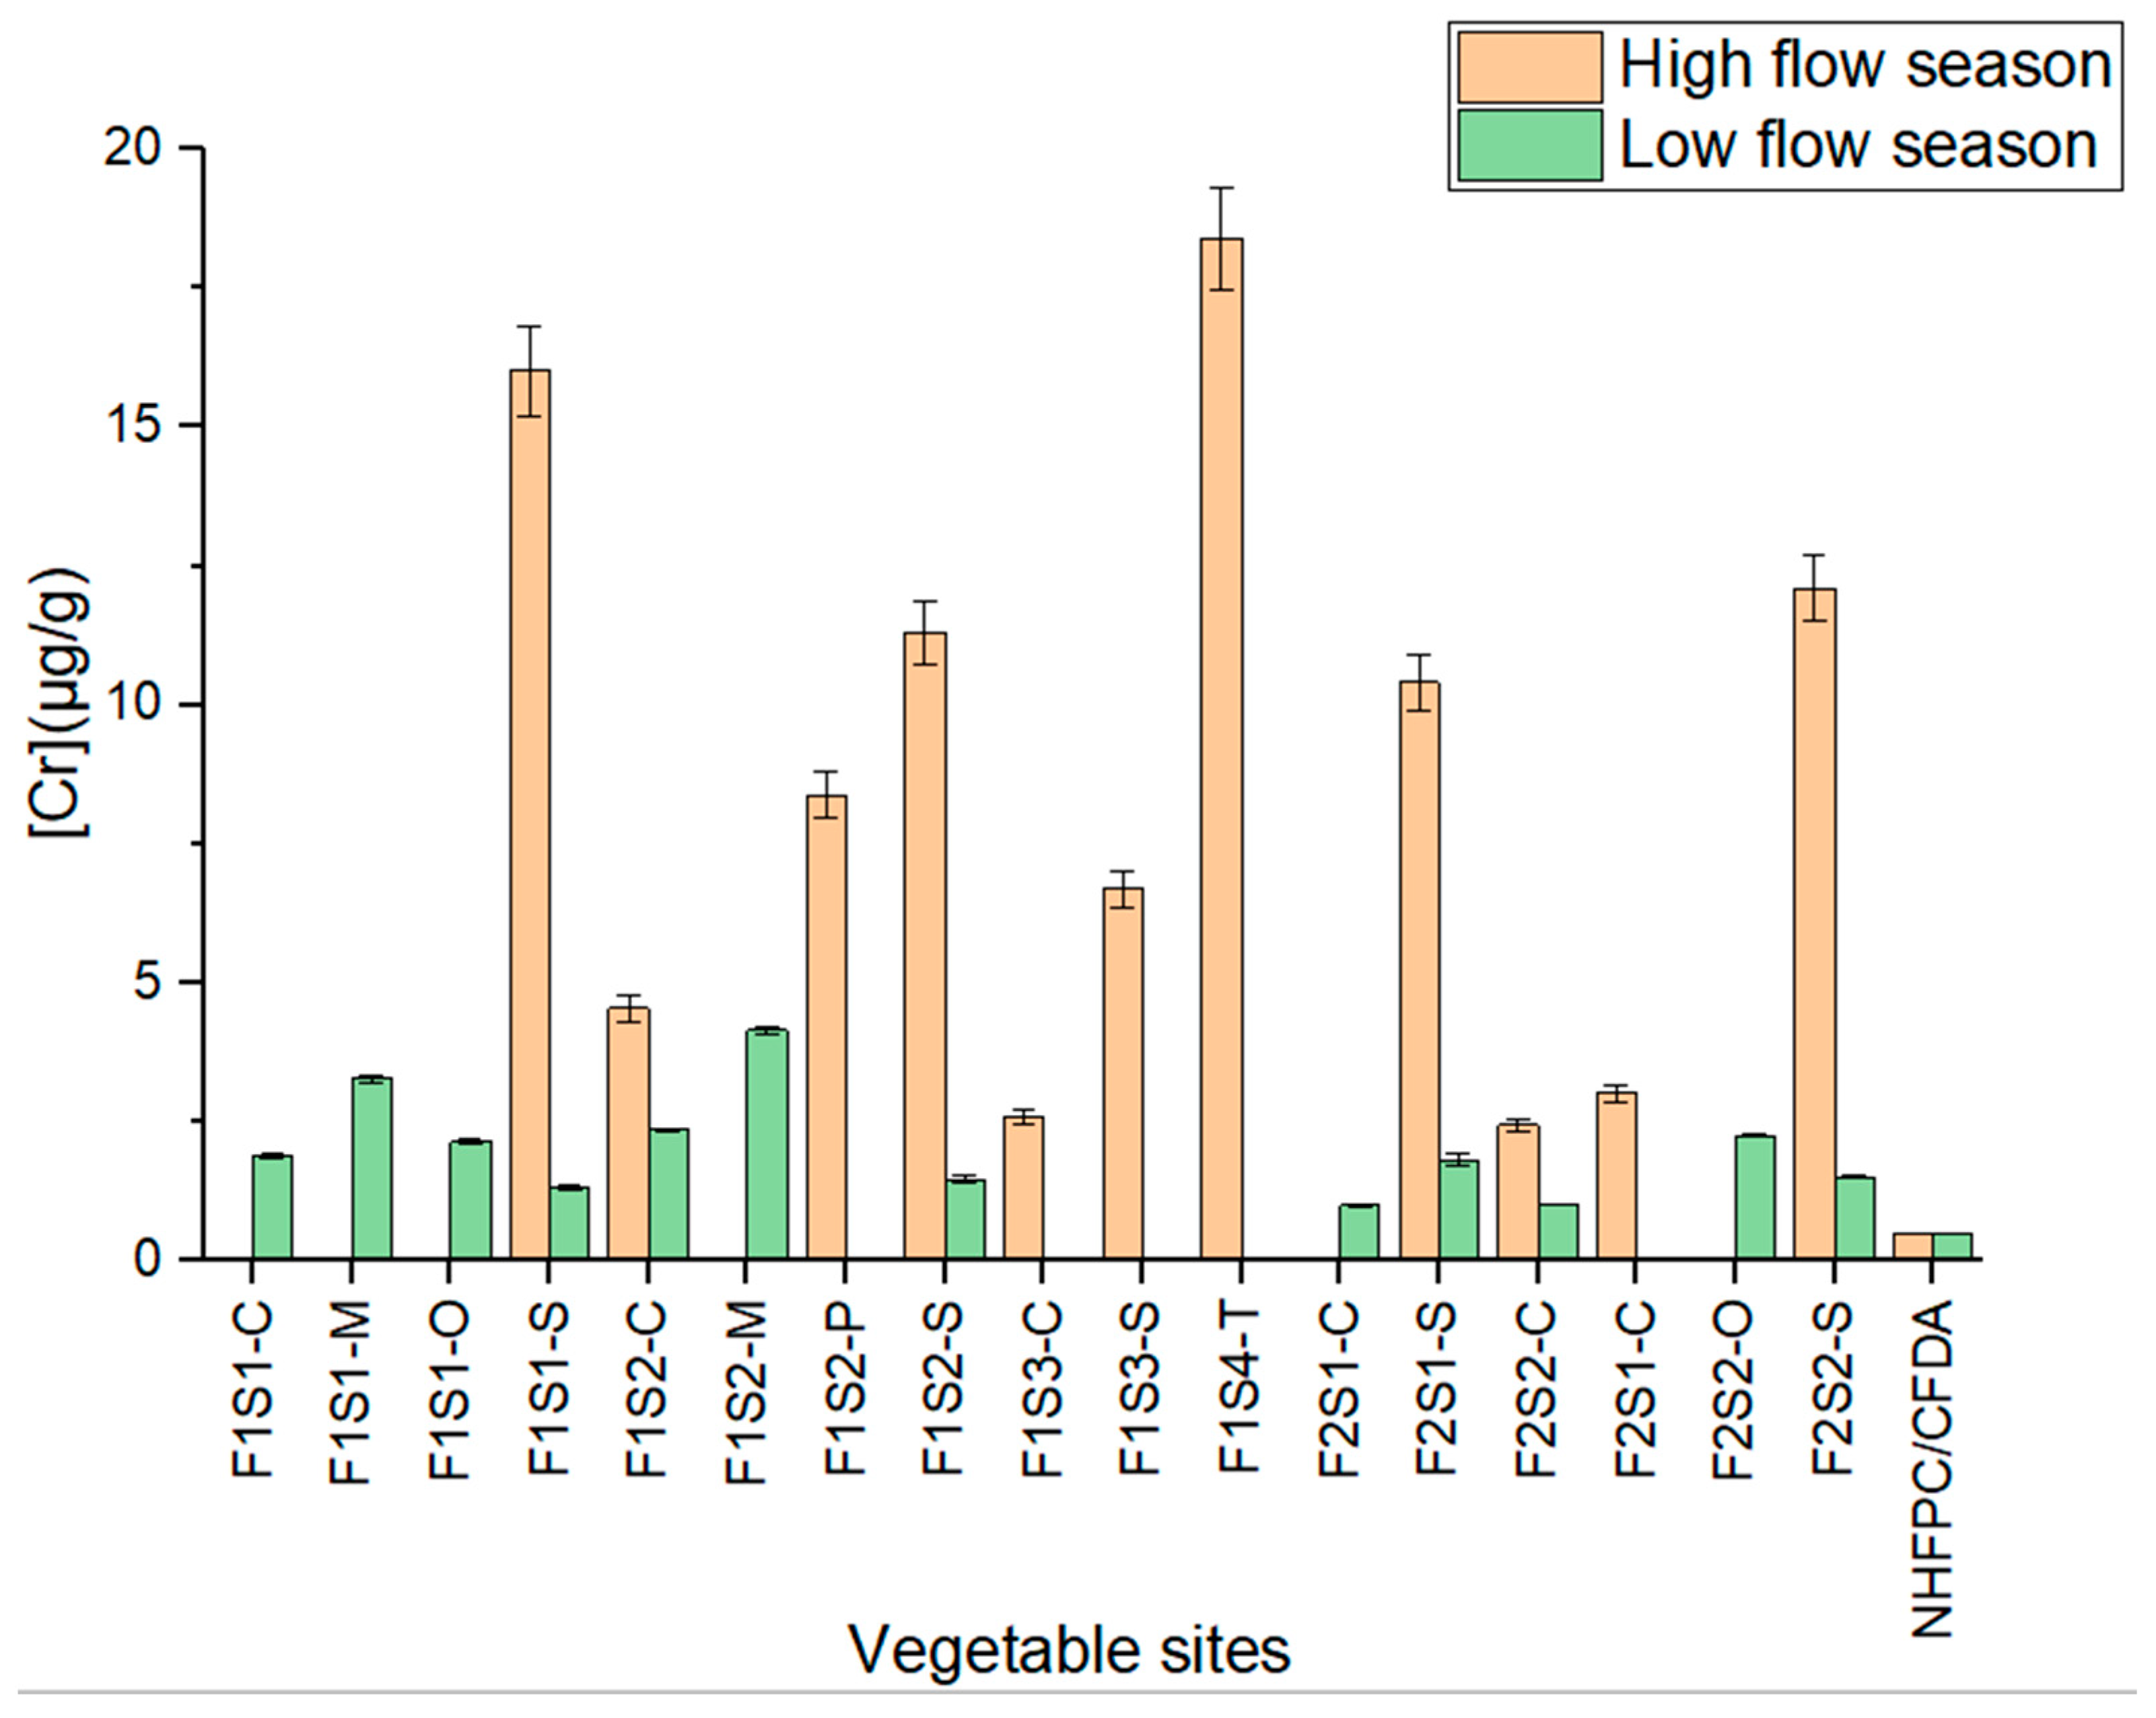
The analysis of each vegetable sample was carried out in triplicates, and the standard deviations are included as the error bars in the figures. Some vegetables were not present for both sampling seasons. This is due to local farming practices and the availability of vegetables in different seasons. For instance, chomolia germinates and grows in temperatures of 7–18 °C and is referred to as a cool-season vegetable [60]. In high- and low-flow seasons, the Cr concentration ranged from 2.58 to 18.4 µg/g and 1.02 to 4.15 µg/g, respectively. During the high-flow season, it was observed that thepe (farm 1) and spinach (farm 2) accumulated more Cr, whereas, in the low-flow season, the highest accumulators of Cr were the mochina and onions. It can be observed through vegetables in both sampling seasons that less Cr content was detected in the low-flow season than in the high-flow season, as shown in Figure 7. Statistical analysis revealed a significant variation for Cr seasonally as p < 0.05 at a 95% confidence level. The MPLs of Cr in vegetables have not been established in South Africa [61]. However, this level has been set by NHFPC/CFDA as 0.5 µg/g [62]. All the vegetables collected during both the high- and low-flow seasons surpassed the MPL, which makes these vegetables unsafe for consumption. Total Cr concentrations in vegetables were reported from Lepelle, Botshabelo and Diphuti (Limpopo Province, South Africa) and revealed that the average Cr content was 1.43 µg/g [13]. The reported average value in that study was below the average values of 8.71 and 2.02 µg/g from this study in the high- and low-flow seasons, respectively.

3.7. Total Concentrations of As in Vegetable Samples

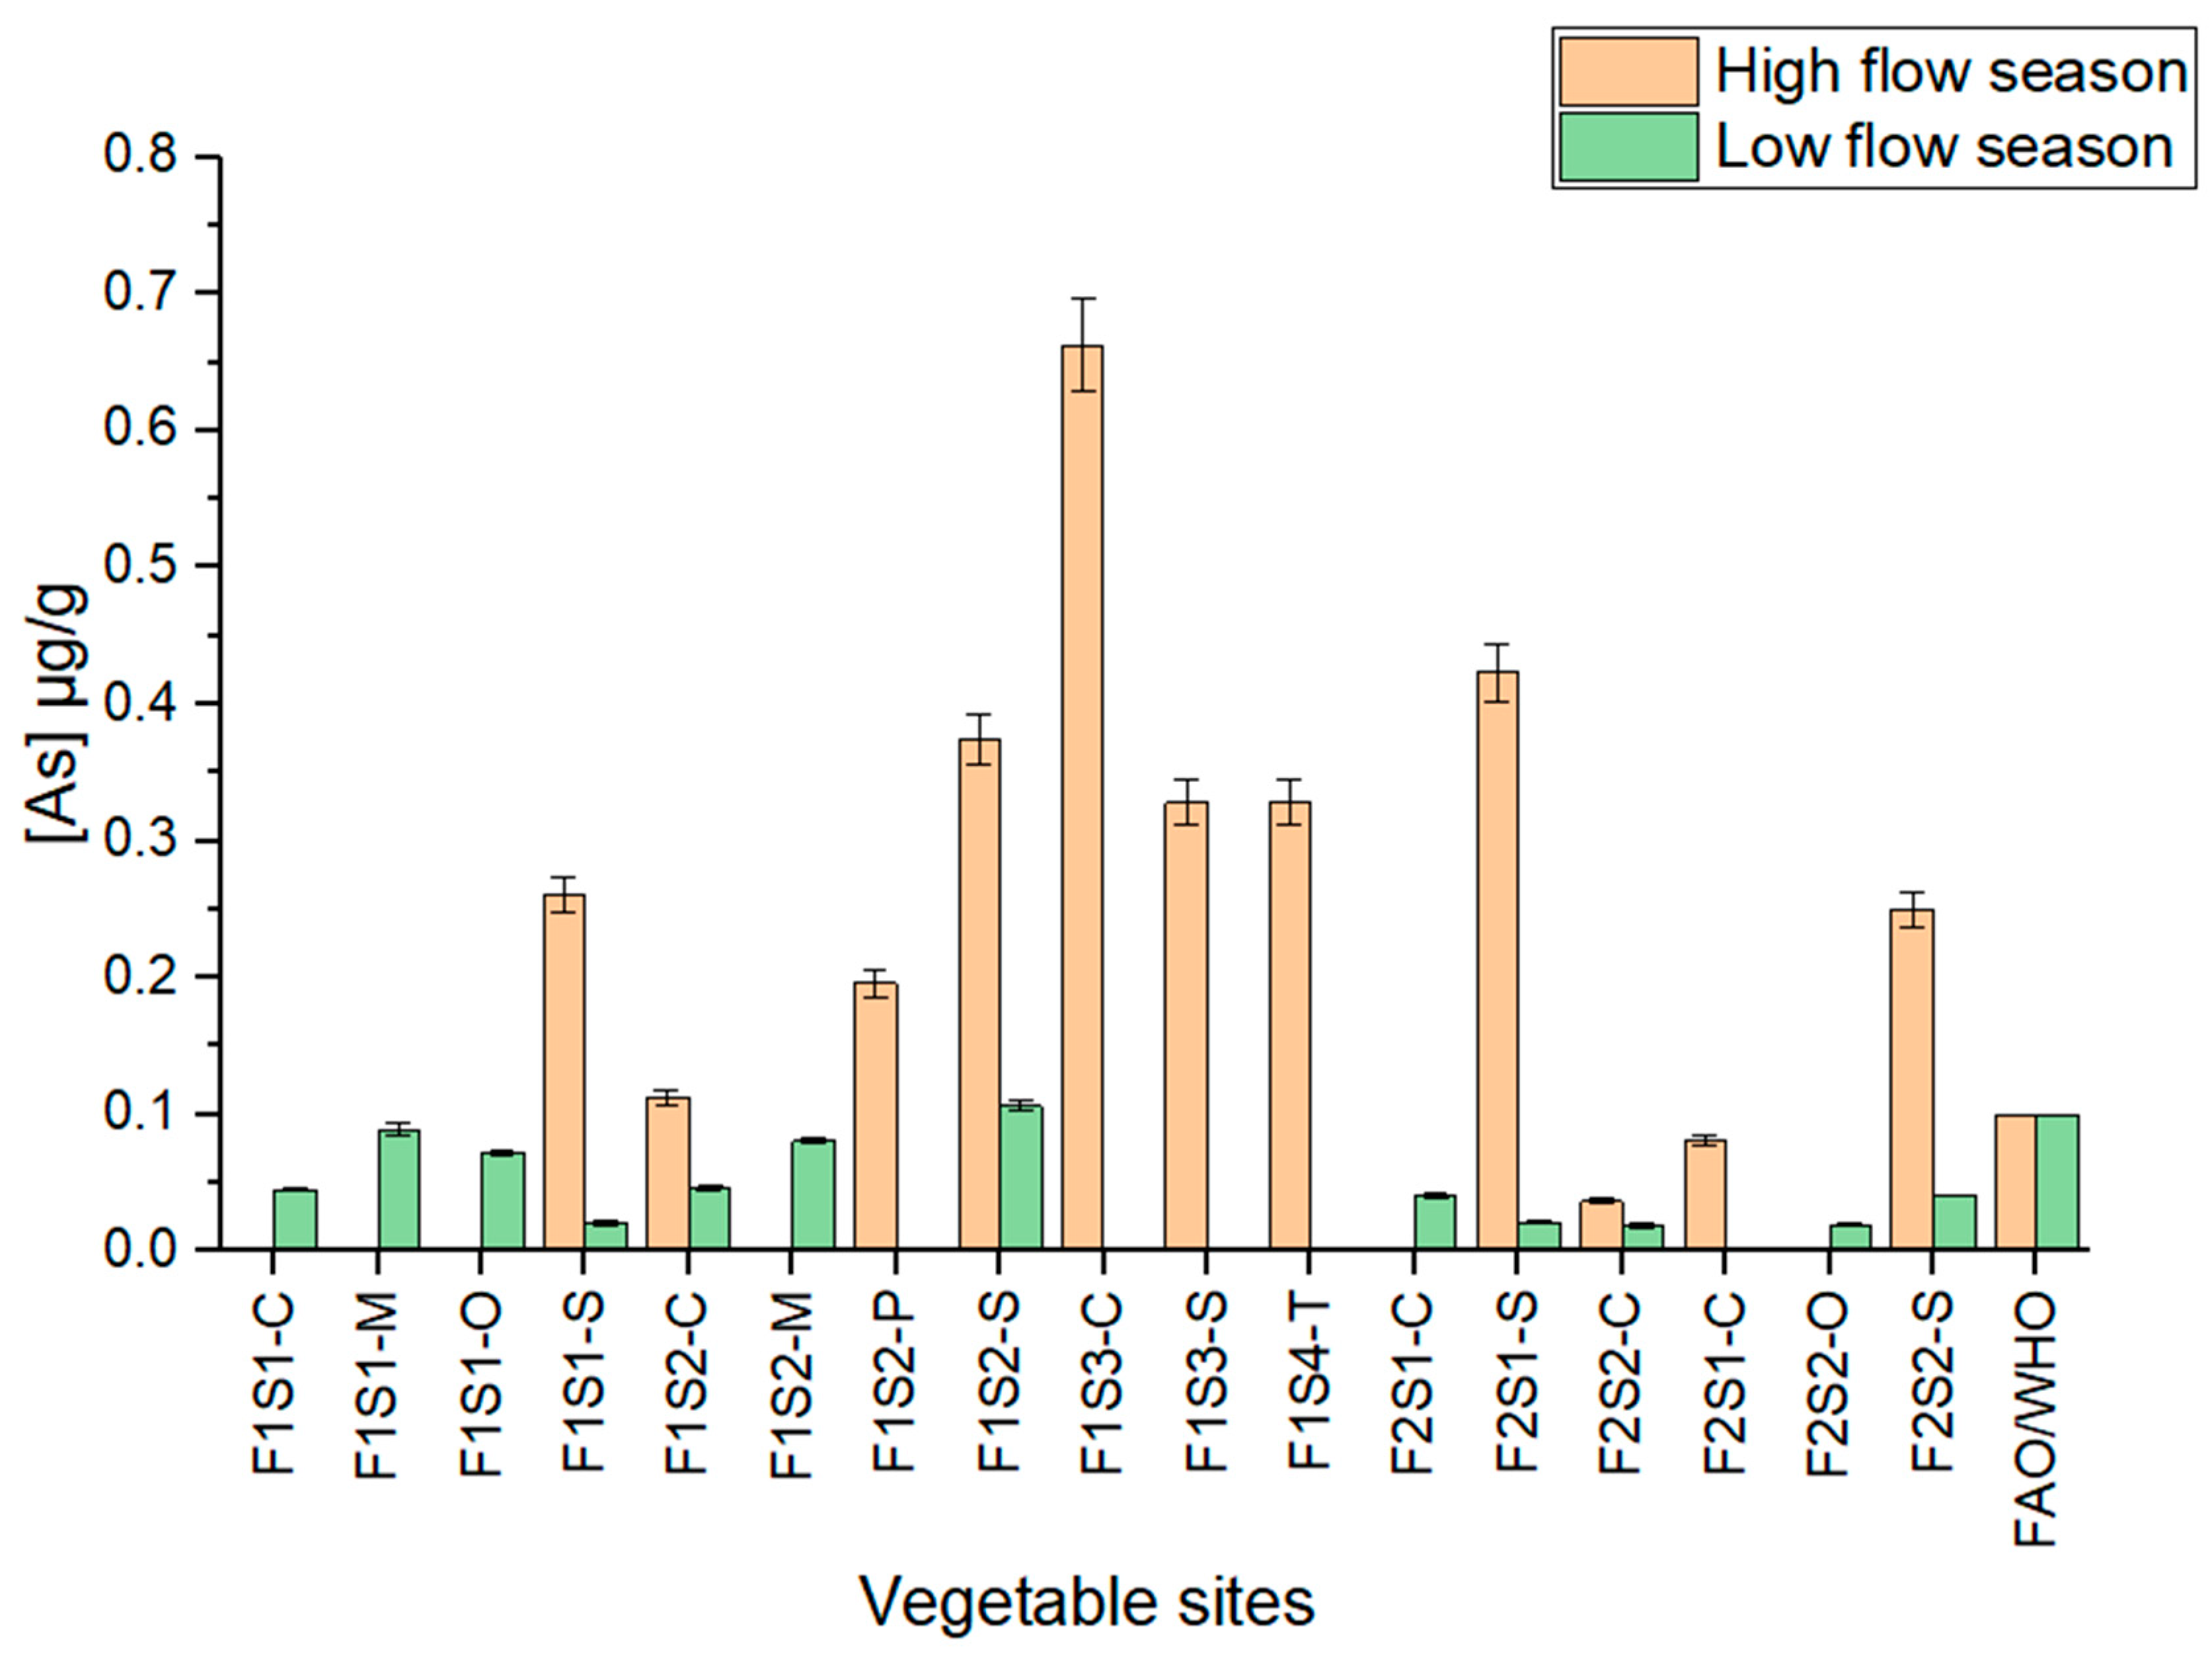
The observed As levels ranged from 0.0362 to 0.663 µg/g and 0.0205 to 0.106 µg/g in the high- and low-flow seasons, respectively, as shown in Figure 8. In this study, high levels of As were observed in chomolia and spinach. Like Cr, the As content dominated in the high-flow season rather than the low-flow season. Compared to other studies, the average observed As levels in this study are below the average of 0.278 and 0.0499 µg/g in both seasons. Still, the average of 0.0700 µg/g reported by Genthe et al. in South Africa [13] only exceeds the average observed As level in the low-flow season. Seasonally, significant statistical variation in As was observed as p < 0.05 at a 95% confidence level.
As with Cr, the MPL of As in vegetables in South Africa has not been set, but this level was determined by the FAO/WHO as 0.1 µg/g [13,63]. Almost 82.0% and 8.33% of vegetables collected during the high- and low-flow seasons exceeded the MPL. Due to the observed As levels, it can be safely concluded that consuming vegetables from the low-flow season is safer than consuming vegetables from the high-flow season.

3.8. Speciation Analysis of As and Cr in Vegetables

Vegetable sample analysis was performed in triplicate and is summarized in Table 7 and Table 8 for the high- and low-flow seasons, respectively. The recorded concentrations in the high-flow season ranged from 1.55 to 189 ng/g, 40.1 to 153 ng/g, 9.38 to 292 ng/g and 0.91 to 262 ng/g for As(III), DMA, MMA and As(V), respectively. In the low-flow season, concentration ranged from 7.03 to 52.9 ng/g, 0.338 to 30.3 ng/g, 2.48 to 15.7 ng/g and 0.72 to 27.8 ng/g for As(III), DMA, MMA and As(V), respectively. These concentration ranges are lower than those observed in the high-flows season. The observed concentrations are higher than those obtained in other studies [64]. Vegetables use various mechanisms to uptake As. These include the absorption of As(V) from soil to plant via the high-affinity PO43− transporter through the phosphate transport pathway. The other mechanisms involve the absorption of As(III), DMA and MMA through the aquaporin channels, which is proposed to be another pathway of absorption [54]. Overall, in this study, the most abundant species of As was As(III), followed by As(V), while DMA and MMA were the least abundant. This raises quite a concern as it is known that As(III) and As(V) are classified as carcinogens in humans and their overall concentrations in this study account for 60% and 78% of As species, in the high- and low-flow seasons, respectively [65]. Unfortunately, the MPLs of As species in vegetables have not yet been established [66]. Statistical analysis revealed significant seasonal variations for DMA (p = 0284), MMA (p = 0.0322) and As(V) (p = 0.0347), while insignificant variation was observed in As(III) (p = 0.0789). The concentration ranges of 594 to 1180 ng/g (Cr(VI)) and 1850 to 17400 ng/g (Cr(III)) were recorded in the high-flow season, whereas ranges of 197 to 687 ng/g (Cr(VI)) and 374 to 3540 ng/g (Cr(III)) were recorded during the low-flow season in vegetables. Higher Cr concentrations are observed with the less toxic Cr(III), and Cr(VI) only accounts for 10% and 27% overall during both sampling seasons, which is still substantially high in vegetables. It is suggested that the high Cr(III) observed is due to its solubility, making it highly mobile during its absorption by the vegetables [67]. Although Cr(III) is a crucial nutrient required for normal energy metabolism, high levels of it in children can lead to long-term adverse health effects [68]. As with As, the MPLs of Cr species in vegetables have not yet been set [69]. Statistical variation was seasonally significant for Cr(III) as p < 0.05, whereas, for Cr(VI), the variation was not significant as p > 0.05 at the 95% confidence level.

3.9. Bioaccumulation Factor

For vegetable samples, further data analysis was carried out using the bioaccumulation factor (BAF). The BAF is used to measure the capability of vegetables to accumulate/bioaccumulate and translocate PTEs, as well as other minerals, from their respective soil sites [24,70]. This is measured by determining the ratio of PTE concentration in plants relative to PTE concentration from the respective soil, as shown in Equation (5).
B A F = C p C s
where C is the concentration (µg/g) in soil (s) and vegetables/plants (p). A vegetable is considered capable of excluding a metal if the BAF is less than 0.1, whereas, if it is greater than 0.1, the vegetable is considered a slight accumulator of a PTE. In contrast, a BAF greater than 1 is an indication that a vegetable is capable of extracting or accumulating PTEs under its natural environmental conditions [24,60,71].
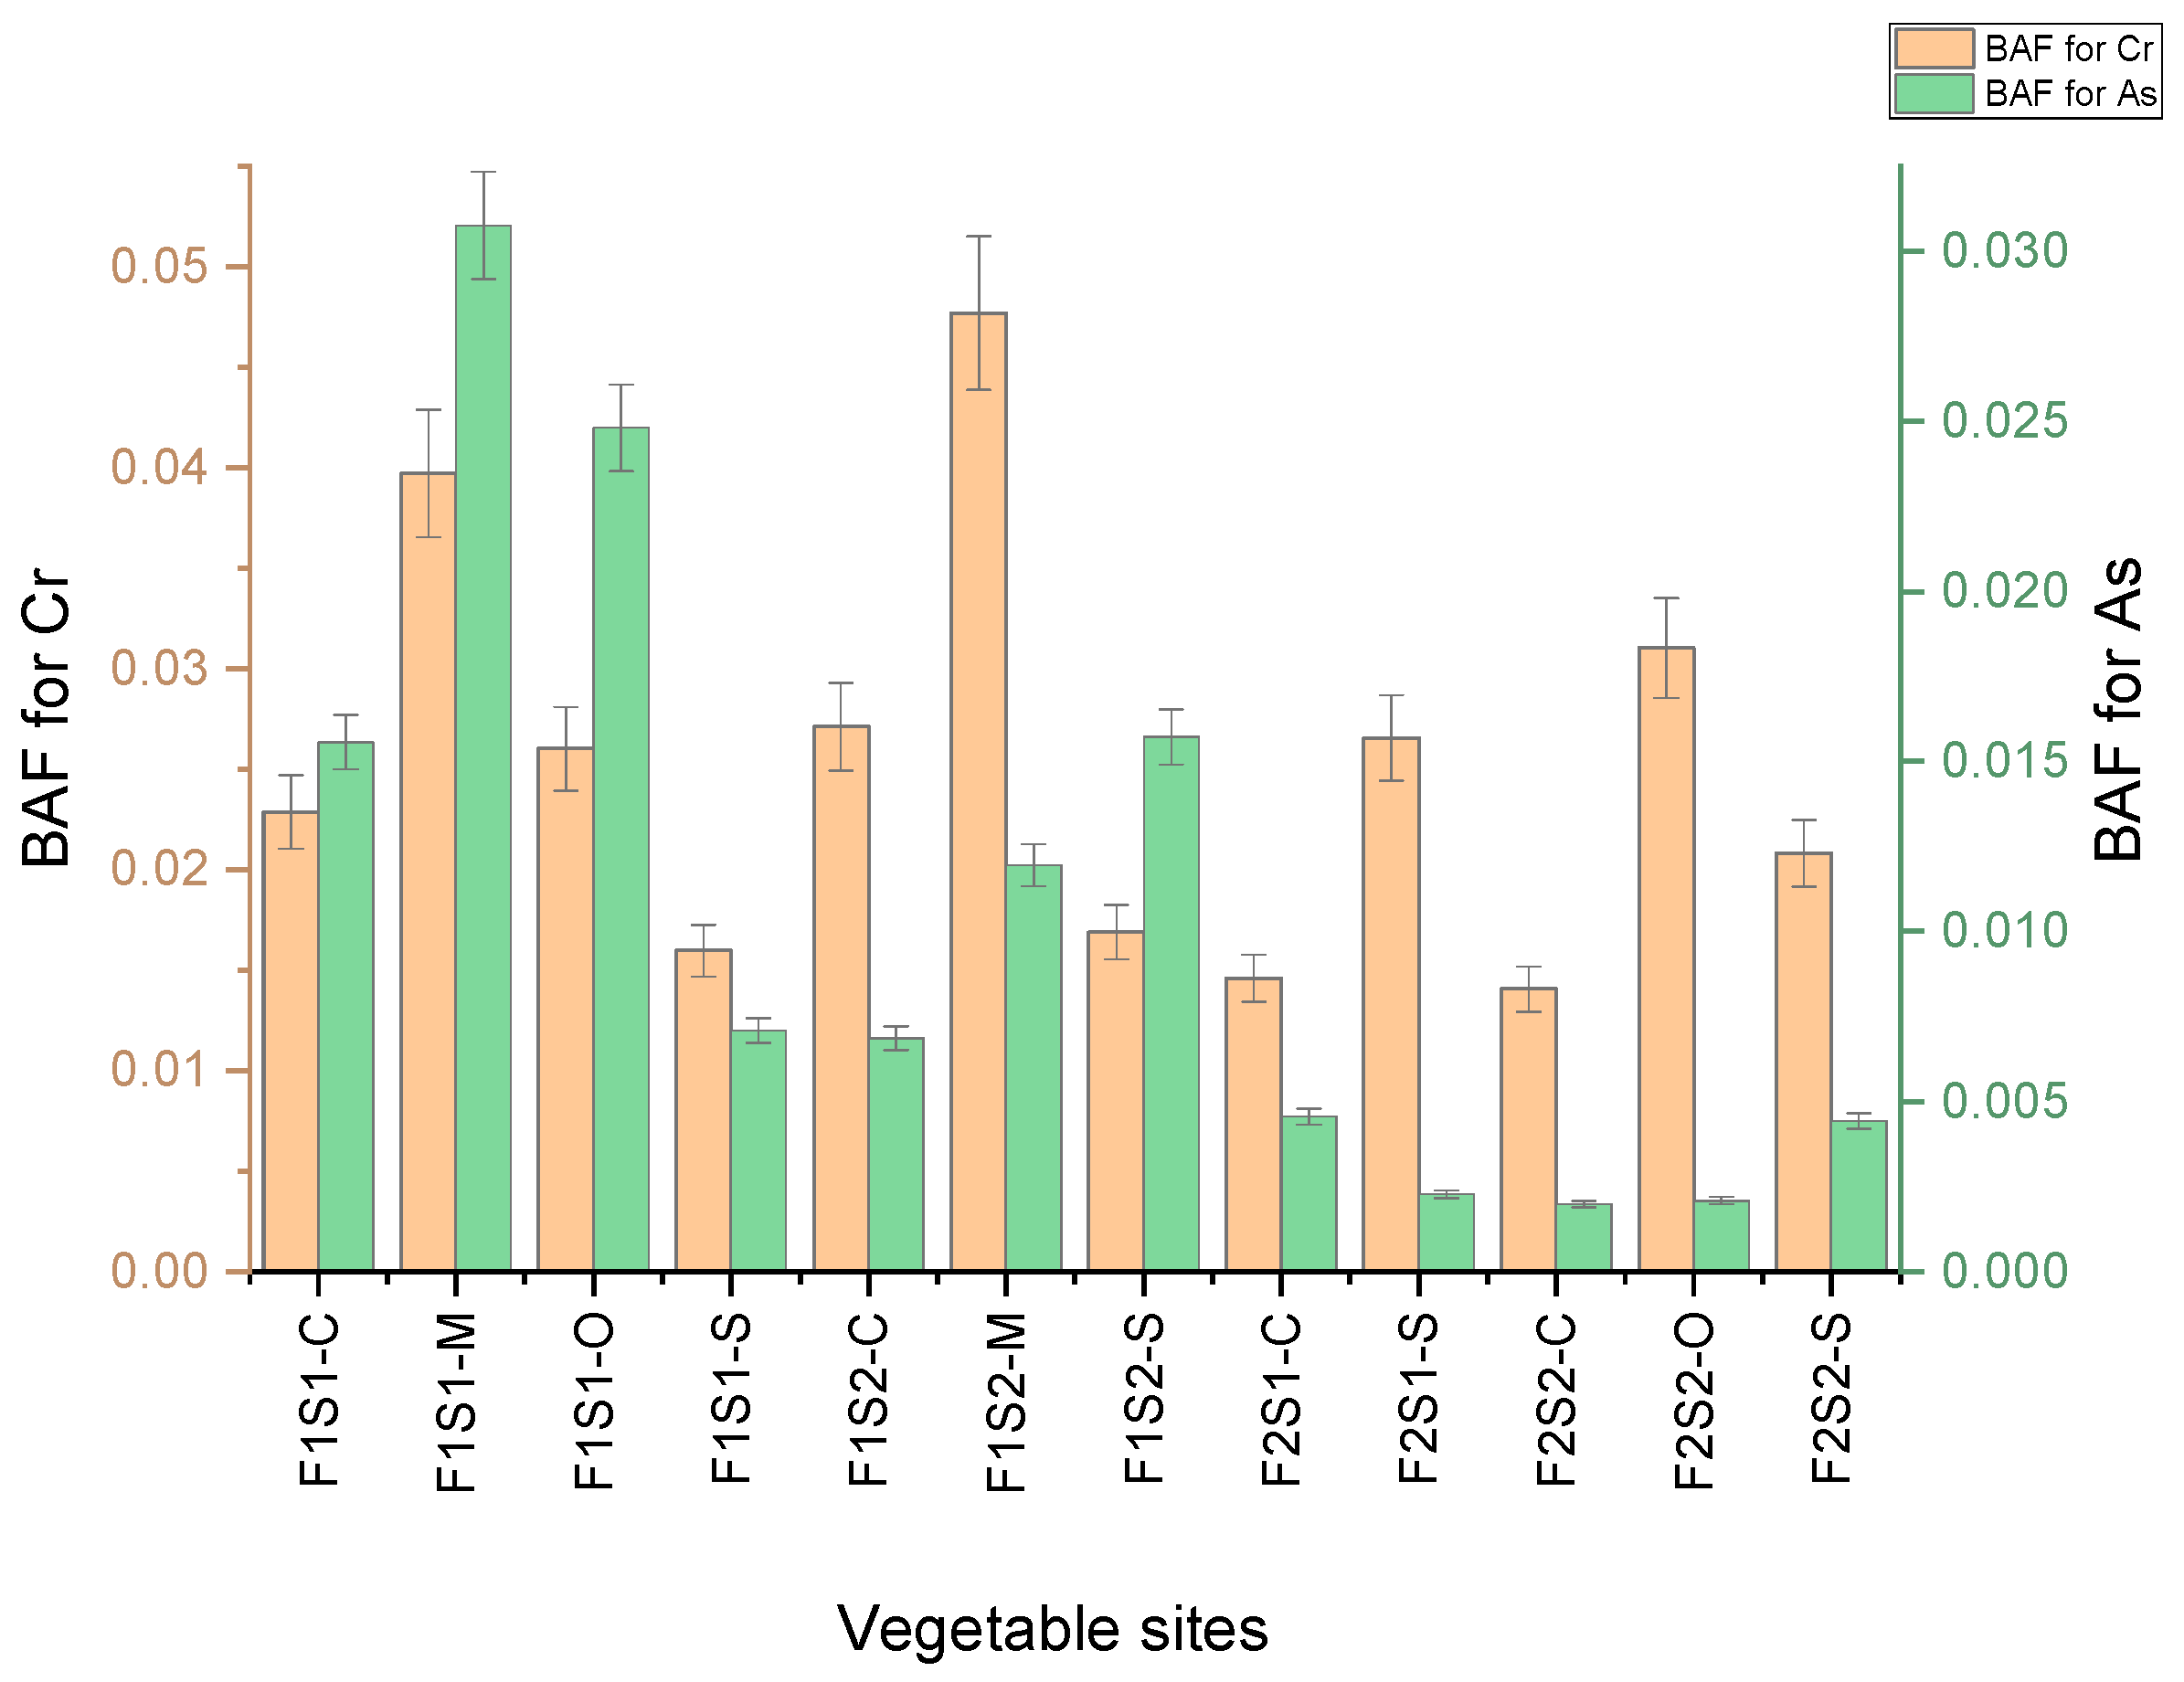
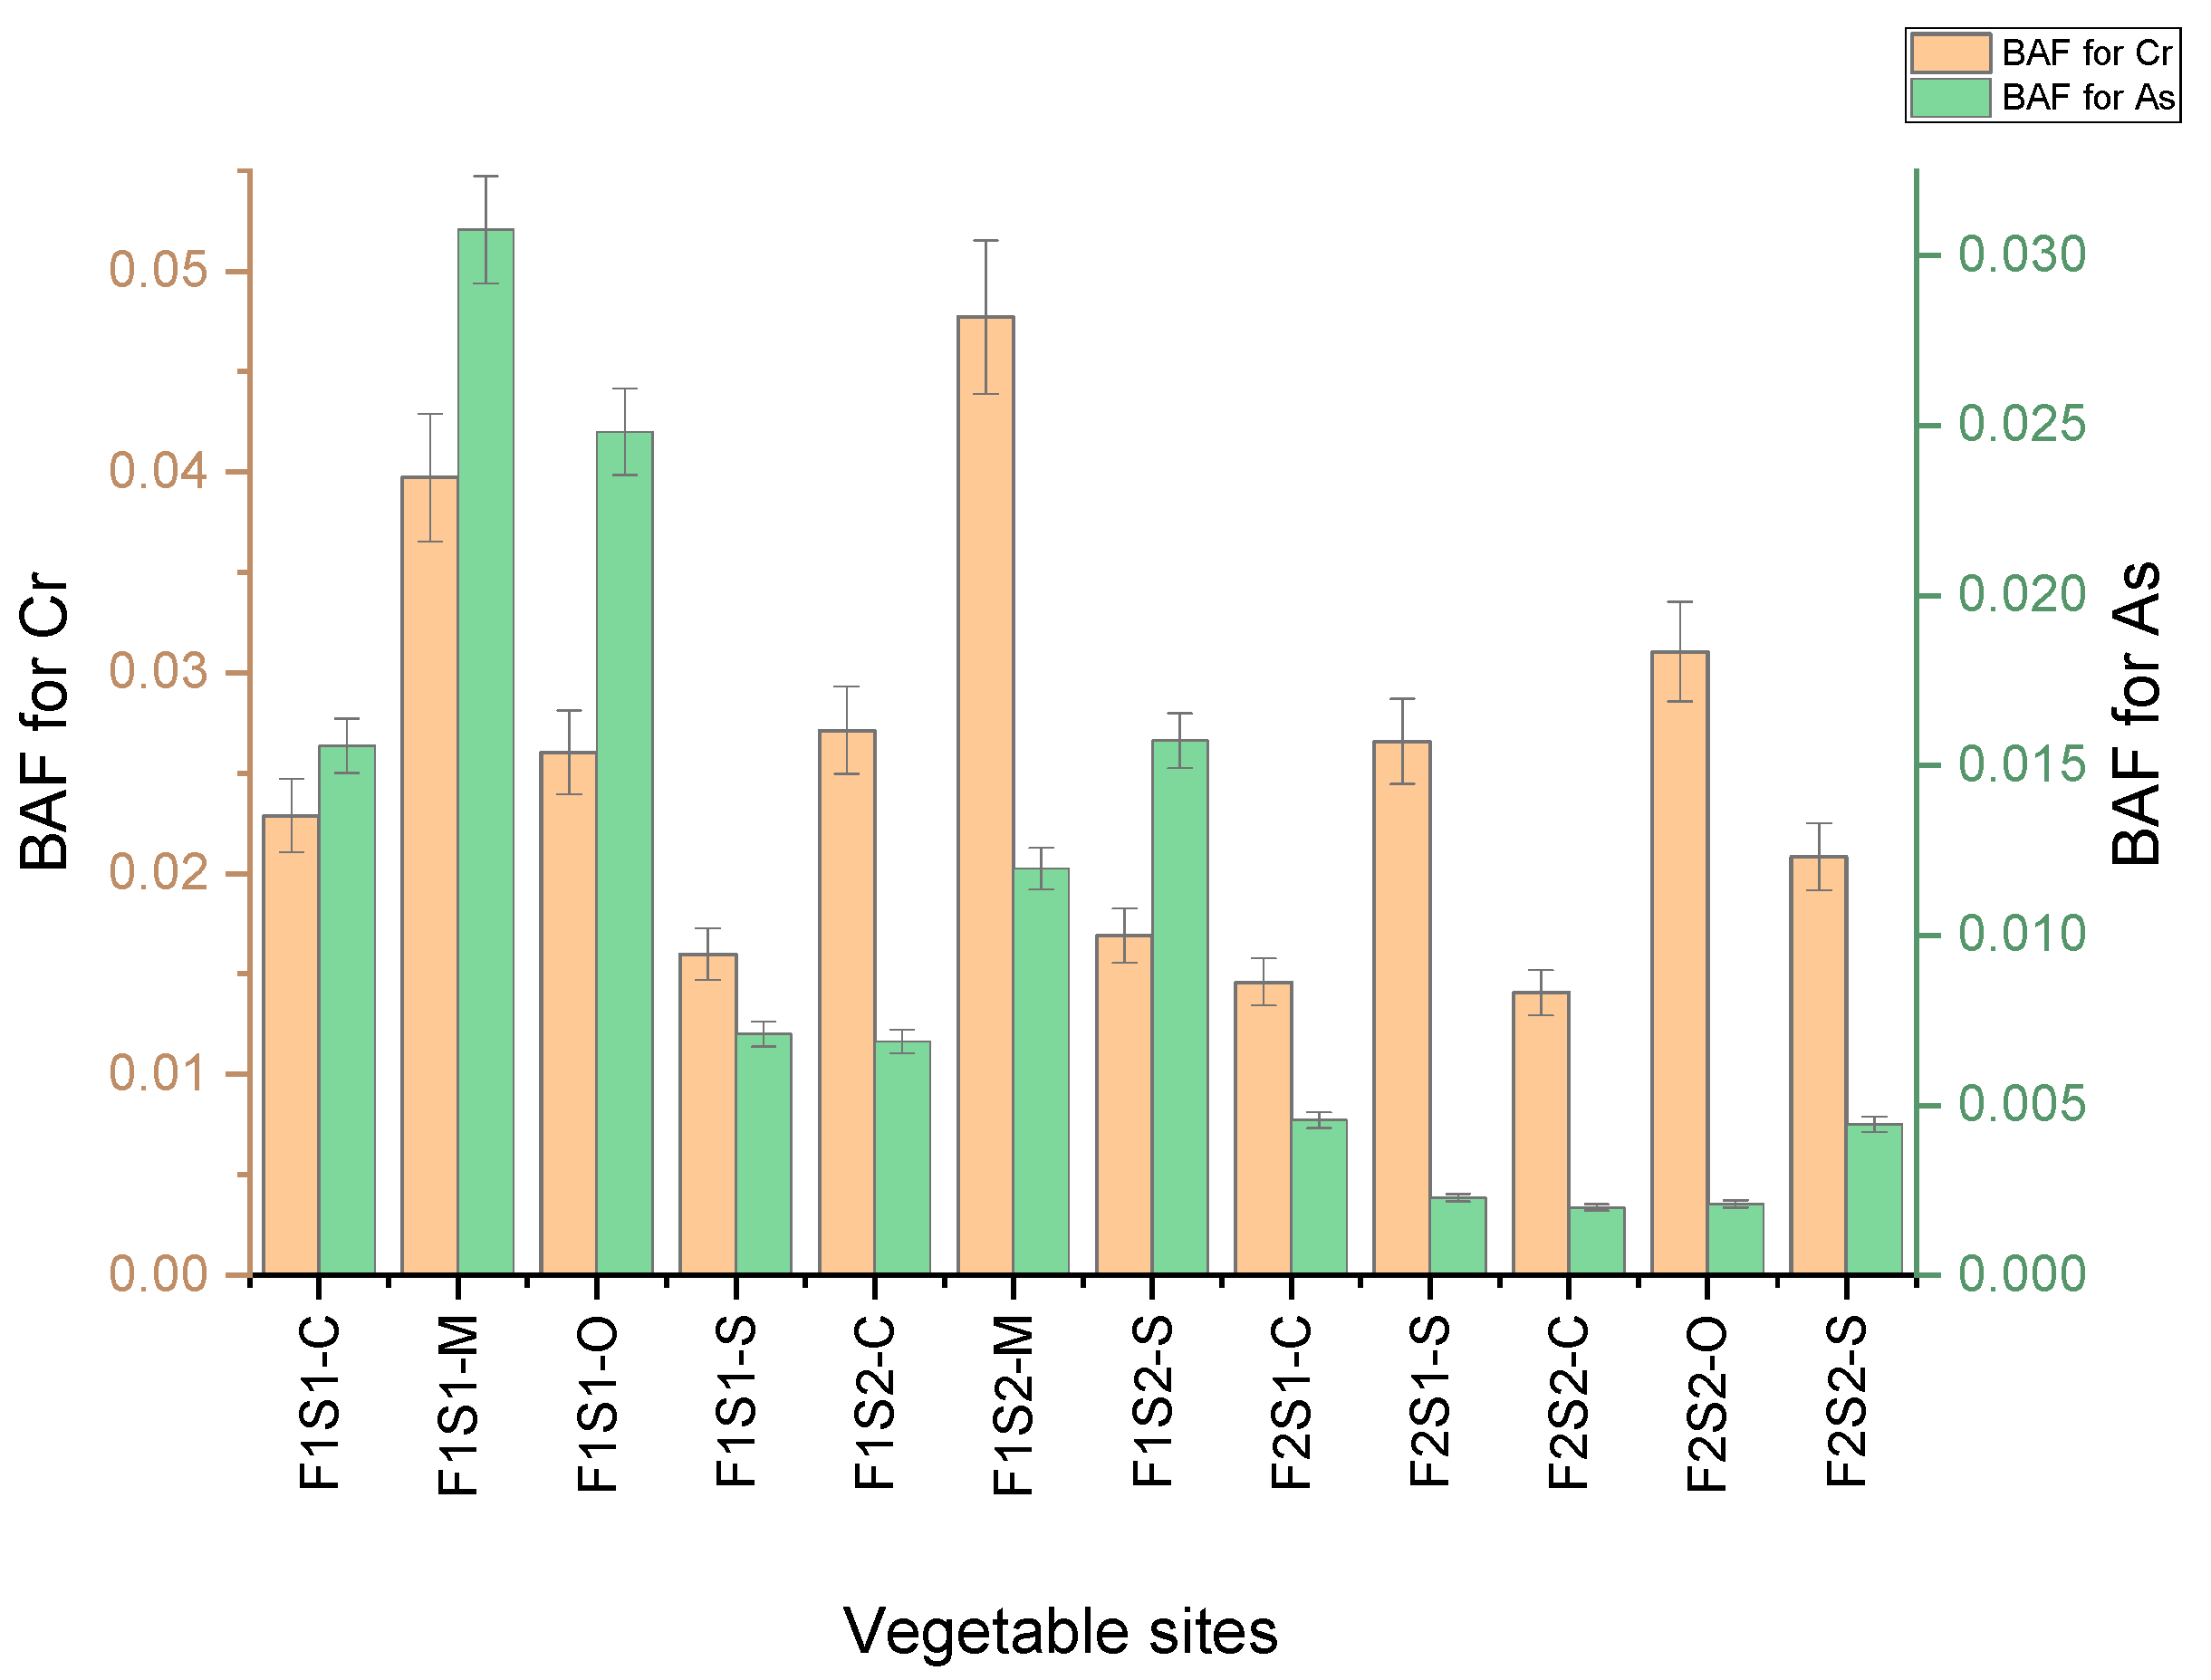
In the high-flow season, most vegetable samples were observed to be unable to accumulate Cr, with spinach from F1S1 and F2S1 being slight accumulators of Cr. For As, vegetable samples of spinach and chomolia in F2S2 and F2S1, respectively, displayed the ability to accumulate As under natural environmental conditions as the BAF was greater than one. The accumulation can be affected by the environmental adaptability of the vegetable. It is suggested that the accumulation might be a result of the vegetables experiencing increased PTE stress that results in the PTE binding to the increased low-methyl-esterified pectins in response to the stress experienced [60,72,73]. The remaining vegetable samples were observed to be incapable of accumulating As while spinach, thepe and chomolia vegetables were slightly accumulating As shown by a BAF greater than 0.1 in Figure 9. In the low-flow season, all vegetable samples were incapable of accumulating both Cr and As, as the BAF was lower than 0.100 for all samples, as shown in Figure 10.

3.10. The Human Health Risk Assessment

3.10.1. Non-Carcinogenic Effects

The HHRA was employed to assess the potential non-carcinogenic health risks of Cr and As from vegetables obtained during the study. Only oral ingestion of Cr and As through vegetables was considered when the HHRA was carried out for both adults and children in this study, to determine whether these PTEs may cause human health risks when the vegetables are consumed [74]. It was assumed that the available vegetables in the farm contributed 100% toward the daily intake of vegetables so as to avoid erroneously underestimating the associated health risk [75,76].

Estimated Daily Intake

Calculations were performed to determine if consuming vegetable samples grown on farms near the Mokolo River would lead to non-carcinogenic risks for human health linked to the consumption of PTEs. These calculations involved determining the EDI and THQ. The outcomes of the EDI are presented in Table 9 and Table 10.
The RfD can be considered an acceptable dose of a substance (Cr and As in this study) that will not produce any harmful effect in a given population’s lifetime [77]. The recommended RfD for Cr is 0.003 mg/kg/day. The EDI in all vegetables for adults and children was observed to exceed the recommended RfD. Therefore, it will harm the population’s health if it does not decrease below the acceptable value. Regarding As, the majority of the EDIs observed exceeded the acceptable RfD of 0.0003 mg/kg/day, with only F1S2-C, F2S1-C and F2S2-C recording EDIs below the RfD. The consumption of these vegetables, as observed with Cr, will result in harmful health effects on the population.
In the low-flow season (Table 10), the recorded EDI values decreased from those observed in the former season. In adults, 58.3% of the vegetable samples (contaminated with Cr) resulted in EDIs greater than the RfD. In contrast, the EDI observed in vegetable samples contaminated with As was below the RfD. There is a great concern in children as most vegetables consumed recorded an EDI greater than the threshold RfD value for Cr and As, which poses a risk of developing harmful health effects amongst children in the population.

Total Hazard Quotient

The non-carcinogenic health risks were estimated using the THQ, and the results are expressed in Table 11.
The hazard quotient for Cr in the high-flow season for adults and children was greater than 1.00 in all vegetable samples and ranged from 1.37 to 10.3 and 6.49 to 48.9 for adults and children, respectively. The highest THQ was observed in thepe obtained from farm 1 in site 4. This is an indication that consumption of the vegetable samples will result in health risks in adults. It will result in serious chronic risks for children as most vegetables have a THQ greater than 10.0 [29]. The THQ for As in vegetables ranged from 0.203 to 3.72 and 0.962 to 17.6 in adults and children, respectively. The THQ for chomolia obtained from F1S2, F2S1 and F2S2 are below 1.00, which indicates that their consumption will have no health risk effects. In contrast, all other vegetable consumption will result in health risk effects in adults. In children, most vegetable samples will have health risk effects with F1S3-C and F2S1-S, resulting in serious chronic risks.
The THQ values observed during the low-flow season (Table 12) are lower than those observed in the high-flow season. In adults, consuming seven vegetables (F1S1-C, F1S1-M, F1S1-O, F1S2-C, F1S2-M, F2S1-S and F2S2-O) will lead to health risks linked to Cr consumption, whereas the remaining vegetables will not result in health risks upon consumption. In children, it was observed that consumption of all the vegetable samples would result in health risk effects, with F1S2-M consumption resulting in chronic health risks associated with Cr exposure. For As, adults’ consumption of vegetables would not have health effects as the THQ is less than 1. In children, the opposite is observed as the consumption of eight vegetable samples (F1S1-C, F1S1-M, F1S1-O, F1S2-C, F1S2-M, F1S2-S, F2S1-C and F2S2-S) will result in health risk effects associated with As consumption, whereas the four remaining vegetable samples (F1S1-S, F2S1-S, F2S2-C and F2S2-O) are safe for consumption.
Overall, the consumption of the vegetables will lead to more health risks in children than in adults. This vulnerability of children has been observed in other studies [78,79]. The susceptibility of children is due to the larger intake of children per kilogram of body weight, which results in a higher dose than adults [80].

3.10.2. Carcinogenic Effects Based on As(III), As(V) and Cr(VI)

Speciation analysis was conducted to determine the toxicity/carcinogenicity because total concentration yielded insufficient information for health risk assessments. This is due to certain species of PTEs being more toxic than others, which cannot be accurately determined from total concentrations studies [81]. Therefore, the evaluation of carcinogenic effects was based on results obtained from speciation studies of As(III), As(V) and Cr(VI). Consumption of a vegetable leads to carcinogenic risks if the threshold ILCR is greater than 10−4. The acceptable ICLR ranged from 10−6 to 10−4, and an ICLR value of less than 10−6 denotes that cancer risks are negligible. The obtained results are presented in Table 13 and Table 14.
In the high-flow season, it was observed that most of the vegetable samples surpassed the recommended threshold risk limit of 1 × 10⁻⁴. This was not the case for F1S2 C (adults: As(III) and As(V)), F1S4 T (adults and children: As(V)), F2S2-C (adults and children: (As(III) and As(V)) and F2S2 (adults: As(V)) as the observed cancer risk value was below the limit indicating that these individual species would have lower chances of cancer risks. Amongst the three species, Cr(VI) displayed a higher cancer risk in the vegetables. The overall cancer risk associated with consuming these vegetables indicated that all these vegetables have a high chance of cancer risk. In adults, the overall cancer risk ranged from 1.92 × 10⁻³ to 3.54 × 10⁻³ in farm 1, whereas it ranged from 1.51 × 10⁻³ to 4.45 × 10⁻³ in farm 2. This means that an excess of 191 to 354 cancer cases per 100,000 adult exposure would occur in farm 1, and 151 to 445 cancer cases per 100,000 adult exposure would occur. In children, 167 cancer cases and 211 cancer cases per 10,000 children exposure would occur if the vegetable with the highest ILCR (F1S2-S and F2S1-S) was consumed from farm 1 and farm 2.
In the low-flow season, a decrease in the cancer risk was observed for adults, particularly with As(III) and As(V), as most samples had a cancer risk less than the threshold. Only F1S1-C and F1S1-M displayed a cancer risk exceeding the As(III) species threshold. Another decrease was observed in children consuming most vegetables containing As(V) species. Regarding As(III), a cancer risk below the threshold was recorded for F1S1-S and F2S2-C. Higher probabilities of cancer risks were observed in adults and children consuming vegetable samples containing Cr(VI), which surpassed the recommended ILCR threshold. The trend of the risk of developing cancer upon consumption of the vegetable was as follows: F2S2-S < F1S1-C < F2S2-O < F2S1-C < F2S1-S < F1S2-C < F1S2-M < F2S2-C < F1S1-O < F1S1-S < F1S1-M. Overall, F1S1-C recorded a high cancer risk of 97 cases per 50,000 adults exposed and 357 cancer cases per 100,000 children in farm 1. In farm 2, it was 83 cases per 50,000 adults exposed and 8 cancer cases per 50,000 children exposed. Overall, all the vegetables, when consumed, led to higher cancer cases observed, with the cancer risk in children being higher than that observed in adults. Amongst the two sampling seasons, more cancer risks were observed in the high-flow season than in the flow season. The average risk for adults and children was determined using vegetables that were present in both seasons such as F1S1-S, F1S2-C, F2S1-C, F2S1-S, F2S2-C and F2S2-S. The greatest risk in adults and children was observed with F2S1-S consumption with 149 cancer cases per 50,000 adults exposed and 469 cancer cases per 40,000 children exposed per year. From the above data, these vegetables’ consumption will result in greater cancer risks in children than in adults which is also observed in similar studies such as that of Bello et al. [82,83]. Cr(VI) is the most dominant carcinogen, and its exposure, as well as that of As species, to the environment should be controlled to save the population from exposure and associated health risks [84].

4. Conclusions

Successful determination of total concentrations (Cr and As) and speciation studies (As(III), As(V), DMA, MMA, Cr(III) and Cr(VI)) were achieved by applying optimized and validated analytical methods for the quantification of analytes in different sample matrices. The results of this study revealed that the water meets the standard for use as total Cr and As were less than the MPLs set by the WHO and DWAF. The As species were identified in soil and vegetable samples. In soil, As species’ presence was associated with chemical transformation by anaerobic bacteria and redox reactions taking place at different sites. Cr(III) was the dominant species in soil compared to Cr(VI), which was also observed in other studies. In vegetables, the total Cr reported surpassed the recommended MPL for both seasons, and the MPL for As was mostly surpassed in the high-flow season.
This study revealed that non-carcinogenic health risks associated with vegetable consumption would be far greater in children than in adults with THQs suggesting that serious chronic risks could be observed. The carcinogenic risk assessment indicated that the probability of higher cancer risks associated with vegetable consumption was 4.73 times more in children than adults. When the assessment was based on the toxic As and Cr species, Cr(VI) had the highest cancer risk. Overall, it was concluded that the consumption of contaminated vegetables could result in high cancer risks for both adults and children. Further studies need to be carried out to explore more PTEs, different exposure pathways and different sources of PTEs in rural areas where farming is the main source of food and livelihood.

Author Contributions

Conceptualization, B.S.D. and A.A.A.; methodology, B.S.D. and M.R.L.; software, B.S.D.; validation, B.S.D., M.R.L. and A.A.A.; formal analysis, B.S.D., M.R.L. and A.A.A.; investigation, B.S.D., M.R.L. and A.A.A.; resources, B.S.D., M.R.L. and A.A.A.; data curation, B.S.D., M.R.L. and A.A.A.; writing—original draft preparation, B.S.D., M.R.L. and A.A.A.; writing—review and editing, M.R.L. and A.A.A.; visualization, M.R.L. and A.A.A.; supervision, A.A.A.; project administration, A.A.A.; funding acquisition, B.S.D. and A.A.A. All authors have read and agreed to the published version of the manuscript.

Funding

This study was funded by the Water Research Commission (WRC) of South Africa, Project Number C2022/2023-00933 and in part by the National Research Foundation (NRF) of South Africa under the Thuthuka Programme, Grant Number 117673, and NRF Grant Number 138922.

Data Availability Statement

All the data used in this study have been reported in the manuscript.

Acknowledgments

We acknowledge the University of Johannesburg Research Centre for Synthesis and Catalysis and Spectrum for the facility.

Conflicts of Interest

The authors declare no conflict of interest.

References

  1. Zayed, A.M.; Terry, N. Chromium in the environment: Factors affecting biological remediation. Plant Soil 2003, 249, 139–156. [Google Scholar] [CrossRef]
  2. Pushkar, B.; Sevak, P.; Parab, S.; Nilkanth, N. Chromium pollution and its bioremediation mechanisms in bacteria: A review. J. Environ. Manag. 2021, 287, 112279. [Google Scholar] [CrossRef]
  3. Pan, L.; Fang, G.; Wang, Y.; Wang, L.; Su, B.; Li, D.; Xiang, B. Potentially toxic element pollution levels and risk assessment of soils and sediments in the upstream river, miyun reservoir, china. Int. J. Environ. Res. Public Health 2018, 15, 2364. [Google Scholar] [CrossRef] [PubMed] [Green Version]
  4. Nde, S.C.; Mathuthu, M. Assessment of Potentially Toxic Elements as Non-Point Sources of Contamination in the Upper Crocodile Catchment Area, North-West Province, South Africa. Int. J. Environ. Res. Public Health 2018, 15, 576. [Google Scholar] [CrossRef] [Green Version]
  5. Baghaie, A.H.; Fereydoni, M. The potential risk of heavy metals on human health due to the daily consumption of vegetables. Environ. Health Eng. Manag. 2019, 6, 11–16. [Google Scholar] [CrossRef]
  6. Ahmadi, A.; Foroutan, R.; Esmaeili, H.; Tamjidi, S. The role of bentonite clay and bentonite clay@MnFe2O4 composite and their physico-chemical properties on the removal of Cr(III) and Cr(VI) from aqueous media. Environ. Sci. Pollut. Res. 2020, 27, 14044–14057. [Google Scholar] [CrossRef]
  7. Li, J.; Liu, J.; Liu, Y.; Guo, J. Research on the adsorption of Cr3+ and Cr6+ by the cracked products of β-cyclodextrin. IOP Conf. Ser. Earth Environ. Sci. 2020, 508, 12159. [Google Scholar] [CrossRef]
  8. Ramjukadh, C.L.; Silberbauer, M.; Taljaard, S. An anomaly in pH data in South Africa’s national water quality monitoring database—Implications for future use. Water SA 2018, 44, 760–763. [Google Scholar] [CrossRef] [Green Version]
  9. Chen, H.Y.; Chen, C. Evaluation of Calibration Equations by Using Regression Analysis: An Example of Chemical Analysis. Sensors 2022, 22, 447. [Google Scholar] [CrossRef]
  10. Thi Hue, N.; Van Hop, N.; Thai Long, H.; Hai Phong, N.; Uyen, T.H.; Quoc Hung, L.; Nhi Phuong, N. Determination of Chromium in Natural Water by Adsorptive Stripping Voltammetry Using in Situ Bismuth Film Electrode. J. Environ. Public Health 2020, 2020, 1347836. [Google Scholar] [CrossRef]
  11. Baig, J.A.; Kazi, T.G.; Shah, A.Q.; Kandhro, G.A.; Afridi, H.I.; Arain, M.B.; Jamali, M.K.; Jalbani, N. Speciation and evaluation of Arsenic in surface water and groundwater samples: A multivariate case study. Ecotoxicol. Environ. Saf. 2010, 73, 914–923. [Google Scholar] [CrossRef] [PubMed]
  12. Jang, Y.-C.; Somanna, Y.; Kim, H. Source, Distribution, Toxicity and Remediation of Arsenic in the Environment—A review. Int. J. Appl. Environ. Sci. 2016, 11, 973–6077. [Google Scholar]
  13. Genthe, B.; Kapwata, T.; Le Roux, W.; Chamier, J.; Wright, C.Y. The reach of human health risks associated with metals/metalloids in water and vegetables along a contaminated river catchment: South Africa and Mozambique. Chemosphere 2018, 199, 1–9. [Google Scholar] [CrossRef] [PubMed] [Green Version]
  14. Juhasz, A.L.; Smith, E.; Weber, J.; Rees, M.; Rofe, A.; Kuchel, T.; Sansom, L.; Naidu, R. In vivo assessment of arsenic bioavailability in rice and its significance for human health risk assessment. Environ. Health Perspect. 2006, 114, 1826–1831. [Google Scholar] [CrossRef] [PubMed] [Green Version]
  15. Oosthuizen, M.; Wright, C.; Matooane, M.; Phala, N. Human health risk assessment of airborne metals to a potentially exposed community: A screening exercise. Clean Air J. 2015, 25, 51–57. [Google Scholar] [CrossRef]
  16. Li, Z.; Ma, Z.; van der Kuijp, T.J.; Yuan, Z.; Huang, L. A review of soil heavy metal pollution from mines in China: Pollution and health risk assessment. Sci. Total Environ. 2014, 468–469, 843–853. [Google Scholar] [CrossRef]
  17. World Health Organization. WHO Human Health Risk Assessment Toolkit: Chemical Hazards; IPCS Harmonization Project Document Xv; World Health Organization: Geneva, Switzerland, 2010. [Google Scholar]
  18. Ali, M.A.; Badruzzaman, A.B.M.; Jalil, M.A.; Hossain, M.D.; Ahmed, M.F.; Masud, A.A.K.; Kamruzzaman, M. Fate of Arsenic in the Environment. In Arsenic Contamination: Bangladesh Perspective; Ahmed, M.F., Ed.; ITN-Bangladesh: Dhaka, Bangladesh, 2003; pp. 7–8. [Google Scholar]
  19. Ma, H.W.; Hung, M.L.; Chen, P.C. A systemic health risk assessment for the chromium cycle in Taiwan. Environ. Int. 2007, 33, 206–218. [Google Scholar] [CrossRef]
  20. Letsoalo, M.R.; Godeto, T.W.; Magadzu, T.; Ambushe, A.A. Quantitative Speciation of Arsenic in Water and Sediment Samples from the Mokolo River in Limpopo Province, South Africa. Anal. Lett. 2018, 51, 2761–2775. [Google Scholar] [CrossRef]
  21. Cui, W.; Meng, Q.; Feng, Q.; Zhou, L.; Cui, Y.; Li, W. Occurrence and release of cadmium, chromium, and lead from stone coal combustion. Int. J. Coal Sci. Technol. 2019, 6, 586–594. [Google Scholar] [CrossRef] [Green Version]
  22. Mekonnen, K.N.; Ambushe, A.A.; Chandravanshi, B.S.; Redi-Abshiro, M. Assessment of potentially toxic elements in Swiss chard and sediments of Akaki River, Ethiopia. Toxicol. Environ. Chem. 2015, 96, 1501–1515. [Google Scholar] [CrossRef]
  23. Letsoalo, M.R.; Mamo, M.A.; Ambushe, A.A. Simultaneous quantitative speciation of selected toxic elements in water using high performance liquid chromatography coupled to inductively coupled plasma-mass spectrometry (HPLC-ICP-MS). Phys. Chem. Earth Parts A/B/C 2021, 124, 103011. [Google Scholar] [CrossRef]
  24. Onyedikachi, U.B.; Belonwu, C.D.; Wegwu, M.O. Health Risk Assessment of Chromium, Manganese and Arsenic through the Consumption of Food from Industrial Areas in South Eastern States of Nigeria. Annu. Res. Rev. Biol. 2019, 31, 1–20. [Google Scholar] [CrossRef]
  25. Sharma, S. Das Risk assessment via oral and dermal pathways from heavy metal polluted water of Kolleru lake—A Ramsar wetland in Andhra Pradesh, India. Environ. Anal. Health Toxicol. 2020, 35, 1–11. [Google Scholar] [CrossRef]
  26. Ritchie, H.; Rosado, P.; Roser, M. Diet Compositions. 2017. Available online: https://ourworldindata.org/diet-compositions (accessed on 21 August 2021).
  27. Amwele, H.R.; Motsei, L.; Kalumbu, G.; Kgabi, N.; Limen Njinga, R.; Tshivhase, V.M. Investigation of possible human exposure to metals concentration in vegetables. J. Toxicol. Environ. Health Sci. Full Length Res. Pap. 2017, 9, 66–72. [Google Scholar] [CrossRef] [Green Version]
  28. Department of Environmental Affairs (DEA). Framework for the Management of Contaminated Land; Department of Environmental Affairs (DEA): Pretoria, South Africa, 2010.
  29. Fakhri, Y.; Mousavi Khaneghah, A.; Hadiani, M.R.; Keramati, H.; Hosseini Pouya, R.; Moradi, B.; da Silva, B.S. Non-carcinogenic risk assessment induced by heavy metals content of the bottled water in Iran. Toxin Rev. 2017, 36, 313–321. [Google Scholar] [CrossRef]
  30. Edlund, K.K.; Killman, F.; Molnár, P.; Boman, J.; Stockfelt, L.; Wichmann, J. Health Risk Assessment of PM2.5 and PM2.5-Bound Trace Elements in Thohoyandou, South Africa. Int. J. Environ. Res. Public Health 2021, 18, 1359. [Google Scholar] [CrossRef] [PubMed]
  31. Lorenc, W.; Markiewicz, B.; Kruszka, D.; Kachlicki, P.; Barałkiewicz, D. Study on speciation of As, Cr, and Sb in bottled flavored drinking water samples using advanced analytical techniques IEC/SEC-HPLC/ICP-DRC-MS and ESI-MS/MS. Molecules 2019, 24, 668. [Google Scholar] [CrossRef] [Green Version]
  32. US_EPA Data Validation Standard Operating Procedures for Contract Laboratory Program US-EPA, Region 4, SESD, Athens, Georgia Inorganic Data By Inductively Coupled Plasma—Atomic Emission Spectroscopy and Inductively Coupled Plasma—Mass Spectroscopy. 2011; pp. 1–35. Available online: https://www.epa.gov/quality/data-validation-standard-operating-procedures-contract-laboratory-program-routine (accessed on 14 March 2022).
  33. Tiwari, G.; Tiwari, R. Bioanalytical method validation: An updated review. Pharm. Methods 2010, 1, 25. [Google Scholar] [CrossRef]
  34. King, M. Correlation and regression. In Fisheries Biology, Assessment and Management; John Wiley & Sons, Ltd.: Oxford, UK, 2016. [Google Scholar] [CrossRef]
  35. Mattusch, J.; Wennrich, R.; Schmidt, A.C.; Reisser, W. Determination of arsenic species in water, soils and plants. Fresenius J. Anal. Chem. 2000, 366, 200–203. [Google Scholar] [CrossRef]
  36. Leśniewska, B.; Gontarska, M.; Godlewska-Żyłkiewicz, B. Selective Separation of Chromium Species from Soils by Single-Step Extraction Methods: A Critical Appraisal. Water. Air. Soil Pollut. 2017, 228, 274. [Google Scholar] [CrossRef] [Green Version]
  37. Moldoveanu, S.C.; David, V. Parameters that Characterize HPLC Analysis. Essentials Mod. HPLC Sep. 2013, 53–83. [Google Scholar] [CrossRef]
  38. Robards, K.; Ryan, D. Analyses. In Principles and Practice of Modern Chromatographic Methods; Academic Press: Cambridge, MA, USA, 2022. [Google Scholar] [CrossRef]
  39. Letsoalo, M.R.; Mamo, M.A.; Ambushe, A.A. Synchronous Extraction and Quantitative Speciation of Arsenic and Chromium in Sediments by High-Performance Liquid Chromatography—Inductively Coupled Plasma—Mass Spectrometry (HPLC-ICP-MS). Anal. Lett. 2021, 54, 1943–1967. [Google Scholar] [CrossRef]
  40. Low, G.K.C.; Batley, G.E.; Buchanan, S.J. Interference of chloride in the speciation of arsenic by ion chromatography. Chromatographia 1986, 22, 292–298. [Google Scholar] [CrossRef]
  41. Department of Water Affairs and Forestry (DWAF). South African Water Quality Guidelines, 2nd ed.; Domestic Use; Department of Water Affairs and Forestry: Pretoria, South Africa, 1996; Volume 1.
  42. World Health Organization. Guidelines for Drinking-Water Quality, 4th ed.; World Health Organization: Geneva, Switzerland, 2011. [Google Scholar]
  43. SANS South African National Standard 241-1; Drinking water. Part 1: Microbiological, Physical, Aesthetic and Chemical Determinands. South African Bureau of Standards (SABS) Standards Division: Pretoria, South Africa, 2015.
  44. Department of Water Affairs and Forestry (DWAF). South African Water Quality Guidelines, 2nd ed.; Agricultural Use: Irrigation; Department of Water Affairs and Forestry: Pretoria, South Africa, 1996; Volume 4.
  45. Sankhla, M.S.; Kumar, R.; Prasad, L. Seasonal variations of lead and chromium concentrations in the water samples from yamuna river in Delhi, India. Iran. J. Toxicol. 2021, 15, 109–114. [Google Scholar] [CrossRef]
  46. Edokpayi, J.N.; Odiyo, J.O.; Popoola, E.O.; Msagati, T.A.M. Evaluation of temporary seasonal variation of heavy metals and their potential ecological risk in Nzhelele River, South Africa. Open Chem. 2017, 15, 272–282. [Google Scholar] [CrossRef]
  47. Loock, M.M.; Beukes, J.P.; van Zyl, P.G. A survey of Cr(VI) contamination of surface water in the proximity of ferrochromium smelters in South Africa. Water SA 2014, 40, 709–716. [Google Scholar] [CrossRef] [Green Version]
  48. Canadian Council of Ministers of the Environment (CCME). Canadian Council of Ministers of the Environment (CCME). Canadian soil quality guidelines for the protection of environmental and human health: Chromium (total 1997) (VI 1999). In Canadian Environmental Quality Guidelines, 1999; Canadian Council of Ministers of the Environment: Winnipeg, MB, Canada, 2007. [Google Scholar]
  49. Srivastava, V.; Sarkar, A.; Singh, S.; Singh, P.; de Araujo, A.S.F.; Singh, R.P. Agroecological responses of heavy metal pollution with special emphasis on soil health and plant performances. Front. Environ. Sci. 2017, 5, 64. [Google Scholar] [CrossRef] [Green Version]
  50. Kinuthia, G.K.; Ngure, V.; Beti, D.; Lugalia, R.; Wangila, A.; Kamau, L. Levels of heavy metals in wastewater and soil samples from open drainage channels in Nairobi, Kenya: Community health implication. Sci. Rep. 2020, 10, 8434. [Google Scholar] [CrossRef]
  51. Lombard, M.A.; Daniel, J.; Jeddy, Z.; Hay, L.E.; Ayotte, J.D. Assessing the Impact of Drought on Arsenic Exposure from Private Domestic Wells in the Conterminous United States. Environ. Sci. Technol. 2021, 55, 1822–1831. [Google Scholar] [CrossRef]
  52. Canadian Council of Ministers of the Environment (CCME). Canadian Soil Quality Guidelines for the Protection of Environmental and Human Health—Canadian Environmental Quality Guidelines; Canadian Council of Ministers of the Environment: Winnipeg, MB, Canada, 1999.
  53. Kumar, B.L.; Gopal, D.V.R.S. Effective role of indigenous microorganisms for sustainable environment. 3 Biotech 2015, 5, 867–876. [Google Scholar] [CrossRef] [Green Version]
  54. Kamal, M.Z.U.; Miah, M.Y. Arsenic Speciation Techniques in Soil Water and Plant: An Overview. In Arsenic Monitoring, Removal and Remediation; IntechOpen: London, UK, 2021. [Google Scholar] [CrossRef]
  55. Moreno-Jiménez, E.; Esteban, E.; Peñalosa, J.M. The fate of arsenic in soil-plant systems. In Reviews of Environmental Contamination and Toxicology; Springer: New York, NY, USA, 2012; Volume 215, pp. 1–37. [Google Scholar] [CrossRef] [Green Version]
  56. Owolabi, I.A.; Mandiwana, K.L.; Panichev, N. Speciation of chromium and vanadium in medicinal plants. S. Afr. J. Chem. 2016, 69, 67–71. [Google Scholar] [CrossRef] [Green Version]
  57. Xiao, W.; Zhang, Y.; Li, T.; Chen, B.; Wang, H.; He, Z.; Yang, X. Reduction Kinetics of Hexavalent Chromium in Soils and Its Correlation with Soil Properties. J. Environ. Qual. 2012, 41, 1452–1458. [Google Scholar] [CrossRef] [PubMed] [Green Version]
  58. Venter, A.D.; Beukes, J.P.; Gideon van Zyl, P.; Josipovic, M.; Jaars, K.; Vakkari, V. Regional atmospheric Cr(VI) pollution from the Bushveld Complex, South Africa. Atmos. Pollut. Res. 2016, 7, 762–767. [Google Scholar] [CrossRef] [Green Version]
  59. Ontario Ministry of Environment (OME). Rules For Soil Management and Excess Soil Quality Standards; Queen’s Printer for Ontario: Toronto, ON, Canada, 2020.
  60. Fonge, B.A.; Larissa, M.T.; Egbe, A.M.; Afanga, Y.A.; Fru, N.G.; Ngole-Jeme, V.M. An assessment of heavy metal exposure risk associated with consumption of cabbage and carrot grown in a tropical Savannah region. Sustain. Environ. 2021, 7, 1–19. [Google Scholar] [CrossRef]
  61. Department of Health. Foodstuffs, Cosmetics and Disinfectants Act: Regulations: Maximum Levels of Metals in Foodstuffs (English/Setswana); Department of Health: Pretoria, South Africa, 2018.
  62. NHFPC/CHFA. National Food Safety Standard of Maximum Levels of Contaminants in Foods; Global Agricultural Information Network: Beijing China, 2017. [Google Scholar]
  63. Joint FAO/WHO Codex Alimentarius Commission; Joint FAO/WHO Food Standards Programme; WHO. Codex Alimentarius Commission: Procedural Manual; Electronic Publishing Policy and Support Branch: Rome, Italy, 2007. [Google Scholar]
  64. Laizu, J. Speciation of arsenic in vegetables and their correlation with inorganic phosphate level. Bangladesh J. Pharmacol. 2008, 2, 88–94. [Google Scholar] [CrossRef]
  65. Signes-Pastor, A.J.; Mitra, K.; Sarkhel, S.; Hobbes, M.; Burló, F.; De Groot, W.T.; Carbonell-Barrachina, A.A. Arsenic speciation in food and estimation of the dietary intake of inorganic arsenic in a rural village of West Bengal, India. J. Agric. Food Chem. 2008, 56, 9469–9474. [Google Scholar] [CrossRef]
  66. EFSA, E. Scientific Opinion on Arsenic in Food. Sci. Opin. Arsen. Food EFSA J. 2009, 7, 1351–1355. [Google Scholar] [CrossRef]
  67. Gezahegn, A.M.; Feyessa, F.F.; Tekeste, E.A.; Beyene, E.M. Chromium Laden Soil, Water, and Vegetables nearby Tanning Industries: Speciation and Spatial Distribution. J. Chem. 2021, 2021, 1–10. [Google Scholar] [CrossRef]
  68. Wilbur, S.; Abadin, H.; Fay, M.; Yu, D.; Tencza, B.; Ingerman, L. Toxicological Profile for Chromium. Atlanta (GA): US Department of Health and Human Services; Public Health Service, Agency for Toxic Substances and Disease Registry: Atlanta, GA, USA, 2012.
  69. Benford, D.; Ceccatelli, S.; Cottrill, B.; DiNovi, M.; Dogliotti, E.; Edler, L.; Farmer, P.; Fürst, P.; Hoogenboom, L.; Katrine Knutsen, H.; et al. Scientific Opinion on the risks to public health related to the presence of chromium in food and drinking water. EFSA J. 2014, 12, 3595. [Google Scholar] [CrossRef]
  70. Koleli, N.; Demir, A.; Kantar, C.; Atag, G.A.; Kusvuran, K.; Binzet, R. Heavy Metal Accumulation in Serpentine Flora of Mersin-Findikpinari (Turkey)—Role of Ethylenediamine Tetraacetic Acid in Facilitating Extraction of Nickel. Soil Remediat. Plants Prospect. Chall. 2015, 629–659. [Google Scholar] [CrossRef]
  71. Huang, W.L.; Chang, W.H.; Cheng, S.F.; Li, H.Y.; Chen, H.L. Potential risk of consuming vegetables planted in soil with lead and cadmium and the influence on vegetable antioxidant activity. Appl. Sci. 2021, 11, 3761. [Google Scholar] [CrossRef]
  72. Busato, B.; de Almeida Abreu, E.C.; de Oliveira Petkowicz, C.L.; Martinez, G.R.; Rodrigues Noleto, G. Pectin from Brassica oleracea var. italica triggers immunomodulating effects in vivo. Int. J. Biol. Macromol. 2020, 161, 431–440. [Google Scholar] [CrossRef] [PubMed]
  73. Perrone, P.; Hewage, C.M.; Thomson, A.R.; Bailey, K.; Sadler, I.H.; Fry, S.C. Patterns of methyl and O-acetyl esterification in spinach pectins: New complexity. Phytochemistry 2002, 60, 67–77. [Google Scholar] [CrossRef]
  74. Alsafran, M.; Usman, K.; Rizwan, M.; Ahmed, T.; Al Jabri, H. The Carcinogenic and Non-Carcinogenic Health Risks of Metal(oid)s Bioaccumulation in Leafy Vegetables: A Consumption Advisory. Front. Environ. Sci. 2021, 9, 380. [Google Scholar] [CrossRef]
  75. Barbillon, A.; Aubry, C.; Nold, F.; Besancon, S.; Manouchehri, N. Health Risks Assessment in Three Urban Farms of Paris Region for Different Scenarios of Urban Agricultural Users: A Case of Soil Trace Metals Contamination. Agric. Sci. 2019, 10, 352–370. [Google Scholar] [CrossRef] [Green Version]
  76. WHO/IPCS. Dietary Exposure Assessment of Chemicals in Food. In Principles and Methods for the Risk Assessment of Chemicals in Food, International Programme on Chemical Safety; Environmental Health Criteria: Geneva, Switzerland, 2009; Volume 240. [Google Scholar]
  77. Taylor, A.A.; Tsuji, J.S.; McArdle, M.E.; Adams, W.J.; Goodfellow, W.L. Recommended Reference Values for Risk Assessment of Oral Exposure to Copper. Risk Anal. 2022, 43, 211–218. [Google Scholar] [CrossRef]
  78. Duan, B.; Zhang, W.; Zheng, H.; Wu, C.; Zhang, Q.; Bu, Y. Comparison of Health Risk Assessments of Heavy Metals and As in Sewage Sludge from Wastewater Treatment Plants (WWTPs) for Adults and Children in the Urban District of Taiyuan, China. Int. J. Environ. Res. Public Health 2017, 14, 1194. [Google Scholar] [CrossRef] [Green Version]
  79. Ssemugabo, C.; Bradman, A.; Ssempebwa, J.C.; Sillé, F.; Guwatudde, D. An assessment of health risks posed by consumption of pesticide residues in fruits and vegetables among residents in the Kampala Metropolitan Area in Uganda. Int. J. Food Contam. 2022, 9, 4. [Google Scholar] [CrossRef]
  80. Pronczuk-Garbino, J. Childrens Health and the Environment: A Global Perspective. Int. J. Health Care Qual. Assur. 2006, 19, 3–4. [Google Scholar]
  81. Tchounwou, P.B.; Yedjou, C.G.; Patlolla, A.K.; Sutton, D.J. Heavy metal toxicity and the environment. Mol. Clin. Environ. Toxicol. 2012, 101, 133–164. [Google Scholar] [CrossRef] [Green Version]
  82. Bello, S.; Nasiru, R.; Garba, N.N.; Adeyemo, D.J. Carcinogenic and non-carcinogenic health risk assessment of heavy metals exposure from Shanono and Bagwai artisanal gold mines, Kano state, Nigeria. Sci. Afr. 2019, 6, e00197. [Google Scholar] [CrossRef]
  83. Zhang, W.; Chen, Y.; Qi, Y.; Hong, C. Seasonal variations of mercury levels and human health risk in vegetables from Arid Oasis (Shihezi city), Xinjiang, Northwest China. Hum. Ecol. Risk Assess. 2018, 24, 122–136. [Google Scholar] [CrossRef]
  84. Sultana, M.S.; Rana, S.; Yamazaki, S.; Aono, T.; Yoshida, S. Health risk assessment for carcinogenic and non-carcinogenic heavy metal exposures from vegetables and fruits of Bangladesh. Cogent Environ. Sci. 2017, 3, 1–17. [Google Scholar] [CrossRef]
Figure 1. A map showing all the sampling sites for water along the Mokolo River and the sampling sites for water, soil and vegetables in the neighboring farms.
Minerals 13 00930 g001
Figure 2. Chromatogram showing the separation and retention times of As and Cr species from a 20 µg/L multi-species standard. The peaks and retention times were identified: (1) As(III) 3.5 min; (2) DMA 5.7 min; (3) MMA 8.7 min; (4) As(V) 10.6 min; and (5) Cr(VI) 14.7 min.
Minerals 13 00930 g002
Figure 3. Total Cr concentrations observed in both high- and low-flow seasons for water samples.
Minerals 13 00930 g003
Figure 4. Total concentrations observed for As in both high-flow and low-flow seasons for water samples.
Minerals 13 00930 g004
Figure 5. Total concentrations of Cr in soil samples in high- and low-flow seasons.
Minerals 13 00930 g005
Figure 6. Total concentrations of As in soil samples for high- and low-flow seasons.
Minerals 13 00930 g006
Figure 7. Total concentrations of Cr in vegetable samples for high- and low-flow seasons.
Minerals 13 00930 g007
Figure 8. Total concentrations of As in vegetable samples for high- and low-flow seasons.
Minerals 13 00930 g008
Figure 9. Graphical representation of BAF observed in vegetable samples during high-flow season for Cr and As.
Minerals 13 00930 g009
Figure 10. Graphical representation of BAF observed in vegetable samples during low-flow season for Cr and As.
Minerals 13 00930 g010
Table 1. Operating conditions for HPLC-ICP-MS.
ParameterSetting
Analytical column Hamilton PRP-X100
Column dimension4.6 mm × 250 mm, 5 µm
Guard column4.6 mm × 150 mm, PEEK
Pump flow rate1 mL/min
Pump pressure2520 psi
Injection volume100 µL
Mobile phase ANH4NO3 (10 mM) and NH4H2PO4 (0.5 mM) at pH 8.7
Mobile phase BNH4NO3 (70 mM) at pH 8.7
Nebulizer gas flow1.18 L/min
Auxiliary has flow1.20 L/min
Plasma gas flow15 L/min
ICP RF power1450 V
Lens voltage12
Table 2. Parameters employed for the HHRA.
ParameterUnitAdultChildrenAdultChildren
FIR [26]g/person/day114.17114.17114.17114.17
EFdays/year365 [27]350 [28]365350
EDyear30 [27]6 [28]306
RfD [27,29]mg/kg/day0.0030.0030.00030.0003
ABW [30]kg68.113.868.113.8
ATdays/year10950 [27]2190 [28]109502190
Table 3. The LODs and LOQs determined for total concentration methods of water, soil and vegetables along with certified values and measured values of SRMs 1640a, 2709a and 1573a, respectively.
SampleAnalyteLODLOQCertified ValueMeasured ValuePercentage Recovery (%)
WaterCr (µg/L)0.1930.64340.2 ± 0.2840.5 ± 1.7101
As (µg/L)0.1170.3908.08 ± 0.0708.70 ± 0.19108
SoilCr (ng/g)2.939.77130 ± 4.0130 ± 15100
As (ng/g)0.9423.1410.5 ± 0.3010.1 ± 0.9596.3
VegetableCr (ng/g)1.304.331.99 ± 0.0342.13 ± 0.16107
As (ng/g)0.4181.390.113 ± 0.00240.131 ± 0.011116
Table 4. LOD, LOQ and percentage recoveries for soil and vegetables spiked at 3× and 20× LOQ.
SamplesAnalyteLOD
(ng/g)
LOQ
(ng/g)
Measured Concentration at
3 × LOQ (ng/g)
Measured Concentration at 20 × LOQ (ng/g)Percentage
Recovery
(3 × LOQ) (%)
Percentage Recovery
(20 × LOQ) (%)
SoilAs(III)0.1610.53726.3 ± 0.9030.4 ± 3.399.285.3
DMA0.4531.51237 ± 22245 ± 2810395.5
MMA0.3431.14109 ± 9.2116 ± 3.0114101
As(V)1.595.30188 ± 8.5241 ± 1810891.6
Cr(VI)0.6702.23120 ± 7.5177 ± 1698.1110
VegetableAs(III)0.1520.50767.7 ± 3.264.2 ± 6.110387.8
DMA0.09320.31166.2 ± 4.966.8 ± 5.610498.0
MMA1.354.5055.4 ± 5.3129 ± 8.397.6104
As(V)0.4581.53117 ± 10123 ± 6.910994.1
Cr(VI)0.5981.991030 ± 741130 ± 47105113
Table 5. Concentrations of As(III), DMA, MMA, As(V), Cr(VI) and Cr(III) recorded in soil during the high-flow season.
SoilAs(III)
(ng/g)
DMA
(ng/g)
MMA
(ng/g)
As(V)
(ng/g)
Cr(VI)
(ng/g)
Cr (III)
(ng/g)
F1S12010 ± 1971.79 ± 0.15<0.343868 ± 69235 ± 152740 ± 250
F1S2241 ± 19348 ± 251200 ± 201190 ± 1002120 ± 170949 ± 77
F1S33960 ± 24020,600 ± 5303110 ± 1504850 ± 3503000 ± 17030,500 ± 1800
F1S424.9 ± 1.3226 ± 2092.0 ± 8.4158 ± 0.30116 ± 10385 ± 33
F2S1359 ± 22<0.45371.4 ± 0.13<1.59236 ± 22284 ± 26
F2S21.51 ± 0.08843.4 ± 0.620.471 ± 0.053<1.5911.2 ± 0.9934.1 ± 3.0
Table 6. Concentrations of As(III), DMA, MMA, As(V), Cr(VI) and Cr(III) recorded in soil during the low-flow season.
SoilAs(III)
(ng/g)
DMA
(ng/g)
MMA
(ng/g)
As(V)
(ng/g)
Cr(VI)
(ng/g)
Cr (III)
(ng/g)
F1S1373 ± 16860 ± 18438 ± 121130 ± 432260 ± 47635 ± 13
F1S2452 ± 462560 ± 2201070 ± 592570 ± 1902200 ± 734540 ± 14
F2S1<0.1616550 ± 3601160 ± 651330 ± 1602890 ± 1206150 ± 250
F2S21600 ± 712490 ± 1501390 ± 1403570 ± 1202370 ± 596770 ± 170
Table 7. Concentrations of As(III), DMA, MMA, As(V), Cr(VI) and Cr(III) recorded during the high-flow season in vegetable samples.
VegetableAs(III)
(ng/g)
DMA
(ng/g)
MMA
(ng/g)
As(V)
(ng/g)
Cr(VI)
(ng/g)
Cr (III)
(ng/g)
F1S1-S63.0 ± 5.862.0 ± 0.5234.3 ± 0.1999.8 ± 6.7963 ± 5715,000 ± 840
F1S2-C25.6 ± 0.6540.1 ± 3.135.3 ± 0.738.97 ± 0.51722 ± 623820 ± 330
F1S2-P67.5 ± 6.5<0.093234.3 ± 0.8792.3 ± 4.1602 ± 197780 ± 250
F1S2-S49.1 ± 2.5<0.093261.3 ± 6.6262 ± 6.71090 ± 5510,200 ± 520
F1S3-C189 ± 4.3131 ± 6.8292 ± 3.648.9 ± 4.2731 ± 241850 ± 60
F1S3-S160 ± 11<0.093270.7 ± 8.795.7 ± 4.5764 ± 405930 ± 310
F1S4-T100 ± 1.4119 ± 6.1107 ± 3.51.05 ± 0.090956 ± 4017,400 ± 740
F2S1-C16.1 ± 1.553.4 ± 3.19.48 ± 0.36<0.4581060 ± 871960 ± 120
F2S1-S502 ± 31<0.0932<1.3581.3 ± 3.51180 ± 979220 ± 480
F2S2-C1.55 ± 0.15<0.093231.7 ± 0.240.91 ± 0.070594 ± 181850 ± 55
F2S2-S54.7 ± 1.2153 ± 0.09527.7 ± 1.812.1 ± 0.91962 ± 8811,100 ± 1000
Table 8. Concentrations of As(III), DMA, MMA, As(V), Cr(VI) and Cr(III) recorded during the low-flow season in vegetable samples.
VegetablesAs(III)
(ng/g)
DMA
(ng/g)
MMA
(ng/g)
As(V)
(ng/g)
Cr(VI)
(ng/g)
Cr (III)
(ng/g)
F1S1-C41.8 ± 2.10.338 ± 0.032<1.350.870 ± 0.087197 ± 131690 ± 110
F1S1-M52.9 ± 2.66.17 ± 0.57<1.3527.8 ± 0.99687 ± 8.72590 ± 33
F1S1-O34.0 ± 1.5<0.093215.7 ± 0.3619.9 ± 1.1603 ± 231550 ± 58
F1S1-S7.83 ± 0.627.47 ± 0.552.48 ± 0.0960.720 ± 0.045668 ± 22652 ± 22
F1S2-C28.1 ± 2.76.54 ± 0.0975.42 ± 0.0754.28 ± 0.071566 ± 381790 ± 100
F1S2-M37.8 ± 1.630.3 ± 2.93.66 ± 0.236.86 ± 0.40608 ± 183540 ± 110
F2S1-C31.5 ± 1.71.38 ± 0.0914.89 ± 0.241.45 ± 0.12517 ± 9.3483 ± 8.6
F2S1-S8.60 ± 0.303.85 ± 0.193.74 ± 0.342.40 ± 0.062585 ± 8.71240 ± 18
F2S2-C7.03 ± 0.44<0.09326.97 ± 0.000422.20 ± 0.13646 ± 31374 ± 18
F2S2-O13.8 ± 1.0<0.0932<1.353.29 ± 0.20500 ± 281750 ± 98
F2S2-S28.6 ± 0.861.09 ± 0.0543.55 ± 0.205.30 ± 0.31579 ± 8.7931 ± 51
Table 9. EDI for adults and children consuming various vegetables during the high-flow season.
Adult
Cr
Children
Cr
Adult
As
Children
As
VegetablesEDI
F1S1-S0.02700.12760.0004400.00312
F1S2-C0.007650.03620.0001890.00134
F1S2-P0.01410.06680.0003300.00234
F1S2-S0.01900.09010.0006300.00447
F1S3-C0.004350.02060.001120.00793
F1S3-S0.01130.05340.0005530.00392
F1S4-T0.03100.1470.0005540.00394
F2S1-C 0.004110.01950.0000610.000433
F2S1-S0.01750.08290.0007130.00506
F2S2-C0.005070.02400.0001370.00097
F2S2-S0.02040.09650.0004210.00299
RfD (mg/kg/day)0.0030.0030.00030.0003
Table 10. The EDI for adults and children consuming various vegetables during the low-flow season.
Adult
Cr
Children
Cr
Adult
As
Children
As
VegetablesEDI
F2S2-C0.001720.008130.00003070.000145
F1S1-C0.003190.01510.00007580.000359
F1S1-M0.005530.02620.0001500.000709
F1S1-O0.003620.01710.0001210.000572
F1S1-S0.002220.01050.00003450.000163
F1S2-C0.003980.01880.00007800.000369
F1S2-M0.006990.03310.0001360.000643
F1S2-S0.002480.01170.0001790.000845
F2S1-C0.001690.007970.00006940.000329
F2S1-S0.003070.01450.00003470.000164
F2S2-C0.001720.008130.00003070.000145
F2S2-O0.003790.01790.00003220.000152
F2S2-S0.002540.01200.00006830.000323
RfD0.0030.0030.00030.0003
Table 11. Hazard quotients observed in vegetable samples during the high-flow season.
CrAs
AdultChildrenAdultChildren
VegetablesTHQTHQ
F1S1-S8.9942.51.476.94
F1S2-S6.3530.02.109.94
F1S2-C2.5512.10.6292.98
F1S2-P4.7122.31.105.21
F1S3-C1.456.863.7217.6
F1S3-S3.7617.81.848.72
F1S4-T10.348.91.858.75
F2S1-S5.8427.62.3811.2
F2S2-S6.8032.21.406.65
F2S1-C1.376.490.200.962
F2S2-C1.698.000.462.15
Table 12. Hazard quotients observed in vegetable samples during the low-flow season.
CrAs
AdultChildrenAdultChildren
Vegetables THQTHQ
F1S1-C1.065.020.2531.20
F1S1-M1.848.720.4992.36
F1S1-O1.215.720.4031.91
F1S1-S0.7423.510.1150.545
F1S2-C1.336.270.2601.23
F1S2-M2.3311.00.4532.14
F1S2-S 0.8263.910.5952.82
F2S1-C 0.5622.660.2311.10
F2S1-S1.024.840.1160.548
F2S2-C 0.5732.710.1020.484
F2S2-O1.265.980.1070.508
F2S2-S0.8484.010.2281.08
Table 13. The ILCR data obtained from the analysis of As(III), As(V) and Cr(VI) during the high-flow season.
VegetableAs(III)As(V)Cr(VI)Total Risk (As(III) + As(V) + Cr(VI))
AdultsChildrenAdultsChildrenAdultsChildrenAdultsChildren
ILCR
F1S1-S1.59 × 10−47.53 × 10−42.52 × 10−41.19 × 10−32.43 × 10−31.15 × 10−22.84 × 10−31.34 × 10⁻²
F1S2-C6.48 × 10−53.06 × 10−42.27 × 10−51.07 × 10−41.83 × 10−38.64 × 10−31.92 × 10−39.05 × 10⁻³
F1S2-P1.71 × 10−48.07 × 10−42.33 × 10−41.10 × 10−31.52 × 10−37.20 × 10−31.92 × 10−39.11 × 10⁻³
F1S2-S1.24 × 10−45.87 × 10−46.61 × 10−43.13 × 10−32.75 × 10−31.30 × 10−23.54 × 10−31.67 × 10⁻²
F1S3-C4.78 × 10−42.26 × 10−31.24 × 10−45.84 × 10−41.85 × 10−38.75 × 10−32.45 × 10−31.16 × 10⁻²
F1S3-S4.04 × 10−41.91 × 10−32.42 × 10−41.14 × 10−31.93 × 10−39.14 × 10−32.58 × 10−31.22 × 10⁻²
F1S4-T2.53 × 10−41.20 × 10−32.65 × 10−61.25 × 10−52.42 × 10−31.14 × 10−22.68 × 10−31.26 × 10⁻²
F2S1-C4.07 × 10−51.93 × 10⁻⁴N/A *N/A *2.67 × 10−31.26 × 10−22.71 × 10−31.28 × 10−2
F2S1-S1.27 × 10−36.01 × 10−32.05 × 10−49.72 × 10−42.97 × 10−31.41 × 10−24.45 × 10−32.11 × 10⁻²
F2S2-C3.92 × 10−61.85 × 10−52.31 × 10−61.09 × 10−51.50 × 10−37.11 × 10−31.51 × 10−37.14 × 10⁻³
F2S2-S1.38 × 10−46.54 × 10−43.07 × 10−51.45 × 10−42.43 × 10−31.15 × 10−22.60 × 10−31.23 × 10⁻²
* N/A: Not available (The concentration of As(V) in F2S1 was less than the LOD (0.458 ng/g) hence the ILCR data for the vegetable is not reported.).
Table 14. The ILCR data obtained from the analysis of As(III), As(V) and Cr(VI) during the low-flow season.
VegetablesAs(III)As(V)Cr(VI)Total Risk (As(III) + As(V) + Cr(VI))
AdultsChildrenAdultsChildrenAdultsChildrenAdultsChildren
ILCR
F1S1-C1.06 × 10−45.00 × 10−42.20 × 10−61.04 × 10−54.98 × 10−47.47 × 10−46.06 × 10−41.26 × 10⁻³
F1S1-M1.34 × 10−46.33 × 10−47.03 × 10−53.33 × 10−41.74 × 10−32.61 × 10−31.94 × 10−33.58 × 10⁻³
F1S1-O8.61 × 10−54.07 × 10−45.04 × 10−52.38 × 10−41.52 × 10−32.29 × 10−31.66 × 10−32.94 × 10⁻³
F1S1-S1.98 × 10−59.37 × 10−41.82 × 10−58.61 × 10−61.69 × 10−32.53 × 10−31.71 × 10−32.63 × 10⁻³
F1S2-C7.09 × 10−53.36 × 10−41.08 × 10−55.12 × 10−51.43 × 10−32.15 × 10−31.51 × 10−32.54 × 10⁻³
F1S2-M9.56 × 10−54.52 × 10−41.74 × 10−58.21 × 10−51.54 × 10−32.31 × 10−31.65 × 10−32.84 × 10⁻³
F2S1-C7.96 × 10−53.77 × 10−43.67 × 10−61.74 × 10−51.31 × 10−31.96 × 10−31.39 × 10−32.35 × 10⁻³
F2S1-S2.18 × 10−51.03 × 10−46.07 × 10−62.87 × 10−51.48 × 10−32.22 × 10−31.51 × 10−32.35 × 10⁻³
F2S2-C1.78 × 10−58.40 × 10−55.57 × 10−62.64 × 10−51.63 × 10−32.45 × 10−31.65 × 10−32.56 × 10⁻³
F2S2-O3.49 × 10−51.65 × 10−48.32 × 10−63.94 × 10−51.26 × 10−31.90 × 10−31.30 × 10−32.10 × 10⁻³
F2S2-S7.22 × 10−53.42 × 10−41.34 × 10−56.35 × 10−54.88 × 10−42.44 × 10−45.74 × 10−46.50 × 10⁻⁴
Disclaimer/Publisher’s Note: The statements, opinions and data contained in all publications are solely those of the individual author(s) and contributor(s) and not of MDPI and/or the editor(s). MDPI and/or the editor(s) disclaim responsibility for any injury to people or property resulting from any ideas, methods, instructions or products referred to in the content.