Abstract
The Middle Jurassic was a time of marginal to shallow shelf settings dominated by organic matter-rich deposition in northern Egypt, southern Tethys. Paleoenvironmental and sequence stratigraphic reconstructions are of paramount significance for a better understanding of basin history and related reservoirs and source rock units. For this purpose, a detailed palynomorph and palynofacies analysis of the Middle Jurassic Khatatba Formation in the Dahab-Mireir Basin, north Western Desert, was conducted. A moderately to well-preserved, moderately diverse palynomorph assemblage of spores, pollen, and dinoflagellate cysts is identified. Marker dinoflagellate cysts, including Dichadogonyaulax sellwoodii, Escharisphaeridia pocokii, Gonyaulacysta adecta, Korystocysta gochtii, Pareodinia ceratophora, and Wanaea acollaris, defined a Bajocian to Callovian age. Palynofacies analysis of the Khatatba Formation revealed two assemblages, whereby PFA-1 is the most abundant in the study well and is comprised mainly of terrestrial phytoclasts deposited nearby fluvio-deltaic sources. The infrequently reported PFA-2 consists of moderate abundances of phytoclasts and AOM, deposited in an inner shelf environment. A more reliable paleoenvironmental interpretation was indicated based on three palynomorph assemblages. The spore-dominated assemblage indicated deposition in a deltaic environment, while the mixed palynomorph assemblage revealed fluvio-deltaic to marginal shallow marine conditions. The microplankton-dominated assemblage is represented by minor samples and reflects an offshore inner shelf condition. Furthermore, the Middle Jurassic relative sea level was reconstructed based on the quantitative variations in the terrestrial/marine (T:M) ratios and abundances of spores, pollen, and dinoflagellate cysts. This led to the subdivide of the Khatatba Formation into thirteen third-order transgressive-regressive sequences, which can be correlated with the global Jurassic short-term sea level changes. Active tectonics and accelerated drifting of the Eurasian Plate during the Middle Jurassic are suggested to control basin uplift/subsidence and, therefore, recurring patterns of relative sea level change.
1. Introduction
Predominant changes in sea level represent a major driver of various environmental conditions in the ancient and modern Earth systems. The Middle Jurassic (ca. 170.3 Ma) (Bajocian–Callovian) was a time of long-term sea level changes, which witnessed variable overall lowstand stacking patterns compared to phases of sea level highstand stacking patterns during the preceding early Toarcian and Kimmeridgian–early Tithonian [1,2]. At this time, the southern margin of the Tethys Ocean, where the study site is located, submerged northern Egypt, and the deposition of thick clastic and carbonate sediments rich in organic matter of the Khatatba Formation took place [3]. Therefore, the Middle Jurassic Khatatba Formation provides an excellent sedimentary archive to assess interactions between sea level fluctuations and a range of paleoenvironmental patterns that controlled the accumulation of different sedimentary facies enriched in organic matter.
Sea level changes in marine basins controlled by tectonic movements and related structures are referred to as tectono-eustacy, whereas those triggered by the waxing and waning of continental ice covers are referred to as glacio-eustacy, which could result in high-amplitude changes of 50–250 m from 10 ky to 100 ky [4,5]. Tectono-eustacy occurs due to changes in the dynamic topography of subsidence/uplift of the ocean floor in response to mantle dynamics, resulting in 1 m/Ma to tens of Ma [6]. Besides, extensional tectonics and/or continental orogeny trigger significant changes to the areal extent of oceans and lead to tens of meters of change in sea level [7]. The use of sequence stratigraphic approaches for optimal hydrocarbon exploration and production tasks is widely implemented in the industry [8,9,10,11]. Addressing the sequence stratigraphic framework in terms of key stratal surfaces, such as sequence boundaries and maximum flooding surfaces, and systems tracts based on palynofacies analysis and palynomorph characteristics have been shown to provide reliable patterns of sea level changes in siliciclastic and carbonate successions [12,13,14,15,16]. For this purpose, palynofacies analysis of particulate organic matter (POM) constituents, amorphous organic matter (AOM), total phytoclasts, including translucent and opaque wood fragments, and terrestrial (pollen grains and spores) and marine palynomorphs (dinoflagellate cysts and acritarchs) is used. The ratio between terrestrial and marine palynomorphs (T:M) could be used to provide major changes in palynomorph composition during the deposition [17,18].
Therefore, this study aims to (1) assess the relative age of the Khatatba Formation and interpret the depositional paleoenvironment that was prevalent at this time; (2) reconstruct the Middle Jurassic short-term sea level oscillations during the deposition of the Khatatba Formation into distinctive third-order transgressive-regressive (T-R) stratigraphic sequences and their bounding stratal surfaces based on palynomorph composition; and (3) compare the elucidated sea level changes from palynological investigation results to the Jurassic global sea level chart of Haq [2].
2. Geologic and Stratigraphic Settings
The north Western Desert attests to complex tectonic evolution due to its location on the extreme northeastern edge of the African Plate. During the Early Paleozoic, Pan-African orogenic events resulted in the formation of active rift basins and fault zones in northeast Africa that were subjected to further tectonics due to the impact of the Hercynian orogeny by the end of the Paleozoic [19]. The coastal basins of the Matruh, Shushan, Dahab-Mireir, and Natrun were initially formed during the Permo–Triassic due to the breakup of Gondwana and the formation of extensional rifts and fragmentation [3,20,21]. Consequently, the active opening of the New-Tethys Ocean took place, and all coastal basins became pull-apart basins with enhanced marine conditions. Subsequently, successive phases of spreading and rifting tectonism took place in the Tethys as well as in the Central Atlantic with respect to the Alpine orogeny, which triggered a left-lateral drift of Africa versus Europe [22]. The late Cimmerian orogeny was activated by the Middle Jurassic, which resulted in the separation of the Apulian microplate from the northeastern African Plate [23]. The eastward movement of the latter relative to the European Plate took place with respect to the opening of the Atlantic Ocean [24,25]. Additionally, these tectonics triggered the NNE-SSW extensional rift system as well as major normal faults NE-SW [25,26,27]. Such major normal faults controlled the subsidence of the main basinal blocks of the basins in northern Egypt mentioned above. This was followed by significant compressional episodes during the Late Cretaceous that resulted in a convergence between the African and Eurasian plate boundaries, creating an ENE-WSE trending fold belt known as the Syrian Arc System [27].
The Dahab-Mireir Basin is located between the Shushan Basin to the west and the Natrun Basin to the east (Figure 1). It is bordered by the Sharib-Sheiba Highs to the south and the Dabaa Ridge to the northwest. It has a northeastward trend and is bifurcated in response to a southeast extension [3]. The Dahab-Mireir Basin is cut by two ENE ridges, the Washka Ridge and the so-called Qattara-Alamein Ridge. It is a Jurassic-Late Cretaceous petroliferous basin, where the main subsidence of this basin took place at the beginning of the Early Cretaceous and was controlled by E-W aligned step faults (F1 and F2) [3]. These step faults dropped the Dahab-Mireir structures over 700 m relative to the Qattara-Alamein Ridge.
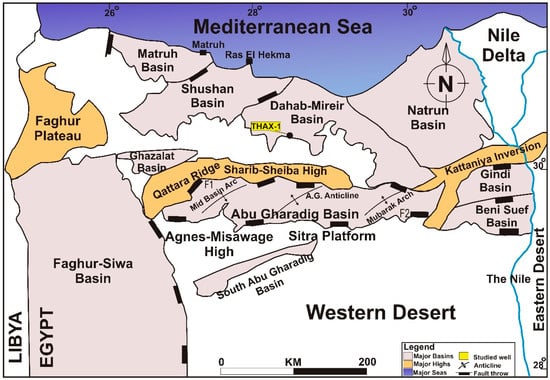
Figure 1.
Geologic map of the north Western Desert of Egypt with the major structural features and sedimentary basins, including the Dahab-Mireir Basin and the current study well of THAX-1 (yellow color, F1 and F2 refer to the two faults).
The Dahab-Mireir Basin consists of a thick stratigraphic succession of more than 8300 m of Permo-Triassic to Miocene siliciclastic and carbonate facies (Figure 2). The current study focuses on the Middle Jurassic sediments of the Khatatba Formation in the THAX-1 well. The Khatatba Formation was first proposed by Norton [28], and the type of section was established in the Khatatba-1 well [3]. It conformably overlies the Lower Jurassic Ras Qattara Formation, which is comprised mainly of dark gray sandstones. The thickness of the Khatatba Formation in the THAX-1 well reaches up to 540 m. It consists of several hundred meters of thick organic carbon-rich black shales, dark brown shales, and siltstones, intercalated with thin white, dark-gray, and brown medium-grained sandstones, coaly shales, fine siltstones, and several limestone interbeds in the middle to upper parts of the formation (Figure 2). The Khatatba Formation conformably underlies the Upper Jurassic carbonate sediments of the Masajid Formation.
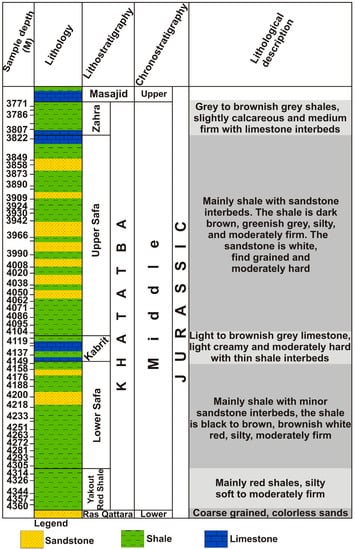
Figure 2.
Lithostratigraphic chart and related lithologic characteristics of the Middle Jurassic Khatatba Formation from the THAX-1 well of the Dahab-Mireir Basin.
3. Materials and Methods
Eighty-four drill-cutting samples collected from the Khatatba Formation in the THAX-1 well (30°20′0.0″ N, 28°29′0.0″ E) from the Dahab-Mireir Basin were used for detailed palynological analysis. These samples span the depth interval from 3771 m to 4305 m. All samples were processed for kerogen extraction at the Paleontology and Stratigraphy Laboratory, Faculty of Science, Cairo University (Egypt), following the traditional palynological procedures of Traverse [29]. Mineral constituents are digested by concentrated hydrochloric and hydrofluoric acids before sieving the organic residue through a 15 µm nylon mesh. The organic fractions of each sample are mounted onto glass slides. The kerogen slides were examined under transmitted light using a BEL microscope and a digital camera (TUCSEN). For reliable environmental and sequence stratigraphic reconstructions, the first 200 palynomorphs and 500 POM (including AOM, phytoclasts (opaque and translucent wood particles), and palynomorphs) were counted on each sample. The counted opaque phytoclasts are represented by lath-shaped and equidimensional black wood particles, while translucent phytoclasts include wood tracheid with bits, wood tracheid without pits, cuticle, membrane, and fungal hyphae. All kerogen slides and organic residues were stored at the Paleontology and Stratigraphy Laboratory, Faculty of Science, Cairo University.
The paleoenvironmental and sequence stratigraphic reconstructions are based on the association of various palynomorph groups revealed by Q-mode cluster analysis to identify similarities between palynomorph communities with respect to different depositional settings and related sea level changes. Cluster analysis of spores, pollen, and microplankton using the Ward method (PAST statistical software, version 2.17c [30]) was conducted to establish groupings and define the common relationship between palynomorph assemblages. Discrete groupings of the former three palynomorph endmembers are displayed in dendrograms via cluster analysis. These clusters are then plotted on the Spores-Pollen-Microplanktons (SPM) ternary plot [31,32] using the PAST software (version 2.17c [30]). Additionally, routine plotting of the counted kerogen fractions of microscopic organic particles was conducted using the AOM-Phytoclasts-Palynomorphs ternary diagram [12] using the PAST software (version 2.17c [30]). This ternary diagram provides further information on the kerogen types, redox state during deposition, and role of terrestrial/riverine input with respect to proximal-distal trends.
The ratio of terrestrial (continental) to marine palynomorphs (T:M) was calculated as T:M = nT/(nT + nM), where T is the sum of spores and pollen grains, M is the sum of dinoflagellate cysts and acritarchs, and n is the number of palynomorph specimens counted [33]. This ratio is commonly used to reconstruct changes in the relative sea level, proximal-distal trends, and changes in terrestrial organic matter input to the basin.
4. Results
4.1. Palynomorph Composition
Samples from the Khatatba Formation in the THAX-1 well yielded abundant assemblages of palynoflora, represented mainly by spores, pollen, and dinoflagellate cysts, with a minor contribution of acritarchs (Supplementary Table S1). A moderately diverse palynomorph assemblage, represented by a total of 37 species that belong to 27 genera of the former palynomorph groups, is identified (Supplementary Table S1). The recovered palynomorph composition exhibits different abundances, taxonomic compositions, and preservation, with moderately to well-preserved palynomorphs. The dinoflagellate cysts are dominated by the abundant contribution of age-diagnostic taxa, including Dichadogonyaulax sellwoodii, Gonyaulacysta adecta, Escharisphaeridia pocokii, Korystocysta gochtii, Pareodinia ceratophora, Lithodinia jurassica, and Wanaea acollaris (Figure 3). Other dinoflagellate cysts are represented by Ctenidodinium combazii, C. continuum, Ctenidodinium sp., Korystocysta pachyderma, Kallosphaeridium sp., Sentusidinium sp., Mancodinium sp., Systematophora complicata, Systematophora areolata, Systematophora sp., and Hystrichosphaeridium orbifera. The recorded spores are comprised of Deltoidospora minor, Deltoidospora sp., Concavisporites sp., Triplanosporites sinuosus, Dictyophyllidites sp., Gleicheniidites senonicus, Gleicheniidites sp., and Cicatricosisporites sp. (Figure 4). The pollen grain content consists of Inaperturopollenites spp., Spheripollenites psilatus, Cycadopites sp., Callialasporites trilobatus, Callialasporites dampieri, and Ephedripites sp. (Figure 4). The stratigraphic distribution of various palynomorph groups, such as spore, pollen, and dinoflagellate cysts, is shown in Figure 5.
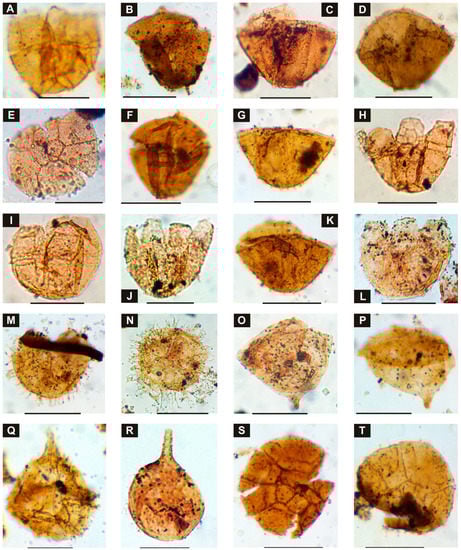
Figure 3.
Microscopic photographs of the recovered spores and dinoflagellate cysts from the Middle Jurassic Khatatba Formation in the THAX-1 well taken under transmitted light. The scale bar equals 40 µm. The corresponding sample depth, slide number, and species coordinates in the kerogen slide are given, respectively. (A) Lithodinia jurassica, 3828 m, slide 1, Coord. 38/10. (B–D) Korystocysta gochtii, 3795 m, slide 1, Coord. 38/10, 3792 m, slide 2, Coord. 37/9.5, 3795 m, slide 1, Coord. 55/8. (E) Dichadogonyaulax selwoodii, 3795 m, slide 1, Coord. 47/7.5. (F,G,K) Korystocysta gochtii, 3792 m, slide 1, Coord. 50/10; 3813 m, slide 1, Coord. 43/11; 3792 m, slide 1, Coord. 55/9. (H,I) Lithodinia jurassica, 4050 m, slide 1, Coord. 33/17; 4095 m, slide 1, Coord. 54/10. (J) Escharisphaeridia pocockii, 3822 m, slide 2, Coord. 53.5/17. (L) Escharisphaeridia sp., 3777 m, slide 1, Coord. 44/10.5. (M,N) Systematophora sp., 3813 m, slide 1, Coord. 53/7.5; 3822 m, slide 1, Coord. 39/10. (O) Wanaea acollaris, 3858 m, slide 2, Coord. 47/14. (P) Wanaea sp., 3864 m, slide 2, Coord. 43/11.5. (Q) Gonyaulacysta adecta, 3864 m, slide 1, Coord. 38/17. (R) Pareodinia ceratophora, 4110 m, slide 2, Coord. 35/12. (S,T) Dichadogonyaulax sellwoodii, 3813 m, slide 1, Coord. 46/11; 3792 m, slide 1, Coord. 36/9.5.
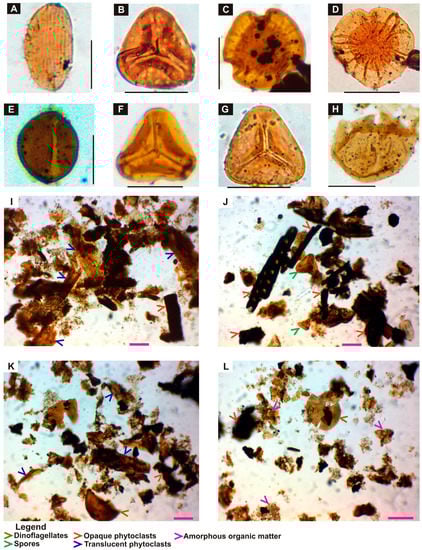
Figure 4.
Microscopic photographs of the recovered palynomorphs as well as various POM components from the Middle Jurassic Khatatba Formation in the THAX-1 well taken under transmitted light. The scale bar equals 40 µm. The corresponding sample depth, slide number, and species coordinates in the kerogen slide are given, respectively. (A) Ephedripites sp., 3822 m, slide 1, Coord. 54/11. (B) Gleicheniidites senonicus, 4200 m, slide 1, Coord. 55/12. (C) Callialasporites trilobatus, 3813 m, slide 1, Coord. 43/12. (D) Callialasporites dampieri, 4200 m, slide 2, Coord. 50.1/9. (E) Cycadopites sp., 3855 m, slide 2, Coord. 47/8. (F) Gleicheniidites senonicus, 4134 m, slide 1, Coord. 55/6. (G) Deltoidospora minor, 4176 m, slide 1, Coord. 39/11. (H) Sentusidinium sp., 3792 m, slide 2, Coord. 44/10. (I–K) POM composition of PFA-1 with high concentrations of the total phytoclast content and recovered from samples that plot in palynofacies field II at depths of 4074 m, slide 2, Coord. 34/10; 3855 m, slide 1, Coord. 41/11; and 3921 m, slide 1, Coord. 48/8, respectively. (L) POM particles of PFA-2 that contain moderate proportions of AOM and total phytoclasts, 3870 m, slide 2, Coord. 41/10.
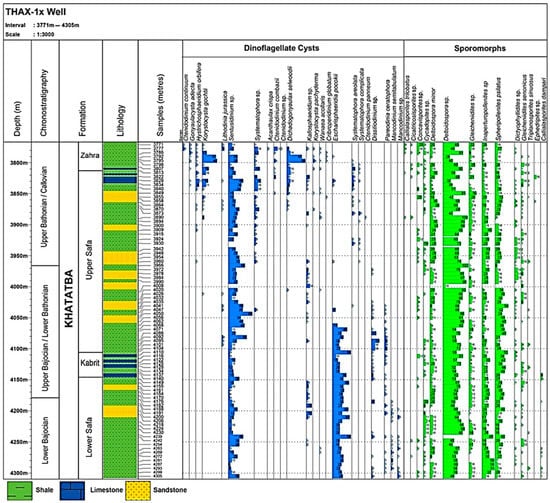
Figure 5.
Stratigraphic distribution chart of marker dinoflagellate cyst taxa as well as the most common sporomorphs recovered from the Khatatba Formation from the THAX-1 well, Dahab-Mireir Basin.
For a reliable assessment of different paleoenvironmental conditions, all samples of the Khatatba Formation were distributed using statistical cluster analysis and plotted in the SPM ternary plot [31,32]. As a result, all samples were plotted in three different fields of environmental conditions relative to their stratigraphic variations in the spore, pollen, and microplankton contents that were distributed into three clusters (Figure 5).
4.1.1. Spore-Dominated Assemblage
It is the most common palynomorph assemblage in the Khatatba Formation, which represents cluster 1 and occupies a total of 42 samples (Figure 6). The spores are the most abundant constituent of this assemblage and are in the range of 74.4%–49% (58.3% on average), followed by pollen grains and dinoflagellate cysts that are in the range of 31%–9.5% (22.5% on average) and 39%–7% (19.1% on average), respectively. The acritarch content of this assemblage is generally low and ranges from 11%–1% (2.7% on average). The T:M ratio shows the highest values (0.9–0.6) throughout the Khatatba Formation, with average values of 0.8.
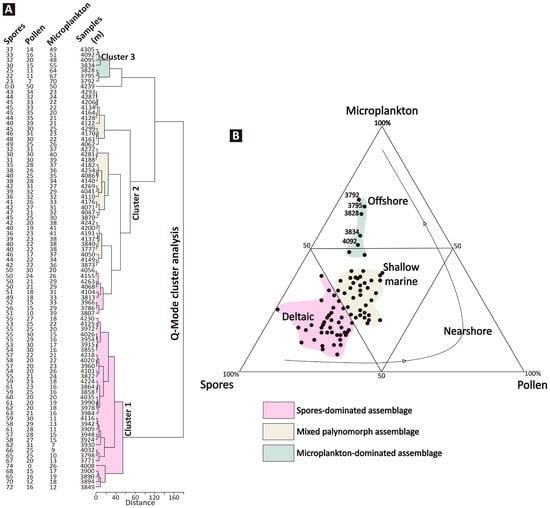
Figure 6.
(A) Cluster analysis of spores, pollen grains, and microplankton groups recovered from the Khatatba Formation from the THAX-1 well using the Ward method [30]. (B) Spores-Pollen-Microplankton ternary diagram illustrating the plot of the Middle Jurassic Khatatba Formation samples from the THAX-1 well, Dahab-Mireir Basin [32].
4.1.2. Mixed Palynomorph Assemblage
This palynomorph assemblage occupies cluster 2 and is dominated by 35 samples of the Khatatba Formation in the THAX-1 well (Figure 6). It is characterized by a mixed average composition between the three palynomorph endmembers of spores, pollen, and dinoflagellate cysts. The spore content is in the range of 49%–30% of total palynomorph composition (41.1% on average), whereas the pollen grain and dinoflagellate cyst contents show slightly similar values of 39%–17% (27.6% on average) and 38%–19% (29.2% on average), respectively. The acritarchs of this assemblage are significantly like those of the former palynomorph assemblage, with low average values of 3.4% of total palynomorph composition. The T:M ratio of the mixed palynomorph assemblage exhibits high to moderate values that are in the range of 0.8–0.6 (0.69 on average).
4.1.3. Microplankton-Dominated Assemblage
This assemblage is deduced from cluster 3 and is represented by the lowest number of samples in the Khatatba Formation (seven samples) (Figure 6). It is dominated by the highest contribution of microplanktons, mainly dinoflagellate cysts (68%–38% of total palynomorph composition, 54.6% on average), compared to moderate to low contents of spores (37%–22.5%, 28.9% on average) and pollen grains (50%–7%, 17.9% on average). The T:M ratio of this assemblage shows moderate to low values of 0.5–0.3 (0.4 on average).
4.2. Palynofacies Analysis
The POM composition of the Khatatba Formation samples in the THAX-1 well is shown in Supplementary Table S2. Based on stratigraphic variations in POM content, palynofacies analysis of the Khatatba Formation is conducted, and all samples are distributed in two palynofacies fields in the AOM-Phytoclasts-Palynomorphs ternary plot of Tyson [12] (Figure 7). Palynofacies assemblage 1 (PFA-1) is comprised of most samples of the Khatatba Formation (71 samples). It is characterized by high concentrations of the total phytoclasts that are in the range of 86%–60% (74.1% on average) compared to low AOM and palynomorph contents that are in the range of 35%–11% (21.8% on average) and 8%–1% (4.1% on average), respectively (Figure 7). PFA-1 is dominated by a higher composition of translucent phytoclasts (66%–35%, 50.8% on average) than opaque phytoclasts (47%–10%, 23.3% on average). All samples of PFA-1 plot in the palynofacies field II of the APP ternary diagram (Figure 7).
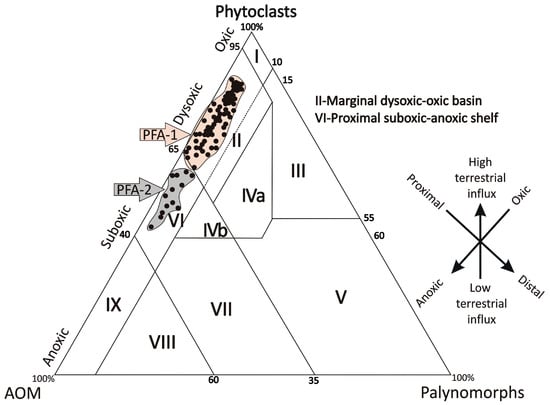
Figure 7.
AOM-Phytoclasts-Palynomorphs ternary diagram showing the plot of the Middle Jurassic Khatatba Formation samples from the THAX-1 well, Dahab-Mireir Basin [12].
PFA-2 is represented by 13 samples throughout the Khatatba Formation (Figure 7). It is characterized by moderate abundances of total phytoclasts and AOM, which are in the range of 59%–43% (52.1% on average) and 54%–36% (44.1% on average), respectively. Like PFA-1, PFA-2 shows abundant concentrations of translucent phytoclasts that are in the range of 42%–30% versus significantly lower abundances of opaque phytoclasts that are in the range of 23%–7%. The PFA-2 samples plot in the palynofacies field VI of the APP ternary diagram (Figure 7).
5. Discussion
5.1. Age Assessment
The biostratigraphic assessment of the studied interval is conducted based on the first downhole occurrence (FDO), which is a common practice in the case of using drill cuttings samples due possibly to caving while drilling [15,17]. Biostratigraphic marker palynomorphs within the Khatatba Formation are represented mainly by dinoflagellate cyst taxa (Figure 5), which provide a reliable depositional history in the Dahab-Mireir Basin. They include Dichadogonyaulax sellwoodii, Escharisphaeridia pocokii, Gonyaulacysta adecta, Korystocysta gochtii, Lithodinia jurassica, Pareodinia ceratophora, and Wanaea acollaris (Figure 5). Dichadogonyaulax sellwoodii is an important index taxon of the Middle Jurassic (Bathonian–Callovian). The first appearance of this species took place at a depth of 4020 m, while the common occurrence occurred at the upper part of the formation (Figure 5). D. sellwoodii is a late Bathonian–Callovian index species in the north Western Desert [34,35] and Sinai [36]. El Beialy et al. [37] identified a late Bathonian-early Callovian assemblage zone based on the co-occurrence of Dichadogonyaulax sellwoodii and Adnatosphaeridium caulleryi in the Khatatba Formation. Recently, Gentzis et al. [38] reported the common occurrence of D. sellwoodii within the Khatatba Formation and the last appearance datum in the lowermost part of the overlying lower Oxfordian Masajid Formation, suggesting an age no younger than Callovian. Similar age assignments were proposed for the same interval in the Shushan [15] and Matruh basins in the north Western Desert [39]. Furthermore, D. sellwoodii was used as a Bathonian–Callovian marker in Arctic Norway [40], the eastern Netherlands [41], England [42], and southern France [43].
The marker dinoflagellate cyst Gonyaulacysta adecta was elevated from Gonyaulacysta jurassica subsp. adecta to the current species level [44]. The common occurrence of G. adecta was reported during the Callovian (Figure 5), while rare to low occurrences occurred during the Bathonian and early Oxfordian. It is used as a Middle Jurassic index species with geographically extensive records in Western Gondwana and Laurasia, reinforcing an age no younger than Callovian [44]. In the THAX-1 well, low to common occurrences of G. adecta are reported within the upper part of the Khatatba Formation, reinforcing the proposed Middle Jurassic (Bathonian–Callovian).
Wanaea acollaris is another age-diagnostic marker species of the Middle Jurassic in northern Egypt [15,37,39,45] and England [42]. It was first recorded in the Middle Jurassic (Bathonian) strata of Bulgaria [46]. W. acollaris was commonly used to define an age no younger than a Bathonian–Callovian in northeast Libya [47], Spain [48], and southern France [43]. In the THAX-1 well, rare occurrences of W. acollaris are reported throughout the middle and upper parts of the Khatatba Formation (Figure 5), thus supporting the proposed age estimates of a Bathonian–Callovian.
Korystocysta gochtii is an important index species of the Middle Jurassic (late Bathonian–Callovian) in the southern Tethys margin (Sinai [36] and north Western Desert [15,34,38,39]). It is a reliable marker of the Middle Jurassic sediments in the western Tethys, such as in the Bathonian–Callovian strata of Lincolnshire in England [42] and the Algarve Basin in southern Portugal [49]. K. gochtii is commonly recorded in the upper part of the Khatatba Formation in the THAX-1 well (Figure 5), revealing an age no younger than late Callovian for the formation top. Ctenidodinium continuum is characteristic of the Callovian Stage [48,49,50]. The top range of C. continuum was reported along with Pareodinia prolongata in strata of the Algarve Basin, southern Portugal, indicating a late Callovian bioevent [49,51]. The consistent presence of dinoflagellate cyst forms such as C. continuum with K. gochtii, G. adecta, W. acollaris, and D. sellwoodii indicates that the top part of the Khatatba Formation has an age no younger than the late Callovian.
Other characteristic dinoflagellate cysts of the Middle Jurassic include Lithodinia jurassica and Escharisphaeridia pocockii. L. jurassica and E. pocockii were sparsely reported within the Khatatba Formation in the Shushan [15] and Matruh basins [39]. L. jurassica was commonly recorded in the upper Bathonian strata of Bulgaria [46] and the upper Bathonian–Callovian strata of northeast Libya [47]. E. pocockii was also reported from the late Bathonian–Callovian biozone in northeast Libya [47], the early Callovian of England [42], and the Callovian of Portugal and northeast Spain [48]. Rare occurrences of L. jurassica are recorded compared to abundant records of E. pocockii in the lower and middle parts of the Khatatba Formation of the THAX-1 well, supporting a Bathonian–Callovian depositional history of the studied interval.
Furthermore, the common occurrence of some species, such as Hystrichosphaerina orbifera and Cribroperdinium globatum, is highly characteristic of the Kimmeridgian from the Dorset coast in southern England [50] and the Algarve Basin in southern Portugal [49]. Both species are sparsely recorded within the upper part of the Khatatba Formation, and thus, their basal downhole occurrence or first appearance could support a Middle Jurassic age. Similarly, the chorate Systematophora sp. is commonly reported in the middle to upper parts of the Khatatba Formation, while rare occurrences of the important species Systematophora areolata and S. complicata occurred in the uppermost part of the formation (Supplementary Table S1). The abundant occurrence of S. areolata occurs during the Oxfordian to early Kimmeridgian in the north Sinai of Egypt [52] and southern Portugal [49]. However, the occasional records of S. areolata in the Bathonian sediments of Portugal [49] are consistent with the sporadic reports of this species in the upper part of the Khatatba Formation.
Pareodinia ceratophora is another age-diagnostic marker that first appeared in the Bajocian [42]. It is a characteristic taxon of the Bathonian–Callovian in the northern hemisphere [42]. In the north Western Desert of Egypt, P. ceratophora was suggested as a marker taxon of the Bajocian–Bathonian strata of the Khatatba Formation [53], while Aboul Ela and Mahrous [45] assigned the P. ceratophora palynozone to the late Bathonian Age. The common occurrence of this species occurs in the upper Bajocian–Bathonian strata of the Khatatba Formation in the north Western Desert [15,37,39]. The abundant occurrence of P. ceratophora in the lower to middle parts of the Khatatba Formation in the THAX-1 well confirms a Bajocian to Bathonian age.
5.2. Paleoenvironmental Interpretation
The stratigraphic distribution of the POM composition and changes in opaque and translucent phytoclasts, AOM, and different palynomorph groups can be implemented to reconstruct changes in relative sea level, related depositional paleoenvironments, and interpret the kerogen types [12,13,14]. According to the APP ternary diagram (Figure 7), two palynofacies assemblages were identified. PFA-1 is dominated by significant contributions of terrestrial organic matter, mainly translucent and opaque phytoclasts, compared to moderate to low contents of AOM particles. All samples of this palynofacies plot in field II (Figure 7), which indicates that the preserved organic matter is kerogen Type III of gas-prone hydrocarbon [12]. Similar organic matter characteristics and kerogen types are reported in the Khatatba Formation from the adjoining Shushan and Matruh coastal basins in the north Western Desert of Egypt [15,17]. The plot of samples in palynofacies field II reveals their deposition in a marginal dysoxic to anoxic basin environment [12] (Figure 7 and Figure 8). Furthermore, the relative abundance of translucent phytoclasts over opaque phytoclasts suggests deposition after a short distance of terrestrial organic matter transport in a proximal environment near active fluvio-deltaic sources [12,14]. The proportions of opaque phytoclasts might indicate enhanced oxidation of translucent phytoclasts and/or active thermal alteration in sediments of the preserved translucent phytoclasts because the Khatatba Formation is currently in the peak stage of organic matter maturation [15] (Figure 8).
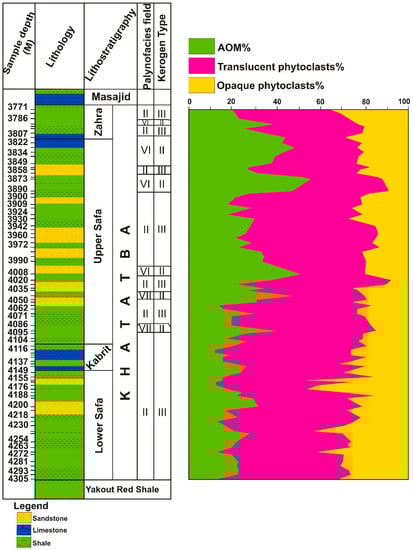
Figure 8.
Stratigraphic distribution chart of the AOM, translucent, and opaque phytoclasts and related palynofacies fields in the APP ternary diagram and kerogen types [12] of the Middle Jurassic Khatatba Formation from the THAX-1 well in the Dahab-Mireir Basin, north Western Desert. An explanation of the palynofacies fields was provided in Figure 7. the other set of Roman numerals of I, II, and II refers to the kerogen types, as explained in the text.
PFA-2 is intermittently recorded at minor intervals of the Khatatba Formation in the THAX-1 well. It is dominated by moderate proportions split between the total phytoclast content and AOM (Figure 8). All samples of this palynofacies plot in field VI on the APP ternary plot of Tyson (Figure 7), which indicates Type II kerogen of oil-prone hydrocarbons [12]. Additionally, this field infers the deposition of PFA-2 in a proximal suboxic-anoxic inner shelf environment, which is slightly deeper than PFA-1 [12]. The higher content of translucent phytoclasts (35.5% on average) that reaches two times the opaque phytoclast content (16.6% on average) suggests deposition near active terrestrial/riverine sources. The abundant concentration of AOM reveals deposition under a low-energy, oxygen-depleted water column that controlled the enhanced preservation of the accumulated organic matter [12,14,15] (Figure 8). This is consistent with the considerably high contents of total organic carbon in the Khatatba Formation, and thus, it is considered one of the most organic carbon-rich units in the north Western Desert [15,17].
The distribution and composition of marine and terrestrial palynomorph groups are physically controlled by several factors. For example, the abundance of dinoflagellate cysts in a marine ecosystem could be triggered by ecological processes, sedimentological patterns, water circulation, surface water productivity, and sea level in a marine depositional environment [16]. Terrestrial palynomorphs are controlled by the climate state and related humidity-aridity conditions, vegetation cover in the vicinity of active fluvio-deltaic sources, wind action, and water discharge into the sedimentary basin [54]. Therefore, the composition of marine and terrestrial palynomorphs is advantageous as a reliable proxy indicator for reconstructing the relative change in the paleoenvironment’s depositional conditions [16,17,54,55,56,57].
According to the SPM ternary diagram, the spore content is the most common palynomorph group in the Khatatba Formation samples, followed by pollen grains with a low contribution of dinoflagellate cysts (Figure 6). The cluster analysis of the three palynomorph endmembers discriminated the Khatatba Formation samples into three clusters (Figure 6). Almost 50% of the study samples belong to cluster 1 of the spore-dominated assemblage (58.3% on average of total palynomorph composition) plot in the palynomorph field, which indicates their deposition in a deltaic environment. The spore content of this assemblage is dominated mainly by a plethora of Deltoidospora and Gleicheniidites groups, which reinforces proximity to fluvio-deltaic settings in warm, humid climates [16]. Low average proportions of dinoflagellate cysts (22.5%) and sporadic occurrences of acritarchs reveal intermittent fluctuations of sea level change and deposition of this assemblage under fluvio-deltaic to marginal shallow marine conditions [12] (Figure 9). This interpretation is consistent with the earlier deductions from palynofacies analysis of samples and deposition in proximal conditions near active fluvio-deltaic sources.
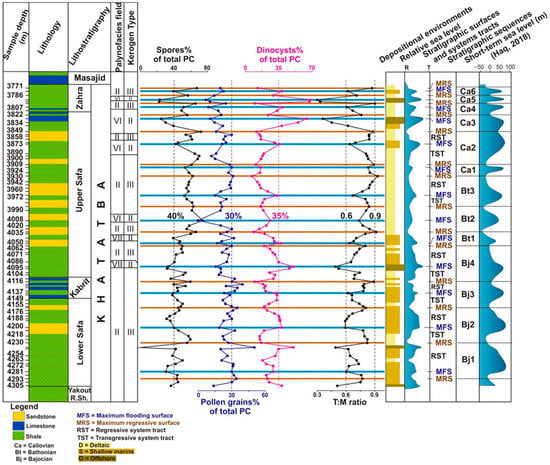
Figure 9.
Stratigraphic distribution chart of the spores, pollen, dinocysts, and T:M ratios of the Middle Jurassic Khatatba Formation from the THAX-1 well in the Dahab-Mireir Basin, north Western Desert. Depositional paleoenvironments, changes in relative sea level, and related third-order stratigraphic sequences, systems tracts, and bounding surfaces of the studied interval are represented and correlated with the short-term stratigraphic sequences of Haq [2].This is the same comment as in Figure 8, which was addressed above.
Cluster 2 is characterized by moderate relative abundances between spores, pollen grains, and microplanktons, which occur in approximately 40% of the studied samples. According to the SPM ternary diagram, this mixed palynomorph assemblage plots in the field, which indicates deposition in a shallow marine environment [32] (Figure 6). The most representative spores (including Deltoidospora, Gleicheniidites, and Concavisporites groups) and pollen (such as Inaperturopollenites and Spheripollenites groups) of this assemblage suggest deposition in an inner shelf environment that is slightly distal compared to the spore-dominated assemblage [12].
Cluster 3 is a microplankton-dominated assemblage that occupies 10% of the study samples (Figure 6). It is dominated by moderate to high contents of dinoflagellate cysts compared to moderate to low average proportions of spores and pollen grains. The samples of this cluster plot in the palynomorph field, which infers deposition in an offshore environment, most likely in an inner shelf marine condition [32]. This is consistent with the recovered forms of dinoflagellate cysts in this assemblage, which are dominated by Sentusidinium, Escharisphaeridia, Dissiliodinium, Korystocysta, and Dichadogonyaulax groups (Supplementary Table S1) (Figure 5). These forms commonly adapt and thrive in shallow marine shelf environments [15,58].
5.3. Palynomorph Composition and Sequence Stratigraphy
During the Middle Jurassic, consequent short-term fluctuations in relative sea level took place, which can be inferred in terms of stratigraphic variations in palynomorph composition (Figure 9). The Khatatba Formation lithology shows cyclic alternations between shales and fine- to coarse-grained sandstones with minor limestone interbeds. This sedimentary record represents a chance to apply the transgressive-regressive (T-R) sequence stratigraphy model following third-order depositional cycles to subdivide the Khatatba Formation into stratigraphic sequences, systems tracts, and their related bounding surfaces [8,59]. This provides a better understanding of the Khatatba Formation’s main source rock and possible reservoir intervals. Generally, the transgressive-regressive sequence model is comprised of the transgressive systems tract (TST) that represents offshore marine sediments, followed by the regressive systems tract (RST) that occupies shallower facies. These two systems tracts are separated by two stratigraphic surfaces, which are the maximum flooding surface (MFS) and maximum regressive surface (MRS) [60]. The RST sediments are bounded in the upper part by a MRS and/or a correlative subaerial unconformity surface, which takes place during a full cycle of sea level change triggered by local to regional tectonism and/or eustacy [9,10,59].
Visual microscopic assessment of kerogen and related characteristics and variations in POM composition recovered from sediments can be used as a reliable proxy indicator to reconstruct relative sea level changes and sequence stratigraphy [13,14,16,56] (Figure 9). However, palynofacies analysis of the Khatatba Formation showed that most samples have similar POM composition, mainly in terms of total phytoclast content, which provides low-resolution fluctuations compared to the more reliable palynomorph composition. The palynomorph composition and related changes in the T:M ratio can be utilized to assess the role of terrestrial/riverine palynomorph input versus the autochthonous marine palynomorphs. The above ratio provides reliable inferences about sea level fluctuations [16] (Figure 9). Additionally, vertical stratigraphic variations in T:M ratios are implemented as reliable proxy indicators to detect the precise location of the stratigraphic bounding surfaces of MFS and MRS. Therefore, an upward decline in the T:M ratio indicates a phase of sea level rise, with the lowest values reflecting the most transgressive point of relative sea level that can be reliably used to locate the MFS of a certain stratigraphic sequence and vice versa. Based on the stratigraphic variations in palynomorph composition and T:M ratios, the Middle Jurassic Khatatba Formation is subdivided into thirteen third-order transgressive-regressive sequences. Four sequences were deposited during the Bajocian (Bj-1 to Bj-4), while three sequences were accumulated during the Bathonian (Bt-1 to Bt-3), and six sequences were deposited during the Callovian (Ca-1 to Ca-6) (Figure 9).
Generally, an upward stratigraphic decrease of the T:M ratio throughout the Khatatba Formation indicates a deepening phase of relative sea level, while the lowest T:M ratio can define the furthest landward invasion of relative sea level and, consequently, can be implemented to plot the MFS. For example, the T:M ratios of the TST sediments in Bj-1 showed a gradual decline from the highest value of 0.77 at a depth of 4293 m to the lowest value of 0.6 at a depth of 4281 m, which indicates a transgressive cycle of sea level to the maximum where the MFS is located [16,18] (Figure 9). Similarly, the T:M ratios show a gradual upward decrease within the TST sediments of the Bj-2, Bj-3, and Bj-4 sequences that are in the range of 0.82–0.59, 0.8–0.62, and 0.78–0.62, respectively, where the lowest T:M values are used to plot the MFS of the former sequences (Figure 9). The common occurrence of specific dinoflagellate cysts, such as Systematophora, Sentusidinium, Dichadogonyaulax, and Korystocysta groups, can be used to reliably predict phases of relative sea level rise (Supplementary Table S1). Their peak abundances could define the point of furthest landward invasion, especially in sensitive environments to sea level transgressive-regressive oscillations such as marginal to shallow marine and coastal settings where these dinoflagellate forms are persisting.
A significant upward increase in the proportions of the total dinoflagellate cyst content of the Bj-2, Bj-3, and Bj-4 sequences from 18% to 50%, 15% to 38%, and 20% to 38%, respectively (Figure 9) is consistent with the T:M ratios, reinforcing phases of sea level rise up to the MFS [13,14]. In contrast, a significant upward decrease of the recovered spore content is reported in the former three sequences, from 50% to total absence, from 50% to 39%, and from 59% to 36%, respectively (Figure 9). Similar trends in palynomorph composition of spores, pollen grains, and dinoflagellate cysts, along with the T:M ratios, are reported within the Bathonian and Callovian sequences, reflecting reliable inferences of the Middle Jurassic sea level changes in this part of the southern Tethys [12,13,16,56] (Figure 9). The lowest values of the T:M ratios reached 0.36 and 0.30, which are reported within the Ca-3 and Ca-5 sequences (Figure 9), revealing that the highest records of relative sea level took place during the deposition of the upper part of the Khatatba Formation in the Callovian [16,18]. The Ca-3 and Ca-5 sequences are characterized by a drastic rise in the dinoflagellate cyst content (from 12% to 64% and from 10% to 68%, respectively) versus a significant fall in the spore content (from 72% to 25% and from 65.5% to 23%, respectively) (Figure 9), reinforcing a prominent phase of relative sea level rise at this time [12,13,16,56]. This could reveal that the Dahab-Mireir Basin was subjected to phases of active tectonics that resulted in enhanced basin floor subsidence and/or phases of eustatic sea level rise in north Africa during the Callovian.
On the contrary, an overall increase in the T:M ratio is used to infer shallowing phases of relative sea level, and the highest T:M ratio reflects the furthest seaward retreat of relative sea level that is used to locate the MRS [16,18]. An example is observed in several stratigraphic sequences of the Khatatba Formation, such as the Bathonian sequences Bt-1 to Bt-3, that show gradual upward increasing trends in the T:M ratios from 0.63 to 0.91, 0.74 to 0.84, and 0.67 to 0.93, respectively (Figure 9). These values indicate cyclic patterns of relative sea level fall, and thus, the deposition of RST sediments and the maximum values are consistent with the plot of MRS for these Bathonian stratigraphic sequences [16,18] (Figure 9). Furthermore, these Bathonian RST sediments and their bounding MRS are characterized by drastic upward increasing trends in the spore content (from 33% to 50%, from 39% to 66%, and from 55% to 63%, respectively) relative to a significant decline in the dinoflagellate cyst content (from 50% to 20%, from 37% to 9%, and from 25.6% to 16%, respectively) (Figure 9). Similar stratigraphic trends in palynomorph composition of spore and dinoflagellate cyst contents and the T:M ratios are reported within the Bajocian and Callovian sequences, which indicate the significance of palynomorph composition as a reliable proxy indicator to reconstruct the Middle Jurassic sea level changes in the north Western Desert [12,13,16,56] (Figure 9). The highest T:M ratios are recorded within the RST sediments of the Bathonian sequences, followed by the Bajocian sequences, whereas the RST sediments of the Callovian sequences show moderate T:M ratios (Figure 9). These palynomorph characteristics and related ratios reveal that phases of the lowest relative sea level occurred during the Bathonian and Bajocian, followed by the Callovian, which are consistent with the aforementioned palynomorph characteristics of the TST sediments [13,16,18]. These inferences might indicate that the Dahab-Mireir Basin was subjected to subsequent phases of active tectonics that triggered basin floor subsidence/uplift during the Middle Jurassic.
Recently, Haq [2] conducted a high-resolution reappraisal of long- and short-term sea level changes in the Jurassic Period based on chemostratigraphic constraints and adjusted by ammonite and calcareous nannofossil zones. This chart showed that the Middle Jurassic was a time of a slight long-term sea level fall compared to the Early and Late Jurassic, which attested to a predominant sea level rise, especially during the Toarcian and Kimmeridgian-Tithonian, respectively. For the Khatatba Formation, the Bajocian to Callovian sequences are completely observed in the sedimentary record of the north Western Desert of Egypt, which can be correlated with the proposed Jurassic global sequence stratigraphic chart of Haq [2] (Figure 9). Therefore, the cyclic patterns of relative sea level during the Bajocian–Callovian in northern Egypt are likely controlled by regional tectonic subsidence/uplift and/or global sea level oscillations with respect to transgressive-regressive phases of the southern Tethys Ocean. This is consistent with the Cimmerian-Tethyan active tectonics and related transtensional E-W trending fault in northern Egypt and the rapid drift of the Eurasian Plate during the Middle Jurassic [3].
6. Conclusions
Based on detailed palynofacies and palynomorph investigations of the Middle Jurassic Khatatba Formation from the THAX-1 well in the Dahab-Mireir Basin, significant deductions are delineated as follows:
- Age-diagnostic dinoflagellate cyst taxa, such as Dichadogonyaulax sellwoodii, Escharisphaeridia pocokii, Gonyaulacysta adecta, Korystocysta gochtii, Lithodinia jurassica, Pareodinia ceratophora, and Wanaea acollaris, defined the Bajocian to Callovian age of the Khatatba Formation.
- Palynofacies analysis revealed two assemblages, whereby PFA-1 occupies most samples of the Khatatba Formation and is dominated mainly by terrestrial phytoclasts of kerogen Type III deposited nearby active fluvio-deltaic sources. PFA-2 occurs at minor intervals and consists of moderate proportions of the AOM and phytoclasts of kerogen Type II, which infers the deposition under an oxygen-depleted inner shelf environment.
- Cluster analysis of spores, pollen, and microplanktons helped define three palynomorph assemblages. The spore-dominated assemblage indicates deposition in a deltaic environment, whereas the mixed palynomorph assemblage reflects deposition in fluvio-deltaic to marginal shallow marine environments. Minor samples belong to the third microplankton assemblage, which infers deposition in an offshore inner shelf environment.
- The quantitative stratigraphic variations in the T:M ratios as well as spore, pollen, and dinoflagellate cyst abundances allowed the subdivision of the Khatatba Formation into thirteen complete third-order transgressive-regressive sequences. These sequences are consistent with the global Jurassic long- to short-term sea level changes. Furthermore, active tectonics and rapid displacement of the Eurasian Plate during the Middle Jurassic were suggested to control basin subsidence/uplift in northern Egypt and, thus, recurring patterns of relative sea level change.
Supplementary Materials
The following supporting information can be downloaded at: https://www.mdpi.com/article/10.3390/min13060827/s1, Palynoflora assemblage Table S1; Particulate Organic Matter composition Table S2.
Author Contributions
Conceptualization, A.M. and S.S.T.; methodology, A.R.; software, A.M. and A.R.; validation, A.M., S.S.T., T.G. and M.S.A.; formal analysis, A.M., S.S.T. and A.R.; investigation, A.M. and S.S.T.; resources, A.M. and M.S.A.; data curation, S.S.T. and A.R.; writing—original draft preparation, A.M.; writing—review and editing, A.M. and T.G.; visualization, A.R.; supervision, A.M. and S.S.T.; project administration, A.M.; funding acquisition, M.S.A. All authors have read and agreed to the published version of the manuscript.
Funding
This work was funded by Researchers Supporting Project, King Saud University, Riyadh, Saudi Arabia, number (RSP2023R455).
Data Availability Statement
Not applicable.
Acknowledgments
We thank the Egyptian General Petroleum Corporation in Cairo, Egypt for the permission to obtain cutting rock samples of this study. The authors are thankful to three anonymous reviewers for their constructive comments.
Conflicts of Interest
The authors declare no conflict of interest.
References
- Haq, B.U.; Hardenbol, J.; Vail, P.R. Chronology of fluctuating sea levels since the Triassic. Science 1987, 235, 1156–1167. [Google Scholar] [CrossRef] [PubMed]
- Haq, B.U. Jurassic Sea-Level Variations: A Reappraisal. Geol. Soc. Amer. Today 2018, 28, 4–10. [Google Scholar] [CrossRef]
- EGPC (Egyptian General Petroleum Corporation). Western Desert, Oil and Gas Fields (A Comprehensive Overview); EGPC: Cairo, Egypt, 1992; 431p. [Google Scholar]
- Conrad, C.P. The solid Earth’s influence on sea-level. GSA Bull. 2013, 125, 1027–1052. [Google Scholar] [CrossRef]
- Cloetingh, S.; Haq, B.U. Inherited landscapes and sea level change. Science 2015, 347, 6220. [Google Scholar] [CrossRef]
- Spasojevic, S.; Gurnis, M. Sea level and vertical motion of continents from dynamic Earth models since the Late Cretaceous. Am. Assoc. Petrol. Geol. Bull. 2012, 9611, 2037–2064. [Google Scholar] [CrossRef]
- Kirschner, J.P.; Kominz, M.A.; Mwakanyamale, K.E. Quantifying extension of passive margins: Implications for sea level change. Tectonics 2010, 294, TC4006. [Google Scholar] [CrossRef]
- Posamentier, H.W.; Vail, P.R. Eustatic controls on clastic deposition. II. Sequence and systems tract models. In Sea Level Changes: An Integrated Approach; Wilgus, C.K., Hastings, B.S., Kendall, C.G.S.C., Posamentier, H.W., Ross, C.A., Van Wagoner, J.C., Eds.; The Society for Sedimentary Geology (SEPM), Special Publication: Oklahoma, OK, USA, 1988; Volume 42, pp. 125–154. [Google Scholar]
- Embry, A.F.; Johannessen, E.P. T-R sequence stratigraphy, facies analysis and reservoir distribution in the uppermost Triassic-Lower Jurassic succession, western Sverdrup Basin, Arctic Canada. In Arctic Geology and Petroleum Potential; Vorren, T.O., Bergsager, E., Dahl-Stamnes, O.A., Holter, E., Johansen, B., Lie, E., Lund, T.B., Eds.; Elsevier: Amsterdam, The Netherlands, 1992; Volume 2, pp. 121–146. [Google Scholar]
- Catuneanu, O. Sequence stratigraphy of clastic systems: Concepts, merits, and pitfalls. J. Afr. Earth Sci. 2002, 351, 1–43. [Google Scholar] [CrossRef]
- Catuneanu, O.; Galloway, W.E.; Kendall, C.G.S.C.; Miall, A.D.; Posamentier, H.W.; Strasser, A.; Tucker, M.E. Sequence stratigraphy: Methodology and nomenclature. Newsl. Strat. 2011, 44, 173–245. [Google Scholar] [CrossRef]
- Tyson, R.V. Palynofacies analysis. In Applied Micropaleontology; Jenkins, D.G., Ed.; Kluwer Academic Publications: Dordrecht, The Netherlands, 1993; pp. 153–191. [Google Scholar]
- Tyson, R.V. Sequence-stratigraphical interpretation of organic facies variations in marine siliciclastic systems; general principles and application to the onshore Kimmeridge Clay Formation, UK. In Sequence Stratigraphy in British Geology; Hesselbo, S.P., Parkinson, D.N., Eds.; The Geological Society: London, UK, 1996; Volume 103, pp. 75–96. [Google Scholar]
- Batten, D.J. Palynofacies analysis. In Fossil plants and Spores: Modern Techniques; Jones, T.P., Rowe, N.P., Eds.; Geological Society: London, UK, 1999; pp. 194–198. [Google Scholar]
- Mansour, A.; Geršlová, E.; Sýkorová, I.; Vöröš, D. Hydrocarbon potential and depositional paleoenvironment of a Middle Jurassic succession in the Falak-21 well, Shushan Basin, Egypt: Integrated palynological, geochemical and organic petrographic approach. Int. J. Coal Geol. 2020, 219, 103374. [Google Scholar] [CrossRef]
- Mansour, A.; Tahoun, S.S.; Gentzis, T.; Elewa, A.M.T. The marine palynology of the upper cretaceous Abu Roash ‘A’ Member in the BED 2-3 borehole, Abu Gharadig Basin, Egypt. Palynology 2020, 441, 167–186. [Google Scholar] [CrossRef]
- Mansour, A.; Tahoun, S.S.; Raafat, A.; Ahmed, M.S.; Oboh-Ikuenobe, F.; Gentzis, T.; Fu, X. Organic Matter Assessment and Paleoenvironmental Changes of the Middle Jurassic Main Source Rocks (Khatatba Formation) in the North Western Desert, Egypt: Palynofacies and Palynomorph Perspectives. Minerals 2023, 13, 548. [Google Scholar] [CrossRef]
- Steffen, D.; Gorin, G. Sedimentology of organic matter in upper Tithonian- Berriasian deep-sea carbonates of southeast France: Evidence of eustatic control. In Source Rocks in Sequence Stratigraphic Framework; Katz, B., Prott, L., Eds.; American Association of Petroleum Geologists: Tulsa, OK, USA, 1993; pp. 49–65. [Google Scholar]
- Said, R. Tectonic framework of Egypt. In The Geology of Egypt; Elsevier: Amsterdam, The Netherlands, 1962; pp. 28–44. [Google Scholar]
- Guiraud, R. Mesozoic rifting and basin inversion along the northern African Tetyan margin: An overview. In Petroleum Geology of North Africa; Macgregor, D.S., Moody, R.T.J., Clark-Lowes, D.D., Eds.; Geological Society: London, UK, 1998; pp. 217–229. [Google Scholar]
- Stampfli, G.M.; Mosar, J.; Favre, P.; Pillevuit, A.; Vannay, J.C. Permo-Mesozoic evolution of the western Tethys realm: The Neo-Tethys east Mediterranean basin connection. In Peri-Tethys Memoir 6: Peri-Tethyan Rift/Wrench Basins and Passive Margins; Ziegler, P.A., Cavazza, W., Robertson, A.H.F., Crasquin-Soleau, S., Eds.; Mémoires du Muséum National d’Histoire Naturelle de Paris: Paris, France, 2001; Volume 186, pp. 51–108. [Google Scholar]
- Guiraud, R.; Bellion, Y. Late Carboniferous to Recent geodynamic evolution of the west Gondwanian cratonic Tethyan margins. In The Ocean Basins and Margins, the Tethys Ocean; Narin, A.E.M., Ed.; Springer: Boston, MA, USA, 1995; Volume 8, pp. 101–124. [Google Scholar]
- Bumby, A.J.; Guiraud, R. The geodynamic setting of the Phanerozoic basins of Africa. J. Afr. Earth Sci. 2005, 43, 1–12. [Google Scholar] [CrossRef]
- Kerdany, M.T.; Cherif, O.H. Mesozoic. In The Geology of Egypt; Said, R., Ed.; Balkema: Rotterdam, The Netherlands, 1990; pp. 407–437. [Google Scholar]
- Guiraud, R.; Bosworth, W. Senonian basin inversion and rejuvenated of rifting in Africa and Arabia: Synthesis and implications to plate-scale tectonics. Tectonophysics 1997, 282, 39–82. [Google Scholar] [CrossRef]
- Bevan, T.G.; Moustafa, A.R. Inverted rift-basins of northern Egypt: Phanerozoic rift systems and sedimentary basins. In Regional Geology and Tectonics, Section 4; Roberts, D., Bally, A., Eds.; Elsevier: Amsterdam, The Netherlands, 2012; Volume 2, pp. 483–506. [Google Scholar]
- Moustafa, A.R. Mesozoic-Cenozoic basin evolution in the northern western desert of Egypt. Geol. East Libya 2008, 3, 29–46. [Google Scholar]
- Norton, P. Rock Stratigraphic Nomenclature of the Western Desert; UAR Oil Co.: Cairo, Egypt, 1967; Volume 557, p. 18. [Google Scholar]
- Traverse, A. Paleopalynology, 2nd ed.; Springer: Berlin/Heidelberg, Germany, 2007; p. 813. [Google Scholar]
- Hammer, Ø.; Harper, D.A.T.; Ryan, P.D. PAST: Paleontological statistics software package for education and data analysis. Palaeontol. Electron. 2001, 4, 4–9. [Google Scholar]
- Federova, V.A. The significance of the combined use of microphytoplankton, spores, and pollen for differentiation of multi-facies sediments. In Questions of Phytostratigraphy; Samoilovich, S.R., Timoshina, N.A., Eds.; TrudyNeftyanoi Nauchno-issledovatelskii Geologo-razvedochnyi Institut (VNIGRI): Leningrad, Russia, 1977; Volume 398, pp. 70–88. [Google Scholar]
- Duringer, P.; Doubinger, J. La palynologie: Un outil de characterisation desfacies marines et continentaux a la limite Muschelkalk Supérieur-Lettenkohle. Sci. Géol. Bull. Strasbg. 1985, 38, 19–34. [Google Scholar]
- Versteegh, G.J.M. Recognition of cyclic and non-cyclic environmental changes in the Mediterranean Pliocene; A palynological approach. Mar. Micropaleontol. 1994, 23, 147–183. [Google Scholar] [CrossRef]
- El Shamma, A.A.; Obied, F.L.; Abu Saima, M.M. Palynostratigraphy of some subsurface Jurassic-lower cretaceous rocks in northern Western Desert. Egypt. J. Geol. 2001, 45, 567–605. [Google Scholar]
- Ibrahim, M.I.A.; Aboul Ela, N.M.; Kholeif, S.E. Dinoflagellate cyst biostratigraphy of Jurassic-Lower Cretaceous formations of the North Eastern Desert, Egypt. Neues Jahrb. Für Geol. Und Paläontologie Abh. 2002, 224, 255–319. [Google Scholar] [CrossRef]
- Aboul Ela, N.M.; El-Shamma, A.A. Palynostratigraphy of the middle-upper Jurassic rocks in El-Giddi borehole, north Sinai, Egypt. Acta Univ. Carol. Geogr. 1997, 41, 47–55. [Google Scholar]
- El Beialy, S.Y.; Zalat, A.; Ali, A.S. The palynology of the Bathonian-early Oxfordian succession in the East Faghur-1 well, Western Desert, Egypt. J. Palaeontol. 2002, 2, 399–414. [Google Scholar]
- Gentzis, T.; Carvajal-Ortiz, H.; Deaf, A.S.; Tahoun, S.S. Multi-proxy approach to screen the hydrocarbon potential of the Jurassic succession in the Matruh Basin, North Western Desert, Egypt. Int. J. Coal Geol. 2018, 190, 29–41. [Google Scholar] [CrossRef]
- Raafat, A.; Tahoun, S.S.; Aboul Ela, N.M. Palynomorph biostratigraphy palynofacies thermal maturity and paleoenvironmental interpretation of the Bajocian-Aptian succession in the OBA D-8 Well Matruh Basin Egypt. J. Afr. Earth Sci. 2021, 177, 104157. [Google Scholar] [CrossRef]
- Thusu, B. Aptian to Toarcian dinoflagellate cysts from Arctic Norway. In Distribution of Biostratigraphically Diagnostic Dinoflagellate Cysts and Miospores from the Northwest European Continental Shelf and Adjacent Areas; Thusu, B., Ed.; Continental Shelf Institute Publication: London, UK, 1978; pp. 61–95. Available online: https://pascal-francis.inist.fr/vibad/index.php?action=getRecordDetail&idt=6373089 (accessed on 5 May 2023).
- Herngreen, G.F.W.; De Boer, K.F.; Romein, B.J.; Lissenberg, T.; Wijker, N.C. Middle Callovian beds in the Achterhoek, eastern Netherlands. Meded. Rijks Geol. Dienst 1984, 37, 95–123. [Google Scholar]
- Riding, J.B. Dinoflagellate cyst stratigraphy of the Nettleton Bottom Borehole (Jurassic: Hettangian to Kimmeridgian), Lincolnshire, England. Proc. Yorks. Geol. Soc. 1987, 46, 231–266. [Google Scholar] [CrossRef]
- Smelror, M.; Leereveld, H. Dinoflagellate and acritarch assemblages from the late Bathonian to Early Oxfordian of Montagne Crussol, Rhone Vally, Southern France. Palynology 1989, 13, 121–141. [Google Scholar] [CrossRef]
- Riding, J.B.; Mariani, E.; Fensome, R.A. A review of the Jurassic dinoflagellate cyst genus Gonyaulacysta Deflandre 1964 emend. Nov. Rev. Palaeobot. Palynol. 2022, 299, 104605. [Google Scholar] [CrossRef]
- Aboul Ela, N.M.; Mahrous, H.A.R. Bathonian dinoflagellate cysts from the subsurface Jurassic of north Western Desert, Egypt. M.E.R.C. Ain Shams Univ. Earth Sci. Ser. 1990, 4, 95–111. [Google Scholar]
- Dodekova, L. New Upper Bathonian dinoflagellate cysts from northeastern Bulgaria. Bulg. Akad. Na Nauk. Paleontol. Strat. Litol. 1975, 2, 17–34. [Google Scholar]
- Thusu, B.; Vander Eem, J.G.A.; El Mehdawi, A.; Bu-Argoub, F. Jurassic-Early Cretaceous palynostratigraphy in northeast Libya. In Subsurface Palynostratigraphy of Northeast Libya; El-Arnauti, A., Owens, B., Thusu, B., Eds.; Garyounis University Publication: Benghazi-Libya, Libya, 1988; pp. 171–214. [Google Scholar]
- Smelror, M.; Arhus, N.; Melenndez, G.; Lardies, M.D. A reconnaissance study of the Bathonian to Oxfordian (Jurassic) dinoflagellates and Acritarchs from the Zaragoza region (NE Spain) and Figueira da Foz (Portugal). Rev. Esp. Micropaleontol. 1991, 23, 47–82. [Google Scholar]
- Borges, M.E.N.; Riding, J.B.; Fernandes, P.; Pereira, Z. The Jurassic (Pliensbachian to Kimmeridgian) palynology of the Algarve Basin and the Carrapateira outlier, southern Portugal. Rev. Palaeob. Palynol. 2011, 163, 190–204. [Google Scholar] [CrossRef]
- Riding, J.B.; Thomas, J.E. Dinoflagellate cyst stratigraphy of the Kimmeridge Clay (Upper Jurassic) from the Dorset coast, southern England. Palynology 1988, 12, 65–88. [Google Scholar] [CrossRef]
- Kunz, R. Phytoplankton und Palynofazies im Malm NW-Deutschlands (Hannoversches Bergland). Palaeontograph. Abt. B 1990, 216, 151–158. [Google Scholar]
- Ibrahim, M.I.A.; El Beialy, S.Y. Kimmeridgian-Barremian palynostratigraphy of the Malha-1 well, north Sinai, Egypt. Palynostratigraphie datée du Kimméridgien-Barrémien du sondage Malha-1, Nord du Sinaï, Egypte. Sci. Géol. Bull. Palynol. 1995, 48, 187–209. [Google Scholar] [CrossRef]
- Keeley, M.L.; Dungworth, G.; Floyd, C.S.; Forbes, G.A.; King, C.; McGarva, R.M.; Shaw, D. The Jurassic System in northern Egypt: I. Regional stratigraphy and implications for hydrocarbon prospectivity. J. Pet. Geol. 1990, 13, 397–420. [Google Scholar] [CrossRef]
- Mansour, A.; Gentzis, T.; Tahoun, S.S.; Ahmed, M.S.; Gier, S.; Carvajal-Ortiz, H.; Neumann, J.; Fu, X.; Wang, J. Near equatorial paleoclimatic evolution and control on organic matter accumulation during the Cenomanian in the Abu Gharadig Basin, southern Tethys: Insights from palynology, organic petrography, and geochemistry. Int. J. Coal Geol. 2023, 270, 104221. [Google Scholar] [CrossRef]
- Dale, B. Dinoflagellate resting cysts: “benthic plankton”. In Survival Strategies of the Algae; Fryxell, G.A., Ed.; Cambridge University Press: Cambridge, UK, 1983; pp. 69–136. [Google Scholar]
- Lister, J.K.; Batten, D.J. Stratigraphic and palaeoenvironmental distribution of Early Cretaceous dinoflagellate cysts in the Hurlands farm borehole, West Sussex, England. Palaeontograph. Abt. B 1988, 210, 9–89. [Google Scholar]
- Brinkhuis, H. Late Eocene to early Oligocene dinoflagellate cysts from the Priabonian type-area (Northeast Italy): Biostratigraphy and paleoenvironmental interpretation. Palaeogeogr. Palaeoclimatol. Palaeoecol. 1994, 107, 121–163. [Google Scholar] [CrossRef]
- Riding, J.; Penn, I.E.; Woollam, R. Dinoflagellate cysts from the type area of the Bathonian Stage (Middle Jurassic; England). Rev. Palaeobot. Palynol. 1985, 45, 149–169. [Google Scholar] [CrossRef]
- Emery, D. Sequence Stratigraphy. In Sequence Stratigraphy; Emery, D., Myers, K., Eds.; Blackwell Science: Hoboken, NJ, USA, 1996; pp. 211–237. [Google Scholar]
- Johnson, J.G.; Murphy, M.A. Time-rock model for Siluro-Devonian continental shelf, western United States. Geol. Soc. Am. Bull. 1984, 95, 13492. [Google Scholar] [CrossRef]
Disclaimer/Publisher’s Note: The statements, opinions and data contained in all publications are solely those of the individual author(s) and contributor(s) and not of MDPI and/or the editor(s). MDPI and/or the editor(s) disclaim responsibility for any injury to people or property resulting from any ideas, methods, instructions or products referred to in the content. |
© 2023 by the authors. Licensee MDPI, Basel, Switzerland. This article is an open access article distributed under the terms and conditions of the Creative Commons Attribution (CC BY) license (https://creativecommons.org/licenses/by/4.0/).