Article

Impact of DEMs for Improvement Sentinel 2 Lithological Mapping Utilizing Support Vector Machine: A Case Study of Mineralized Fe-Ti-Rich Gabbroic Rocks from the South Eastern Desert of Egypt

1
Department of Mineralogy and Geology, University of Debrecen, 4032 Debrecen, Hungary
2
Department of Geology, Tanta University, Tanta 31527, Egypt
3
Geology Department, Faculty of Science, Al-Azhar University, Nasr City, Cairo 11884, Egypt
4
Department of Civil Engineering, Faculty of Engineering, Northern Border University, Arar 91431, Saudi Arabia
*
Authors to whom correspondence should be addressed.
Minerals 2023, 13(6), 826; https://doi.org/10.3390/min13060826
Submission received: 3 May 2023 / Revised: 9 June 2023 / Accepted: 11 June 2023 / Published: 18 June 2023

Abstract

:
Fused remote sensing datasets have greatly contributed to enhancing lithological targets and providing significant information for mineral exploration. For instance, multispectral datasets can discriminate rock units through their unique spectral signatures. Digital Elevation Models (DEMs) could be an effective tool boosting lithological discrimination based mainly on their topographic variations. Consequently, the current study applied the power of the support vector machine (SVM) algorithm and the integrated Phased Array L-type band Synthetic Aperture Radar (PALSAR) DEM and multispectral Sentinel 2 data to: 1—Create an updated lithological map of a poorly mapped arid terrain (Khashir-Ras El-Kharit district, Eastern Desert of Egypt), and 2—Compare and assess the distribution of ferrogabbros with the aim of improving the localization of these rock bodies and investigating their mineral content. Our results enhanced the lithological mapping and revealed a better generalization of mineralized ferrogabbros when the input was a fused DEM with Sentinel 2 compared to the salt and pepper effect observed when adopting the Sentinel 2 solely as the input data. Additionally, the current research strongly recommends detailed exploration programs for Fe-Ti oxide ores within the gabbroic rocks delineated through the resultant thematic map. The ferrogabbros were subjected to a comprehensive analysis involving whole rock geochemistry, XRD, EDX, and light-reflecting investigations, which revealed the existence of magnetite, titanomagnetite, and hematite. The titanomagnetite crystals display subhedral morphology and exhibit fine- to medium-grained surfaces with irregular shapes. X-ray diffraction (XRD) analysis revealed the presence of magnetite and hematite in the concentrated Fe-Ti oxides. Additionally, the whole rock geochemistry highlighted the origin of the ferrogabbros and their proposed tectonic setting as an alkaline to calc-alkaline magma type that developed in a continental arc setting.

1. Introduction

The Precambrian Nubian Shield in Egypt exhibits a distinctive elongated shape, resembling a stretched belt, with its widest portion located in the south and gradually narrowing as it extends towards the north. According to Abdel Naby et al. [1] and Abdel Naby and Frisch [2], the shield can be classified into four primary rock sequences: a gneiss assemblage, an ophiolite assemblage, an island arc assemblage, and granitoid intrusions. In the South Eastern Desert (SED) where our study area is located, the exposed Precambrian basement spans over 30,000 square kilometers. However, it represents a smaller area compared to the exposures in Sinai, the North Eastern Desert (NED), or the Central Eastern Desert (CED). Despite its relatively limited size, the SED holds significant research potential, attracting the attention of researchers for their future investigations. Nevertheless, its remote location, poor accessibility, and the absence of asphalt roads pose challenges for researchers seeking to explore this region. Thus, remote sensing becomes mostly an indispensable tool implemented in geological investigations on such terrains.
As an accepted alternative to primarily conventional field mapping, remote sensing datasets have been increasingly utilized in geological mapping over the last two decades [3,4,5,6,7,8,9,10,11,12] due to saving time, effort and delivering reliable outputs. Lithological discrimination is substantially attributed to unique spectral signatures of pixels representing various mineralogical and lithological contents [9,13]. These spectral responses may be affected by atmospheric conditions, the utilized spatial and spectral resolutions, weathering outputs, and vegetation [5]. Consequently, several researchers supplemented this optical information with other datasets including spectrometric gamma-ray data [14,15], aeromagnetic data [15,16], combined optical sensors and radar data [9], for better lithologic mapping. These studies consider that each rock type is supposed to have its unique radiometric content, characteristic magnetic tenor, and differentiating response to microwave and optical wavelengths. Similarly, the same rock unit should mostly have the same emplacement mode, textural appearance and elevation. Thus, the rock unit elevation, provided by DEMs, will be tested in the current study to investigate its impact on enhancing lithological mapping delivered by optical datasets utilizing a support vector machine for thematic allocation.
Sentinel 2, as one of the latest optical sensors that can provide medium to high spatial (10–60 m) and high spectral resolutions, is widely utilized in geological mapping. It can discriminate lithological targets and several types of hydrothermal alterations [7,8,9,14,17,18,19,20]. Accurate topographical information could be extracted through DEMs, especially if they are built utilizing radar data (e.g., PALSAR DEM) that are not affected by weather conditions. Thus, Sentinel 2 data and ALOS PALSAR DEM were selected as efficient datasets to be combined for enhancing the geological mapping. Toward impartial lithological classifications, several Machine Learning Algorithms (MLAs) have been widely implemented [9,14,21,22,23,24,25,26,27,28,29,30,31,32]. One of the most powerful algorithms that is mostly utilized and recommended by several studies is the support vector machine [5,9,14,29,31,33,34,35,36,37,38].
Therefore, the primary aim of this study is to create a novel thematic lithologic map by integrating multispectral data from Sentinel 2 and topographical characteristics derived from PALSAR DEM. This integration will be achieved using support vector machines (SVM) to exploit the potential of DEMs in enhancing lithological mapping. Furthermore, the generated map will be compared with a thematic map obtained solely from Sentinel 2 data in order to quantitatively assess the impact of DEMs on improving lithological mapping accuracy. Additionally, and as accurate lithological mapping is a substantial stride towards the better identification of mineralized rock units, the results of our approach were adopted to detect the distribution of gabbroic rocks within the study area, to investigate their mineralized content and the associated ores besides highlighting the origin and petrogenesis of Fe-Ti mineralization in gabbroic rocks. Our primary focus was directed toward ferrogabbros (FGb) due to their economic significance and the heightened attention they have received in recent research [39,40,41] conducted across various regions of the Eastern Desert of Egypt. By precisely identifying the locations of mineralized gabbroic rocks and their associated ores, we aim to gather valuable insights into potential mineral resources. The current case study was selected due to its higher lithological variability (12 lithological targets) and the existence of mafic-ultramafic assemblages represented by gabbroic rocks and associated ores (Fe-Ti oxide ores). Thus, the improved lithological mapping may provide better guidance for these rock units, saving time and efforts in further explorations.

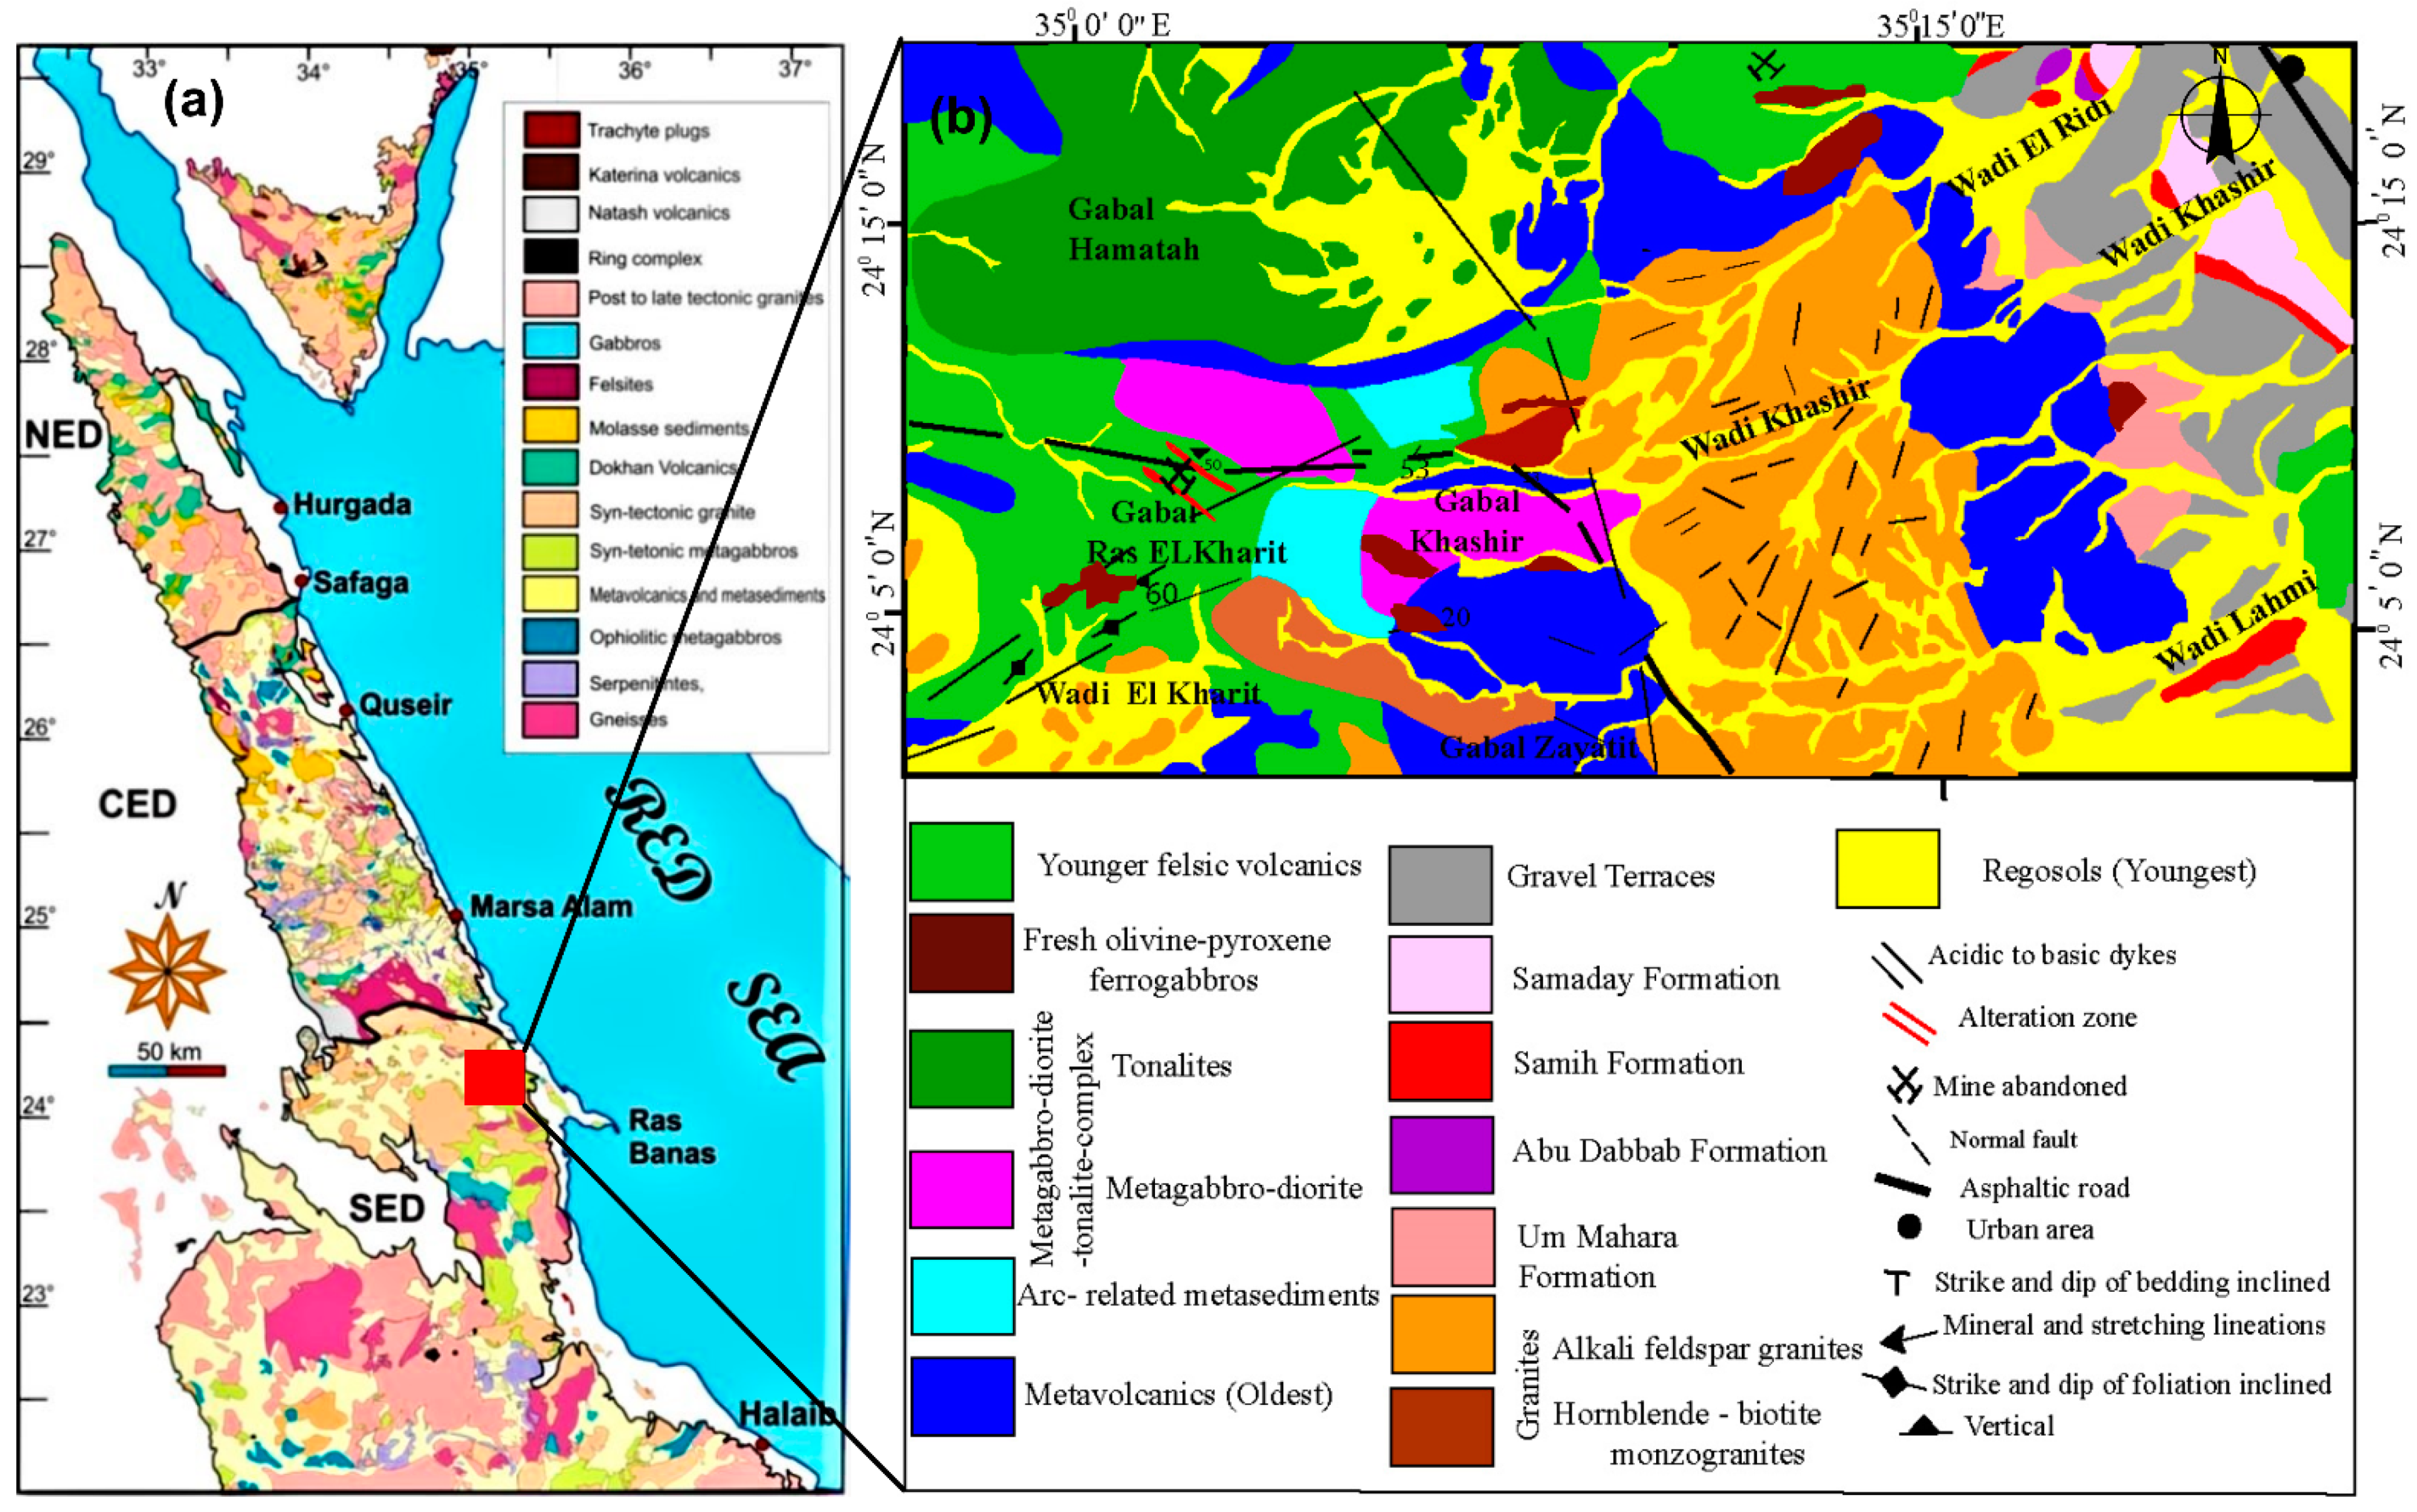
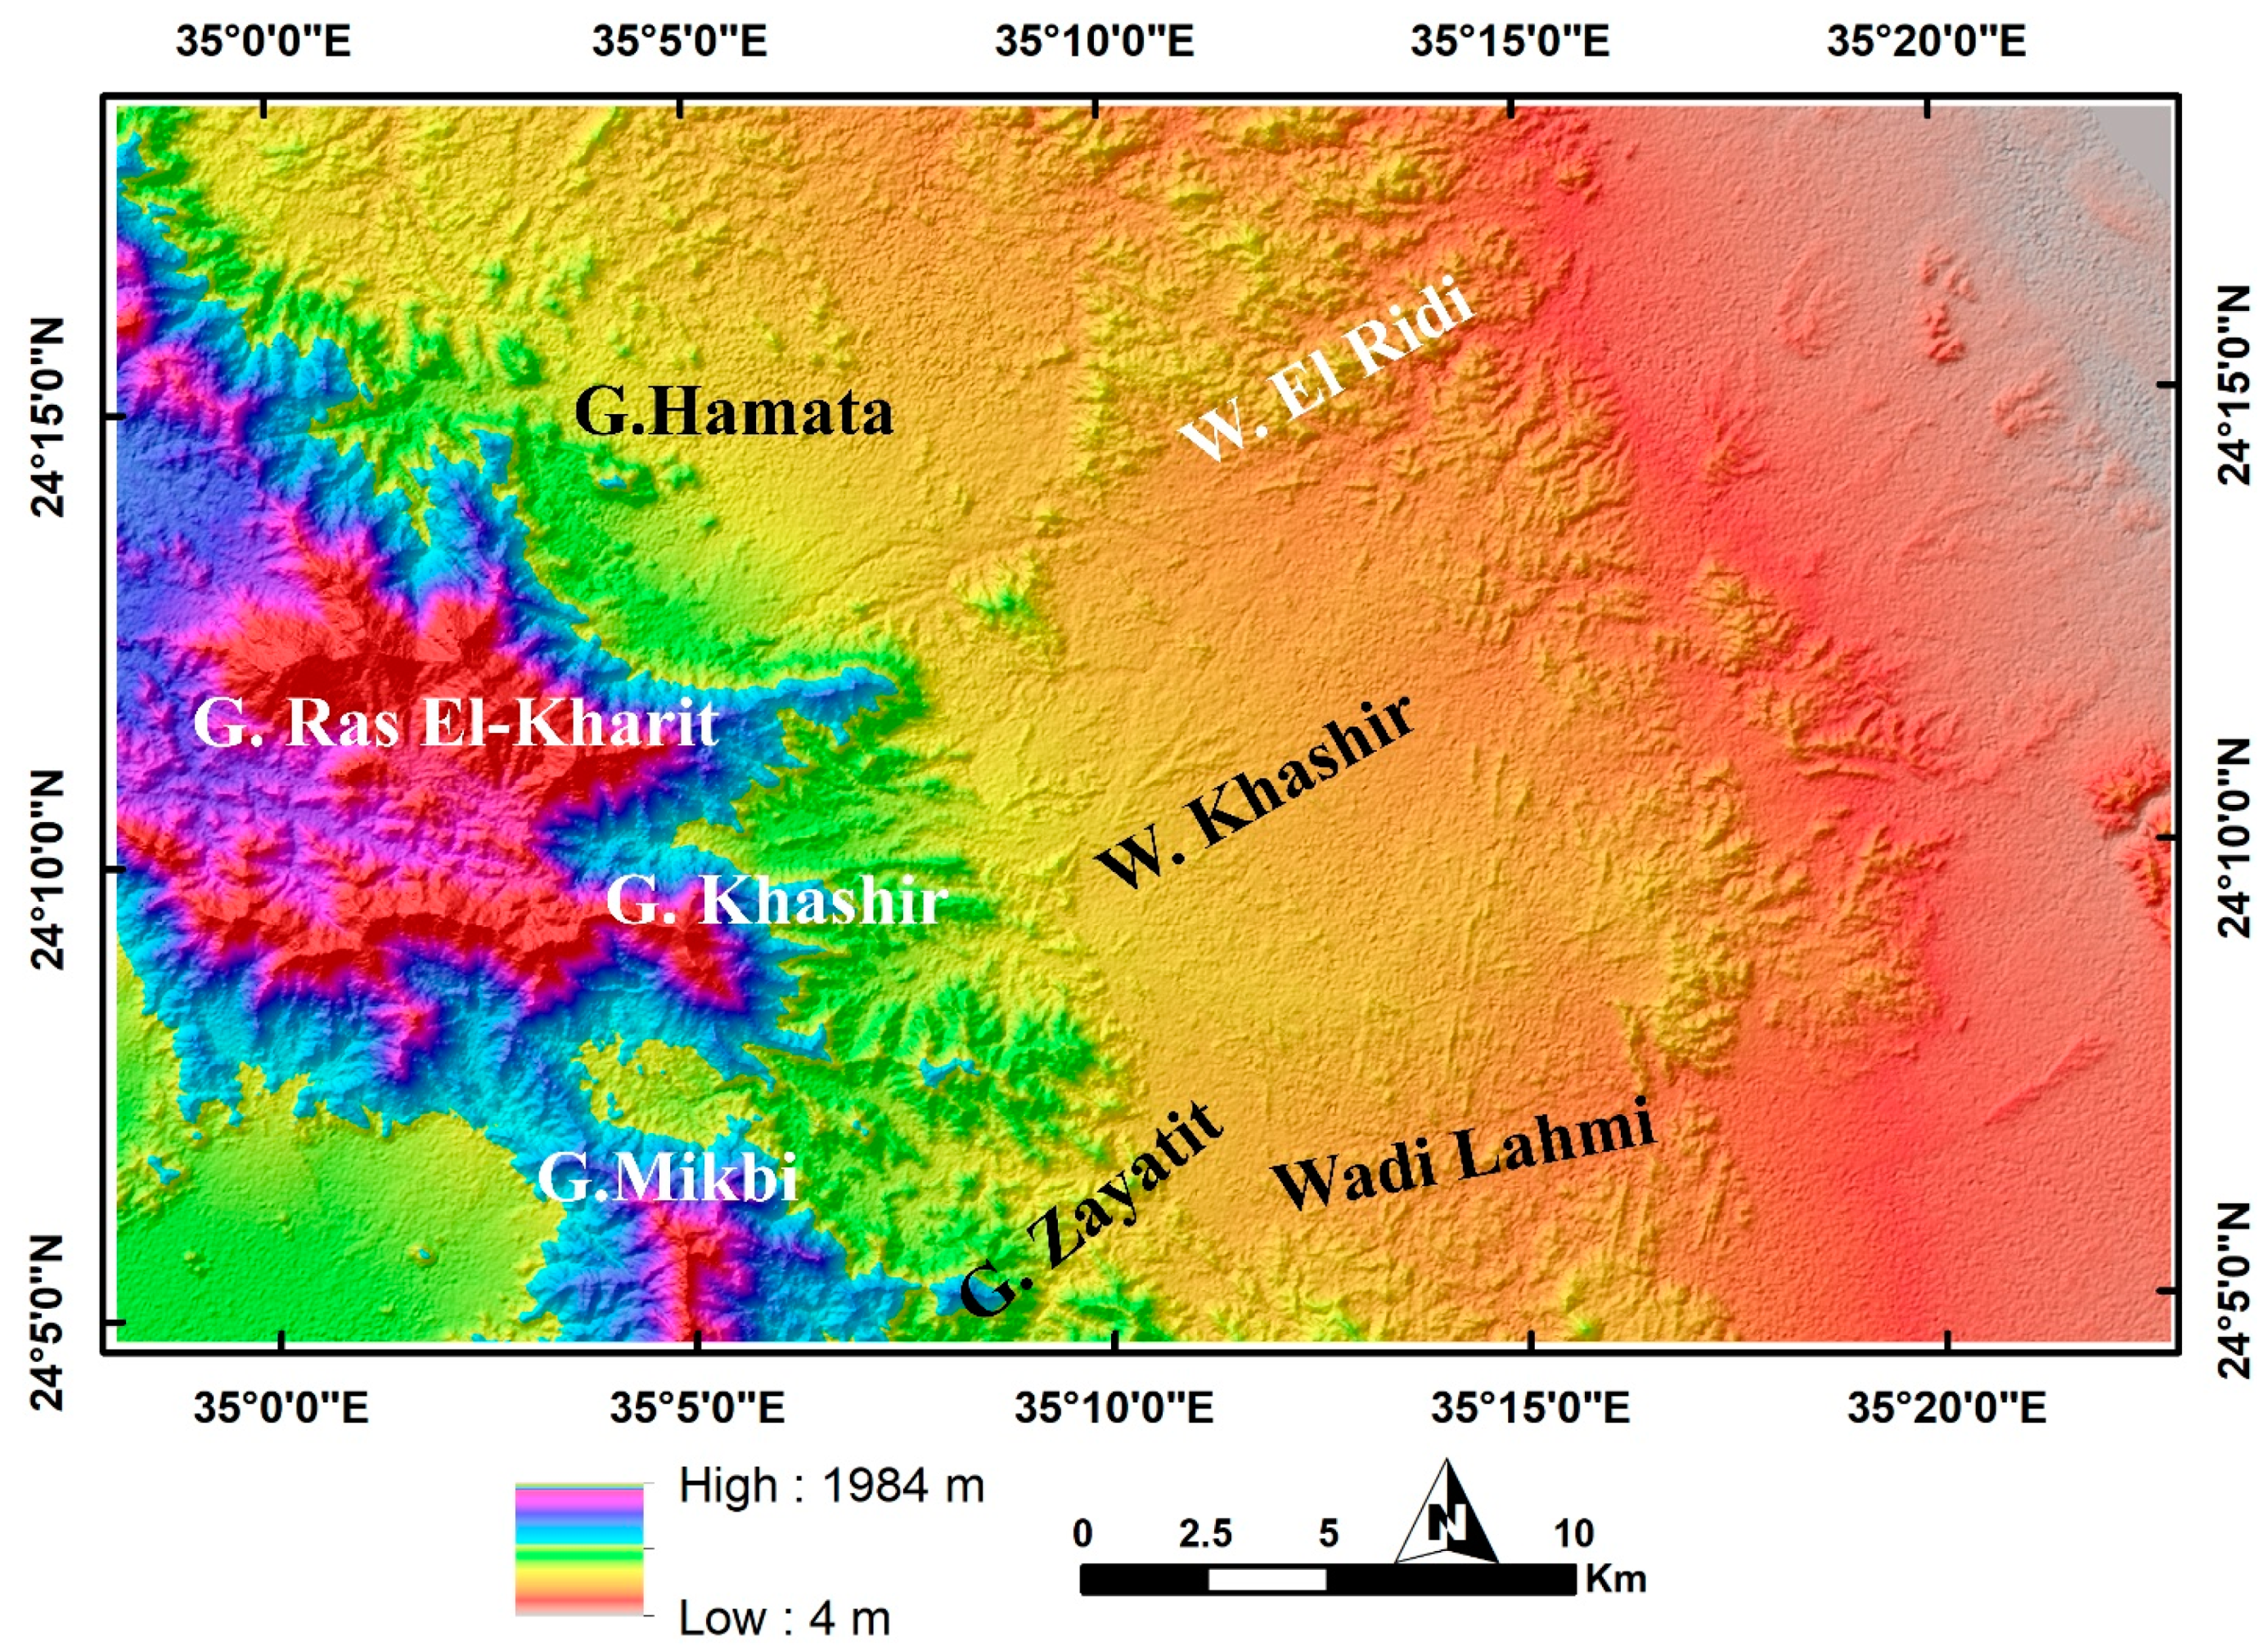
2. Study Area and Geological Setting

The study area (Wadi Khashir and Ras El-Kharit) is located at the central part of the South Eastern Desert, Egypt (Figure 1a). It is situated between the entrance of the well-known wadis of Abu Ghusun and Lahmi on the coastal Red Sea. Wadi Khashir and Ras El-Kharit are totally covered by Precambrian basement rocks of the Southern Eastern Desert and Phanerozoic rocks of Samaday Formation. According to the previous geologic map of EGSMA, 1997 [42]; the main rock units in the study area are divided into Neoproterozoic basement rocks including metavolcanics, arc-related metasediments, metagabbro–diorite–tonalite complex, fresh olivine–pyroxene ferrogabbros, younger felsic volcanics, granites, dykes, veins, and plugs, and Phanerozoic sedimentary rocks represented mainly by Samaday Formation and Samih Formation, as shown in Figure 1b. We selected this area based on the existence of 12 targets with complex rock units, which provided a rigorous test for our approach. Additionally, the area is known to contain mineralized ferrogabbros that require further investigation and exploration. Therefore, we applied our techniques to these Neoproterozoic lithologies with the aim of successfully identifying the distribution of ferrogabbros for future exploration.
Metavolcanics are one of the common lithologies within the study area. The investigated metavolcanics comprise meta-andesites and metabasalts. These metavolcanics have deep blackish and dark greyish colors and are fine- to medium-grained. Field observation indicates they are highly altered, fractured, massive and sheared. The metavolcanics are extruded by younger felsic volcanics (rhyolites) and intruded by the alkali feldspar granites in the studied district. The field observation also indicates that the arc-related metasediments are relatively younger than the proper metavolcanics in the studied district. The arc-related metasediments are directly extruded by granitic and rhyolitic dykes and quartz veins. The metagabbro–diorite–tonalite complex occupies the east, west, and central parts of the study district. They occur as massive rocks that are medium- to coarse-grained and have a dark grey color. The cataclastic rocks exposed at the western portion of Gabal Ras El-Kharit exhibit some alteration zones owing to its hydrothermal system. The younger felsic volcanics rocks cover a large area from the Wadi Khashir and Gabal Ras El-Kharit district. These volcanics occasionally, sheared, fractured, and highly ferruginated rhyolites and altered mineralized rhyolites. The rhyolites cropping out at the western portion of Wadi Khashir are coincidental with the general behavior of the volcanic suite erupted as an anorogenic extrusion.
The current research focused mainly on fresh olivine–pyroxene ferrogabbros. The latter occupy the western, eastern, and northern parts of the Wadi Khashir area, are medium- to coarse-grained, and a dark greyish to dark greenish color at the fresh surface. These rocks are massive, with lustrous features, and are slightly deformed. These ferrogabbros exhibit a reddish-brown weathered surface owing to their oxidation of titaniferous magnetite crystals. They sometimes forms spheroidal weathered masses and are composed, essentially, of pyroxenes and olivine. These ferrogabbros bear some ore minerals, such as magnetite and titanomagnetite crystals. The most common of the accessory constituents is an opaque ore mineral of some kind, the most frequent one is titaniferous magnetite (titanomagnetite).

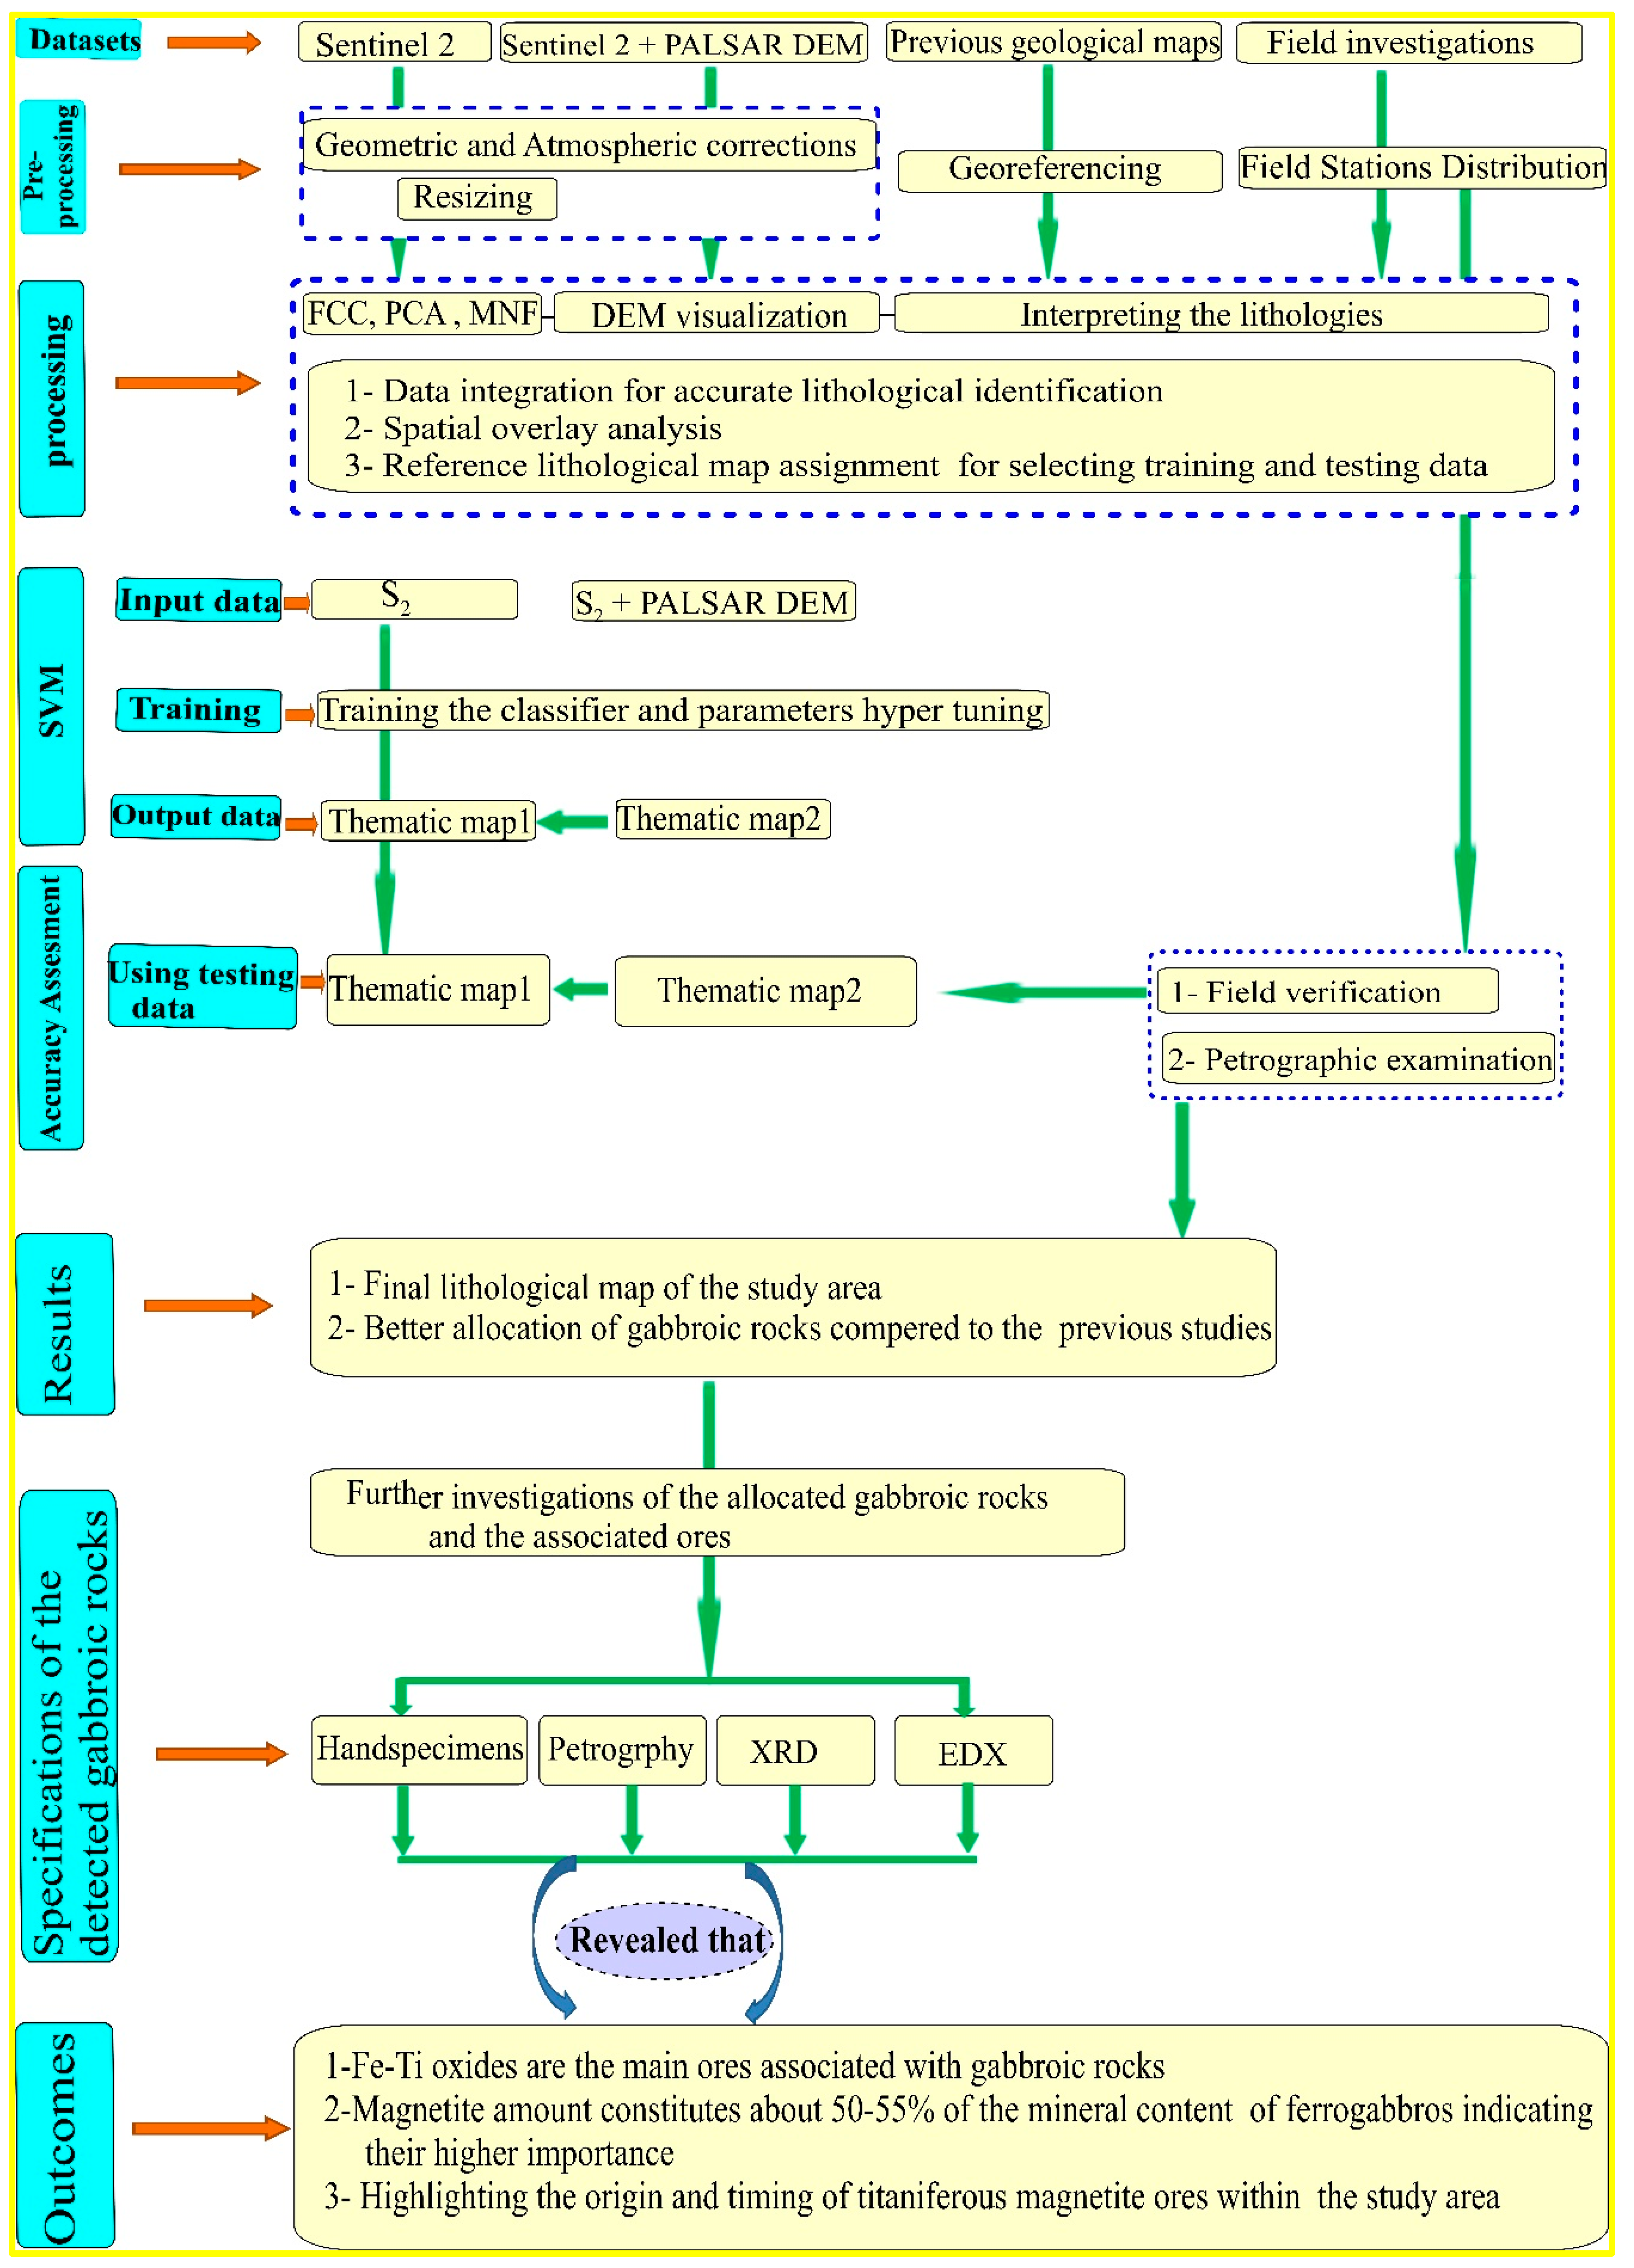
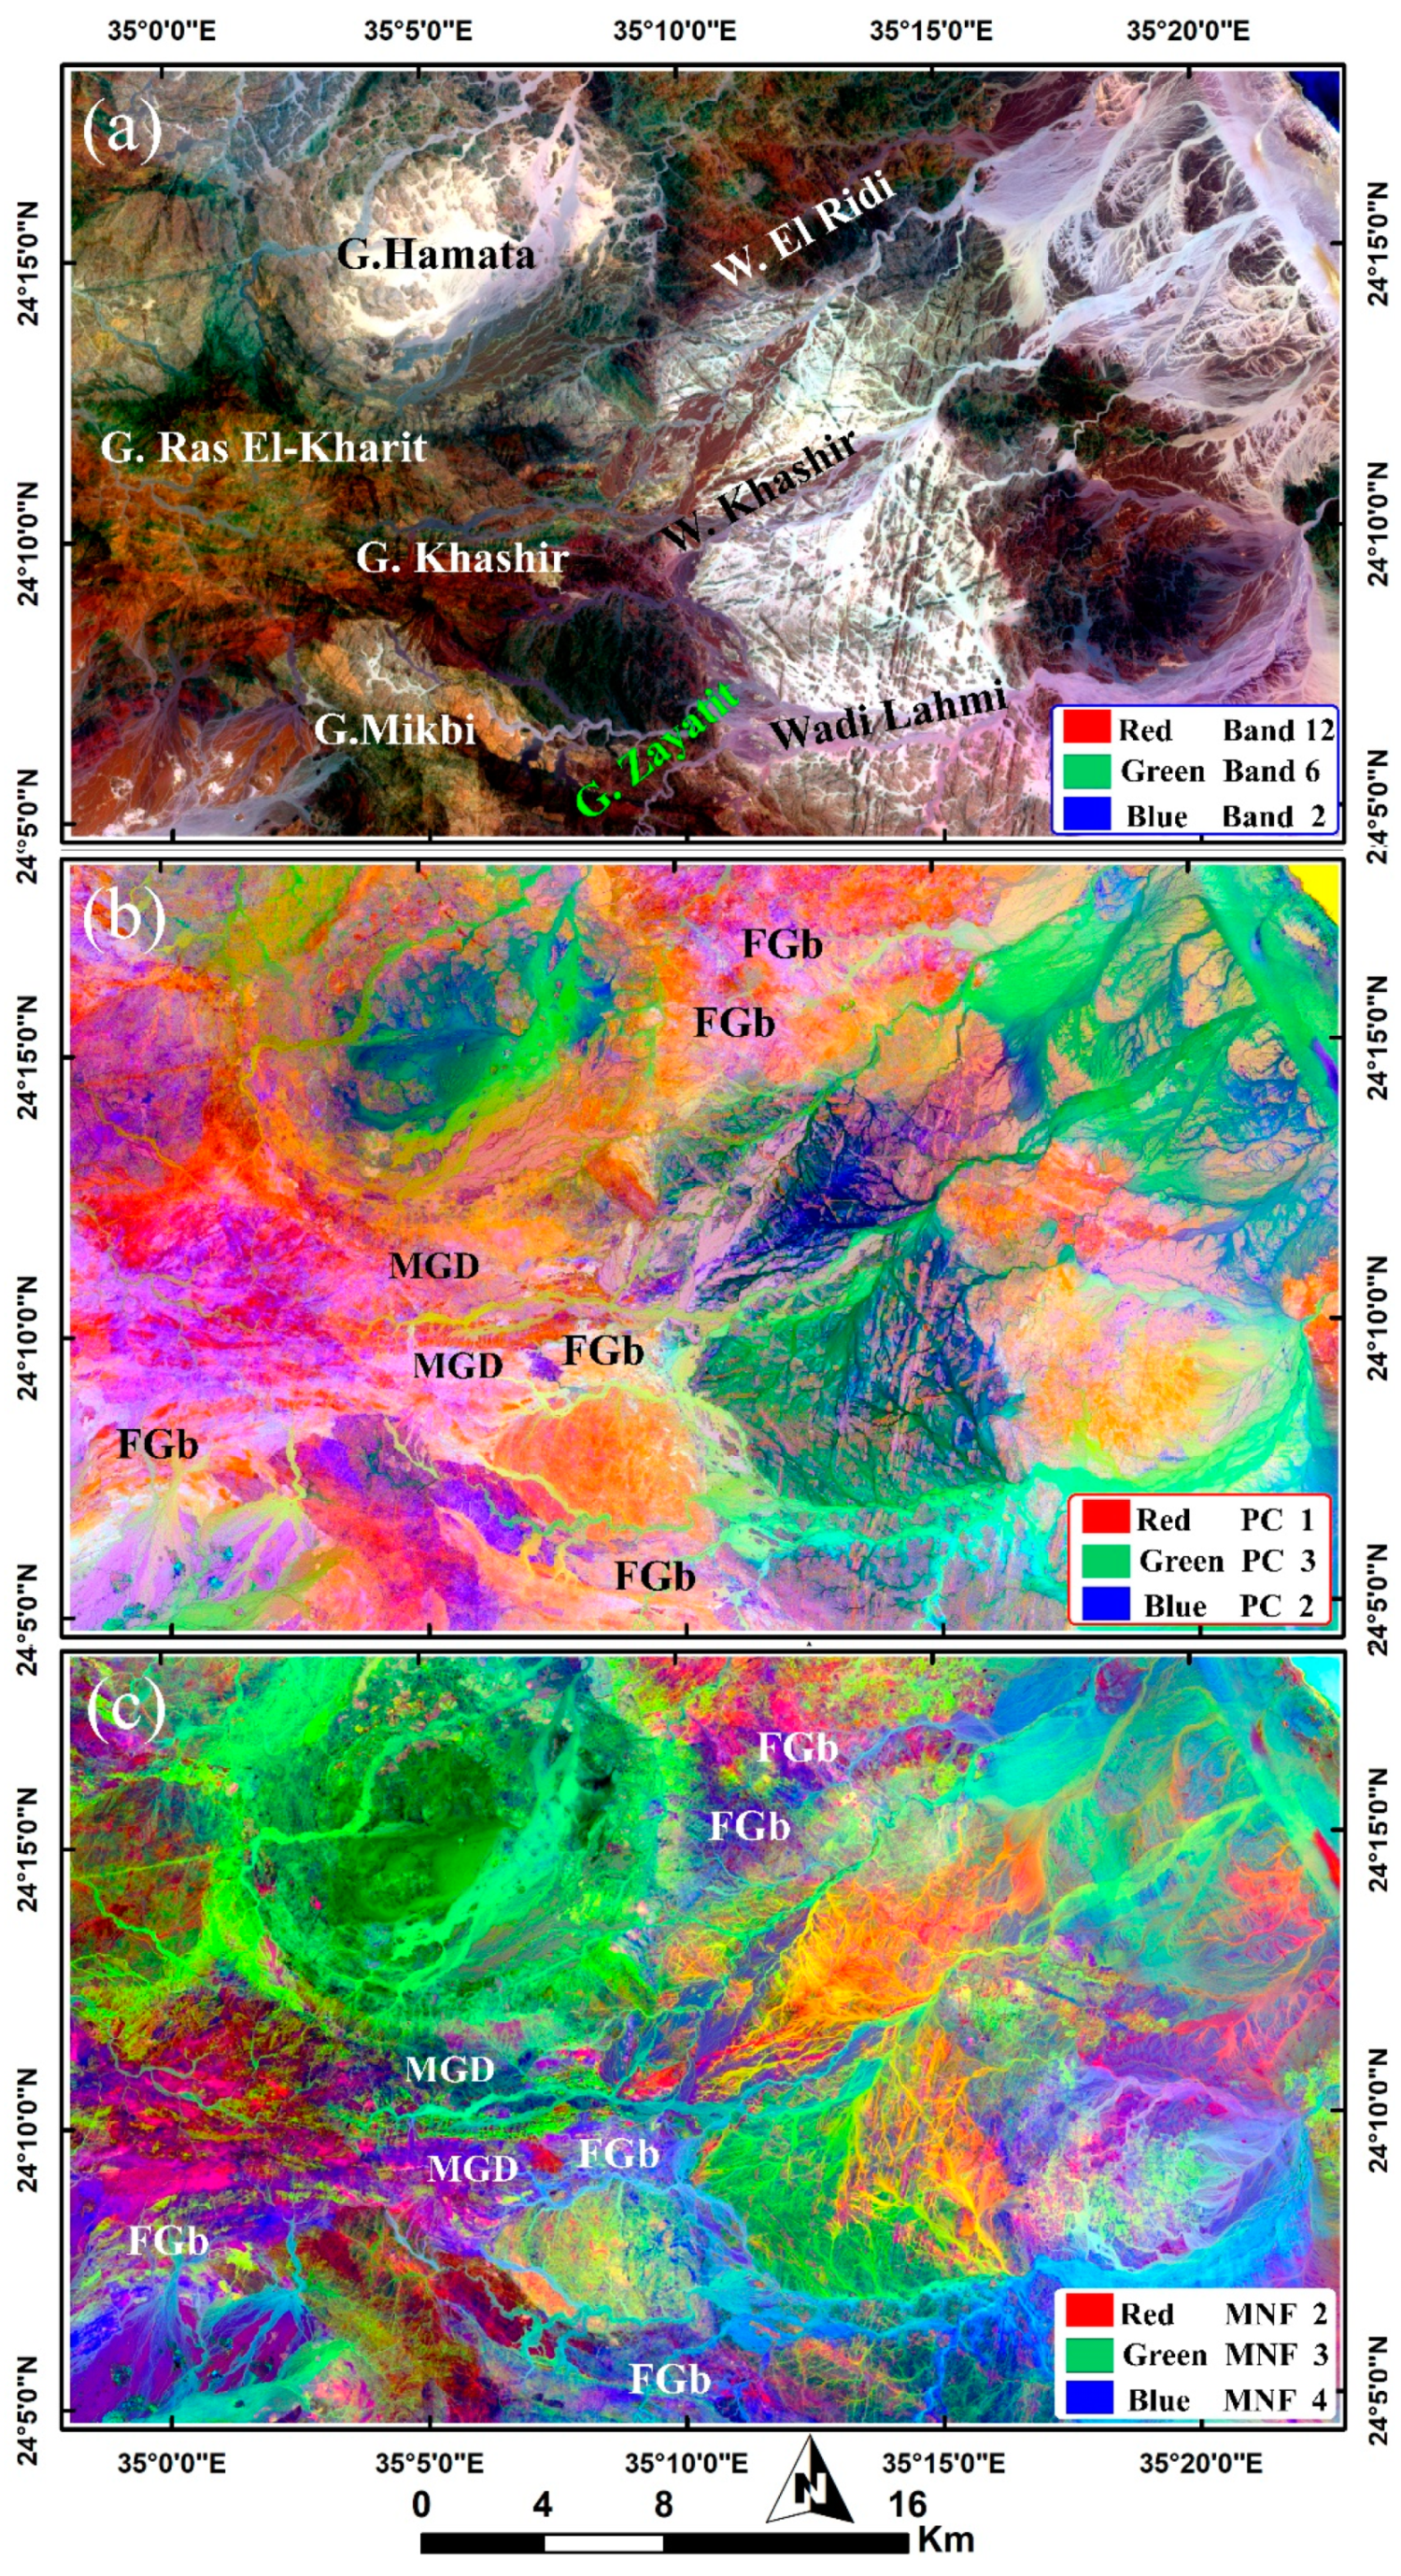
3. Materials and Methods

3.1. Datasets

3.1.1. Sentinel 2 (S2)

As a global (latitude coverage from −56° to 84°) monitoring program, the Sentinel 2 satellite was launched by the European Space Agency (ESA) on 23 June 2015. Toward better spatial monitoring compared to the freely available satellites, S2 is provided by four bands of 10 m pixel size and a 20 m spatial resolution for six bands. In addition, its higher spatial resolution, global coverage, 290 km field of view, and wide swath, a high spectral coverage for visible Near Infrared (VNIR) and short-wave infrared (SWIR), is evident via 13 spectral bands, as shown in Table 1. These excellent characteristics make S2 a good choice for several geological applications. Consequently, a cloud-free, Level-1C product covering the study area was accessed through ESA (Copernicus Open Access Hub) and handled and preprocessed with the aid of QGIS and SNAP. This scene was acquired on 6 July 2021, radiometrically (top-of-atmosphere reflectance) and geometrically corrected (UTM zone 36 projection with WGS 84 datum) and resized to fit the borders of the study area. For the purpose of the current study, lower spatial resolution bands (60 m) were excluded.

3.1.2. ALOS-PALSAR DEM

As a joint project between JAXA and the Japan Resources Observation System Organization (JAROS), The Advanced Land Observing Satellite (ALOS) was launched on 24 January 2005, and provided 3 sensors, including a Panchromatic Remote-sensing Instrument for Stereo Mapping (PRISM), Advanced Visible and Near Infrared Radiometer type 2 (AVNIR-2), and a Phased Array type L-band Synthetic Aperture Radar (PALSAR). For the purpose of the current study, and with the aid of an L-band (1.27 GHz), a 12.5 m pixel size terrain corrected DEM (AP_07509_FBD_F0470_RT1) was acquired on 22 June 2007; accessed through the Alaska Satellite Facility (https://asf.alaska.edu/, accessed on 22 June 2007), and characterized by a Fine Beam double polarization mode (HH + HV). An ascending flight direction with a 34.3° off-nadir angle and 2.057 Faraday rotation was implemented, as shown in Figure 2.
The integration of Sentinel 2 and the PALSAR DEM data in this study offers several advantages for lithological mapping and mineralized gabbroic rock detection. Sentinel 2 provides up to 10 m of multispectral imagery, enabling the detailed analysis of surface reflectance patterns and the classification of different lithological units based on their unique spectral signatures. Additionally, PALSAR DEM data provides valuable information on topographic variations, allowing the incorporation of topographic attributes to enhance accuracy. The combined use of these datasets provides complementary information, enabling a comprehensive analysis of the spectral and topographic characteristics for the more accurate identification and delineation of lithological units and potential mineral resources in the study area.

3.2. Methods

3.2.1. Reference Geological Mapping and Feature Selection

A representative reference geological map is a veracious yardstick for accurate sampling and for delivering reliable results in the current investigation. Consequently, several image processing techniques, including False Color composites (FCCs), Principal Component Analysis (PCA) and Minimum Noise Fraction (MNF), besides a previous geological map [42], were integrated to discriminate between the complicated lithologies of the study area. FCC is a normal RGB representation of 3 bands (any combination except the true-color composite) that depends mainly on the ability of each band to enhance lithological features, based on their spectral coverage [11,43,44,45,46]. Combining representative bands can greatly improve the identification of features. The current research adopted the FCC 12/6/2 in RGB, respectively, for visualizing and discriminating the lithological units within the study area. PCA is a dimensionality-reduction statistical method used to obtain information about features aiming to better highlight certain targets [47]. This could be achieved by converting correlated variables to uncorrelated variables through an orthogonal transformation known as principal component analysis [43,44]. However, although PCA significantly helps to reduce the dimensions of satellite data, it mostly retains the important information of the images. Basically, the preceding bands contain more data variance compared to subsequent bands. In the current research, PCA 132 was adopted as the best PCA combination for discriminating the lithological targets within the study area. The MNF technique is a well-known image processing technique used mainly for noise whitening, noise reduction, and feature extraction [43,44,48,49]. Two main steps are involved with MNF, the first includes the decorrelation and rescaling of the data. In the second step, principal components are generated from the noise-reduced data [50]. Thus, MNF is considered a modified version of the PCA method. By applying MNF to the Sentinel 2′s bands 2, 3, and 4, it was possible to enhance the lithological units within the study area. A flow chart has been introduced in Figure 3 to illustrate the adopted methodology in the current study.
Twelve rock units including metavolcanics (MVs), arc-related metasediments (AMS), the metagabbro–diorite complex (MGD), tonalities (Ton), fresh ferrogabbros (FGb), younger felsic volcanics (YFV), hornblende–biotite monzogranites (Mon), alkali feldspar granite (AFG), Samaday formation (SMD), Samih formation (SMH), gravel terraces (Grv) and Wadi deposits (WDs) are delineated. Each of the FCC, PCA, or MNF images (Figure 4a–c) could highlight certain rock units. For instance, FCC 12/6/2 in RGB, respectively, clearly distinguished the alkali feldspar granite in a highly dissected area with a white background, metavolcanics in dark black color, metagabbro–diorite and ferrogabbros in dark red colors, other granitic rocks (monazite and tonalite) and younger felsic volcanics in yellowish-beige to yellowish-brown colors. PC1, PC3, and PC2 in RGB, respectively, highlighted gabbroic rocks in pinkish violet color, metavolcanics in orange color, granitic rocks in blue-violet colors, alkali feldspar granites in dark blue with a greenish background due to the effect of weathering, and dissection by dyke swarms. Similarly, MNF 2/3/4, respectively, in RGB discriminated granitic rocks in green color, with different tints depending on the type of granite, and gabbroic rocks in violet colors.
Training pixels were randomly selected according to the spectral characteristics of lithologies displayed on the reference map and known field stations. According to Shebl et al. 2021 and Kumar et al. 2020 [14,29], a training pixel selection percentage of 70% to 80% (of the selected pixels) was recommended. Accordingly, the current study adopted this range for selecting the training and testing pixels, as indicated in Table 2. The selection of testing data was conducted with the utmost care, ensuring that they remained unseen by the classifier throughout the allocation process.
Two main data inputs (Sentinel 2 and combined Sentinel 2–PALSAR data) were prepared for testing via SVM and compared in terms of their lithological mapping potentiality, utilizing the same training and testing pixels. To ensure unbiased results, the Sentinel 2 data and PALSAR DEM were resampled to 10 m (pixel size of the reference map) utilizing the cubic convolution method. The spectral information was fused with topographic data utilizing the stacked-vector method [9,51]. The latter was employed to integrate information from different datasets (Sentinel 2 imagery and DEM). The process involved the following steps: (1) Gathering, cleaning and georeferencing the datasets. (2) Ensuring spatial alignment between the datasets to maintain a consistent spatial extent and resolution. (3) For each pixel location, the pixel values from both datasets were extracted and stacked together to create a continuous vector representing the fused information. This concatenated representation enabled the exploration of relationships and patterns across the datasets. The fused data, in the form of the stacked vector, was subsequently utilized for further analysis using SVM. This approach provided the advantage of integrating multiple datasets into a unified representation, capturing complementary information, and enhancing the overall understanding of the data.

3.2.2. Support Vector Machine (SVM)

As a supervised technique introduced by Cortes and Vapnik [52], SVM is considered an efficient classifier in setting apart lithological classes through building a decision boundary hyperplane [37,53,54]. Finding a hyperplane that divides data points into distinct classes is the basic purpose of an SVM. Because the margin between the two classes of data points is maximized by this hyperplane, SVMs are sometimes referred to as “maximum margin classifiers [52,55,56]. Additionally, an SVM depends mainly on using the kernel, which enables the mapping of data points into higher-dimensional feature spaces where a hyperplane can more easily divide them. Several comparisons of different classifiers utilized in allocating rock units can be found at Shebl and Csámer 2021 [9] and references therein, and most of them give a preference for an SVM. In the current study, Radial Basis Function (RBF) was selected as a kernel, the Gamma in kernel function assigned was 0.1 for the S2 bands and 0.09 for the Combined S2 and PALSAR DEM, and the misclassifications penalty parameter was 100.
We employed a trial-and-error approach, conducting over 20 iterations to allocate the rock units accurately. Previous studies in similar terrains and the spatial distribution of our field stations guided our decision about selecting the training and testing data. We comprehensively analyzed the lithological classes and selected representative samples using a combination of oversampling and undersampling. We ensured a minimum of 70% training data, randomly selected based on field observations. These measures aim to prevent inaccurate classification.

3.2.3. Analytical Methods

X-ray diffraction analysis (XRD), backscattered electron (BSE) imaging, X-ray fluorescence (XRF), and an energy-dispersive X-ray spectroscopy (EDX) spot analysis were conducted at the laboratories of the Nuclear Materials Authority of Egypt to elucidate the nature and characteristics of the ferrogabbros. The X-ray diffraction technique (XRD) was used to identify the unknown minerals using a PHILIPS PW 3710/31 diffractometer, scintillation counter, Cu-target tube, and a Ni filter at 40 kV and 30 mA. This instrument is connected to a computer system using a powder diffraction program and a PDF-2 database for mineral identification. The ESEM model (PHILIPS XL 30) fitted with an energy dispersive X-ray analysis (EDAX) unit was used. The EDX analysis is considered a semi-quantitative analysis since hydrogen is not analyzed. The X-ray fluorescence technique (XRF) was used to determine the trace element concentrations (ppm) via PHILIPS X’ Unique-II spectrometer with the automatic sample changer PW 1510. This instrument is connected to a computer system using the X-40 program for spectrometry. Trace elements’ concentrations are calculated from the program’s calibration curves, which are set up according to some international reference materials (standards). The detection limit for the elements measured using the XRF technique is estimated at 2 ppm for Rb, Nb, Ga, Y and Sr, and at 8 ppm for Pb and Cu, and 5 ppm for other measured trace elements. The determination of the major oxides is achieved by using conventional wet chemical techniques [57]. The spectrophotometer is used to measure the SiO2, TiO2, Al2O3 and P2O5 contents (%), while the flame photometer is used to measure the Na2O and K2O contents (%). The Fe2O3, FeO, MgO and CaO contents (%) were analyzed by means of a complex titrimetric technique using EDTA. The loss on ignition, (L.O.I.) was determined by heating.

4. Results

Utilizing the training and testing datasets, the generalization process was executed over both the S2 data and the fused S2–PALSAR DEM. The allocation accuracy was assessed utilizing the widely used producer accuracy (PA), user accuracy (UA), error matrix, kappa coefficient (K), overall accuracy (OA), and intensive fieldwork over the study area. Generally, embedding PALSAR DEM in the generalization process yields a more accurate result, and a significant enhancement in the classifier performance is noticed for most of the classified lithologies, as shown in Table 3. Moreover, it raised the overall accuracy from 84.22% (utilizing S2 only) to 87.86% (S2 + PALSAR DEM). Undoubtedly, this increase in the allocation of OA is attributed to the role of PALSAR DEM in categorizing rocks of the same elevation to a single output class, which in turn, mostly resolves the spectrally confused pixels (in case of the S2 only) and helps the SVM to appropriately allocate the hyperplane and classify those pixels. This is manifested by the statistical analysis given through the error matrix, as shown in Table 3, where most of the rock types are correctly classified utilizing the combined PALSAR and S2 compared to implementing solely the S2 data. A comprehensive comparison of the resultant thematic layers demonstrates the evident enhancement through diminishing the misclassified pixels and the reduction of the salt and pepper effect, as shown in Figure 5 and Figure 6.
A closer investigation of the classified targets and the utilized input data was performed to highlight the main coincidence and inharmoniousness in the outputs. For instance, the water and gravel terraces are classified completely correctly (100% UA and PA) for the two datasets, as both have unambiguous spectral characteristics, and any enhancement in their categorization is not expected by adding PALSAR DEM. Similarly, SMH is well-categorized utilizing the Sentinel 2 data (100% PA and UA); however, a commission error (2.15%) is noticed with the S2 + PALSAR data due to classifying only 2 pixels of the Wadi deposits as SMH. This error sharply increased in the case of SMD, where additional pixels of Wadi deposits are classified as SMD at the eastern part of the study area.
These misclassifications are attributed to the effect of weathering, where the eastern side of the study is always struck by severe storms that could easily weather these sedimentary rocks, and the weathering products are distributed along with lower elevation Wadi deposits; that is why several misclassifications are introduced with the PALSAR DEM thematic result.
Being the lower elevation lithological target within the study area, the Wadi deposits’ class could receive several other weathering products resulting in a general decrease in the OA of the Wadi deposits due to the included mixed spectral signatures when only S2 data is used. This is clear even when investigating the FCC, MNF and PCA images where the Wadi deposits’ tone may significantly differ from one area to the other. Consequently, supplementing the S2 spectral data with PALSAR DEM greatly delineates Wadi deposits, with their lower elevation, and this is clearly reflected by the higher PA and UA results. For instance, comparing the Wadi El Ridi main trunk and its transection within the alkali feldspar granites clearly demarcates the usefulness of PALSAR DEM in the exact delineation of the Wadi deposits, and separating these from the surrounding lithological classes, as shown in Figure 6. In the same way, arc-related metasediments are well-recognized by adding PALSAR DEM, as shown by a considered enhancement in their results when compared to S2 data only (Figure 7). This is reasonably attributed to the varied clastic compositions of these volcaniclastic metasediments. Three types of granitic rocks (AFG, Mon, Ton) are separated well using the two inputs, with higher producer accuracies when PALSAR DEM is included in the classification process (91.34%, 95.07% and 96.41% for AFG, Mon and Ton, respectively). Moreover, the consistency of their distribution is clearly noticed over the study area in S2 + PALSAR compared to the S2 data only results. Likewise, YFV and MVs are classified well using the fused datasets; however, some misclassifications are reported. MGD are sometimes misclassified as FGb and vice versa due to their closer mineralogical compositions.
Spatial comparison of the rock units revealed the superiority of the fused dataset over spectral data only. For example, alkali feldspar granite in the central-eastern part of the map appears to be more amalgamated in Figure 5b and Figure 6b compared to that in Figure 5a and Figure 6a (a higher number of error pixels results in a clear salt and pepper effect). Sporadic representation of AFG at the extreme eastern part of both maps is attributed to its intensive weathering; thus, it is confused with Wadi deposits. With reference to fieldwork and geological maps, Samaday formation is clearly confined to the eastern part of the map in Figure 5b in contrary with its distribution all over the area in Figure 5a, disclosing how well the added DEM could help in the specification process. Comparing the northern parts of the two maps reveals how the error pixels are decreased in Figure 5b and shows well-defined representations of FGb and MVs compared to Figure 5a. This superior allocation of gabbroic rocks (e.g., FGb in Figure 6b compared to Figure 6a) matches our field observations considerably, highlighting the usefulness of the adopted approach for further lithological allocations.

4.1. Verification of Remote Sensing Results (Using Fieldwork and Petrographic Examinations)

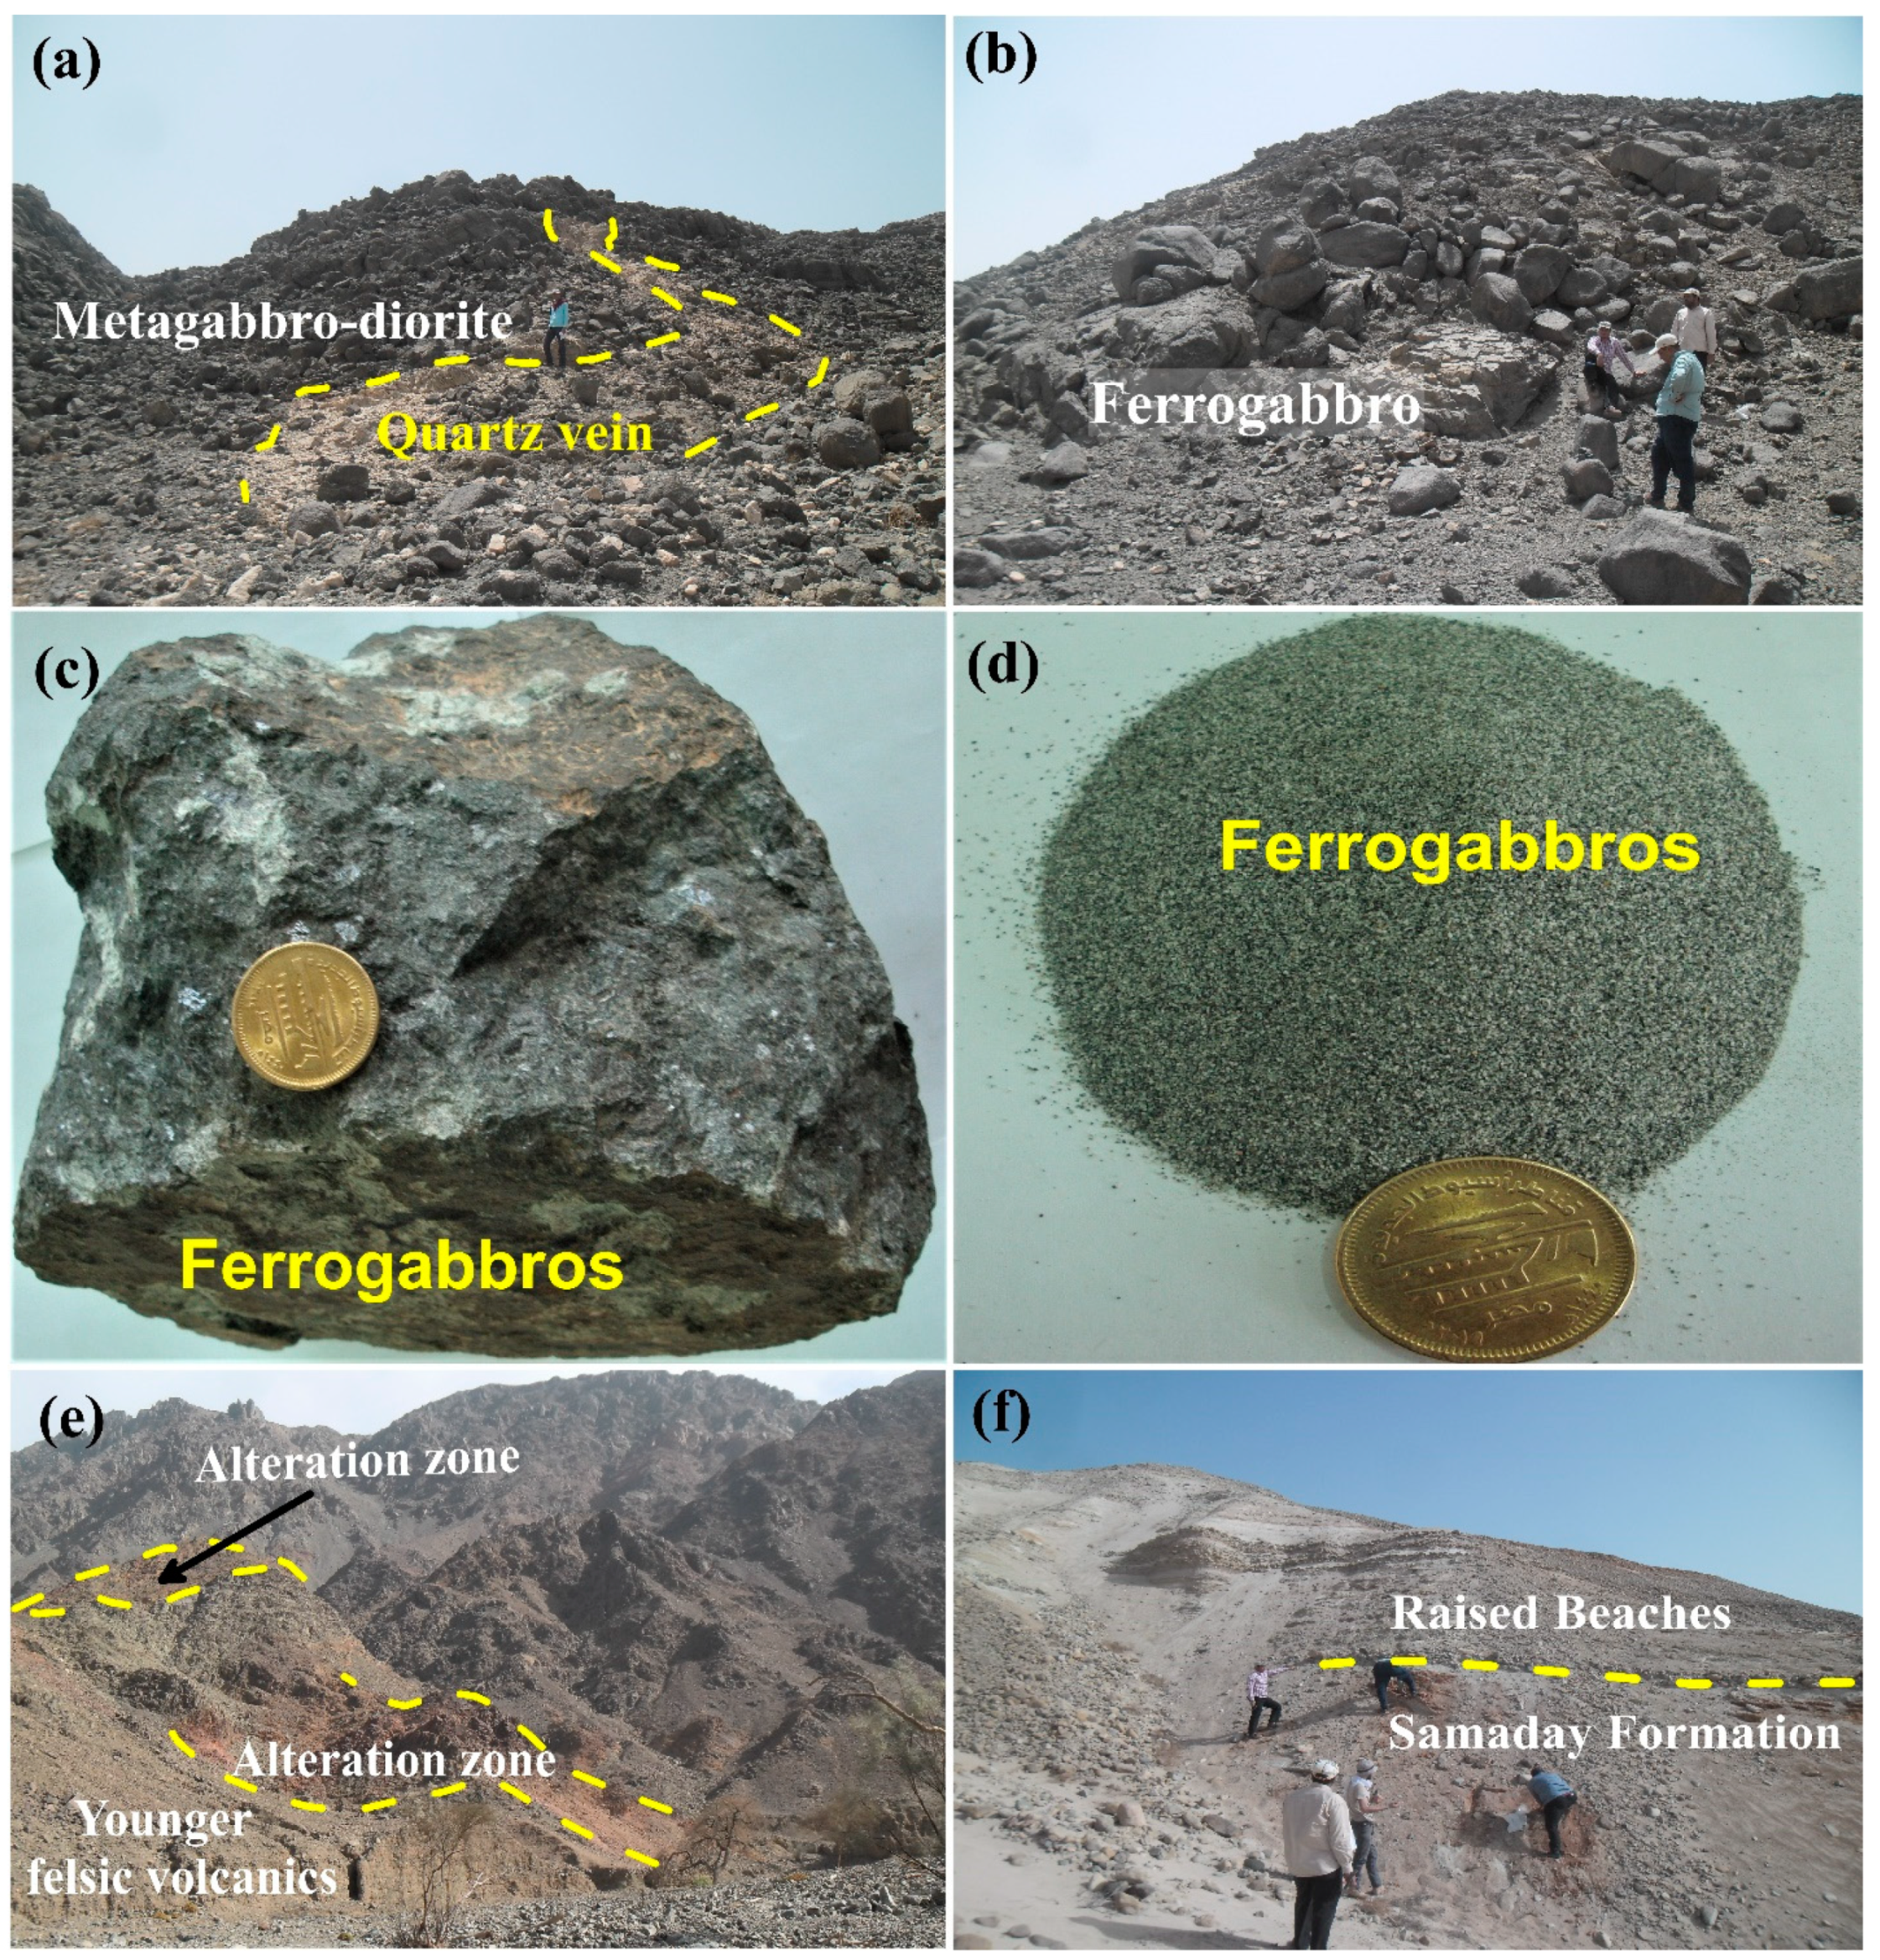
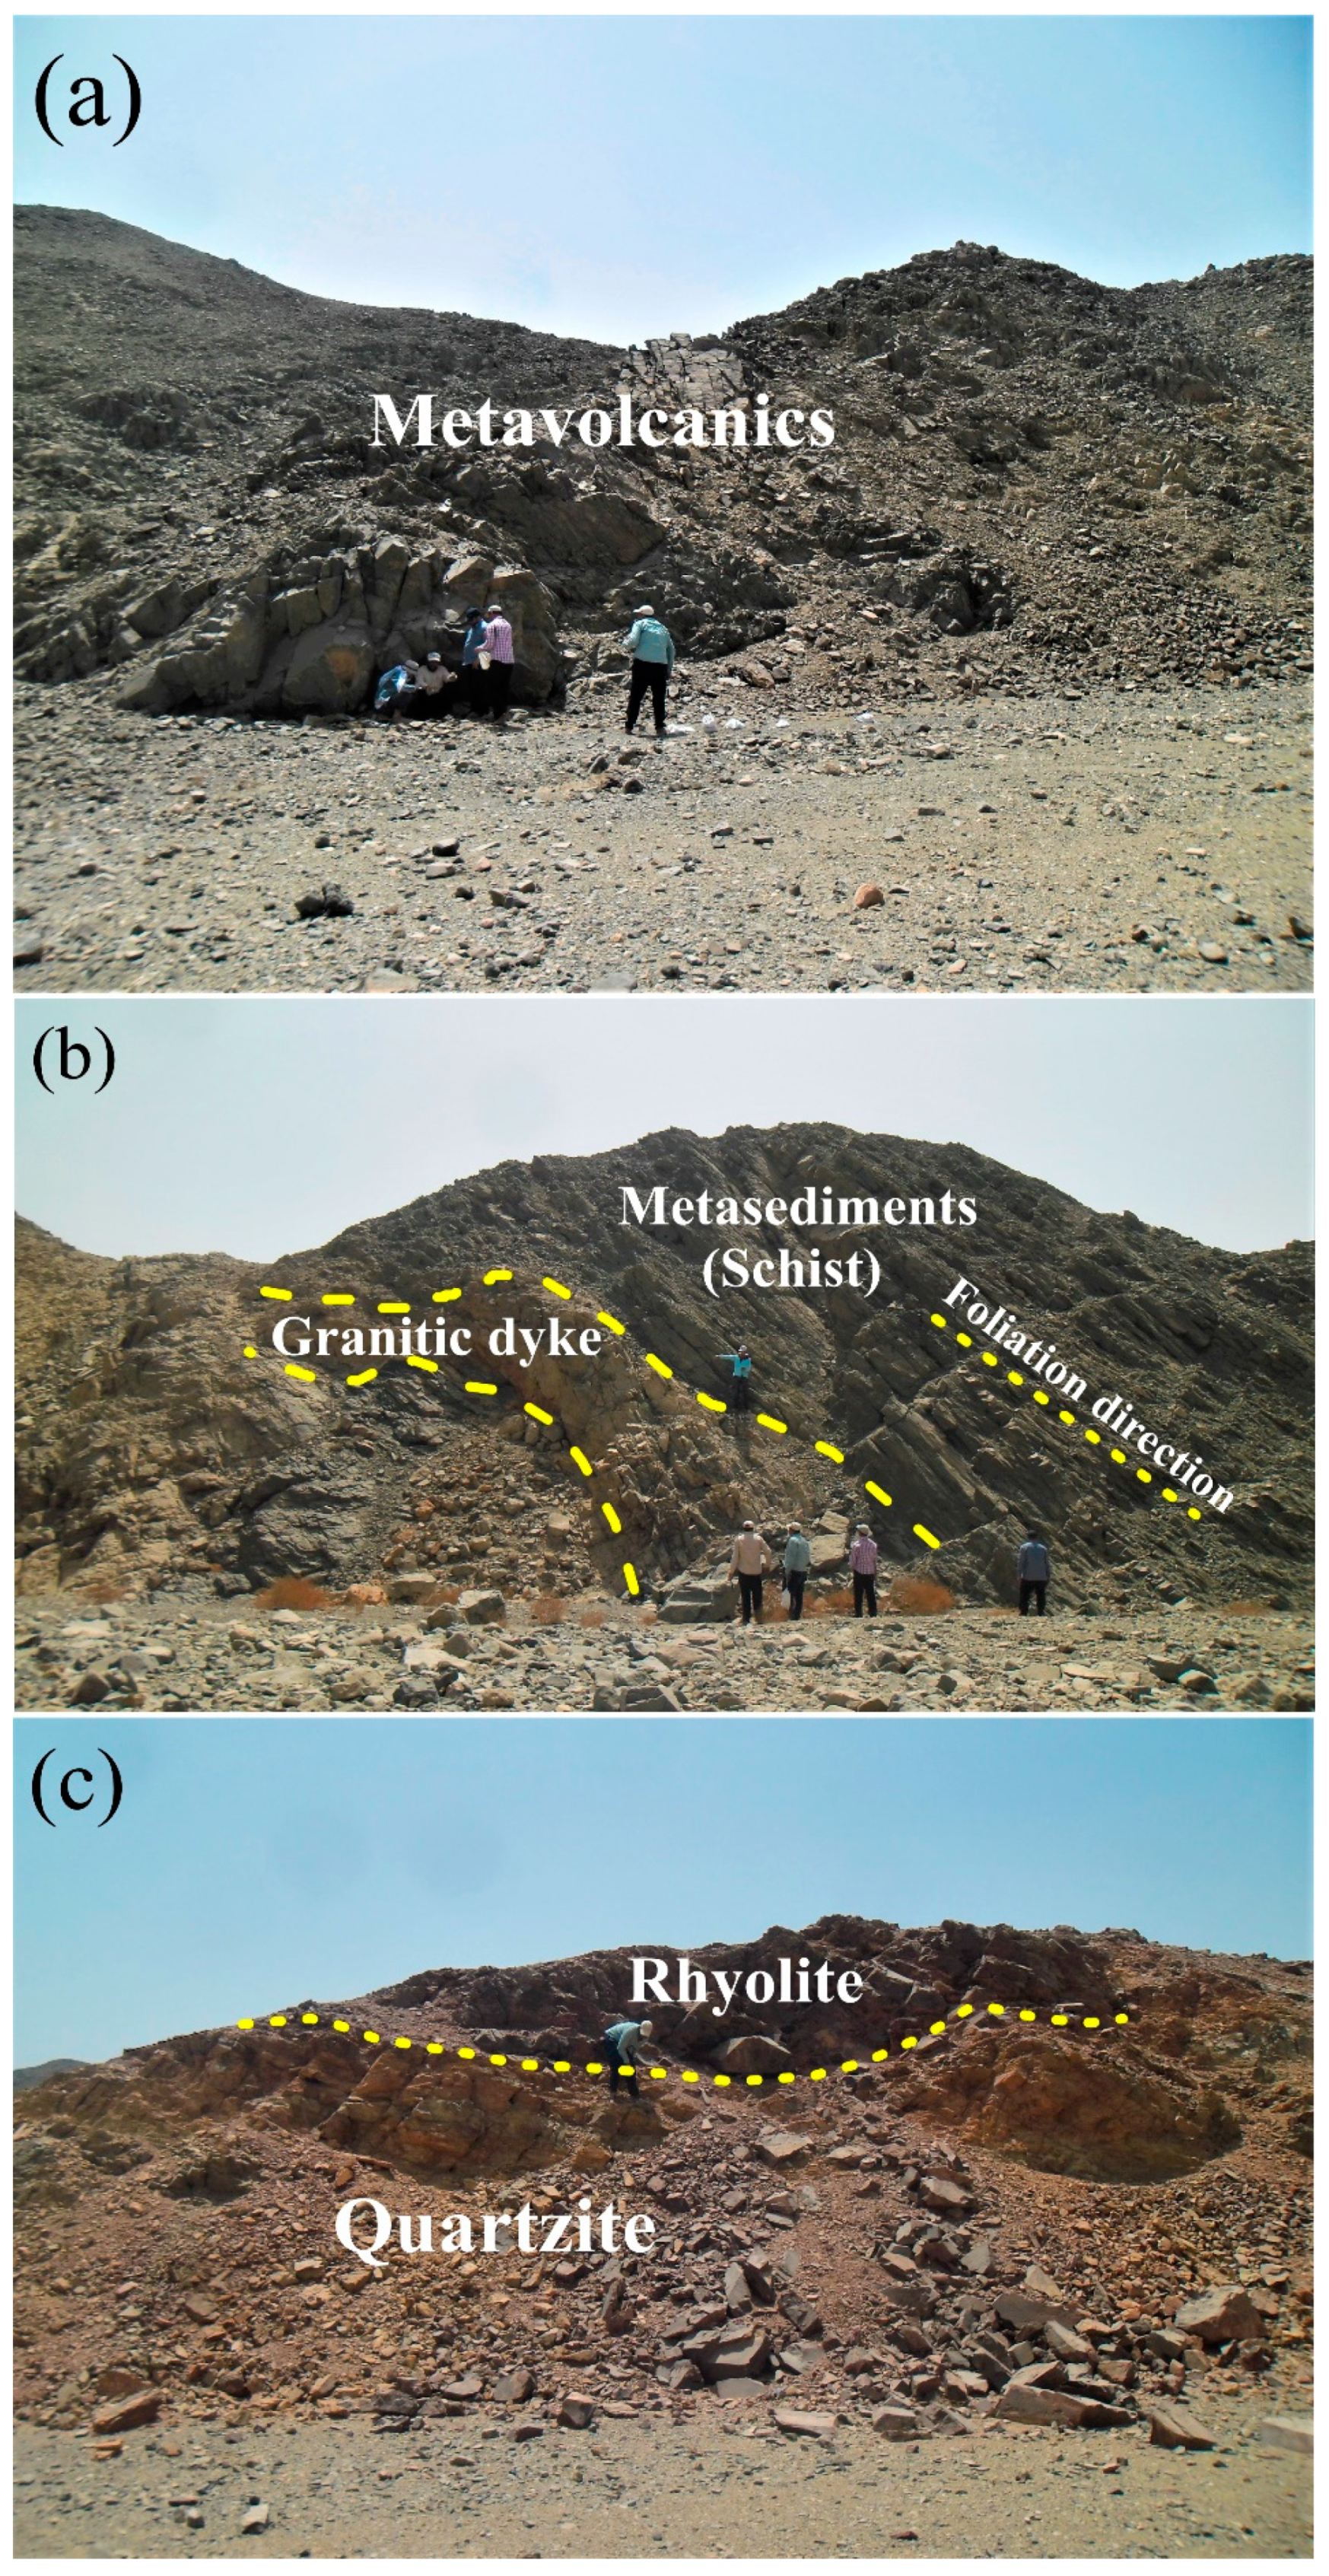
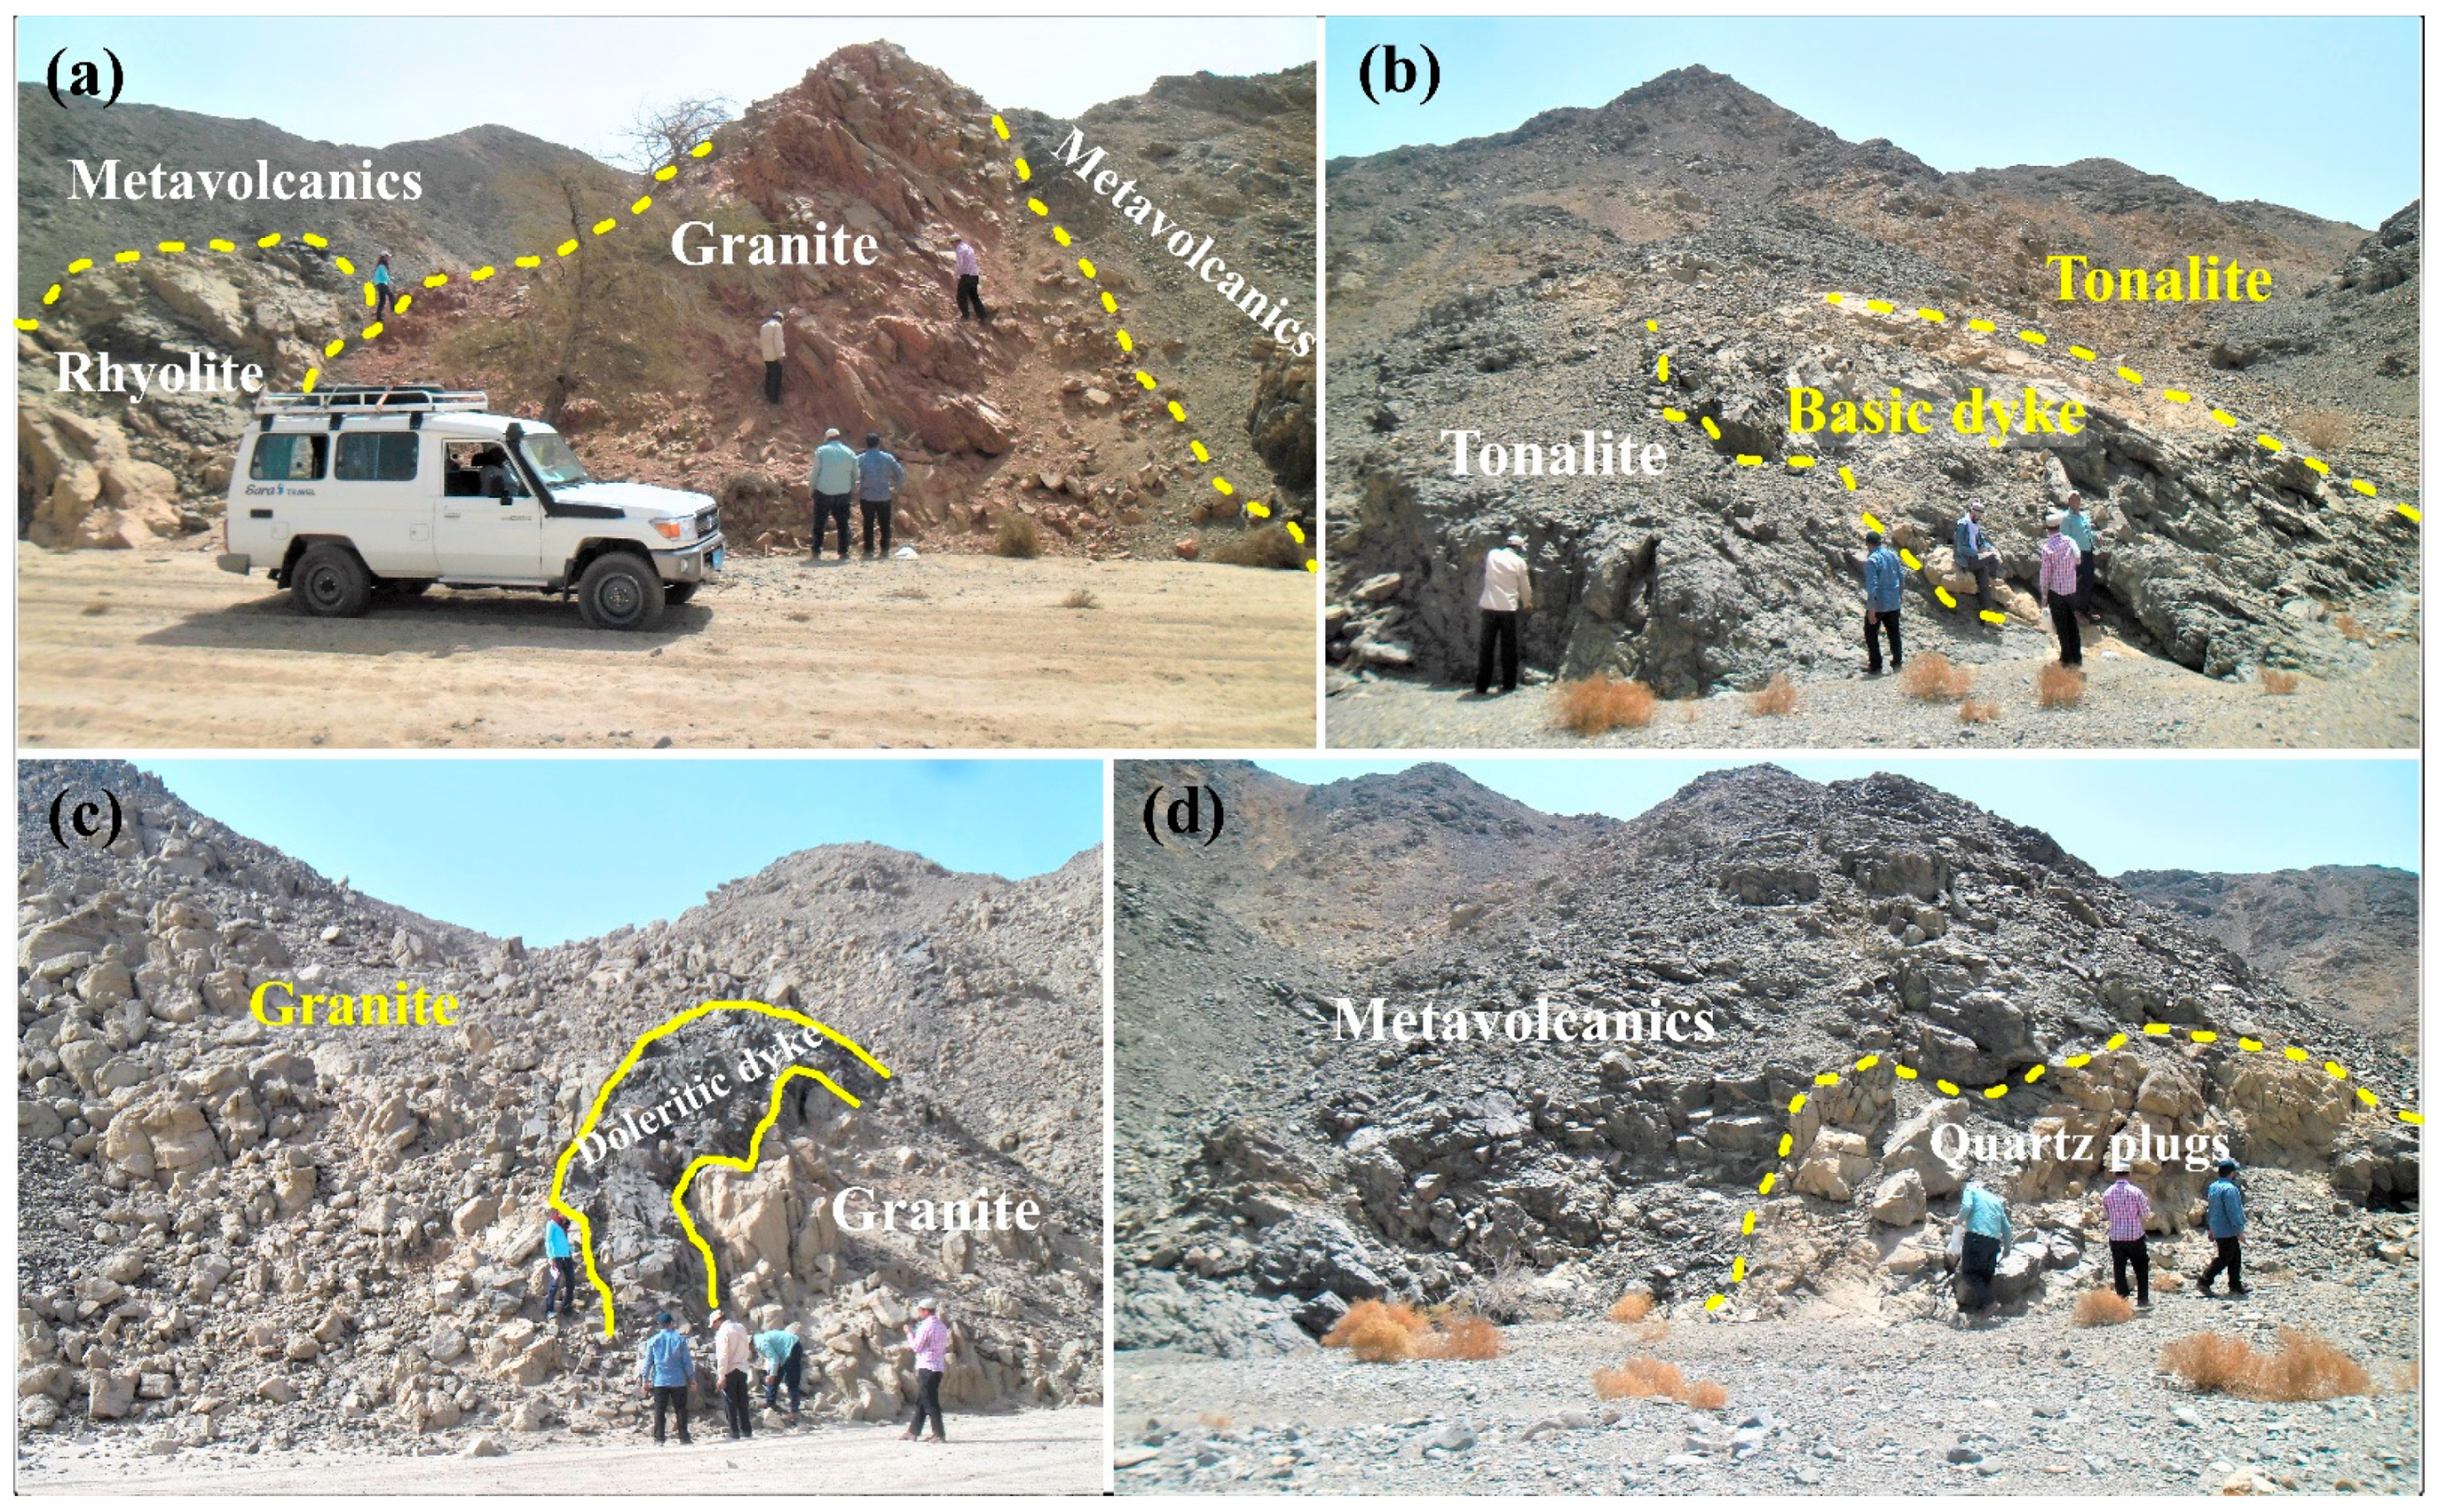
4.1.1. Field Investigations

Intensive fieldwork was carried out to check the remote sensing findings of the current research. Our fieldwork revealed that the metagabbro–diorite–tonalite complex occupies the study district’s east, west, and central parts. They occur as massive rocks that are medium- to coarse-grained and have a dark grey color. They are related to the metagabbro–diorite complex of El-Ramly and Akaad [58], Sabet [59] and Habib [60], or to the gabbro–diorite–tonalite (GDT) of Abdel-Rahman [61] and Khalil [62]. Metagabbros exhibit dark greenish-grey color on a fresh surface, are massive, fractured, have dykes and sometimes form spheroidal weathered masses. These rocks are frequently intruded by quartz veins (Figure 8a). Similarly, fresh olivine–pyroxene ferrogabbros (FGb) occasionally form spheroidal weathered masses and are composed essentially of pyroxenes, olivine, and plagioclase (Figure 8b). FGb is medium- to coarse-grained, dark greyish to dark greenish color on a fresh surface, sometimes speckled in white (Figure 8b,c). These ferrogabbros exhibit a reddish-brown weathered surface owing to the oxidation of titaniferous magnetite crystals. Due to the similarity between MGD and FGb, a number of misclassified pixels were observed primarily within these lithologies. However, a portion of the MGD pixels exhibited classification as YFV, which encompasses a wide range of lithologic compositions and is affected by hydrothermal alteration features, as encountered during our fieldwork. Gabbroic rocks contain about 50 to 55% of titaniferous magnetite as iron ore minerals (Figure 8d).
Younger felsic volcanics are fine- to medium-grained, have gradient color ranges from buff to dark greenish-grey and sometimes to pale purple, and are composed essentially of quartz, potash feldspars, and plagioclase. These volcanics are strongly jointed, low to moderate relief rocks. These rocks are represented by black or deep purple rhyolites, and sheared mineralized rhyolites, with a purple to buff or reddish-brown color as due to the potash feldspar crystals. Occasionally, there are alteration zones encountered in the contact between quartzites and younger felsic volcanics at Wadi Khashir (Figure 8e). These zones of sheared mineralized rhyolites range in thickness from 5 to 20 m (Figure 8e). Figure 7a also shows that some pixels are left out from the correctly classified Wadi deposits due to inconsistencies in the elevation, texture, and composition of the Wadi deposits over the study area, which have an inhomogeneous content of weathered Precambrian rocks distributed all over the study area. Investigating all of the other classes revealed that the S2–PALSAR results have far lower omission errors compared to S2 thematic mapping (Figure 7a).
Alternatively, checking the reliability of the resultant thematic maps through interpreting the user’s accuracy and commission errors for both datasets revealed a reasonable classification of S2-PALSAR with all the classes (commission errors are less than 10% for most of the classes). The highest error was committed in classifying Samaday formation (SMD) as Wadi deposits in both data inputs due to the diversified composition revealed during the fieldwork, where SMD (Pliocene to Pleistocene age) is composed of red to reddish-brown sandstones, siltstones, and conglomerates with limestone lenses. This formation is considered the oldest sedimentary rock unit at the entrance of Wadi Khashir and is overlain by gravels, sands, and conglomerates with evaporates (Figure 8f). Sometimes, these sandstones are gritty to conglomeritic and moderate to high relief, more than 20 m in thickness, and composed of iron oxides, quartz and chlorite. These assorted components are responsible for mixed spectral signatures and varied elevations resulting in the misclassification of SMD as WDs whatever the implemented datatype (S2–PALSAR or S2).
Field observations of metavolcanics revealed various occurrences in the eastern and western parts of the study area. They are trending approximately E–NE, W–SW and traversed by the Wadi Khashir–Gabal Ras El-Kharit district. Wadi Khashir metavolcanics are represented by meta-andesites while metabasalts are recorded in the Gabal Ras El-Kharit metavolcanics (Figure 9a).
The potentiality of S2–PALSAR over S2 was evident; for instance, in mapping arc-related metasediments through overcoming the spectral confusion associated with S2 generalization due to a heterogeneous mixture of quartz-pyroxene schists, pebbly-quartz-biotite schists, mylonitic schists, and quartzites. All of these components have more or less the same topographic appearance (highly foliated, schistose, folded, and boudinage parallel to the foliation planes) and elevation and are characterized by a well-developed schistose texture (Figure 9b). Quartzites are characterized by being highly altered, fine- to coarse-grained, yellowish-brown to dark brown in color, laminated, and occasionally extruded by younger felsic volcanics (Figure 9c). Consequently, fusing topographic particulars with spectral information sharply decreased the omission and commission errors by about 24.37%, and 27.13%, respectively. Similarly, omission and commission errors for metavolcanics distinctly dropped to 0.36% and 2.26% after combining with PALSAR DEM through decreasing the effect of the spectral confusion associated with S2 and verified in the field.
Similarly, a considered enhancement of the producer and user accuracies (Table 3), and errors of omission and commission (Figure 7), emphasizes the role of embedding DEM in classifying various rock units and how well it could help in decreasing the heterogeneity effect reflected by numerous components within the same class. For instance, the granitic rocks are medium- to coarse-grained, dark to light grey in color and subdivided into two distinctive varieties (hornblende–biotite monzogranites and alkali feldspar granites) depending, essentially, on the field relationship and mineralogical composition. The hornblende–biotite monzogranites form an elliptical pluton-like shape and extended with an approximately NE–SW trend. These granites are medium- to coarse-grained and are composed chiefly of quartz, plagioclase, and alkali feldspars. Monzogranites’ omission error was decreased from 28.09% to 4.93% with the addition of PALSAR DEM; however, the commission error was raised by about 10% due to some misclassifications with metavolcanics. The alkali feldspar granite is usually red to buff in color, medium- to coarse-grained, and composed, essentially, of plagioclase, K-feldspars and quartz. Many dykes also traversed through this pluton, particularly in the WSW and E–W trends at Wadi Khashir and Gabal Ras El-Kharit with variable colors from red to buff and dark to light grey in color. The first structural acidic dykes were represented by granitic and rhyolitic dykes. The granitic dykes intruded within the metavolcanics and arc-related metasediments as well as the rhyolitic dykes, invading within the alkali feldspar granites and metavolcanics at Wadi Khashir (trending 90° E; Figure 10a). The basic dykes are represented by basaltic and doleritic dykes. The basaltic dykes (trending 80° NE, Figure 10b) and the doleritic dykes (trending 225° SW, Figure 10c) crosscut the alkali feldspar granites at Wadi Khashir. Mapping AFG is greatly enhanced (Figure 5 and Figure 6) by embedding PALSAR DEM, where the producer and user accuracies increased by about 11.08% and 6.5%, respectively.
A reasonable allocation of tonalities was evident; however, some misclassifications were associated with Wadi deposits mainly due to weathering. Generally, tonalities are medium- to coarse-grained, comprising hornblende, pyroxene, plagioclase and quartz. These rocks are commonly highly jointed, fractured and characterized by high relief, and were intruded by basic dykes with an 80° NE trend (Figure 10b). Dykes can also cause some error pixels, especially if they are abundant and possess dissimilar compositions, which is the case in the present district. The latter is injected by numerous dykes and veins of different shapes and compositions, invading all the rock units. The basic dykes are represented by basaltic rocks; they are generally fine-grained, and dark grey to black in color. They belong to the post-orogenic to foreland volcanics that took place during the Paleozoic and probably passed to the Mesozoic [63]. The granitic rocks are invaded by basic dykes at Wadi Khashir, with WSW trends, and ENE trends (Figure 10b). The doleritic dykes have widths that vary from 2 to 10 m and extend up to more than 100 m; they are generally medium- to coarse-grained, and grey to dark grey in color. They usually form small outcrops and present in association with alkali feldspar granites at Wadi Khashir, occurring as parallel to sub-parallel swarms penetrating these granites and trending 225° SW (Figure 10c). The acidic dykes are usually of a light grey to pink color and are medium- to coarse-grained. These dykes are widely distributed in the study district and invade into all different rock units. They comprise rhyolitic and granitic dykes penetrating the metavolcanics and arc-related metasediments (Figure 10a). Quartz veins are most widely distributed among all the Wadi Khashir and Gabal Ras El-Kharit rock units (Figure 8a and Figure 10d).

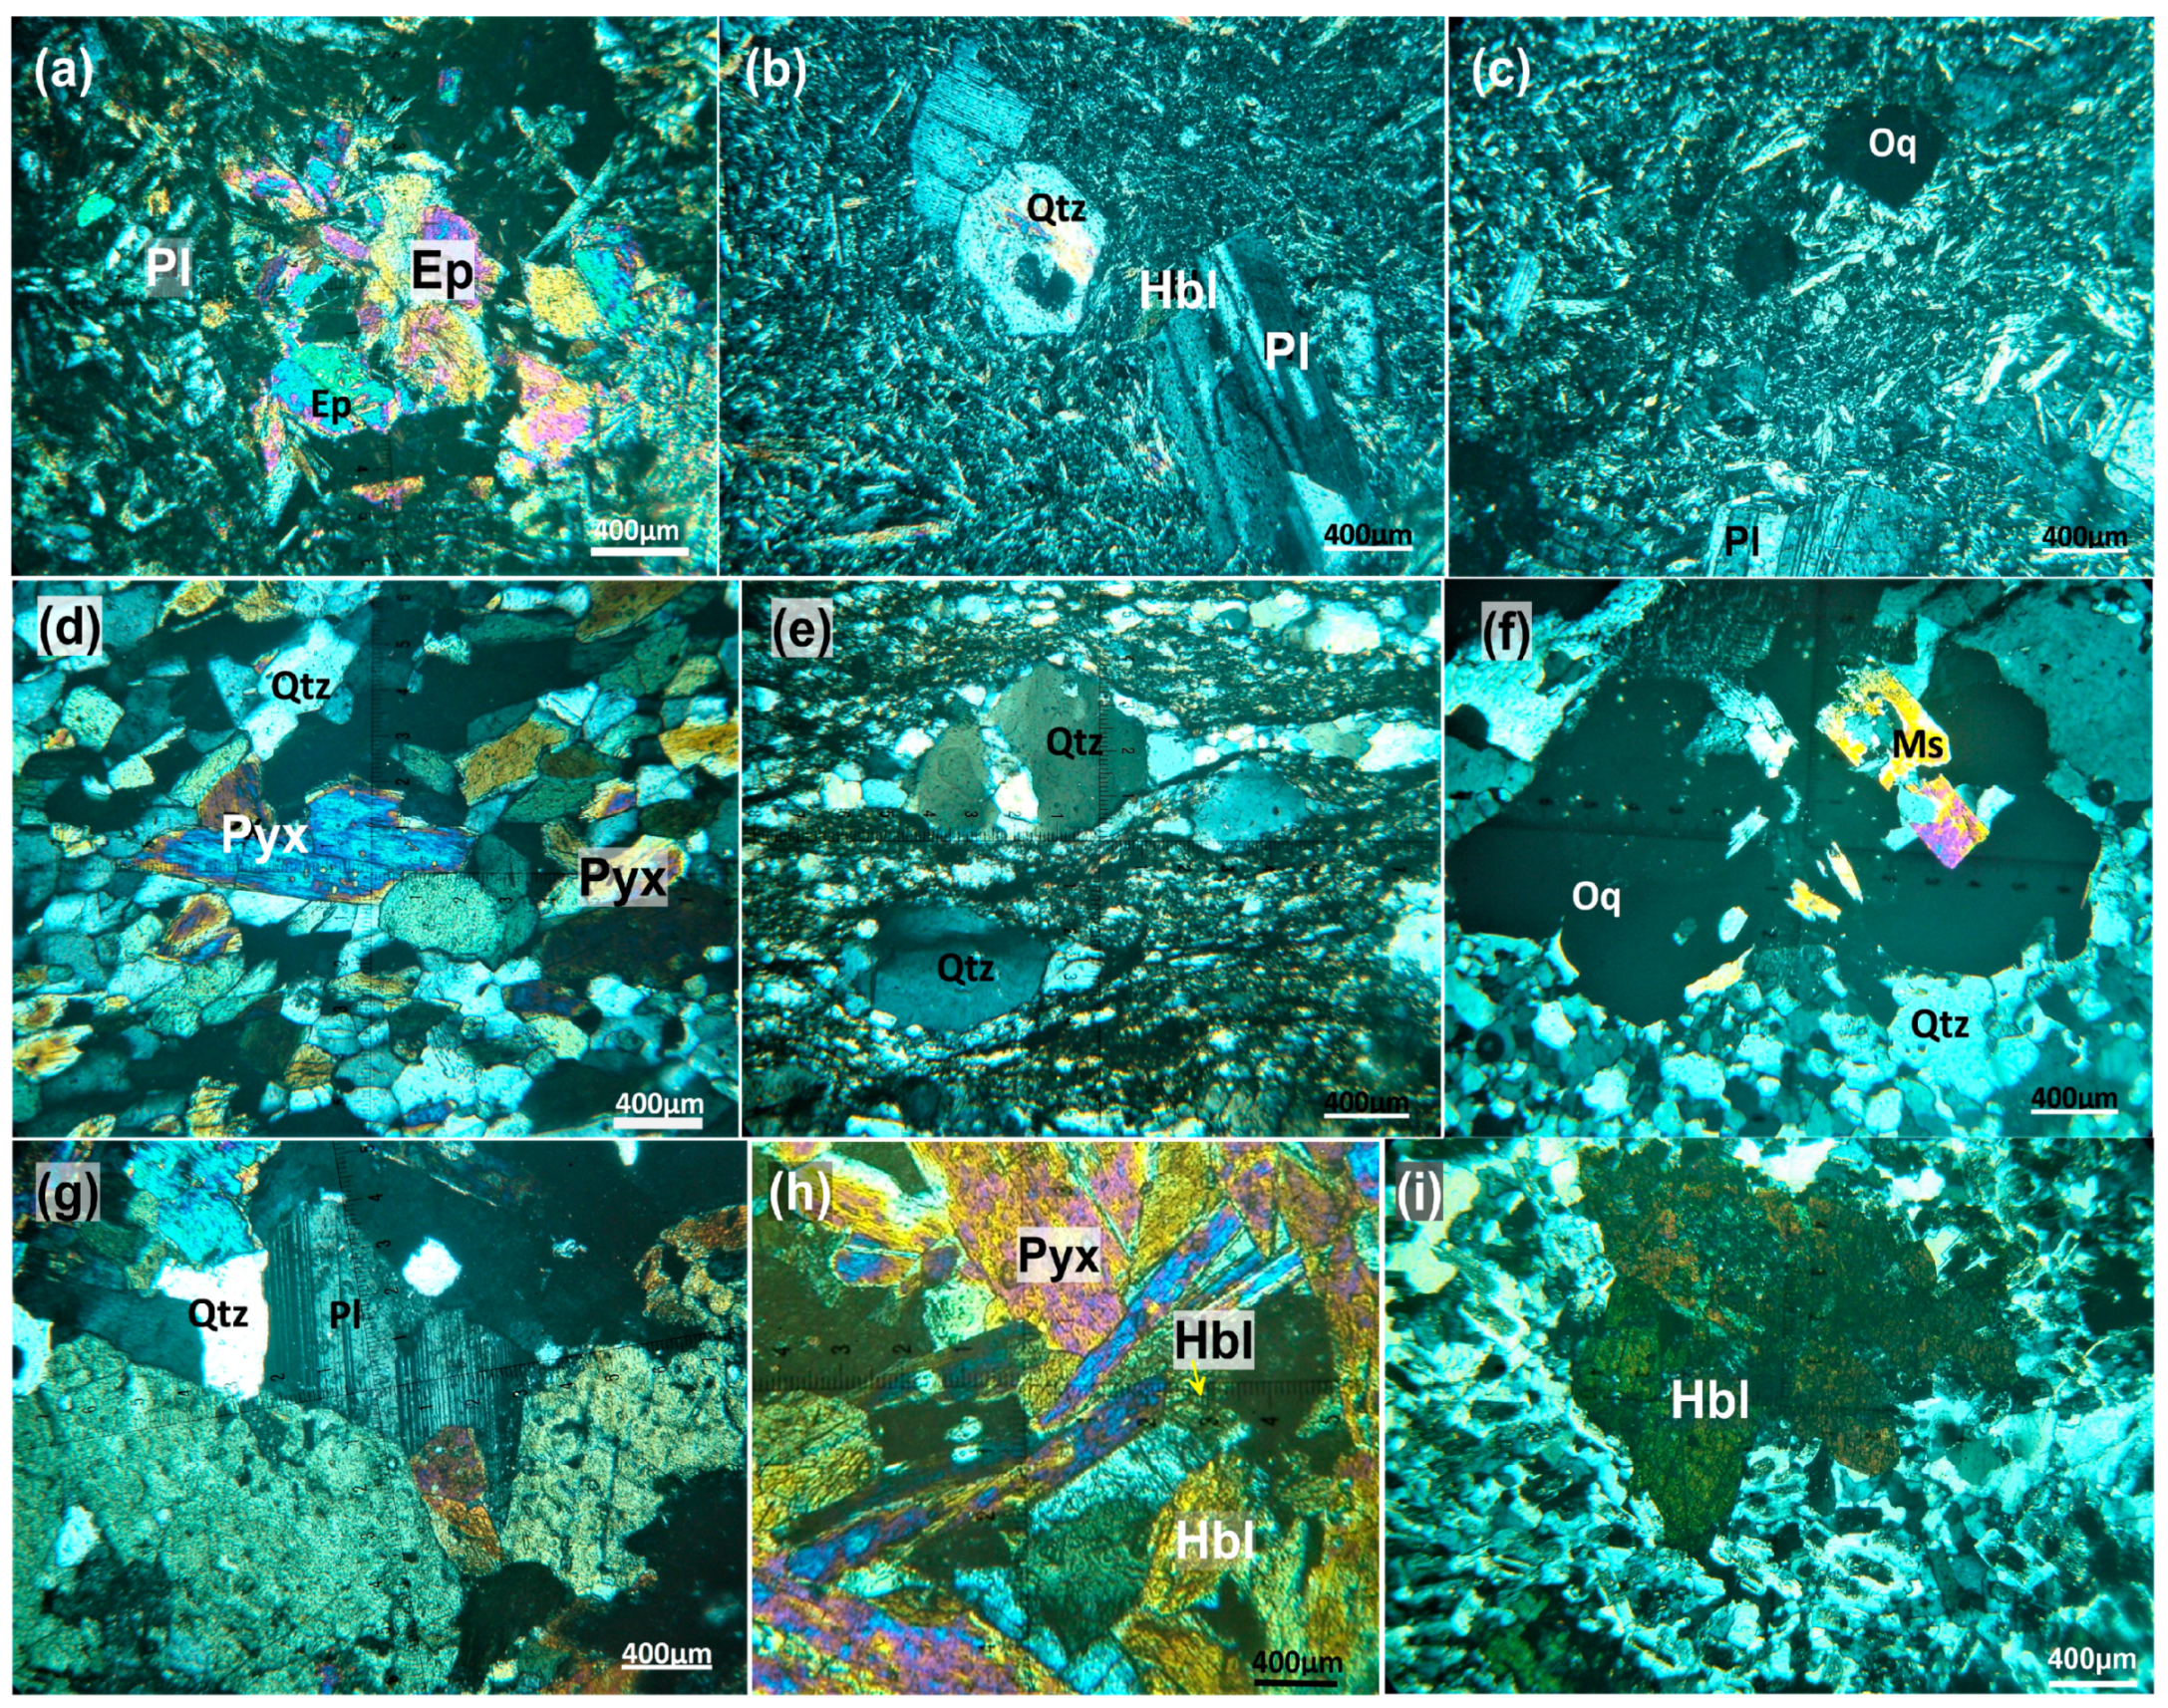
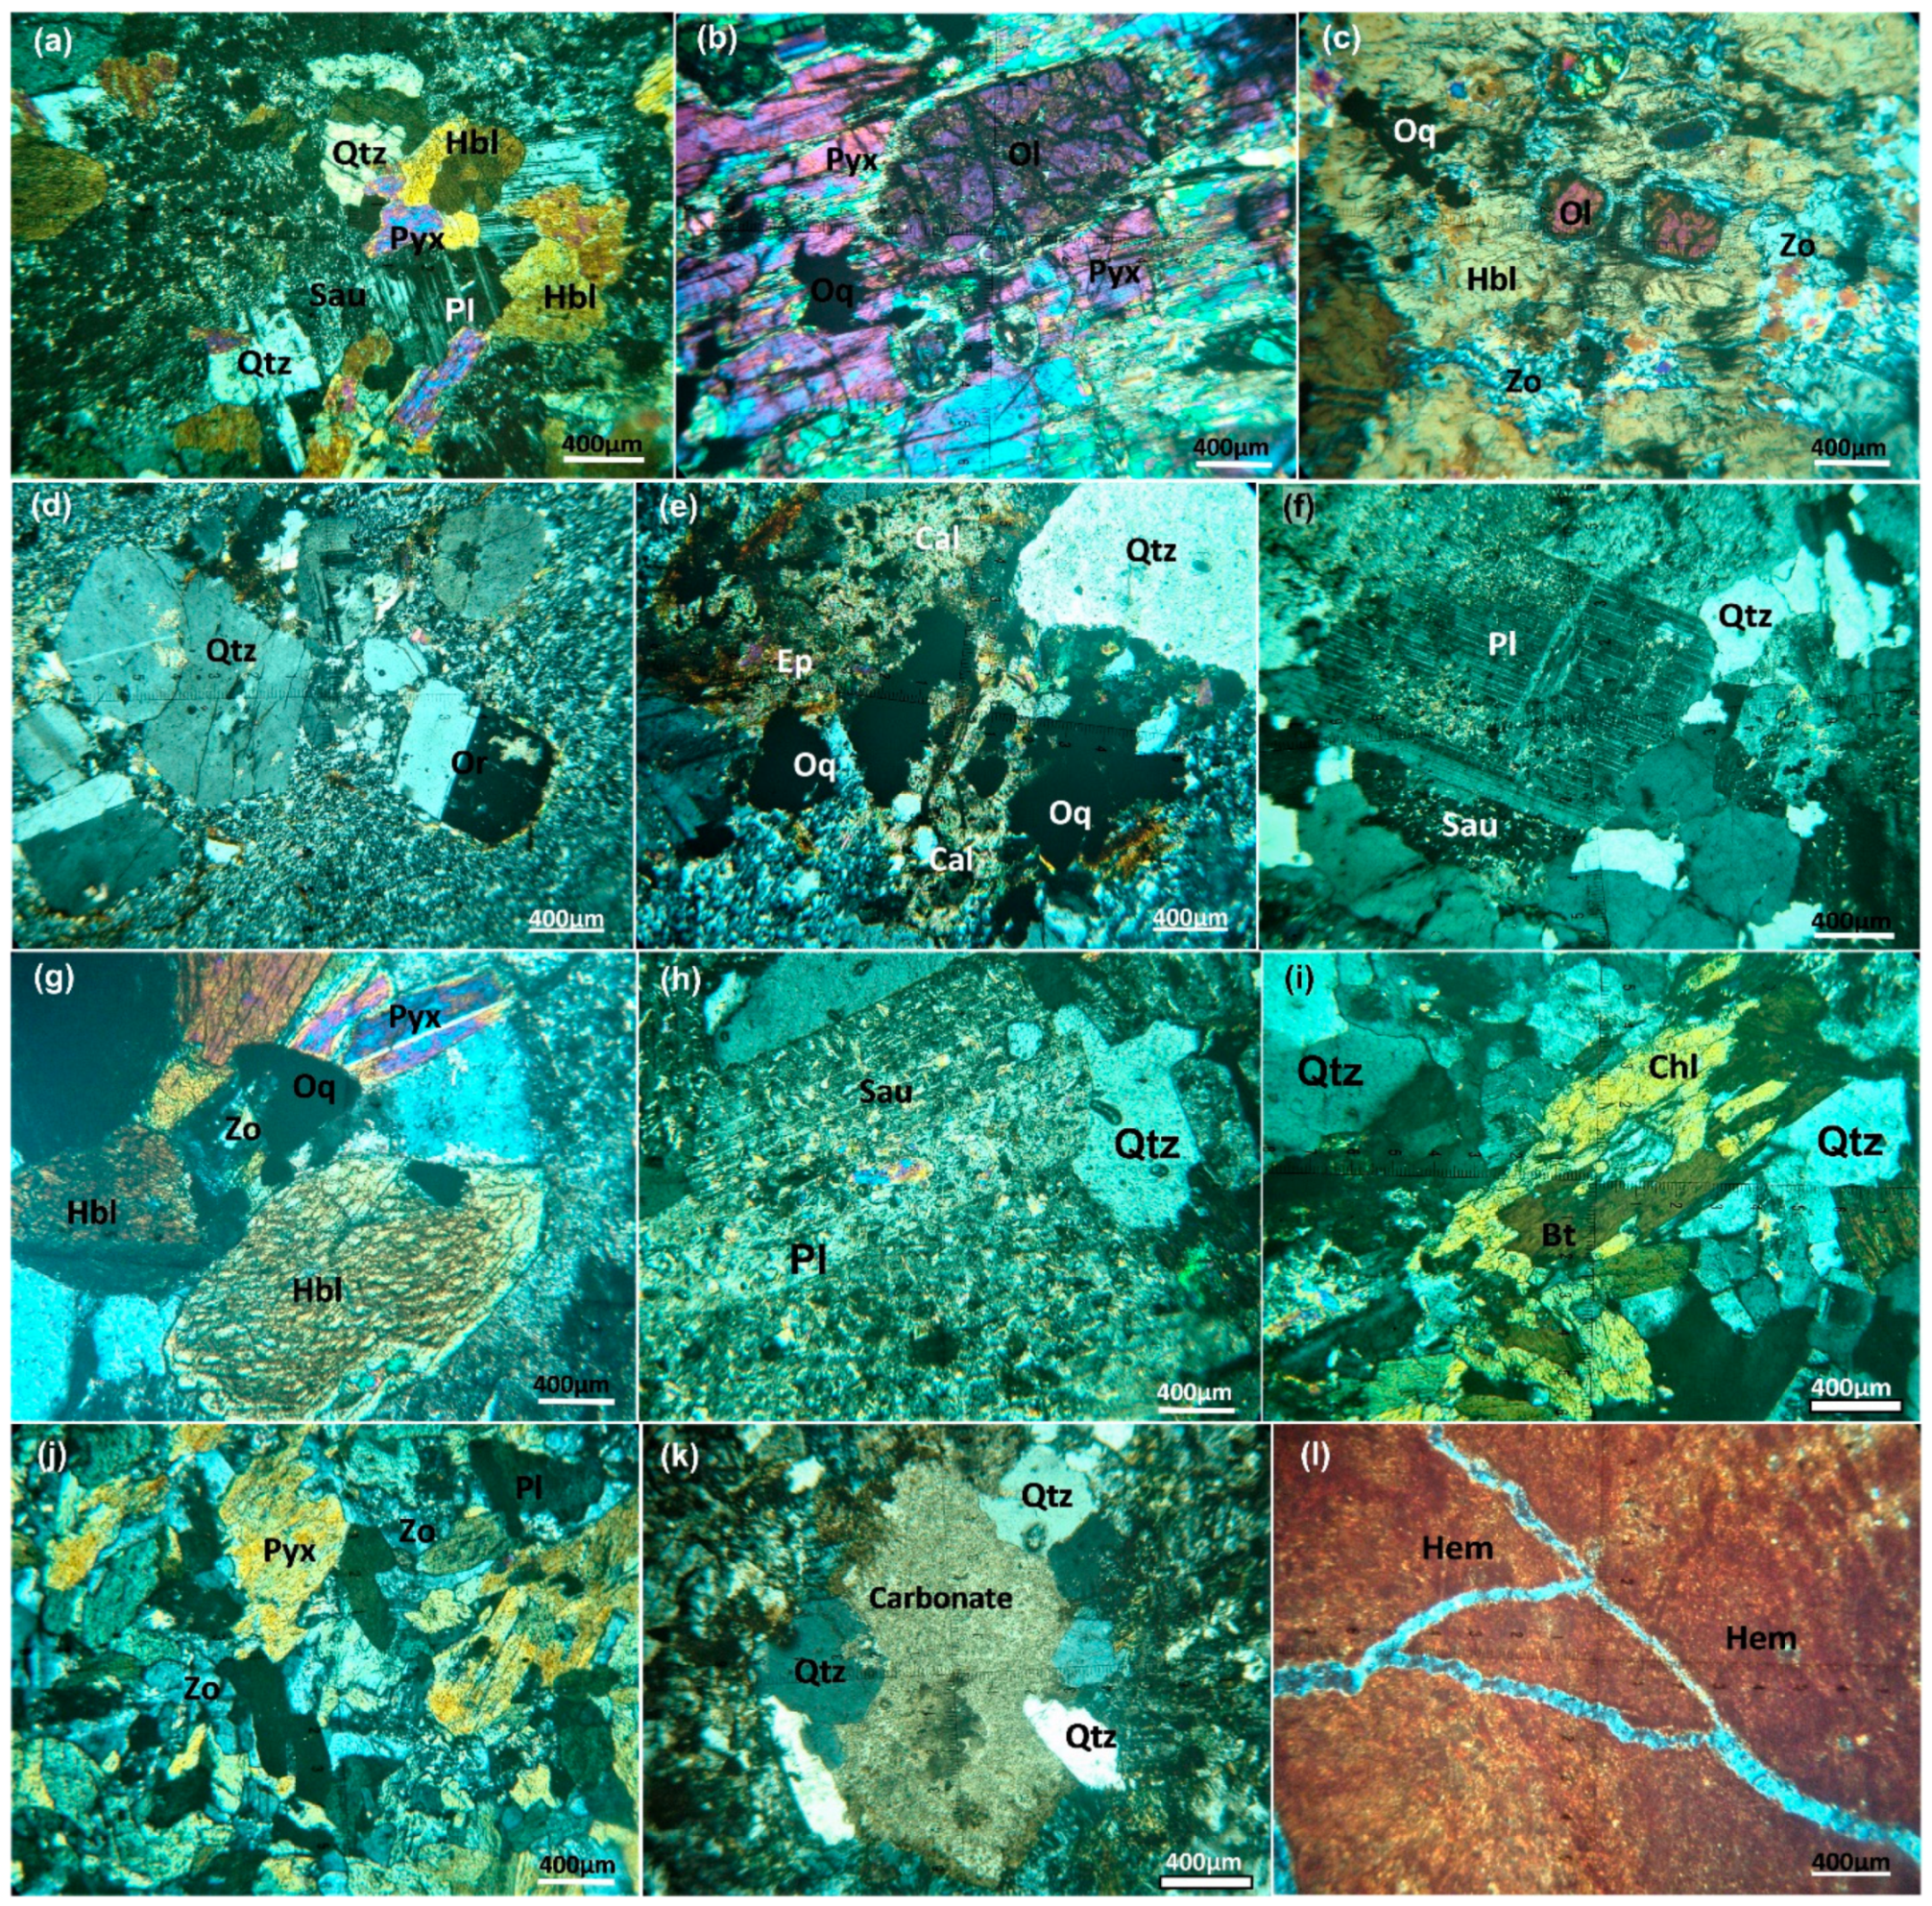
4.1.2. Petrographic Examinations

In addition to the statistical analysis and field verification for the exposed lithologies presented in the final lithological map (Figure 5), a petrographic description of the mineralogical composition and textural features characterizing the different rock units exposed in the studied district was conducted. These petrographical investigations clearly explain the compositional varieties of the mapped rock units to provide a well-constructed geological map for further studies over the studied terrain. For instance, the metavolcanics are represented by metabasalts and meta-andesites. Metabasalts are fine-grained and composed, essentially, of plagioclase, pyroxene, zoisite, chlorite, and opaque minerals. Porphyroblastic features and amygdales are common and filled with secondary epidote (Figure 11a). Although the meta-andesitic rocks exhibit a porphyroblastic texture (Figure 11b) and are composed, essentially, of saussuritized plagioclase and hornblende set in the fine-grained groundmass, secondary minerals are mainly represented by chlorite, epidote, and sericite together with quartz and opaques as accessory minerals (Figure 11c).
Arc-related metasediments are mainly represented by two varieties, viz: quartz-pyroxene schists, pebbly-quartz-biotite schists, and quartzite. Quartz-pyroxene schists are composed essentially of quartz, pyroxene, and plagioclase (Figure 11d). The accessory constituents are represented by opaque minerals, such as pyrite and iron oxides. Pebbly-quartz-biotite schists are fine- to coarse-grained, strongly foliated, and consist of quartz, biotite, plagioclase, and opaque minerals (Figure 11e). Quartzites are highly altered, fine- to coarse-grained, and are composed, essentially, of quartz, muscovite, epidote, sericite, and opaque minerals such as pyrite (Figure 11f).
Metagabbros are medium- to coarse-grained, exhibit hypidioblasts and an ophitic and subophitic texture (Figure 11g). Ophitic titanoaugite is associated with small crystals of iron-ores. They are composed, essentially, of plagioclase, hornblende, pyroxene, quartz, biotite, and olivine (Figure 11h). Quartz diorites are medium- to coarse-grained and are composed, essentially, of plagioclase, hornblende, pyroxene, quartz, and biotite. Opaque minerals are the main accessory minerals. Meanwhile, epidote, saussurite and chlorite are the main secondary minerals (Figure 11i). Tonalites rocks are medium- to coarse-grained and greyish-white in color with a hypidiomorphic granular texture. They are composed, essentially, of hornblende, pyroxene, plagioclase, and quartz. Saussurite and zoisite are secondary minerals (Figure 12a).
The ferrogabbros are medium- to coarse-grained, showing an often hypidiomorphic texture, as well as subordinate ophitic, subophitic and cumulated textures. They mainly consist of plagioclase, pyroxenes, olivine, and hornblende. The main accessory constituents are apatite, zircon, titaniferous magnetite, spinel, and pyrite (Figure 12b,c). The younger felsic volcanics are represented by rhyolites. This rock is fine-grained, composed, essentially, of quartz, orthoclase, and plagioclase. The accessory minerals are represented by biotite and opaque minerals, such as magnetite, pyrite, hematite, and arsenopyrite. The secondary minerals are chlorite, epidote, zoisite, and sericite (Figure 12d,e).
The studied granites are classified petrographically into hornblende–biotite monzogranites and alkali feldspar granites. Hornblende–biotite monzogranites are medium- to coarse-grained with a subhedral-granular texture and composed, chiefly, of plagioclase, quartz, alkali feldspars, hornblende, pyroxene, and biotite. Sericite, epidote, zoisite, and chlorite are the main secondary minerals. Apatite, zircon, and opaque minerals are the chief secondary constituents (Figure 12f,g). Alkali feldspar granites are medium- to coarse-grained, with euhedral to subhedral crystals and showing an often poikilitic texture. They consist, essentially, of alkali feldspars, quartz, and plagioclase crystals. Biotite is less common and altered to chlorite. Opaque minerals are the chief accessory minerals. Chlorite, sericite, and epidote are the main secondary minerals (Figure 12h,i).
The basaltic dykes are fine-grained, and show ophitic, subophitic and diabasic textures. They are mainly composed of plagioclase and pyroxene as an essential mineral. Epidote, quartz, and zoisite are considered to be the most dominant secondary minerals (Figure 12j); opaque minerals (pyrite cubes) are the essential accessory minerals. The doleritic dykes are represented by fine- to medium-grained porphyritic rocks and are mainly composed of plagioclase. Zoisite, quartz and carbonate are present as secondary minerals (Figure 12k). Meanwhile, opaque minerals are the main accessory minerals. They are characterized by mature and immature carbonate minerals (Figure 12k). Samaday formation is fine- to medium-grained, red to reddish-brown in color and a source of iron ore (hematite). Red beds are composed, essentially, of hematite, quartz and chlorite (Figure 12l).

5. Ferrogabbros and Their Associated Ores

Building on our previous findings that demonstrated the usefulness of DEMs in lithological mapping, this study takes a step further toward improving the applicability with more precise mapping of mineralized ferrogabbros within the study area. Figure 13a illustrates the distribution of ferrogabbros using S2 data and their enhanced allocation utilizing the integrated S2–PALSAR (Figure 13b). Notably, the latter lithological allocation is more accurate and identified the mineralized ferrogabbros as high-potential zones of mineralization that were consistent with a previous study conducted by El-Desoky [64].

5.1. Mineralogy, XRD and EDX of Fe-Ti Oxide Ores

Magnetite, titanomagnetite and hematite are examples of the opaque ore mineralogy found in gabbroic rocks. Well-formed euhedral crystals of dark grey with a metallic sheen make up magnetite’s natural form (Figure 14a). Moreover, the granular aggregates of magnetite can be thin to coarse-grained, elongated or irregular (Figure 14b). The primary opaque mineral, magnetite, is found in subhedral to euhedral crystals (Figure 14c). The Wadi Khashir district’s ferrogabbros contain magnetite crystals. Fifty to fifty-five percent of the ferrogabbros in the Wadi Khashir region have magnetite crystals. Bireflectance is absent, and the anisotropy is somewhat abnormal. Although the twinning boundaries are located along the deformation-producing zones, this magnetite is isotropic in those areas. Titanomagnetite emerges as subhedral crystals having fine to medium-grained surfaces with irregular outlines (Figure 14d). The Fe-Ti oxides concentrated on fresh olivine–pyroxene gabbros were observed to contain magnetite and hematite, according to the XRD results (Figure 15a). Depending on the result of the Scanning Electronic Microscope, the existence of titanomagnetite emerges as subhedral crystals with fine to medium-grained surfaces (Figure 15b).

5.2. Whole Rock Geochemistry

For better analysis of the detected ferrogabbros, a whole rock geochemistry was performed to highlight the tectonic setting and the accurate geochemical classification of the fresh olivine–pyroxene gabbros. Table 4 provides a comprehensive chemical analyses of the fresh olivine–pyroxene gabbros, detailing both the major oxides and trace elements. The chemical composition of the ferrogabbros analyzed in this study exhibits noteworthy variations in their major oxide concentrations.
The SiO2 content displays a wide range, spanning from 49.65% to 51.50%, with an average of 50.14%, indicating different degrees of intermediate mineral fractionation. Similarly, the major oxides (Al2O3, Fe2O3, FeO, MgO, CaO, Na2O, K2O and P2O5) exhibit a significant variation in their content, with Al2O3 ranging from 16.15% to 18.50%, Fe2O3 from 1.23% to 1.75%, FeO from 13.45% to 15.74%, MgO from 2.10% to 5.13%, CaO from 4% to 9.5%, Na2O from 0.88% to 1.15%, K2O from 0.63% to 0.82%, and P2O5 from 0.2% to 0.65% (Table 4). The higher values of the FeO/MgO ratio, ranging from 6.4 to 3.1 with an average of 4.43, indicate that the original magma of these rocks was primitive and alkaline to calc-alkaline in nature. This interpretation is further supported by the high content of Fe2O3, ranging from 14.95% to 17.50% with an average of 15.06%.
Moreover, the trace element concentrations in the ferrogabbros also vary significantly, with higher contents of Cr, Ni, V, Sr and Ba, and moderate levels of Cu and Zn. The content of other trace elements, however, remains relatively low. Notably, the studied ferrogabbros show low contents of Na2O, K2O and P2O5, which is consistent with their alkaline to calc-alkaline nature. The abundance of magnetite is related to the content of iron, titanium and vanadium, while the abundance of silicates affects the amounts of silicon, aluminum, magnesium, calcium and sodium present in the rocks. Wadi Khashir ferrogabbros have lower Rb/Sr, Na2O/K2O and Zn/(Pb + Zn) ratios of olivine–pyroxene ferrogabbros, indicating that these rocks formed in the same genetic environment. Based on the Q-P diagram of Debon and Le Fort [65], which measures “quartz” and dark minerals, the ferrogabbro samples are classified almost exclusively as gabbros (Figure 16a). Additionally, in order to distinguish between the various types of gabbroic rocks, Streckeisen [66] utilized the plagioclase–pyroxene–olivine ternary diagram. The studied ferrogabbro samples are situated within the olivine gabbronorite field, as depicted in Figure 16b. To identify the magma type of the investigated olivine–pyroxene ferrogabbros, various diagrams were utilized. For instance, Miyashiro and Shido [67] utilized the Cr versus V binary diagrams to differentiate between calc-alkaline and tholeiitic rocks. The plots of the studied ferrogabbro samples are situated within the calc-alkaline field, as depicted in Figure 16c.
Moreover, the tectonic setting of the studied ferrogabbro can be inferred from the following relationships. On the FeO* + TiO2 versus Zr ternary diagram of Biermanns [68], the ferrogabbro samples were plotted within the continental arc field, as illustrated in Figure 16d. Trace elements contents confirmed that the analyzed samples tend to be richer in Cr (2435–2470 ppm) and Ni (660–677 ppm) than the other estimated trace elements. The trace element patterns of the analyzed basic plutonic rocks are relatively enriched in Rb, Y and Ba, which characterizes the calc-alkaline rocks. In addition, the studied ferrogabbros show a negative anomaly in Ti and K (Figure 16e). In this study, the mafic rocks intruding the lower crust section of the Wadi Khashir and Gabal Ras El-Kharit rock units exhibit a similar geochemical character to the continental arc gabbros. Trace element patterns (Figure 16e) show characteristic low Ti and K abundances compared to the continental arc crust.
The trace elements’ distribution (Primitive mantle-normalized; McDonough and Sun [69]) of ferrogabbros in three different patterns can be observed; most samples are of enrichment patterns, and low samples are of depleted patterns. The studied ferrogabbros are depleted in Ti and K and enriched in the other trace elements (Figure 16e). Geochemically, it is clear that the study olivine–pyroxene ferrogabbros originated from an alkaline to calc-alkaline magma type that developed in a continental arc setting.

6. Discussion

Our adopted approach revealed that the resultant thematic map presented in Figure 5 introduced a detailed distribution of the ferrogabbros compared to the previous geological maps of the study area [42,64,70,71,72]. In addition to the visual comparison, a statistical analysis (Table 3 and Figure 7), spatial verification of the resultant thematic maps with reference geological map, and intensive fieldwork was carried out to confirm the results of the utilized approach. Through 30 field stations across the lithological contacts (Figure 8, Figure 9 and Figure 10), an overwhelming endorsement is given to the fused PALSAR–sentinel 2 data output compared to the delivered thematic map using Sentinel 2 only. Moreover, more than 100 rock samples were gathered to check some misclassifications among the closely related lithologies. These field investigations reasonably justify our results and the given explanation, where most of the rock units are inhomogeneous, and includes other closely related lithological compositions, besides providing a better allocation of gabbroic rocks compared to the previous studies [42,64,70,71,72].
Statistically, comparing the producer and user accuracies of the two inputs reveals the superiority of embedding DEM within the allocation process. Furthermore, investigating the errors of omission and commission clearly reflects the superior lithological generalization when topographical characteristics are involved, as shown in Figure 7. Generally, all the resultant omission errors for S2 + PALSAR DEM are less than that of S2, approximately for all the classes. Only the MGD class of the fused dataset has a slightly higher omission error due to its misclassification as FGb and YF. This is due to the closer composition and elevation of the metagabbro–diorite complex and fresh ferrogabbros, besides the considered intraclass variability of younger felsic volcanics as revealed during our field investigations.
All of these specifications (described in detail in the fieldwork section) are very difficult to distinguish utilizing remote sensing data due to their smaller sizes compared to the implemented spatial resolution; however, it justifies most of the error pixels associated with these inhomogeneous terrains that have been affected by various events since the Neoproterozoic Era. The current study strongly recommends fusing PALSAR DEM with Sentinel 2 data when performing the upcoming lithological mapping due to its positive role in enhancing the allocation process, decreasing the salt and pepper effect, and supplementing the Sentinel 2 data to overcome the confused spectral characteristics (several spectral classes within the same information class) that are mostly inherited in these arid terrains. Moreover, applying the current methodology through combining the Sentinel 2–PALSAR data over less complicated terrains or sedimentary rocks ensures far better lithologic classification compared to that which depends mainly on optical datasets.
It is worth mentioning that this increase (3.6%) is only the case within our study area; however, the enhancement percentage is a function of the study area and their exposed lithologies (topographic variations among the rock units), the spatial resolution of the applied DEM, and the spatial and spectral resolution of the adopted multispectral dataset. For instance, Shebl and csamer [9] stated that there was about a 5.3% increase in the overall accuracy when DEM is fused with Landsat 8 in lithological mapping. Notwithstanding the foregoing, the enhancement experienced by adopting the topographic attributes is mostly ensured, but with percentages depending on the case study characteristics and the adopted datasets. That is one of the main targets of our study; highlighting the usefulness of supplementing multispectral data with DEMs (that are rarely utilized compared to multispectral datasets) in lithological mapping and recommending their outputs for future research. It should be emphasized that confirming the usefulness of DEM in the lithological mapping over a different case study [9] could ensure the reliability and reproducibility of our current research for future work in delineating a specific mineralized rock unit (i.e., ferrogabbros in the current study).
The current research focused on ferrogabbros through providing a whole rock geochemical analysis highlighting the origin of the ferrogabbros (continental arc gabbros). Additionally, the higher values of the FeO/MgO ratio, ranging from 6.4 to 3.1 with an average of 4.43, indicates that the original magma of these rocks was primitive and alkaline to calc-alkaline in nature. The significant Fe2O3 content, which varies between 14.95% and 17.50% with an average of 15.06%, provides additional evidence in favor of this interpretation (primitive and alkaline to calc-alkaline composition for the original magma). By thoroughly examining all the previous findings, insights were drawn regarding the source and timing of the titaniferous magnetite ore minerals in Wad Khashir. Fe-Ti oxides crystallize during the progressive cooling of several mafic magmas. The sequence of minerals produced by the crystallization of a primitive tholeiitic mafic magma is olivine, plagioclase and clinopyroxene. Some gabbroic intrusions have high concentrations of Fe-Ti oxides that are spread out over relatively thick masses, constituting economic ore.
An iron-titanium (Fe-Ti) ore deposit is hosted, mainly, by the ferrogabbros. The primary titanomagnetite that crystallized from the melt thus evolved to an end-member magnetite coexisting with ulvöspinel. Many gabbroic intrusions are emplaced in the continental crust where they are often genetically related to continental arc gabbros formed during continental rifting. Ti-bearing magnetite that formed as oxidized or exsolved lamellae is designated as chemical magnetization during subsolidus cooling. Titanomagnetite deposits form during the differentiation of a silicate melt as a result of the periodic oxidation of the magma. The reaction between iron-rich olivine (fayalite) crystallizing from magma and the oxygen dissolved in melt is as follows [73,74,75,76,77]:
3Fe2SiO4 + O2 = 2Fe3O4 + 3SiO2
Fayalite is a ferrous (Fe2+) compound, whose crystal structure tolerates only a minute amount of Fe3+. If sufficient oxygen is present in the system to cause significant oxidation of Fe2+ to Fe3+, the olivine breaks down to a mixture of magnetite (Fe3O4), which contains both Fe2+ and Fe3+, and quartz [75,76]. Titanomagnetite ore ranges texturally from continuous aggregates of Fe-Ti minerals enclosing silicate minerals to disseminated ore in which titanomagnetite ores occur as xenomorphic segregations from about 5 mm to several centimeters’ diameter within a silicate matrix. The thickness of the gabbroic intrusions extended over an area of at least 2 km by 3 km and these intrusions indicate that magma intruded as a single pulse. It should be emphasized that a recent study [76] has been conducted over the south Eastern Desert (where the current study area is located) and reported Fe–Ti–V ore deposits in mafic-ultramafic rocks in harmony with our results, which highlights the role of fractional crystallization in the formation of Fe-Ti oxide deposits.

7. Conclusions

The current research integrated Sentinel 2–PALSAR DEM data to deliver a reliable lithologic mapping of Khashir-Ras El-Kharit district utilizing a support vector machine, aiming to highlight the distribution of mineralized ferrogabbros. The resultant thematic maps were statistically analyzed through the error matrix, compared with reference geological maps derived utilizing various remote sensing techniques, visually compared with the previous geological maps, and verified using intensive fieldwork and petrographical studies. The newly reported ferrogabbros were identified and analyzed using XRD and EDX, revealing their considerable economic value of Fe-Ti oxide ores. Additionally, the delineated ferrogabbros were analyzed (whole-rock geochemical analysis) to highlight their origin. In addition, the source and timing of the titaniferous magnetite ore minerals in Wadi Khashir were identified. The study concludes with the following:
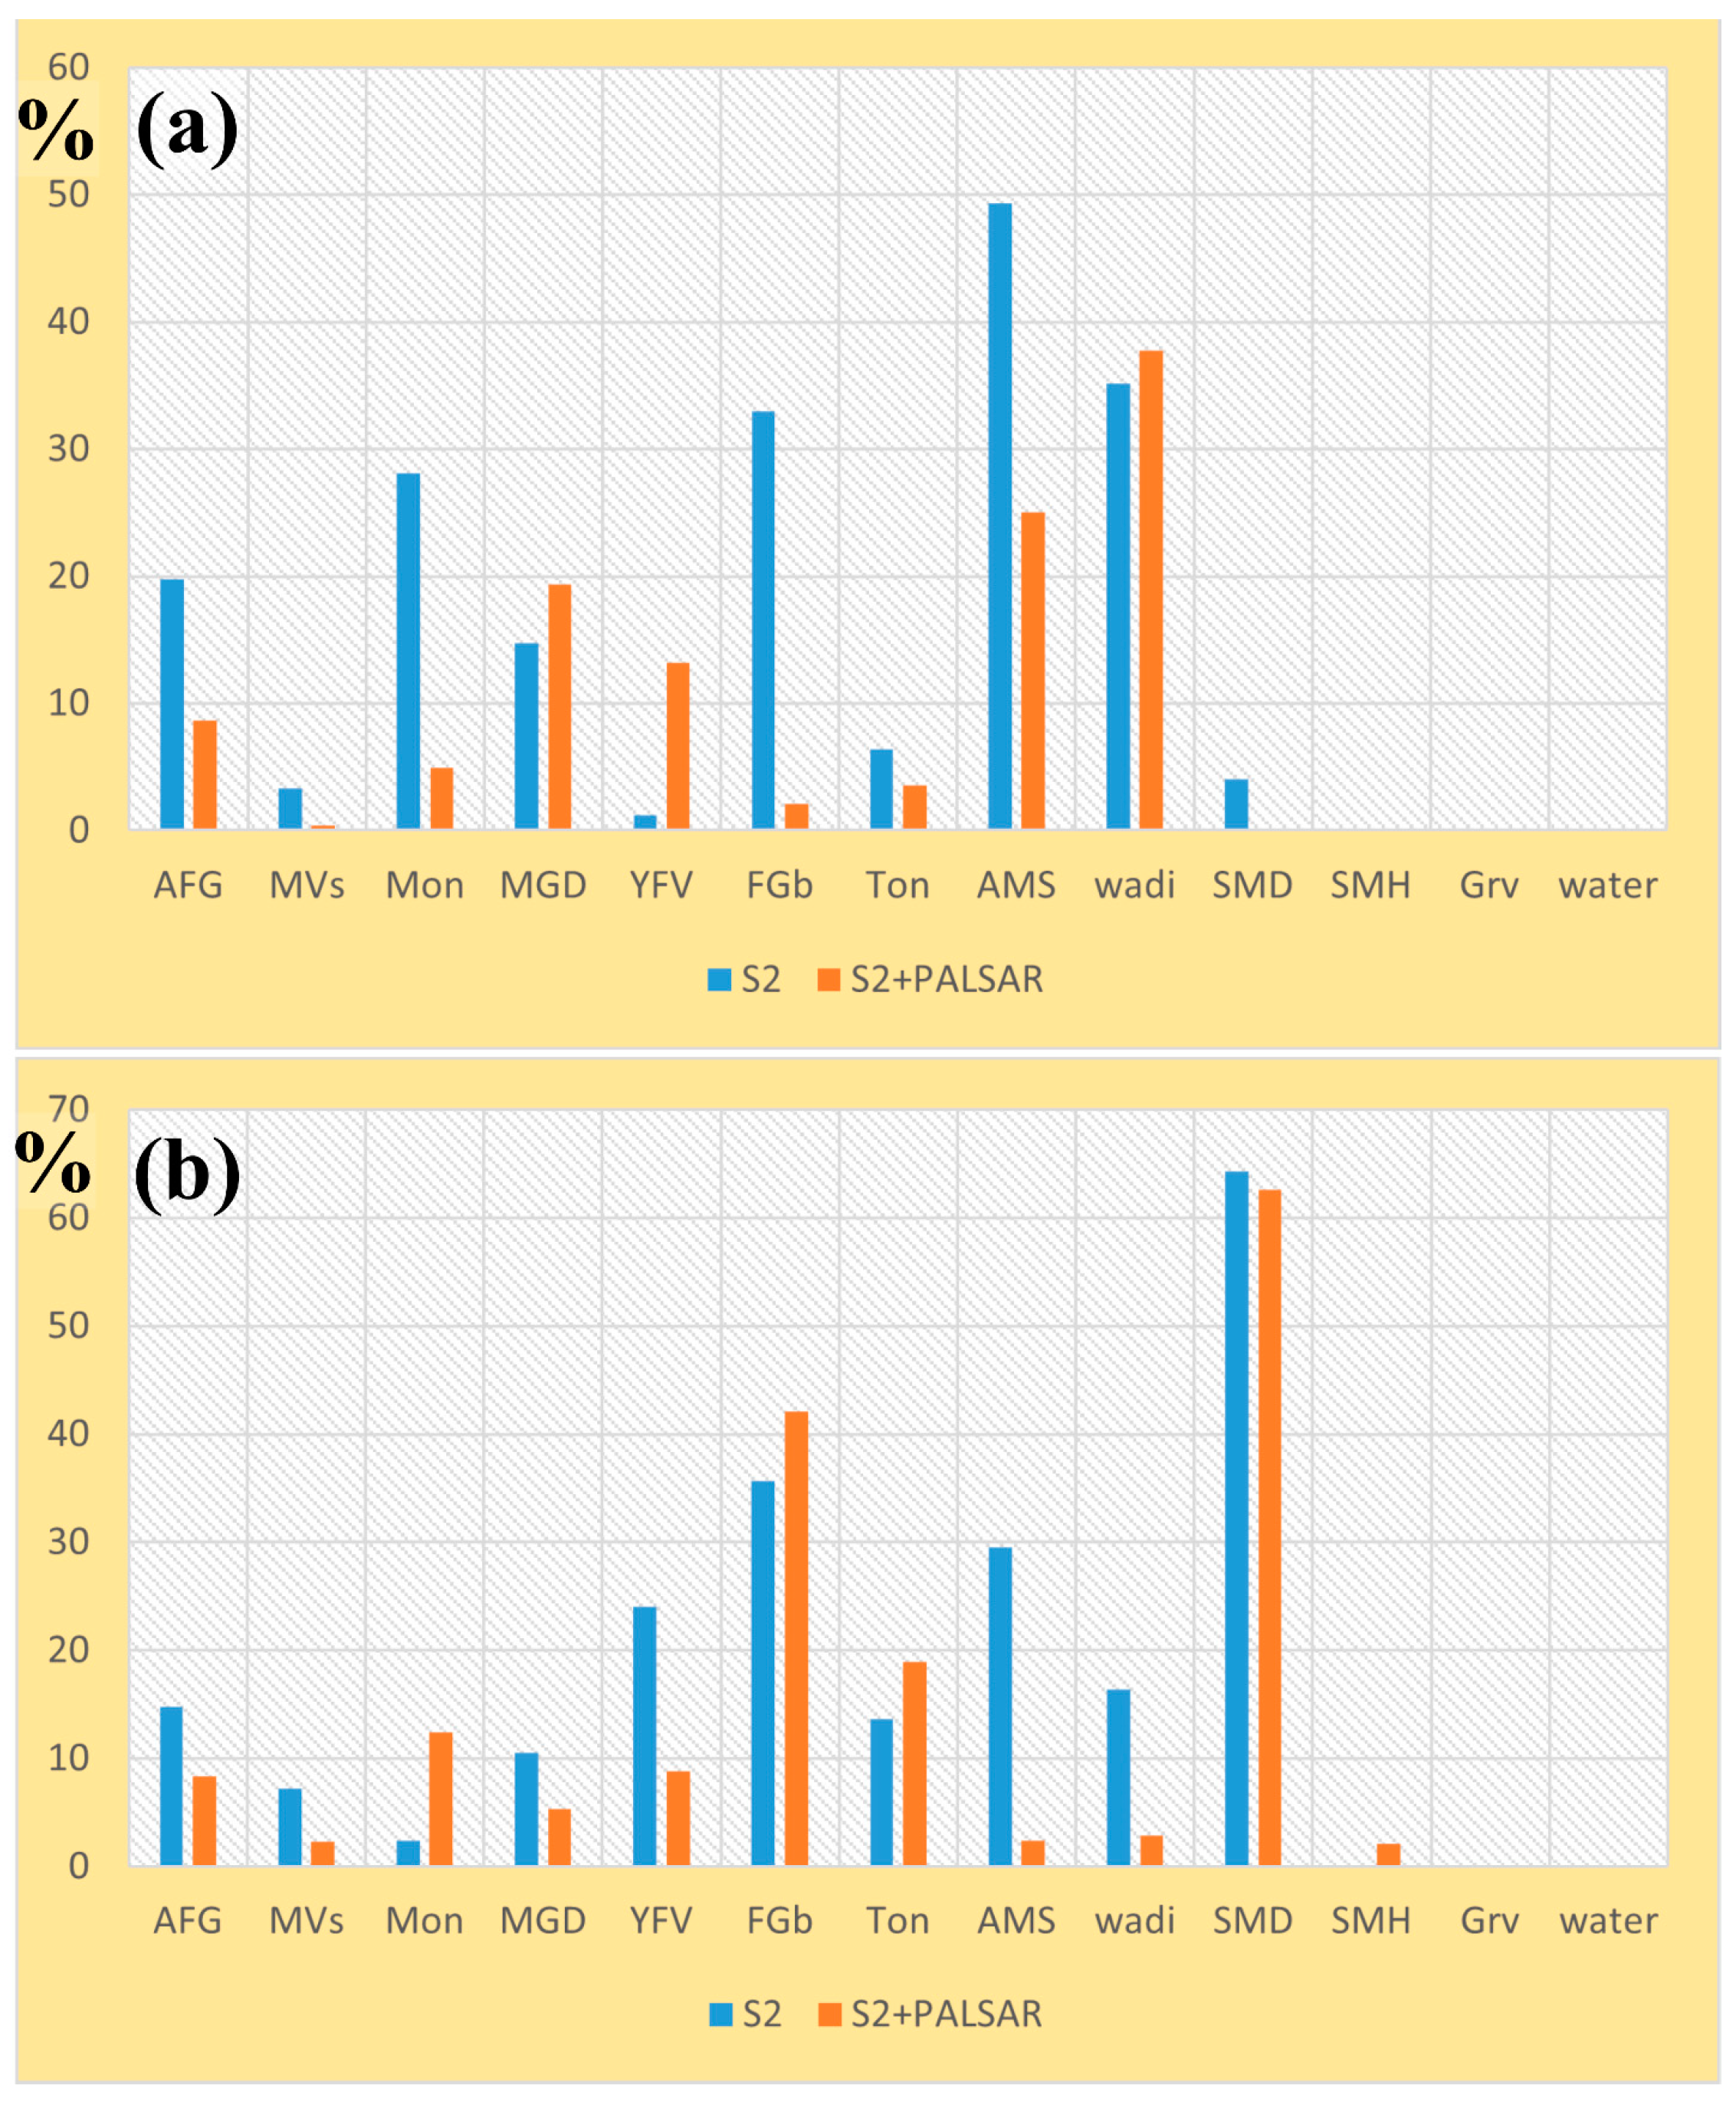
  • The study found that combining Sentinel-2 and PALSAR data improved lithological mapping compared to using Sentinel-2 alone.
  • The study introduced a new, objective lithologic map of the study area (focusing on ferrogabbros due to their mineralized content) and strongly recommends blending topographical information with optical datasets as the enhancement in their outputs are mostly ensured with varied percentages depending on the nature of the lithologies, the implemented datasets and the study area.
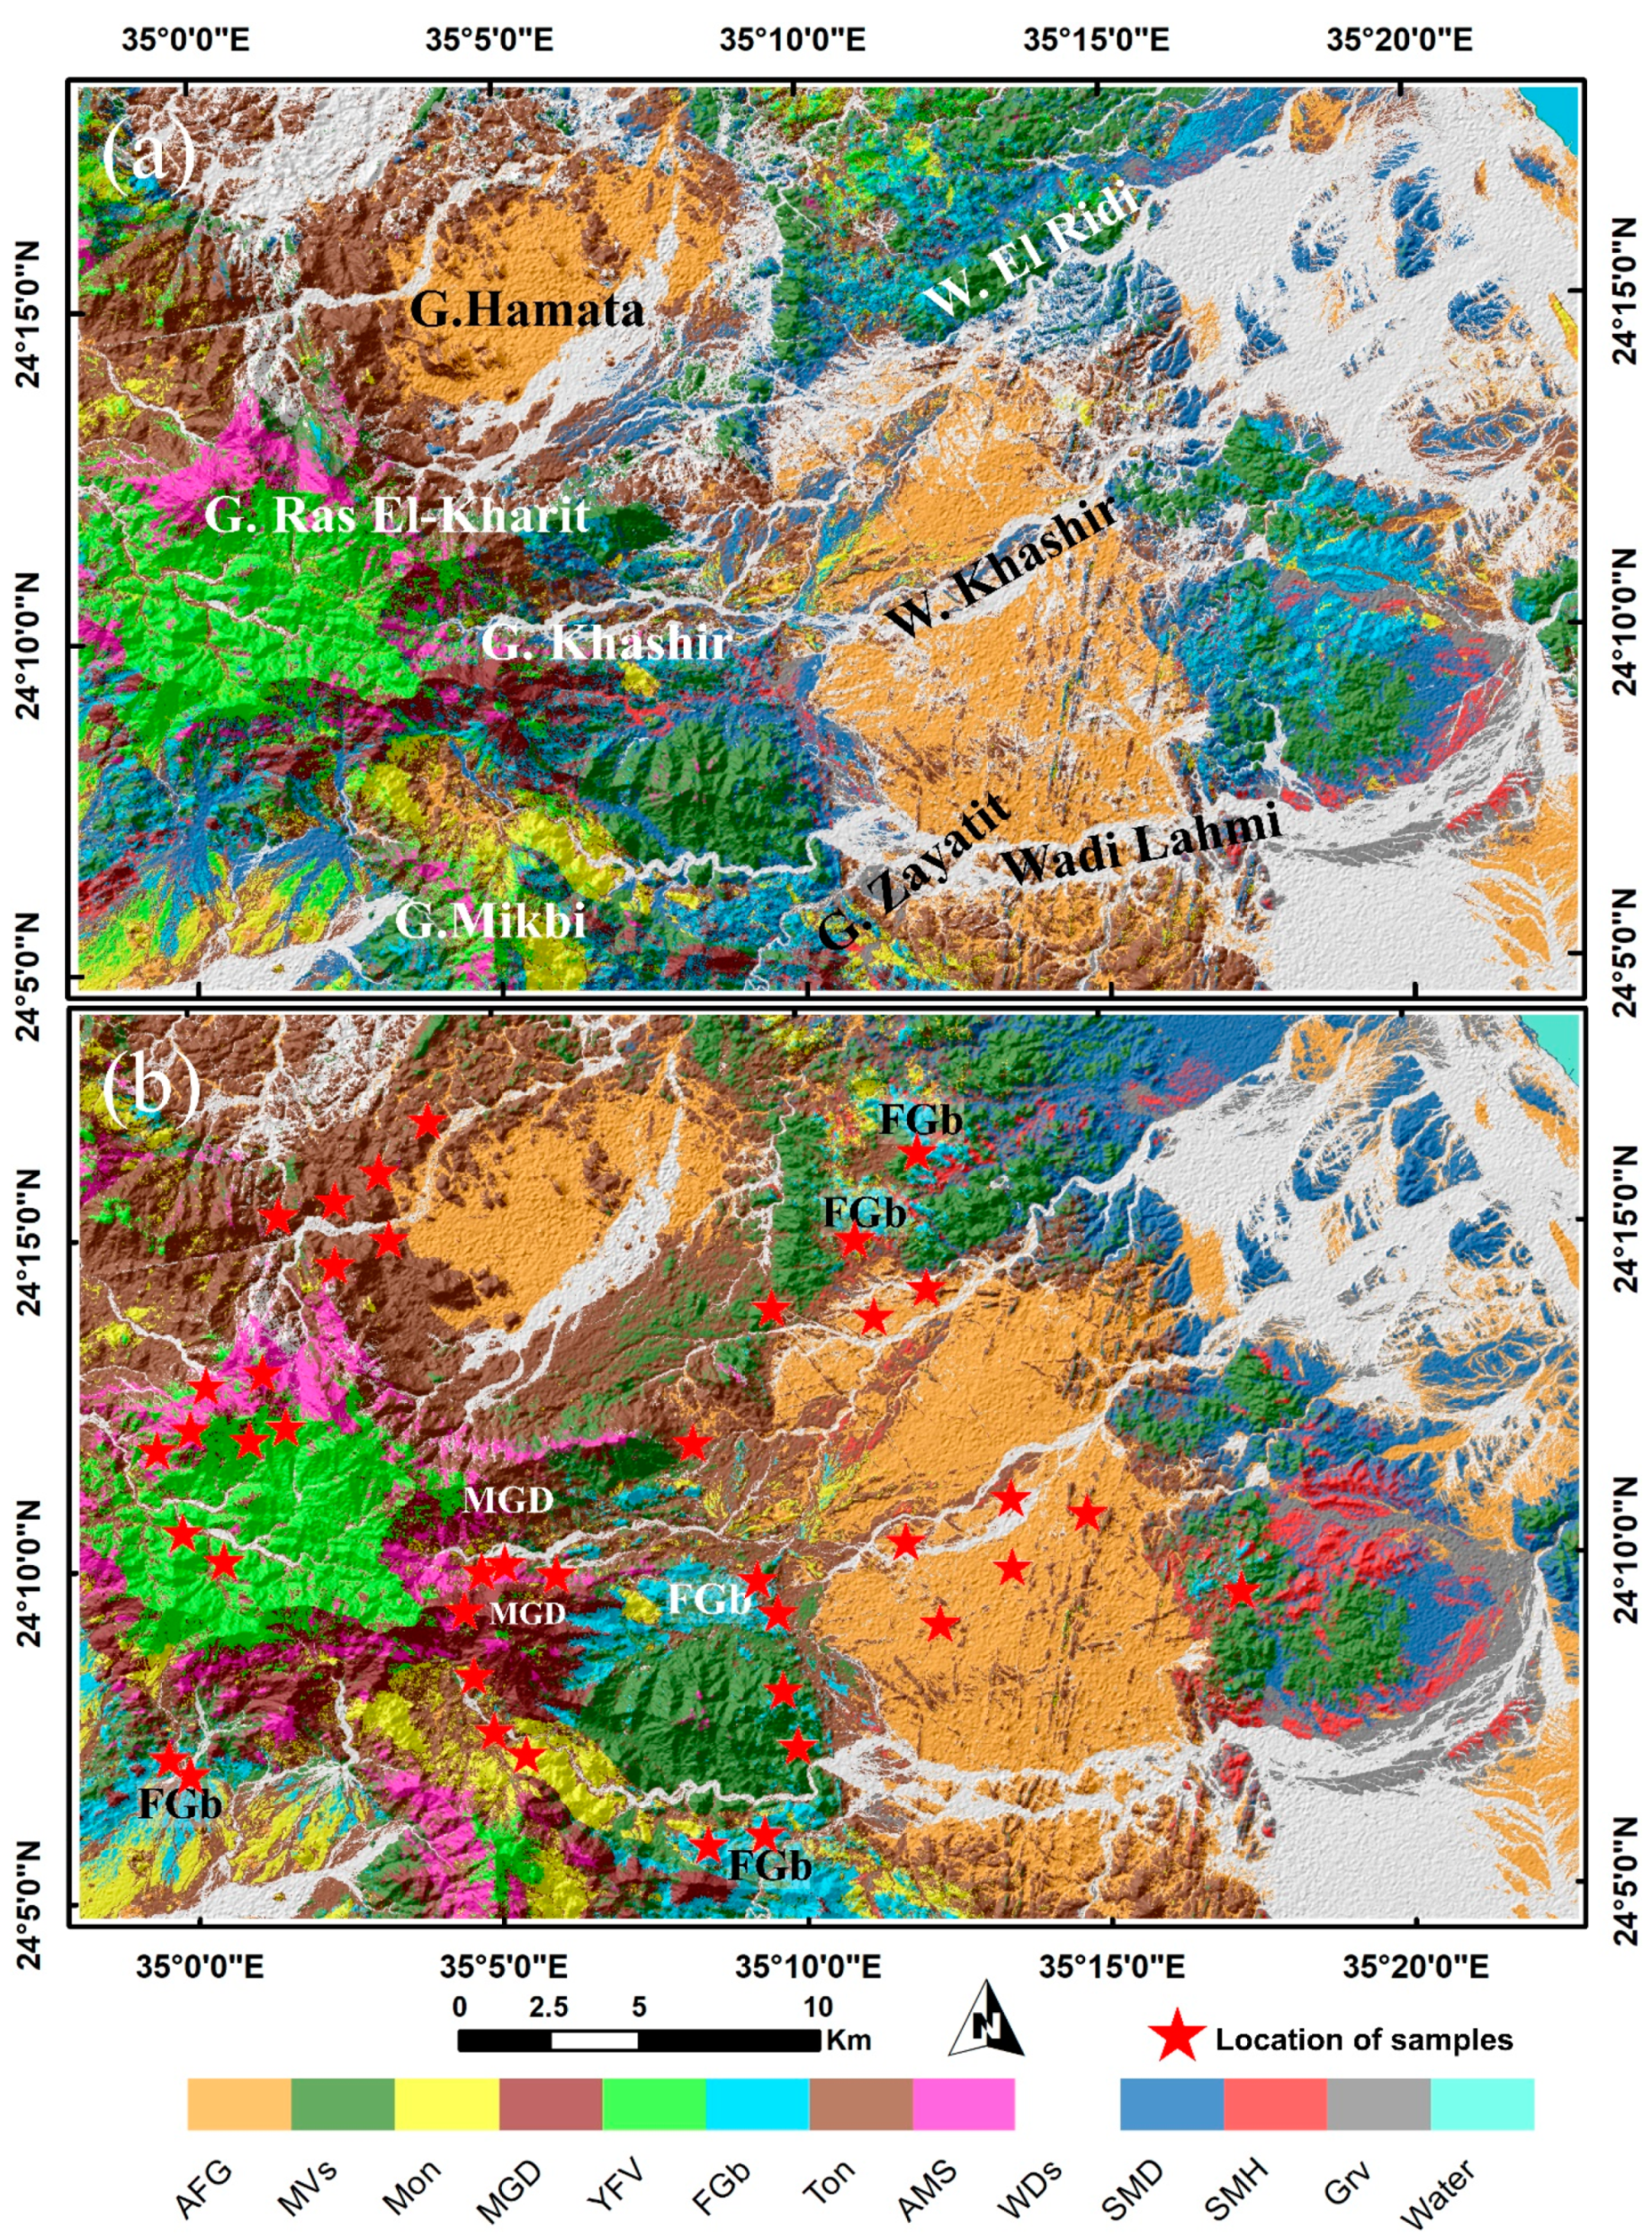
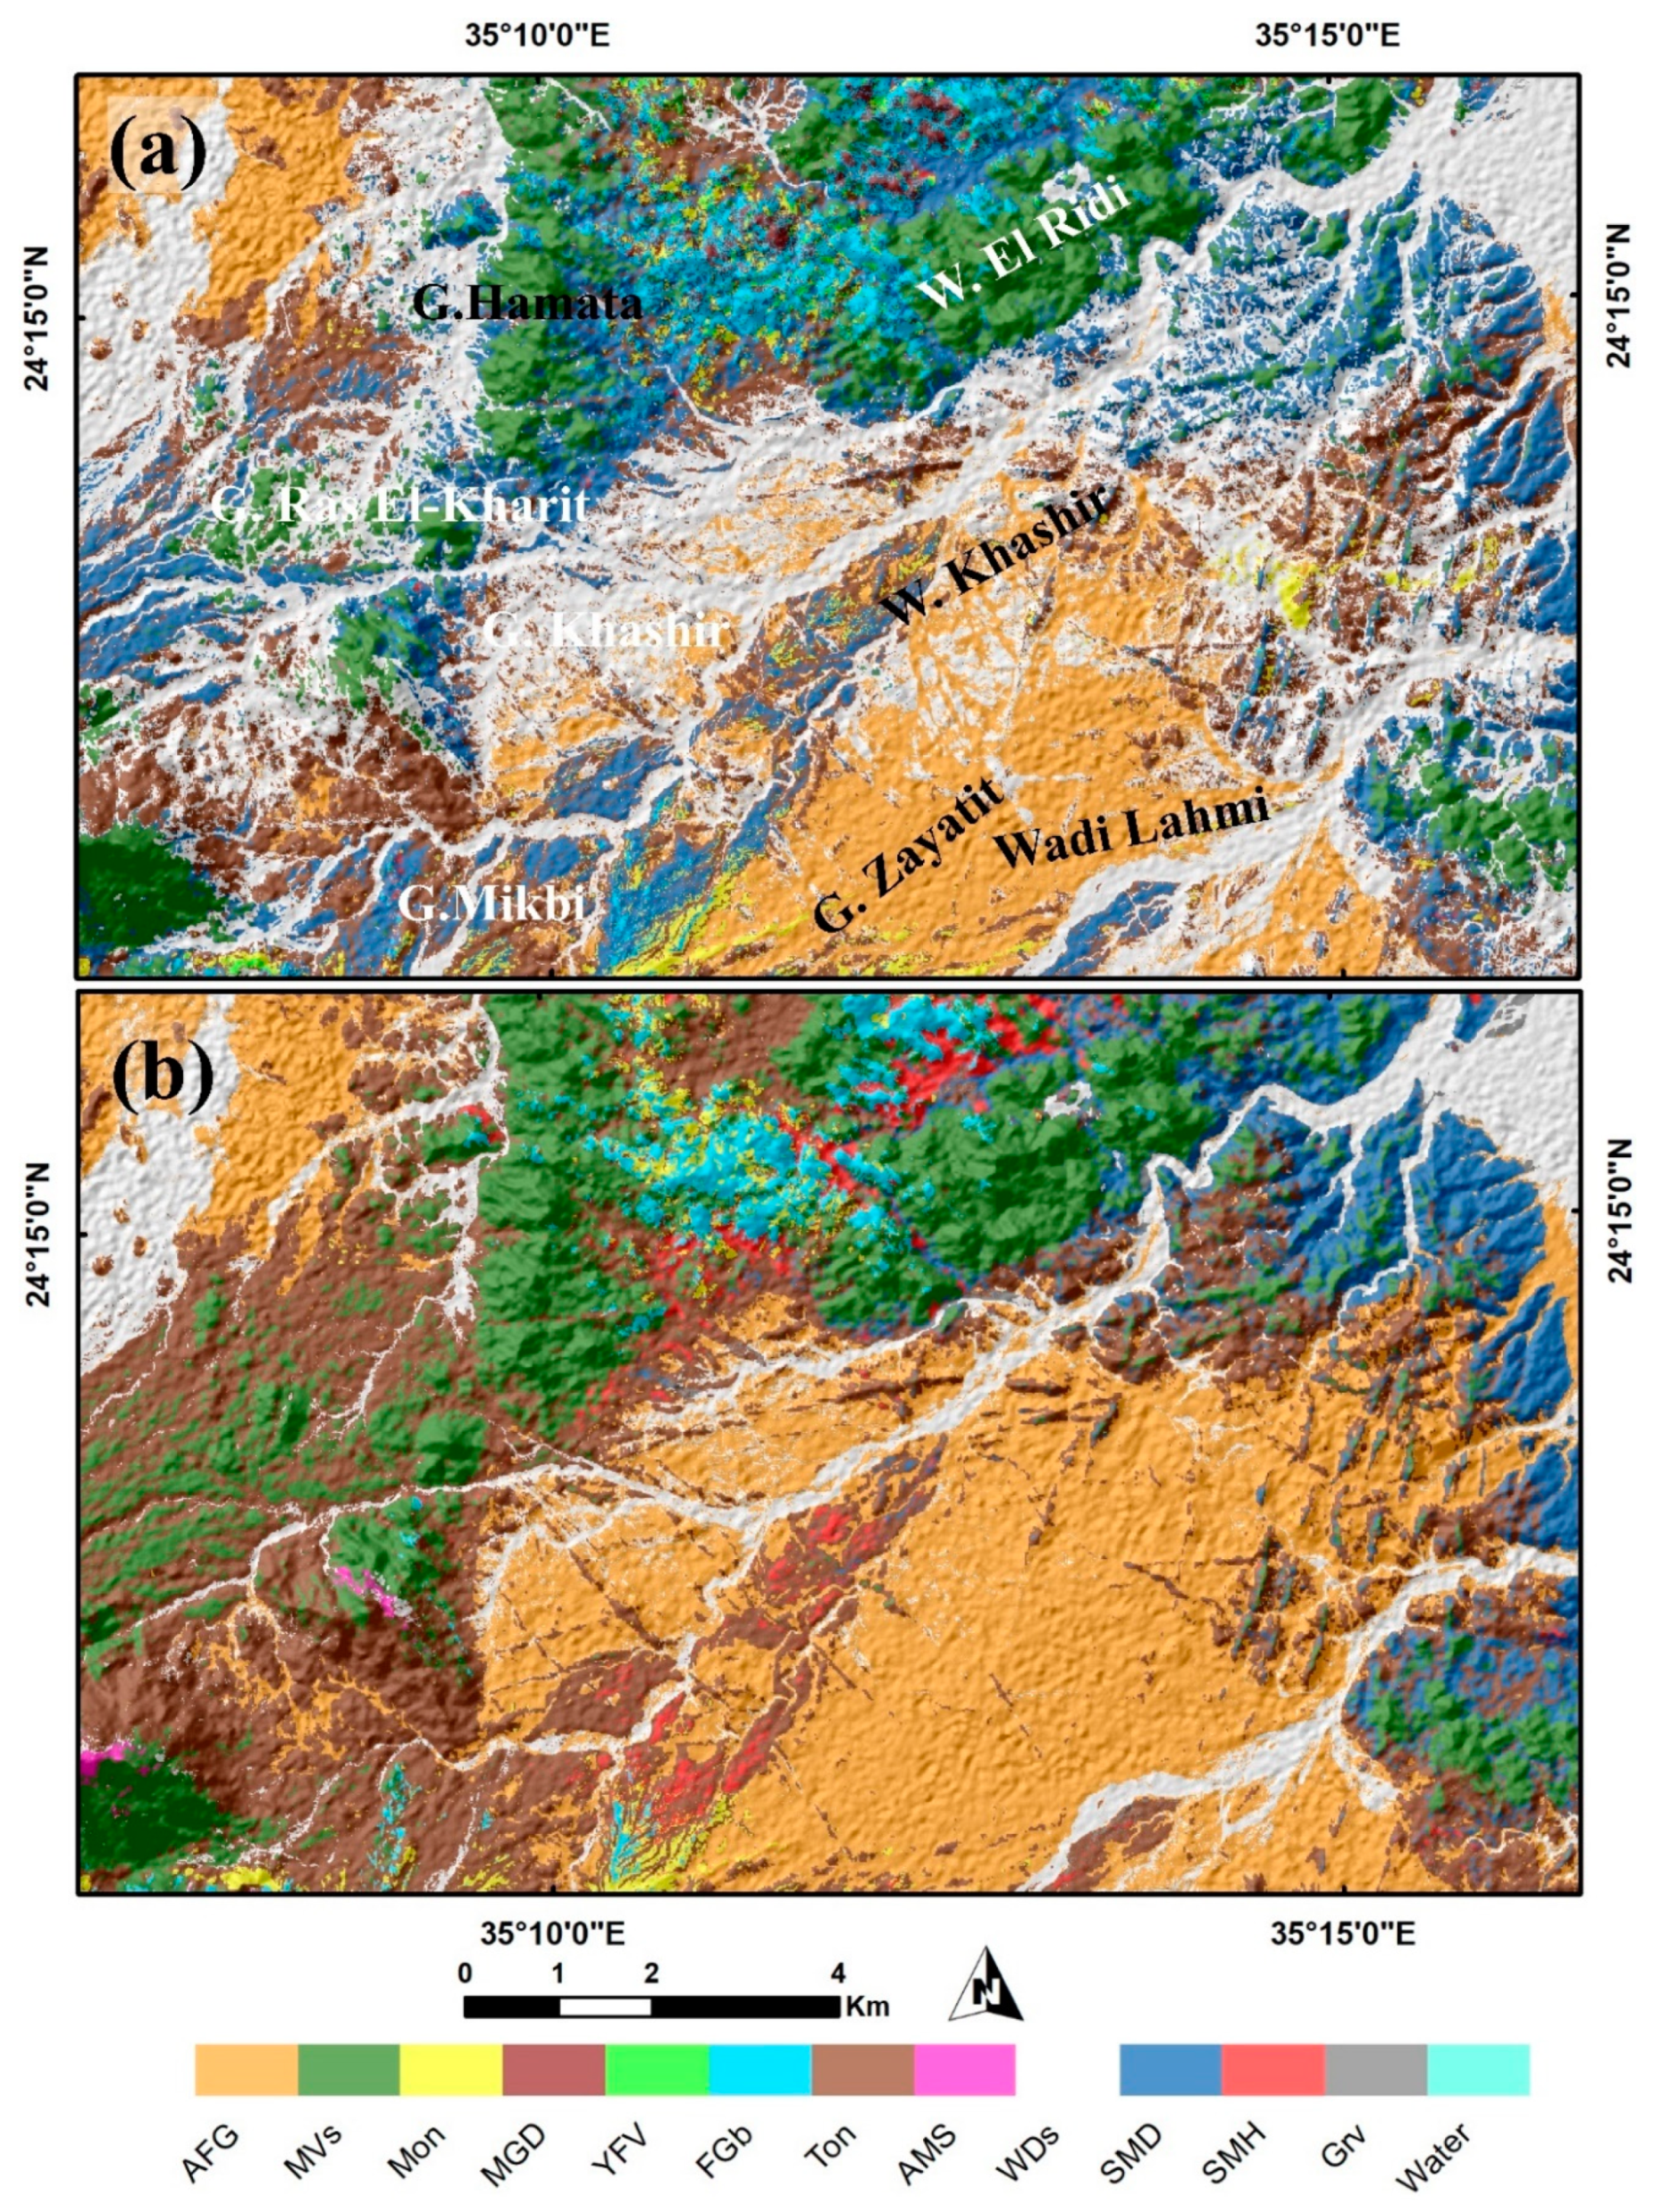
  • Both Sentinel 2 and the combined Sentinel 2–PALSAR data can be used to create reasonable lithological maps using a support vector machine. Nonetheless, incorporating PALSAR DEM with Sentinel 2 data leads to an improved lithological map.
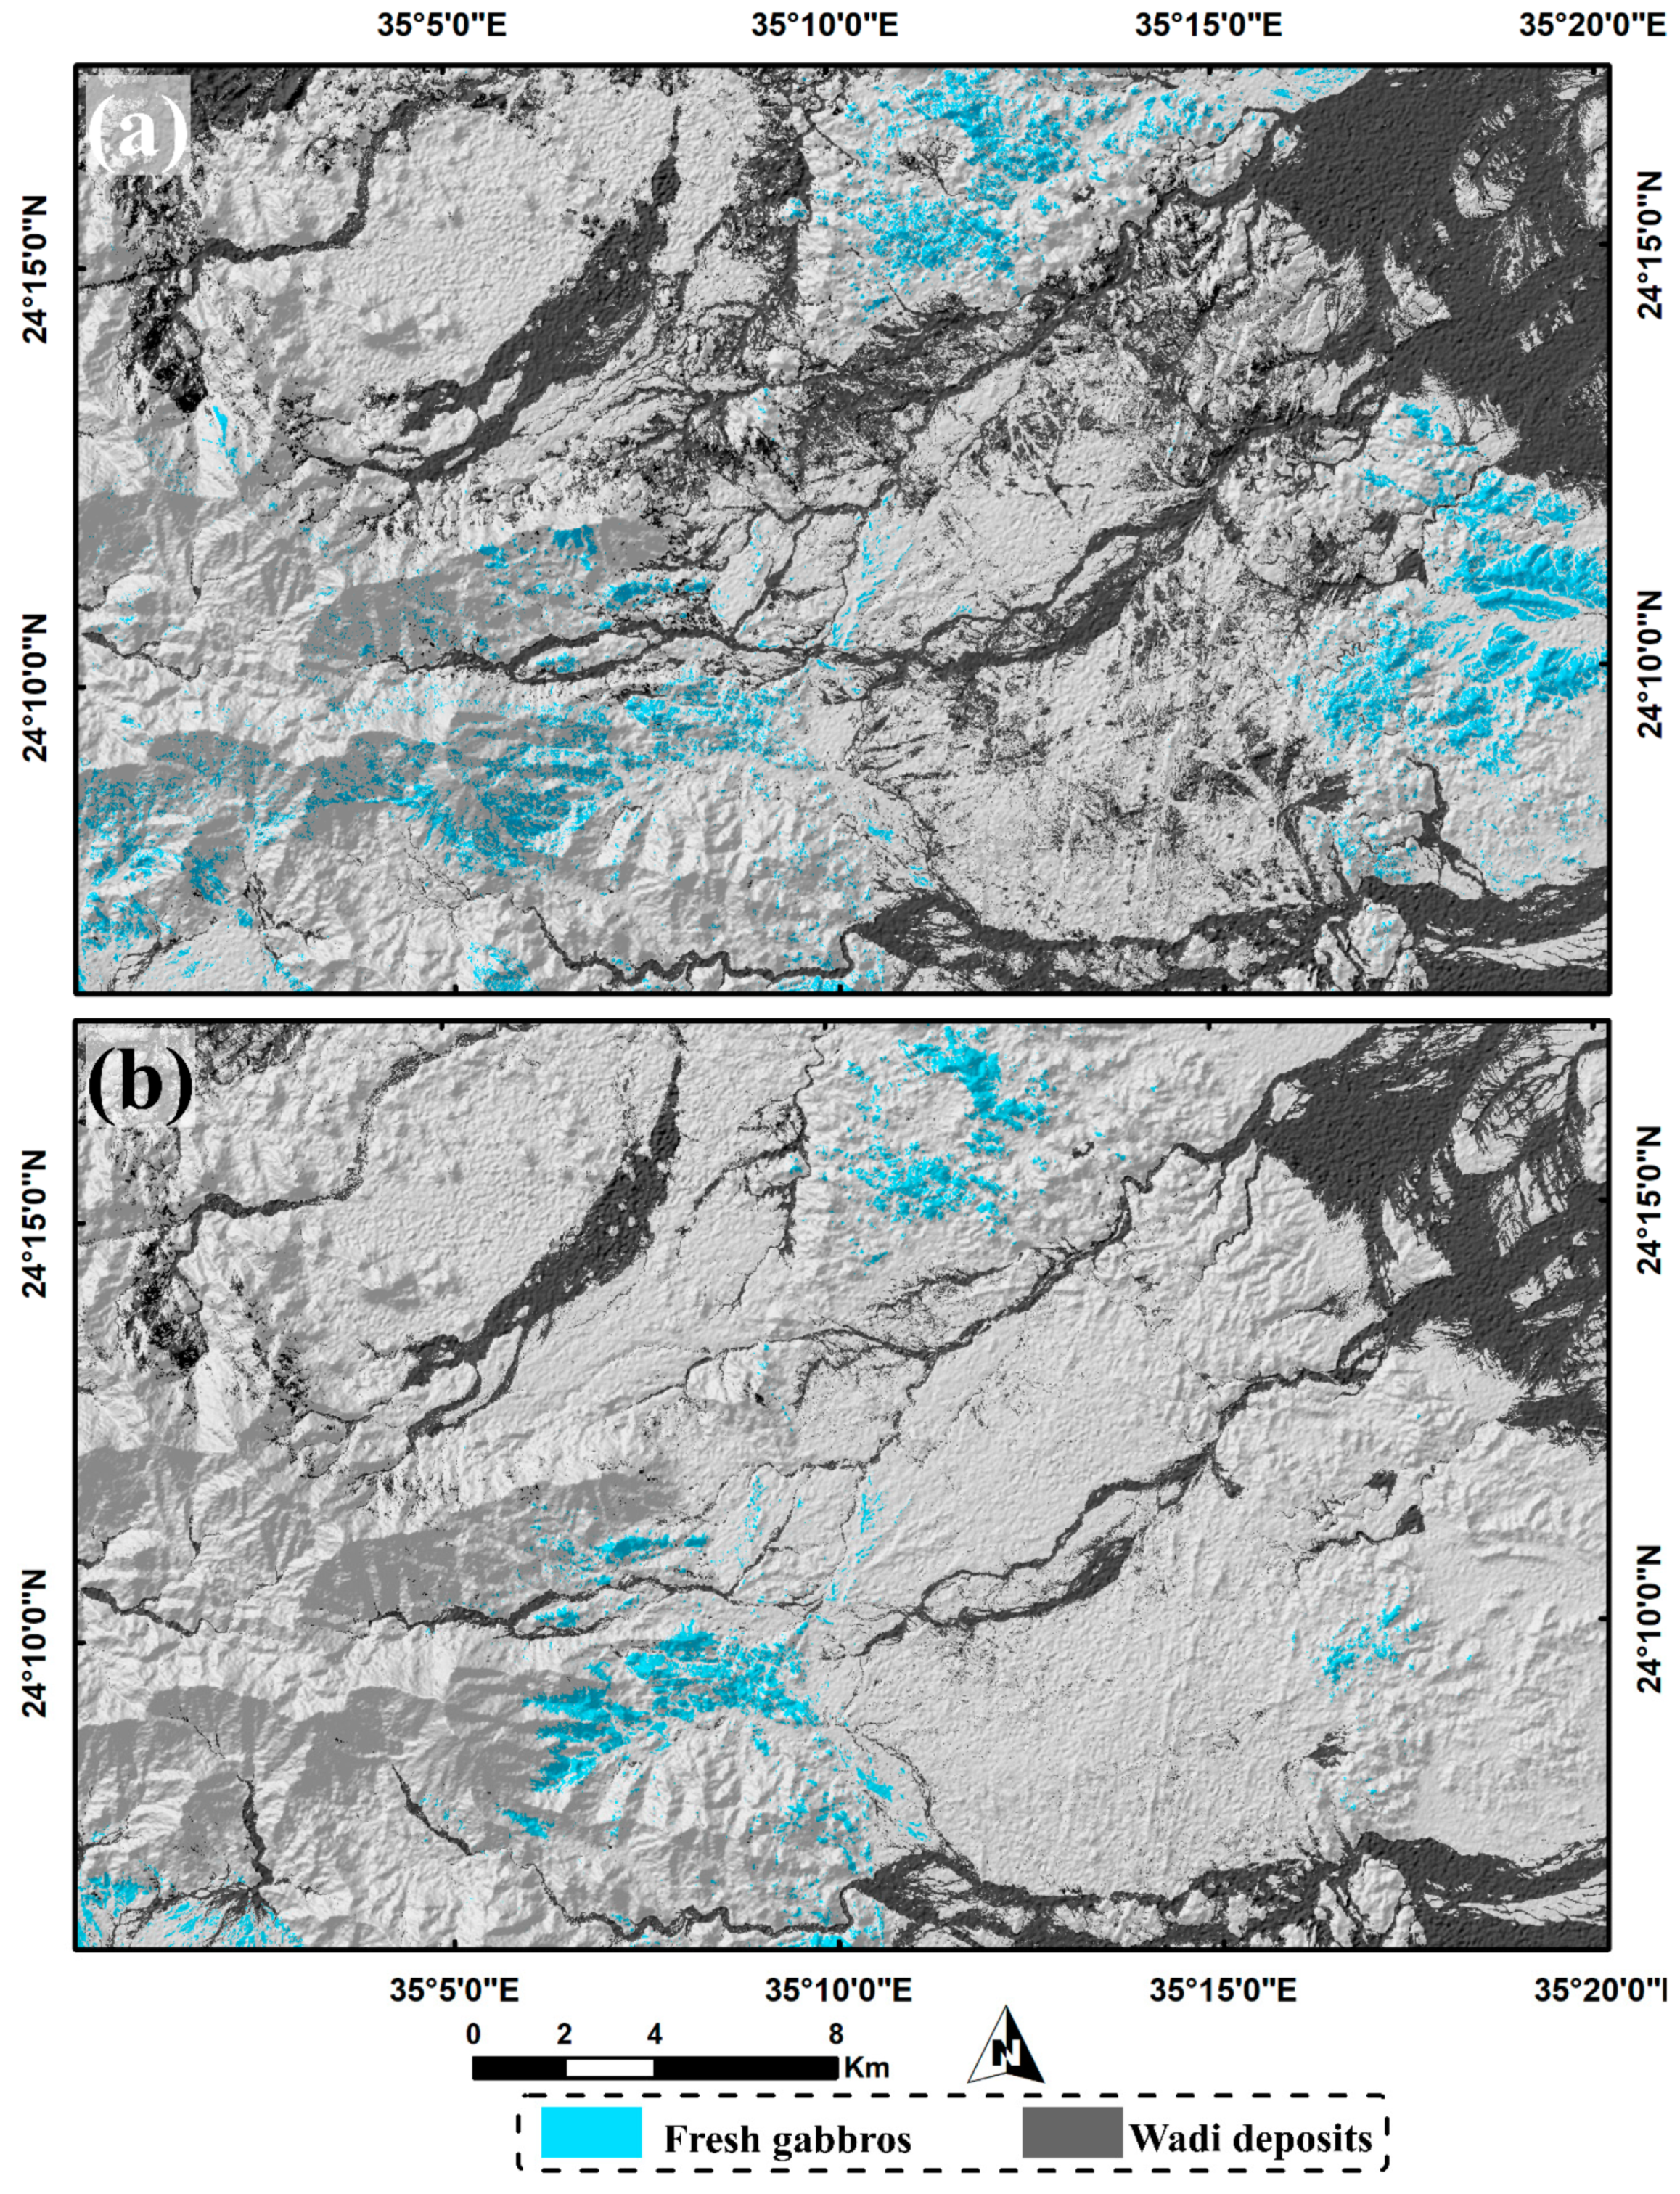
  • The resultant lithological map (using combined PALSAR DEM with Sentinel 2) introduced a well-defined distribution of ferrogabbros compared to all the previous studies over the study area.
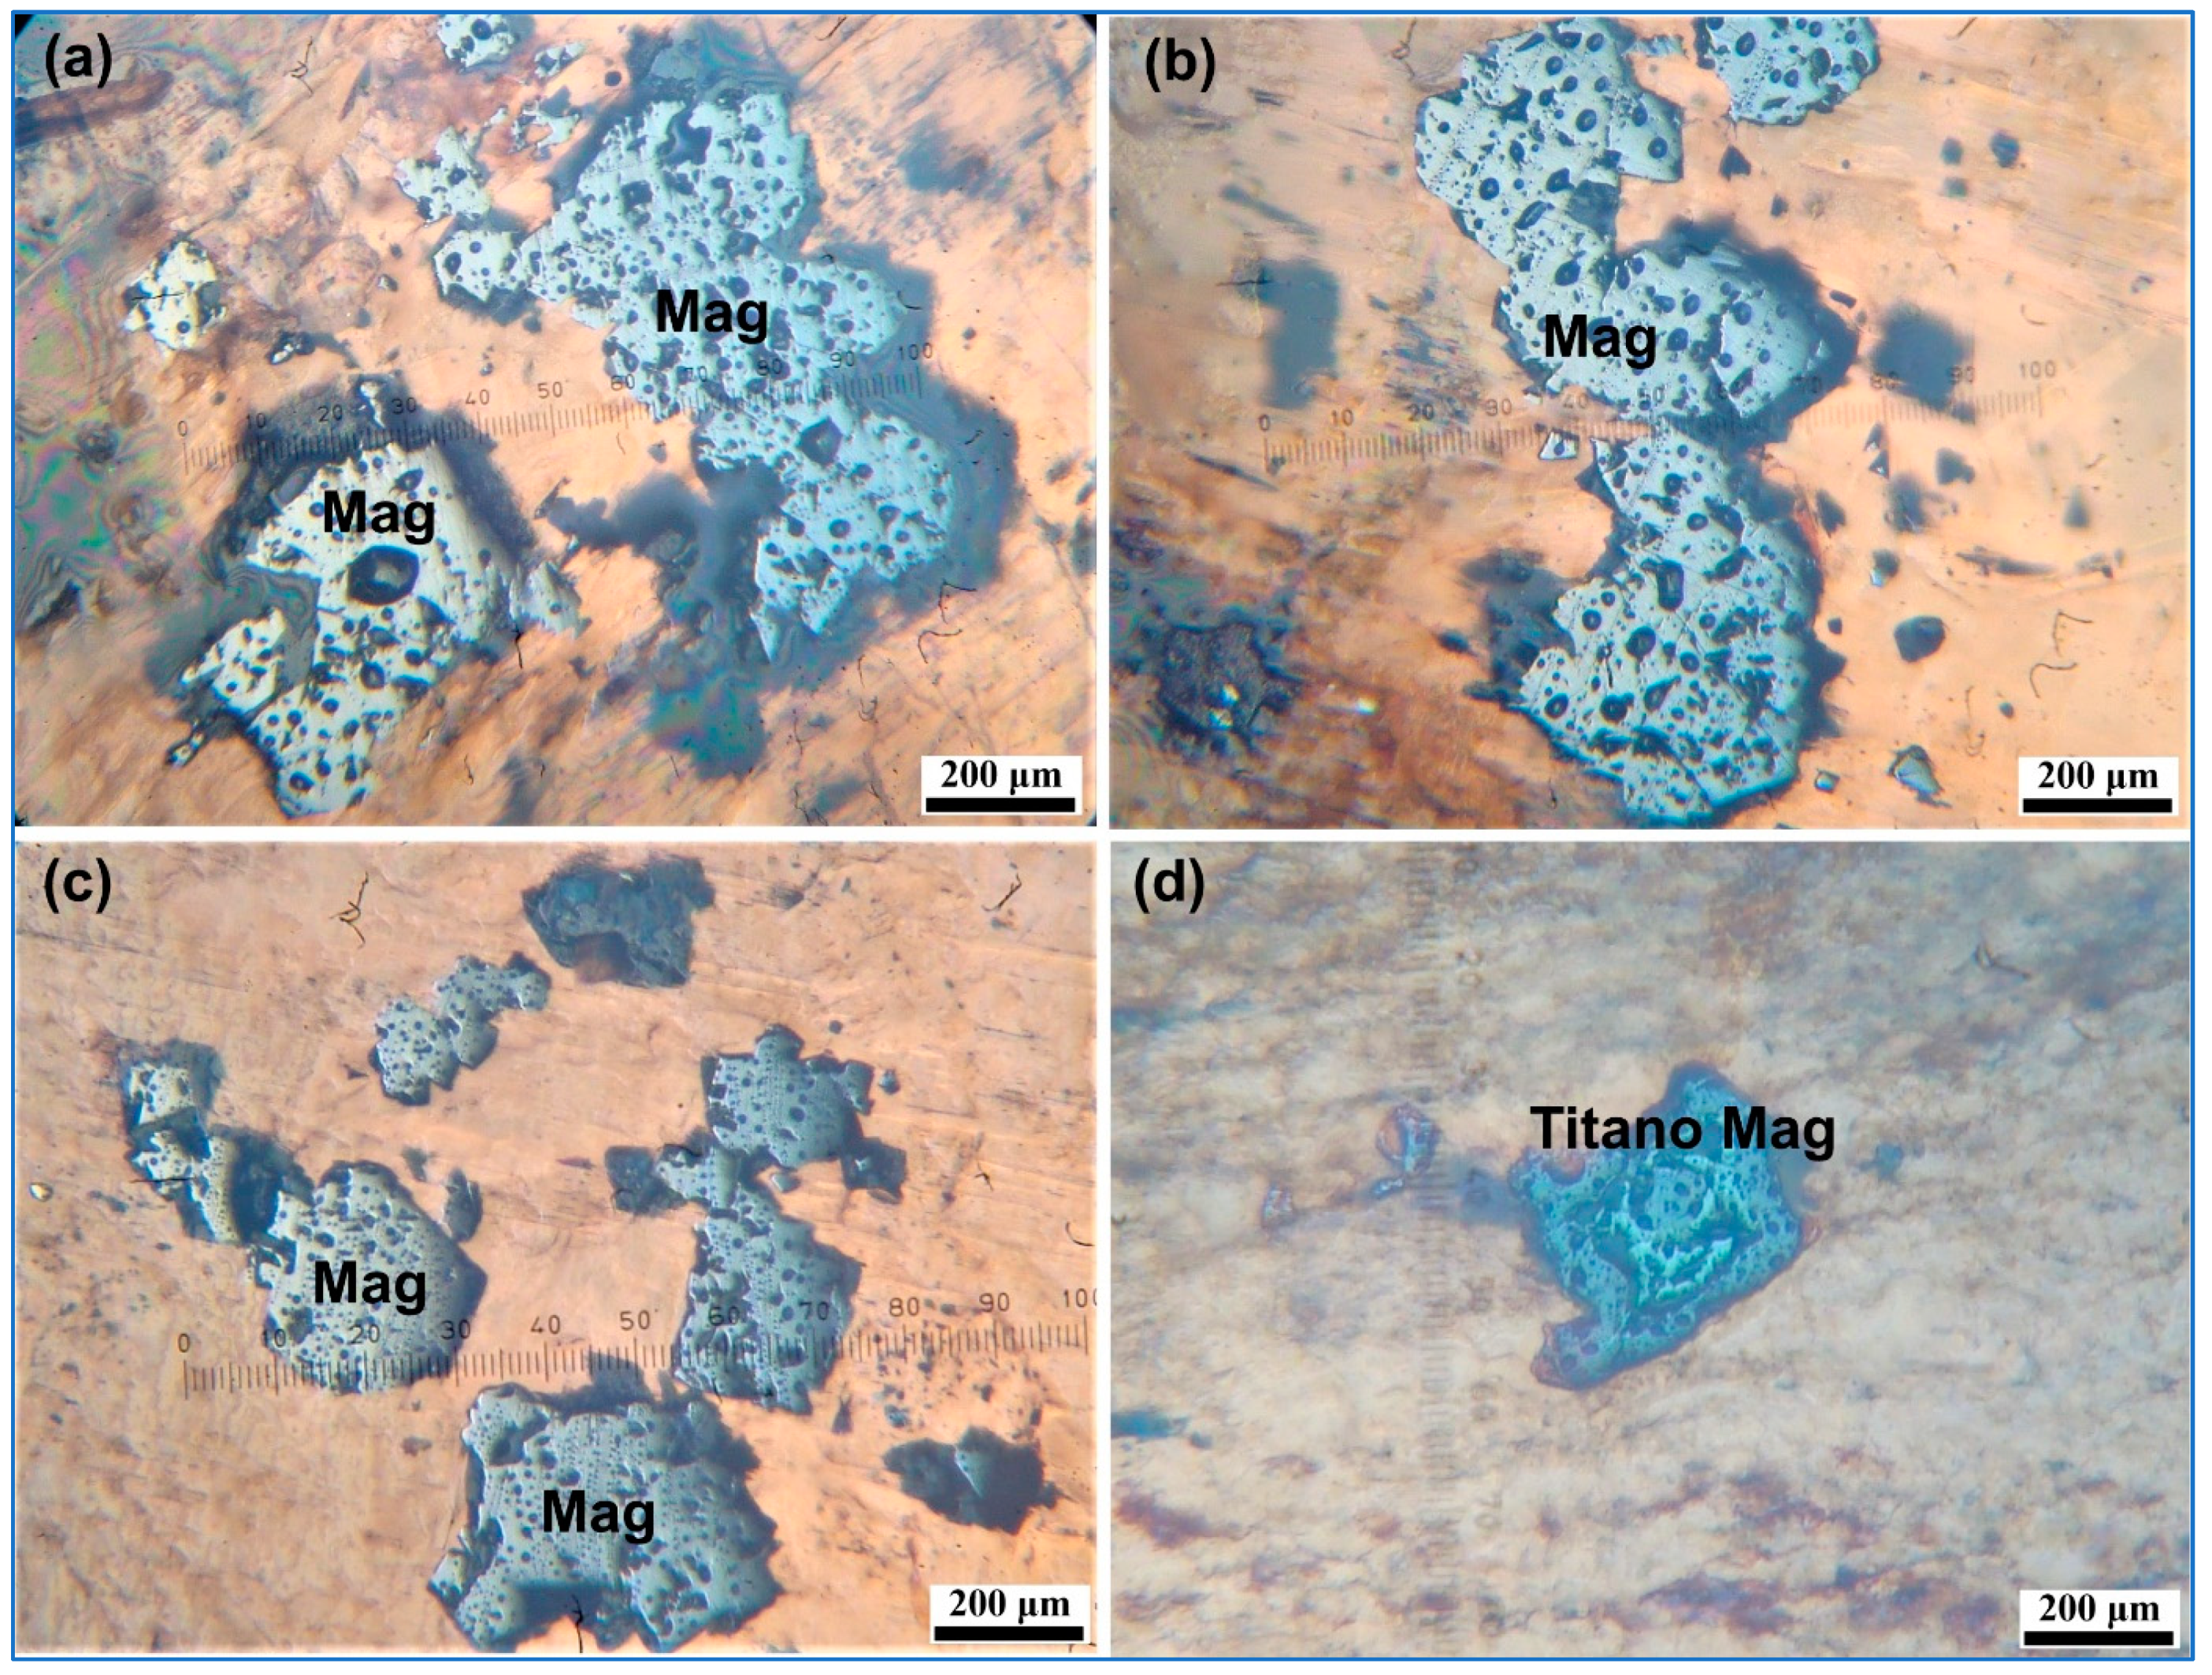
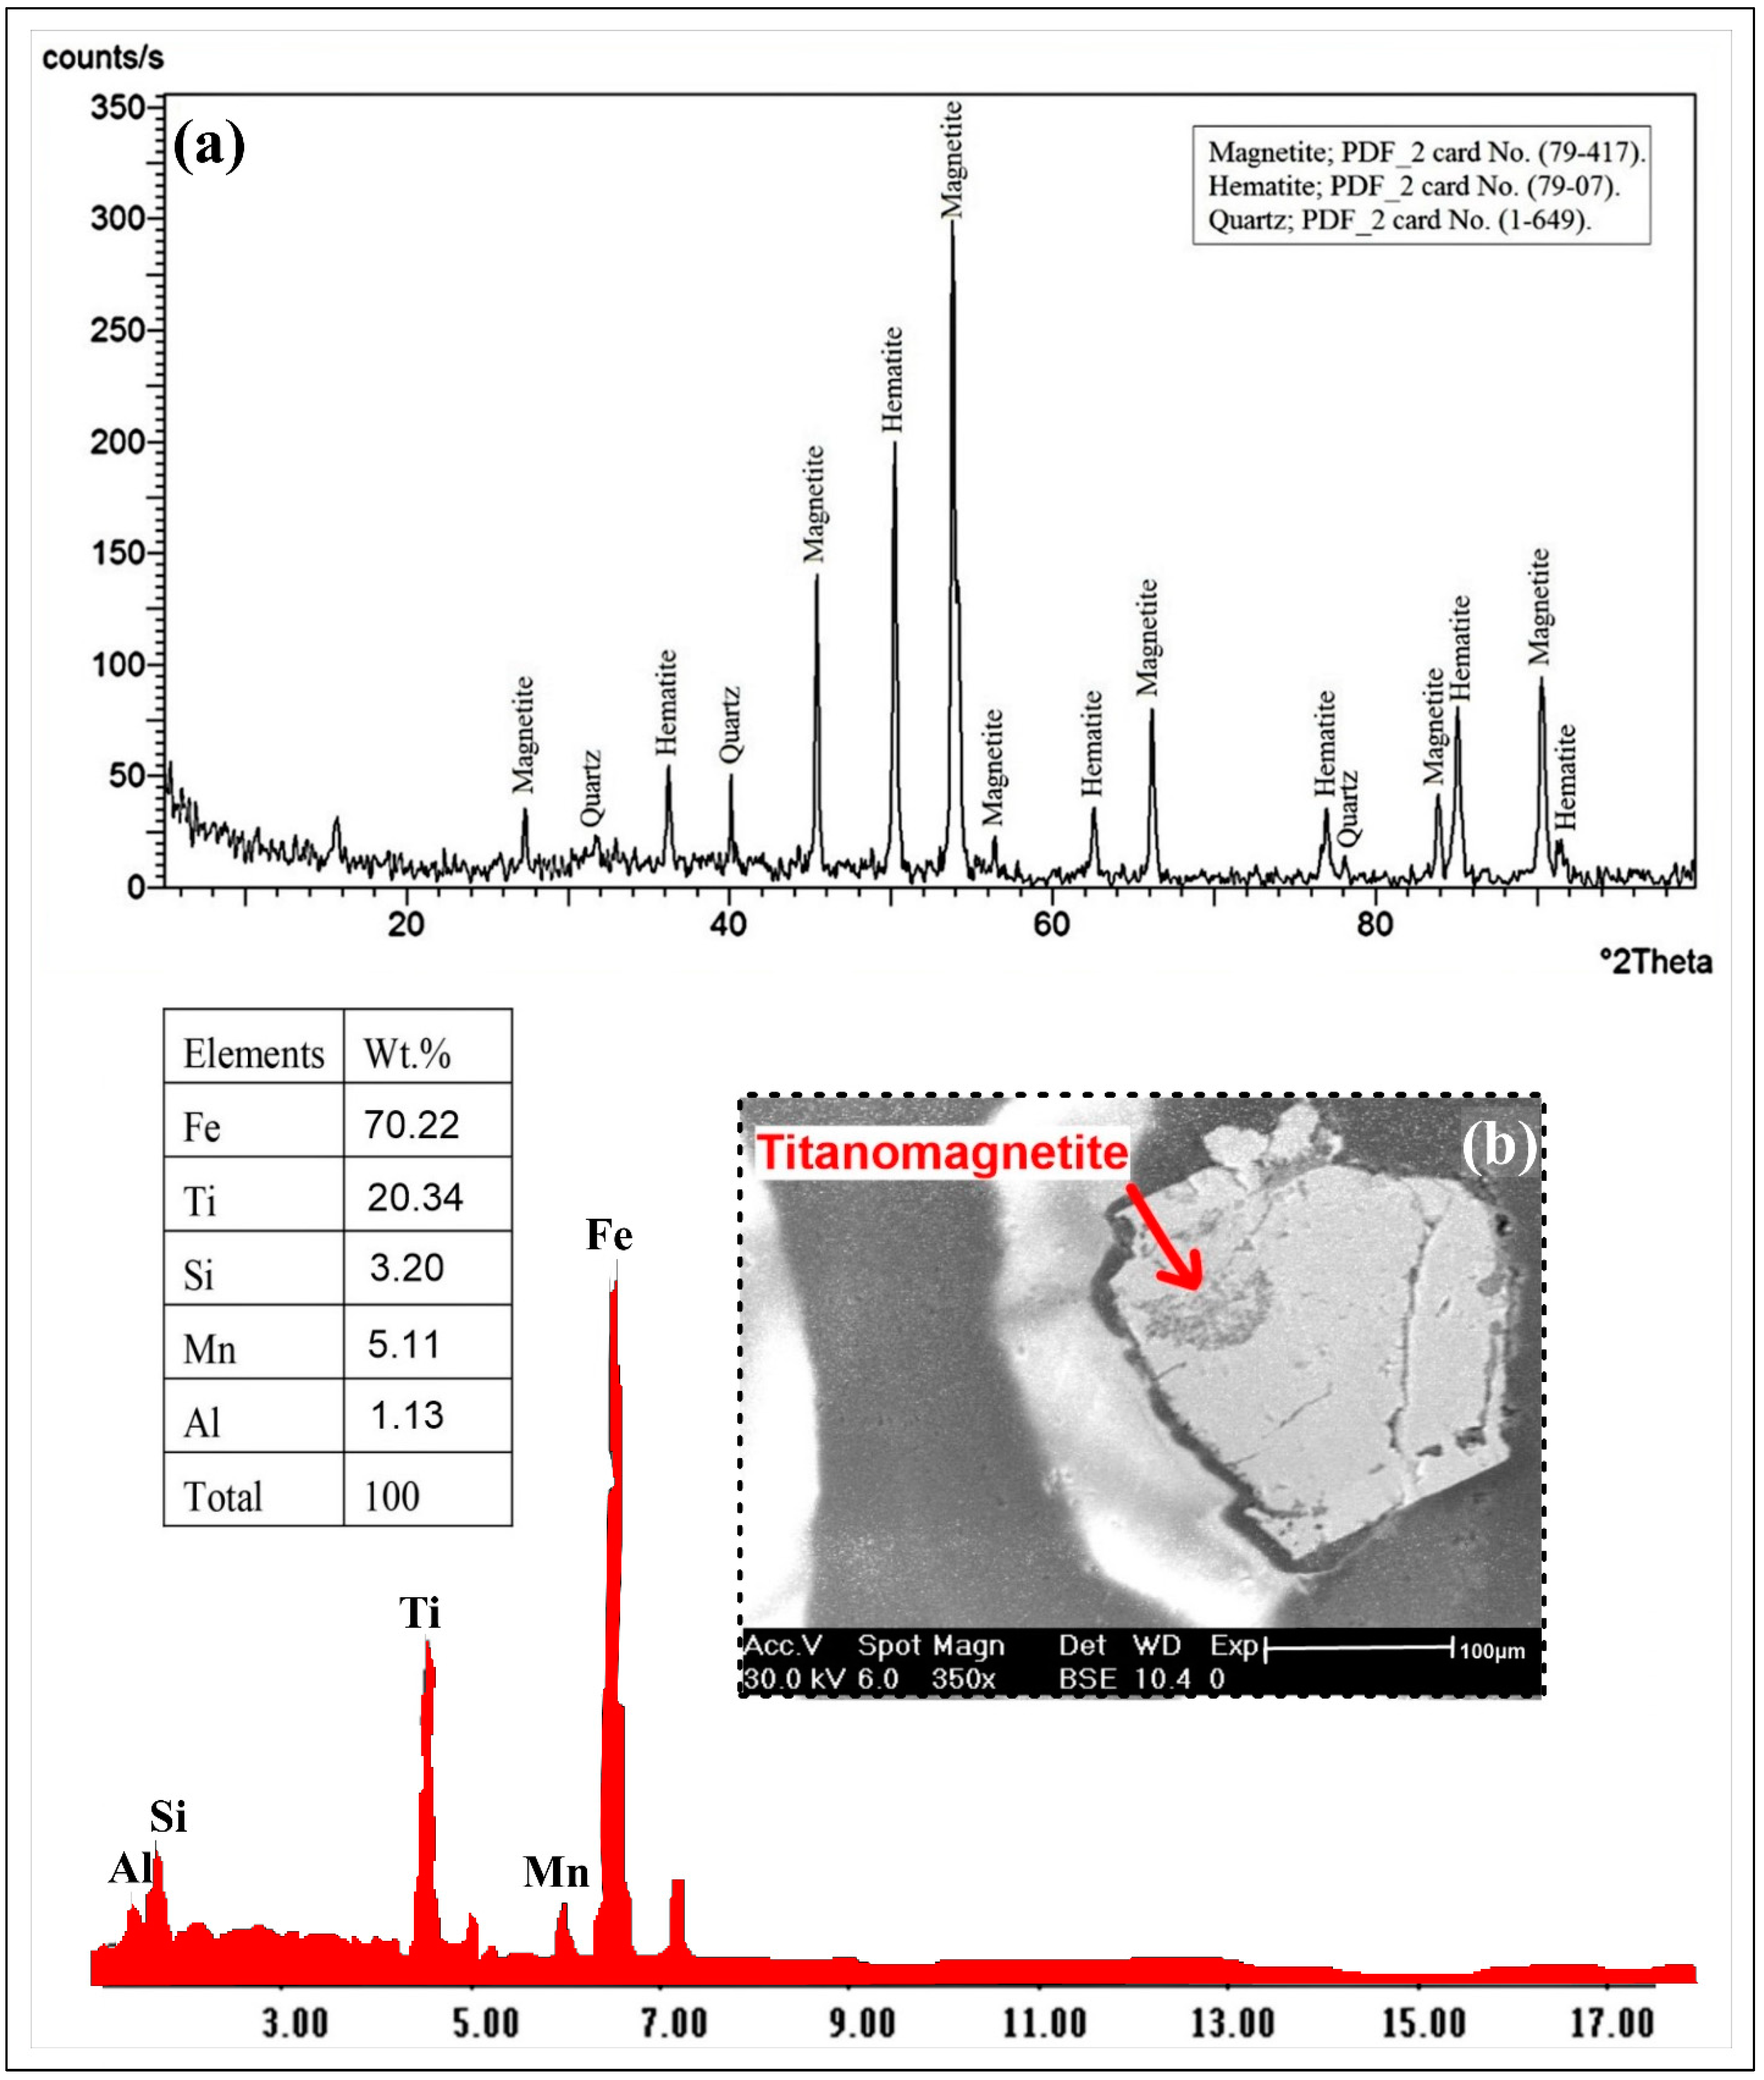
  • Analytical investigations of the ferrogabbros highlighted the presence of magnetite, titanomagnetite and hematite.
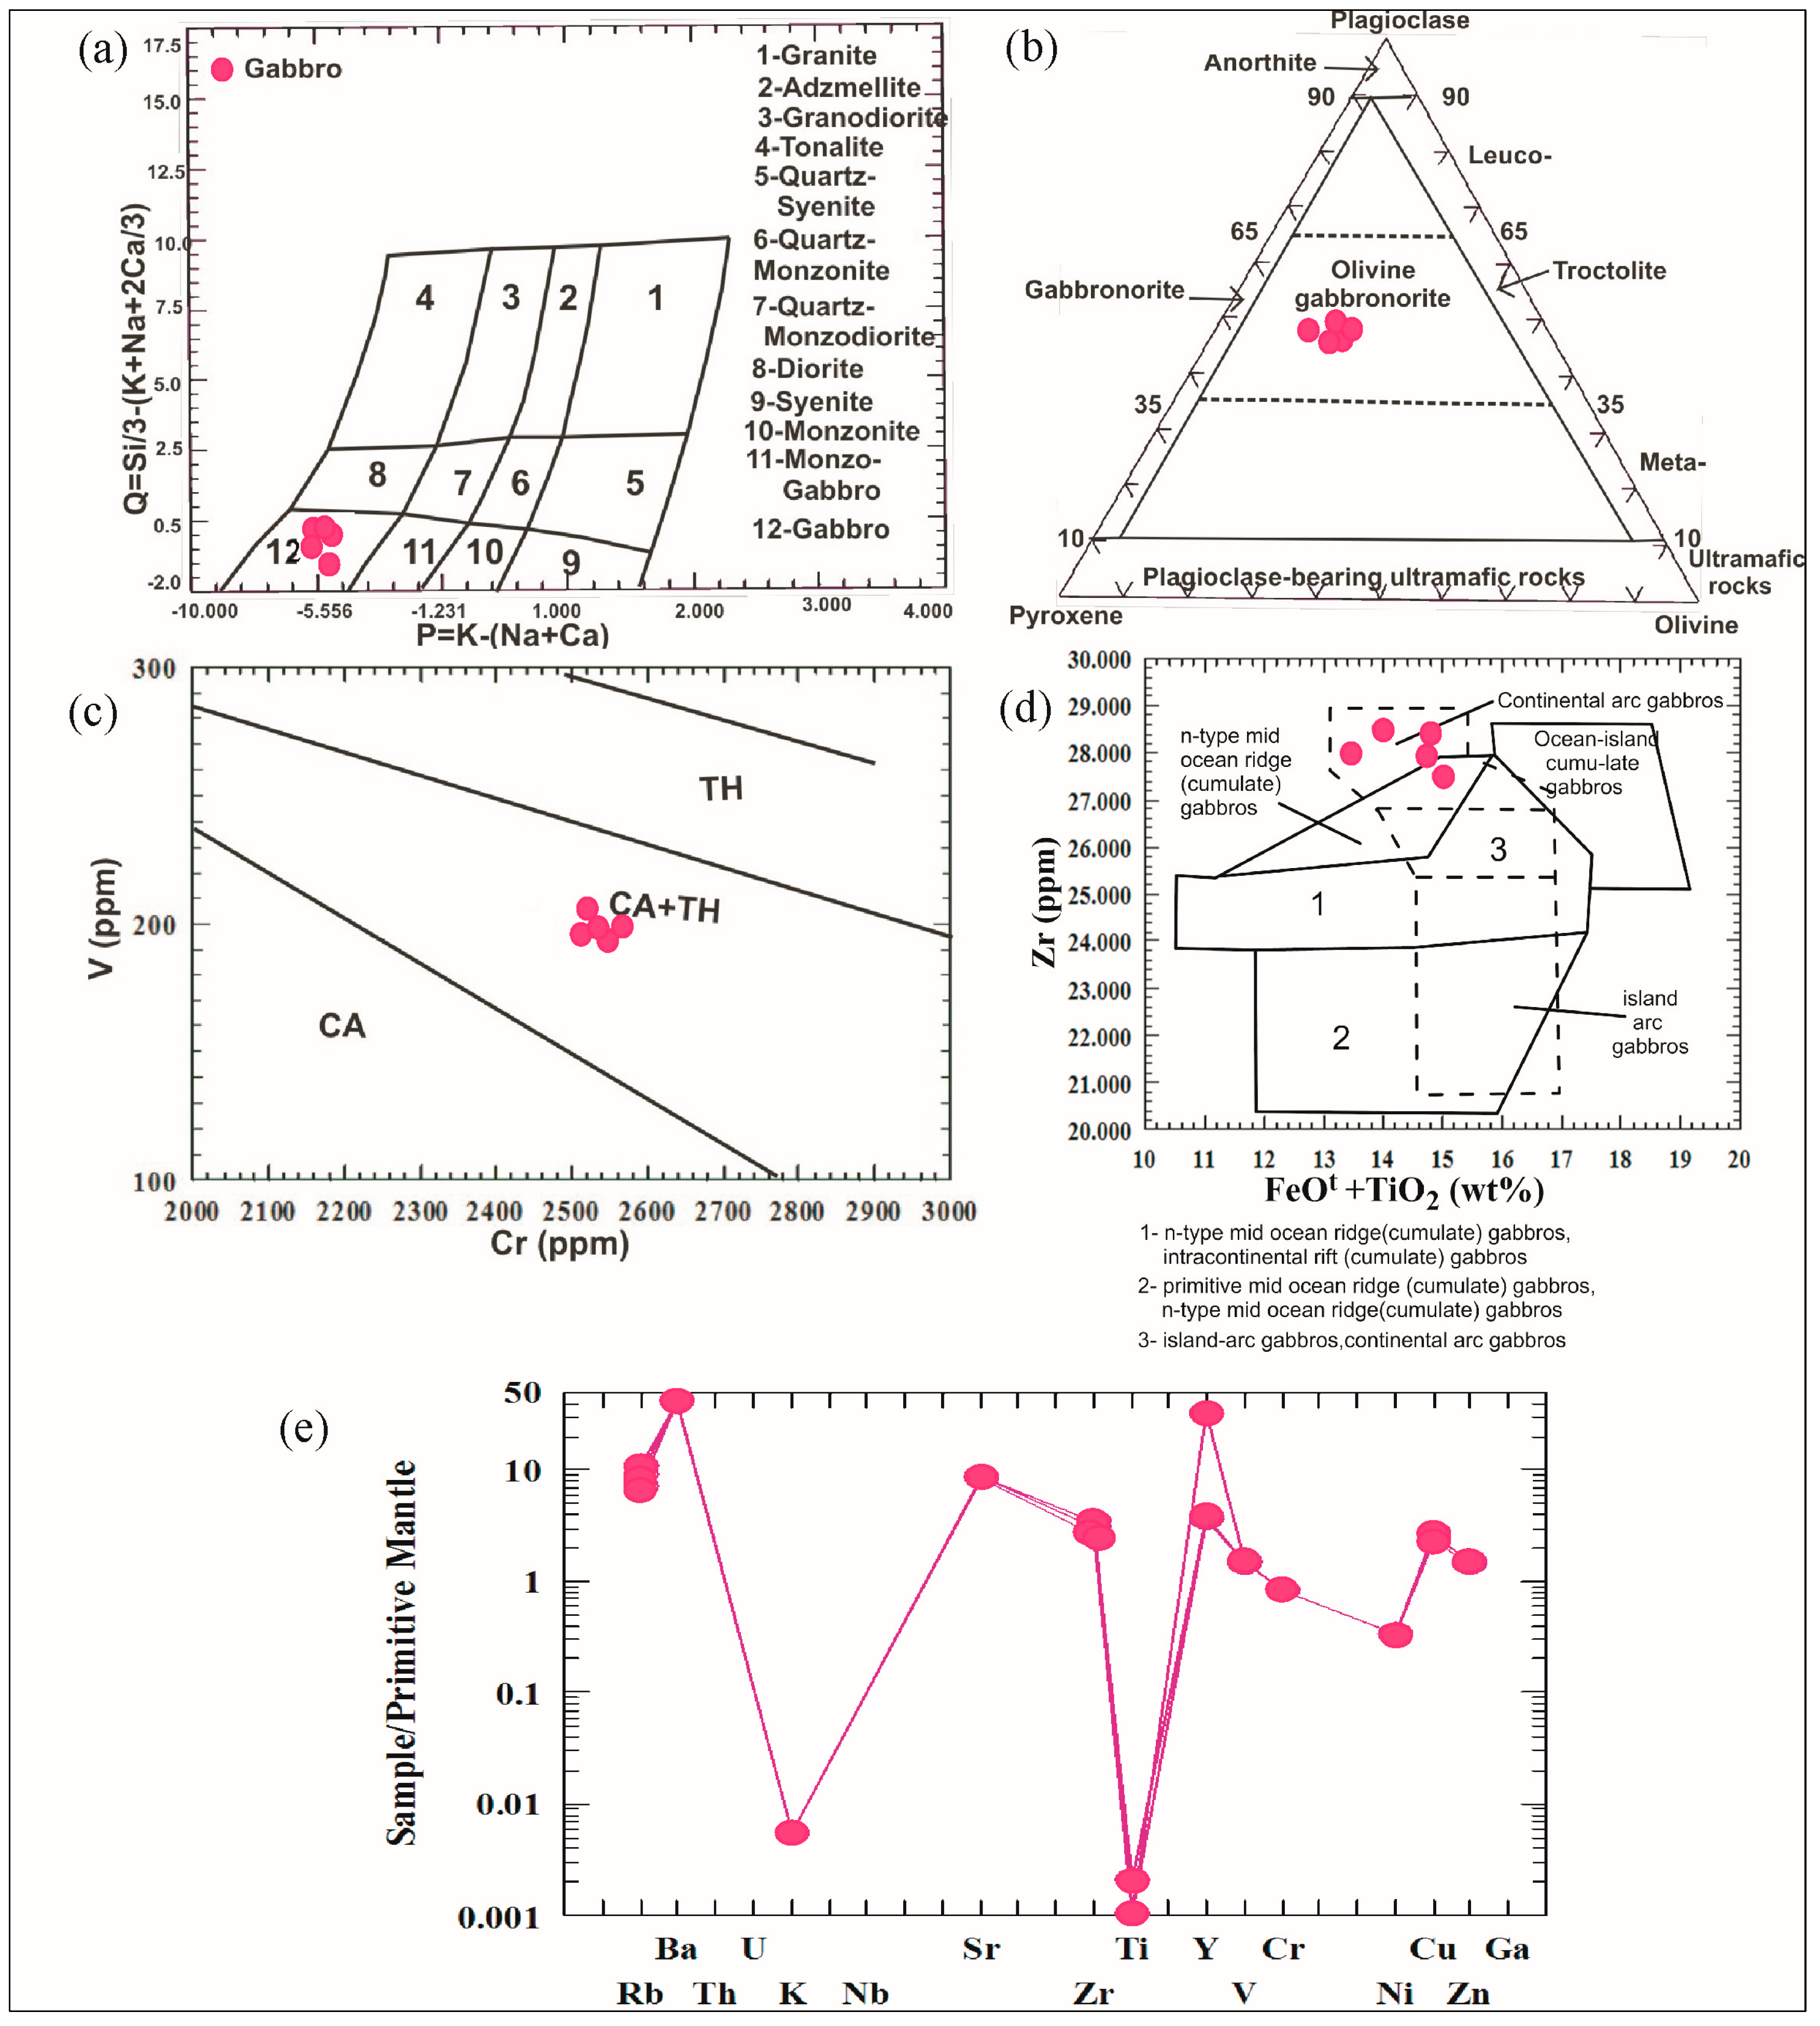
  • Geochemical analysis of the ferrogabbros indicates that they were formed in the same (genetic) environment as the olivine gabbronorite, having an alkaline to calc-alkaline magma type that developed in a continental arc setting. The trace element patterns of the basic plutonic rocks that were analyzed indicate relatively high concentrations of Cr, Ni and Ba. Furthermore, the examined ferrogabbros display a negative anomaly in Ti and K.
  • Gabbroic rocks within the study area could serve as a primary exploration target for their Fe-Ti oxide ores due to their higher magnetite content (50 to 55%).

Author Contributions

All authors were involved in the current study. Conceptualization, A.S.; Formal analysis, A.M.A.-R.; Investigation, W.F. and Á.C.; Methodology, A.M.A.-R.; Resources, H.E.-A. and Á.C.; Software, A.S.; Supervision, H.M.E.-D. and Á.C.; Validation, H.M.E.-D., H.E.-A. and M.M.E.-R.; Visualization, W.F.; Writing—original draft, A.S. and H.E.-A.; Writing—review and editing, A.M.A.-R., A.E.-S. and Á.C. All authors have read and agreed to the published version of the manuscript.

Funding

This research received no external funding.

Data Availability Statement

The datasets used and/or analyzed during the current study are available from the corresponding author upon reasonable request.

Acknowledgments

Great thanks to the University of Debrecen for providing open access funding. Thanks to ESA, JAXA, and JAROS for providing the data. Ali Shebl is funded by the Stipendium Hungaricum scholarship under the joint executive program between Hungary and Egypt. We would also like to extend our sincere appreciation to the anonymous reviewers, Guest Editor and associated Editor for their invaluable guidance and support throughout the review process.

Conflicts of Interest

The authors declare no conflict of interest.

References

  1. Abd El-Naby, H.; Frisch, W.; Hegner, E. Evolution of the Pan-African Wadi Haimur metamorphic sole, Eastern Desert, Egypt. J. Metamorph. Geol. 2000, 18, 639–651. [Google Scholar] [CrossRef]
  2. Abd El-Naby, H.H.; Frisch, W. Origin of the Wadi Haimur–Abu Swayel gneiss belt, south Eastern Desert, Egypt: Petrological and geochronological constraints. Precambrian Res. 2002, 113, 307–322. [Google Scholar] [CrossRef]
  3. Rowan, L.C.; Mars, J.C. Lithologic mapping in the Mountain Pass, California area using Advanced Spaceborne Thermal Emission and Reflection Radiometer (ASTER) data. Remote Sens. Environ. 2003, 84, 350–366. [Google Scholar] [CrossRef]
  4. Chen, X.; Warner, T.A.; Campagna, D.J. Integrating visible, near-infrared and short-wave infrared hyperspectral and multispectral thermal imagery for geological mapping at Cuprite, Nevada. Remote Sens. Environ. 2007, 110, 344–356. [Google Scholar] [CrossRef] [Green Version]
  5. Yu, L.; Porwal, A.; Holden, E.J.; Dentith, M.C. Towards automatic lithological classification from remote sensing data using support vector machines. Comput. Geosci. 2012, 45, 229–239. [Google Scholar] [CrossRef]
  6. Abd El-Wahed, M.; Kamh, S.; Ashmawy, M.; Shebl, A. Transpressive Structures in the Ghadir Shear Belt, Eastern Desert, Egypt: Evidence for Partitioning of Oblique Convergence in the Arabian-Nubian Shield during Gondwana Agglutination. Acta Geol. Sin.-Engl. Ed. 2019, 93, 1614–1646. [Google Scholar] [CrossRef]
  7. Khedr, M.Z.; Kamh, S.; Al Desouky, A.A.; Takazawa, E.; Hauzenberger, C.; Whattam, S.A.; El-Awady, A. Remote sensing and geochemical investigations of sulfide-bearing metavolcanic and gabbroic rocks (Egypt): Constraints on host-rock petrogenesis and sulfide genesis. Gondwana Res. 2023, 119, 282–312. [Google Scholar] [CrossRef]
  8. Abo Khashaba, S.M.; El-Shibiny, N.H.; Hassan, S.M.; Takazawa, E.; Khedr, M.Z. Application of remote sensing data integration in detecting mineralized granitic zones: A case study of the Gabal Al-Ijlah Al-Hamra, Central Eastern Desert, Egypt. J. Afr. Earth Sci. 2023, 200, 104855. [Google Scholar] [CrossRef]
  9. Shebl, A.; Csámer, Á. Stacked vector multi-source lithologic classification utilizing Machine Learning Algorithms: Data potentiality and dimensionality monitoring. Remote Sens. Appl. Soc. Environ. 2021, 24, 100643. [Google Scholar] [CrossRef]
  10. Khedr, M.Z.; Abo Khashaba, S.M.; El-Shibiny, N.H.; El-Arafy, R.A.; Takazawa, E.; Azer, M.K.; Palin, R.M. Remote sensing techniques and geochemical constraints on the formation of the Wadi El-Hima mineralized granites, Egypt: New insights into the genesis and accumulation of garnets. Int. J. Earth Sci. 2022, 111, 2409–2443. [Google Scholar] [CrossRef]
  11. Badawi, M.; Abdelatif, M.; Shebl, A.; Makroum, F.; Shalaby, A.; Nemeth, N. Mapping Structurally Controlled Alterations Sparked by Hydrothermal Activity in the Fatira-Abu Zawal Area, Eastern Desert, Egypt. Acta Geol. Sin.-Engl. Ed. 2022, 97, 662–680. [Google Scholar] [CrossRef]
  12. Abdelkader, M.A.; Watanabe, Y.; Shebl, A.; El-Dokouny, H.A.; Dawoud, M.; Csámer, Á. Effective delineation of rare metal-bearing granites from remote sensing data using machine learning methods: A case study from the Umm Naggat Area, Central Eastern Desert, Egypt. Ore Geol. Rev. 2022, 150, 105184. [Google Scholar] [CrossRef]
  13. Sabins, F.F. Remote sensing for mineral exploration. Ore Geol. Rev. 1999, 14, 157–183. [Google Scholar] [CrossRef]
  14. Shebl, A.; Abdellatif, M.; Hissen, M.; Ibrahim Abdelaziz, M.; Csámer, Á. Lithological mapping enhancement by integrating Sentinel 2 and gamma-ray data utilizing support vector machine: A case study from Egypt. Int. J. Appl. Earth Obs. Geoinf. 2021, 105, 102619. [Google Scholar] [CrossRef]
  15. Harris, J.R.; Grunsky, E.C. Predictive lithological mapping of Canada’s North using Random Forest classification applied to geophysical and geochemical data. Comput. Geosci. 2015, 80, 9–25. [Google Scholar] [CrossRef]
  16. Harris, J.R.; Ford, K.L.; Charbonneau, B.W. Application of gamma-ray spectrometer data for lithological mapping in a cordilleran environment, Sekwi Region, NWT. Can. J. Remote Sens. 2014, 35, S12–S30. [Google Scholar] [CrossRef]
  17. Cardoso-Fernandes, J.; Teodoro, A.C.; Lima, A.; Roda-Robles, E. Semi-Automatization of Support Vector Machines to Map Lithium (Li) Bearing Pegmatites. Remote Sens. 2020, 12, 2319. [Google Scholar] [CrossRef]
  18. Shebl, A.; Abdellatif, M.; Elkhateeb, S.O.; Csámer, Á. Multisource Data Analysis for Gold Potentiality Mapping of Atalla Area and Its Environs, Central Eastern Desert, Egypt. Minerals 2021, 11, 641. [Google Scholar] [CrossRef]
  19. Bentahar, I.; Raji, M. Comparison of Landsat OLI, ASTER, and Sentinel 2A data in lithological mapping: A Case study of Rich area (Central High Atlas, Morocco). Adv. Sp. Res. 2021, 67, 945–963. [Google Scholar] [CrossRef]
  20. Van der Meer, F.D.; van der Werff, H.M.A.; van Ruitenbeek, F.J.A. Potential of ESA’s Sentinel-2 for geological applications. Remote Sens. Environ. 2014, 148, 124–133. [Google Scholar] [CrossRef]
  21. Kuhn, S.; Cracknell, M.J.; Reading, A.M. Lithologic mapping using Random Forests applied to geophysical and remote-sensing data: A demonstration study from the Eastern Goldfields of Australia. Geophysics 2018, 83, B183–B193. [Google Scholar] [CrossRef]
  22. Foody, G.M.; Mathur, A. A relative evaluation of multiclass image classification by support vector machines. IEEE Trans. Geosci. Remote Sens. 2004, 42, 1335–1343. [Google Scholar] [CrossRef] [Green Version]
  23. Ham, J.S.; Chen, Y.; Crawford, M.M.; Ghosh, J. Investigation of the random forest framework for classification of hyperspectral data. IEEE Trans. Geosci. Remote Sens. 2005, 43, 492–501. [Google Scholar] [CrossRef] [Green Version]
  24. Waske, B.; Benediktsson, J.A.; Arnason, K.; Sveinsson, J.R. Mapping of hyperspectral AVIRIS data using machine-learning algorithms. Can. J. Remote Sens. 2009, 35, S106–S116. [Google Scholar] [CrossRef]
  25. Leite, E.P.; de Souza, C.; Leite, E.P.; de Souza, C. A Matlab Program for Textural Classification Using Neural Networks. AGUFM 2008, 2008, IN31C-1146. [Google Scholar] [CrossRef]
  26. Zhang, Y.; Wang, G.; Li, M.; Han, S. Automated Classification Analysis of Geological Structures Based on Images Data and Deep Learning Model. Appl. Sci. 2018, 8, 2493. [Google Scholar] [CrossRef] [Green Version]
  27. Jackisch, R.; Lorenz, S.; Kirsch, M.; Zimmermann, R.; Tusa, L.; Pirttijärvi, M.; Saartenoja, A.; Ugalde, H.; Madriz, Y.; Savolainen, M.; et al. Integrated Geological and Geophysical Mapping of a Carbonatite-Hosting Outcrop in Siilinjärvi, Finland, Using Unmanned Aerial Systems. Remote Sens. 2020, 12, 2998. [Google Scholar] [CrossRef]
  28. Cracknell, M.J.; Reading, A.M. Geological mapping using remote sensing data: A comparison of five machine learning algorithms, their response to variations in the spatial distribution of training data and the use of explicit spatial information. Comput. Geosci. 2014, 63, 22–33. [Google Scholar] [CrossRef] [Green Version]
  29. Kumar, C.; Chatterjee, S.; Oommen, T.; Guha, A. Automated lithological mapping by integrating spectral enhancement techniques and machine learning algorithms using AVIRIS-NG hyperspectral data in Gold-bearing granite-greenstone rocks in Hutti, India. Int. J. Appl. Earth Obs. Geoinf. 2020, 86, 102006. [Google Scholar] [CrossRef]
  30. Cracknell, M.J.; Reading, A.M. The upside of uncertainty: Identification of lithology contact zones from airborne geophysics and satellite data using random forests and support vector machnes. Geophysics 2013, 78, WB113–WB126. [Google Scholar] [CrossRef]
  31. Horrocks, T.; Holden, E.J.; Wedge, D. Evaluation of automated lithology classification architectures using highly-sampled wireline logs for coal exploration. Comput. Geosci. 2015, 83, 209–218. [Google Scholar] [CrossRef]
  32. Othman, A.A.; Gloaguen, R. Integration of spectral, spatial and morphometric data into lithological mapping: A comparison of different Machine Learning Algorithms in the Kurdistan Region, NE Iraq. J. Asian Earth Sci. 2017, 146, 90–102. [Google Scholar] [CrossRef]
  33. Pal, M.; Mather, P.M. Support vector machines for classification in remote sensing. Int. J. Remote Sens. 2005, 26, 1007–1011. [Google Scholar] [CrossRef]
  34. Ge, W.; Cheng, Q.; Jing, L.; Armenakis, C.; Ding, H. Lithological discrimination using ASTER and Sentinel-2A in the Shibanjing ophiolite complex of Beishan orogenic in Inner Mongolia, China. Adv. Sp. Res. 2018, 62, 1702–1716. [Google Scholar] [CrossRef]
  35. Wang, F.; Zhen, Z.; Wang, B.; Mi, Z. Comparative Study on KNN and SVM Based Weather Classification Models for Day Ahead Short Term Solar PV Power Forecasting. Appl. Sci. 2017, 8, 28. [Google Scholar] [CrossRef] [Green Version]
  36. Manap, H.S.; San, B.T. Lithological mapping using different classification algorithms in western antalya, turkey. Int. Multidiscip. Sci. GeoConference Surv. Geol. Min. Ecol. Manag. SGEM 2018, 18, 551–556. [Google Scholar] [CrossRef]
  37. Shebl, A.; Hamdy, M. Multiscale (microscopic to remote sensing) preliminary exploration of auriferous-uraniferous marbles: A case study from the Egyptian Nubian Shield. Sci. Rep. 2023, 13, 9173. [Google Scholar] [CrossRef] [PubMed]
  38. Liesenberg, V.; Gloaguen, R. Evaluating SAR polarization modes at L-band for forest classification purposes in eastern Amazon, Brazil. Int. J. Appl. Earth Obs. Geoinf. 2012, 21, 122–135. [Google Scholar] [CrossRef]
  39. Khedr, M.Z.; Al Desouky, A.A.; Kamh, S.; Hauzenberger, C.; Arai, S.; Tamura, A.; Whattam, S.A.; Morishita, T.; Lasheen, E.S.R.; El-Awady, A. Petrogenesis of Gerf Neoproterozoic carbonatized peridotites (Egypt): Evidence of convergent margin metasomatism of depleted sub-arc mantle. Lithos 2023, 450–451, 107192. [Google Scholar] [CrossRef]
  40. Khedr, M.Z.; El-Awady, A.; Arai, S.; Hauzenberger, C.; Tamura, A.; Stern, R.J.; Morishita, T. Petrogenesis of the ~740 Korab Kansi mafic-ultramafic intrusion, South Eastern Desert of Egypt: Evidence of Ti-rich ferropicritic magmatism. Gondwana Res. 2020, 82, 48–72. [Google Scholar] [CrossRef]
  41. Kharbish, S.; Eldosouky, A.M.; Amer, O. Integrating mineralogy, geochemistry and aeromagnetic data for detecting Fe–Ti ore deposits bearing layered mafic intrusion, Akab El-Negum, Eastern Desert, Egypt. Sci. Rep. 2022, 12, 15474. [Google Scholar] [CrossRef]
  42. EGSMA Geological Survey of Egypt. Geological Map of Egypt, Scale 1:250,000, NG 36 D Sheet; EGSMA Geological Survey of Egypt: Cairo, Egypt, 1997. [Google Scholar]
  43. Arivazhagan, S.; Naseer, K.A.; Mahmoud, K.A.; Arun Kumar, K.V.; Libeesh, N.K.; Sayyed, M.I.; Alqahtani, M.S.; Yousef, E.S.; Khandaker, M.U. Gamma-ray protection capacity evaluation and satellite data based mapping for the limestone, charnockite, and gneiss rocks in the Sirugudi taluk of the Dindigul district, India. Radiat. Phys. Chem. 2022, 196, 110108. [Google Scholar] [CrossRef]
  44. Libeesh, N.K.; Naseer, K.A.; Arivazhagan, S.; Mahmoud, K.A.; Sayyed, M.I.; Alqahtani, M.S.; Yousef, E.S. Multispectral remote sensing for determination the Ultra-mafic complexes distribution and their applications in reducing the equivalent dose from the radioactive wastes. Eur. Phys. J. Plus 2022, 137, 267. [Google Scholar] [CrossRef]
  45. Shebl, A.; Csámer, Á. Lithological, structural and hydrothermal alteration mapping utilizing remote sensing datasets: A case study around Um Salim area, Egypt. IOP Conf. Ser. Earth Environ. Sci. 2021, 942, 012032. [Google Scholar] [CrossRef]
  46. Elith, J.; Leathwick, J.R.; Hastie, T. A working guide to boosted regression trees. J. Anim. Ecol. 2008, 77, 802–813. [Google Scholar] [CrossRef] [PubMed]
  47. Amer, R.; Kusky, T.; Ghulam, A. Lithological mapping in the Central Eastern Desert of Egypt using ASTER data. J. Afr. Earth Sci. 2010, 56, 75–82. [Google Scholar] [CrossRef]
  48. Richards, J.A. Remote Sensing with Imaging Radar; Springer: Berlin/Heidelberg, Germany, 2009. [Google Scholar]
  49. Libeesh, N.K.; Naseer, K.A.; Arivazhagan, S.; El-Rehim, A.F.A.; ALMisned, G.; Tekin, H.O. Characterization of Ultramafic–Alkaline–Carbonatite complex for radiation shielding competencies: An experimental and Monte Carlo study with lithological mapping. Ore Geol. Rev. 2022, 142, 104735. [Google Scholar] [CrossRef]
  50. Green, A.A.; Berman, M.; Switzer, P.; Craig, M.D. A Transformation for Ordering Multispectral Data in Terms of Image Quality with Implications for Noise Removal. IEEE Trans. Geosci. Remote Sens. 1988, 26, 65–74. [Google Scholar] [CrossRef] [Green Version]
  51. Libeesh, N.K.; Naseer, K.A.; Mahmoud, K.A.; Sayyed, M.I.; Arivazhagan, S.; Alqahtani, M.S.; Yousef, E.S.; Khandaker, M.U. Applicability of the multispectral remote sensing on determining the natural rock complexes distribution and their evaluability on the radiation protection applications. Radiat. Phys. Chem. 2022, 193, 110004. [Google Scholar] [CrossRef]
  52. Luo, G.; Chen, G.; Tian, L.; Qin, K.; Qian, S.E. Minimum Noise Fraction versus Principal Component Analysis as a Preprocessing Step for Hyperspectral Imagery Denoising. Can. J. Remote Sens. 2016, 42, 106–116. [Google Scholar] [CrossRef]
  53. Richards, J.A.; Jia, X. Remote Sensing Digital Image Analysis; Springer: Berlin/Heidelberg, Germany, 1999; ISBN 9783540251286. [Google Scholar]
  54. Cortes, C.; Vapnik, V. Support-vector networks. Mach. Learn. 1995, 20, 273–297. [Google Scholar] [CrossRef]
  55. Othman, A.; Gloaguen, R. Improving Lithological Mapping by SVM Classification of Spectral and Morphological Features: The Discovery of a New Chromite Body in the Mawat Ophiolite Complex (Kurdistan, NE Iraq). Remote Sens. 2014, 6, 6867–6896. [Google Scholar] [CrossRef] [Green Version]
  56. Scholkopf, B.; Smola, A. Learning with Kernels: Support Vector Machines, Regularization, Optimization, and Beyond; The MIT Press: Cambridge, MA, USA, 2018. [Google Scholar]
  57. Chang, C.-C.; Lin, C.-J. LIBSVM: A library for support vector machines. ACM Trans. Intell. Syst. Technol. 2011, 2, 1–27. [Google Scholar] [CrossRef]
  58. Boser, B.E.; Guyon, I.M.; Vapnik, V.N. Training algorithm for optimal margin classifiers. In Proceedings of the Fifth Annual Workshop on Computational Learning Theory, Pittsburgh, PA, USA, 27–29 July 1992; pp. 144–152. [Google Scholar] [CrossRef] [Green Version]
  59. Shapiro, L.; Brannock, W.W. Rapid Analysis of Silicate, Carbonate and Phosphate Rocks; US Government Printing Office: Washington, DC, USA, 1962. [Google Scholar]
  60. El-RamlyM, F.; Akaad, M.K. The Basement Complex in the Central-Eastern Desert of Egypt, Between Latitudes 24 30′ and 25 40′ N; Geological Survey of Egypt: Cairo, Egypt, 1960. [Google Scholar]
  61. Sabet, A.H.; El-Gaby, S.; Zalata, A.A. Geology of the basement rocks in the northern parts of El-Shayib and Safaga sheets, Eastern Desert. Ann. Geol. Surv. Egypt 1972, 2, 111–128. [Google Scholar]
  62. Habib, M.E. Landsat investigation of mineralized granites in the area between Gabals El-Urf and El-Erediya due best of Safaga. In Proceedings of the Egypt 8th International Data, LARS/Purdue University, West Lafayette, IN, USA, 5 August 1982; pp. 441–446. [Google Scholar]
  63. Abdel-Rahman, A.F.M. Petrogenesis of Early-Orogenic Diorites, Tonalites and Post-Orogenic Trondhjemites in the Nubian Shield. J. Petrol. 1990, 31, 1285–1312. [Google Scholar] [CrossRef]
  64. Khalil, A.E.; El-Desoky, H.M.; Salem, A.A. Geochemistry and petrogenesis of the Neoproterozoic island arc gabbro-diorite-tonalite complexes at Wadi Abu El-Lijam and Wadi Selilab area, Central Eastern Desert, Egypt. Egypt J. Geol. 2017, 61, 1–11. [Google Scholar]
  65. El Shazly, E.M. The geology of the Egyptian region. In The Ocean Basins and Margins; Springer: Boston, MA, USA, 1977; Volume 4. [Google Scholar]
  66. El-Desoky, H.M.; Shebl, A.; Abdel-Rahman, A.M.; Fahmy, W.; El-Awny, H.; El-Sherif, A.M.; El-Rahmany, M.M.; Csámer, Á. Multiscale mineralogical investigations for mineral potentiality mapping of Ras El-Kharit-Wadi Khashir district, Southern Eastern Desert, Egypt. Egypt. J. Remote Sens. Sp. Sci. 2022, 25, 941–960. [Google Scholar] [CrossRef]
  67. Debon, F.; Le Fort, P. A chemical–mineralogical classification of common plutonic rocks and associations. Earth Environ. Sci. Trans. R. Soc. 1983, 73, 135–149. [Google Scholar] [CrossRef]
  68. Streckheisen, A.L. Classification and nomenclature of plutonic rocks. Geol. Rundsch 1974, 63, 773–786. [Google Scholar] [CrossRef]
  69. Miyashiro, A.; Shido, F. Tholeiitic and calc-alkalic series in relation to the behaviors of titanium, vanadium, chromium, and nickel. Am. J. Sci. 1975, 275, 265–277. [Google Scholar] [CrossRef]
  70. Biermanns, L. Chemical classification of gabbroic-dioritic rocks, based on TiO2, SiO2, FeOtot, MgO, K2O, Y and Zr. In Proceedings of the III International Symposium on Andean Geodynamics, Saint-Malo, France, 17–19 September 1996; pp. 547–550. [Google Scholar]
  71. McDonough, W.F.; Sun, S.S. The composition of the Earth. Chem. Geol. 1995, 120, 223–253. [Google Scholar] [CrossRef]
  72. Hamdy, M.M.; Abd El-Wahed, M.A.; Thabet, I.A. Origin of dyke swarms in Wadi El Redi-Wadi Lahami area, southern Eastern Desert of Egypt. Arab. J. Geosci. 2017, 10, 1–15. [Google Scholar] [CrossRef]
  73. Ahmed, A.E.A. Fusulinid marble from Wadi Heimur area, Southeastern Desert, Egypt. J. Afr. Earth Sci. 1991, 13, 397–399. [Google Scholar] [CrossRef]
  74. Conoco, C. Geological Map of Egypt, Scale 1:500,000-NG 36 SE Gebel Hamata, Egypt; Egyptian General Petroleum Corporation: Cairo, Egypt, 1987. [Google Scholar]
  75. Rankama, K.; Sahama, T.G. Geochemistry; University of Chicago Press: Chicago, IL, USA, 1964. [Google Scholar]
  76. Cox, P.A. Elements on Earth; Oxford University Press: Oxford, UK, 1995; 287p. [Google Scholar]
  77. Khedr, M.Z.; Takazawa, E.; Arai, S.; Stern, R.J.; Morishita, T.; El-Awady, A. Styles of Fe–Ti–V ore deposits in the Neoproterozoic layered mafic-ultramafic intrusions, south Eastern Desert of Egypt: Evidence for fractional crystallization of V-rich melts. J. Afr. Earth Sci. 2022, 194, 104620. [Google Scholar] [CrossRef]
Figure 1. (a) Geological map of the Egyptian Nubian Shield Compiled after the Geological Map of Egypt (El-Ramly 1972) and the CONOCO geological maps (Klitzch et al., 1987). (b) Detailed geologic map of Wadi Khashir and Gabal Ras El-Kharit district (Modified after EGSMA, 1997, and El-Desoky et al., 2022).
Minerals 13 00826 g001
Figure 2. PALSAR DEM of the study area shows reasonable differentiation of some rocks relying only on their topography. For instance, younger felsic volcanics (YFV) are mainly depicted in purple color, metagabbro–diorite complex (MGD) and fresh ferrogabbros (FGb) in blue to yellow colors, alkali feldspar granite (AFG) in the central part of the map showing yellow with a reddish hue color, metavolcanics (Mvs) in rough shape with an orange color, phanerozoic rocks representing Samaday formation (SMD), Samih formation (SMH), and gravel terraces (Grv) in red color with greyish tint in the eastern part of area.
Minerals 13 00826 g002
Figure 3. Flow chart showing the adopted methodology of the current study.
Minerals 13 00826 g003
Figure 4. Comprehensive lithological differentiation via Sentinel 2 (a) FCC 12/6/2; (b) PC1, PC3, and PC2; (c) MNF 2/3/4, respectively, in RGB. Ferrogabbros (FGb), metagabbro–diorite complex (MGD).
Minerals 13 00826 g004
Figure 5. SVM thematic results utilizing (a) Sentinel 2, and (b) combined PALSAR Sentinel 2 datasets. Metavolcanics (MVs), arc-related metasediments (AMS), metagabbro–diorite complex (MGD), tonalities (Ton), fresh ferrogabbros (FGb), younger felsic volcanics (YFV), hornblende–biotite monzogranites (Mon), alkali feldspar granite (AFG), Samaday formation (SMD), Samih formation (SMH), gravel terraces (Grv) and Wadi deposits (WDs).
Minerals 13 00826 g005
Figure 6. A close-up view around Wadi El Ridi utilizing (a) the Sentinel 2 thematic map, manifesting how efficient the (b) fused Sentinel 2–PALSAR DEM is in the accurate delineation (diminishing salt and pepper effect) of the wadis and surrounding rock units’ coherency. Metavolcanics (MVs), arc-related metasediments (AMS), metagabbro–diorite complex (MGD), tonalities (Ton), fresh ferrogabbros (FGb), younger felsic volcanics (YFV), hornblende–biotite monzogranites (Mon), alkali feldspar granite (AFG), Samaday formation (SMD), Samih formation (SMH), gravel terraces (Grv) and Wadi deposits (WDs).
Minerals 13 00826 g006
Figure 7. Errors of commission utilizing (a) Sentinel 2 and (b) the combined PALSAR Sentinel 2 datasets.
Minerals 13 00826 g007
Figure 8. Field photographs showing: (a) Metagabbro rocks intruded by quartz veins at Wadi Khashir (Looking 160° SE). (b) Fresh olivine–pyroxene ferrogabbros exhibiting the spheroidal shape of physical weathering at West Wadi Khashir (Looking 230° SW). (c) Hand specimen of ferrogabbros. (d) Stream sediments of Ferrogabbros. (e) An overview of several alteration zones within the younger felsic volcanics at Gabal Ras El-Kharit (Looking 180° S). (f) Samaday formation showing reddish-brown sandstones at the entrance of Wadi Khashir (Looking 340° NW).
Minerals 13 00826 g008
Figure 9. Field photographs showing: (a) General view of the metavolcanics represented mainly by meta-andesites and metabasalts. (b) Offshoots of granitic dykes cutting the Wadi Khashir quartz-pyroxene schists (Looking 90° E). (c) Quartzites extruded by younger felsic volcanics (rhyolites, looking 350° N).
Minerals 13 00826 g009
Figure 10. Field photographs: (a) Metavolcanics extruded by younger felsic volcanics (rhyolites) and intruded by alkali feldspar granites at Wadi Khashir (Looking 90° E). (b) Highly fractured tonalites intruded by basic dyke at Wadi Khashir (Looking 80° NE). (c) Wadi Khashir alkali feldspar granites intruded by doleritic dykes (Looking 225° SW). (d) Biotite-quartz plugs invading the metavolcanics at Wadi Khashir (Looking 220° SW).
Minerals 13 00826 g010
Figure 11. Photomicrographs showing (a) well-developed crystals of epidote (Ep) in metabasalt. (b) Porphyritic texture in metandesite. (c) Opaque minerals (Oq) set in plagioclase crystals in metandesite. (d) The subidiomorphic to xenomorphic of pyroxene (Pyx) crystals in quartz-pyroxene schists. (e) Augen-shape of quartz (Qtz) parallel to the foliation in pebbly-quartz-biotite schists. (f) Quartz crystals enclosed within muscovite (Ms) flakes in quartzites. (g) Lamellar twinning of plagioclase (Pl) associated with quartz (Qtz) and titanoaugite crystal in metagabbros. (h) Hornblende (Hbl) crystals enclosed in the pyroxene (Pyx) in metagabbros. (i) Coarse grains of hornblende (Hbl) in quartz diorites.
Minerals 13 00826 g011
Figure 12. Photomicrographs showing (a) the hypidiomorphic texture and baveno twinning of hornblende (Hbl) crystals in tonalites. (b) High relief of olivine (Ol) with berlin blue interference color of zoisite (Zo) in olivine–pyroxene ferrogabbros. (c) Euhedral crystals of olivine (Ol) with brown hornblende (Hbl) and opaque minerals in olivine–pyroxene ferrogabbros. (d) Porphyritic texture and orthoclase simple twining (Or) in rhyolites. (e) Wide spread of opaque minerals (Oq) associated with quartz (Qtz) and calcite (Cal) in rhyolites. (f) Highly altered plagioclase (Pl) to saussurite (Sau) in hornblende–biotite monzogranites. (g) High relief hornblende (Hbl) associated opaque (Oq) minerals in hornblende–biotite monzogranites. (h) Carlsbad twinning of plagioclase and highly altered to saussurite in alkali feldspar granites. (i) Brown biotite (Bt) altered to chlorite (Chl) in alkali feldspar granites. (j) Anhedral texture in basaltic dykes. (k) Immature carbonates and undulose extinction of quartz (Qtz) in doleritic dykes. (l) Red to reddish-brown of hematite dust (Hem) in Samaday formation.
Minerals 13 00826 g012
Figure 13. Thematic maps of ferrogabbros utilizing (a) Sentinel 2, and (b) combined PALSAR Sentinel 2 datasets. Note also how well the Wadi deposits are allocated in (b) compared to (a).
Minerals 13 00826 g013
Figure 14. Photomicrograph of ferrogabbros showing: (a) Grey magnetite (Mag) crystals (R.L). (b) Large, elongated magnetite (Mag) crystals (R.L). (c) Euhedral magnetite (Mag) crystals (R.L). (d) Subhedral to euhedral titanomagnetite (Titan-Mag) crystals. (R.L).
Minerals 13 00826 g014
Figure 15. (a) X-ray diffractograms of the heavy fractions display magnetite, hematite and quartz in fresh olivine–pyroxene ferrogabbros. (b) BSE image and EDX spot analysis of titanomagnetite grains (Ti-Mg) in the studied fresh olivine–pyroxene ferrogabbros.
Minerals 13 00826 g015
Figure 16. (a) Q-P multicationic variation diagram of Debon 1983; [65]. (b) Modal classification diagram of the studied ferrogabbros, Streckheisen 1974 [66]. (c) Plots of the Cr-V diagram for the studied ferrogabbros (Miyashiro and Shido, 1975; [67]). (d) FeO* + TiO2 versus Zr diagram (Biermanns, 1996; [68]) showing the tectonic setting of the studied ferrogabbros. (e) Spider diagram of the studied ferrogabbros (Primitive mantle-trace elements normalized after (McDonough and Sun, 1995) [69]).
Minerals 13 00826 g016
Table 1. Characteristics of Sentinel 2 data.
Band Central Wavelength (µm)Pixel Size (m)
10.44360
20.49010
30.56010
40.66510
50.70420
60.74020
70.78220
80.84210
8a0.86520
90.94560
101.37560
111.61020
122.19020
Table 2. Training and testing data characteristics of the lithological classes.
Training DataTesting Data
ClassPixels%Pixels%
AFG298973.56107426.43
MVs293172.24112627.75
Mon297471.67117528.32
MGD302973.69108126.30
YFV302773.63108426.36
FGb57175.2318824.76
Ton329673.35119726.64
AMS58678.5516021.44
Wadi321271.28129428.71
SMD36371.1714728.82
SMH23872.349127.65
Grv41671.8416328.15
Water56173.1420626.85
Table 3. Confusion matrix, Overall Accuracy (OA), User Accuracy (UA), Producer Accuracy (PA) and the Kappa coefficient (K) of the SVM classification results with S2 and S2 + PALSAR DEM.
S2AFGMVsMonMGDYFVFGbTonAMSWDsSMDSMHGrvWaterTotPAUA
AFG862000002001300000101280.2685.18
MVs010890201061210000117496.7192.76
Mon007731120600000079271.9197.6
MGD00519221570000000103185.2989.43
YFV0023897107103100000141098.875.96
FGb038590126000000019667.0264.29
Ton1130300011205560000129793.5786.35
AMS03400000810000011550.6370.43
WDs990000048128396000100464.8483.57
SMD0020040024814100039595.9235.7
SMH000000000016300163100100
Grv0000000000091091100100
Water000000000000206206100100
Tot1074112610751081108418811971601294147163912068886OA = 84.2K = 0.82
S2 + DEMAFGMVsMonMGDYFVFGbTonAMSWDsSMDSMHGrvWaterTotPAUA
AFG9810000050840000107091.3491.68
MVs01122000402200000114899.6497.74
Mon001022713602000000116795.0787.57
MGD004287270000000092180.6794.68
YFV00074941017000000103286.8191.18
FGb0341270184000000031897.8757.86
Ton93070001154131560000142396.4181.1
AMS0101000120100001237597.56
WDs000000195805000082962.2197.1
SMD0000000024614700039310037.4
SMH000000002091009310097.85
Grv000000000001630163100100
Water000000000000206206100100
Tot1074112610751081108418811971601294147911632068886OA = 87.8K = 0.86
Table 4. Major oxides (wt. %), trace elements (ppm) and some elemental ratios of the studied olivine–pyroxene ferrogabbros.
Rock UnitsOlivine–Pyroxene Ferrogabbros
Sample No.K46K48K49K50K51Average
SiO251.5049.6549.9049.8549.8050.14
TiO22.751.851.801.702.61.99
Al2O318.5016.1516.5016.3016.2216.73
Fe2O31.751.491.551.451.231.49
FeO15.7413.4513.9413.7413.8914.15
Fe2O3*17.5014.9515.5015.1915.1215.6
MgO2.105.004.004.125.134.07
CaO4.009.507.008.128.157.35
Na2O0.881.151.021.121.081.05
K2O0.670.820.660.630.680.69
P2O50.650.350.200.340.220.35
LOI0.552.751.602.051.751.74
Total99.10102.298.1899.4299.98-
Na2O/K2O1.311.41.551.81.61.5
Trace Elements (ppm)
Cr244324502435245524702451
Cu716575706870
Ni669661677675660668
Zn767172707773
Zr252822292325
Ga------
Sr153158151155157155
Y1311112142234
Rb465755
V191197187198180191
Nb------
Pb------
Ba211208214210212211
Rb/Sr0.030.0380.030.050.030.04
Zn/(Pb + Zn)111111
Disclaimer/Publisher’s Note: The statements, opinions and data contained in all publications are solely those of the individual author(s) and contributor(s) and not of MDPI and/or the editor(s). MDPI and/or the editor(s) disclaim responsibility for any injury to people or property resulting from any ideas, methods, instructions or products referred to in the content.

