Abstract
The Tuotuohe region is a highly prospective area for Pb and Zn mineral exploration. This paper contributes to our comprehension of the ore-controlling structures, fluid inclusions, and C–H–O–S–Pb isotope geochemistry of Pb–Zn deposits in this region. These deposits are generally hosted by carbonates and controlled by fractures. The principal homogenization temperatures of quart- and calcite-hosted inclusions ranged predominantly between 120 and 220 °C, with salinities varying from 6 to 16 wt.% NaCl equivalent. The Pb isotope compositions of the ore deposits are comparable to those of Cenozoic volcanic rocks in the region but differ significantly from those of the host rocks, indicating that the Pb within these deposits was derived from the mantle. The C, O, and S isotope compositions of samples exhibit a bimodal distribution based on whether they were derived from magma or host rocks, implying that magma-derived fluids underwent an isotopic exchange with the host rocks. The H-O isotope compositions of samples also indicate that ore-forming fluids were originally magmatic but were depleted by combining with meteoric water. These findings are also supported by variations in fluid inclusion homogenization temperatures and salinities. Taken together, these findings suggest that the Pb–Zn deposits of the Tuotuohe region developed from magma to hydrothermal fluids at medium–low temperatures.
1. Introduction
The nearly north–south-trending Nujiang, Lancangjiang, and Jinshajiang drainage area of western Yunnan, eastern Tibet, western Sichuan, and southeast Qinghai in the southwest of China is collectively termed the Sanjiang or Southwest Sanjiang area. This area represents a complex tectonomagmatic belt that contains a significant amount of polymetallic mineralization and is the most prospective area for mineral exploration and development in western China [1,2,3]. This metallogenic belt hosts more than 100 large- to small-sized Pb–Zn–Ag deposits (e.g., the Jinding, Huize, and Nanping deposits in Yunnan) and more than 400 Pb–Zn–(Ag) prospects [4,5,6].
The Southwest Sanjiang structural zone extends to the northwest to an area termed North Sanjiang, which includes the Tuotuohe region that is the focus of this study. Both Southwest and North Sanjiang are geologically similar and have similar tectonic and structural histories, with both areas undergoing late Paleozoic to Mesozoic Tethyan tectonism and Cenozoic continental collisional orogenesis, both of which were associated with the formation of numerous ore deposits.
Dozens of valuable Pb–Zn deposits and prospects have been identified within the Yushu and Tuotuohe regions of the North Sanjiang area, including a number of large deposits, such as the Duocaima [7], Dongmozhazhua [8,9,10,11], and Mohailahen deposits [10]. The identification of these deposits and prospects means that the North Sanjiang area is highly prospective for further mineral exploration, and these discoveries indicate that North Sanjiang could be as well-endowed as the Southwest Sanjiang area, suggesting that the North Sanjiang area could be an extension of the Southwest Sanjiang metallogenic belt. This hypothesis is corroborated by Hou [1], who suggested that a giant belt of Pb–Zn–Cu–Ag mineralization is present within the Sanjiang area, which surrounds the eastern and northern edges of the Tibetan Plateau.
However, the North Sanjiang area, including the Tuotuohe region, is relatively unexplored and unresearched, especially when compared with the Southwest Sanjiang area. This is exemplified by the fact that there is little or no knowledge of the tectonic setting of mineralization, the type and composition of ore-forming fluids, or the source of mineralization in the North Sanjiang area. This lack of knowledge hinders future mineral exploration and means that exploration targeting may be ineffective.
This paper focuses on the geology, ore-forming fluids, and isotope geochemistry of five Pb–Zn deposits and prospects within the Tuotuohe region, namely mineralization within the Duocaima (DCM), Kongjie (KJ), Nabaozhalong (NBZL), Chuduoqu (CDQ), and Quemocuo (QMC) areas, and discusses (1) the tectonic setting of mineralization, (2) the source of ore-forming fluids and the metals deposited in these mineralized areas, and (3) the ore-forming processes that generated this mineralization. These new data indicate that the deposits in the study area represent a medium- to low-temperature hydrothermal vein type of mineralization, and this new information may provide a firm scientific foundation for future mineral exploration in this area.
2. Geological Setting
The Tuotuohe region is located within the hinterland of the Tibetan Plateau; is geologically within the northern Qiangtang Block [12]; and is bounded by the Jinshajiang suture belt to the north, the Tanggulashan Mountains Fault to the south, the line of 94°30′ longitude to the east, and a large bend of the Tuotuohe River to the west [13,14] (Figure 1). The Qiangtang Block records the Carboniferous-Permian development, evolution, and closure of the Tethys Ocean; the Early Triassic amalgamation with the Kunlun Block; the Early Cretaceous conjoining with the Lhasa Block as a result of southward subduction of the Bangonghu-Nujiang Ocean [15,16]; and the far-field effects of the Late Cretaceous subduction of the Indian Plate beneath the Eurasian Plate [17], which caused a fundamental transition in the crust–mantle dynamics of the region. The associated detachment and delamination, thinning of the lithosphere, and rapid uplift of the Tibetan Plateau [15,18,19,20] during this latest event all influenced the formation of mineral deposits in the study area during the Cenozoic.
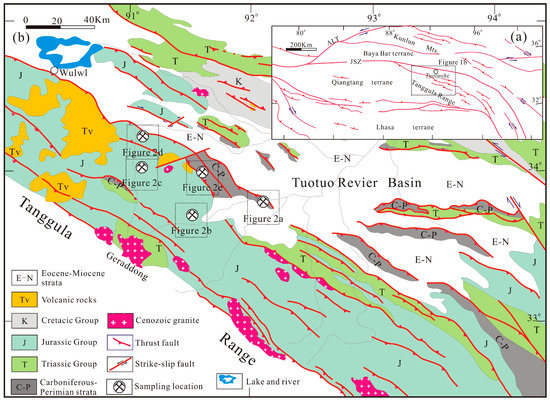
Figure 1.
Simplified tectonic map of the Tibetan Plateau (a) and Tuotuohe region (b) (adapted from [13]). JSZ, Jinshajiang suture; BSZ, Banggongcuo-Nujiang suture; ALT, Altyn Tagh Fault.
Sedimentary and volcanic rocks are widespread within the Tuotuohe Basin. Marine units dominate the Carboniferous-Permian section of the basin, with marine and marine–terrigenous units deposited between the Triassic and the Jurassic. These units are generally divided by the Tuotuohe River, and the Cenozoic evolution of the basin involved the formation of imbricate thrust structures [13,14] (Figure 1b). The deposition of marine units ceased during the Cretaceous and was superseded by a period of intra-continental tectonism, although Lower Triassic and Paleocene sediments are absent from the Tuotuohe region as a result of Tethyan and Himalayan collisional orogenesis and the formation of two regional angular unconformities [6,14,21].
The active continental margin and intra-continental orogenic activities suggest that units in the study area are intensively and extensively folded. The oldest fold structures in the area are within segments of a complexly folded island arc belt of the early Permian and continental marginal orogenic belt in the Qiangtang Block, with faults in these areas characterized by a WNW–ESE-trending thrust belt. These thrusts and other major faults in the study area usually delineate boundaries between the basin and orogenic belt and control both outcrop patterns and the location of mineralization.
The Tuotuohe region contains a significant volume of volcanic rocks, the most distinctive of which are Cenozoic alkaline volcanic rocks that have a zircon U–Pb age of 32–40 Ma [22] (Figure 1b). These alkaline volcanics are associated with the crustal thickening of the Tibetan Plateau that occurred from 65 Ma onward. The magmas that formed these volcanics were generated by a low degree of partial melting of mafic eclogite materials at the base of the thickened crust, and these magmas were also subsequently contaminated by lithospheric mantle materials. The Duocaima and Nabaozhalong areas of the study area also contain the late Permian to the early Triassic crystal tuffs that yield zircon U–Pb ages of 256 and 245 Ma [23] (Figure 2). The magmas that formed these tuffs were generated during the subduction of the Jinshajiang Ocean to the south of the study area.
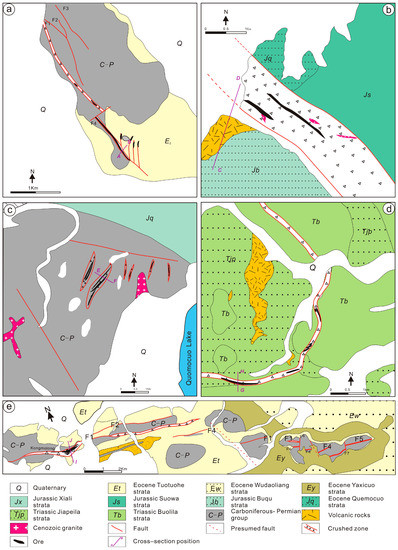
Figure 2.
Schematic map showing regional and ore geology of the Pb–Zn deposits in Tuotuohe region. (a) Geology of the KJ Pb–Zn deposit. (b) Geology the CDQ Pb–Zn deposit. (c) Geology of the QMC Pb–Zn deposit. (d) Geology of the NBZL Pb–Zn deposit. (e) Geology of the DCM Pb–Zn deposit.
3. Ore Deposits Geology
3.1. Host Rocks for Pb–Zn Mineralization
Sporadic bands of Carboniferous and Permian units outcrop between the Mesozoic and Cenozoic units within the Tuotuohe region and significant amounts of Triassic and Cretaceous units are exposed in the northwest of the study area, whereas Jurassic units dominate the southwest and Cenozoic units are concentrated in the interior of the basin. The outcropping of all of these entities is controlled by regional structures [13].
The Kongjie (KJ), Duocaima (DCM), Nabaozhalong (NBZL), Chuduoqu (CDQ), and Quemocuo (QMC) deposits are typical examples of Pb–Zn mineralization within the study area. They are generally located in the southern and western Tuotuohe Basin and are hosted by carbonate sediments, including Triassic limestones of the Zarigen (Kongjie), Jiushidaoban (Duocaima), Labuchari (Quemocuo), and Bolila (Nabaozhalong) formations, Jurassic limestones within the Buqu Formation (Chuduoqu), and Cenozoic limestones of the Wudaoliang Formation (Duocaima; Table 1; Figure 2).

Table 1.
The geological characteristics of the deposits in Tuotuohe region.
Some mineralization in the study area is hosted by sandstones, including mineralization within the Jurassic Jiabila (Nabaozhalong) and Xili (Duocaima) formations and the Cenozoic Tuotuohe Formation (Duocaima, Kongjie; Figure 2), although it should be noted that the majority of significant mineralization is hosted by carbonate formations rather than sandstones.
3.2. Ore-Controlling Structures
The most important ore-controlling structures in the study area are NW–SE-trending faults [13], which generally control the location of individual deposits and ore bodies, including those within the DCM, KJ, and CDQ deposits (Table 1, Figure 2).
The faults associated with the KJ deposit are small-scale, descend to the NE at 50°–70°, and cover a length of 3.4 km with a fragmentation width of 50–200 m. From the northwest to the southeast, the width is gradually decreasing. In addition, the Pb–Zn ore bodies that comprise the KJ deposit are dominated by fragmentation associated with the development of extensional breccias (Figure 2a).
The CDQ deposit strikes SE–NW, leading some researchers to suggest that the deposit is controlled by an interformational fracture zone, and previous research suggests that ore bodies within the deposit trend S–N. However, fieldwork undertaken during this study indicates that this deposit is associated with a NW–SE-trending structure (Figure 2b) that is a more essential control on the location of mineralization than the previously identified S–N structure. Field geological investigation and cataloging of the mine (Figure 3) revealed that the main ore-controlling structure is an EW-oriented alteration and fragmentation zone, within which multiple EW-oriented ore bodies can be circled. The above-mentioned near-SN-oriented structure is a series of parallel distribution of interstratified fracture zones, which contains ore but are secondary ore-bearing structures, in which mineralization is intermittently distributed, and the mineralization is weakened to disappear away from the EW main structure zone. The NW–SE-trending structure is concordant with regional bedding, is over 500 m wide, has a length of more than several thousand meters, and extends to the west of the study area where it is covered by Quaternary sediments. This structure hosts a significant number of ore bodies, with intermittent mineralization of the CDQ deposit located in an interformational fracture zone. However, all of these ore bodies dissolve outside the NW–SE-trending structure. The interformational fracture zone slightly displaces the NW–SE-trending mineralization-rich veins, indicating that the former predates the latter, although both faults formed in the same overall period. The new ore-controlling NW–SE structure discovered during this study has altered the approach to mineral exploration in this area, and the total Pb–Zn metal reserves for the deposit are greater than 510,000 tons [24].
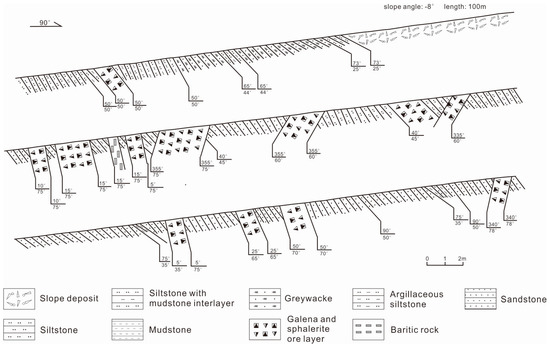
Figure 3.
Measured profile of the CDQ Pb–Zn deposit.
The QMC Pb–Zn prospect is associated with lenticular ore-controlling structures that trend ENE–WSW, are brecciated, and are dominated by limestone components; these structures are common within this portion of the study area (Figure 2c). Breccias in this area have an angular shape, vary in diameter, and were formed during tensional tectonism. The QMC Pb–Zn mineralized prospect is hosted by one of these ENE–WSW-oriented structures and is a minor prospect. Through the geological compilation and route geological investigation of TC1 and TC5 (Figure 4a,b), the main control tectonic zone is in the NWW direction, and the NWW and NW direction fractures control a group of NE-direction-distributed ore (chemical) bodies distributed in a subparallel lateral row. The NWW-oriented fractures have left-rotation tensegrity, while the NE-oriented lateral ore bodies are controlled by right-going tensegrity.
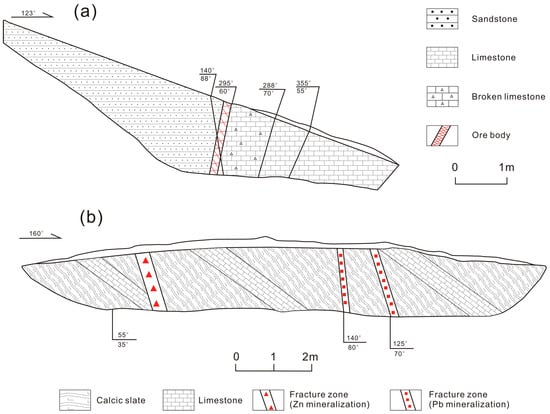
Figure 4.
Geological compilation maps of (a) TC1 trench and (b) TC5 trench of M1 ore body within the QMC deposit.
The structure that controls the location of Pb–Zn mineralization within the NBZL deposit is circular in geometry, centered on volcanic and dike units within the west of the mine (Figure 2d). This structure descends outwards at an angle of 30° and is the primary host for fault gouges, breccias, and ore bodies in the area. However, only the eastern half of the circular structure has been identified to date, and no specific research has been undertaken on the western half, primarily as a consequence of mining rights issues. Drilling has identified that Pb–Zn mineralization predominantly occurs along the contact between the hanging wall of the circular structure and the limestones of the Bolila Formation, with mineralization controlled by both the location of the structure and the presence of limestone.
The fault that hosts the ore bodies within the DCM deposit is about 20 km long, 40–400 m wide, trends NW–SE, and descends 60–80° to the NE. The deposit is divided into three ore blocks (from west to east): the Kongmolong, Chaqupacha, and Duocaima blocks. Fractures within the deposit contain tectonic breccias and fault gouges, both of which are suitable sites for mineralization, indicating that the mineralization within the deposit is preferentially fracture-hosted (Figure 2e). The field trenching and geological compilation of drill holes show that the interstratified fracture zone does have a certain degree of mineralization, but the main part of the mineralization is controlled by the steeply dipping interlayer fracture, and the mineralization is more abundant at the superposition of the two structures. In other words, the main ore-holding structure is a steeply dipping interlayer fracture rather than an interstratified fracture zone (Figure 5).
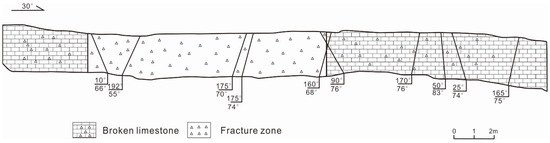
Figure 5.
Geological compilation map of TC01 trench in the Kongmolong section of the DCM Pb–Zn deposit.
From the geological phenomena revealed by the field geological work, the Kongjie Pb–Zn ore is mainly Zn mineralization, and the quantity of galena is greatly reduced compared with other deposits, which is consistent with the results of chemical analysis (Pb/Zn = 0.01~0.3) (Figure 6a), indicating that this deposit has a deep stripping depth; the Pb–Zn ore of Quemucuo has a large amount of galena and less sphalerite due to the low mineralization temperature and mineral assemblage, and its Pb/Zn ratio is 6~15, indicating that the surface position at this stage is close to the head of the deposit, and this deposit has a shallow stripping and better preservation conditions (Figure 6c); the Pb/Zn ratio of the Duocaima deposit is high (0.1~150), showing a strong Pb mineralization (Figure 6e), which is consistent with the small depth of mineralization and low temperature of mineralization, and the shallow denudation of the deposit; the Pb/Zn ratio of Chuduoqu is between 0.1 and 10 (Figure 6b), with relatively good Pb–Zn mineralization potential and shallow stripping; the Pb/Zn ratio of Nabozhalong is low (the main body is around 0.1) (Figure 6d), which is equivalent to the central Pb–Zn zone in the vertical zone of Pb–Zn, indicating a deep stripping.
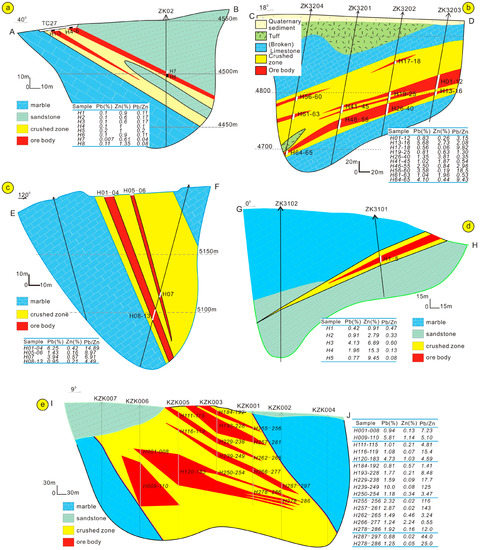
Figure 6.
Prospecting line profile maps of (a) Kongjie (KJ), (b) Chuduoqu (CDQ), (c) Quemocuo (QMC), (d) Nabaozhalong (NBZL), and (e) Duocaima (DCM) Pb–Zn deposits in Tuotuohe region.
3.3. Ore Types and Mineral Assemblages
The main ore minerals within both Pb–Zn deposits and prospects within the Tuotuohe region are galena and sphalerite (Table 1; Figure 7g–i), and copper–iron mineralization is also present in the DCM and CDQ deposits (Figure 7d–f), as well as pearceite within the CDQ deposit. The galena–sphalerite–copper assemblage in these deposits represents low-temperature mineralization, and secondary limonite, malachite, azurite, sardinianite, and smithsonite are present in secondary enrichment zones along joints and fractures that formed during weathering. Assaying of drill cores indicates that the lower parts of the deposits in the study area are Zn-rich, whereas the upper parts are Pb-rich (Figure 3). Mineralization is divided into four ore types: vein-like, brecciated, disseminated, and massive mineralization, with vein-like and massive mineralization being dominant. Ore minerals are hosted by a chalcedony- and calcite-dominated gangue with minor barite. The mineralization in the study area is hydrothermal and formed at low temperatures, as supported by the presence of colloform-textured ore (Figure 7a).
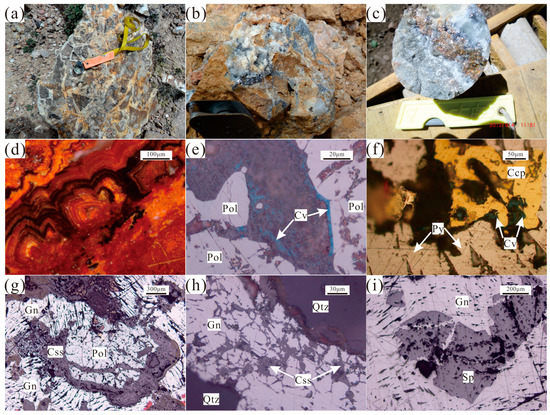
Figure 7.
Photographs and photomicrographs of ore from the Pb–Zn deposits in Tuotuohe region. (a) Tectonic breccia cemented by later calcite veins; (b) veined Pb–Zn ore in quartz veins; (c) pyrite mineralization, galena mineralization quartz veins; (d) the internal reflection color of limonite; (e) polybasite with covellite at the margin; (f) pyrite contains chalcopyrite, and covellite is visible along the edge of chalcopyrite; (g) cerussite metasomatizing polybasite and galena; (h) cerussite metasomatizing galena along its crystal eages, and galena is euhedral–subhedral; (i) galena metasomatizing sphalerite along its microfractures. Qtz—quartz; Pol—polybasite; Css—cerussite; Py—pyrite; Ccp—chalcopyrite; Sp—sphalerite; Gn—galena; Cv—covellite.
The brecciated nature of the ore, the various sizes and shapes of breccia zones, the presence of chalcedony and barite with comb structures, and the presence of vein-like mineralization (Figure 7b,c) are all indicative of formation during tensional tectonism and the abundance of mineralization in an area is often controlled by the strength of fissures and the presence of quartz–calcite veins (Figure 7a–c).
3.4. Stages of Mineralization
All mineral assemblages within Pb–Zn deposits in the Tuotuohe region can be divided into hydrothermal and weathering periods of formation (Figure 8). The hydrothermal period of mineralization is divided into quartz–galena, chalcedony–barite–carbonate–galena, and carbonate–gypsum stages of mineralization (stages 1, 2, and 3, respectively).
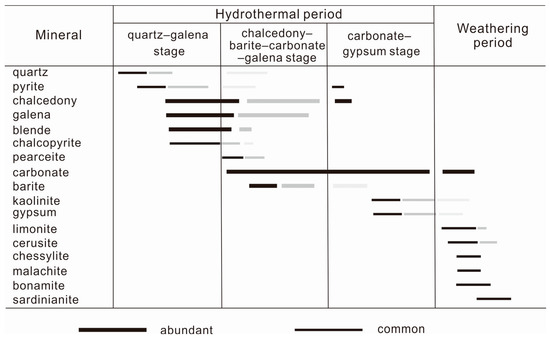
Figure 8.
Mineral assemblages in the paragenetic sequence of the Pb–Zn deposits in Tuotuohe region (the shade of colors represents different generations).
3.5. Wallrock Alteration
Mineralization in the study area is associated with significant wallrock alteration that is dominated by silicification and the formation of barite and carbonate alteration, all of which are closely related to Pb–Zn mineralization as corroborated by petrography, mineral assemblages, and cross-cutting vein relationships (Table 1). The primary types of alteration are as follows:
- (1)
- During stages 1 and 2 of mineralization, silicification takes many forms, forming irregular quartz veins and networks in stage 1 and planar alteration that is closely related to Pb–Zn mineralization in stage 2;
- (2)
- Barite alteration is characterized by the formation of variegated barite during stage 2 and by less abundant barite associated with gypsum in stage 3;
- (3)
- Carbonate alteration is associated with stages 2 and 3. The carbonate alteration that formed during stage 2 is more closely related to mineralization and is more voluminous than that which formed during stage 3, with the latter cross-cutting the former.
4. Sampling and Analytical Methods
A total of 45 samples, including quartz and calcite, were obtained for microthermometric analysis. Samples were chosen during comprehensive field investigations of individual ore deposits (Table 2). Fluid inclusion microthermometry and laser Raman spectra analyses were undertaken in the Geofluid Laboratory of Jilin University, China, using samples of 0.25–0.3 mm thickness. Each sample was meticulously examined under a binocular microscope before fluid inclusion microthermometry analysis using a Linkam THMS-600 heating–freezing stage calibrated with purified water and synthetic fluid inclusion standards. This stage has an accuracy of ±0–2 °C at temperatures < 300 °C and ±2–5 °C at temperatures > 300 °C. Decrepitation was avoided during analysis by first freezing and then heating samples over a range of −196 to 600 °C at a heating/freezing rate of 0.1–1.0 °C/min for temperatures < 10 °C, 5–10 °C/min at temperatures between 10 and 31 °C and >100 °C, and <0.5 °C/min when approaching phase transformation temperatures. Salinities were determined as wt.% NaCl equivalents and were calculated using the melting temperature of the last crystal of ice within two-phase fluid inclusions using the equation proposed by [25]. Fluid densities were estimated using fluid inclusion homogenization temperatures and the equation proposed by [26].
Table 2.
Summary of fluid inclusions data from the Pb–Zn deposits in Tuotuohe region.
The compositions of individual FIs were determined using an RM-2000 laser Raman microprobe (Renishaw, New Mills, UK) with an argon ion laser and a laser source of 514 nm. The scanning range of spectra was set between 100 and 4300 cm−1 with an accumulation time of 60 s for each scan. The laser beam width was 1 µm, and the spectral resolution was 0.14 cm−1.
Twenty-five galena samples that formed during leaching and decomposition during mineralization stages 1 and 2 were selected from diverse deposits for S–Pb isotopic analysis using a binocular microscope. These analyses were carried out at the Analytical Laboratory of the Beijing Research Institute of Uranium Geology (ALBRIUG; Table 3), Beijing, China. Sulfide isotope compositions were measured using a Finnigan MAT-251 mass spectrometer and the SO2 method of [27], with results reported using the conventional δ34S notation and ‰ units relative to the Vienna Canon Diablo Troilite (V-CDT) standard as δ34SV-CDT. Total uncertainties were estimated to be less than ±0.2‰, and GBW 04415 and GBW 04414 Ag2S were used as external standards, yielding δ34SV-CDT values of −0.07‰ ± 0.13‰ and 22.15‰ ± 0.14‰, respectively.
Table 3.
Sulfur and lead isotope composition of galena from the Pb–Zn deposits in Tuotuohe region.
Pb isotopic compositions were measured using an Isoprobe-T mass spectrometer and a single filament and are reported with regard to Pb standard reference NBS-981 values [29]: 206Pb/204Pb = 16.934 ± 0.007, 207Pb/204Pb = 15.486 ± 0.012, and 208Pb/204Pb = 36.673 ± 0.033. The accuracy of the mass measurement of 1 μg Pb relative to the NBS 981 values is greater than 0.005% for 206Pb/204Pb and 0.0005% for 208Pb/206Pb.
The H and O isotope analyses of quartz undertaken during this investigation were carried out using a Finnigan MAT-253 mass spectrometer at ALBRIUG, China, following the procedures outlined by [30]. The results are given in terms of SMOW (Standard Mean Ocean Water), with a precision of ±2‰ for δD and ±0.2‰ for δ18O.
The C and O isotope analyses of stage 2 and 3 calcite were performed on an ISOPrime instrument at ALBRIUG, China, and the results are presented as δ13CPDB and δ18OPDB relative to Pee Dee Belemnite (PDB). The analytical precision (2σ) for carbon isotopes is ±0.2‰ and for oxygen isotopes is ±2‰, and the relationship between δ18OSMOW and δ18OPDB is δ18OSMOW = 1.03086 × δ18OPDB + 30.86 [31].
5. Analytical Results
5.1. Fluid Inclusions
Fluid inclusion phase ratios at room temperature (25 °C) show that two fluid inclusion types are present in quartz and calcite from Pb–Zn deposits in the study area:
Type I: two-phase liquid and vapor (aqueous liquid + vapor) inclusions (Figure 9a–i).
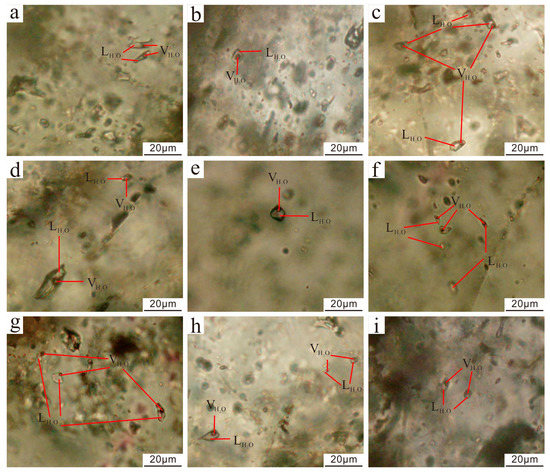
Figure 9.
Photomicrographs of fluid inclusions in the Pb–Zn deposits in Tuotuohe region. (a) Type I inclusions in the DCM Pb–Zn deposit; (b) Type I inclusions in the CDQ Pb–Zn deposit; (c) Type I and II inclusions in the CDQ Pb–Zn deposit; (d) Type I inclusions in the KJ Pb–Zn deposit; (e) Type I inclusions in the KJ Pb–Zn deposit; (f) Type I and II inclusions in the KJ Pb–Zn deposit; (g) Type I inclusions in the QMC Pb–Zn deposit; (h) Type I inclusions in the NBZL Pb–Zn deposit; (i) Type I inclusions in the NBZL Pb–Zn deposit.
Type II: monophase liquid (aqueous liquid) inclusions (Figure 9c,f).
Type I fluid inclusions dominate the samples and account for more than 80% of the total fluid inclusion population within the samples. In addition, the vapor-free nature of Type II inclusions means that they are sub-stable; as a result, only Type I inclusions were analyzed during this study. Type I fluid inclusions are liquid-rich, with degrees of fill ranging from 0.6 to 0.9, and have varied morphologies, including round, negative crystal, or irregular, with diameters ranging from 4 to 20 μm (Figure 9). They appear as both isolated inclusions and as clusters along crystal growth orientations, suggesting they are primary inclusions. The absence of liquid CO2 or clathrate formation during freezing experiments suggests that none of the inclusions contained significant quantities of CO2 [32].
The microthermometric data are presented in Table 2. Type I fluid inclusions are completely homogenized to liquid at temperatures varying from 80 °C to 260 °C (Th), with the preponderance homogenizing at 120 to 220 °C (Figure 10), covering four stages of mineralization. However, fluid inclusions within quartz that formed during stages 1 and 2 have typically higher homogenization temperatures than those within calcite that formed during stages 2 and 3. These inclusions have densities of 0.833–1.051 g/cm3 and salinities of 1.90–19.79 wt.% NaCl equivalent, with the majority having salinities of 6–16 wt.% NaCl equivalent (Table 2; Figure 10).
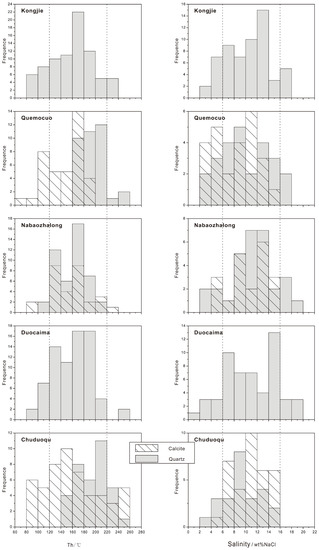
Figure 10.
Histograms of salinities and homogenization temperatures of fluid inclusions (the point lines represent the scope of data concentration; the gray slanted part represents the common part of fluid inclusions data within quartz and calcite).
Representative FIs from the Pb–Zn deposits in the Tuotuohe region were studied using laser Raman spectroscopy to determine their gas compositions. The results suggest that the vapor phases of the Type I FIs are dominated by H2O and trace amounts of CO2 are also found in the vapor phases of Type I FIs in the CDQ deposit (Figure 11). In summary, the FIs can be described as the H2O − NaCl ± CO2 system.
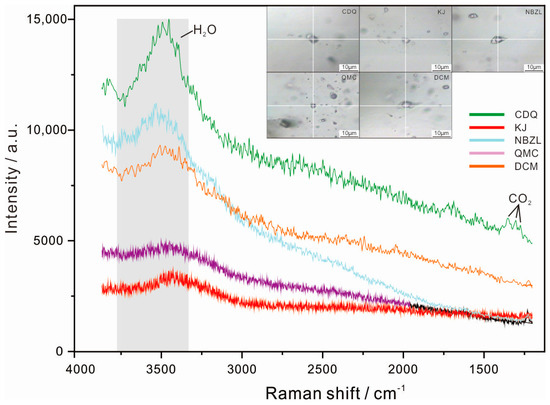
Figure 11.
Representative laser Raman spectra for fluid inclusions from the Pb–Zn deposits in Tuotuohe region.
5.2. S Isotope Compositions
The S isotope compositions of galena, together with previously published data [28], are listed in Table 3 and are shown in a histogram in Figure 11. The samples have δ34SV-CDT values of −34.53‰ to +10.1‰ (Table 3; Figure 12), while the DCM and KJ deposits have slightly different δ34S values to the other deposits, ranging from −34.53‰ to −7.05‰, generally between −30‰ and −25‰. In contrast, the S isotope compositions of the CDQ, QMC, and NBZL deposits are close to zero, ranging from −3.8‰ to +10.1‰ but generally between −5‰ and +5‰ (Table 3; Figure 12). The δ34SV-CDT of the Pb–Zn deposits in the study area have a bimodal distribution (Figure 12), suggesting that the ore-forming metals have a complex source [33].
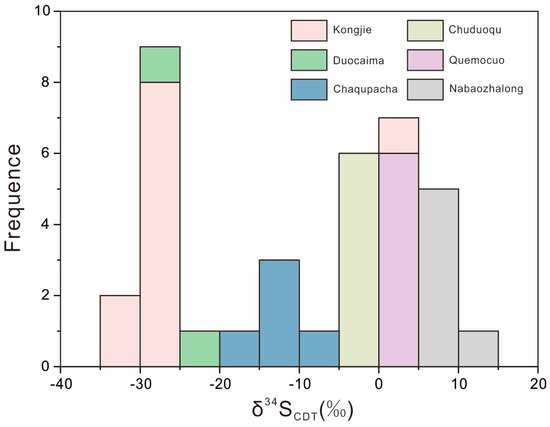
Figure 12.
S isotope compositions histogram of the Pb–Zn deposits in Tuotuohe region.
5.3. Pb Isotope Compositions
The data listed in Table 3 indicate that the galena samples obtained from the five deposits within the study area have homogeneous Pb isotopic compositions, with 208Pb/204Pb values of 38.568–38.976 (mean of 38.779), 207Pb/204Pb values of 15.623–15.769 (mean of 15.662), and 206Pb/204Pb values of 18.410–18.810 (mean of 18.624).
5.4. C and O Isotope Compositions
Both new and previously published C and O isotope compositions of individual carbonate minerals from the five deposits analyzed in this study are given in Table 4. Hydrothermal calcite separates have comparatively diverse C and O isotope compositions, with δ13CPDB values of −7.5‰ to −7.9‰ and δ18OSMOW values of +10.6‰ to +23.4‰. The C isotope compositions of samples from these deposits can be broadly separated into two categories: negative values (−7.5‰ to −5.6‰) that are within the range of mantle compositions (−9‰ to −4‰), all of which were from the CDQ deposits, and positive (0.7‰–7.9‰) values. The O isotope compositions of samples from these deposits also have an analogous dichotomy, where compositions both correspond and do not correspond with the mantle range of δ18OSMOW compositions (6‰–15‰), with samples from the CDQ and KJ deposits having mantle δ18OSMOW values (10.6‰ to 12.1‰ and 11.5‰ to 17‰), whereas samples from the QMC and DCM deposits have higher δ18OSMOW values (15.9‰ to 21.7‰ and 16.4‰ to 23.4‰) that lie outside this range.
Table 4.
δ13C and δ18O values of the Pb–Zn deposits in Tuotuohe region.
5.5. H and O Isotope Compositions
Oxygen and hydrogen isotope values were analyzed directly from fluid inclusions within ore-bearing vein quartz from the CDQ deposit, and the results are given in Table 5. Quartz δ18OSMOW values vary from 15.3‰ to 22.2‰ with a mean of 19.0‰, whereas δDSMOW values obtained from fluid inclusions within these quartz samples range from −96.4‰ to −122.1‰ with a mean of −111.2‰. Calculated δ18OH2O values obtained from quartz δ18OSMOW values range from 2.1‰ to 9.5‰ at the mean homogenization temperature of the associated fluid inclusions.
Table 5.
δD and δ18O values of the CDQ Pb–Zn deposit in Tuotuohe region.
6. Discussion
6.1. Temperature, Density, and Salinity of Ore-Forming Fluids
Type I fluid inclusions homogenize at medium-low temperatures (80 °C to 260 °C, with the majority between 120 °C and 220 °C, covering four stages of mineralization), have medium-low salinity (1.90 to 19.79 wt.% NaCl equivalent, with the majority between 6 and 16 eq. wt.% NaCl equivalent), and have low densities (0.833–1.051 g/cm3), indicative of the conditions of Pb–Zn precipitation within the Pb–Zn deposits of the Tuotuohe region. Homogenization temperatures and salinities positively correlate in a salinity vs. Th diagram (Figure 13), indicating that the abundance of atmospheric water within these systems increases from the early to later phases of mineralization.
Ref. [34] measured the temperature range of CDQ from 144 to 370 °C, of which stages 2 to 4 were more consistent with the results of this study, indicating that the temperature reduction was the result of a slight cooling process and fluid mixture. It is believed that fluid boiling occurs during the third stage of mineralization. According to the temperature measurement results of the fluid package, it can be launched at a pressure of <10 Mpa and a depth of about less than 1 km [32]. This result is also consistent with the P-T conditions of the CDQ deposit that [34] just obtained. From the early stage of mineralization to the late stage, the temperature and salinity continue to decrease, indicating the addition of meteoric water, which coincides with other medium-low temperature hydrothermal vein Pb–Zn deposits [32,34,35,36,37,38,39,40]. However, the late-stage fluid evolution in the Aveiro district was found to have high salinity, different from the Braganca district [35], in line with the high salinity characteristics of the fluid measured at the late stage of mineralization reported by [41].

Figure 13.
Plot of homogenization temperatures against salinity values of fluid inclusions from the Pb–Zn deposits in Tuotuohe region (dark represents quartz and colorless represents calcite). Inset illustration for different fluid evolution paths is based on [42].
Figure 13.
Plot of homogenization temperatures against salinity values of fluid inclusions from the Pb–Zn deposits in Tuotuohe region (dark represents quartz and colorless represents calcite). Inset illustration for different fluid evolution paths is based on [42].

All of the typical deposit fluids listed above show that the mineralization stage evolves from early to late, from high to low temperature, with increasing meteoric water and decreasing salinity. The low-salinity and low-density characteristics are distinctly different from the typical MVT formed in a stable basin where the mineralizing fluid is a high-salinity, high-density thermal brine [43,44,45,46].
6.2. Sources of Ore-Forming Metals
Galena samples obtained from Pb–Zn deposits within the Tuotuohe region have a relatively narrow range of 208Pb/204Pb, 207Pb/204Pb, and 206Pb/204Pb ratios (38.568–38.976, 15.623–15.769, and 18.410–18.810, respectively; Table 3), which is consistent with the medium-low temperature hydrothermal vein Pb–Zn deposits [39,47,48], suggesting that the Pb within these deposits was derived from a single source or from a homogenized mixture of different sources.
The 207Pb/204Pb vs. 206Pb/204Pb diagram shown in Figure 14a indicates that the majority of samples lie within the upper crust and orogenic belt fields of [49], whereas the same samples plot within the lower crust and orogenic fields in a 208Pb/204Pb vs. 206Pb/204Pb diagram (Figure 14b). These Pb isotope values are indicative of sourcing from the lower and upper crusts and orogenic zones, suggesting that the Pb within the Pb–Zn deposits in the study area was derived from both the mantle and crust [50,51], with the upper crust being the main source of lead for these deposits. These lead isotope discrimination diagrams indicate that the Pb–Zn deposits of the Tuotuohe region formed in an orogenic environment, with the majority of metal originating from the crust.
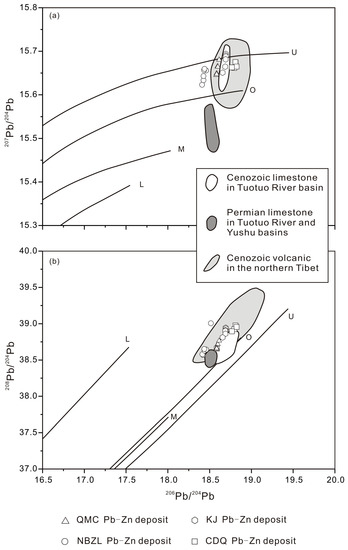
Figure 14.
Lead isotope compositions of samples from the Pb–Zn deposits in Tuotuohe region plotted in the model lead evolution diagrams of [49]. (a) 207Pb/204Pb vs. 206Pb/204Pb; (b) 208Pb/204Pb vs. 206Pb/204Pb plot. M: upper mantle-source lead; O: orogenic belt-source lead; U: upper crust-source lead; L: lower crust-source lead.
The Pb isotope compositions of Permian limestones of the Tuotuohe and Yushu basins, Mesozoic and Cenozoic limestones of the Tuotuohe Basin [11], and alkaline Cenozoic volcanics of the northern Tibetan Plateau [52] were also plotted in 207Pb/204Pb vs. 206Pb/204Pb and 208Pb/204Pb vs. 206Pb/204Pb diagrams, with the Pb isotopes of ore samples being similar to the latter two but significantly different from the former. This suggests that although Permian limestones in the study area host mineralization within the DCM and KJ deposits, these units did not supply any Pb to these deposits. In addition, the Pb isotope compositions of ores in both the 207Pb/204Pb vs. 206Pb/204Pb and 208Pb/204Pb vs. 206Pb/204Pb diagrams are very similar to those of the Cenozoic volcanics, suggesting that these volcanics may be the source of Pb within the Pb–Zn deposits of the Tuotuohe region.
Ref. [53] proposed a Δγ-Δβ diagram based on the equations Δγ = (γ − γM) × 1000/γM and Δβ = (β − βM) × 1000/βM, where γ = the 208Pb/204Pb value of a sample, γM = the 208Pb/204Pb value of the mantle (37.47), β = the 207Pb/204Pb value of a sample, and βM = the 207Pb/204Pb value of the mantle (15.33). This approach can help in identifying sources of Pb by determining Δγ and Δβ values (Figure 15). The vast majority of the samples analyzed during this study plot in the mixed crust and magmatism-related mantle fields in Figure 15 and have similar Δγ and Δβ values to the Cenozoic volcanics [52] but are different from both Permian and Mesozoic limestones [11] in the study area. This suggests that the metals within the Pb–Zn deposits of the Tuotuohe region were derived from Cenozoic volcanics, indicating, in turn, that this mineralization represents the result of some degree of crust–mantle interaction, as is consistent with the 207Pb/204Pb vs. 206Pb/204Pb and 208Pb/204Pb vs. 206Pb/204Pb diagrams discussed above. [34] suggests that the primary source of minerals within the CDQ deposit is the regional hydrocarbonate pulp hot fluid system, as well as the Jurassic carbonate that provides a partial contribution.
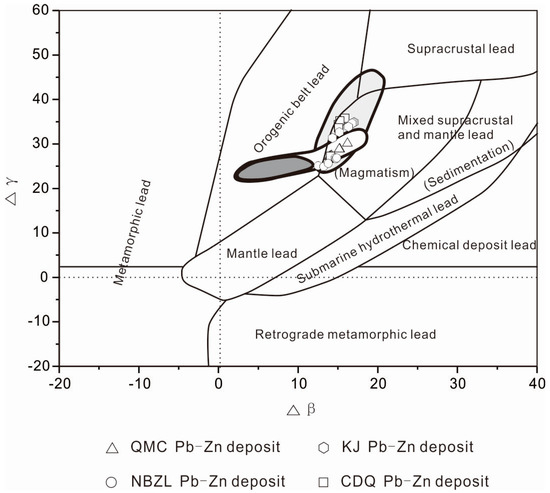
Figure 15.
Δγ-Δβ diagram of ore lead from the Pb–Zn deposits in Tuotuohe region (after [53]).
The results of Pb isotope analysis from different deposits in the study area show that the mineralized material Pb mainly originates from the Cenozoic igneous rocks rather than the ore-bearing strata. The fact that different deposits in the region are distributed in different age strata also proves that there is no special selection of stratigraphy for these deposits, and their mineralization has the same kinetic background and the same metallogenic process. Therefore, the study of this work supports the idea that the mineralized material originates from igneous rocks, and their mineralization is closely related to magma, and these deposits are not MVT-type Pb–Zn deposits that are unrelated to magmatic activity.
Sulfur isotopes are the main mineralizing agents for sulfophile elements precipitated as sulfides, and they also play an important role in the precipitation and enrichment of the metallogenic material [54]. However, there are differences in the δ34SV-CDT values of the different deposits. The δ34SV-CDT values of samples from the CDQ, QMC, and NBZL deposits are −3.8‰ to −1.3‰, +2.2‰ to +3.4‰, and +5.2‰ to +10.1‰, respectively, all of which are close to the accepted mantle range [55] and indicate a magmatic control over the mineralizing event in the study area. Ref. [37] obtained Qibaoshan polymetallic ore field S for 0.5~4.3, and ref. [51] obtained 1.4~2.7 in the Aobaotu Pb–Zn deposit, which is relatively consistent with the QMC results in this paper; both of which are considered to be primarily derived from rocks. The δ34SV-CDT values of samples from the CDQ deposit are consistent with the δ34SV-CDT measured in galena and sphalerite by [34] and with the results obtained in Dashishan Sn–Pb–Zn deposits [38]. However, ref. [34] just measured the δ34SV-CDT of the chalcopyrite to be a little higher than the galena and sphalerite, suggesting that the main mineralization stage of CDQ is formed in a stable and uniform hot-liquid environment. Ref. [38] conclude that the mineral logistics body originates from the subdued granite body by contrasting the relationship with the surrounding rocks. Ref. [56] concludes that the results obtained in the Xinling Pb–Zn deposit were consistent with the NBZL deposit and suggest the Pb–Zn mineralization is a magmatic source. This result, combined with the fact that the metals within the deposits were derived from Cenozoic volcanics, suggests that the sulfur within the CDQ, QMC, and NBZL deposits was also derived from a magmatic source.
Samples from the KJ and DCM deposits have mean δ34SV-CDT values of −26.3‰ and −15.5‰, respectively. These negative δ34SV-CDT values are indicative of sulfide accumulation in an open system with an infinite sulfate reservoir, such as seawater sulfate [35] within sedimentary pore spaces in an anoxic environment [57]. The values are also typical of sedimentary sulfides formed in marine sediments by the bacterial reduction of seawater sulfate via the formation of pyrite, causing the accumulation of diagenetic sulfides with mean δ34S values of between −15‰ and −40‰. Ref. [58] obtained identical δ34SV-CDT values for the DCM deposit but suggest that the DCM deposit belongs to the MVT-type Pb–Zn deposit.
In summary, it is recognized that although the Pb sources of the medium- and low-temperature hydrothermal vein-type Pb–Zn ores in the Tuotuo River area are relatively consistent, with some deposits characterized by the involvement of deep-source magmatic sulfur in mineralization, the sulfur sources of individual Pb–Zn ores, represented by Kongjie, are more complex and may consist of both deep-source magmatic sulfur and sedimentary basin sulfur sources. However, the large positive δ34SV-CDT interval (8.03‰–31.36‰; [59]) between the δ34SV-CDT of all these deposits and the typical MVT deposits of sulfides represents a large difference in seawater sulfide, implying a non-MVT genetic type.
6.3. Sources of Ore-Forming Fluid
The O and H isotopic compositions of selected minerals at different mineralization stages are widely used in the study of the source and evolution processes of hydrothermal fluids [37,60]. Most samples from the CDQ Pb–Zn deposit plot between magmatic and meteoric water lines in a δDSMOW vs. δ18OH2O diagram (Figure 16), indicating that these samples formed from hydrothermal fluids derived from the mixing of magmatic and meteoric fluids. This drop in the δ18OH2O values can be explained by the addition of meteoric waters to the hydrothermal system, resulting in a migration of the δ18OH2O [40]. This is consistent with the findings of the study [33,34,36]. Ref. [34] believe that as the mineralization progresses, from the first stage to the third stage, the samples gradually move away from the magmatic water area, indicating that the meteoric water continues to increase, which is also consistent with the results of the study of the fluid temperature and salinity, which also suggests the mixing of different fluids.
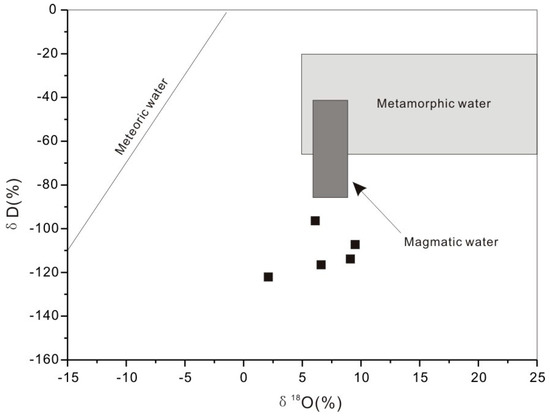
Figure 16.
δD-δ18O diagram for ore–fluid of the CDQ Pb–Zn deposit in Tuotuohe region. The base diagram is cited from [60].
The differences in the δ13CPDB values of various carbon pools mean that C isotope analysis is an important method for tracing the origin of ore-forming fluids [34]. Five calcite samples from the CDQ deposits have δ13CPDB values of −7.5‰ to −5.6‰, similar to or slightly higher than the conventional mantle values (−4‰ to −8‰; [61]). These samples also have δ18OSMOW values of 10.6‰ to 12.1‰, which are slightly higher than the mantle (6.0‰–10.0‰; [61]). All of these samples plot near the mantle field in a δ13CPDB vs. δ18OSMOW diagram (Figure 17). This indicates that the CO2 within the ore fluids was probably sourced from a magmatic system, perhaps with some input from marine carbonates. This is consistent with the results measured by [34] in the fourth stage of mineralization, as well as the results obtained by [62] that are considered to be from a magmatic source. However, ref. [63] obtained the same results in the Bayji Pb–Zn deposit, which formed in the late phase of orogenic extension and is thought to be primarily derived from the dissolution of pelagic carbonate sequences.
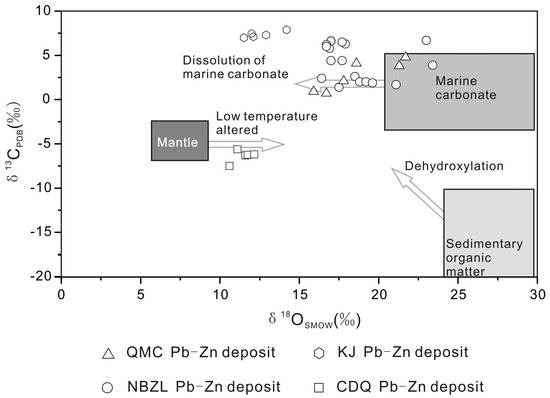
Figure 17.
Plots of δ13CPDB vs. δ18OSMOW for the Pb–Zn deposits in Tuotuohe region. C and O isotopic compositions of the DCM Pb–Zn deposit are taken from [28].
The δ13CPDB and δ18OSMOW compositions of the other 29 calcite samples from the KJ, QMC, and DCM deposits range from 0.7‰ to 7.9‰, and from 12.9‰ to 23.4‰, respectively, which is consistent with the C-O results obtained in the Pb–Zn deposit in the Rajasthan region [64]. Ref. [58] conducted a C-O isotopic analysis of calcites and limestones associated with mineralization in the DCM mining area, which is consistent with this paper. These samples plot in-between the mantle and marine carbonate fields in a δ13CPDB vs. δ18OSMOW diagram (Figure 17), but closer to marine carbonate compositions (δ13CPDB = 0‰ ± 4‰, δ18OSMOW = 20‰–24‰; [54,65]) and away from the organic carbon compositions (δ13CPDB = −30‰ to −15‰; [54]). This suggests that the marine carbonates within the deposits were the main source of carbon, and the carbon from these carbonates was partially re-equilibrated with magmatic fluids during mineralization.
The C-H-O isotope compositions described above suggest that the preponderance of ore-forming fluids was magmatic, as evidenced by fluid inclusion characteristics and sulfur and lead isotope compositions. However, these magmatic fluids evolved by mixing with meteoric water and wallrock interaction prior to mineralization in the study location.
6.4. Pb and Zn Transportation and Deposition Mechanisms
Previous research has indicated that Pb and Zn are transported as aqueous Cl− and HS− complexes rather than as bisulfide complexes within hydrothermal solutions, especially under conditions of medium to low temperatures and high salinity [47]. The fluid characteristics and Pb isotope compositions of Pb–Zn deposits in the study area are identical, although the deposits have varying δ34S compositions, suggesting that the metals within the ore-forming fluids were not transported as sulfur complexes but were transported mainly by chloride complexes of Pb2+ and Zn2+ in the ore-forming fluids.
The migration of magmatic fluids to shallower parts of the crust led to the precipitation of Pb and Zn, primarily as the result of three possible processes: cooling [66], fluid mixing/dilution [67], and fluid–rock interaction [68], as follows:
- (1)
- Cooling: Metal complex solubility is a function of temperature, and cooling reduces both solubility and stability, leading to the precipitation of sphalerite and galena. The study of the CDQ deposit by [34] shows that the temperature continues to decline as mineralization progresses, suggesting that cooling plays an important role;
- (2)
- Fluid mixing/dilution: Fluid mixing/dilution can lower the salinity of a fluid, reducing the concentrations of H+ and Cl− and decreasing the stability of metal complexes, leading to decomposition and precipitation, as follows:
ZnCl42− + PbC142− + 4H+ + 2FeS2 = ZnS↓ + PbS↓ + 2FeC142− + 2H2S
It is also consistent with the results of the C-O and H-O isotopes.
- (3)
- Fluid–rock reactions: Sphalerite and galena can precipitate as a result of fluid–rock reactions that cause carbonate dissolution and the consequent Ca (+Mg) enrichment of hydrothermal fluids, as follows:
ZnCl42− + PbC142− + 2H2S + CaMg(CO3)2 = ZnS↓ + PbS↓ + 8Cl− + Ca2+ + Mg2+ + 2H2CO3
6.5. Mineral Deposit Type
Although the Pb–Zn deposits within the Tuotuohe region are hosted by carbonates, the primary controls on mineralization are extensional fault structures that cross-cut the carbonates rather than the carbonates themselves. Fluid inclusions and C-H-O isotope compositions indicate that the ore-forming fluids were medium-low temperature, medium-low salinity, and low-density fluids that formed by mixing between magmatic and meteoric waters and that were affected by fluid–rock interaction. In addition, S–Pb isotope data suggest that Pb was sourced from Cenozoic volcanics in the study area. These characters are consistent with the Cordilleran-type vein deposits [69,70,71], which differ from the MVT-type deposits. However, Au was not found in the Pb–Zn deposits in the region, which have some differences from Cordilleran-type vein deposits. Combined, all of these data indicate that the Pb–Zn deposits of the Tuotuohe region are magmatism-related medium-low temperature hydrothermal vein deposits. Ref. [34] suggest that the trapping pressures during ore-forming stage 3 are estimated to range from ∼3 to 8 MPa and are mostly concentrated at 5 MPa, which would correspond to depths of 0.3–0.8 km, assuming hydrostatic conditions [72]. Hence, the initial Pb–Zn mineralization in the Chuduoqu Pb–Zn–Cu deposit mainly occurred at depths of less than 0.8 km, which is a shallow mineralization depth. This type of Pb–Zn mineralization depth generally does not exceed 2 km [32,37,39,41,73]. Since the homogenization temperature and isotope characteristics of the five deposits in the region are similar, this paper concludes that the mineralization of the Pb–Zn deposits in the area formed in the shallow area, and the latter degree of erosion varies as a result of the actual deposit of the mineral.
The geological setting and chronology of the formation of Pb–Zn deposits in adjacent regions suggest that the deposits in the study area formed as follows: The Asian–Indian continental collision began in the Paleocene, causing a thickening of the lower crust and associated delamination, fusion, and exhumation. Contemporaneous upwelling of hot asthenospheric material caused partial melting of the eclogitic lower crust, which combined with exhumation-generated adakitic magmas between 40 and 32 Ma [22]. These magmas ascended along structures and steadily exsolved mineralizing fluids. A reduction in temperature and pressure, fluid mixing, and fluid–rock interaction caused the formation of mineralization within the host structures and altered the S-C-O isotope composition of the mineralizing fluid.
7. Conclusions
- (1)
- The primary structural constraints on the location of Pb–Zn deposits within the Tuotuohe region are faults, although the deposits are primarily carbonate-hosted;
- (2)
- Fluid inclusion data for these deposits indicate that they formed from medium-low temperature, medium-low salinity, and low-density fluids;
- (3)
- Pb isotope compositions imply that the Pb within these deposits was derived from Cenozoic volcanics, and C-H-O-S isotope data indicate that the ore-forming fluid was a mixing of magmatic and meteoric water that was affected by wallrock interaction. Pb and Zn were transported in solution as chloride complexes and precipitated as a consequence of cooling, fluid mixing/dilution, and fluid–rock reactions;
- (4)
- The Pb–Zn deposits within the Tuotuohe region are magmatism-related medium-low temperature hydrothermal vein deposits.
Author Contributions
Conceptualization, Y.Q.; Writing—original draft, Y.Q.; Writing—review & editing, L.Z. and J.S. All authors have read and agreed to the published version of the manuscript.
Funding
This work was funded by the Natural Science Foundation of Jilin Province (20220101161JC), Shandong Provincial Engineering Laboratory of Application and Development of Big Data for Deep Gold Exploration (SDK202203), National Natural Science Foundation of China (41402060), Science and Technology Project of Department of Education, Jilin Province (JJKH20200946KJ), and Self-determined Foundation of Key Laboratory of Mineral Resources Evaluation in Northeast Asia, Ministry of Natural Resources (DBY-ZZ-19-13 and DBY-ZZ-19-15).
Data Availability Statement
Not applicable.
Acknowledgments
We thank Assistant Editor, and two anonymous referees for comments which helped in improving our manuscript and also thank Minxia Ma for funding support and help with analysis and testing.
Conflicts of Interest
The authors declare no conflict of interest.
References
- Hou, Z.Q.; Song, Y.C.; Li, Z.; Wang, Z.L.; Yang, Z.M.; Yang, Z.S.; Liu, Y.C.; Tian, S.H.; He, L.Q.; Chen, K.X.; et al. Thrust-controlled, sediments-hosted Pb-Zn-Ag-Cu deposits in eastern and northern margins of Tibetan orogenic belt: Geological features and tectonic model. Miner. Depos. 2008, 27, 123–144, (In Chinese with English Abstract). [Google Scholar]
- Dai, Z.X.; Bai, Y.; Wu, C.G.; Gu, F.; Zhu, M.Y.; Shang, X.Z. The Gold and Copper Mineralization in Western China and Its Adjacent Regions; Seismological Press: Beijing, China, 2001; p. 215. [Google Scholar]
- Deng, J.; Yang, L.Q.; Wang, C.M. Research advances of superimposed orogenesis and metallogenesis in the Sanjiang Tethys. Acta Petrol. Sin. 2011, 27, 2501–2509, (In Chinese with English Abstract). [Google Scholar]
- Hu, R.Z.; Turner, G.; Burnard, P.G.; Zhong, H.; Ye, Z.J.; Bi, X.W. Helium and argon isotopic geochemistry of Jinding superlarge Pb-Zn deposit. Sci. China Ser. D Earth Sci. 1998, 41, 442–448. [Google Scholar] [CrossRef]
- Huang, Z.L.; Li, W.B.; Chen, J.; Han, R.S.; Liu, C.Q.; Xu, C.; Guan, T. Carbon and oxygen isotope constraints on mantle fluidinvolvement in the mineralization of the Huize super-large Pb-Zn deposits, Yunnan Province, China. J. Geochem. Explor. 2003, 78, 637–642. [Google Scholar] [CrossRef]
- Song, Y.C.; Hou, Z.Q.; Yang, T.N.; Zhang, H.R.; Yang, Z.S.; Tian, S.H.; Liu, Y.C.; Wang, X.H.; Liu, Y.X.; Xue, C.D.; et al. Sediment-hosted Himalayan base metal deposits in Sanjiang region: Characteristics and genetic types. Acta Petrol. Et Mineral. 2011, 30, 355–380, (In Chinese with English Abstract). [Google Scholar]
- Wang, G.R.; Song, Y.C.; Zou, G.M.; Hou, Z.Q.; Yang, Z.S.; Yang, T.N.; Zhang, H.R.; Liu, Y.X.; Li, Z.; Wang, Y.K.; et al. History, current status, and next targets of exploration in the Chaqupacha Pb-Zn deposit, southern Qinghai Province. Acta Petrol. Et Miner. 2012, 31, 79–90. [Google Scholar]
- Liu, Y.C.; Hou, Z.Q.; Yang, Z.S.; Tian, S.H.; Song, Y.C.; Xue, W.W.; Wang, F.C.; Zhang, Y.B. Fluid inclusion constraints on the origin of Dongmozhazhua Pb-Zn ore deposit, Yushu area, Qinghai Province. Acta Petrol. Sin. 2010, 26, 1805–1819, (In Chinese with English Abstract). [Google Scholar]
- Liu, Y.C.; Yang, Z.S.; Hou, Z.Q.; Tian, S.H.; Wang, Z.L.; Song, Y.C.; Xue, W.W.; Lu, H.F.; Wang, F.C.; Zhang, Y.B.; et al. Geology and hydrogen, oxygen and carbon isotope geochemistry of Dongmozhazhua Pb-Zn ore deposit, Yushu area, Qinghai Province. Miner. Depos. 2009, 28, 770–784, (In Chinese with English Abstract). [Google Scholar]
- Tian, S.H.; Yang, Z.S.; Hou, Z.Q.; Gong, Y.L.; Liu, Y.C.; Song, Y.C.; Xue, W.W.; Lu, H.F.; Wang, F.C.; Zhang, Y.B. Rb-Sr and Sm-Nd isochron ages of Dongmozhazhua and Mohailaheng Pb-Zn ore deposits in Yushu area, southern Qinghai and their geological implications. Miner. Depos. 2009, 28, 747–758, (In Chinese with English Abstract). [Google Scholar] [CrossRef]
- Tian, S.H.; Yang, Z.S.; Hou, Z.Q.; Liu, Y.C.; Song, Y.C.; Wang, F.C.; Lu, H.F. Sulfur, lead, strontium and neodymium isotope compositions of the Dongmozhazhua lead-zinc ore deposit in the Yushu area, southern Qinghai: Implications for the sources of ore-forming material in the deposit. Acta Petrol. Sin. 2011, 27, 2173–2183, (In Chinese with English Abstract). [Google Scholar]
- Pan, G.T.; Xiao, Q.H.; Lu, S.N.; Deng, J.F.; Feng, Y.M.; Zhang, K.X.; Zhang, Z.Y.; Wang, F.G.; Xing, G.F.; Hao, G.J.; et al. Subdivision of tectonic units in China. Geol. China 2009, 36, 1–28, (In Chinese with English Abstract). [Google Scholar]
- Li, Y.L.; Wang, C.S.; Zhao, X.X.; Yin, A.; Ma, C. Cenozoic thrust system, basin evolution, and uplift of the Tanggula Range in the Tuotuohe region, central Tibet. Gondwana Res. 2012, 22, 482–492. [Google Scholar] [CrossRef]
- Liu, Y.X.; Hou, Z.Q.; Wang, G.H.; Jiang, X.J.; Li, Z.; Song, Y.C.; Wang, X.H. Basin evolutions of the Tuotuohe River basin and sedimentary response to the uplifting of the Qinghai-Tibet Plateau in the Paleogene-Neogene. Earth Sci. Front. 2011, 18, 65–76, (In Chinese with English Abstract). [Google Scholar]
- Mo, X.X.; Pan, G.T. From the Tethys to the formation of the Qinghai-Tibet Plateau: Constrained by tectono-magmatic events. Earth Sci. Front. 2006, 13, 43–51, (In Chinese with English Abstract). [Google Scholar]
- Pan, G.T.; Mo, X.X.; Hou, Z.Q.; Zhu, D.C.; Wang, L.Q.; Li, G.M.; Zhao, Z.D.; Geng, Q.R.; Liao, Z.L. Spatial-temporal framework of the Gangdese Orogenic Belt and its evolution. Acta Petrol. Sin. 2006, 22, 521–533, (In Chinese with English Abstract). [Google Scholar]
- Tapponnier, P.; Molnar, P. Slip-line field theory and large-scale continental tectonics. Nature 1976, 264, 319–324. [Google Scholar] [CrossRef]
- Molnar, P.; England, P.; Martinod, J. Mantle dynamics, uplift of the Tibetan Plateau, and the Indian monsoon. Rev. Geophys. 1993, 31, 357–396. [Google Scholar] [CrossRef]
- Luo, Z.H.; Mo, X.X.; Hou, Z.Q.; Deng, W.M.; Wang, J.H.; Zhao, Z.D.; Yu, X.H.; Li, J.P. An integrated model for the Cenozoic evolution of the Tibetan plateau: Constraints from igneous rocks. Earth Sci. Front. 2006, 13, 196–211, (In Chinese with English Abstract). [Google Scholar]
- Wu, F.Y.; Huang, B.C.; Ye, K.; Fang, A.M. Collapsed Himalayan-Tibetan orogen and the rising Tibetan Plateau. Acta Petrol. Sin. 2008, 24, 1–30, (In Chinese with English Abstract). [Google Scholar]
- Zhao, R.F.; Zhu, Y.T.; Zhou, Q.H.; Wang, M.C.; Li, J.X.; Sun, N.Y. Discovery of angular uncomformity below Triassic strata in the Yushu area, Qinghai. Geol. Bull. China 2004, 23, 616–619, (In Chinese with English Abstract). [Google Scholar]
- Qian, Y.; Tian, S.N.; Li, Y.J.; Sun, F.Y. Zircon U–Pb age and geochemical constraints on the origin and tectonic implication of the Tuotuohe Cenozoic alkaline magmatism in Qinghai–Tibet Plateau. Acta Geoc. 2020, 39, 67–84. [Google Scholar] [CrossRef]
- Qian, Y.; Sun, F.Y.; Li, B.L.; Li, S.J.; Zhao, J.W. Early Permian–Late Triassic magmatism in the Tuotuohe region of the Qinghai–Tibet plateau: Constraints on the tectonic evolution of the western segment of the Jinshajiang Suture. Acta Geol. Sin. (Engl. Ed.) 2014, 88, 498–516. [Google Scholar] [CrossRef]
- Sun, Y.G. Study on Ore-Controlling Structure Characteristics and Ore Genesis of Chuduoqu Lead-Zinc Mine in Tuotuohe Region, Qinghai Province. Master’s Thesis, Jilin University, Changchun, China, 2016. (In Chinese). [Google Scholar]
- Bodnar, R. Revised equation and table for determining the freezing point depression of H2O-NaCl solutions. Geochim. Et Cosmochim. Acta 1993, 57, 683–684. [Google Scholar] [CrossRef]
- Liu, B.; Shen, K. Thermodynamics of Fluid Inclusions; Geological Publishing House: Beijing, China, 1999; p. 290. [Google Scholar]
- Robinson, B.W.; Kusakabe, M. Quantitative preparation of sulfur dioxide, for sulfur-34/sulfur-32 analyses, from sulfides by combustion with cuprous oxide. Anal. Chem. 1975, 47, 1179–1181. [Google Scholar] [CrossRef]
- Li, Z. The Ore Forming Genesis Research of Chaqupacha Lead-Zinc Deposits in Qinghai Province Tuotuohe Area. Master’s Thesis, University of Science and Technology, Beijing, China, 2008; pp. 58–64, (In Chinese with English Abstract). [Google Scholar]
- Todt, W.; Cliff, R.; Hanser, A.; Hofmann, A. Re-calibration of NBS lead standards using a 202Pb + 205Pb double spike. Terra Abstr. 1993, 5, 396. [Google Scholar]
- Clayton, R.N.; Mayeda, T.K. The use of bromine pentafluoride in the extraction of oxygen from oxides and silicates for isotopic analysis. Geochim. Cosmochim. Acta 1963, 27, 43–52. [Google Scholar] [CrossRef]
- Friedman, I.; O’Neil, J.R. Compilation of stable isotope fractionation factors of geochemical interest. In Data of Geochemistry; Fleischer, M., Ed.; United States Geological Survey: Reston, VI, USA, 1977; pp. kk1–kk440. [Google Scholar]
- Shafaroudi, A.M.; Karimpour, M.H. Mineralogic, fluid inclusion, and sulfur isotope evidence for the genesis of Sechangi lead–zinc (–copper) deposit, Eastern Iran. J. Afr. Earth Sci. 2015, 107, 1–14. [Google Scholar] [CrossRef]
- Qu, G.Y.; Wang, K.Y.; Yang, H.; Sun, Q.F.; Li, J.; Cai, W.Y.; Lai, C.K. Fluid inclusions, H-O-S-Pb isotopes and metallogenic implications of Triassic Hua’naote Ag-Pb-Zn deposit (Inner Mongolia, China) in the eastern Central Asian Orogenic Belt. J. Geochem. Explor. 2021, 225, 106766. [Google Scholar] [CrossRef]
- Sun, Y.G.; Li, B.L.; Sun, F.Y.; Qian, Y.; Yu, R.T.; Zhao, T.F.; Dong, J.L. Ore Genesis of the Chuduoqu Pb-Zn-Cu Deposit in the Tuotuohe Area, Central Tibet: Evidence from Fluid Inclusions and C–H–O–S–Pb Isotopes Systematics. Minerals 2019, 9, 285. [Google Scholar] [CrossRef]
- Marques de Sá, C.; Noronha, F.; Cardellach, E.; Bobos, I. Fluid inclusion and (S, C, O, Pb) isotope study of Pb-Zn-(Cu-Ag) hydrothermal veins from Central and Northern Portugal—Metallogenic implications. Ore Geol. Rev. 2019, 112, 103043. [Google Scholar] [CrossRef]
- Zhang, Y.C.; Gao, S.B.; Zheng, Y.Y.; Jiang, J.S.; Zhang, S.Z.; Jiang, X.J.; Guo, X.R. Mineralogy, fluid inclusions and C–H–O–S–Pb isotopes of the Palaeocene Longgen Pb-Zn deposit in the western Nyainqentanglha belt, Tibet. Ore Geol. Rev. 2018, 102, 18–43. [Google Scholar] [CrossRef]
- Yu, G.Y.; Li, S.D.; Wang, Y.C.; Wang, K.Y. Fluid Evolution and Ore Genesis of the Qibaoshan Polymetallic Ore Field, Shandong Province, China: Constraints from Fluid Inclusions and H–O–S Isotopic Compositions. Minerals 2019, 9, 394. [Google Scholar] [CrossRef]
- Yang, S.S.; Wang, H.; Zhu, X.Y.; Zou, T.; Yang, C.L.; Jiang, H.Y.; Jiang, B.B.; Cheng, X.Y.; Li, Y.J. The Metallogenic Mechanism of Skarn Sn-Polymetallic Deposits in the Southern Great Khingan Range, China: Constraints on the Geological and Geochemical Characteristics of Damogutu Sn–Fe and Dashishan Sn–Pb–Zn Deposits. Minerals 2019, 9, 418. [Google Scholar] [CrossRef]
- Li, S.D.; Chen, C.; Gao, L.L.; Xia, F.; Zhang, X.B.; Wang, K.Y.; Arkin, K. Ore Genesis of the Kuergasheng Pb–Zn Deposit, Xinjiang Province, Northwest China: Constraints from Geology, Fluid Inclusions, and H–O–C–S–Pb Isotopes. Minerals 2020, 10, 592. [Google Scholar] [CrossRef]
- Ke, L.L.; Zhang, H.Y.; Liu, J.J.; Zhai, D.G.; Guo, D.H.; Yang, J.K.; Tan, Q.; Xu, Y.W.; Zhang, M.; Wang, S.G. Fluid Inclusion, H-O, S, Pb and noble gas isotope studies of the Aerhada Pb-Zn-Ag deposit, Inner Mongolia, NE China. Ore Geol. Rev. 2017, 88, 304–316. [Google Scholar] [CrossRef]
- Borojević Šoštarić, S.; Palinkaš, L.A.; Neubauer, F.; Hurai, V.; Cvetković, V.; Roller-Lutz, Z.; Mandić, M.; Genser, J. Silver-base metal epithermal vein and listwanite hosted deposit Crnac, Rogozna Mts., Kosovo, part II: A link between magmatic rocks and epithermal mineralization. Ore Geol. Rev. 2013, 50, 98–117. [Google Scholar] [CrossRef]
- Shepherd, T.J.; Rankin, A.H.; Alderton, D.H.M. A Practical Guide to Fluid Inclusion Studies; Blackie and Son Ltd.: London, UK, 1985. [Google Scholar]
- Conliffe, J.; Wilton, D.H.C.; Blamey, N.J.F.; Archibald, S.M. Paleoproterozoic Mississippi Valley Type Pb–Zn mineralization in the Ramah Group, Northern Labrador: Stable isotope, fluid inclusion and quantitative fluid inclusion gas analyses. Chem. Geol. 2013, 362, 211–223. [Google Scholar] [CrossRef]
- Liu, H.G. Research on provenance of MVT Pb-Zn deposits. IOP Conf. Ser. Mater. Sci. Eng. 2017, 207, 012108. [Google Scholar] [CrossRef]
- Wu, T.; Huang, Z.L.; He, Y.F.; Yang, M.; Fan, H.F.; Wei, C.; Ye, L.; Hu, Y.S.; Xiang, Z.H.; Lai, C.K. Metal source and ore-forming process of the Maoping carbonate-hosted Pb-Zn deposit in Yunnan, SW China: Evidence from deposit geology and sphalerite Pb-Zn-Cd isotopes. Ore Geol. Rev. 2021, 135, 104214. [Google Scholar] [CrossRef]
- Liu, Y.C.; Song, Y.C.; Hou, Z.Q.; Xi, D.P.; Li, S.P.; Yue, L.L.; Ma, W.; Tang, B.L. Palynological constraints on the age of the Mississippi Valley-type Changdong Pb-Zn deposit, Sanjiang belt, West China. Sci. China Earth Sci. 2021, 65, 167–181. [Google Scholar] [CrossRef]
- Zhong, R.C.; Brugger, J.; Chen, Y.J.; Li, W.B. Contrasting regimes of Cu, Zn and Pb transport in ore-forming hydrothermal fluids. Chem. Geol. 2015, 395, 154–164. [Google Scholar] [CrossRef]
- Saeidabadi, Z.K.; Karimpour, M.H.; Shafaroudi, A.M.; Rahimi, B.; Corfu, F. Origin of the Kaviro lead deposit in the Neyganan area, Lut Block, Eastern Iran: Constraints from geology, fluid inclusions, and isotope geochemistry. J. Geochem. Explor. 2018, 192, 85–102. [Google Scholar] [CrossRef]
- Zartman, R.; Doe, B. Plumbotectonics—The model. Tectonophysics 1981, 75, 135–162. [Google Scholar] [CrossRef]
- Stacey, J.S.; Kramers, J. Approximation of terrestrial lead isotope evolution by a two-stage model. Earth Planet. Sci. Lett. 1975, 26, 207–221. [Google Scholar] [CrossRef]
- Wang, R.L.; Zeng, Q.D.; Zhang, Z.C.; Guo, Y.P.; Zhang, Z.; Zhou, L.L.; Wang, X.W.; Yu, B. Genesis of the Aobaotu Pb–Zn deposit in the southern Great Xing’an Range, NE China: Constraints from geochronology and C–H–O–S–Pb isotopic and fluid inclusion studies. Geol. J. 2022, 57, 1391–1412. [Google Scholar] [CrossRef]
- Zhao, Z.D.; Mo, X.X.; Dong, G.C.; Zhou, S.; Zhu, D.C.; Liao, Z.L.; Sun, C.G. Pb isotopic Geochemistry of Tibetan Plateau and its implications. Geoscience 2007, 21, 265–274, (In Chinese with English Abstract). [Google Scholar]
- Zhu, B.Q. The Theory and Application of the Isotopic Systematic in Geoscience Concurrent Discussion of the Continental Crust and Mantle Evolvement in China; Science Publishing House: Beijing, China, 1998; p. 330. [Google Scholar]
- Hoefs, J. Stable Isotope Geochemistry; Springer: Berlin/Heidelberg, Germany, 2009; p. 285. [Google Scholar]
- Harris, A.C.; Golding, S.D.; White, N.C. Bajo de la Alumbrera copper-gold deposit: Stable isotope evidence for a porphyry-related hydrothermal system dominated by magmatic aqueous fluids. Econ. Geol. 2005, 100, 863–886. [Google Scholar] [CrossRef]
- Sun, G.T.; Zeng, Q.D.; Zhou, J.X.; Zhou, L.L.; Chen, P.W. Genesis of the Xinling vein-type Ag-Pb-Zn deposit, Liaodong Peninsula, China: Evidence from texture, composition and in situ S-Pb isotopes. Ore Geol. Rev. 2021, 133, 104120. [Google Scholar] [CrossRef]
- Schwarcz, H.; Burnie, S. Influence of sedimentary environments on sulfur isotope ratios in clastic rocks: A review. Miner. Depos. 1973, 8, 264–277. [Google Scholar] [CrossRef]
- Hao, H.D.; Song, Y.C.; Li, L.S.; Jia, Z.Y.; Wang, Y.K.; Liu, Q. Characteristics of Breccias and C-O-Sr-S Isotope Geochemistry of the Duocaima Pb-Zn Deposit in Tuotuohe, Qinghai Province: Implications for the Ore-forming Process. Acta Geol. Sin. Engl. Ed. 2015, 89, 1568–1587. [Google Scholar]
- Yao, F.L.; Sun, F.Y. (Eds.) Mineralogy Tutorial; Geological Publishing House: Beijing, China, 2005. (In Chinese) [Google Scholar]
- Taylor, H.P. The Application of Oxygen and Hydrogen Isotope Studies to Problems of Hydrothermal Alteration and Ore Deposition. Econ. Geol. 1974, 69, 843–883. [Google Scholar] [CrossRef]
- Taylor, H.P., Jr.; Frechen, J.; Degens, E.T. Oxygen and carbon isotope studies of carbonatites from the Laacher See district, West Germany and the Alnö district, Sweden. Geochim. Et Cosmochim. Acta 1967, 31, 407–430. [Google Scholar] [CrossRef]
- Li, Y.; Ren, Y.S.; Hao, Y.J.; Yang, Q. Ore-forming fluid characteristics and genesis of vein-type lead-zinc mineralization of Xiaohongshilazi deposit, Jilin Province, China. Glob. Geol. 2017, 20, 191–199. [Google Scholar]
- Liu, Y.F.; Qi, H.W.; Bi, X.W.; Hu, R.Z.; Qi, L.K.; Yin, R.S.; Tang, Y.Y. Two types of sediment-hosted Pb-Zn deposits in the northern margin of Lanping basin, SW China: Evidence from sphalerite trace elements, carbonate C-O isotopes and molybdenite Re-Os age. Ore Geol. Rev. 2021, 131, 104016. [Google Scholar] [CrossRef]
- Fareeduddin; Venkatesh, B.R.; Hanumantha, R.; Golani, P.R.; Sharma, B.B.; Neogi, S. Petrology and Stable Isotope (S, C, O) Studies of Selected Sedimenthosted Basemetal Ore Deposits in the Proterozoic Aravalli-Delhi Fold Belt, Rajasthan. J. Geol. Soc. India 2014, 83, 119–141. [Google Scholar] [CrossRef]
- Veizer, J.; Hoefs, J. The nature of 18O/16O and 13C/12C secular trends in sedimentary carbonate rocks. Geochim. Et Cosmochim. Acta 1976, 40, 1387–1395. [Google Scholar] [CrossRef]
- Landtwing, M.; Pettke, T.; Halter, W.; Heinrich, C.; Redmond, P.; Einaudi, M.; Kunze, K. Copper deposition during quartz dissolution by cooling magmatichydrothermal magmatic-hydrothermal fluids: The Bingham porphyry. Earth Planet. Sci. Lett. 2005, 235, 229–243. [Google Scholar] [CrossRef]
- O’Neil, J.R.; Silberman, M.L. Stable isotope relations in epithermal Au-Ag deposits. Econ. Geol. 1974, 69, 902–909. [Google Scholar] [CrossRef]
- Beane, R.; Titley, S. Porphyry copper deposits; Part II: Hydrothermal alteration and mineralization. Econ. Geol. 1981, 75, 235–269. [Google Scholar]
- Sawkins, F.J. Sulfide ore deposits in relation to plate tectonics. J. Geol. 1972, 80, 377–397. [Google Scholar] [CrossRef]
- Benedezú, R.; Fonteboté, L. Cordilleran Epithermal Cu-Zn-Pb-(Au-Ag) Mineralization in the Colquijirca District, Central Peru: Deposit-Scale Mineralogical Patterns. Econ. Geol. 2009, 104, 905–944. [Google Scholar] [CrossRef]
- Kissin, S.A.; Mango, H. Silver vein deposits. In Treatise on Geochemistry, 2nd ed.; Elsevier: Oxford, UK, 2014; pp. 425–432. [Google Scholar]
- Sibson, R.H.; Robert, F.; Poulsen, K.H. High angle reverse faults, fluid-pressure cycling, and mesothermal gold-quartz deposits. Geology 1988, 16, 551–555. [Google Scholar] [CrossRef]
- Wu, J.; Li, Z.; Zhu, M.J.; Huang, W.T.; Liao, J.; Zhang, J.; Liang, H.Y. Genesis of the Beixiang Sb-Pb-Zn-Sn Deposit and Polymetallic Enrichment of the Danchi Sn-Polymetallic Ore Belt in Guangxi, SW China. Minerals 2022, 12, 1349. [Google Scholar] [CrossRef]


Disclaimer/Publisher’s Note: The statements, opinions and data contained in all publications are solely those of the individual author(s) and contributor(s) and not of MDPI and/or the editor(s). MDPI and/or the editor(s) disclaim responsibility for any injury to people or property resulting from any ideas, methods, instructions or products referred to in the content. |
© 2023 by the authors. Licensee MDPI, Basel, Switzerland. This article is an open access article distributed under the terms and conditions of the Creative Commons Attribution (CC BY) license (https://creativecommons.org/licenses/by/4.0/).