Article

Study the Mechanical Properties of Geopolymer under Different Curing Conditions

1
School of Civil Engineering, Northeast Forestry University, Harbin 150040, China
2
Liaoning Communication Planning and Design Institute Co., Ltd., Shenyang 110121, China
3
Advanced Structures and Composites Center, University of Maine, Orono, ME 04469, USA
*
Author to whom correspondence should be addressed.
Minerals 2023, 13(5), 690; https://doi.org/10.3390/min13050690
Submission received: 20 March 2023 / Revised: 11 May 2023 / Accepted: 16 May 2023 / Published: 18 May 2023
(This article belongs to the Special Issue Alkali-Activated Binders)

Abstract

:
The geopolymer is an environmentally friendly and high-performance material. Nowadays, how to improve the degree of the geopolymer’s reaction and enhance its mechanical properties has become a hot topic. This study used orthogonal tests to design the precursor mixing ratio, considering GGBS content (A), water/binder ratio (B), and alkaline activator modulus (C). The fly ash (FA) ground granulated blast furnace slag (GGBS)-based geopolymers were cured under two standard curing conditions: 40 °C under water and 40 °C in the oven. Then, the influence of these factors on the mechanical properties of geopolymers under different curing conditions was summarized. The contribution of each factor was ranked, which was used to find out the most sensitive factors affecting the mechanical properties. Taking the 7 days and 28 days of compressive strength and flexural strength of the geopolymer specimens as the evaluation criteria, the optimum ratio method for preparing geopolymers was obtained. Then, the prediction model of compressive strength under different curing conditions was established. SEM and XRD were used to analyze the microstructure and hydration products of the samples. The test results showed that the optimum ratio of FA-based geopolymers varied under different curing conditions. The GGBS content was the key factor in determining the mechanical properties. The heat curing condition was the best curing condition, the 28-day compressive strength could reach 76.3 MPa, and the 28-day flexural strength could reach 7.4 MPa. The prediction models established for compressive strength under different curing conditions had high accuracy. The specimens under the best curing conditions exhibited a dense internal microstructure and the presence of C-S-H gels, C-A-S-H gels, and N-A-S-H gels.

1. Introduction

Concrete has been the most widely used building material across the world. The binder used to produce it is usually ordinary Portland cement (OPC). OPC is the most widely used cementitious material in the construction industry [1]. However, the production of OPC requires a high calcination temperature and directly generates large amounts of CO2 [2] into the atmosphere, which leads to the greenhouse effect [3]. The loss of economy and the destruction of the environment make the shortcomings of OPC evident. It was reported that the production of 1 t of cement produces about 1 t of CO2 [4], and the cement industry accounts for 5–7% [4] of the total global CO2 emissions. It was estimated that the annual production of cement will increase by 50% by 2050 [5,6]. Energy consumption and environmental concerns caused by cement production have become increasingly prominent. Therefore, it is urgent to find a valuable alternative to the OPC material.
The geopolymer is a new type of inorganic cementitious material and a low-carbon, environmentally friendly building material that is one of the most competitive green building materials to replace OPC [2,7]. The amount of carbon dioxide emitted by the preparation of geopolymers is about six times lower than that of OPC concrete [8]. It has promising high performance [9], low energy consumption, and green environmental protection [10,11,12]. Simultaneously, the source of raw materials for preparing geopolymers is wide; thus, it has broad application prospects. The general formula describing the chemical composition of geopolymers is Mn{-(Si-O2)z-Al-O}n·wH2O, where z is 1, 2, or 3, M is an alkaline cation (such as potassium, sodium, or calcium), and n is the degree of polymerization [13,14,15]. The geopolymer is mainly a cementitious material with a three-dimensional Si-O-Al network formed by the reaction of aluminosilicate minerals or industrial by-products with an alkaline activator [16,17]. Materials rich in silicon, such as FA, GGBS, and rice husk, as well as aluminum-rich materials such as metakaolin and bentonite [18], are largely derived from industrial by-products [19]. Alkaline activators such as NaOH, Na2SiO3, Na2SO4, K2CO3, and KOH [20,21] have relatively low energy consumption and minimal CO2 emissions during the configuration process, making them sustainable and green materials. The polymerization process consists of three steps: dissolution, precipitation, and polycondensation. These three steps occur almost simultaneously, which is a complex process [22]. In addition, polymerization is also an exothermic process [23], which is greatly affected by the chemical composition of the binder and alkaline solution. While FA and GGBS are commonly used binders in geopolymer preparation, low-calcium FA usually requires high-temperature curing to achieve superior mechanical properties and has a slow increase in strength under environmental curing conditions [24]. GGBS is characterized by rapid solidification and low workability [25,26]. These reasons may limit their wide application in industry. The FA and GGBS mixed compound can be cured at room temperature and further deliver good mechanical properties in a short period. Despite studies on FA-based geopolymers being carried out for 40 years [27], research has mainly focused on the mixing ratio of raw materials [25,28]. Generally, it has been discovered that replacing FA with GGBS contributes to an increase in compressive strength [29].
Importantly, the types of raw materials, the mixing ratio of the raw materials, the type and concentration of the activators, the curing methods, and the curing time all play crucial roles in the delivery of mechanical properties of the geopolymer [20,21,30,31]. In a study conducted by Osama A. Mohamed [32], the effect of soaking mortar in a high acid solution on compressive strength was studied by using 100% slag, 75% slag and 25% fly ash, and 50% slag and 50% fly ash. After 28 days of soaking in a sulfuric acid solution, the mortar containing 75% slag and 25% fly ash had the highest compressive strength of 87 MPa, confirming the beneficial effect of water as a curing medium. Further research conducted by Hamidreza Khalili et al. [33] indicated that changing both the curing method and alkali activator content could significantly improve compressive strength. Under room temperature curing, Ayoub Dehghani et al. [34] discussed the effect of the initial molar ratio of SiO/AlO on the mechanical properties of fly-ash-based geopolymers. The results showed that the compressive strength changed with the SiO/AlO ratio, and the maximum compressive strength was obtained when the SiO/AlO ratio was 3.37 (Si/Al = 1.68). The higher compressive strength at this ratio may be related to the alumina-silica bonding in the amorphous region. Apriany Saludung et al. [35] examined various curing methods, including thermal curing, environmental curing, water curing, and heat and water combined curing on the mechanical properties of a fly ash-based geopolymer prepared and showed that different curing methods had a large effect on the mechanical properties of the geopolymer. All samples maintained adequate compressive strength at a maximum temperature of 950 °C. M.S. El-Feky et al. [36] researched the compressive strength of slag geopolymer pastes by air curing, water curing, microwave curing, and oven curing under the same mix ratio. The results proved that microwave curing was more conducive to obtaining higher early strengths than other curing methods, and microwave radiation significantly shortened the thermal curing time.
The influence of curing conditions on the synthesis and mechanical properties of geopolymers is evident [37,38]. Previous studies mainly focused on the effect of various curing methods on the mechanical properties of geopolymers with a single mix ratio or the effect of standard curing methods on the mechanical properties of geopolymers with multiple mix ratios. There are few reports on the influence of manifold factors on the geopolymer’s optimal preparation under different curing conditions. In particular, information on the mechanism of geopolymerization reactions is more limited. Furthermore, it is noteworthy that high mechanical properties of special concrete can be achieved through curing conditions, which is also extremely meaningful for finding methods to improve the mechanical properties of geopolymers. To make up for the deficiencies of previous research work, orthogonal tests would be designed to prepare nine types of geopolymer pastes with a total of 162 specimen samples, considering the effects of GGBS content, water/binder ratio, and alkaline activator modulus. Then, the effects of the standard curing (SC), 40 °C water curing (WC), and 40 °C heat curing (HC) conditions on the mechanical properties of the nine geopolymer pastes would be analyzed by range and variance. Then, the prediction model of compressive strength under different curing conditions was established. The effects of different curing conditions on the microstructure and hydration products of FA-based geopolymers would be characterized by SEM and XRD. This study can provide a reference for the preparation of geopolymers and present curing methods that meet the strength requirements of engineering practice.

2. Materials and Methods

2.1. Materials

The main materials of the prepared samples included precursors (FA and GGBS) and alkaline, and the raw materials of FA and GGBS used in the test were from the Jiahao Mineral Powder Plant in Lingshou County, Hebei Province, China. The particle sizes of both FA and GGBS were 38 μm. According to the microscopic morphology of SEM, FA was characterized by a continuous spherical structure with a smooth surface, as presented in Figure 1a, while GGBS exhibited irregular and angular particles, as shown in Figure 1b. The chemical composition and physical properties of FA and GGBS are shown in Table 1. It can be seen that FA and GGBS provided a large amount of soluble Si and Al elements for the polymerization system, and the GGBS was S95 grade with high CaO content.
Alkaline activators were synthesized from water glass (Na2SiO3), flake sodium hydroxide (NaOH), and water. Industrial-grade water glass was obtained from Jinan Qianqi Chemical Co., Ltd. According to the product information provided by the merchant and verified before the test, the alkaline activator modulus was 3.29, Na2O was 8.62%, SiO2 was 27.44%, and the solid content was 39.7 wt%. NaOH flakes with a purity of 99% were provided by Linlanshan Trading Company in Shijiazhuang, Hebei Province. The water was laboratory tap water.

2.2. Orthogonal Test Design

Orthogonal tests were designed without considering the interaction. It was an efficient, fast, and economical experimental design method to select some representative level combinations for the orthogonal test. The optimum ratio of compressive and flexural strength of geopolymers under different curing conditions was optimized. SEM and XRD microscopic methods were used to analyze the microstructure and hydration products.
In this study, compressive strength and flexural strength were used as evaluation indexes, using three factors and three levels of orthogonal design table L9(33), for a total of nine groups of test programs. The effects of GGBS content, water/binder ratio, and alkaline activator modulus on the mechanical properties of FA-GGBS-based geopolymers were analyzed. Three levels were set for each factor level: GGBS content of 30%, 50%, and 70% [39,40,41,42]; water/binder ratio of 0.36, 0.39, and 0.42; and alkaline activator modulus of 1.2, 1.4, and 1.6 [43,44]. Each factor level was determined by previous research results and a large number of pre-test results [39,40,41,42,43,44]. The extent of the contribution of the three factors to the mechanical properties of the geopolymer was summarized based on the experimental results, and the optimal ratio for preparing the geopolymer was obtained. Details of the design of the three-factor, three-level orthogonal test are given in Table 2. More detailed data on the preparation of geopolymer precursors are provided in Table 3.

2.3. Sample Preparation and Curing

The whole preparation process included the mixing of dry materials, the preparation of wet materials, casting, demolding, and curing. The flow chart for sample preparation is shown in Figure 2. After being prepared and completely hardened, the specimens were demolded and cured for 7 and 28 days, respectively, for compressive and flexural strength tests.
Firstly, a mixed solution of sodium silicate, sodium hydroxide, and water of the corresponding modulus was prepared. The process was exothermic, sealed after stirring and dissolving, and cooled at room temperature for 1 day. Following that, the FA and GGBS were poured into the stirring pot and stirred for 2 min at low speed to fully integrate the solid raw materials, and then the alkaline activator was added to the stirring pot and stirred for 4 min, including 2 min at low speed and 2 min at high speed, for a total of 6 min. Next, the fresh geopolymer paste was poured into a 40 mm × 40 mm × 160 mm plastic mold, which was pre-coated with the engine oil produced in Zhenjiang City, Jiangsu Province. At this time, to reduce the bubbles and fluid inhomogeneity generated inside the specimen during the casting process, the mold was placed on a vibrating table and vibrated at a low frequency for 30 s. The surface of the specimen was scraped flat with a steel ruler. The surface of the specimen was sealed with polyethylene plastic film to avoid moisture evaporation. The require geopolymer samples were prepared according to the same preparation process and demolded after 1 day of standard curing (temperature of 20 ± 3 °C and humidity of 95%) [45,46], and the prepared geopolymer samples were cured under three different curing conditions. For standard curing, the specimens were tested after curing for 7 and 28 days, respectively. For water curing, the specimens were put into water curing at 40 °C for 24 h, followed by standard curing, and tested after curing at 7 and 28 days of age. For heat curing, specimens were placed in a 40 °C oven for 1 h, then standard cured and tested after curing at 7 and 28 days of age.

2.4. Mechanical Properties Test

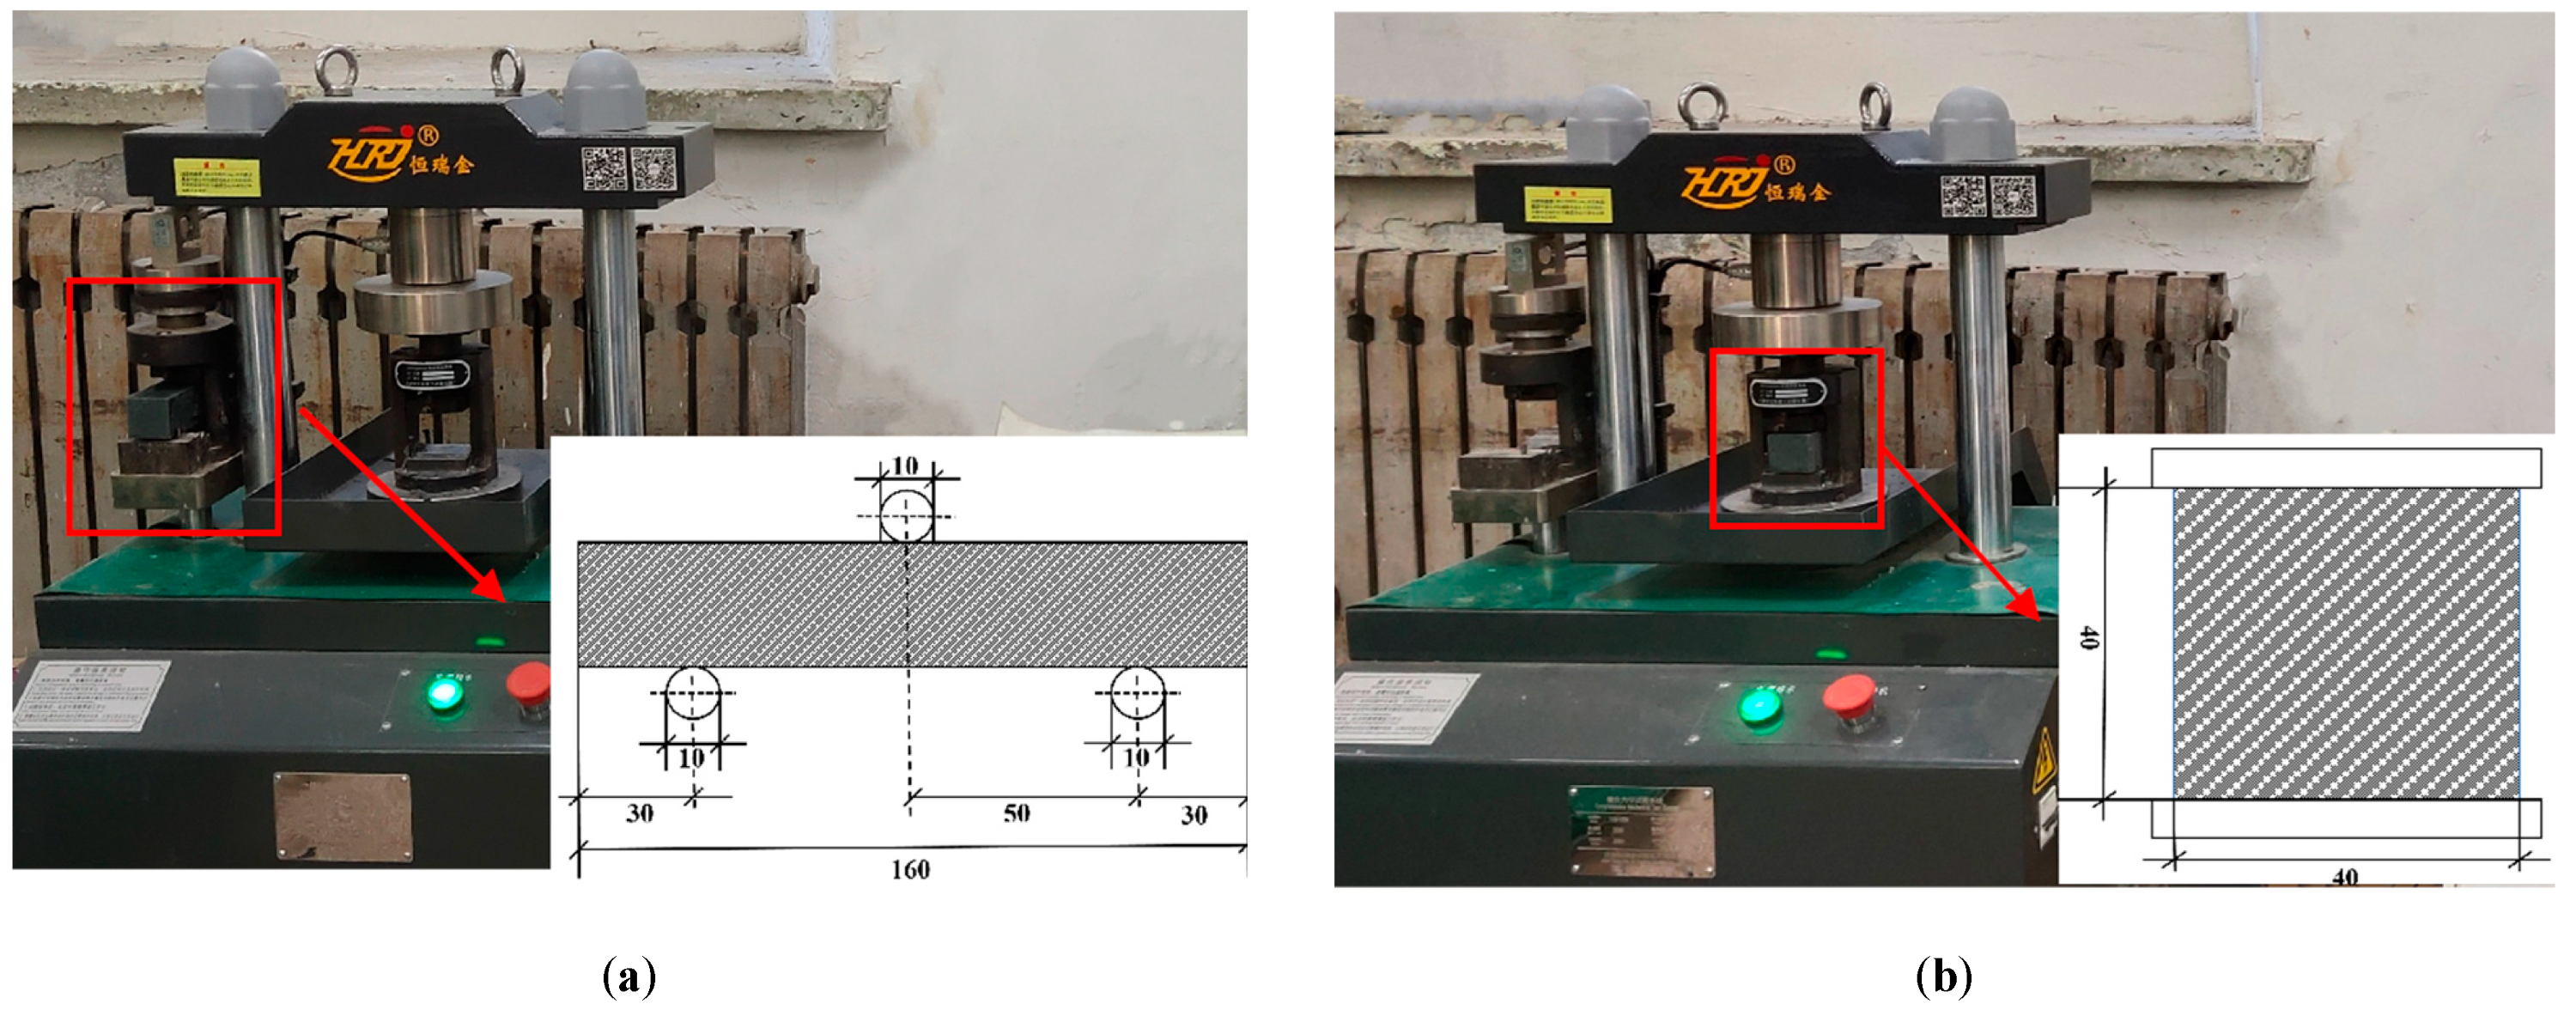
The compressive strength and flexural strength were determined according to the Chinese Standard Specifications GB/T17671-1999(ISO) [47]. The flexural strength and compressive strength were measured by a cement compression bending testing machine (Jinan Hengruijin Testing Machine Co., Ltd., Jinan, China). The flexural strength test was carried out at a loading rate of 50 N/s, and the flexural strength of the geopolymer was obtained from the average of the three samples. After the flexural strength test, each sample was divided into two parts, and the compressive strength test was performed at a loading rate of 2400 N/s. The compressive strength was obtained by taking the average of the six samples. The combination of the physical diagram and the schematic diagram of the flexural strength test and compressive strength test of the geopolymer specimens is shown in Figure 3. For flexural strength, the three vertical planes through the three cylindrical axes should be parallel. The upper cylindrical axis was at the center of the specimen, and the centers of the lower two cylindrical axes were 30 mm from the two end edges of the specimen and 50 mm from the center of the specimen, respectively [47]. In the compression test, the vertical axis of the piston of the press coincided with the vertical axis of the press, and the resultant force of the piston action should pass through the center of the specimen [47].

2.5. Microstructure Test

The microscopic morphology of the sample fracture was observed by a new high-resolution field emission scanning electron microscope (SEM) SU8020 produced by HITACHI in Tokyo, Japan. After the compressive strength test, the unstressed specimens were collected to avoid microdamage, the size was about 10 mm × 10 mm × 5 mm of material, and the specimens were Au coated before the test. At the same time, the collected specimens were ground into powder. The X-ray diffraction (XRD) test was conducted on a Smart Lab (9) to analyze the phase change in the specimen, with a scanning range of 10°~80°, a step size of 0.02°, and a scanning speed of 5°/min.

3. Results and Discussion

3.1. The Optimum Ratio under Standard Curing

3.1.1. Visual Analysis of Standard Curing Mechanical Property Test Results

The compressive strength and flexural strength of 7 days and 28 days were used as the evaluation indexes of the orthogonal test. Figure 4 shows the results of geopolymer mechanical properties testing. As can be seen from the figure, the compressive strength and flexural strength of 7 days are higher than 28 days, which is attributed to the continuation of the geopolymerization reaction, where the hydration gel increases with age and fills the pores of the geopolymer samples to form a dense structure [48], increasing the strength. The compressive strength ranges from 18.3 to 50.3 MPa and 28.4 to 58.2 Mpa for 7 days and 28 days, respectively. The flexural strength ranges from 2.5 to 5.9 Mpa and 3.1 to 6.9 Mpa for 7 days and 28 days, respectively. The compressive strength and flexural strength of specimen 8 reached their best at 7 days and 28 days, respectively. The samples obtained sufficient mechanical properties in the early stages.

3.1.2. Results of Mechanical Property Testing under Standard Curing by Range Analysis

The results of the 7 days and 28 days of compressive strength and flexural strength of geopolymer were analyzed by range analysis, and the contribution of each factor to the mechanical properties of geopolymer was evaluated. The specific range analysis results are shown in Table 4.
Among them, Equation (1):
Rj = max{kji} − min{kji}
where i (i = 1, 2, and 3) is the level number, and j (j = A, B, and C) represents a certain factor.
Equation (2):
kji = Kji/kj
where Kji is the sum of the specified indices for all levels in each factor j; kj is the overall level of the relevant factor [49].
As can be seen from Table 4, the degree of contribution of each factor to the 7 d and 28 d compressive strengths of geopolymers is ranked as A > C > B according to the Rj value. The larger the Rj value, the greater the contribution of the factor to the 7 days and 28 days compressive strengths, i.e., the GGBS content has the greatest effect on the 7 days and 28 days compressive strengths, followed by the alkaline activator modulus, and the water/binder ratio has the least effect. Among them, the 7 days compressive strength factor (GGBS content) is much greater than the other two factors. Regarding the ki value, there is an inflection point change in the results of the factor level calculation, which does not obey a single trend. For example, at 7 days of compressive strength, the factor of water/binder ratio is less than 0.39, showing an increasing trend, but, with the increase in the water/binder ratio, its compressive strength decreases. It can be seen that a water/binder ratio of 0.39 is the best choice for the preparation of the geopolymer. The level with the largest ki value among the factors is the optimal level, thus the best combination of the fitting ratio for the preparation of geopolymers under standard curing was obtained by the orthogonal test with range analysis as a GGBS content of 70%, a water/binder ratio of 0.39, and an alkaline activator modulus of 1.2. In the test, the compressive strength of the geopolymer prepared with this ratio was the highest, reaching 50.3 MPa and 58.2 MPa at 7 days and 28 days, respectively, which also proved the correctness of the orthogonal test to a certain extent. Similarly, the degree of contribution of each factor to the 7 days and 28 days flexural strengths of geopolymers was ranked as A > C > B. As can be found in Table 4, the preparation of the geopolymer for 7 days and 28 days corresponding to the best ratio is consistent with the compressive strength, with a GGBS content of 70%, a water/binder ratio of 0.39, and an alkaline activator modulus of 1.2. Under this scheme, the 7 d and 28 d flexural strengths of the specimens were 5.9 MPa and 6.9 MPa, respectively. On 28 d, the flexural strength, the difference between GGBS content and factor alkaline activator modulus Rj values is not large, and both are greater than the water/binder ratio, indicating that factor GGBS content and alkaline activator modulus play a vital role in the growth of flexural strength in the later period, while the water/binder factor ratio has a significantly weaker effect on flexural strength.
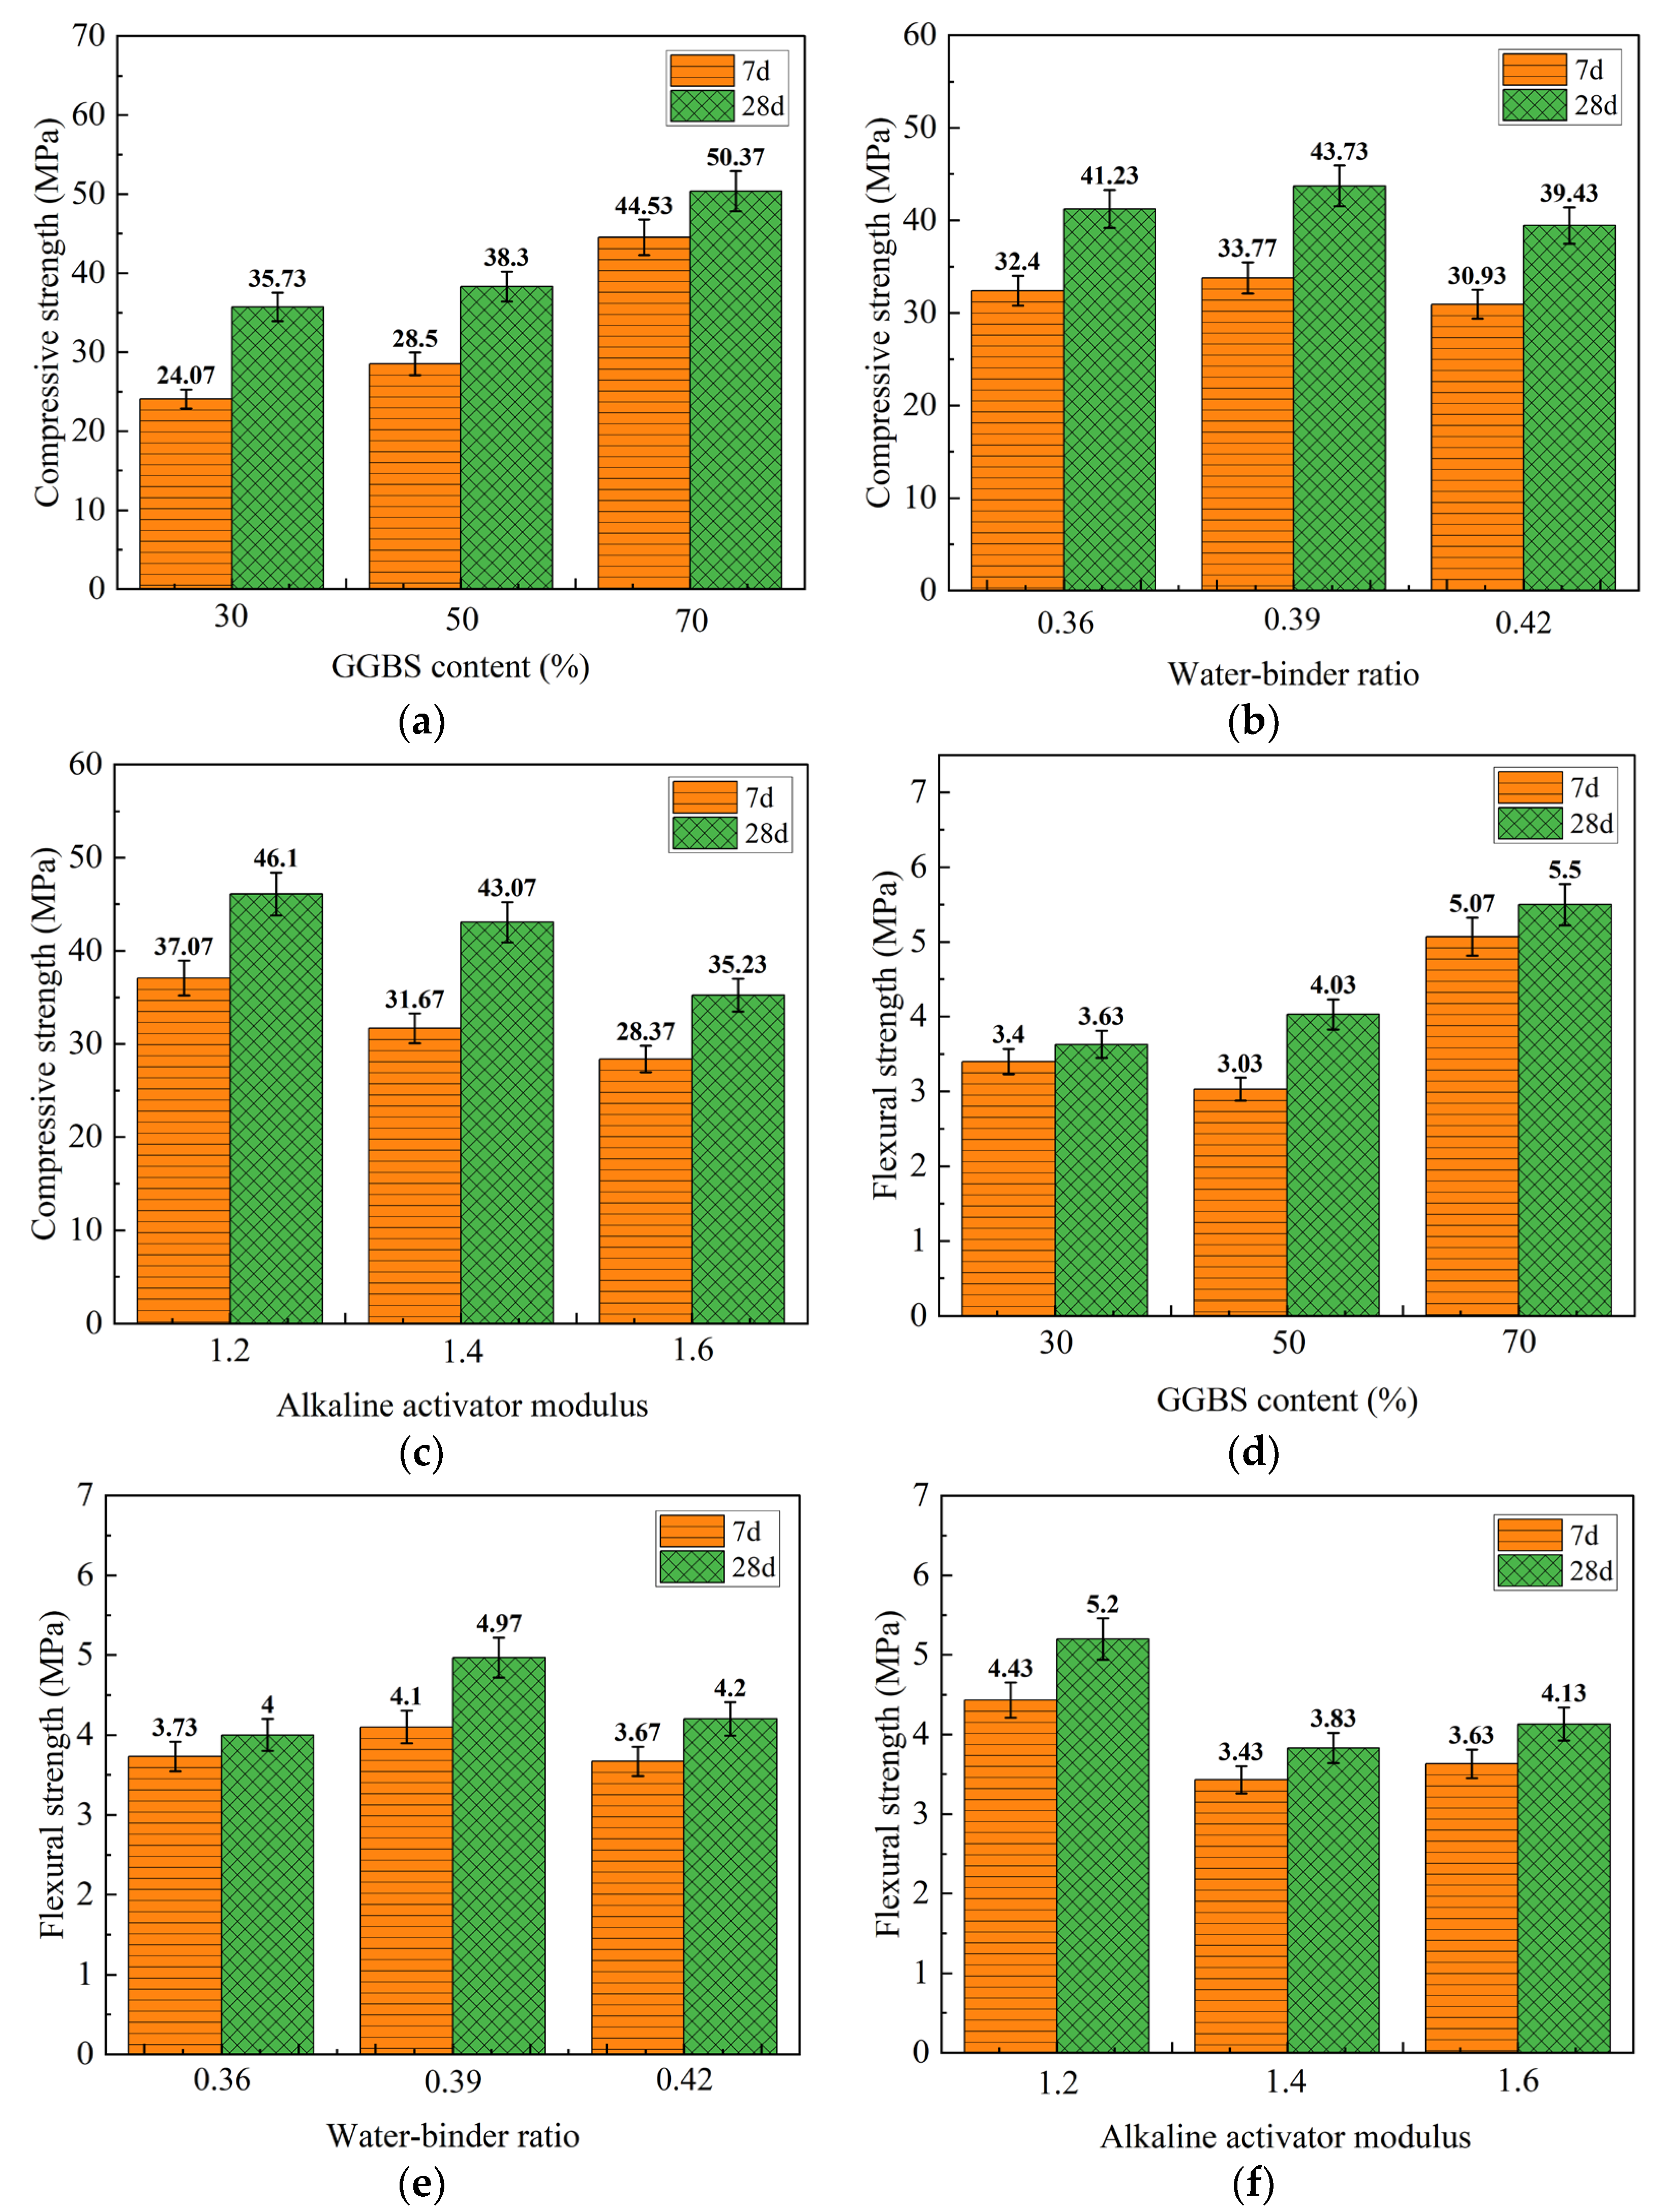
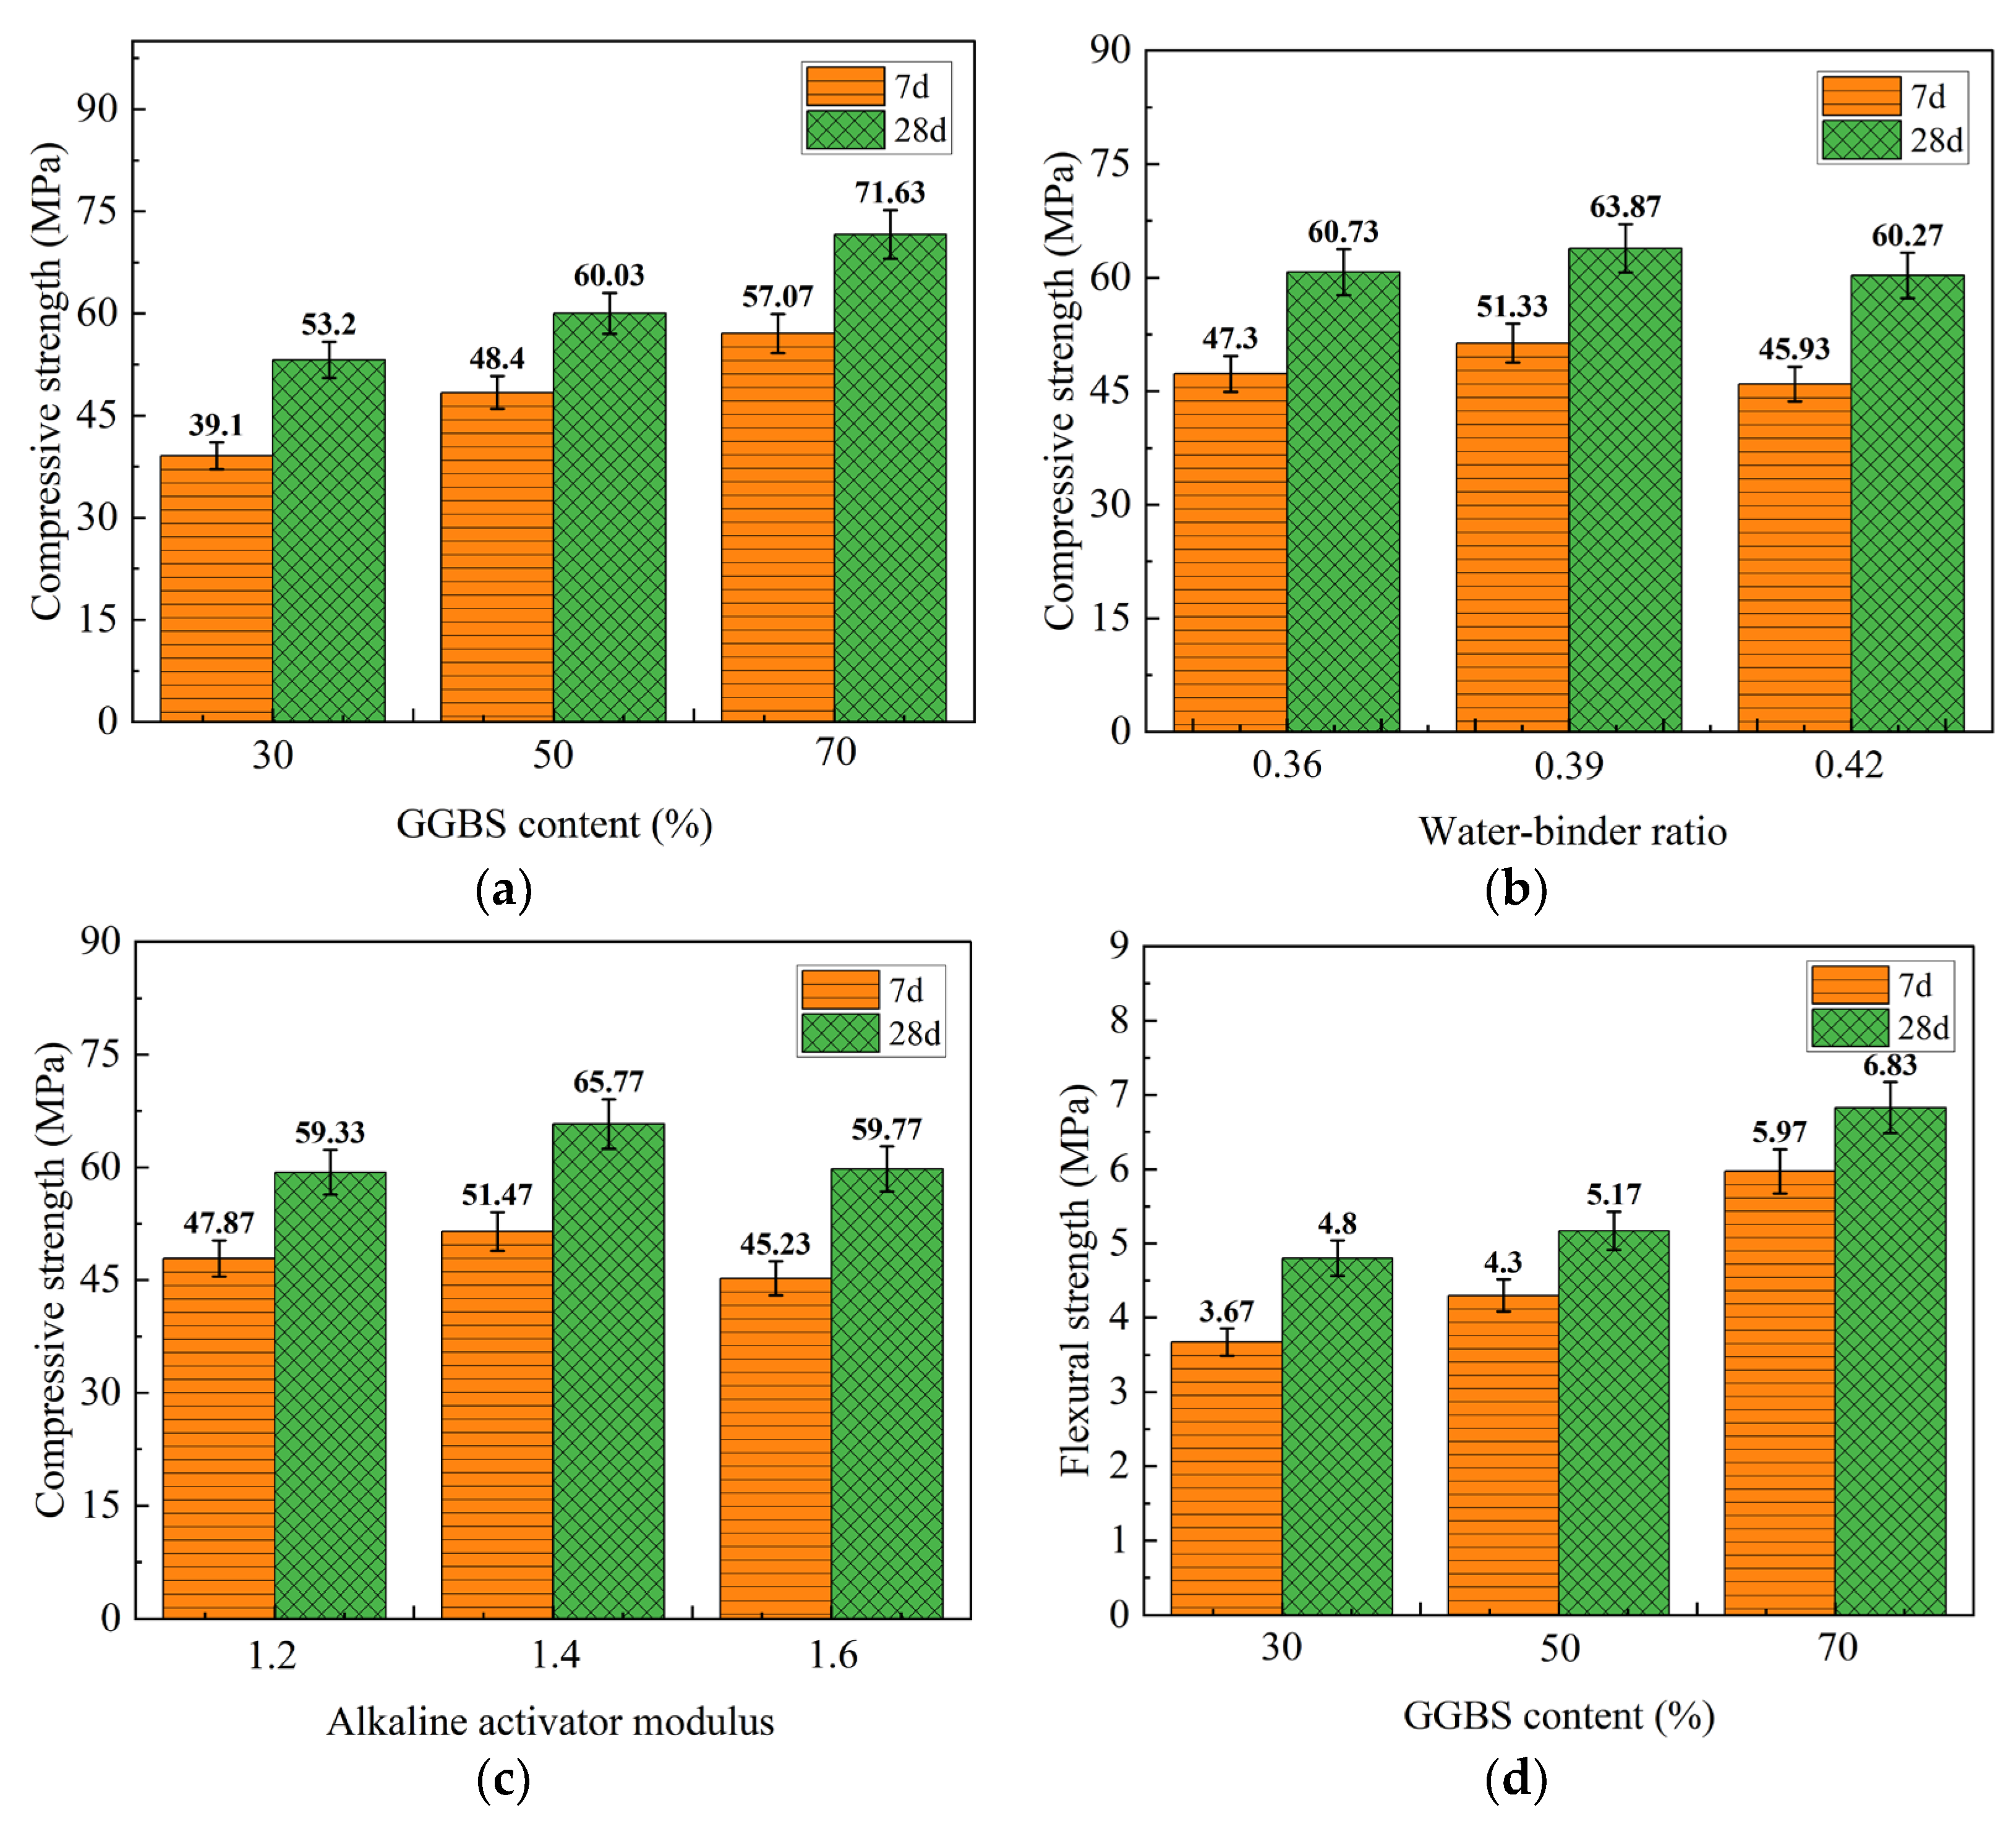
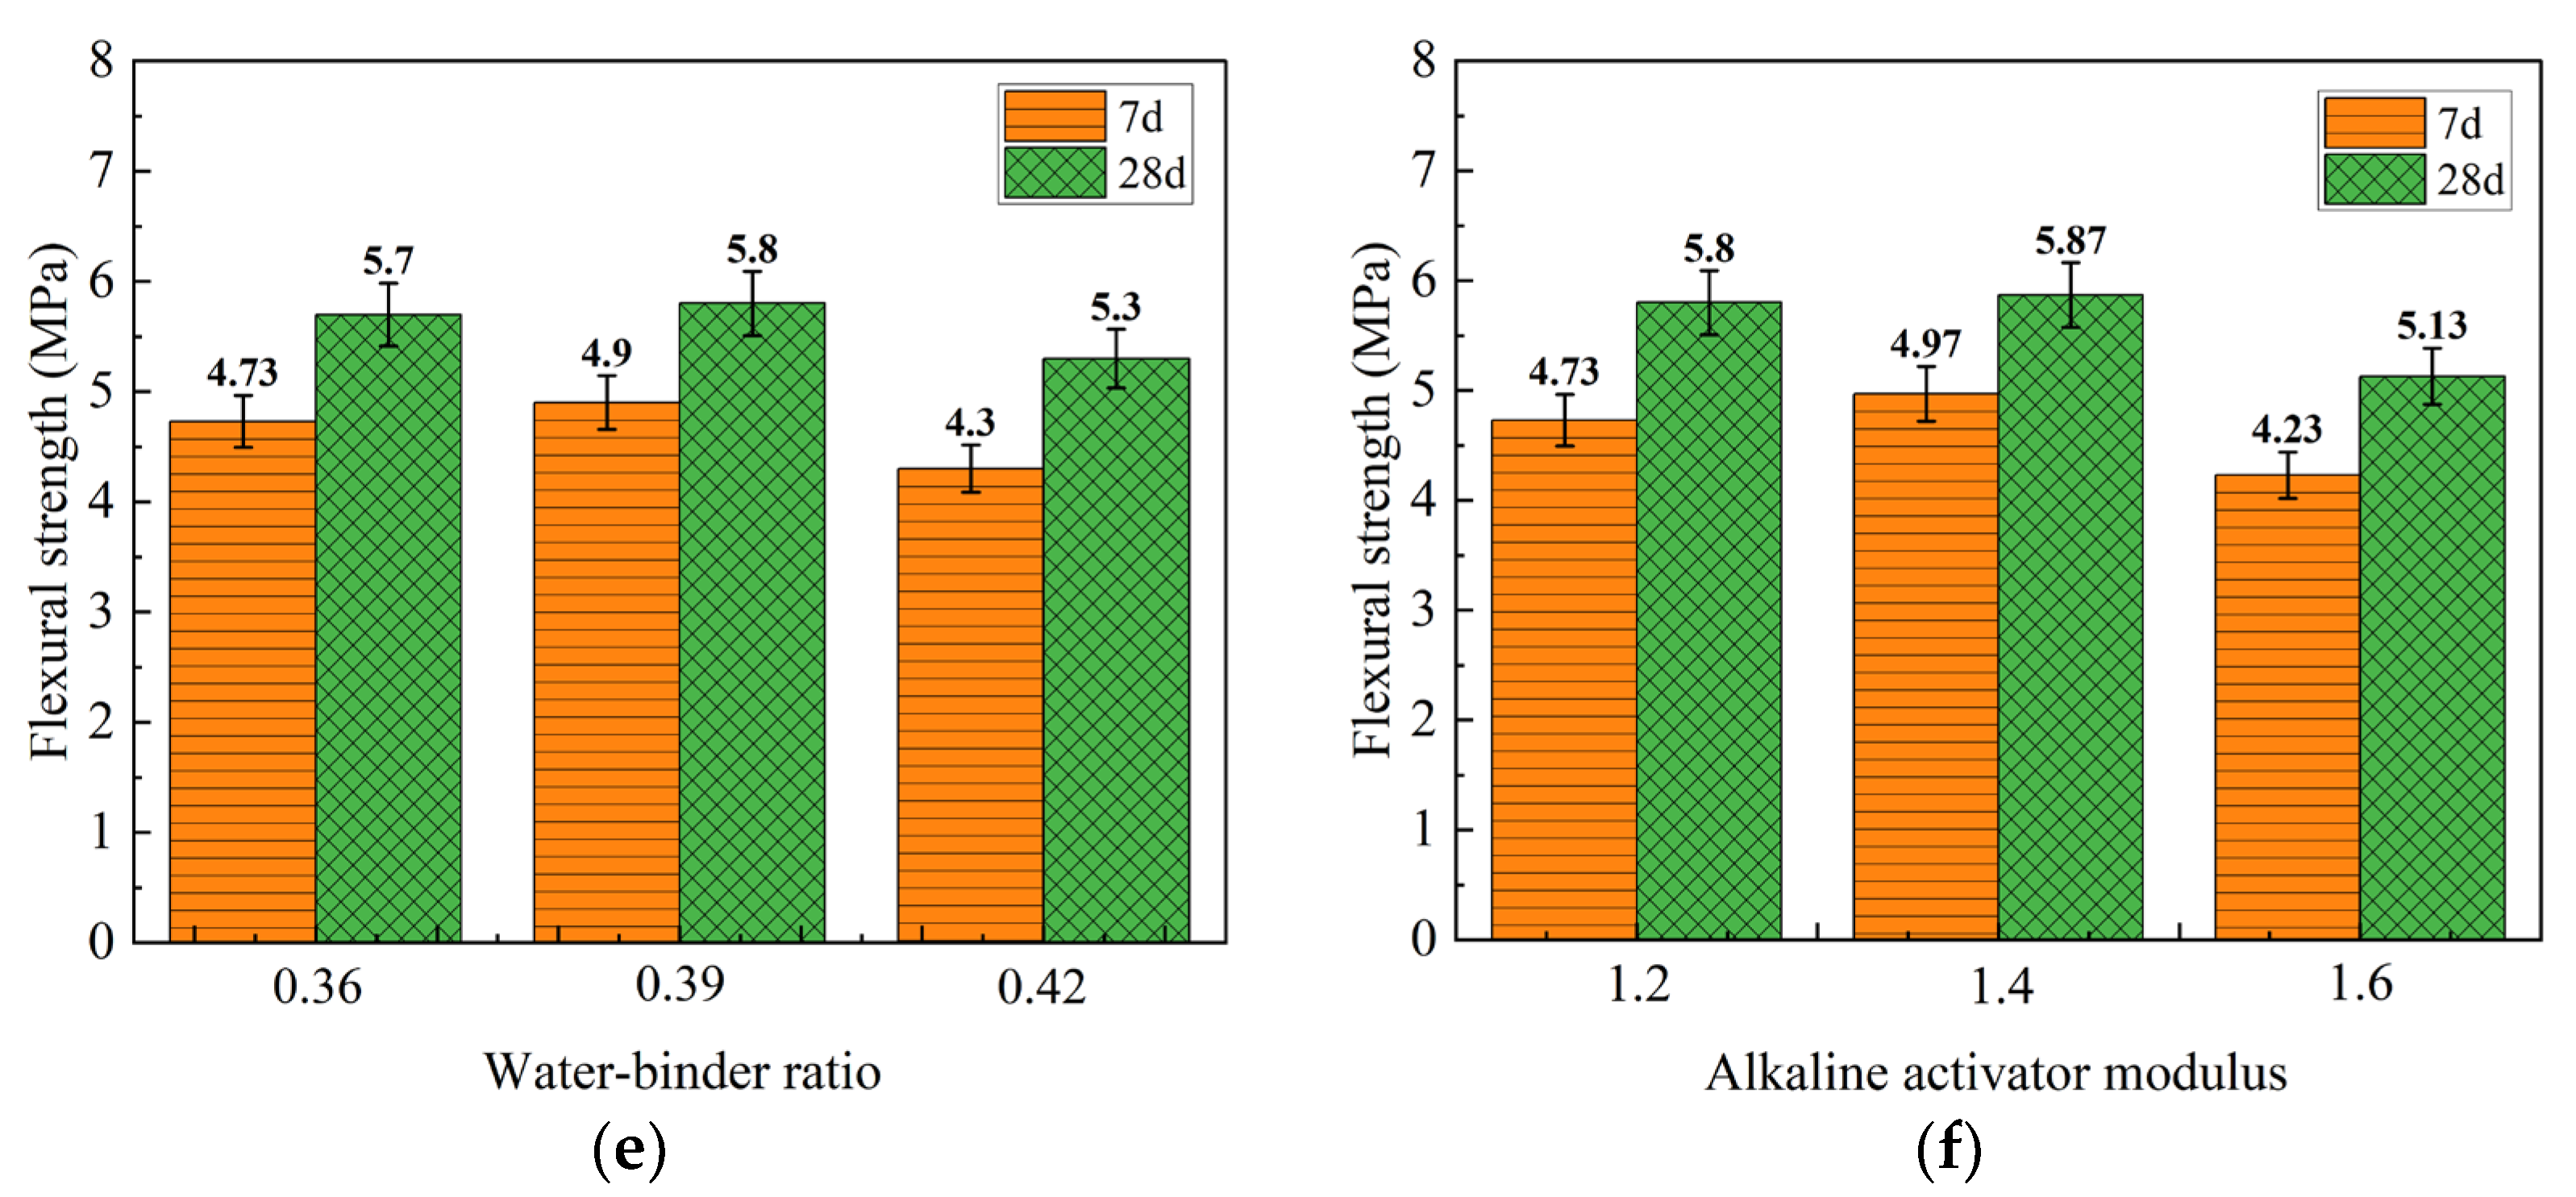
To demonstrate the influence pattern of each factor on the test index more intuitively, a trend chart was plotted with each factor as the horizontal coordinate and the mean value of the intensity of the orthogonal test results as the vertical coordinate, as shown in Figure 5. The effects of GGBS content, water/binder ratio, and alkaline activator modulus on compressive strength and flexural strength are shown in Figure 5a–c and Figure 5d–f, respectively. It can be seen that the compressive strength and flexural strength show an increasing trend with the increase in GGBS content. This is the same as the results of J. Qiu et al. [50,51]. Firstly, GGBS plays a role in filling the voids between raw materials and reducing the porosity so that the sample is dense [52]. Secondly, in an alkaline environment, the activity of GGBS is greater than that of FA [28], and Ca2+ in GGBS dissolves more in the system, forming additional hydration gel [53]. Finally, the microstructure of FA presents a continuous and smooth spherical structure, while the GGBS powder is characterized by irregular and angular particles. The contact area of GGBS is larger than that of FA, and the reaction rate is accelerated. In summary, an appropriate increase in GGBS content can improve the mechanical properties of geopolymers. It has been shown that the addition of excessive GGBS can cause cracks during the curing process, resulting in a decrease in compressive strength [54,55]. The compressive strength and flexural strength both increased and then decreased as the water/binder ratio increased. The main reason is that the increase in water/binder ratio will reduce the alkalinity of geopolymers, decrease the reaction rate, and slow down the reaction process. In the meantime, the water/binder ratio also affects the porosity of the geopolymer, and when the water/binder ratio is too high, the free water will migrate under the action of pore water pressure, thus the increase in the number of capillaries will lead to a decrease in compressive strength [2,56]. In addition, the water/binder ratio is too large, leading to excessive liquidity, which is difficult to apply in engineering practice. The alkaline activator modulus directly affects the alkalinity of the activator, which affects the reaction rate and the formation of hydration gel [57]. Both the compressive and flexural strengths show the best strength at an alkaline activator modulus of 1.2. If the alkaline activator modulus is high, the system will have a high OH concentration and early precipitation of aluminosilicate gel, reducing the strength [58].

3.1.3. Results of Mechanical Property Testing under Standard Curing by Variance Analysis

The range analysis cannot estimate the magnitude of the error, distinguish between the data fluctuation caused by the test conditions and the data deviation caused by the error of the test method, and accurately estimate the contribution of each factor to the test results [59,60]. Variance analysis can make up for the disadvantages of range analysis, improve accuracy, and accurately analyze the influence of each factor on mechanical property results. Table 5 shows the results of the variance analysis of 7 days and 28 days compressive strengths. For the 7 days compressive strength of the geopolymer, the value of the factor GGBS content F is greater than the F critical value 19 at a confidence level of 95%. Similarly, the value of the factor GGBS content F is greater than the F critical value 99 at a confidence level of 99%, indicating that the GGBS content has an extremely important effect on the 7 days compressive strength of the prepared geopolymer to a very significant level. The factor alkaline activator modulus F value at 95% confidence level is greater than the F critical value of 19, indicating that the alkaline activator modulus reaches significance, but the degree of influence is small. For the 28 days compressive strength of the geopolymer, the F values of GGBS content and alkaline activator modulus have a 95% confidence level, which has reached a significant level. Table 6 shows that the flexural strength of the geopolymer at each age, the factor GGBS content and alkaline activator modulus F values are greater than the F critical value 19 at the 95% confidence level, both reaching a significant level. It is clear that the factors GGBS content and the alkaline activator modulus have a greater influence on compressive and flexural strengths under standard curing conditions.

3.2. The Optimum Ratio under 40 °C Water Curing

3.2.1. Visual Analysis of 40 °C Water Curing Mechanical Property Test Results

Figure 6 shows that the compressive strength and flexural strength of each group increased with age, which was consistent with the standard curing trend. However, the strength of the geopolymers prepared by each ratio was greater at 40 °C water curing than at standard curing, and it could be found that water curing had a positive effect on the strength development of the geopolymers. The ranges of 7 days and 28 days compressive strengths were obtained from 24.4 to 59.7 MPa and 30.9 to 66.2 MPa, respectively, and the 7 days and 28 days flexural strengths were 3.0 to 6.2 MPa and 3.3 to 6.7 MPa. The 7 days and 28 days compressive strengths of specimen 8 were the maximum, reaching 59.7 MPa and 66.2 MPa, respectively. Similarly, the 7 days and 28 days flexural strengths of specimen 8 reached their maximum, reaching 6.2 MPa and 6.7 MPa, respectively.

3.2.2. Results of Mechanical Property Testing under 40 °C Water Curing by Range Analysis

The results of the 7 days and 28 days compressive and flexural strengths of the geopolymers by range analysis are shown in Table 7. From the Rj values, it can be seen that the degree of contribution of each factor to the 7 days and 28 days compressive strengths of geopolymers is ranked as A > C > B, i.e., the factor GGBS content has the greatest influence, followed by the alkaline activator modulus, and the water/binder ratio has the least influence, which is consistent with the order of the factors affecting the compressive strength under standard curing. Comparing the ki values, it can be seen that the optimum ratio for the preparation of 7 days and 28 days of compressive strength of geopolymer is the same, which is with a GGBS content of 70%, a water/binder ratio of 0.39, and an alkaline activator modulus of 1.2. This combination is within the range of the orthogonal test, the 7 days compressive strength is 59.7 MPa, the 28 days compressive strength is 66.2 MPa, and these results prove the accuracy of the orthogonal test results. Furthermore, the contribution of each factor to the flexural strength of geopolymers at 7 days and 28 days is still: A > C > B. The optimum ratio of 7 days and 28 days flexural strength is from samples with a GGBS content of 70%, a water/binder ratio of 0.39, and an alkaline activator modulus of 1.2. This conclusion is consistent with the standard curing conditions for each age.
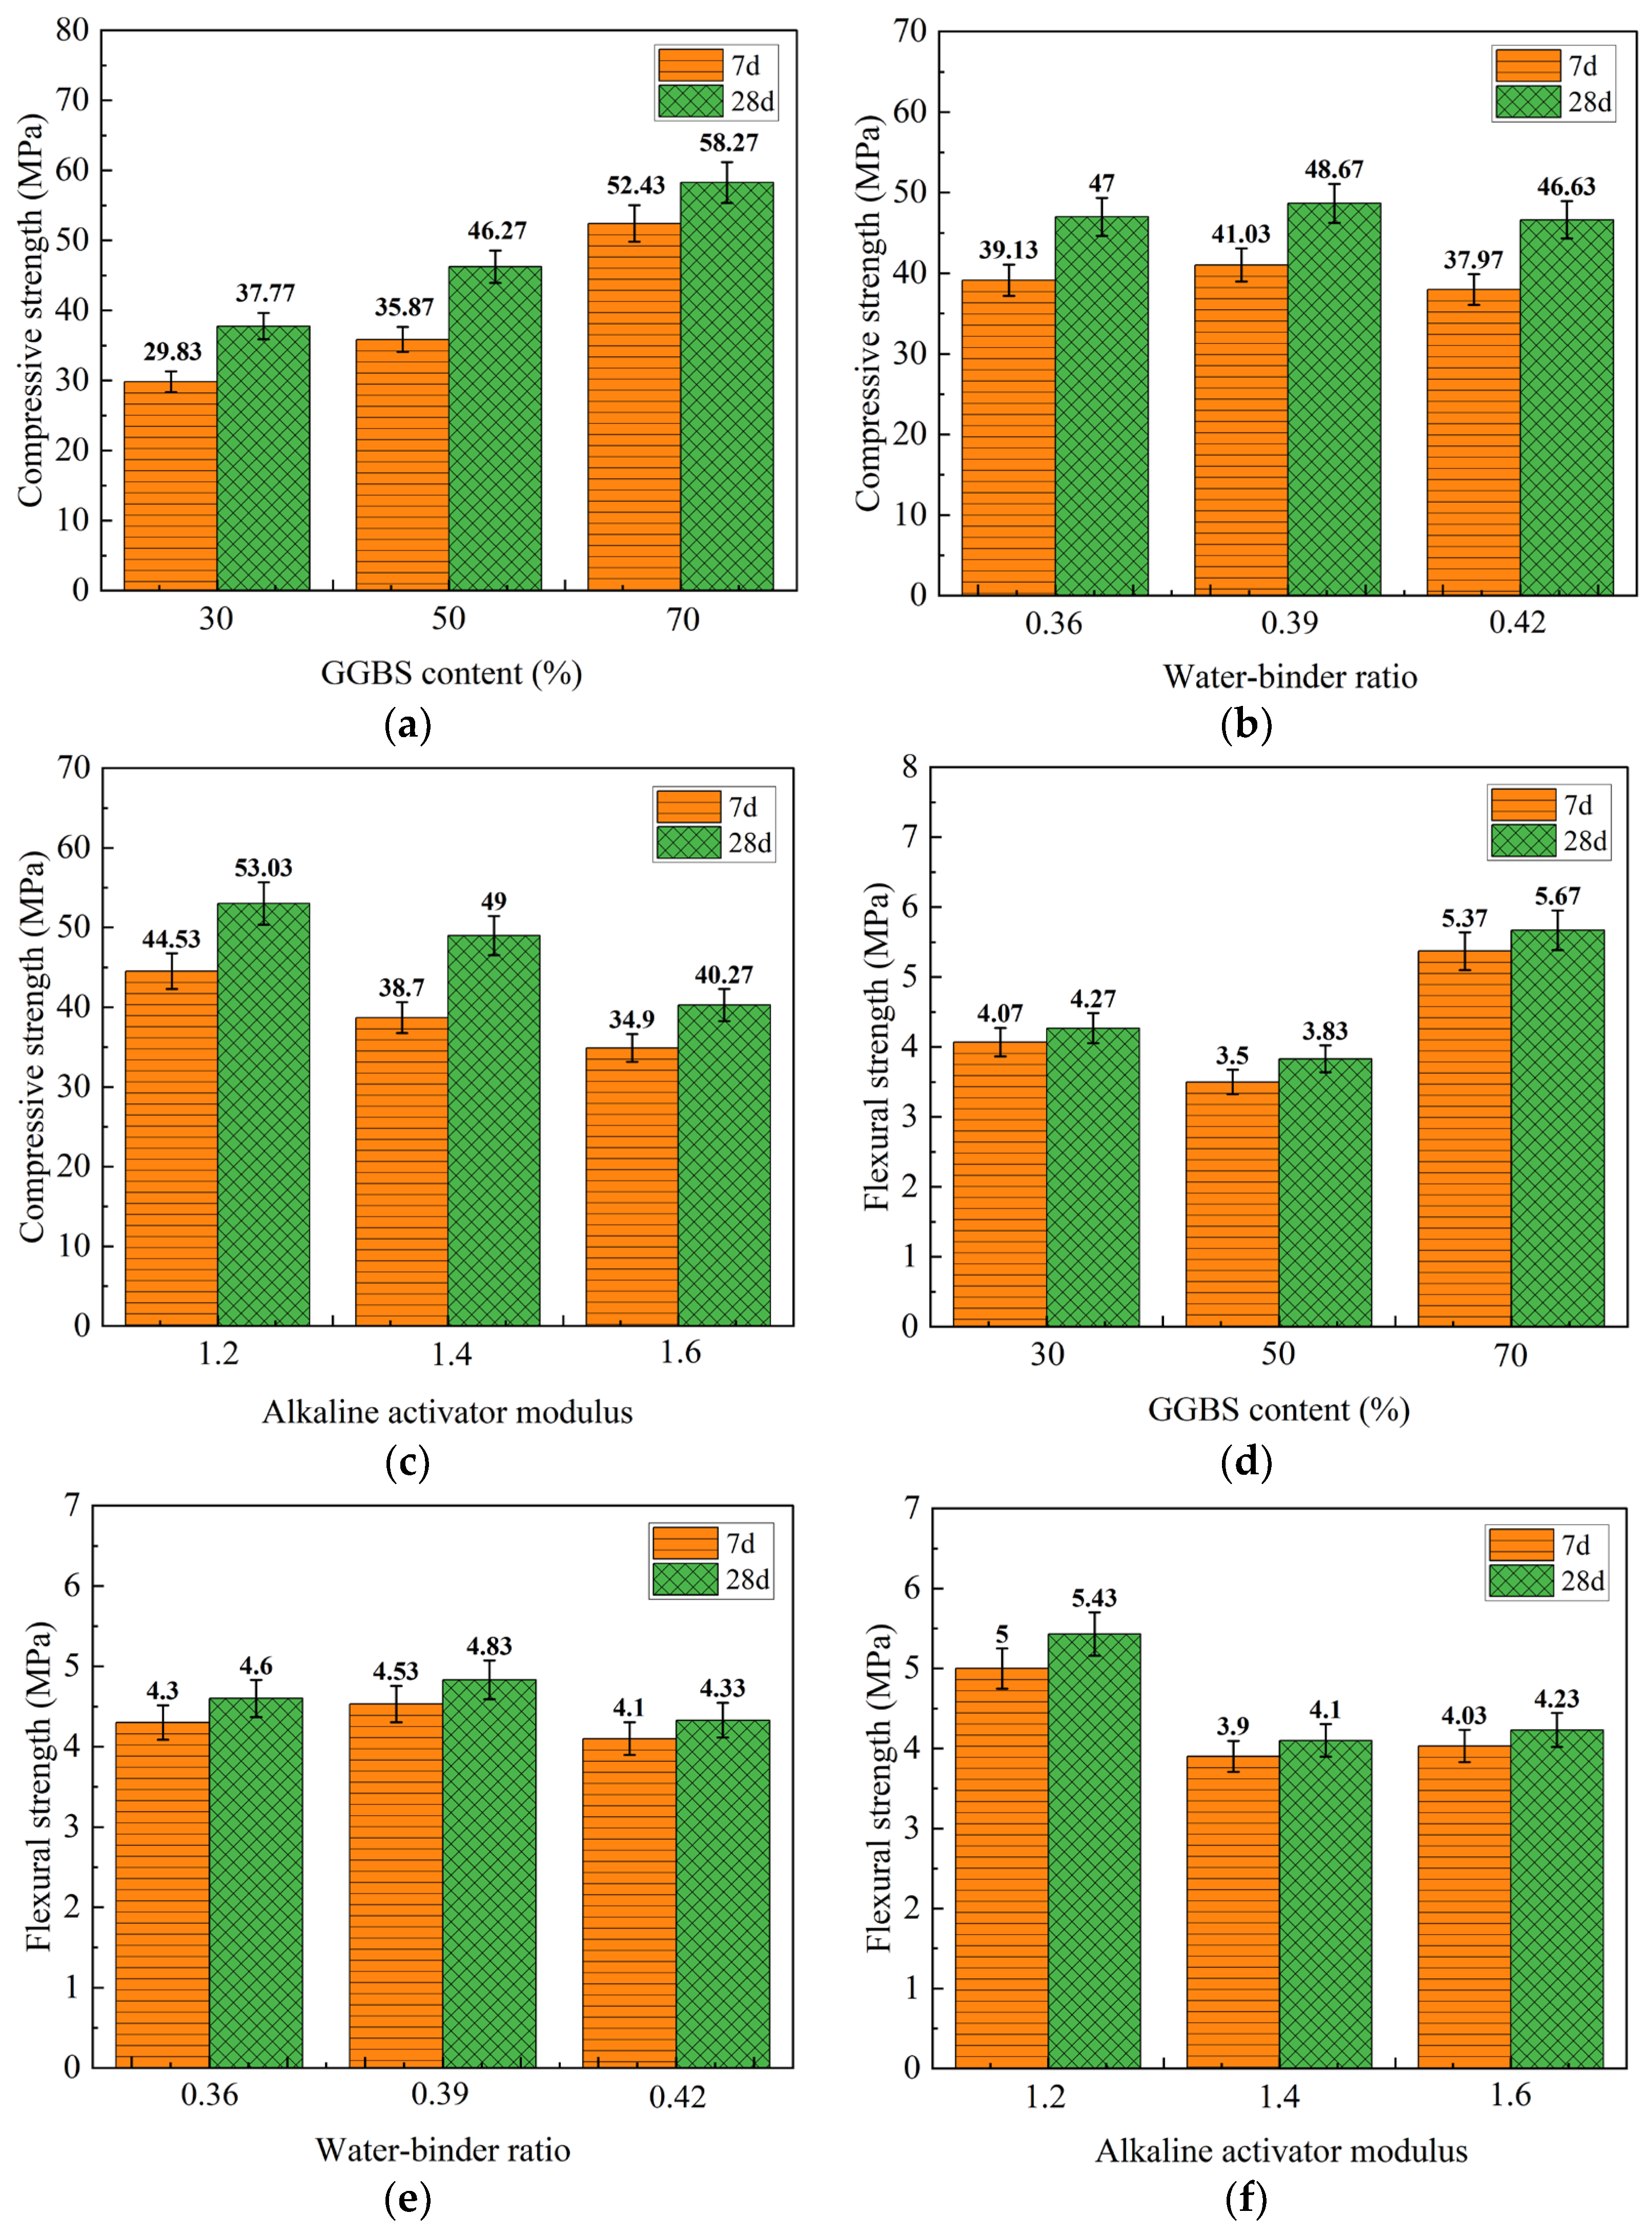
Figure 7a–c,e,f visualize the trend graphs of the range analysis of GGBS content, water/binder ratio, and alkaline activator modulus on compressive strength and flexural strength, respectively. With the increase in GGBS content, the compressive strength showed a rising trend, and the flexural strength showed a trend in first decreasing and then increasing, all of which reached their maximum strength when the GGBS content was 70%. Compared with standard curing, the strength of each ratio of prepared geopolymer increased, which showed that 40 °C water curing could stimulate the activity of the geopolymer, accelerate the speed of the hydration and hardening, and improve the strength. The compressive strength and flexural strength showed a trend in increasing and then decreasing with the increase in the water/binder ratio, but the trend was not evident, which indicated that the water/binder ratio had little effect on the mechanical properties of geopolymers. It was worth noting the compressive strength and flexural strength peak at an alkaline activator modulus of 1.2, as illustrated in Figure 7c,f. This was consistent with the results of previous researchers [61,62] who found that an alkaline activator modulus of 1.2 may densify the alkali-activated structure, reduce porosity, and enhance the binding ability of the hydrated gel. On the other hand, studies have shown that large amounts of alkaline in the geopolymer can easily leach into the water during water curing, and the significant loss of alkaline may affect its mechanical properties in the environment; thus, water curing is sometimes avoided [35]. Conversely, under 40 °C water curing conditions, the geopolymer prepared in this test design ratio still performed well in terms of compressive strength and flexural strength. In conclusion, the difference in curing conditions has a considerable effect on the mechanical properties of the geopolymer.

3.2.3. Results of Mechanical Property Testing under 40 °C Water Curing by Variance Analysis

The study accurately analyzed the effect of each factor on the mechanical property results water curing at 40 °C through variance analysis. Table 8 demonstrates the 7 days and 28 days compressive strength variance analysis results. In the 7 days and 28 days compressive strengths of geopolymers, the F value of GGBS content and alkaline activator modulus have a 95% confidence level, which reached a significant level. It can be seen from Table 9 that the F value of the GGBS content and alkaline activator modulus is greater than the F critical value 19 at a confidence level of 95% for the 7 days and 28 days flexural strengths of geopolymers, reaching a significant level. In summary, different curing conditions for the preparation of the geopolymer would change the degree of contribution of the factors, influencing the mechanical properties. In addition, the variance analysis shows that there is no significant level of contribution of the factor water/binder ratio to the mechanical properties at either 7 or 28 days of age, which is consistent with the results of the range analysis above.

3.3. The Optimum Ratio under 40 °C Heat Curing

3.3.1. Visual Analysis of 40 °C Heat Curing Mechanical Property Test Results

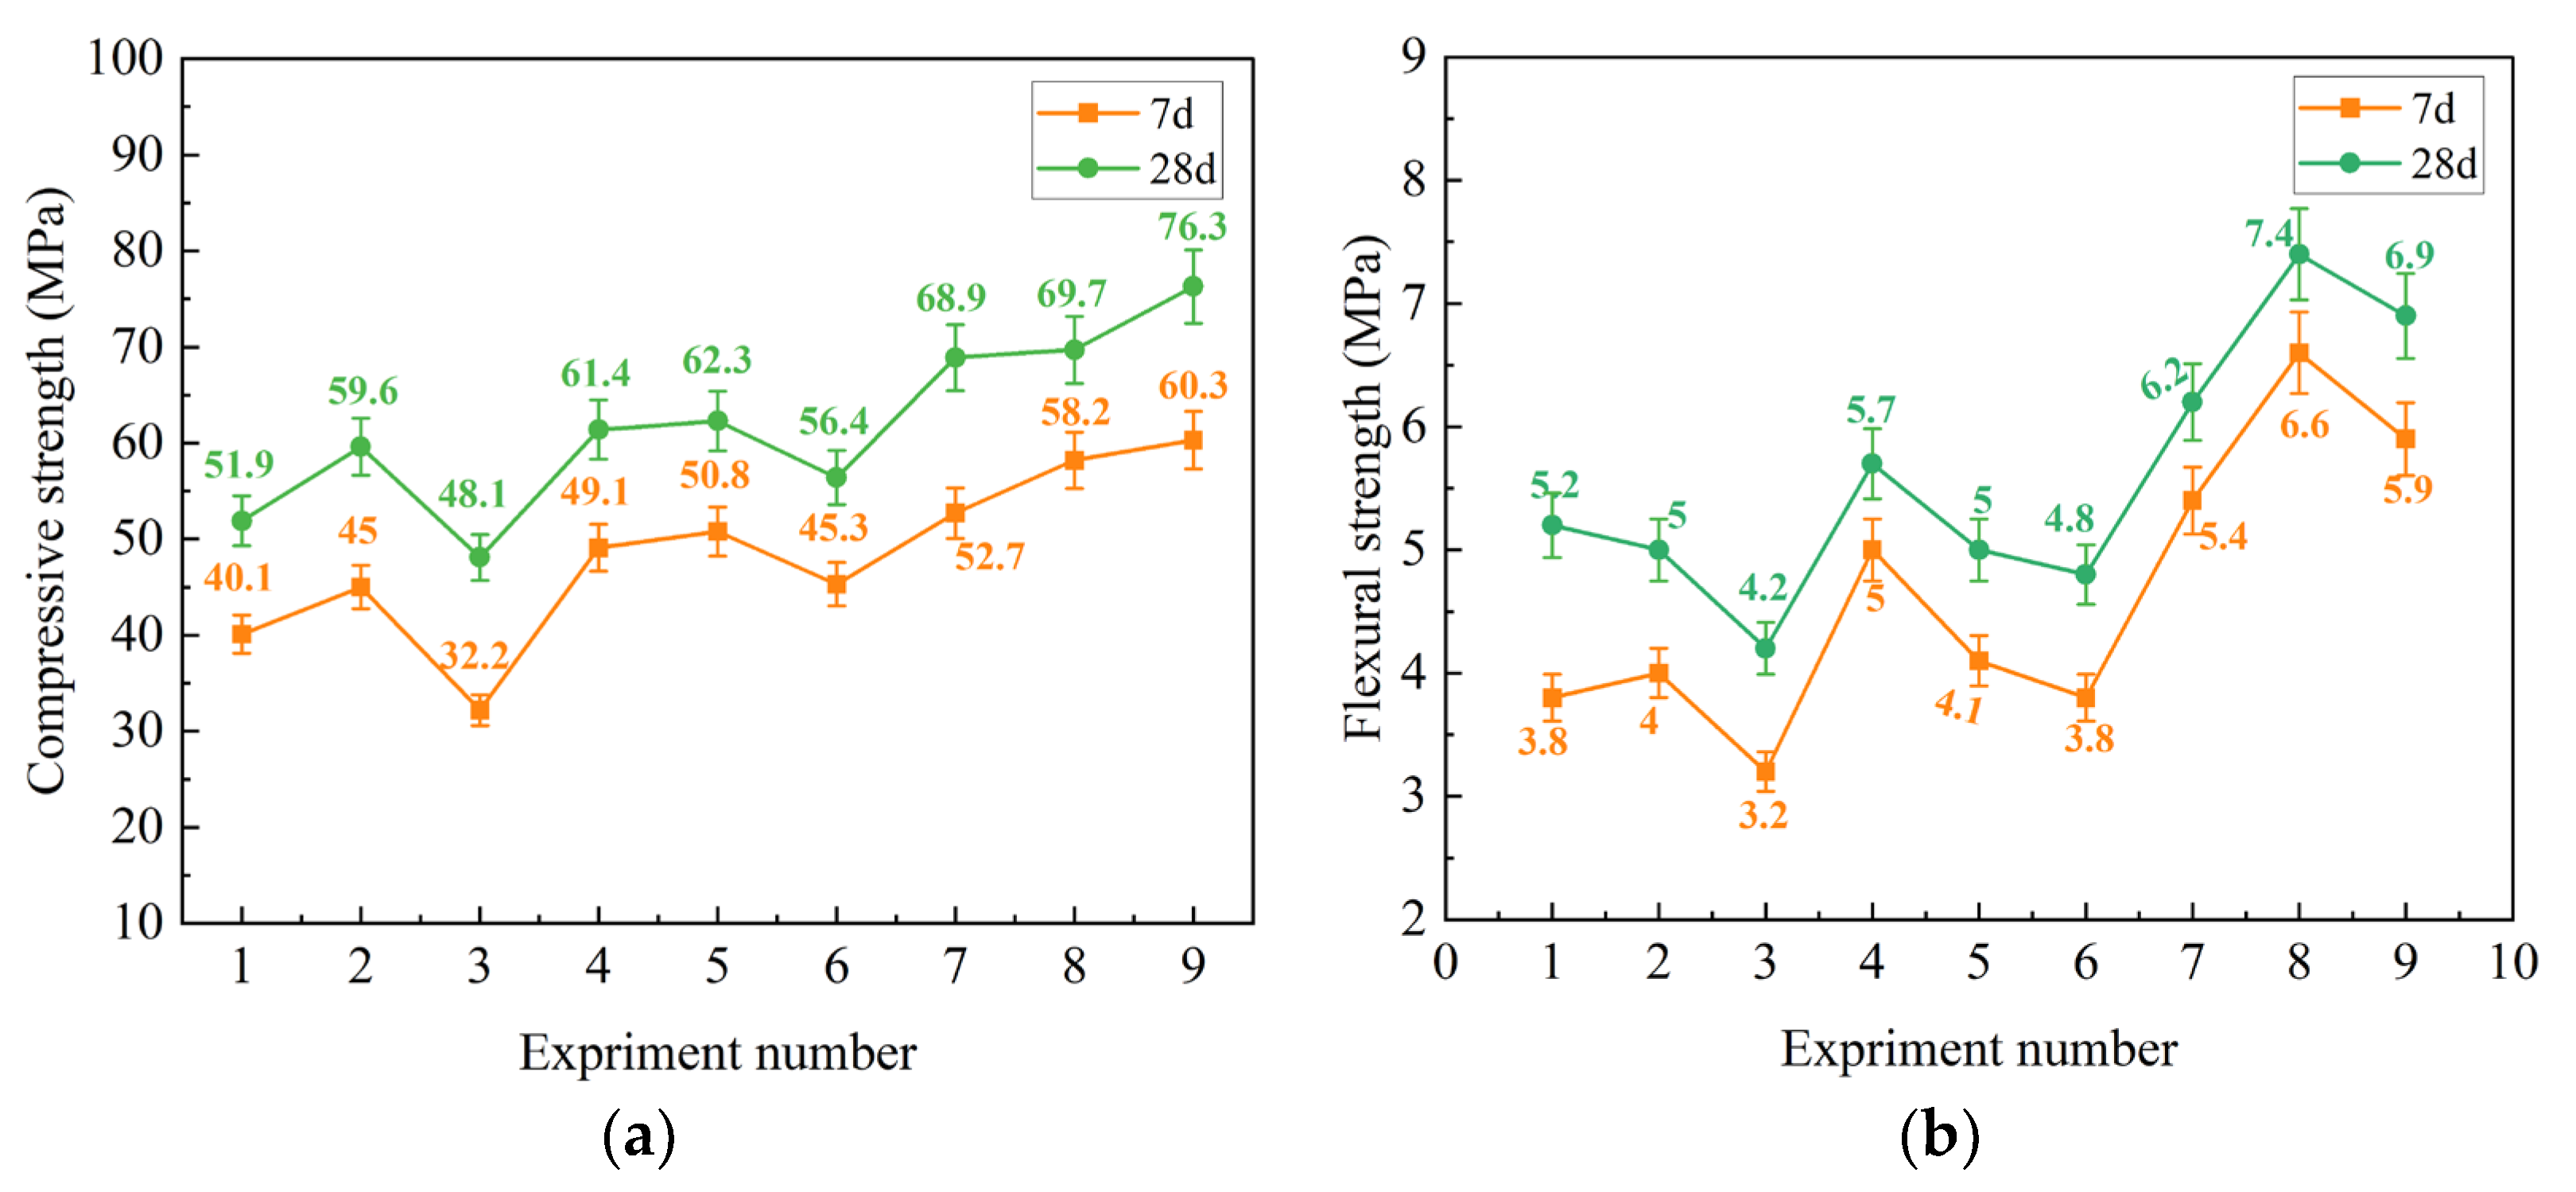
It can be seen from Figure 8 that the compressive and flexural strengths of each group test increased with increasing age, which is consistent with the trend exhibited by standard curing and water curing. The compressive strength ranges of 7 days and 28 days are 32.2 to 60.3 MPa and 48.1 to 76.3 MPa, respectively, and the flexural strength ranges of 7 days and 28 days are 3.2 to 6.6 MPa and 4.2 to 7.4 MPa, respectively. The 7 days and 28 days compressive strengths of specimen 9 reached a maximum of 60.3 MPa and 76.3 MPa, respectively. Compared with the first two curing conditions, the strength of the 40 °C heat curing condition is the highest and exhibits greater mechanical properties due to the appropriate curing temperature increase, which promotes the dissolution of silica-aluminates and accelerates the degree of geopolymerization reaction, promoting more gel formation and resulting in improved mechanical properties [63].

3.3.2. Results of Mechanical Property Testing under 40 °C Heat Curing by Range Analysis

Table 10 shows the results of the 7 days and 28 days of compressive strength and flexural strength of the geopolymer analyzed by the range method. The size of the effect of each factor on the 7 days and 28 days compressive strengths of geopolymers is A > C > B, based on the magnitude of the Rj value. The factor GGBS content has the greatest effect, followed by alkaline activator modulus, and the water/binder ratio has the least effect, and this conclusion is consistent with standard curing and water curing. According to the size of the ki value, the optimal ratio for the configuration of the geopolymer for 7 days and 28 days is the same, which is a GGBS content of 70%, a water/binder ratio of 0.39, and an alkaline activator modulus of 1.4. There is no such combination in the orthogonal test design, thus a supplementary test was conducted for its combination; the compressive strength of 7 days was 62.7 MPa, and the compressive strength of 28 days was 81.5 MPa. The orthogonal test is also supported by the test results. Moreover, the influence of various factors on the flexural strength of geopolymers 7 days and 28 days is sorted as follows: A > C > B. In addition, the configured geopolymers at 7 days and 28 days flexural strengths had the same mix ratio. The optimal ratio was determined to be a GGBS content of 70%, a water/binder ratio of 0.39, and an alkaline activator modulus of 1.4. Similarly, additional tests were conducted on the combinations to obtain a 7-day flexural strength of 6.9 MPa and a 28-day compressive strength of 7.8 MPa.
The trend graphs of the range analysis of GGBS content, water/binder ratio, and alkaline activator modulus on compressive strength and flexural strength are shown in Figure 9a–c,e,f. The compressive and flexural strengths showed the same increasing trend with the increase in GGBS content. This is in agreement with the results of Syed Farasat Ali Shah et al. [64]. The mechanical properties have the same trend and increase significantly with the increase in curing temperature. The early strength of the geopolymer is due to the high Ca content of GGBS [65], which promotes C-A-S-H gel formation as the curing temperature rises and the geopolymerization reaction accelerates, improving mechanical properties [66,67]. With the increase in the water/binder ratio, the compressive strength and flexural strength also showed a trend in first increasing and then decreasing. Although the trend is not evident, it can be seen that a water-to-binder ratio will influence the mechanical properties of the prepared geopolymers. Equally, the compressive strength and flexural strength showed the same trend of rising and then falling with the increase in alkaline activator modulus, and the trend was also not evident. To sum up, increasing the appropriate curing temperature accelerates the activity of OH in the solution, leading to a faster dissolution rate of silica-aluminate precursors, finally enhancing the mechanical properties of the geopolymer [6].

3.3.3. Results of Mechanical Property Testing under 40 °C Heat Curing by Variance Analysis

Variance analysis accurately analyzed the effect of each factor on the mechanical properties of geopolymer under heat curing at 40 °C. Results of variance analysis for 7 days and 28 days compressive strengths are presented in Table 11. The factor GGBS content was found to have a significant effect on the compressive strengths at both 7 days and 28 days, based on the F value being greater than the F critical value of 19 at the 95% confidence level. On the other hand, the remaining two factors showed no significant levels. As displayed in Table 12, for the 7 days and 28 days flexural strengths of the geopolymer, the factor GGBS content F value is greater than the F critical value 19 at the 95% confidence level, reaching a significant level. In a word, the mechanical properties at both 7 days and 28 days are only significantly affected by one factor, which is the GGBS content, under the condition of heat curing at 40°C. The factors of the water/binder ratio and alkaline activator modulus have no significant effect on the mechanical properties, which is consistent with the results of the above range analysis and shows the reasonableness of the variance analysis and range analysis.

4. Strength Prediction Model

The regression analysis of the 7 days and 28 days compressive strengths of geopolymers under different curing conditions was performed using the multiple linear regression analysis module of SPSS. Considering the GGBS content, water/binder ratio, and alkaline activator modulus as the influencing factors of geopolymer compressive strength. Table 13 shows the results of the linear regression analysis of 7 days and 28 days of compressive strengths under standard curing. The linear regression model R2 for 7 days compressive strength is 0.902 and is established as Equation (3):
ƒ7d, s =46.767 + 51.167 × A − 24.444 × B − 21.750 × C
where ƒ7d, s is 7 days compressive strength under standard curing, A is GGBS content, B is water/binder ratio, and C is alkaline activator modulus.
Meanwhile, as shown in Table 13, the model R2 is 0.857, and the linear regression model of 28 days compressive strength is established as Equation (4):
ƒ28d, s =72.908 + 36.583 × A − 30.000 × B − 27.167 × C
where ƒ28d, s is 28 days compressive strength under standard curing, A is GGBS content, B is water/binder ratio, and C is alkaline activator modulus.
Similarly, as shown in Table 14, the model R2 is 0.925, and the linear regression model of 7 days compressive strength under water curing is established as Equation (5):
ƒ7d, w = 52.428 + 56.500 × A − 19.444 × B − 24.083 × C
where ƒ7d, w is 7 days compressive strength under water curing, A is GGBS content, B is water/binder ratio, and C is alkaline activator modulus.
As shown in Table 14, the model R2 is 0.967, and the linear regression model of 28 days compressive strength under water curing is established as Equation (6):
ƒ28d, w = 68.875 + 51.250 × A − 6.111 × B − 31.917 × C
where ƒ28d, w is 28 days compressive strength under water curing, A is GGBS content, B is water/binder ratio, and C is alkaline activator modulus.
As shown in Table 15, the model R2 is 0. 809, and the linear regression model of 7 days compressive strength under heat curing is established as Equation (7):
ƒ7d, h = 43.831 + 44.917 × A − 22.778 × B − 6.583 × C
where ƒ7d, h is 7 days compressive strength under heat curing, A is GGBS content, B is water/binder ratio, and C is alkaline activator modulus.
As shown in Table 15, the model R2 is 0. 794, and the linear regression model of 28 days compressive strength under heat curing is established as Equation (8):
ƒ28d, h = 40.097 + 46.083 × A − 7.778 × B − 1.083 × C
where ƒ28d, h is 28 days compressive strength under heat curing, A is GGBS content, B is water/binder ratio, and C is alkaline activator modulus.
To sum up, the prediction model of compressive strength at each age under different curing conditions is established with high accuracy in this paper, which has certain reference significance for engineering practice.

5. Microscopic Mechanism Analysis

5.1. SEM Analysis

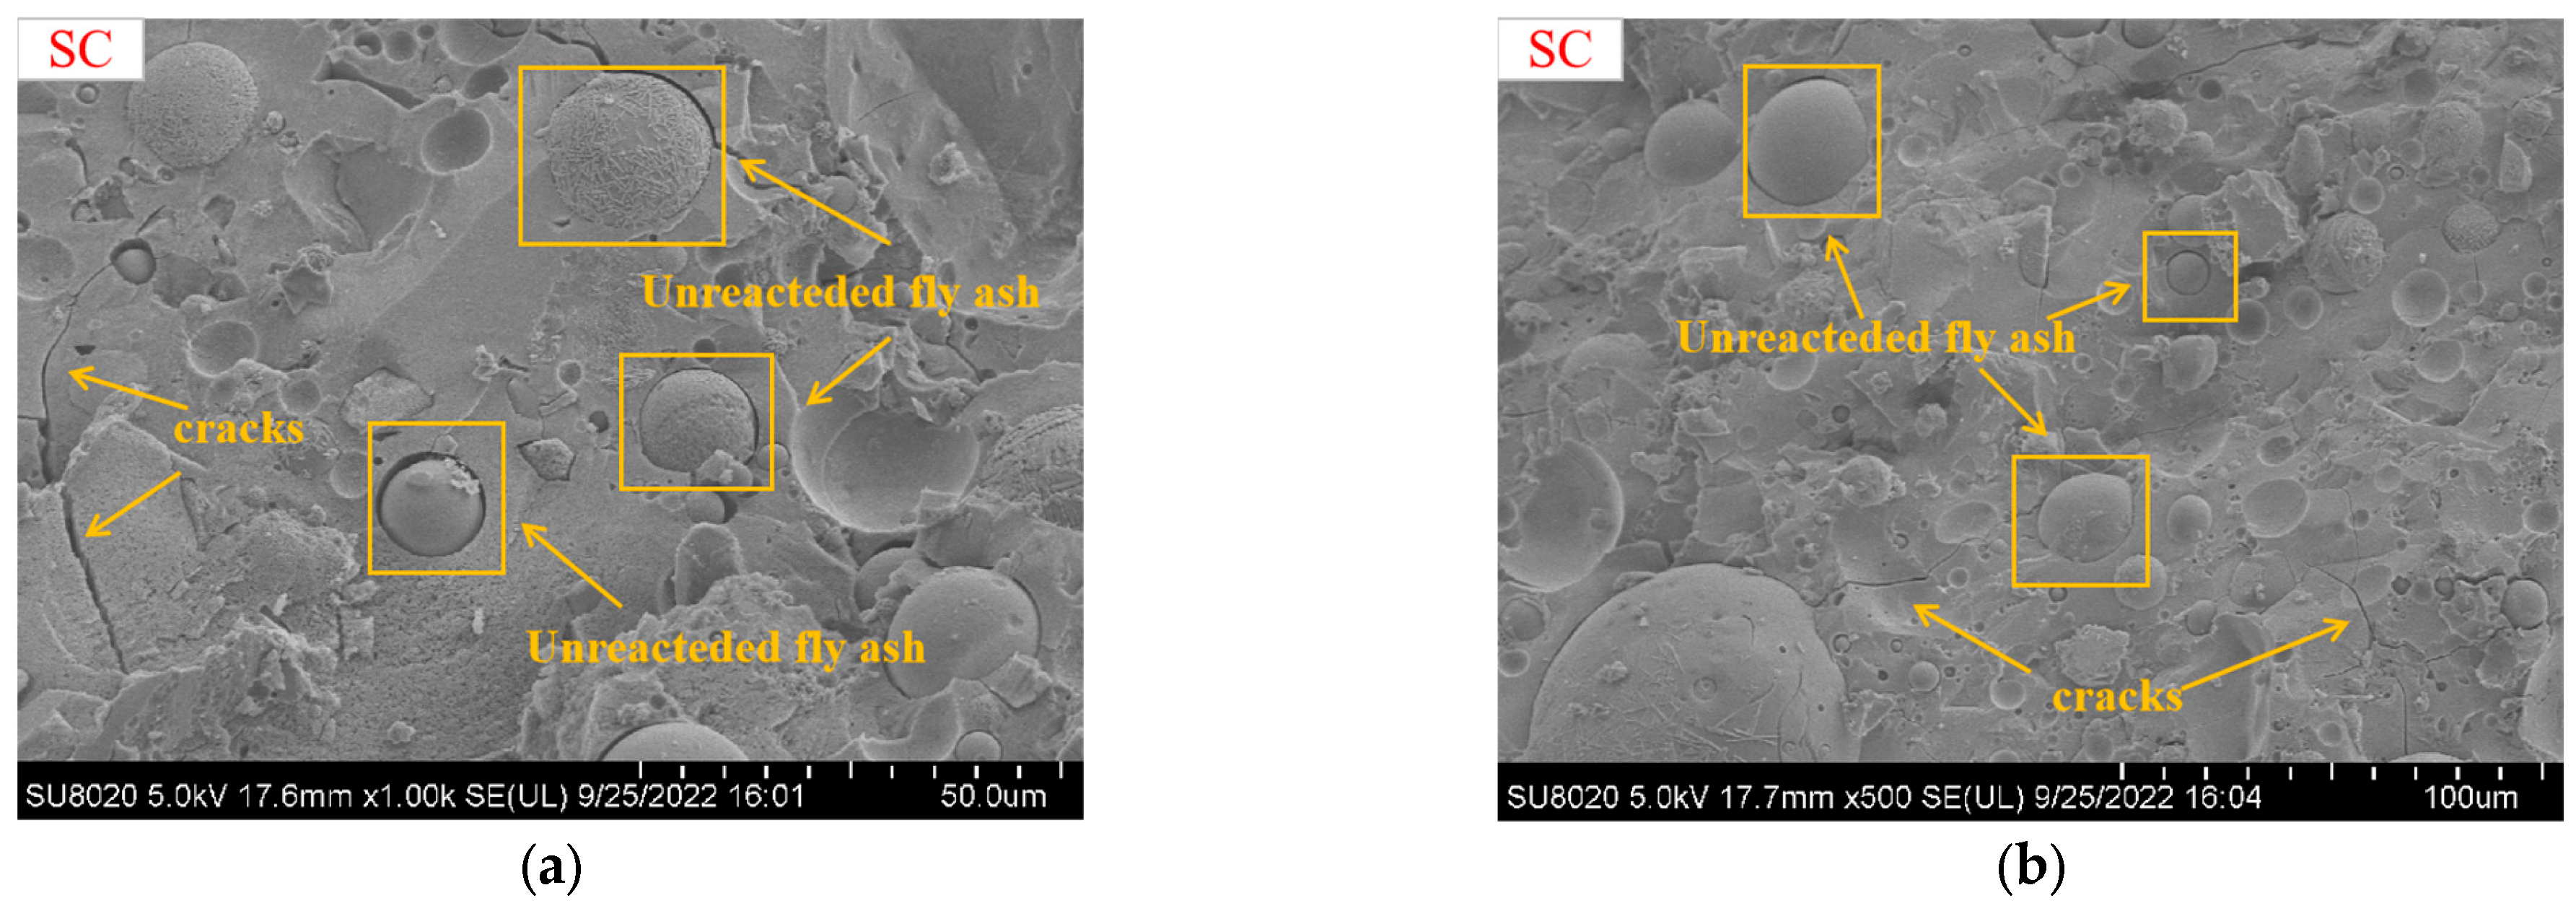
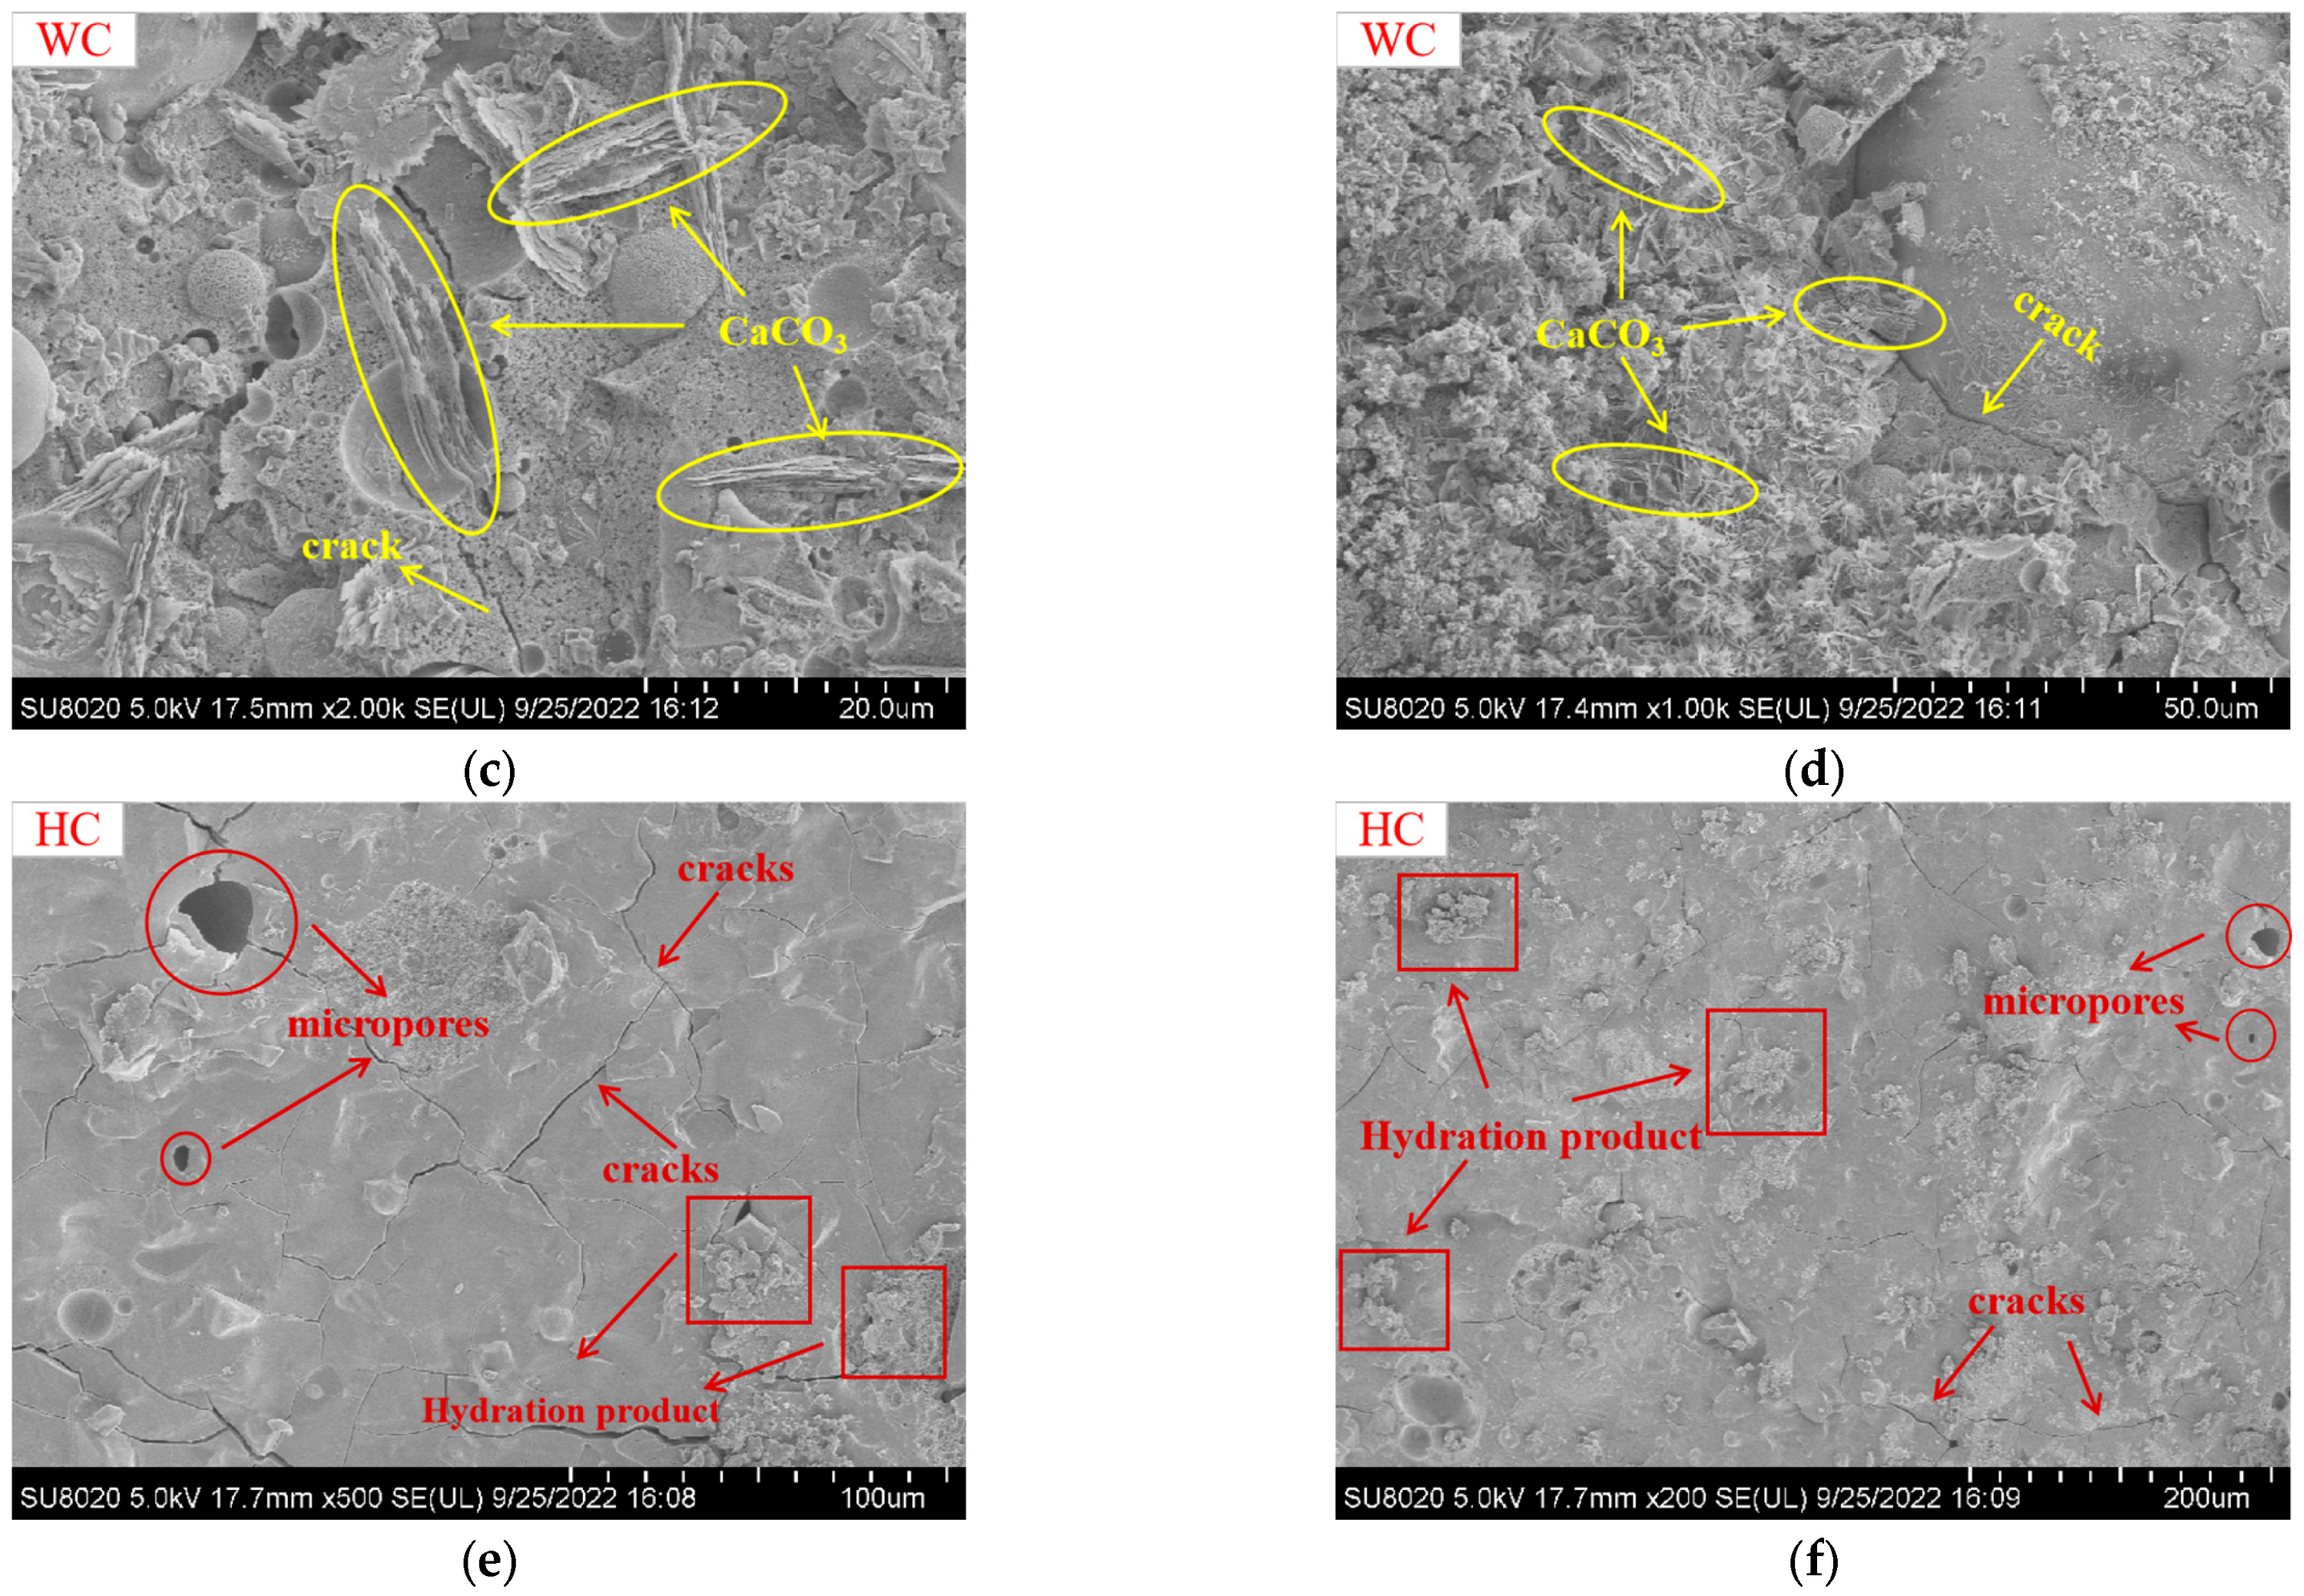
Figure 10 shows the SEM images of the samples selected to prepare the optimal ratio of geopolymers under different curing conditions (standard curing, 40 °C water curing, and 40 °C heat curing). The microstructure and morphology of the 28-days geopolymer samples were observed by SEM. Figure 10a,b were observed to contain a large amount of unreacted FA with varying particle sizes, while many cracks were observed on the surface, which explains the lower mechanical properties of the standard cured geopolymer. Figure 10c,d saw that water curing produced fewer cracks than standard curing. More importantly, laminated CaCO3 in the form of calcite [68] was found in the geopolymer. Studies have shown that [35] Ca is the most abundant among the elements of the lamellar structure formed by calcite, and small amounts of Na, Al, Si, and Mg are also present, which confirm the formation of CaCO3 in the form of calcite. The formation of the laminated CaCO3 by calcite promotes the self-healing effect and increases the compressive strength of the geopolymer. Moreover, the reduction in cracks may also be due to the filling of cracks by calcite, which is the reason why water curing of geopolymer produces greater mechanical properties than standard curing [35]. Compared to standard curing and water curing, heat curing conditions exhibit a dense internal microstructure of the geopolymer [69]. Comparing standard and 40 °C water curing methods, it was found in Figure 10e,f that the content of unreacted FA in 40 °C heat curing was significantly, and relatively more hydration products were generated because heat curing facilitates the acceleration of the geopolymerization reaction [69,70,71]. It can be seen that the appropriate temperature increase accelerates the degree of the polymerization reaction and makes the matrix denser, which is the reason for the higher mechanical properties obtained by heat curing. Combined with the mechanical properties, it can be seen that the 40 °C heat curing condition is the best curing condition. Additionally, the presence of many micropores on the surface is due to the removal of water molecules during the process [35].
To summarize, the mechanical properties of geopolymers are closely related to morphology, which is impacted by the formation of various hydration products. Thus, it is crucial to conduct an XRD analysis to better understand the composition of these hydration products.

5.2. XRD Analysis

The same samples as SEM were selected to observe the XRD traces at 28 days under different curing conditions (standard curing, 40 °C water curing, and 40 °C heat curing), as shown in Figure 11. It can be observed that a wide hump was obtained from about 16°–35°2θ region, indicating the formation of hydration products. The different curing conditions did not change the type of hydration products, which showed almost similar XRD traces, and the presence of quartz and mullite in both products indicated that some raw materials were not fully involved in the reaction, which echoed the SEM images. In water curing, the peak at 41°2θ is sharper and more intense than the other diffraction peaks due to the formation of CaCO3 crystals in the form of calcite. CaCO3 is probably formed by the reaction of Ca2+ in GGBS with the dissolved CO32− in water [35]. Additionally, gel formation was observed in the diffraction peaks of crystalline minerals. Combined with SEM images, it can be seen that heat curing accelerates the dissolution of ions in raw materials, thereby promoting the formation of gels. As the test raw material FA contains a large amount of Si4+ and Al3+ and GGBS contains a large amount of Ca2+ and Si4+, OH in the alkaline solution destroys Ca2+, Al3+, and Si4+ in the raw material and releases a large amount of Si (OH)4 monomer and Al (OH)4 monomer, while Ca2+ and Si (OH)4 combine to form C-S-H gel [72]. Then, a portion of Al3+ replaces Ca2+ to form a C-A-S-H gel [73,74,75,76]. Na+ in alkaline solutions combines with Si (OH)4 monomers and Al (OH)4 monomers to form N-A-S-H gel [72]. Three gels were found in all three curing conditions of this study, which together acted to increase the mechanical properties and promote structural densification. Comparing the three curing conditions, it is evident that heat curing generates a higher number of combined with the results of the mechanical property tests, and it is verified that the reaction degree at 40 °C heat curing is better.

6. Conclusions

In this paper, the orthogonal test was applied to describe the effects of GGBS content, water/binder ratio, and alkaline activator modulus on the development of mechanical properties of geopolymers under different curing conditions. Microstructure analysis and hydration product analysis were performed by SEM and XRD. The following main conclusions could be drawn:
(1)
Under the standard curing conditions, the compressive strength and flexural strength of 28 days were higher than 7 days, which were attributed to the continuation of the geopolymerization reaction. The contribution of the three influencing factors to the compressive strength and flexural strength of the geopolymers was ranked as follows: GGBS content > alkaline activator modulus > water/binder ratio. Taking the 7 days and 28 days compressive strength and flexural strength of the geopolymer specimens as the evaluation criteria, the optimum ratio of preparing the geopolymer was about a GGBS content of 70%, a water/binder ratio of 0.39, and an alkaline activator modulus of 1.2.
(2)
Compared with standard curing, the mechanical properties of the geopolymer prepared by 40 °C water curing were improved, which had a positive effect on the development of geopolymer strength. The contribution of the three influencing factors to the compressive strength and flexural strength of the geopolymers was ranked as follows: GGBS content > alkaline activator modulus > water/binder ratio. Taking the 7 days and 28 days compressive strength and flexural strength of the geopolymer specimens as the evaluation criteria, the optimum ratio of the prepared geopolymer was a GGBS content of 70%, a water/binder ratio of 0.39, and an alkaline activator modulus of 1.2.
(3)
In total, 40 °C heat curing accelerated the dissolution of silicate and promoted the formation of more gels. Under the three curing conditions, at 40 °C heat curing compressive strength and flexural strength were the largest. The contribution of the three influencing factors to the compressive strength and flexural strength of the geopolymers was ranked as follows: GGBS content > alkaline activator modulus > water/binder ratio. Taking the 7 days and 28 days compressive strength and flexural strength of the geopolymer specimens as the evaluation criteria, the optimum ratio of the prepared geopolymer was a GGBS content of 70%, a water/binder ratio of 0.39, and an alkaline activator modulus of 1.4.
(4)
The prediction model of compressive strength under various curing conditions had been developed. The model demonstrated high accuracy in predicting results and could serve as an important reference tool for engineering applications.
(5)
The mechanical properties and microstructures indicated that 40 °C heat curing was the best curing condition, which exhibited a dense internal microstructure and the presence of many C-S-H gels, C-A-S-H gels, and N-A-S-H gels.

Author Contributions

Conceptualization, J.L.; methodology, X.S.; software, X.S.; validation, X.S.; formal analysis, J.L.; investigation, J.L.; resources, J.L.; data curation, X.S.; writing—original draft preparation, J.L., X.S., G.Z. and L.L.; writing—review and editing, J.L., X.S., G.Z. and L.L.; visualization, J.L.; supervision, X.S.; project administration, J.L.; funding acquisition, J.L. All authors have read and agreed to the published version of the manuscript.

Funding

This study was supported by the Fundamental Research Funds for the Central Universities (2572021BJ01) and the Natural Science Foundation of Heilongjiang Province of China (YQ2022E002).

Data Availability Statement

The authors confirm that the data generated or analyzed during this study are provided in full within the published article.

Conflicts of Interest

The authors declare no conflict of interest.

References

  1. Jiapei, D.; Yuhuan, B.; Xuechao, C.; Zhonghou, S.; Baojiang, S. Utilization of alkali-activated slag based composite in deepwater oil well cementing. Constr. Build. Mater. 2018, 186, 114–122. [Google Scholar] [CrossRef]
  2. Zhao, J.; Li, S. Study on processability, compressive strength, drying shrinkage and evolution mechanisms of microstructures of alkali-activated slag-glass powder cementitious material. Constr. Build. Mater. 2022, 344, 128196. [Google Scholar] [CrossRef]
  3. Kroehong, W.; Sinsiri, T.; Jaturapitakkul, C.; Chindaprasirt, P. Effect of palm oil fuel ash fineness on the microstructure of blended cement paste. Constr. Build. Mater. 2011, 25, 4095–4104. [Google Scholar] [CrossRef]
  4. Hanjitsuwan, S.; Phoo-Ngernkham, T.; Li, L.-Y.; Damrongwiriyanupap, N.; Chindaprasirt, P. Strength development and durability of alkali-activated fly ash mortar with calcium carbide residue as additive. Constr. Build. Mater. 2018, 162, 714–723. [Google Scholar] [CrossRef]
  5. Turner, L.K.; Collins, F.G. Carbon dioxide equivalent (CO2-e) emissions: A comparison between geopolymer and OPC cement concrete. Constr. Build. Mater. 2013, 43, 125–130. [Google Scholar] [CrossRef]
  6. Yıldırım, G.; Kul, A.; Özçelikci, E.; Şahmaran, M.; Aldemir, A.; Figueira, D.; Ashour, A. Development of alkali-activated binders from recycled mixed masonry-originated waste. J. Build. Eng. 2021, 33, 101690. [Google Scholar] [CrossRef]
  7. Fang, G.; Ho, W.K.; Tu, W.; Zhang, M. Workability and mechanical properties of alkali-activated fly ash-slag concrete cured at ambient temperature. Constr. Build. Mater. 2018, 172, 476–487. [Google Scholar] [CrossRef]
  8. Soutsos, M.; Boyle, A.P.; Vinai, R.; Hadjierakleous, A.; Barnett, S.J. Factors influencing the compressive strength of fly ash based geopolymers. Constr. Build. Mater. 2016, 110, 355–368. [Google Scholar] [CrossRef]
  9. Chindaprasirt, P.; Phoo-Ngernkham, T.; Hanjitsuwan, S.; Horpibulsuk, S.; Poowancum, A.; Injorhor, B. Effect of calcium-rich compounds on setting time and strength development of alkali-activated fly ash cured at ambient temperature. Case Stud. Constr. Mater. 2018, 9, e00198. [Google Scholar] [CrossRef]
  10. Xiang, J.; He, Y.; Liu, L.; Zheng, H.; Cui, X. Exothermic behavior and drying shrinkage of alkali-activated slag concrete by low temperature-preparation method. Constr. Build. Mater. 2020, 262, 120056. [Google Scholar] [CrossRef]
  11. Suttiprapa, P.; Tangchirapat, W.; Jaturapitakkul, C.; Rattanasak, U.; Jitsangiam, P. Strength behavior and autogenous shrinkage of alkali-activated mortar made from low-calcium fly ash and calcium carbide residue mixture. Constr. Build. Mater. 2021, 312, 125438. [Google Scholar] [CrossRef]
  12. Jokar, Z.; Mokhtar, A. Policy making in the cement industry for CO2 mitigation on the pathway of sustainable development- A system dynamics approach. J. Clean. Prod. 2018, 201, 142–155. [Google Scholar] [CrossRef]
  13. Palomo, A.; Grutzeck, M.W.; Blanco, M.T. Alkali-activated fly ashes: A cement for the future. Cem. Concr. Res. 1999, 29, 1323–1329. [Google Scholar] [CrossRef]
  14. Jang, J.; Lee, H. Effect of fly ash characteristics on delayed high-strength development of geopolymers. Constr. Build. Mater. 2016, 102, 260–269. [Google Scholar] [CrossRef]
  15. Bakharev, T. Geopolymeric materials prepared using Class F fly ash and elevated temperature curing. Cem. Concr. Res. 2005, 35, 1224–1232. [Google Scholar] [CrossRef]
  16. Li, X.; Li, O.X.; Rao, F.; Song, S.; Ortiz-Lara, N.; Aguilar-Reyes, E.A. Microstructural evolution in sulfate solutions of alkali-activated binders synthesized at various calcium contents. J. Mater. Res. Technol. 2020, 9, 10377–10385. [Google Scholar] [CrossRef]
  17. Xu, F.; Gu, G.; Zhang, W.; Wang, H.; Huang, X.; Zhu, J. Pore structure analysis and properties evaluations of fly ash-based geopolymer foams by chemical foaming method. Ceram. Int. 2018, 44, 19989–19997. [Google Scholar] [CrossRef]
  18. Khale, D.; Chaudhary, R. Mechanism of geopolymerization and factors influencing its development: A review. J. Mater. Sci. 2007, 42, 729–746. [Google Scholar] [CrossRef]
  19. Pacheco-Torgal, F.; Castro-Gomes, J.; Jalali, S. Alkali-activated binders: A review: Part 1. Historical background, terminology, reaction mechanisms and hydration products. Constr. Build. Mater. 2008, 22, 1305–1314. [Google Scholar] [CrossRef]
  20. Karim, R.; Hossain, M.; A Elahi, M.; Mohd Zain, M.F. Effects of source materials, fineness and curing methods on the strength development of alkali-activated binder. J. Build. Eng. 2020, 29, 101147. [Google Scholar] [CrossRef]
  21. Al-Otaibi, S. Durability of concrete incorporating GGBS activated by water-glass. Constr. Build. Mater. 2008, 22, 2059–2067. [Google Scholar] [CrossRef]
  22. Buchwald, A.; Hilbig, H.; Kaps, C. Alkali-activated metakaolin-slag blends—Performance and structure in dependence of their composition. J. Mater. Sci. 2007, 42, 3024–3032. [Google Scholar] [CrossRef]
  23. Alanazi, H.; Hu, J.; Kim, Y.-R. Effect of slag, silica fume, and metakaolin on properties and performance of alkali-activated fly ash cured at ambient temperature. Constr. Build. Mater. 2019, 197, 747–756. [Google Scholar] [CrossRef]
  24. Provis, J.L.; Palomo, A.; Shi, C. Advances in understanding alkali-activated materials. Cem. Concr. Res. 2015, 78, 110–125. [Google Scholar] [CrossRef]
  25. Rafeet, A.; Vinai, R.; Soutsos, M.; Sha, W. Effects of slag substitution on physical and mechanical properties of fly ash-based alkali activated binders (AABs). Cem. Concr. Res. 2019, 122, 118–135. [Google Scholar] [CrossRef]
  26. Puertas, F.; Martínez-Ramírez, S.; Alonso, S.; Vázquez, T. Alkali-activated fly ash/slag cements: Strength behaviour and hydration products. Cem. Concr. Res. 2000, 30, 1625–1632. [Google Scholar] [CrossRef]
  27. Zhang, J.; Shi, C.; Zhang, Z. Chloride binding of alkali-activated slag/fly ash cements. Constr. Build. Mater. 2019, 226, 21–31. [Google Scholar] [CrossRef]
  28. Ismail, I.; Bernal, S.A.; Provis, J.L.; San Nicolas, R.; Hamdan, S.; van Deventer, J.S.J. Modification of phase evolution in alkali-activated blast furnace slag by the incorporation of fly ash. Cem. Concr. Compos. 2014, 45, 125–135. [Google Scholar] [CrossRef]
  29. Saha, S.; Rajasekaran, C. Enhancement of the properties of fly ash based geopolymer paste by incorporating ground granulated blast furnace slag. Constr. Build. Mater. 2017, 146, 615–620. [Google Scholar] [CrossRef]
  30. El-Hassan, H.; Shehab, E.; Al-Sallamin, A. Influence of Different Curing Regimes on the Performance and Microstructure of Alkali-Activated Slag Concrete. J. Mater. Civ. Eng. 2018, 30, 04018230. [Google Scholar] [CrossRef]
  31. Dong, M.; Elchalakani, M.; Karrech, A. Curing Conditions of Alkali-Activated Fly Ash and Slag Mortar. J. Mater. Civ. Eng. 2020, 32, 04020122. [Google Scholar] [CrossRef]
  32. Mohamed, O.A. Effect of immersing geopolymer slag-fly ash mortar in sulfuric acid on strength development and stability of mass. Constr. Build. Mater. 2022, 341, 127786. [Google Scholar] [CrossRef]
  33. Maghsoodloorad, H.; Khalili, H.; Allahverdi, A. Alkali-activated phosphorous slag performance under different curing conditions: Compressive strength, hydration products, and microstructure. J. Mater. Civ. Eng. 2018, 30, 04017253. [Google Scholar] [CrossRef]
  34. Dehghani, A.; Aslani, F.; Panah, N.G. Effects of initial SiO2/Al2O3 molar ratio and slag on fly ash-based ambient cured geopolymer properties. Constr. Build. Mater. 2021, 293, 123527. [Google Scholar] [CrossRef]
  35. Saludung, A.; Azeyanagi, T.; Ogawa, Y.; Kawai, K. Mechanical and microstructural evolutions of fly ash/slag-based geopolymer at high temperatures: Effect of curing conditions. Ceram. Int. 2023, 49, 2091–2101. [Google Scholar] [CrossRef]
  36. El-Feky, M.; Kohail, M.; El-Tair, A.; Serag, M. Effect of microwave curing as compared with conventional regimes on the performance of alkali activated slag pastes. Constr. Build. Mater. 2020, 233, 117268. [Google Scholar] [CrossRef]
  37. Kürklü, G. The effect of high temperature on the design of blast furnace slag and coarse fly ash-based geopolymer mortar. Compos. Part B Eng. 2016, 92, 9–18. [Google Scholar] [CrossRef]
  38. Gholampour, A.; Ho, V.D.; Ozbakkaloglu, T. Ambient-cured geopolymer mortars prepared with waste-based sands: Mechanical and durability-related properties and microstructure. Compos. Part B Eng. 2019, 160, 519–534. [Google Scholar] [CrossRef]
  39. Liu, F.; Zheng, M.; Ye, Y. Formulation and properties of a newly developed powder geopolymer grouting material. Constr. Build. Mater. 2020, 258, 120304. [Google Scholar] [CrossRef]
  40. Ma, H.; Wu, C. Mechanical and microstructural properties of alkali-activated fly ash-slag material under sustained moderate temperature effect. Cem. Concr. Compos. 2022, 134, 104744. [Google Scholar] [CrossRef]
  41. Ling, Y.; Wang, K.; Li, W.; Shi, G.; Lu, P. Effect of slag on the mechanical properties and bond strength of fly ash-based engineered geopolymer composites. Compos. Part B Eng. 2019, 164, 747–757. [Google Scholar] [CrossRef]
  42. Hager, I.; Sitarz, M.; Mróz, K. Fly-ash based geopolymer mortar for high-temperature application—Effect of slag addition. J. Clean. Prod. 2021, 316, 128168. [Google Scholar] [CrossRef]
  43. Guo, X.; Shi, H.; Dick, W.A. Compressive strength and microstructural characteristics of class C fly ash geopolymer. Cem. Concr. Compos. 2010, 32, 142–147. [Google Scholar] [CrossRef]
  44. Liu, J.; Zhao, W.; Su, X.; Xie, X. Assessment and prediction of the mechanical properties of ternary geopolymer concrete. Front. Struct. Civ. Eng. 2022, 16, 1436–1452. [Google Scholar] [CrossRef]
  45. Li, X.; Wang, Z.; Jiao, Z. Influence of Curing on the Strength Development of Calcium-Containing Geopolymer Mortar. Materials 2013, 6, 5069–5076. [Google Scholar] [CrossRef] [PubMed]
  46. Jiao, Z.; Li, X.; Yu, Q. Effect of curing conditions on freeze-thaw resistance of geopolymer mortars containing various calcium resources. Constr. Build. Mater. 2021, 313, 125507. [Google Scholar] [CrossRef]
  47. State Bureau of Quality and Technical Supervision. Cement Mortar Strength Test Method (ISO Method); State Bureau of Quality and Technical Supervision: Beijing, China, 1999. [Google Scholar]
  48. Cheng, H.; Lin, K.-L.; Cui, R.; Hwang, C.-L.; Cheng, T.-W.; Chang, Y.-M. Effect of solid-to-liquid ratios on the properties of waste catalyst–metakaolin based geopolymers. Constr. Build. Mater. 2015, 88, 74–83. [Google Scholar] [CrossRef]
  49. Wang, J.; Li, Y.; Han, Z.; Song, S.; Li, J. Study on the preparation and combustion performance of Al F composites prepared by a solvent/non-solvent method. Surf. Coat. Technol. 2022, 440, 128455. [Google Scholar] [CrossRef]
  50. Qiu, J.; Zhao, Y.; Xing, J.; Sun, X. Fly Ash/Blast Furnace Slag-Based Geopolymer as a Potential Binder for Mine Backfilling: Effect of Binder Type and Activator Concentration. Adv. Mater. Sci. Eng. 2019, 2019, 060803. [Google Scholar] [CrossRef]
  51. Ismail, I.; Bernal, S.A.; Provis, J.L.; Nicolas, R.S.; Brice, D.G.; Kilcullen, A.R.; Hamdan, S.; van Deventer, J.S. Influence of fly ash on the water and chloride permeability of alkali-activated slag mortars and concretes. Constr. Build. Mater. 2013, 48, 1187–1201. [Google Scholar] [CrossRef]
  52. Prusty, J.K.; Pradhan, B. Investigation on effect of precursor materials and sand-to-binder ratio on strength development, acid resistance and microstructure evolution of geopolymer mortar. Constr. Build. Mater. 2022, 346, 128501. [Google Scholar] [CrossRef]
  53. Gao, X.; Yu, Q.; Brouwers, H. Reaction kinetics, gel character and strength of ambient temperature cured alkali activated slag–fly ash blends. Constr. Build. Mater. 2015, 80, 105–115. [Google Scholar] [CrossRef]
  54. Liu, J.; Su, X.; Yan, F. Experimental investigation on the effect of geopolymer adhesive on the bond behavior between CFRP and concretes. Polym. Compos. 2022, 43, 3259–3275. [Google Scholar] [CrossRef]
  55. Zhang, L.; Suleiman, A.; Nehdi, M. Self-healing in fiber-reinforced alkali-activated slag composites incorporating different additives. Constr. Build. Mater. 2020, 262, 120059. [Google Scholar] [CrossRef]
  56. Jaya, N.A.; Yun-Ming, L.; Abdullah, M.M.A.B.; Cheng-Yong, H.; Hussin, K. Effect of Sodium Hydroxide Molarity on Physical, Mechanical and Thermal Conductivity of Metakaolin Geopolymers. IOP Conf. Ser. Mater. Sci. Eng. 2018, 343, 012015. [Google Scholar] [CrossRef]
  57. Hu, X.; Shi, C.; Shi, Z.; Zhang, L. Compressive strength, pore structure and chloride transport properties of alkali-activated slag/fly ash mortars. Cem. Concr. Compos. 2019, 104, 103392. [Google Scholar] [CrossRef]
  58. Jittin, V.; Madhuri, P.; Santhanam, M.; Bahurudeen, A. Influence of preconditioning and curing methods on the durability performance of alkali-activated binder composites. Constr. Build. Mater. 2021, 311, 125346. [Google Scholar] [CrossRef]
  59. Zhu, X.; Li, W.; Du, Z.; Zhou, S.; Zhang, Y.; Li, F. Recycling and utilization assessment of steel slag in metakaolin based geopolymer from steel slag by-product to green geopolymer. Constr. Build. Mater. 2021, 305, 124654. [Google Scholar] [CrossRef]
  60. Nie, W.; Yi, S.; Xu, C.; Zhang, S.; Peng, H.; Ma, Q.; Guo, C.; Cha, X.; Jiang, C. Numerical simulation analysis of a combined wind-fog dust removal device in return air roadways based on an orthogonal test. Powder Technol. 2023, 413, 117890. [Google Scholar] [CrossRef]
  61. Aydın, S.; Baradan, B. Effect of activator type and content on properties of alkali-activated slag mortars. Compos. Part B Eng. 2014, 57, 166–172. [Google Scholar] [CrossRef]
  62. Bakharev, T.; Sanjayan, J.; Cheng, Y.-B. Effect of admixtures on properties of alkali-activated slag concrete. Cem. Concr. Res. 2000, 30, 1367–1374. [Google Scholar] [CrossRef]
  63. Tian, X.; Xu, W.; Song, S.; Rao, F.; Xia, L. Effects of curing temperature on the compressive strength and microstructure of copper tailing-based geopolymers. Chemosphere 2020, 253, 126754. [Google Scholar] [CrossRef]
  64. Shah, S.F.A.; Chen, B.; Oderji, S.Y.; Haque, M.A.; Ahmad, M.R. Improvement of early strength of fly ash-slag based one-part alkali activated mortar. Constr. Build. Mater. 2020, 246, 118533. [Google Scholar] [CrossRef]
  65. El-Hassan, H.; Elkholy, S.A. Performance evaluation and microstructure characterization of steel fiber–reinforced alkali-activated slag concrete incorporating fly ash. J. Mater. Civ. Eng. 2019, 31, 04019223. [Google Scholar] [CrossRef]
  66. Huseien, G.F.; Mirza, J.; Ismail, M.; Hussin, M.W. Influence of different curing temperatures and alkali activators on properties of GBFS geopolymer mortars containing fly ash and palm-oil fuel ash. Constr. Build. Mater. 2016, 125, 1229–1240. [Google Scholar] [CrossRef]
  67. Shoaei, P.; Musaeei, H.R.; Mirlohi, F.; Zamanabadi, S.N.; Ameri, F.; Bahrami, N. Waste ceramic powder-based geopolymer mortars: Effect of curing temperature and alkaline solution-to-binder ratio. Constr. Build. Mater. 2019, 227, 116686. [Google Scholar] [CrossRef]
  68. Viravaidya, C.; Li, M.; Mann, S. Microemulsion-based synthesis of stacked calcium carbonate (calcite) superstructures. Chem. Commun. 2004, 19, 2182–2183. [Google Scholar] [CrossRef]
  69. Williams, P.; Biernacki, J.J.; Walker, L.R.; Meyer, H.; Rawn, C.J.; Bai, J. Microanalysis of alkali-activated fly ash–CH pastes. Cem. Concr. Res. 2002, 32, 963–972. [Google Scholar] [CrossRef]
  70. Sajan, P.; Jiang, T.; Lau, C.; Tan, G.; Ng, K. Combined effect of curing temperature, curing period and alkaline concentration on the mechanical properties of fly ash-based geopolymer. Clean. Mater. 2021, 1, 100002. [Google Scholar] [CrossRef]
  71. Mo, B.-H.; Zhu, H.; Cui, X.-M.; He, Y.; Gong, S.-Y. Effect of curing temperature on geopolymerization of metakaolin-based geopolymers. Appl. Clay Sci. 2014, 99, 144–148. [Google Scholar] [CrossRef]
  72. Yuan, L.; Ma, Y.; Zhang, J.; Men, J.; Sun, T.; Zhao, H.; Wu, H.; Wang, H.; Dai, S. Orthogonal analysis and mechanism of compressive strength and microstructure of the metakaolin-fly ash geopolymer. Case Stud. Constr. Mater. 2022, 17, e01154. [Google Scholar] [CrossRef]
  73. Li, C.; Sun, H.; Li, L. A review: The comparison between alkali-activated slag (Si + Ca) and metakaolin (Si + Al) cements. Cem. Concr. Res. 2010, 40, 1341–1349. [Google Scholar] [CrossRef]
  74. Jiang, C.; Ding, H.; Gu, X.L.; Zhang, W.P. Failure mode-based calculation method for bending bearing capacities of normal cross-sections of corroded reinforced concrete beams. Eng. Struct. 2022, 258, 114113. [Google Scholar] [CrossRef]
  75. Jiang, C.; Ding, H.; Gu, X.L.; Zhang, W.P. Failure mode-based calculation method for bearing capacities of corroded RC columns under eccentric compression. Eng. Struct. 2023, 285, 116038. [Google Scholar] [CrossRef]
  76. Jiang, C.; Ding, H.; Gu, X.L.; Zhang, W.P. Calibration analysis of calculation formulas for shear capacities of corroded RC beams. Eng. Struct. 2023, 286, 116090. [Google Scholar] [CrossRef]
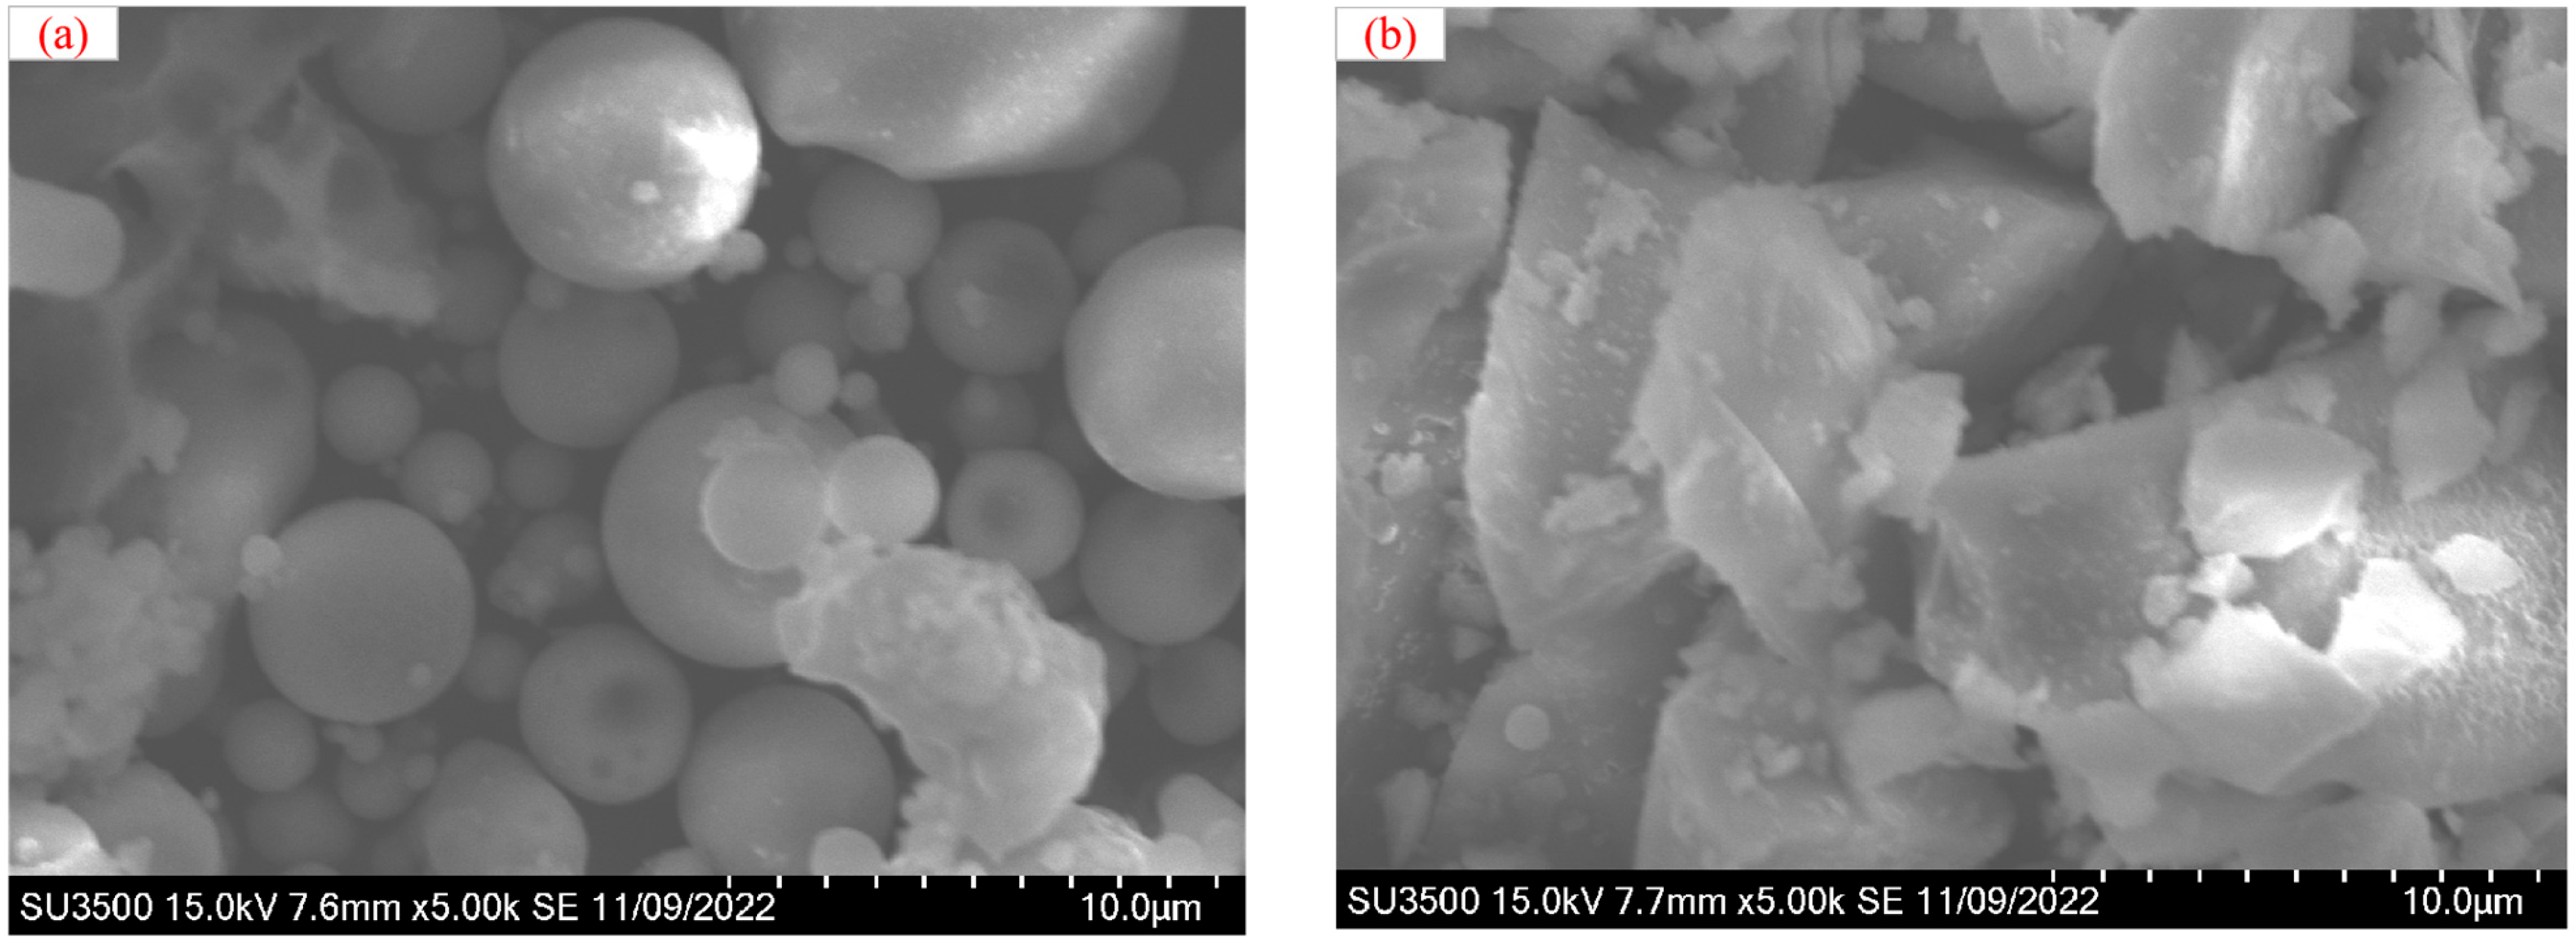
Figure 1. The SEM analysis results of precursors. (a): FA; (b): GGBS.
Minerals 13 00690 g001
Figure 2. Sample preparation flow chart.
Minerals 13 00690 g002
Figure 3. Mechanical properties test FA-GGBS-based geopolymers specimens (unit: mm). (a): Flexural strength test; (b): Compressive strength test.
Minerals 13 00690 g003
Figure 4. The mechanical properties of specimens under standard curing of 7 days and 28 days. (a): Compressive strength; (b): Flexural strength.
Minerals 13 00690 g004
Figure 5. The range analysis table under standard curing. (a): GGBS content versus compressive strength; (b): Water/binder ratio versus compressive strength; (c): Alkaline activator modulus versus compressive strength; (d): GGBS content versus flexural strength; (e): Water/binder ratio versus flexural strength; (f): Alkaline activator modulus versus flexural strength.
Minerals 13 00690 g005
Figure 6. The mechanical properties of specimens under 40 °C water curing of 7 days and 28 days. (a): Compressive strength; (b): Flexural strength.
Minerals 13 00690 g006
Figure 7. The range analysis table under 40 °C water curing. (a): GGBS content versus compressive strength; (b): Water/binder ratio versus compressive strength; (c): Alkaline activator modulus versus compressive strength; (d): GGBS content versus flexural strength; (e): Water/binder ratio versus flexural strength; (f): Alkaline activator modulus versus flexural strength.
Minerals 13 00690 g007
Figure 8. The mechanical properties of specimens under 40 °C heat curing of 7 days and 28 days. (a): Compressive strength; (b): Flexural strength.
Minerals 13 00690 g008
Figure 9. The Range analysis table under 40 °C heat curing. (a): GGBS content versus compressive strength; (b): Water/binder ratio versus compressive strength; (c): Alkaline activator modulus versus compressive strength; (d): GGBS content versus flexural strength; (e): Water/binder ratio versus flexural strength; (f): Alkaline activator modulus versus flexural strength.
Minerals 13 00690 g009aMinerals 13 00690 g009b
Figure 10. SEM of FA-GGBS-based geopolymer on 28 days under different curing conditions. (a) Standard curing; (b) Standard curing; (c) 40 °C water curing; (d) 40 °C water curing; (e) 40 °C heat curing; (f) 40 °C heat curing.
Minerals 13 00690 g010aMinerals 13 00690 g010b
Figure 11. XRD of FA-GGBS geopolymer on 28 days under different curing conditions.
Minerals 13 00690 g011
Table 1. Chemical compositions and physical characteristics of FA and GGBS.
Fly Ash (FA)Ground Granulated Blast Furnace Slag (GGBS)
Composition (mass % as oxide)
Calcium oxide (CaO)11.8534.0
Silica (SiO2)45.134.5
Alumina (Al2O3)24.217.7
Iron Oxide (Fe2O3)0.851.03
Magnesium oxide (MgO)1.266.01
Sulfur trioxide (SO3)2.11.64
Physical characteristics
Loss on ignition2.80.84
Specific surface area (m2/kg)450429
Table 2. Orthogonal factor level table.
LevelFactor AFactor BFactor C
GGBS
Content (g)
Water/Binder RatioAlkaline Activator Modulus
130%0.361.2
250%0.391.4
370%0.421.6
Table 3. Design of orthogonal experimental table.
Test
Number
FactorsMass Distribution (g)Alkaline Activator (g)
GGBS Content
(A)
Water/Binder Ratio
(B)
Alkaline Activator Modulus
(C)
Fly
Ash
(FA)
Ground Granulated Blast Furnace Slag (GGBS)NaOHNa2SiO3Water
130%0.361.284036052.27323.6252.4
230%0.391.484036044.53342.9269.1
330%0.421.684036038.1364.7283.3
450%0.361.460060044.53342.9233.1
550%0.391.660060038.1364.7247.3
650%0.421.260060052.27323.6324.4
770%0.361.684036038.1364.7211.3
870%0.391.284036052.27323.6288.4
970%0.421.484036044.53342.9305.1
Table 4. The result of range analysis on 7 days and 28 days of compressive strength and flexural strength under standard curing. (unit: MPa).
Level7 Days and 28 Days Compressive Strength7 Days and 28 Days Flexural Strength
Factor AFactor BFactor CFactor AFactor BFactor C
K172.21
(107.19)
97.20
(123.69)
111.21
(138.30)
10.20
(10.89)
11.19
(12.00)
13.29
(15.60)
K285.50
(114.90)
101.31
(131.19)
95.01
(129.21)
9.09
(12.09)
12.30
(14.91)
10.29
(11.49)
K3133.59
(151.11)
92.79
(118.29)
85.11
(105.69)
15.21
(16.50)
11.01
(12.60)
10.89
(12.39)
k124.07
(35.73)
32.40
(41.23)
37.07
(46.10)
3.40
(3.63)
3.73
(4.00)
4.43
(5.20)
k228.50
(38.30)
33.77
(43.73)
31.67
(43.07)
3.03
(4.03)
4.01
(4.97)
3.43
(3.83)
k344.53
(50.37)
30.93
(39.43)
28.37
(35.23)
5.07
(5.50)
3.67
(4.20)
3.63
(4.13)
R20.47
(14.63)
2.84
(4.3)
8.70
(10.87)
2.04
(1.87)
0.43
(0.97)
1.00
(1.37)
Note: within “( )” are the results of the 28 days range analysis.
Table 5. The result of variance analysis on 7 days and 28 days compressive strength under standard curing.
FactorDeviation Sum of SquaresDegrees of FreedomF ValueFaSignificant Level
GGBS content695.607
(366.327)
2239.287
(86.255)
F0.05 (2, 2) = 19**
(*)
Water/binder ratio12.047
(27.980)
24.144
(6.588)
F0.01 (2, 2) = 99/
Alkaline activator modulus115.740
(188.647)
239.814
(44.419)
*
(*)
Error2.91
(4.25)
2
Notes: **: The confidence level is 99%; *: The confidence level is 95%; within “( )” are the results of the 28 days variance analysis.
Table 6. The result of variance analysis on 7 days and 28 days flexural strength under standard curing.
FactorDeviation Sum of SquaresDegrees of FreedomF ValueFaSignificant Level
GGBS content7.047
(5.796)
281.000
(42.618)
F0.05 (2, 2) = 19*
(*)
Water/binder ratio0.327
(1.562)
23.759
(11.485)
F0.01 (2, 2) = 99/
Alkaline activator modulus1.680
(3.06)
219.310
(22.765)
*
(*)
Error0.09
(0.14)
2
Notes: *: The confidence level is 95%; within “( )” are the results of the 28 days variance analysis.
Table 7. The result of range analysis on 7 days and 28 days of compressive strength and flexural strength under 40 °C water curing. (unit: MPa).
Level7 Days and 28 Days Compressive Strength7 Days and 28 Days Flexural Strength
Factor AFactor BFactor CFactor AFactor BFactor C
K189.49
(113.31)
117.39
(141.00)
133.59
(159.09)
12.21
(12.81)
12.90
(13.80)
15.00
(16.29)
K2107.61
(138.81)
123.09
(146.01)
116.19
(147.00)
10.50
(11.49)
13.59
(14.49)
11.70
(12.30)
K3157.29
(174.81)
113.91
(139.89)
104.70
(120.81)
16.11
(17.01)
12.30
(12.99)
12.09
(12.69)
k129.83
(37.77)
39.13
(47.00)
44.53
(53.03)
4.07
(4.27)
4.30
(4.60)
5.00
(5.43)
k235.87
(46.27)
41.03
(48.67)
38.70
(49.00)
3.50
(3.83)
4.53
(4.83)
3.90
(4.10)
k352.43
(58.27)
37.97
(46.63)
34.90
(40.27)
5.37
(5.67)
4.10
(4.33)
4.03
(4.23)
R22.60
(20.50)
3.06
(2.04)
9.63
(12.76)
1.87
(1.84)
0.43
(0.50)
1.10
(1.33)
Note: within “( )” are the results of the 28 days range analysis.
Table 8. The result of variance analysis on 7 days and 28 days compressive strength under 40 °C water conditions.
FactorDeviation Sum of SquaresDegrees of FreedomF ValueFaSignificant Level
GGBS content821.616
(636.500)
2219.919
(107.390)
F0.05 (2, 2) = 19**
(**)
Water/binder ratio14.376
(7.047)
23.848
(1.189)
F0.01 (2, 2) = 99/
Alkaline activator modulus141.269
(255.527)
237.813
(43.112)
*
(*)
Error3.74
(5.93)
2
Notes: **: The confidence level is 99%; *: The confidence level is 95%; within “( )” are the results of the 28 days variance analysis.
Table 9. The result of variance analysis on 7 days and 28 days flexural strength under 40 °C water conditions.
FactorDeviation Sum of SquaresDegrees of FreedomF ValueFaSignificant Level
GGBS content5.496
(5.509)
250.422
(189.966)
F0.05 (2, 2) = 19*
(**)
Water/binder ratio0.282
(0.376)
22.587
(12.966)
F0.01 (2, 2) = 99/
Alkaline activator modulus2.162
(3.236)
219.835
(111.586)
*
(**)
Error0.11
(0.03)
2
Notes: **: The confidence level is 99%; *: The confidence level is 95%; within “( )” are the results of the 28 days variance analysis.
Table 10. The result of range analysis on 7 days and 28 days of compressive strength and flexural strength under 40 °C heat curing. (unit: MPa).
Level7 Days and 28 Days Compressive Strength7 Days and 28 Days Flexural Strength
Factor AFactor BFactor CFactor AFactor BFactor C
K1117.30
(159.60)
141.90
(182.19)
143.61
(177.99)
11.01
(14.40)
14.19
(17.10)
14.19
(17.40)
K2145.20
(180.09)
153.99
(191.61)
154.41
(197.31)
12.90
(15.51)
14.70
(17.40)
14.91
(17.61)
K3171.21
(214.89)
137.79
(180.81)
135.69
(179.31)
17.91
(20.49)
12.90
(15.90)
12.69
(15.39)
k139.10
(53.20)
47.30
(60.73)
47.87
(59.33)
3.67
(4.80)
4.73
(5.70)
4.73
(5.80)
k248.40
(60.03)
51.33
(63.87)
51.47
(65.77)
4.30
(5.17)
4.90
(5.80)
4.97
(5.87)
k357.07
(71.63)
45.93
(60.27)
45.23
(59.77)
5.97
(6.83)
4.30
(5.30)
4.23
(5.13)
R17.97
(18.43)
5.40
(3.60)
6.24
(6.44)
2.30
(2.03)
0.60
(0.50)
0.74
(0.74)
Note: within “( )” are the results of the 28 days range analysis.
Table 11. The result of variance analysis on 7 days and 28 days compressive strength under 40 °C heat conditions.
FactorDeviation Sum of SquaresDegrees of FreedomF ValueFaSignificant Level
GGBS content484.402
(521.042)
220.148
(24.483)
F0.05 (2, 2) = 19*
(*)
Water/binder ratio47.296
(22.996)
21.967
(1.081)
F0.01 (2, 2) = 99/
Alkaline activator modulus58.749
(77.576)
22.444
(3.645)
/
Error24.04
(21.28)
2
Notes: *: The confidence level is 95%; within “( )” are the results of the 28 days variance analysis.
Table 12. The result of variance analysis on 7 days and 28 days flexural strength under 40 °C heat conditions.
FactorDeviation Sum of SquaresDegrees of FreedomF ValueFaSignificant Level
GGBS content8.469
(7.047)
219.424
(21.550)
F0.05 (2, 2) = 19*
(*)
Water/binder ratio0.576
(0.420)
21.321
(1.284)
F0.01 (2, 2) = 99/
Alkaline activator modulus0.842
(0.987)
21.931
(3.018)
/
Error0.44
(0.33)
2
Notes: *: The confidence level is 95%; within “( )” are the results of the 28 days variance analysis.
Table 13. Results of linear regression analysis of 7 days and 28 days compressive strength of GGBS-FA-based geopolymers under standard curing.
7 Days28 Days
Non-Standardized CoefficientStandardized CoefficientNon-Standardized CoefficientStandardized Coefficient
Regression CoefficientStandard ErrorRegression CoefficientStandard Error
Constant46.76724.675/72.90825.097/
GGBS content51.1678.2270.87236.5838.3670.74
Water/binder ratio−24.44454.844−0.062−3055.781−0.091
Alkaline activator modulus−21.7508.227−0.371−27.1678.367−0.549
R20.9020.857
Table 14. Results of linear regression analysis of 7 days and 28 days compressive strength of GGBS-FA-based geopolymers under water curing.
7 Days28 Days
Non-Standardized CoefficientStandardized CoefficientNon-Standardized CoefficientStandardized Coefficient
Regression CoefficientStandard ErrorRegression CoefficientStandard Error
Constant52.42823.492/68.87514.983/
GGBS content56.5007.8320.88451.2504.9950.835
Water/binder ratio−19.4440.078−0.046−6.11133.301−0.015
Alkaline activator modulus−24.0837.832−0.377−31.9174.995−0.52
R20.9250.967
Table 15. Results of linear regression analysis of 7 days and 28 days compressive strength of GGBS-FA-based geopolymers under heat curing.
7 Days28 Days
Non-Standardized CoefficientStandardized CoefficientNon-Standardized CoefficientStandardized Coefficient
Regression CoefficientStandard ErrorRegression CoefficientStandard Error
Constant43.83129.628/40.09731.531/
GGBS content44.9179.8780.88846.08310.5120.89
Water/binder ratio−22.77865.852−0.068−7.77870.081−0.023
Alkaline activator modulus−6.5839.878−0.131.08310.5120.021
R20.8090.794
Disclaimer/Publisher’s Note: The statements, opinions and data contained in all publications are solely those of the individual author(s) and contributor(s) and not of MDPI and/or the editor(s). MDPI and/or the editor(s) disclaim responsibility for any injury to people or property resulting from any ideas, methods, instructions or products referred to in the content.