Abstract
Based on the JK Drop Weight test and principle of selective crushing, a multicomponent complex ore with its component minerals, i.e., pyrrhotite, sphalerite, and quartz, was used to explore the impact crushing characteristics and relationship between the complex ore and its component minerals. Results show that the order of impact crushing resistance is quartz > pyrrhotite > ore > sphalerite. The particle-size-distribution characteristic curve of ore crushing products is always “sandwiched” between the curves of pyrrhotite, sphalerite, and quartz within the same feed-size range. When the particle size is −63 + 53, −45 + 37.5, −31.5 + 26.5, and −22.4 + 19 mm, the component mineral pyrrhotite has a negative effect on the impact crushing of ore, while the component mineral sphalerite has a positive effect. When the particle size is −16 + 13.2 mm, the component mineral pyrrhotite has a positive effect on the crushing effect of the ore, while the component mineral sphalerite has a negative effect. The component mineral quartz always has a negative effect on the impact crushing effect of ore in all the studied particle sizes.
1. Introduction
Mineral resources are an important material for the economic and social development of many countries. Given the continuous growth of the global population and continuous improvement in people’s living standards, the global consumption of mineral resources is increasing [1,2]. The original high-grade, easy-to-grind, and easy-to-select mineral resources are practically exhausted because mineral resources are nonrenewable. Crushing is an effective approach to improve the sufficient dissociation and recovery of useful minerals in ores [3,4]. However, for the exploitation of complex ores and the design of ore-dressing plants, it is often necessary to have significant investment costs to improve the crushing and grinding processes to ensure the full dissociation and recovery of complex ores. The power consumption of crushing and grinding operations will increase fourfold by 2030 [5,6]. Thus, the reduction of the environmental impact of mineral processing and unnecessary energy consumption of the ore crushing process, which can be achieved by selective crushing, is an important research area.
Selective crushing refers to the behavior of mixed minerals, ores, or composite materials that exhibit different crushing characteristics due to differences in physical, chemical, and mechanical properties of their internal component minerals or materials when subjected to external forces. Selective crushing is an objective phenomenon in industrial practice, and its application to regulate and optimize the grinding process has a long history [7,8,9]. For example, Abouzed et al. [10] used a mixture of limestone and quartz as the research object, with limestone as the representative of soft minerals and quartz as the representative of hard minerals. The aim was to examine the influence of mixed-mineral composition on grinding parameters, grinding operation factors, energy consumption of hard and soft minerals among mixed materials, and particle size distribution of products by controlling the proportion of soft and hard minerals in the mixture. Hesse et al. [11] used a lead–zinc ore and proposed a mathematical representation of how to determine the selective-crushing probability of minerals in the ore based on geological conditions. Furthermore, by determining the crystal structure in the ore and combining the hardness, toughness, and strength indexes of the minerals in the ore, the parameters required for the operation of the system could be calculated to quantitatively analyze the selective-crushing behavior of the ore from the microstructure perspective. Stepanov et al. [12] considered a mixture of quartz and rock salt and determined that the primary factors that affect the selective crushing of soft-component minerals in the two-component mixed minerals were the hardness of the mineral itself, the feed sizes, and the ratio of the crushing energy in the mill to the energy required for crushing the two-component minerals. This was performed by observing the characteristics of the two-component mixed minerals’ crushing behavior in the mill. These studies demonstrate that the research on selective crushing had been qualitatively and quantitatively described by relevant experts. Previous studies tended to focus on the selective crushing of mixed-component minerals or the actual ore. However, there are only a few studies on the relationship between the selective-crushing characteristics of component minerals and the actual ore. Therefore, in this work, a multicomponent complex ore and its primary component minerals (pyrrhotite, sphalerite, and quartz) were considered the subjects of this study. Using the selective-crushing theory and the JK Drop Weight test, the impact crushing characteristics of a complex ore and its component minerals under single-particle impact crushing conditions are examined, in addition to the influence and relationship between the complex ore and the component minerals. The results provide new guidance for the subsequent study of crushing characteristics of multicomponent complex ores by providing an empirical and theoretical basis for quantifying the impact of all component minerals and their contents on the crushing contribution rate of a certain ore.
2. Materials and Methods
2.1. Materials
Multicomponent complex ores were obtained from a multicomponent complex ore in Guangxi. The primary useful minerals were pyrrhotite, sphalerite, and cassiterite. Primarily, the gangue minerals were quartz and calcite. Among them, the useful mineral pyrrhotite, sphalerite, and gangue mineral quartz were the three minerals in the ore forming up to 90% of the content [13,14]. To facilitate this study, the multicomponent complex ore is simplified to comprise the three pure minerals pyrite, sphalerite, and quartz to ensure the universality and representativeness of the test. The pure mineral samples were purchased from a company in Guangzhou. The drop-weight-testing equipment was developed by the Julius Kruttschnitt Mineral Research Centre of the University of Queensland, Australia. Figure 1 shows the drop-weight machine-body diagram and machine plan.
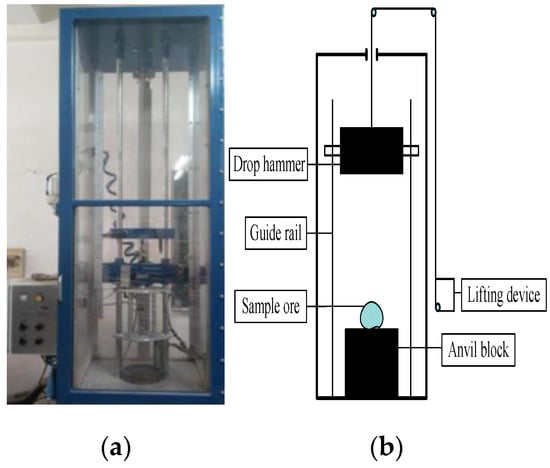
Figure 1.
Drop-weight machine equipment. (a) Drop-weight machine-body diagram and (b) drop-weight machine plan.
2.2. Methods
The JK Drop Weight test is a method used to determine the impact crushing characteristics of materials, which has become an important research method in grinding. Table 1 shows the relationship between the drop-weight-test parameters and the impact resistance of the material.

Table 1.
Relationship of material rigidity and parameters of the JK Drop Weight test.
Based on the standard JK Drop Weight test method, the prepared samples were divided into five different particle sizes; the required particle sizes were 30 particles of −63 + 53 mm, 45 particles of −45 + 37.5 mm, 90 particles of −31.5 + 26.5 mm, 90 particles of −22.4 + 19 mm, and 90 particles of −16 + 13.2 mm. They were then divided into three equal masses. The single-particle impact crushing test was performed based on the order recommended by the JK Drop Weight test form. The energy was calculated based on the height of the drop hammer, and the samples were crushed by horizontal impact with three different energies in the same feed size. The sample after impact crushing was then sieved and weighed based on each particle size and energy combination to obtain the particle size distribution of the sample impact crushing products. The crushing product t10 was used as the parameter to characterize the impact crushing degree of the ore, and t10 was the cumulative yield under sieve (%) of the crushing product less than one-tenth of the feed particle size, where the feed size was the nominal particle size, i.e., the geometric average of the upper and lower limits of the particle size. The relationship equation between t10 and ECS is shown in Equation (1):
Based on the analysis of the particle size distribution of the materials, the regression equation of particle size characteristics (Equation (2)) is applied to fit the coefficient of the particle size distribution, and then, the cumulative yield y under a sieve with a product particle size less than x was obtained:
where y is the cumulative yield under the sieve of products with particle size less than x (%); x is the feed size of the material (mm); and A1, A2, dx, and x0 are parameters related to equipment performance and material properties. According to Equation (2), the impact crushing products t10 could be obtained using the same method. By calculating 15 groups of t10 data, combining the corresponding ECS and performing fitting analysis according to Equation (1), the impact crushing characteristic parameters A and b are obtained.
3. Results and Discussion
3.1. Particle Size Distribution of Crushing Products
The products of the impact crushing tests of the multicomponent complex ore and its three component minerals, pyrrhotite, sphalerite, and quartz, which were performed under different ECS, were screened and analyzed. Origin was used to create the cumulative yield curve of the products under sieve of ore and its component minerals in semi-log coordinates. Figure 2 shows the cumulative yield curve of the impact crushing products of the ore. Figure 3, Figure 4 and Figure 5 show the cumulative yield curves of the impact crushing products of pyrrhotite, sphalerite, and quartz.
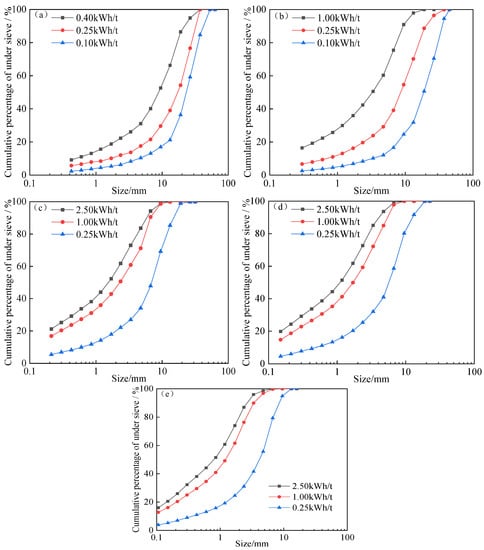
Figure 2.
Particle size distribution of ore crushing products. Feed size of (a) −63 + 53 mm, (b) −45 + 37.5 mm, (c) −31.5 + 26.5 mm, (d) −22.4 + 19 mm, and (e) −16 + 13.2 mm.
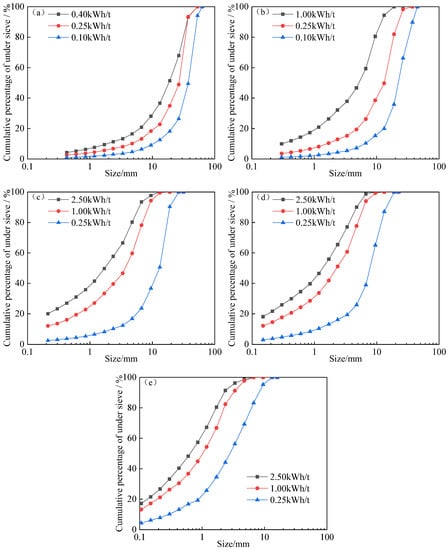
Figure 3.
Particle size distribution of pyrrhotite crushing products. Feed size of (a) −63 + 53 mm, (b) −45 + 37.5 mm, (c) −31.5 + 26.5 mm, (d) −22.4 + 19 mm, and (e) −16 + 13.2 mm.
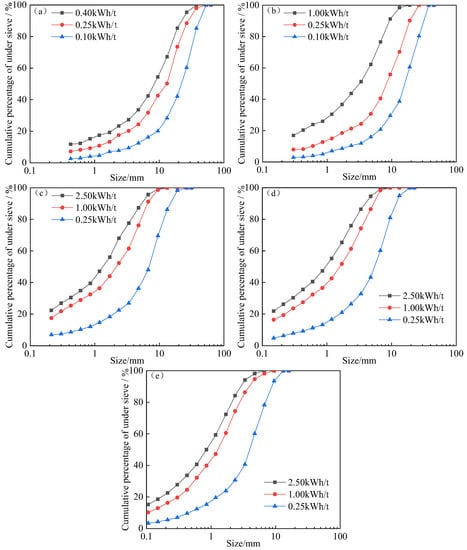
Figure 4.
Particle size distribution of sphalerite crushing products. Feed size of (a) −63 + 53 mm, (b) −45 + 37.5 mm, (c) −31.5 + 26.5 mm, (d) −22.4 + 19 mm, and (e) −16 + 13.2 mm.
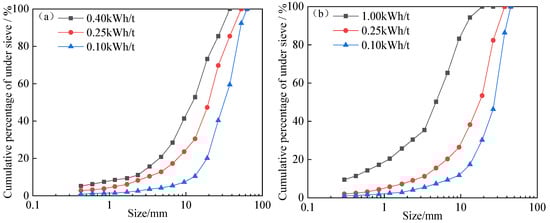
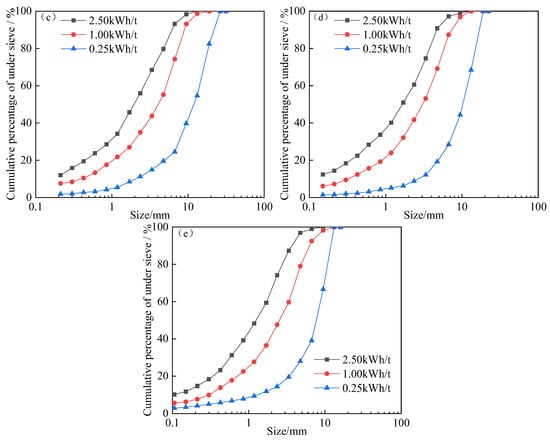
Figure 5.
Particle size distribution of quartz crushing products. Feed size of (a) −63 + 53 mm, (b) −45 + 37.5 mm, (c) −31.5 + 26.5 mm, (d) −22.4 + 19 mm, and (e) −16 + 13.2 mm.
Based on the analysis of Figure 2, Figure 3, Figure 4 and Figure 5, when the ore and its component minerals are subjected to impact crushing under the same feed particle size but different ECS, the particle-size-distribution characteristic curve of the products is basically the same and approximately decreases exponentially. Because the ECS increased, the particle-size-distribution curve of the ore and its component minerals gradually shifted upward. When the ECS was closer, the particle-size-distribution curves of the impact crushing products tended to be closer. The reason was that under a certain sieving particle size, the greater the impact crushing energy acting on the ore and its component minerals, the more completely the ore and its component minerals are broken, and the greater the cumulative yield of its products under the sieve. Furthermore, when the ECS is closer, the impact crushing effect tends to be closer. Moreover, the particle-size-distribution characteristic curves of the three impact crushing products of each particle size demonstrate that the two sides are close to each other and the middle distance was far, which indicates that the proportion of intermediate particle size produced by the ore and its component minerals under the instantaneous impact crushing force was larger than that of fine and coarse particle size. This phenomenon is consistent with the principle of crushing. The comprehensive analysis demonstrates that the impact crushing characteristics of ore and its component minerals are similar under the same feed size and the same ECS. Generally, owing to the differences in physical, chemical, and mechanical properties of the different materials, during the process of impact crushing under the same conditions, different product particle size distributions will be generated, i.e., different impact crushing characteristics will be observed. This is attributed to the similarity and relationship between component minerals and complex ores. In other words, from the whole ore level to the main mineral level of the ore, there is a certain theoretical basis to examine the relationship between the impact and crushing characteristics of multicomponent complex ores under this condition. This is also the focus of this paper’s research. In subsequent sections, according to Section 2.2, the data of the JK Drop Weight test in this section will be further processed to further explore the influence of component minerals on ore crushing.
3.2. Impact Crushing Characteristics of Ore and Its Component Minerals
Using the JK Drop Weight test data of the ore and its component minerals in Section 3.1, the particle size distribution of the impact crushing products of the ore was analyzed according to Equation (2), and 15 groups of crushing products t10 of each ore and its component minerals were calculated. Then, the actual ECS of each group of the ore and its component minerals was combined with the desired crushing product t10. Note that the ECS–t10 functional relationship was established using regression analysis of Equation (1), and then, the impact crushing characteristic parameters A and b of the ore and its component minerals were determined. The fitting curve is shown in Figure 6, and the fitting results are shown in Table 2.
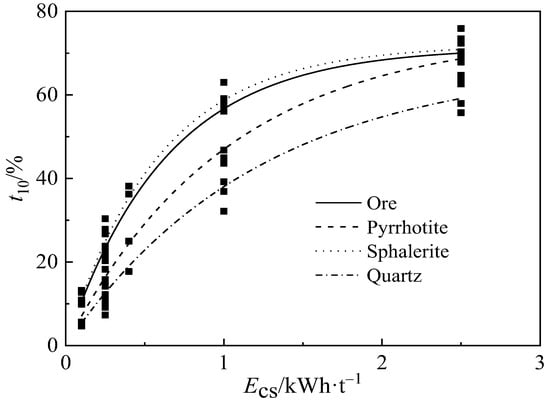
Figure 6.
Comparison of impact crushing results for ore and its component minerals.
Table 2.
Comparison results of the impact crushing test for ore and its component minerals.
Based on the analysis of Figure 6 and Table 2, with the increase in the ECS, the crushing products t10 of the ore and its component minerals increased. The greater the impact crushing energy acted on the ore sample, the more completely the ore sample was broken. The order of the A × b value of the impact crushing characteristic parameters of the ore and its component minerals is quartz < pyrrhotite < ore < sphalerite. Thus, the order of impact crushing resistance of the ore and its component minerals is sphalerite < ore < pyrrhotite < quartz. The Mohs hardness of sphalerite is 3.5, that of pyrrhotite is 3.5–4.5, and that of quartz is 7. It indicates that the A × b value and Mohs hardness have good compatibility.
Based on the analysis of Figure 6 and Table 2, the order of the fitting curve of the ECS–t10 relationship between the ore and its component minerals agreed with the order of the impact crushing resistance between the two. Under the same ECS, the fitting curve of the ECS–t10 relationship of minerals with weak resistance to impact crushing is always higher than that of minerals with strong resistance to impact crushing. Moreover, the ECS–t10 relation fitting curve of the ore was always between the ECS–t10 relation fitting curve of component minerals with strong impact crushing resistance and weak impact crushing resistance. Comprehensive analysis shows that the ore was a mixture of its component minerals; therefore, the impact crushing characteristics of the component minerals would directly affect the impact crushing characteristics of the ore. Additionally, from the principle of fragmentation, it can also be judged that the crushing effect of the ore will be between its component minerals. In the comparative study, the impact crushing parameter A × b value was used to characterize the impact crushing characteristics of the ore samples, i.e., the impact crushing resistance of ore samples. Therefore, the strength of the impact crushing resistance of the component minerals would directly affect the impact crushing strength of the ore. This corresponds to the analysis result of Section 3.1, which confirms the rationality of extending the study of the ore to the study of the main component minerals. To analyze and compare the impact crushing characteristics of the ore and its component minerals, Origin was used to create a t10 relationship diagram of crushing products under different feed sizes. The result is shown in Figure 7.
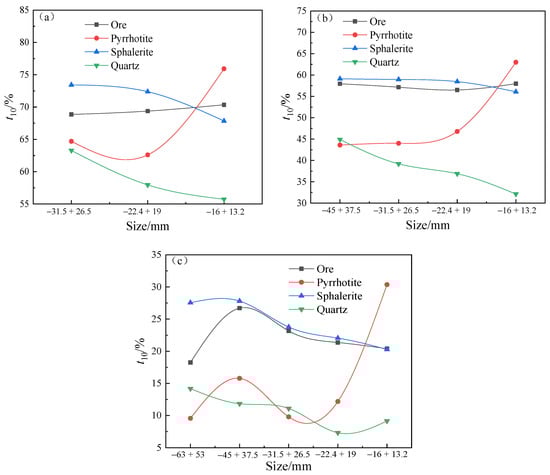
Figure 7.
The t10 of crushing products at different feed sizes for ore and its component minerals. (a) 2.50 kWh/t, (b) 1.00 kWh/t, and (c) 0.25 kWh/t.
As per the analysis of Figure 7, the t10 fitting curves of the ore crushing products of any feed size were between the t10 fitting curves of its component-mineral crushing products under the same ECS. This agreed with the results of the fitting curve of the impact crushing characteristic parameter A × b and the ECS–t10 relationship. Under different ECS, the changes in the crushing products t10 of ore and its component minerals were complex, and no obvious rule could be identified. However, an extremely important experimental phenomenon was reported in the research process. That is, under different ECS, when the ranges of feed sizes were from −22.4 + 19 to −16 + 13.2 mm, the position of the t10 curve of the crushed product of pyrrhotite and sphalerite is reversed compared to that of the crushed product of the ore, and the t10 curve of the crushed product of ore is still between the curves of the three component minerals. The reason for this phenomenon may be the presence of some impurities in the mineral. When the particle size of the mineral decreases, the small impurities in the mineral will have varying degrees of impact on the anti-crushing performance of the mineral. It is also possible that there are some small cracks in the mineral, and when the particle size of the mineral decreases, these cracks will, to some extent, promote the process of fragmentation, thereby affecting the regularity of fragmentation. After a comprehensive analysis of the test results, a reasonable conclusion was obtained, i.e., the impact crushing characteristics of component minerals affect the ore crushing characteristics, and there was a certain relationship between them that could be expressed using a mathematical model.
3.3. Influence of Component Minerals on the Impact Crushing Characteristics of Ore
Using the principle of selective crushing and from the perspective of material properties, the criterion for determining the influence of component minerals on their parent ore was formulated [15,16,17]. Using the particle-size-distribution characteristic curve of the impact crushing products of the multicomponent complex ore, the impact crushing characteristics of the ore and its component minerals were compared and analyzed. Our results demonstrated that if the particle-size-distribution characteristic curve of the impact crushing products of component minerals is below the curve of the ore, this indicates that the cumulative yield under sieve of the products generated by the mineral crushing of this group is lesser than that of the ore, i.e., the resistance of the component to impact crushing is stronger than that of the ore. In this manner, it can be simply considered that the presence of the component minerals reduces the impact crushing effect of ore, and it can be considered that the existence of component minerals has a negative effect on the impact crushing effect of ore. However, it can be simply taken to indicate that the existence of component minerals improves the impact crushing resistance of the ore; in other words, the presence of component minerals has a positive impact on improving the impact crushing resistance of the ore. Based on the abovementioned theoretical analysis, the relationship between component minerals and the impact crushing characteristics of ore is qualitatively analyzed. Figure 8, Figure 9, Figure 10, Figure 11 and Figure 12 show the relationship between the particle-size-distribution characteristic curves of component minerals and impact crushing products of ore.
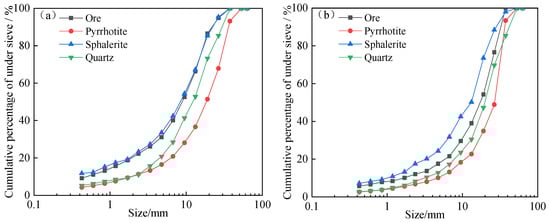
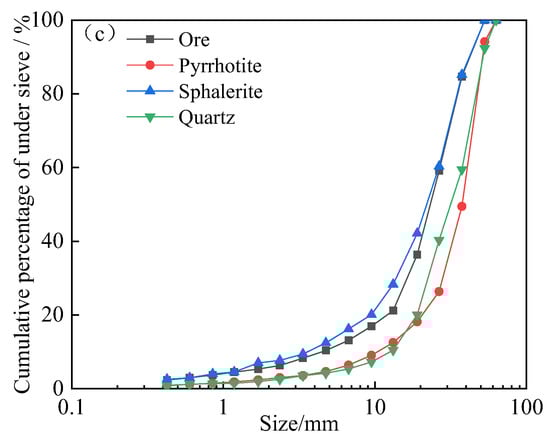
Figure 8.
Particle size distribution of crushing products from the −63 + 53 mm fraction of ore and its component minerals: (a) 0.40 kWh/t, (b) 0.25 kWh/t, and (c) 0.10 kWh/t.
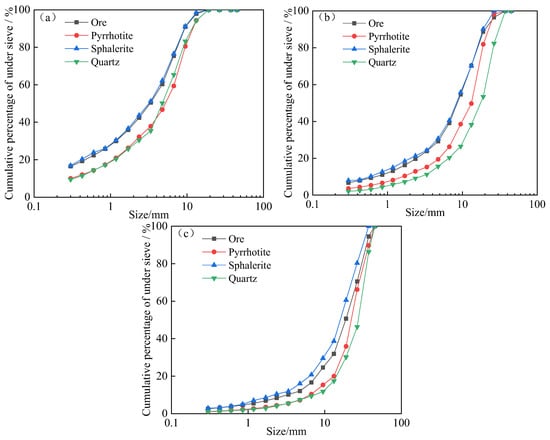
Figure 9.
Particle size distribution of crushing products from the −45 + 37.5 mm fraction of ore and its component minerals: (a) 1.00 kWh/t, (b) 0.25 kWh/t, and (c) 0.10 kWh/t.
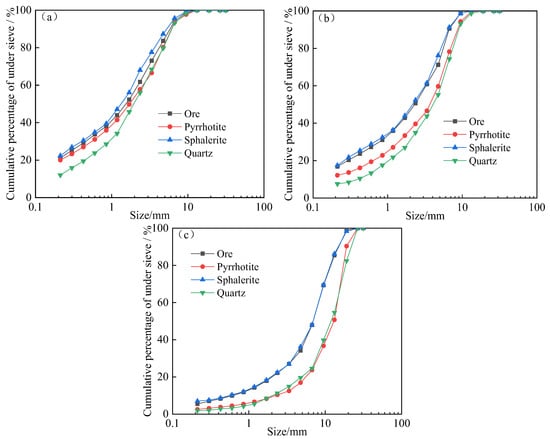
Figure 10.
Particle size distribution of crushing products from the −31.5 + 26.5 mm fraction of ore and its component minerals: (a) 2.50 kWh/t, (b) 1.00 kWh/t, and (c) 0.25 kWh/t.
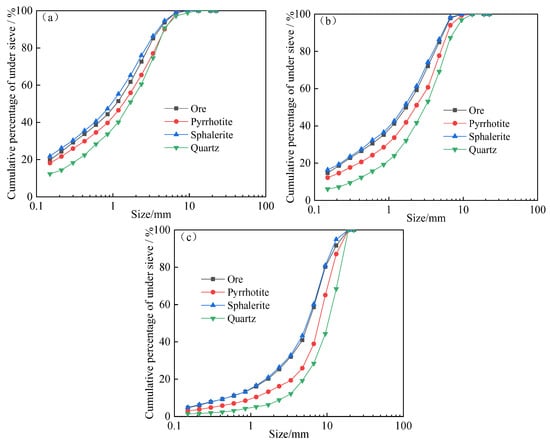
Figure 11.
Particle size distribution of crushing products from the −22.4 + 19 mm fraction of ore and its component minerals: (a) 2.50 kWh/t, (b) 1.00 kWh/t, and (c) 0.25 kWh/t.
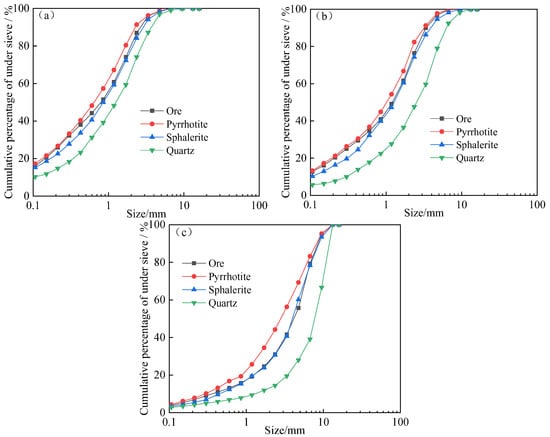
Figure 12.
Particle size distribution of crushing products from the −16 + 13.2 mm fraction of ore and its component minerals: (a) 2.50 kWh/t, (b) 1.00 kWh/t, and (c) 0.25 kWh/t.
From the analysis of Figure 8, Figure 9, Figure 10, Figure 11 and Figure 12, under the same feed particle size, as the ECS increases, the particle-size-distribution characteristic curves of the impact crushing products of the ore and its component minerals were somewhat similar. In the same range of feed particle size, the particle-size-distribution characteristic curve of the crushing products of ore was always “sandwiched” between the particle-size-distribution characteristic curve of the pyrrhotite, sphalerite, and quartz crushing products. When the feed particle size is −63 + 53, −45 + 37.5, −31.5 + 26.5, and −22.4 + 19 mm, the particle-size-distribution characteristic curve of the pyrrhotite crushing product is always under that of the ore crushing product. Moreover, the particle-size-distribution characteristic curve of the sphalerite crushing product is always above the grain-size-distribution characteristic curve of the ore crushing product. Based on the previous theoretical analysis, in the process of ore impact crushing, the presence of the component mineral pyrrhotite reduced the impact crushing effect of the ore; therefore, the presence of pyrrhotite in the ore has a negative effect on the impact crushing effect of the ore. The presence of sphalerite improves the impact crushing effect of ore, and the presence of sphalerite has a positive effect on the impact crushing effect of ore. When the feed particle size was in the range of −16 + 13.2 mm, the “position” of the particle-size-distribution curve of the crushed products of pyrrhotite and sphalerite was reversed compared to that of the ore. The particle-size-distribution characteristic curve of the crushing products of pyrrhotite was above that of the ore, while the particle-size-distribution characteristic curve of the crushing products of sphalerite was below that of the ore. This indicates that the impact crushing properties of the component pyrrhotite and sphalerite minerals should have changed compared to the ore when the feed size was −16 + 13.2 mm, and the original negative effect of pyrrhotite on the impact crushing effect of ore should have transformed into a positive effect. However, the active effect of sphalerite on the impact crushing effect of ore changed to a negative effect. Quartz was always under the particle-size-distribution characteristic curve of the ore crushing products in the feed-size ranges of −63 + 53, −45 + 37.5, −31.5 + 26.5, −22.4 + 19, and −16 + 13.2 mm, which indicates that the existence of quartz always reduced the impact crushing effect of the ore. That is, it always has a negative effect on the impact crushing effect of the ore. There is currently no very clear conclusion on the reasons for the above phenomenon. It may be that the anti-crushing performance of ores with different particle sizes is different. The particle-size crushing effect of different ores is different, which may also lead to the reversal of the crushing effect of pyrrhotite and sphalerite on ores at –16 mm. It may also be that the purity of magnetite pyrite and sphalerite is not enough, and there are some small impurities in the minerals. When the particle size of minerals becomes smaller, the fine impurity ores will have different degrees of impact on the anti-crushing properties of magnetite pyrite and sphalerite. It is also possible that there are some small cracks in the mineral, and when the particle size of the mineral decreases, these cracks will, to some extent, promote the process of fragmentation, thereby affecting the regularity of fragmentation. In response to this phenomenon, we will conduct in-depth research and analysis in the future, striving to quantitatively express its principles and laws.
4. Conclusions
The following conclusions can be drawn from this study. The impact crushing characteristic parameters of the ore are A = 71.3838, b = 1.5796, and A × b = 112.76, while its impact crushing resistance is a “soft” level. In addition, the impact crushing characteristic parameters of pyrrhotite are A = 75.0663, b = 0.9833, and A × b = 73.82, while its impact crushing resistance is a “soft” level. For sphalerite, its impact crushing characteristic parameters are A = 71.9238, b = 1.6960, and A × b = 121.98, while its impact crushing resistance is a “soft” level. For quartz, its impact crushing characteristic parameters are A = 67.8071, b = 0.8230, and A × b = 55.81, while its impact crushing resistance is a “medium” level. By comparing the values of the impact crushing characteristic parameter A × b of the four materials, the order of their impact crushing resistance is quartz > pyrrhotite > ore > sphalerite.
As the ECS is increased, the particle-size-distribution characteristic curves of the impact crushing products of ore and its component minerals are roughly similar under the same feed size. When the range of feed size is the same, the particle-size-distribution characteristic curve of the crushing products of ore is always between the curves of pyrrhotite, sphalerite, and quartz. Moreover, a relationship was identified between them that can be mathematically expressed.
In the process of ore impact crushing, when the feed sizes are within the four particle-size ranges of −63 + 53, −45 + 37.5, −31.5 + 26.5, and −22.4 + 19 mm, the presence of pyrrhotite reduces the impact crushing effect of the ore; that is, the existence of pyrrhotite has a negative effect on the impact crushing effect of the ore. However, the existence of sphalerite improves the ore impact crushing effect, i.e., the existence of sphalerite has a positive effect on the ore impact crushing effect. Nevertheless, when the feed particle size is −16 + 13.2 mm, pyrrhotite has a positive effect on the impact crushing effect of ore, while sphalerite has a negative effect. Quartz consistently has a negative effect on the impact crushing effect of ore regardless of the particle size.
These results provide new guidance for the subsequent study of crushing characteristics of multicomponent complex ores. They provide an empirical and theoretical basis for the subsequent quantification of the impact of all component minerals and their contents on the fragmentation distribution rate of a certain ore.
Author Contributions
Conceptualization, J.Y. and S.M.; Data curation, P.Z. and J.Y.; Formal analysis, X.H. and Z.L.; Funding acquisition, S.M.; Investigation, P.Z. and J.Y.; Methodology, J.Y. and S.M.; Project administration, J.Y. and S.M.; Validation, P.Z. and H.L.; Writing—original draft, P.Z. and J.Y.; Writing—review and editing, J.Y. and H.L. All authors have read and agreed to the published version of the manuscript.
Funding
This research was funded by the National Natural Science Foundation of China (No. 52274258, No. 51874105).
Institutional Review Board Statement
Not applicable.
Informed Consent Statement
Not applicable.
Data Availability Statement
Not applicable.
Conflicts of Interest
The authors declare no conflict of interest.
References
- Krausmann, F.; Gingrich, S.; Eisenmenger, N.; Erb, K.; Haberl, H.; Fischer-Kowalski, M. Growth in global materials use, GDP and population during the 20th century. Ecol. Econ. 2009, 68, 2696–2705. [Google Scholar] [CrossRef]
- Knapp, H.; Neubert, K.; Schropp, C.; Hermann, W. Viable Applications of Sensor-Based Sorting for the Processing of Mineral Resources. Chembioeng. Rev. 2014, 1, 86–95. [Google Scholar] [CrossRef]
- Ballantyne, G.R.; Powell, M.S. Benchmarking comminution energy consumption for the processing of copper and gold ores. Miner. Eng. 2014, 65, 109–114. [Google Scholar] [CrossRef]
- Lieberwirth, H.; Kühnel, L. Particle Size Effects on Selectivity in Confined Bed Comminution. Minerals 2021, 11, 342. [Google Scholar] [CrossRef]
- Norgate, T.; Jahanshahi, S. Reducing the greenhouse gas footprint of primary metal production: Where should the focus be? Miner. Eng. 2011, 24, 1563–1570. [Google Scholar] [CrossRef]
- Norgate, T.; Haque, N. Energy and greenhouse gas impacts of mining and mineral processing operations. J. Clean. Prod. 2009, 18, 266–274. [Google Scholar] [CrossRef]
- Puffe, E. Selektive Prallzerkleinerung als Mittel zur Senkung der Betriebskosten und zur Erhöhung des Ausbringens in Aufbere-itungsanlagen. Glückauf Berg Hüttenmännische Z. 1960, 96, 20–30. [Google Scholar]
- Tong, L.B.; Klein, B.; Zanin, M.; Quast, K.; Skinner, W.; Addai-Mensah, J.; Robinson, D. Stirred milling kinetics of siliceous goethitic nickel laterite for selective comminution. Miner. Eng. 2013, 49, 109–115. [Google Scholar] [CrossRef]
- Wang, E.; Shi, F.N.; Manlapig, E. Experimental and numerical studies of selective fragmentation of mineral ores in electrical comminution. Int. J. Miner. Process. 2012, 112–113, 30–36. [Google Scholar] [CrossRef]
- Abouzeid, A.M.; Fuerstenau, D.W. Grinding of mineral mixtures in high-pressure grinding rolls. Int. J. Miner. Process. 2009, 93, 59–65. [Google Scholar] [CrossRef]
- Hesse, M.; Popov, O.; Lieberwirth, H. Increasing efficiency by selective comminution. Miner. Eng. 2017, 103–104, 112–126. [Google Scholar]
- Stepanov, A.L.; Shinkorenko, S.F.; Frolov, A.V.; Kochetkov, P.A. Selective comminution of two-component mineral mixtures. J. Min. Sci. 1992, 27, 202–207. [Google Scholar] [CrossRef]
- Zhou, W.T.; Han, Y.X.; Sun, Y.S.; Yang, J.L.; MA, S.J. Multi-scale impact crushing characteristics of polymetallic sulphide ores. T. Nonferr. Metal. Soc. 2019, 29, 1929–1938. [Google Scholar] [CrossRef]
- Yang, J.L.; Shuai, Z.C.; Zhou, W.T.; Ma, S.J. Grinding Optimization of Cassiterite-Polymetallic Sulfide Ore. Minerals 2019, 9, 134. [Google Scholar] [CrossRef]
- Fandrich, R.G.; Bearman, R.A.; Boland, J.; Lim, W. Mineral liberation by particle bed breakage. Miner. Eng. 1997, 10, 175–187. [Google Scholar] [CrossRef]
- Kapur, P.C.; Fuerstenau, D.W. Energy split in multicomponent grinding. Int. J. Miner. Process. 1988, 24, 125–142. [Google Scholar] [CrossRef]
- Dündar, H.; Benzer, H. Investigating multicomponent breakage in cement grinding. Miner. Eng. 2015, 77, 131–136. [Google Scholar] [CrossRef]


Disclaimer/Publisher’s Note: The statements, opinions and data contained in all publications are solely those of the individual author(s) and contributor(s) and not of MDPI and/or the editor(s). MDPI and/or the editor(s) disclaim responsibility for any injury to people or property resulting from any ideas, methods, instructions or products referred to in the content. |
© 2023 by the authors. Licensee MDPI, Basel, Switzerland. This article is an open access article distributed under the terms and conditions of the Creative Commons Attribution (CC BY) license (https://creativecommons.org/licenses/by/4.0/).