Abstract
This study aims to design novel amine-functionalized alumina nanofibers for the removal of lead (II) and mercury (II) ions from aqueous solutions. The -Al2O3 nanofibers were prepared by calcination of boehmite, and then functionalization with 3-(2-aminoethylamino) propyl trimethoxy silane. The characterization of the nanofibers was carried out using TEM, EDS, elemental mapping, XRD, and XPS. The effects of initial concentration, pH, contact time, and selectivity were studied. The results revealed that the nanofibers can remove 98% of Hg2+ ions and 90% of Pb2+ ions from aqueous solution at concentrations of 40 mg/L and 35 mg/L, respectively. Additionally, the optimal pH conditions for mercury and lead ion adsorption were established to be 6. It was also observed that for concentrations of 100 mg/L and 250 mg/L, the majority of ion contaminants were removed by the nanofibers within the first hour. The adsorption capacities were found to be 129 mg/g and 165 mg/g for Hg2+ and 72.3 mg/g and 111 mg/g for Pb2+ at 100 mg/L and 250 mg/L concentrations, respectively. The ion-adsorption kinetic data was best fitted to a pseudo-second-order model. High sorption capacities were also demonstrated when employed to selectively adsorb mercury (II) and lead (II) ions from aqueous solutions containing Zn2+, Mg2+, Cu4+, Sn4+, and Ni4+. Desorption tests were performed to explore the stability of the heavy metals on the nanofiber.
Keywords:
alumina; nanofiber; amino; functionalized; lead (II); mercury (II); heavy metal removal; adsorption 1. Introduction
Toxic heavy metal contaminants in water sources are an ongoing serious environmental problem, due to the irreversible, harmful effects they cause to ecosystems and human health. Mercury (II) (Hg2+) ions and lead (II) (Pb2+) ions have been found in contaminated drinking water in several countries including Mexico, Saudi Arabia, India, and Egypt [1]. According to the World Health Organization (WHO), concentrations above 0.01 mg/L for lead and 0.006 mg/L for mercury are toxic to humans [2]. Lead concentrations have been found at above 0.1 mg/L in Scotland, where the contamination was identified to be primarily from lead fittings and plumbing in buildings. Excess lead ions in humans can cause health problems including neurological effects, impaired fertility, and hypertension [3]. In Japan, mercury (II) ion concentrations have been found up to 0.0055 mg/L where the main source of contamination was found to be from volcanic activity [4]. Currently, the primary causes of mercury contamination are from coal-combustion electrical power generation and industrial waste disposal [5]. Excess mercury ions in humans can lead to serious health issues such as cardiovascular collapse, kidney damage, and gastrointestinal damage. To ensure the safety and well-being of the environment and living organisms, it is crucial to implement novel and effective techniques for removing these harmful heavy metals from water [6].
There are various technologies that have been employed to remove lead and mercury ions from wastewater including reverse osmosis, sulfide frameworks, biosorption, chemical precipitation, ion exchange, and electrochemical treatment [7,8,9,10]. However, these methods are generally expensive and energy intensive, displaying little selectivity and a low adsorption capacity. In order to address these limitations, there has been a recent focus on exploring novel and innovative materials technologies. The use of nanomaterials through adsorption has been widely investigated for the removal of heavy metals as it is a simple technique, cost-effective, and has a low environmental impact [11,12]. Nanomaterials as adsorbents possess unique qualities such as high surface-to-volume ratio, small porosity, high stability, and high selectivity [13]. However, previous studies have demonstrated that the use of nanomaterials for the removal of heavy metals from aqueous solutions has resulted in low removal efficiency. Table 1 below compares different materials for the removal of lead (II) and mercury (II) ions to highlight the need for a novel and effective adsorbent.

Table 1.
Summary of the removal of Hg2+ and Pb2+ by various adsorbents.
Mercury is a naturally occurring element found in three forms: elemental metallic mercury, inorganic mercury, and methylmercury. Inorganic mercury exists in two oxidative states as Hg+ (mercurous) and Hg2+ (mercuric) forms. Hg2+ ions in an aqueous solution binds to six molecules of H2O to form an octahedral complex. Furthermore, Hg2+ is an electron pair acceptor that forms covalent bonds with nitrogen donor ligands [23]. Lead exists in two main oxidation states of Pb2+ (plumbous) and Pb4+ (plumbic) forms. Pb2+ is a relatively reactive heavy metal that can form stable compounds with bases such as NH3.
Nanofibers are a subset of a nanomaterial that has recently received attention for the removal of heavy metals from water [14]. They are a type of material synthesized from a variety of materials including ceramics, polymers, and metals, with a diameter in the nanoscale range, typically 0.1–100 nanometers [24]. Nanofiber surface chemistry can be fine-tuned with functionalized surface groups to enhance the selectivity and reactivity of ions to the nanomaterial. Additional potential benefits of nanofibers are that they can be retained and reused to improve cost effectiveness, while reducing the amount of material produced and used. For instance, these benefits have been demonstrated in a study performed by Yang et al. for the removal of 4-nonylphenol from aqueous solution using a octyl grafted -Al2O3 nanofiber [25]. The functionalized alumina nanofiber examined in this study removed 98% of the ions, whereas the pure -Al2O3 only removed 15% of the toxic ion contaminants.
The nanofiber chosen in this research paper was an amine-modified -Al2O3 nanofiber. Alumina is a ceramic material with high thermal and chemical stability. At the nanoscale, alumina fibers exhibit enhanced mechanical properties such as high tensile strength and high aspect ratio, making them ideal candidates for adsorbents. Alumina nanofibers are low-cost, rapid sorbents with high adsorption capacities and can have high selectivity to certain target metal ion contaminants [26]. Furthermore, once the nanofibers have been used for treatment, they can be removed from water using ultrafiltration and sedimentation [27]. The development of a scalable method of producing alumina nanofibers is an ongoing challenge, but with continued research and development, these materials have the potential to revolutionize a wide range of industries.
Alumina nanofibers exist in various forms including alpha (α), beta (β), and gamma (). Of these three forms, -Al2O3 nanofibers exhibit beneficially high strength with a large surface area and high porosity, which makes it a great ion adsorbent [28]. The alumina nanofiber was functionalized with amine groups to enhance adsorption capacity. Amines are organic compounds that contain a nitrogen atom with a lone pair of electrons [29]. This lone pair can form a coordinate covalent bond with metal ions, increasing the adsorption capacity of the material. Additionally, amine groups can act as proton donors or acceptors, making them ideal for interacting with acidic or basic molecules. This allows for selective adsorption of certain types of ions from a solution. The presence of amine groups can also increase the stability and durability of the adsorbent material, as they can form strong bonds with the surface of the material [30].
The adsorption of mercury (II) and lead (II) ions onto the functionalized amine group of an alumina nanofiber can be described as follows:
Hg2+(aq) + NH2–Al2O3(s) → HgO–NH–Al2O3(s)
Pb2+(aq) + NH2–Al2O3(s) → PbO–NH–Al2O3(s)
2. Materials and Methods
2.1. Materials and Reagents
Aluminum nitrate nonahydrate (Al(NO3)3-9H2O), 98% and ammonia (NH3), 28% were supplied by CHEM-SUPPLY. Toluene was provided by UNIVAR and the 3-(2-aminoethylamino) propyl trimethoxysilane by SIGMA-ALDRICH. Mercuric chloride (HgCl2) 99.5% was supplied by UNILAB and lead(II) nitrate (Pb(NO3)2) 99.9% was supplied by SIGMA-ALDRICH. Magnesium chloride hexahydrate (MgCl2-6H2O) was provided by CHEM-SUPPLY and zinc chloride (ZnCl2) was supplied by Fluka. Additionally, SIGMA-ALDRICH supplied the tin(II) chloride 98% (SnCl2), nickel(II) chloride 98% (NiCl2), and copper(II) chloride 99% (CuCl2). Nitric acid 70% (HNO3) and hydrochloric acid (HCl) 32% were supplied by RCI Labscan, and sodium hydroxide (NaOH) was provided by CHEM-SUPPLY.
2.2. Synthesis and Characterisation of Adsorbent (Al2O3–NH–NH2 Nanofiber)
The amine-functionalized alumina nanofiber was prepared by dissolving 45 g Al (NO3)3·9H2O in 75 mL deionized H2O while stirring for 30 min. To the Al (NO3)3·9H2O solution, 10 wt% ammonia aqueous solution was added dropwise at a speed of 5 mL/min (1 drop per second). The titration was concluded when the pH value of the mixture reached 5.00 and then was continuously stirred at room temperature for 1 h. The produced white gel was vacuum filtered for 2 h, and a dry gel-cake was produced. This was weighed and found to be 116.22 g, which was then transferred evenly into 6, 20 mL glass vials. These were transferred into 120 mL Teflon vessels and 2 mL ultrapure H2O was poured to the bottom of each vessel. The Teflon vessels were heated at 170 °C for 48 h. This produced a white material that was washed with ultrapure water 3 times and alcohol once and recovered using a centrifuge (3500 rpm, 30 min). The final solid was dried at 60 °C for two days. A mass of 3 g of the dried Boehmite was calcined in a tube furnace for 4.5 h at 450 °C and then added to a 150 mL beaker. An amount of 25 mL of toluene and 2.1 mL of 3-(2-aminoethylamino) propyl triethoxysilane were added to the boehmite and placed under reflux for 40 h. The product was collected and filtered with H2O and ethanol, then dried at 60 °C for two days.
The nanofibers were characterized to determine the elemental composition, surface morphology, and crystallinity. Samples were taken before and after adsorption of 50 mg/L Hg2+ and 50 mg/L Pb2+ for analysis by using transmission electron spectroscopy (TEM) using a JEOL 2100 TEM. Elemental analysis was accumulated from scanning electron microscopy–energy dispersive X-ray spectroscopy (SEM–EDS) and elemental mapping using the Zeiss Sigma FESEM (field emission scanning electron microscopy). Samples were taken before and after adsorption of 50 mg/L, 100 mg/L, and 250 mg/L of Hg2+ and Pb2+. Additionally, X-ray powder diffraction (XRD) patterns were acquired using a Bruker D8 diffractometer with Co- radiation and variable divergence split of 10 mm. The final characterization was performed using a Kratos AXIS Supra for X-ray photoelectron spectroscopy (XPS).
2.3. Heavy Metal Adsorption
The prepared alumina nanofibers were tested as adsorbent material for the removal of Hg2+ and Pb2+ from water. A stock solution (250 mg/L) of mercury (I I) ions and lead(II) ions in aqueous solutions were prepared by dissolving accurate amounts of mercury chloride (HgCl2) and lead chloride (PbCl2) in deionized water. Solutions with concentrations of 0.1, 1, 2.5, 5, 25, 50, 100, and 250 mg/L were prepared by serial dilutions from the stock solution for both mercury (II) and lead (II). Standard solutions were also made for concentrations of 500 mg/L. An amount of 20 mg of Al2O3–NH–NH2 sorbent was added to 30 mL of the mercury (II) and lead (II) stock solutions for each concentration (25–750 mg/L). The solutions were placed on a scientific rotator at room temperature (25 °C) for 3 h and at a constant speed of 60 rpm. The amount of cation removed from each solution was determined using the R4 Perkin Elmer inductively coupled plasma optical emission spectroscopy (ICP-OES) 8300DV.
To determine the removal and adsorption efficiency of the nanofiber to Hg2+ and Pb2+ ions, the removal percentage was calculated by
where C0 is the initial concentration (mg/L) before adsorbent was added and Ce is the final concentration (mg/L) after adsorption. Parameters such as volume of solution and mass of adsorbent were kept constant.
2.4. Heavy Metal Adsorption with Varying pH Values
The prepared stock solutions of 50 mg/L Hg2+ and Pb2+ were used to examine the effect of pH on the adsorption by the alumina nanofibers. Solutions of varied pH from 2 to 10 were prepared using accurate amounts of HNO3, NaOH, and deionized water. The pH of the solutions was determined using pH indicator test strip paper. A total of 20 mg of the sorbent was added to 30 mL of the prepared solutions, which were placed on the scientific rotator at room temperature (25 °C) for 3 h. The speed was kept constant at 60 rpm throughout and after 3 h, the quantity of cations removed was determined by using ICP analysis. This was further quantified using Equation (1).
2.5. Adsorption Kinetics and Adsorption Capacities
The effect of contact time with the adsorption capacity of the alumina nanofiber was studied. An amount of 20 mg of sorbent was added to 30 mL of the 100 mg/L and 250 mg/L mercury and lead solutions. The mixtures were placed on the centrifuge at room temperature (25 °C), and samples were taken after time increments of 10 min, 30 min, 1 h, 2 h, and 3 h. The scientific rotator was kept at a constant speed of 60 rpm. The amount of cation removed from the solutions at each time was determined using ICP analysis.
The amount of Hg2+ and Pb2+ ions removed from solution onto the alumina nanofiber per unit wight of adsorbent at equilibrium was calculated by [31]
where qe is the adsorption capacity (mg/g), C0 is the initial concentration (mg/L) before adsorbent is added, and Ce is the final concentration (mg/L) after adsorption. The other parameters such as the mass (m) of nanofiber 20 mg (0.02 g) and the volume (V) of solution 30 mL (0.03 L) were kept constant.
By utilizing the data obtained from the experiment, the sorption kinetics of mercury and lead ions onto the surface of alumina nanofibers were evaluated through the application of pseudo-first-order and pseudo-second-order models. The pseudo-first-order model, introduced by Lagergren (1898), is as follows [32]:
The pseudo-second-order model in linear form, proposed by Ho (1995) is described as [33]
where qe is the adsorption capacity at equilibrium (mg/g), qt is the amount of solute adsorbed at equilibrium time t (min), and k1 and k2 are the rate constants of pseudo-first-order and pseudo-second-order adsorption, respectively (g/mg/min).
2.6. Nanosorbent Selectivity
To evaluate the selectivity of alumina functionalized nanofibers to Hg2+ and Pb2+ ions, the solutions were placed in an environment containing other cations. Solutions of 100 mg/L and 250 mg/L Zn2+, Mg2+, Cu4+, Sn4+, and Ni4+ were prepared by dissolving accurate amounts of zinc chloride (ZnCl2), aqueous magnesium chloride (MgCl2•6H2O), copper chloride (CuCl2), tin chloride (SnCl2), and nickel chloride (NiCl2) in deionized water. A total of 20 mL of 50 mg/L Hg2+ and Pb2+ solutions were mixed with 20 mL of 100 mg/L and 250 mg/L Zn2+, Mg2+, Cu4+, Sn4+, and Ni4+ ions separately.
An amount of 20 mg of adsorbent was placed in each solution, and the mixtures were placed on the scientific rotator at a constant speed of 60 rpm at room temperature (25 °C). Samples were taken when the cations were initially mixed and then after time increments of 10 min, 30 min, 1 h, 2 h, and 3 h. The amount of cation removed from the solutions at each time was determined using ICP analysis. The amount of each cation adsorbed by the nanofiber was calculated using the adsorption capacity formula in Equation (2).
2.7. Desorption
The stability of Hg2+ and Pb2+ ions on the prepared nanofiber was analyzed by desorption experiments. Hg2+ and Pb2+ 50 mg/L solutions were prepared, and 30 mL was added to 16 separate centrifuge tubes (8 Hg2+ and 8 Pb2+). An amount of 20 mg Al2O3 nanofibers were added to each tube and placed on a scientific rotator at room temperature (25 °C) for 3 h and at a constant speed. The aqueous solutions were decanted from the centrifuge tubes and the loaded nanofibers were washed with demineralized water twice.
Demineralized water, 0.05 M, 0.5 M, and 1 M solutions of HCl and HNO3 were prepared and added to the Hg2+ and Pb2+ loaded nanofibers separately. This was placed on the scientific rotator at room temperature (25 °C) for 2 h at a constant speed of 60 rpm. The ion concentrations in aqueous solution were determined using ICP analysis and quantified using Equation (5):
where Cd is the concentration of ions (mg/L) in solution after desorption, C0 is the initial concentration before adsorbent is added (mg/L), and Ce is the concentration of ions in solution after two washes and addition of HNO3 or HCl (mg/L)
3. Results and Discussion
3.1. Characterisation of Alumina Nanofibers
3.1.1. Morphology Analysis Using TEM and SEM–EDS
The morphologies of the amine-functionalized -Al2O3 nanofibers were observed by using TEM microscope images, as in Figure 1a–c. These images demonstrate the dimensions of the prepared nanofibers which range in length up to 500 nm and are 25 nm wide. Similar to Riaz et al., who reported diameters of 25 to 30 nm, using a lower temperature sol–gel method to synthesize gamma alumina nanofibers [34]. Figure 1a micrograph of the nanofibers before adsorption shows that they consist of a random-distribution, mesh structure. Figure 1b,c show TEM images of the alumina nanofibers after Hg2+ and Pb2+ adsorption. The form of these Al2O3 nanofibers are cylindrical, ultrafine, crystalline structures. Many interconnected mesoporous voids around 2–25 nm in diameter were found in the pure alumina nanofibers. Similar voids were found in the Hg2+-adsorbed nanofibers, whereas the Pb2+-exposed nanofibers appear denser and more compact. The interparticle voids should allow for the contaminated water to pass through the nanofibers, increasing the surface area to volume ratio and hence the adsorption of ions onto the nanofiber.
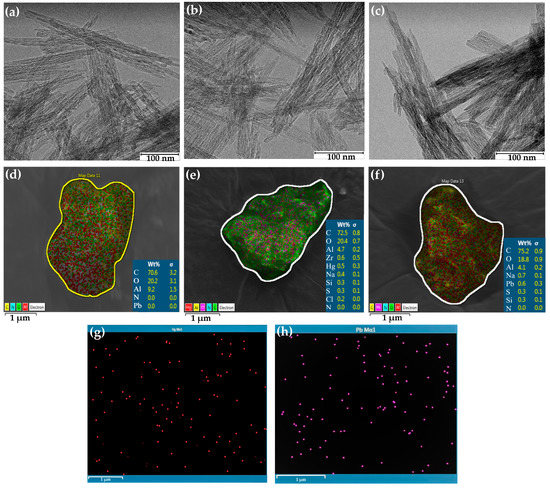
Figure 1.
Surface analysis of -Al2O3 nanofibers before and after 50 mg/L Hg2+ or Pb2+ adsorption. TEM images (a) before adsorption; (b) Hg2+ adsorption; (c) Pb2+ adsorption. SEM images (d) before adsorption (Al marked in red); (e) Hg2+ adsorption (Hg marked in red; Al marked in yellow); (f) Pb2+ adsorption and elemental mapping images (Al marked in red; Pb marked in pink); (g) Hg2+ adsorption; (h) Pb2+ adsorption.
EDS was used to determine the elemental composition of the alumina nanofiber after adsorption of mercury and lead ions. The elemental composition of the alumina nanofibers before and after adsorption are displayed in Figure 1d–f. Figure 1d explores the alumina nanofiber directly after synthesis, with the predominant elements detected to be present being carbon, oxygen, and aluminum. This is the same for the elements in Figure 1e,f, which represent the nanofibers after 50 mg/L of Hg2+ and Pb2+ adsorption, respectively. It is seen that 0.5 wt% of mercury (II) ions and 0.6 wt% of lead (II) ions were found in each selected nanofiber cluster. This confirms that heavy metal ions adsorbed onto the nanofiber and gives a clear representation of the even distribution of these elements on the surface. Further, Figure S1a–h demonstrate that there is a directly proportional relationship between ion concentration in solution and the number of ions after adsorption. Figure S1b,d refer to 100 mg/L samples of Hg2+ and Pb2+ having wt%s of 4.2 and 0.8, and Figure S1f,h refer to 250 mg/L samples having wt%s of 7.4 and 1.7, respectively. However, it is difficult to differentiate the spatial distribution of lead and mercury ions on the NH2–NH–Al2O3 composite nanofibers.
Elemental mapping using EDS was used to further qualify the data. The core electrons of the target ions were bombarded with high energy electromagnetic radiation to release energy from an L transition [16]. Figure 1g displays Hg2+ ions adsorbed on the nanofiber in red and (h) Pb2+ ions in purple. The mercury (II) and lead (II) ions were extracted from the EDS images in Figure 1e,f to provide a clearer representation of arrangement of the target ions. Additionally, elemental mapping in Figure S1a,c,e,g explores the distribution of Hg2+ and Pb2+ at concentrations of 100 mg/L and 250 mg/L, respectively. This further confirms the binding of Hg2+ and Pb2+ ions to the alumina nanofiber.
3.1.2. Structural Analysis Using XRD
To confirm the crystallinity and purity of the functionalized alumina nanofibers, XRD patterns were measured and are shown in Figure 2. The spectra explore distinct diffraction peaks at d-spacings of 0.24 nm (d220), 0.22 nm (d311), 0.20 nm (d222), 0.17 nm (d400), and 0.12 nm (d440). These XRD patterns of the amine-functionalized -Al2O3 nanofibers are consistent with studies of standard -Al2O3 powders; therefore, the grafting of the amine group did not alter the purity or crystallinity of the fiber [35,36]. The nanofibers after adsorption display a significant reduction in intensity and an increase in width, with additional small peaks at ~2θ = 25° and ~2θ = 31°. A decrease in peak height after adsorption was predicted since the addition of Hg2+ and Pb2+ to the nanofiber would alter the atoms in the crystal lattice structure. The small peaks that were observed with these samples are proposed to come from the heavy metal adsorption onto the nanofiber [37]. Finally, the XRD patterns of the alumina nanofiber after desorption using HCl and HNO3 treatments, were established. All the peak intensities increased substantially and the small peaks that presented after adsorption had disappeared, indicating the desorption of Hg2+ and Pb2+ ions. The peaks are slightly smaller than the original -alumina nanofiber; however, the peak shift remained the same, indicating the nanofiber retained its crystal structure.
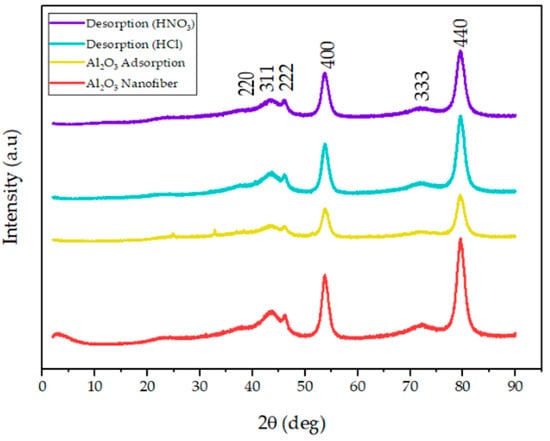
Figure 2.
XRD pattern of the amine-functionalized -Al2O3 nanofibers (red) before adsorption and after Hg2+ and Pb2+ adsorption (yellow). Additionally, the -Al2O3 nanofibers after desorption with HCl (blue) and HNO3 (purple).
3.1.3. XPS Analysis
To understand the chemical and electronic state of mercury (II) and lead (II) on the surface of the alumina nanofiber, XPS analysis was performed. Quantitative analysis was demonstrated using wide scan XPS as shown in Figure S2. Aside from Hg and Pb peaks, O 1s, N 1s, C 1s, and Al 2p peaks were detected in each scan. This corresponds to the elements found in the SEM–EDS images in Figure 2d–f. As displayed in Figure 3a, two main peaks were interpreted to demonstrate mercury ion association with the Hg-amine group. The Hg 4f doublet was fitted with four distinct peaks at 96.6 eV (P1), 100.5 (P2), 97.1 (P3), and 101.3 (P4) eV, corresponding to Hg 4f7/2 and Hg 4f5/2 oxidation states, respectively [38]. The Hg 4f region displays two spin orbit components with a splitting of 3.98 eV, which is slightly less than the standard of 4.05 eV [39]. P1 and P2 align with the binding of Hg2+ cations to the NH group on the alumina, while the P3 and P4 peaks show the formation of HgO from Hg2+ cations.
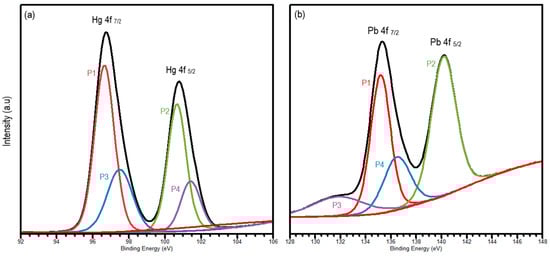
Figure 3.
High-resolution XPS spectra of (a) Hg 4f and (b) Pb 4f, where P1 and P2 represent mercury or lead ions binding to the nanofiber and P3 and P4 shows the formation of HgO or PbO, respectively.
Similarly, Pb 4f in Figure 3b was fitted as a doublet peak to explore the Pb 4f7/2 and Pb 4f5/2 oxidation states at 134.9 (P1), 140.5 (P2), 131.6 (P3), and 136.6 (P4) eV, respectively. The peaks of P1 and P2 represent the core levels of Pb2+ cations binding with the alumina of the nanofiber [39], whereas the P3 and P4 peaks associate the Pb2+ binding with oxygen to form PbO. The energy separation between the Pb 4f7/2 and Pb 4f5/2 doublet is 4.7 eV, which once again is slightly lower than the standard of 4.88 eV [40]. On both spectra, P1 and P2 peaks are wider and have a higher intensity than the P3 and P4 peaks, indicating that the presence of the metal-NH group is more predominant that metal-O.
3.2. Adsorption Studies of Alumina Nanofibers
3.2.1. Effect of Initial Concentration on Adsorption Removal Percentage
The removal of Hg2+ and Pb2+ from an aqueous solution by aluminum oxide nanofibers was studied by varying the concentration of ions over a range of 0.1–525 mg/L for 3 h of contact time. The effect of concentration is observed in Figure 4, as the percentage removal of ions in solution by the alumina nanofibers.
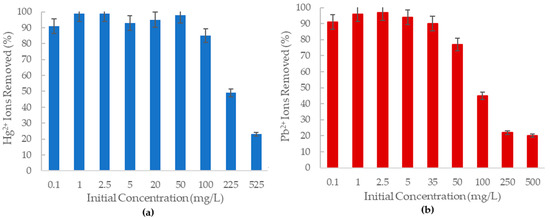
Figure 4.
The percent removal of (a) Hg2+ ions; (b) Pb2+ ions from solution at various concentrations by 20 mg of the -Al2O3 nanofiber.
As shown in Figure 4a, the amine-functionalized alumina oxide nanofiber can remove more than 80% of Hg2+ ions in solution at a concentration of 100 mg/L. At concentrations lower than 50 mg/L, the adsorbent can remove more than 90% of the mercury (II) ions in solution, with the highest removal percentage of 99% at 1 mg/L and 2.5 mg/L concentrations. The nanofiber becomes less effective as the concentration of mercury (II) ions increases as demonstrated by the 525 mg/L solution only being able to remove 23% of the Hg2+ ions. This is proposed to be due to the fixed adsorbent amount in each solution generating limited available adsorption sites on the nanofiber at higher concentrations.
A recent study in Brazil has found a mercury (II) concentration of 0.002 0.001 mg/L in their drinking water [41]. The amine grafted -Al2O3 can remove nearly 100% of aqueous mercury ions at concentrations of up to 40 mg/L. Therefore, the prepared nanofibers have the potential to remove these ions from water.
It was further observed in Figure 4b that the percentage removal of lead (II) ions decreased considerably with increasing concentration, displaying an inversely proportional relationship. At concentrations below 35 mg/L, the alumina nanofiber could remove 90% of Pb2+ ions in solutions, and at 2.5 mg/L, 97% of these ions were removed from solution. However, at 100 mg/L lead (II) concentration, the percentage removal is less than 50%, which is significantly lower when compared to the 85% removal of mercury (II) ions at 100 mg/L. The highest concentration at 500 mg/L only had 20% of the Pb2+ ions removed in solution by the alumina nanofiber. This could also be due to the less available adsorption sites to lead (II) ion ratio.
According to WHO, the highest reported amount of lead ions found in water was 0.1 mg/L (100 g/L) in Glasgow, Scotland [4]. The -Al2O3 nanofiber was tested at over 100 times this concentration and successfully removed 90% of ions in solution. Without considering other factors such as the presence of other ions in the water, it is possible the nanofiber would efficiently be able to remove these lead ions from the water.
It is recognized that mercury (II) ions have higher removal percentages induced by alumina nanofibers than lead (II) ions. This is consistent with a similar study by Mahapatra et al., which found that the order of affinity for metal ions towards Fe2O3-Al2O3 nanofibers was Cu2+ < Pb2+ < Ni2+ < Hg2+ [14]. The preference of this sorbent towards mercury (II) over lead (II) may be explained by the inner and outer sphere complexes formed and other chemical properties including electronegativity and charge per radius value. Additionally, Hg2+ is a transition element with a full outer d-orbital whereas Pb2+ is an f-block metal with an outer orbital of 6s2. Transition metals form covalent bonds more easily than main group metals as they are more electronegative [42]. Furthermore, since Pb2+ is a larger ion, the electrostatic attraction to the NH3 of the nanofiber would be less than that of Hg2+.
The TEM images of the nanofiber after Hg2+ adsorption in Figure 1e indicates that interparticle voids were still present, whereas the nanofibers examined after Pb2+ adsorption in Figure 1f were more dense and compact. The TEM images were taken after 50 mg/L ion concentration adsorption. The voids allow for increased surface area to volume ratio, and therefore, more ions can bind to the nanofiber. This may explain why more mercury ions were adsorbed onto the nanofiber than lead ions at higher concentrations.
A similar study conducted by Bao et al. fabricated mercaptoamine-functionalized silica-coated magnetic nanoparticles (MAF-SCMNPs) for the removal and recovery of Hg2+ and Pb2+ ions from water [43]. The results showed that the removal efficiencies by the nanoparticles was also better for Hg2+ than Pb2+. This was proposed to be due to the hard-soft acid–base theory where hard bases have a high affinity for hard acids and soft bases have a high affinity for soft acids. Hg2+ is considered a softer acid than Pb2+ so could form a more stable complex with the nanoparticle.
3.2.2. Effect of pH on Adsorption Removal Percentage
Altering the pH of an aqueous solution can affect the degree of ionization and solubility of the target ions and may induce redox or precipitation reactions [44]. Consequently, if the pH of the solution is not within the optimal range, the reactivity of the nanofiber surface to the ions in solution is compromised, and the adsorption process is significantly diminished. The adsorption of mercury and lead ions onto the amine-functionalized alumina nanofibers was studied at various pH values ranging from 2 to 10, as shown in Figure 5 below.
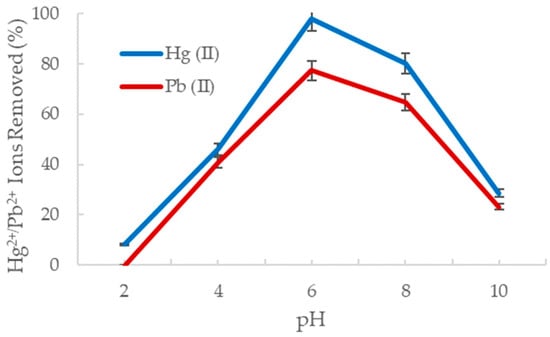
Figure 5.
The percent removal of Hg2+ (blue) and Pb2+ (red) with change in pH.
It is evident that the optimal pH for metal ion adsorption by the alumina oxide nanofiber is with 98% of the Hg2+ ions removed and 77% of the Pb2+ ions removed from solution. This is consistent with previous results in Section 3.2.1 as the pH of deionized water used was also At a lower pH, hydrogen ion concentration is too high, which protonates the sorbent site and lowers the sorption capacity of heavy metals. The nitrogen carries a lone pair of electrons, creating an electron dense amine adsorption site and readily reacts with the electron poor hydrogens from the acid [45]. As the pH increases, the positive charge of the amine group on the sorbent decreases, and hence the sorption amount decreases significantly. This may also be due to metal hydroxide reactions where the heavy metal reaches its solubility minimum and begins to form a salt precipitate [46]. These results are consistent with a study by Boudrahem et al. who observed lead ion adsorption from aqueous solution using the leaves of date trees [47]. They explored pH ranging from 3 to 7 and determined the optimal pH was 5.8, removing 100% of the Pb2+ in solution. Furthermore, approximately 40% of lead ions were removed at a pH of 3, and 50% were removed at a pH of 7. The results using the date tree leaves are broadly consistent with the results obtained using the amine-functionalized alumina nanofibers.
The adsorption behavior of Hg2+ and Pb2+ at specific pH can also be explained by the various species they form in acidic and basic solutions. In high acidity, Hg (II) primarily exists as HgOH+ or Hg2+ ions and Pb (II) is found as Pb2+ ions [48,49]. Since the sorbent site becomes protonated in an acidic environment, an extremely weak interaction is formed with the Hg (II) and Pb (II) species, resulting in decreased adsorption. At a neutral pH, Hg (II) is found as Hg(OH)2 and Pb (II) as Pb(OH)+ and Pb(OH)2 (s). As the pH increases, Hg(OH)2 is hydrated to Hg(OH)3, and Pb(OH)2 is hydrated to Pb(OH)3 and Pb(OH)42−. The radii of each species in a basic environment becomes quite large, which decreases the electrostatic attraction to the metal complexes [50]. Together, with the sorbent material becoming less positive, the adsorption efficiency declines substantially.
3.3. Adsorption Kinetics
The amount (mg/g) of lead and mercury ions adsorbed onto the alumina nanofiber was studied while considering the effect of contact time the adsorbent had with the ions in solution. By observing the adsorption kinetics, an optimal time for the maximum removal of Hg2+ and Pb2+ was established. Samples were taken at different contact times, varying from 0 to 3 h for concentrations of 100 mg/L and 250 mg/L. Figure 6 demonstrates the effect of contact time (t) on removal of Pb2+ and Hg2+ ions (qe) by the -Al2O3 nanofibers.
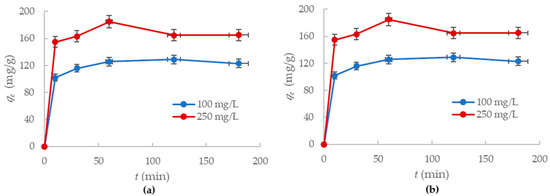
Figure 6.
Adsorption capacity of the alumina nanofibers to: (a) Hg2+ ions; (b) Pb2+ ions with changes in time.
The results in Figure 6a indicate that most mercury (II) ion adsorption occurred within the first 30 min for both concentrations. After an hour, the adsorption rate reached equilibrium and the trend line plateaued. The nanofiber removed 86% Hg2+ in the 100 mg/L solution and 55% Hg2+ ions in the 250 mg/L solution after an hour had passed. There was no significant change in ion removal between 1 and 3 h, so the adsorption capacity for mercury ions to the alumina nanofibers is 129 mg/g and 165 mg/g for the 100 mg/L and 250 mg/L concentration solutions, respectively.
Additionally, it was identified that the adsorption of lead (II) ions showed similar trends to the mercury (II) ions. Figure 6b displays the adsorption of Pb2+ ions onto the nanofiber, which was effectively complete within the first hour. Between the first and third hour, there was no significant removal of ions by the nanofibers. After the first hour, the alumina nanofibers had removed 48% of Pb2+ ions in the 100 mg/L solution and 26% of Pb2+ ions in the 250 mg/L solution. The adsorption capacities for the nanofiber to lead ions were 72.3 mg/g and 111 mg/g for the 100 mg/L and 250 mg/L concentrations, respectively.
Therefore, it is observed that the adsorption of mercury (II) and lead (II) ions to the alumina nanofibers is rapid at high concentrations. After an hour of mixing with the solution, the nanofiber reached complete adsorption equilibrium for both Hg2+ and Pb2+. The adsorption capacities of the nanofiber to mercury ions are much higher than to lead ions at the same concentrations. This further confirms the affinity of the nanofiber to mercury ions.
Pseudo-First-Order and Pseudo-Second-Order Kinetic Modeling
Mercury (II) and lead (II) sorption onto the alumina nanofibers was examined by applying pseudo-first-order and pseudo-second-order models of the kinetics data. Pseudo-first-order kinetic model describes adsorption as a physical process with which the attachment of adsorbate to the surface of the adsorbent occurs through weak Vander Waal’s forces [51]. The kinetic data were fit to Equation (3) to plot pseudo-first-order models for the adsorption of mercury (II) and lead (II) ions onto the alumina nanofiber as shown in Figure 7a,b. The pseudo-second-order model assumes chemisorption is the rate-limiting step in the adsorption process and suggests the rate of adsorption is dependent on the adsorption capacity of the adsorbate, rather than the concentration of adsorbate in solution [52]. Figure 7c,d explore pseudo-second-order models for the adsorption of mercury (II) and lead) using the kinetic data and Equation (4).
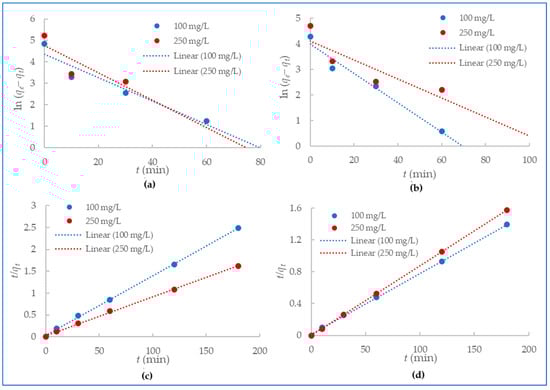
Figure 7.
Pseudo-first-order kinetics for (a) Hg2+ and (b)Pb2+ adsorption and pseudo-second-order kinetics for (c) Hg2+ and (d) Pb2+ adsorption.
Table 2 presents all the experimental and calculated kinetic parameters from the pseudo-first-order and pseudo-second-order models in Figure 7. The linear regression correlation coefficients (R2) were much higher for pseudo-second-order kinetics with a range of 0.9991–1 compared to the pseudo-first-order with a range of 0.7181–0.9672. Additionally, the calculated qe fit the qe experimental better for pseudo-second-order kinetics than pseudo-first-order for both mercury (II) and lead (II) adsorption. From these values, it is clearly demonstrated that the experimental data are in good agreement with pseudo-second-order kinetic models.
Table 2.
Pseudo-first order and pseudo-second-order kinetics parameters of Hg2+ and Pb2+ adsorption onto the alumina nanofibers.
3.4. Selectivity of the Alumina Nanofiber to Hg2+ and Pb2+ Ions
In a natural water environment, it is guaranteed that other ions are present. Therefore, the selectivity of the alumina nanofiber to mercury and lead ions was tested by introducing various cations. For this, 100 mg/L and 250 mg/L solutions of zinc (II), magnesium (II), copper (IV), tin (IV), and nickel (IV) ions were mixed separately with 50 mg/L Pb2+ and Hg2+ solutions. Samples were taken at times varying from 0 to 3 h. Figure 7 below explores the adsorption kinetics and selectivity of the alumina nanofiber to mercury and lead ions in an ion-spiked aqueous solution.
As displayed in Figure 8a,c, the removal of mercury (II) ions by the alumina nanofibers was highly effective and efficient in solutions containing other cations of 100 and 250 mg/L concentrations. In Figure 8a, the adsorption capacity reached equilibrium at 60 min and had >90% Hg2+ adsorption for all cation solutions. The highest adsorption capacity was Hg2+/Zn2+ with 0.373 mmol/g and 100% Hg2+ ions adsorbed and only 2.87% Zn2+ ions adsorbed. The lowest adsorption capacity was 0.343 mmol/g, being the Hg2+/Ni4+ solution, with 93.94% Hg2+ adsorbed and 42.3% Ni4+ adsorbed. Figure 8c exhibited a similar pattern to (a) with the majority of mercury (II) ions adsorbed within the first 60 min. The highest adsorption capacity is Hg2+/Ni4+ being 0.367 mmol/g, with 98.51% Hg2+ ions adsorbed and 59.99% Ni4+ ions adsorbed. The lowest adsorption capacity is Hg2+/Sn4+ with 0.277 mmol/g and 74.32% Hg2+ adsorbed and 94.3% Sn4+ ions adsorbed. Overall, the alumina nanofibers exhibited effective adsorption of mercury (II) ions when in competition with other heavy metals.
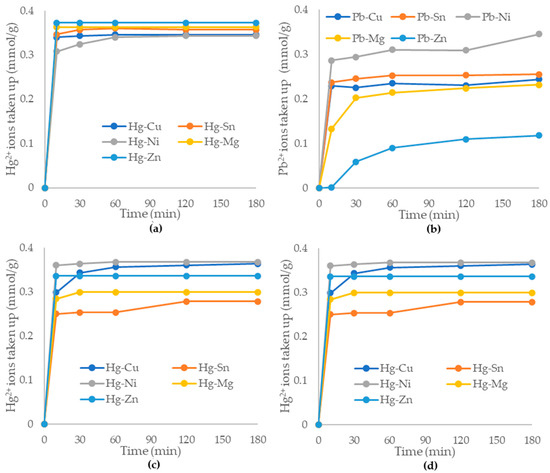
Figure 8.
Adsorption capacities of the alumina nanofiber to 50 mg/L (a) Hg2+; (b) Pb2+ in presence of 100 mg/L Zn2+, Mg2+, Cu4+, Sn4+, and Ni4+. Additionally, adsorption capacities of 50 mg/L: (c) Hg2+; (d) Pb2+ in presence of 250 mg/L Zn2+, Mg2+, Cu4+, Sn4+, and Ni4+.
Figure 8b,d plot the removal of lead (II) ions by alumina nanofibers in a competitive environment. There was a significant gap between the amount of Pb2+ ions adsorbed in the presence of each co-adsorbed cation, and adsorption equilibrium was not reached before 180 min, in most cases. In Figure 8b, the highest adsorption capacity is with Pb2+/Ni4+ at 0.345 mmol/g and 91.5% Pb2+ adsorbed and 48.96% Ni4+ adsorbed. The lowest adsorption capacity of Pb2+ to the alumina nanofibers is 0.118 mmol/g for Pb2+/Zn2+ with 50.8% Pb2+ adsorbed and 2.87% Zn2+ ions adsorbed. Figure 8d exhibits similar trends to Figure 8b with Pb2+/Ni4+ having the highest adsorption capacity of 0.364 mmol/g and 96.54% removal of Pb2+ ions and 70.1% Ni4+ adsorbed. The lowest adsorption capacity was the same as Figure 7b with Pb2+/Zn2+ showing 0.245 mmol/g with 56.7% Pb2+ adsorbed and only 20.8% Zn2+ ions adsorbed. The results demonstrate that the alumina nanofibers are not highly selective to Pb2+ ions, which compete for sorbent sites with other metal ions.
At 250 mg/L concentrations of competitive ions, the selectivity of the alumina nanofiber was similar for both mercury (II) and lead (II) ions. At 100 mg/L concentrations, there was a higher selectivity of the alumina nanofiber to mercury (II) compared to lead (II) ions. This may be due to properties such as the ion size. The ionic radii for Hg2+ and Pb2+ are 102 and 119 rpm, respectively, while radii of Ni4+, Mg2+, Cu4+, Zn2+, and Sn4+ are 70, 72, 73, 74, and 118 rpm, respectively [53]. The higher the charge relative to ionic radius is, the higher is the binding affinity to the adsorbent. Pb2+ and Hg2+ are significantly larger ions than other metals (except tin (II)) so their binding affinity is much higher. Furthermore, from observing the reactivity series, magnesium, zinc, nickel, tin, and lead readily react with acids [54]. Since all the metals were in chloride compound forms, the solution may have become slightly acidic, resulting in salt formation, reducing the adsorption ability. Copper and mercury are the lowest on the reactivity series; they are highly unreactive metals and will be displaced as their salt form by metals higher up in the series. This may explain why the alumina nanofiber is more selective to mercury (II) than other metal ions.
3.5. Desorption Studies
Recovery of heavy metals is important for reuse and environmental sustainability; so desorption studies were performed to gauge the stability and strength of the bond between mercury (II) and lead (II) ions and the amino-grafted alumina nanofibers. Loaded nanofibers were washed with deionized water to remove any excess/loose heavy metals from the surface of the nanofibers. The desorption was carried out by varying the HCl and HNO3 concentration over a 0.05 M–1.0 M range, with 2 h contact time, as displayed in Figure 9.
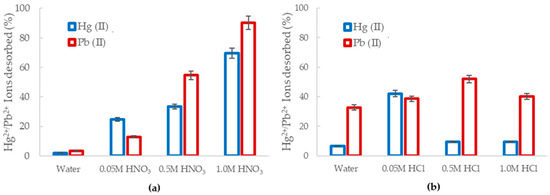
Figure 9.
The percentage of desorbed of Hg2+ (blue) and Pb2+ (red) from the loaded Al2O3 nanofibers obtained using (a) HNO3 and (b) HCl.
The use of HNO3 as a desorbing solution is displayed in Figure 9a. The desorption efficiency of mercury (II) and lead (II) from the alumina nanofibers increased as the acid molarity increased, with 69.5% and 90.2% being desorbed, respectively. In lower pH solutions, there was greater abundance of H+ ions compared to heavy metal ions. Therefore, due to the high concentration gradient and the significantly smaller size of H+, Hg (II) and Pb (II) were expelled from the sorbent site [55]. When the molarity of acid decreased, the desorption efficiency also decreased, as there was less ion exchange and competition at adsorption sites. Using purified water as a method of desorption was the least effective with only 2.1% Hg2+ 3.33% Pb2+ remaining in solution.
Desorption studies were also explored using HCl, as shown in Figure 9b. The optimum HCl concentration for ion desorption was observed to be 0.05 M for Hg2+ and 0.5 M for Pb2+. At 0.05 M HCl concentration, 62% of mercury ions were removed from the alumina nanofibers and less than 20% was desorbed at 0.5 M and 1.0 M. For the case of lead ions, 52% were desorbed at 0.5 M, 40.3% at 1.0 M, and 38% at 0.05 M HCl concentration. The low desorption efficiency can be explained by the displacement reaction that occurs between the acid and metal. At lower pH, the metal at the adsorbent site is replaced by H+, leaving the metal and acid to form a precipitate salt. The precipitates formed are HgCl2 and PbCl2 [56,57]. In a similar study, Karapinar et al. explored the desorption of Cu(II), Pb(II), and Ni(II) from TiO2 fibers using HNO3, HCl, and NaOH with concentrations of 3 M, 4 M, and 5 M. The results identified 5 M HNO3 to be the most effective eluent, desorbing 98.76% of the Pb2+ ions from the adsorbent. This was explained to be a result arising from the metal ions not being sufficiently competitive for adsorption at active sites in the presence of a high concentration of hydronium ions [58].
Overall, Pb2+ ions had a higher desorption percentage, which confirms previous results in Section 3.2.1 that Hg2+ is a more stable complex and has a greater binding strength to the alumina nanofibers than Pb2+.
4. Conclusions
Novel amine-functionalized alumina nanofibers were synthesized for adsorption and removal of mercury and lead ions from aqueous solutions. TEM, EDS, elemental mapping images, XRD, and XPS spectra confirmed the alumina nanofibers’ crystalline structure and adsorption of Hg2+ and Pb2+ ions. Adsorption experiments determined the effects of initial concentration, contact time, and selectivity of the nanofibers to mercury (II) and lead (II) ions. The maximum percentage removal of Hg2+ was observed to be 98% at a concentration of 40 mg/L and for Pb2+ it was 90% at a concentration of 35 mg/L. The amount of ion contaminants removed decreased with increasing concentration, due to a decrease in available adsorption sites. Further studies found the optimum pH for adsorption was 6 for both mercury (II) and lead (II) ions. The alumina nanofiber adsorption capacity toward Hg2+ and Pb2+ at 100 mg/L concentration was 129 mg/g and 72.3 mg/g, respectively. At 250 mg/L concentrations, the nanofiber adsorption capacity to Hg2+ was 165 mg/g and 111 mg/g for Pb2+. Adsorption equilibrium was obtained after 1 h of contact time for both ions in solution. The adsorption of Hg2+ and Pb2+ onto the alumina nanofibers is best described by pseudo-second-order reaction kinetics. Furthermore, competitive adsorption studies showed that the alumina nanofibers were highly selective to mercury (II) and less selective to lead (II) ions. The nanofibers maintained high removal of Hg2+ ions (>74%) when in competition with other metals at loadings of 100 mg/L and 250 mg/L, while >50% Pb2+ was removed in all solutions studied. Thus, the amine-functionalized alumina nanofibers proved effective for the removal of both Hg2+ and Pb2+ ions in an aqueous solution.
Supplementary Materials
The following supporting information can be downloaded at https://www.mdpi.com/article/10.3390/min13050654/s1, Figure S1: Surface analysis of -Al2O3 nanofibers after adsorption of 100 mg/L of Hg2+ (a) elemental mapping; (b) SEM–EDS, 100 mg/L Pb2+; (c) elemental mapping; (d) SEM–EDS, 250 mg/L Hg2+; (e) elemental mapping; (f) SEM–EDS and 250 mg/L Pb2+; (g) elemental mapping; (h) SEM–EDS; Figure S2: Wide scan XPS of alumina nanofiber with Hg2+ adsorption (orange) and Pb2+ adsorption (blue).
Author Contributions
Conceptualization, R.L.H., E.R.W. and S.S.; methodology, S.S. and E.R.W.; validation, R.L.H. and E.R.W.; formal analysis, R.L.H.; investigation, R.L.H.; data curation, R.L.H.; writing—original draft preparation, R.L.H.; writing—review and editing, E.R.W.; visualization, R.L.H. and E.R.W.; supervision, E.R.W.; project administration, E.R.W. and S.S.; funding acquisition, E.R.W. and S.S. All authors have read and agreed to the published version of the manuscript.
Funding
This research was funded by Queensland University of Technology, Centre for Materials Science; QCMS Linkage Spark.
Data Availability Statement
All data produced is provided in this article.
Acknowledgments
The authors acknowledge the support from Queensland University of Technology School of Chemistry and Physics and Central Analytical Research Facility (CARF).
Conflicts of Interest
The authors declare no conflict of interest.
References
- Chowdhury, S.; Mazumder, M.A.J.; Al-Attas, O.; Husain, T. Heavy metals in drinking water: Occurrences, implications, and future needs in developing countries. Sci. Total Environ. 2016, 569–570, 476–488. [Google Scholar] [CrossRef] [PubMed]
- World Health Organization. Guidelines for Drinking-Water Quality; World Health Organization: Geneva, Switzerland, 2017. [Google Scholar]
- World Health Organization. Lead in Drinking-water. In Background Document for Development of WHO Guidelines for Drinking-Water Quality; World Health Organization: Geneva, Switzerland, 2016; p. 27. [Google Scholar]
- World Health Organization. Mercury in Drinking-water. In Background Document for Development of WHO Guidelines for Drinking-Water Quality; World Health Organization: Geneva, Switzerland, 2005; p. 18. [Google Scholar]
- School, W.S. Mercury Contamination of Aquatic Environments; USGS: Reston, VA, USA, 2018. [Google Scholar]
- Saleh, T.S.; Badawi, A.K.; Salama, R.S.; Mostafa, M.M.M. Design and development of novel composites containing nickel ferrites supported on activated carbon derived from agricultural wastes and its application in water remediation. Materials 2023, 16, 2170. [Google Scholar] [CrossRef] [PubMed]
- Qu, X.; Alvarez, P.J.; Li, Q. Applications of nanotechnology in water and wastewater treatment. Water Res. 2013, 47, 3931–3946. [Google Scholar] [CrossRef] [PubMed]
- Kurniawan, T.A.; Lo, W.-H.; Liang, X.; Goh, H.H.; Othman, M.H.D.; Chong, K.-K.; Mohyuddin, A.; Kern, A.O.; Chew, K.W. Heavy Metal Removal from Aqueous Solutions Using Biomaterials and/or Functional Composites: Recent Advances and the Way Forward in Wastewater Treatment Using Digitalization. J. Compos. Sci. 2023, 7, 84. [Google Scholar] [CrossRef]
- Alyüz, B.; Veli, S. Kinetics and equilibrium studies for the removal of nickel and zinc from aqueous solutions by ion exchange resins. J. Hazard. Mater. 2009, 167, 482–488. [Google Scholar] [CrossRef]
- Panizza, M. Importance of electrode material in the electrochemical treatment of wastewater containing organic pollutants. In Electrochemistry for the Environment; Springer: New York, NY, USA, 2010; pp. 25–54. [Google Scholar]
- Hamza, M.F.; Mira, H.; Khalafalla, M.S.; Wang, J.; Wei, Y.; Yin, X.; Ning, S.; Althumayri, K.; Fouda, A. Photocatalytic Performance of Functionalized Biopolymer for Neodymium (III) Sorption and the Recovery from Leachate Solution. Catalysts 2023, 13, 672. [Google Scholar] [CrossRef]
- Benettayeb, A.; Haddou, B. New biosorbents based on the seeds, leaves and husks powder of Moringa oleifera for the effective removal of various toxic pollutants. Int. J. Environ. Anal. Chem. 2021, 1–26. [Google Scholar] [CrossRef]
- Dasgupta, N.; Ranjan, S.; Mundekkad, D.; Ramalingam, C.; Shanker, R.; Kumar, A. Nanotechnology in agro-food: From field to plate. Food Res. Int. 2015, 69, 381–400. [Google Scholar] [CrossRef]
- Mahapatra, A.; Mishra, B.; Hota, G. Studies on electrospun alumina nanofibers for the removal of chromium (VI) and fluoride toxic ions from an aqueous system. Ind. Eng. Chem. Res. 2013, 52, 1554–1561. [Google Scholar] [CrossRef]
- Tian, Y.; Wu, M.; Liu, R.; Li, Y.; Wang, D.; Tan, J.; Wu, R.; Huang, Y. Electrospun membrane of cellulose acetate for heavy metal ion adsorption in water treatment. Carbohydr. Polym. 2011, 83, 743–748. [Google Scholar] [CrossRef]
- Fouda-Mbanga, B.; Prabakaran, E.; Pillay, K. Synthesis and characterization of CDs/Al2O3 nanofibers nanocomposite for Pb2+ ions adsorption and reuse for latent fingerprint detection. Arab. J. Chem. 2020, 13, 6762–6781. [Google Scholar] [CrossRef]
- Saleh, T.A. Isotherm, kinetic, and thermodynamic studies on Hg (II) adsorption from aqueous solution by silica-multiwall carbon nanotubes. Environ. Sci. Pollut. Res. 2015, 22, 16721–16731. [Google Scholar] [CrossRef] [PubMed]
- Rahimi, S.; Moattari, R.M.; Rajabi, L.; Derakhshan, A.A.; Keyhani, M. Iron oxide/hydroxide (α, γ-FeOOH) nanoparticles as high potential adsorbents for lead removal from polluted aquatic media. J. Ind. Eng. Chem. 2015, 23, 33–43. [Google Scholar] [CrossRef]
- De Canck, E.; Lapeire, L.; De Clercq, J.; Verpoort, F.; Van Der Voort, P. New ultrastable mesoporous adsorbent for the removal of mercury ions. Langmuir 2010, 26, 10076–10083. [Google Scholar] [CrossRef]
- Liu, C.; Zhang, D.; Zhao, L.; Lu, X.; Zhang, P.; He, S.; Hu, G.; Tang, X. Synthesis of a thiacalix [4] arenetetrasulfonate-functionalized reduced graphene oxide adsorbent for the removal of lead (II) and cadmium (II) from aqueous solutions. RSC Adv. 2016, 6, 113352–113365. [Google Scholar] [CrossRef]
- Abbas, K.; Znad, H.; Awual, M.R. A ligand anchored conjugate adsorbent for effective mercury (II) detection and removal from aqueous media. Chem. Eng. J. 2018, 334, 432–443. [Google Scholar] [CrossRef]
- Huang, Z.-H.; Zheng, X.; Lv, W.; Wang, M.; Yang, Q.-H.; Kang, F. Adsorption of lead (II) ions from aqueous solution on low-temperature exfoliated graphene nanosheets. Langmuir 2011, 27, 7558–7562. [Google Scholar] [CrossRef]
- Partana, C.; Salim, A. Structure and dynamics of Hg2+ in aqueous solution: An Ab Initio QM/MM molecular dynamics study. J. Phys. Conf. Ser. 2019, 1156, 012012. [Google Scholar] [CrossRef]
- Almetwally, A.A.; El-Sakhawy, M.; Elshakankery, M.; Kasem, M. Technology of nano-fibers: Production techniques and properties-Critical review. J. Text. Assoc. 2017, 78, 5–14. [Google Scholar]
- Yang, D.; Paul, B.; Xu, W.; Yuan, Y.; Liu, E.; Ke, X.; Wellard, R.M.; Guo, C.; Xu, Y.; Sun, Y. Alumina nanofibers grafted with functional groups: A new design in efficient sorbents for removal of toxic contaminants from water. Water Res. 2010, 44, 741–750. [Google Scholar] [CrossRef]
- Golshaei, R.; Shemirani, F.; Davudabadi Farahani, M. Synthesis of sulfur nanoparticles-loaded alumina as a low-cost sorbent for the preconcentration of nickel from real samples. Sep. Sci. Technol. 2017, 52, 2523–2531. [Google Scholar] [CrossRef]
- Huang, Y.; Keller, A.A.; Cervantes-Avilés, P.; Nelson, J. Fast multielement quantification of nanoparticles in wastewater and sludge using single-particle ICP-MS. ACS EST Water 2020, 1, 205–213. [Google Scholar] [CrossRef]
- Paranjpe, K.Y. Alpha, Beta and Gamma alumina as catalyst. Pharma Innov. J. 2017, 6, 236–238. [Google Scholar]
- Gebald, C.; Wurzbacher, J.A.; Tingaut, P.; Zimmermann, T.; Steinfeld, A. Amine-based nanofibrillated cellulose as adsorbent for CO2 capture from air. Environ. Sci. Technol. 2011, 45, 9101–9108. [Google Scholar] [CrossRef] [PubMed]
- Gelles, T.; Lawson, S.; Rownaghi, A.A.; Rezaei, F. Recent advances in development of amine functionalized adsorbents for CO2 capture. Adsorption 2020, 26, 5–50. [Google Scholar] [CrossRef]
- Baaloudj, O.; Nasrallah, N.; Kenfoud, H.; Bourkeb, K.W.; Badawi, A.K. Polyaniline/Bi12TiO20 Hybrid System for Cefixime Removal by Combining Adsorption and Photocatalytic Degradation. ChemEngineering 2023, 7, 4. [Google Scholar] [CrossRef]
- Lagergren, S.K. About the theory of so-called adsorption of soluble substances. Sven. Vetenskapsakad. Handingarl 1898, 24, 1–39. [Google Scholar]
- Ho, Y.-S.; McKay, G. Pseudo-second order model for sorption processes. Process Biochem. 1999, 34, 451–465. [Google Scholar] [CrossRef]
- Riaz, S.; Sajid-ur-Rehman; Abutalib, M.; Naseem, S. Structural, Optical, and Dielectric Properties of Aluminum Oxide Nanofibers Synthesized by a Lower-Temperature Sol–Gel Approach. Electron. Mater. 2016, 45, 5185–5197. [Google Scholar] [CrossRef]
- Yang, J.; Frost, R.L. Synthesis and characterization of boehmite nanofibers. Res. Lett. Inorg. Chem. 2008, 2008, 602198. [Google Scholar] [CrossRef]
- Sifontes, Á.B.; Gutierrez, B.; Mónaco, A.; Yanez, A.; Díaz, Y.; Méndez, F.J.; Llovera, L.; Cañizales, E.; Brito, J.L. Preparation of functionalized porous nano-γ-Al2O3 powders employing colophony extract. Biotechnol. Rep. 2014, 4, 21–29. [Google Scholar] [CrossRef] [PubMed]
- Wang, J.; Zhang, W. Evaluating the adsorption of Shanghai silty clay to Cd (II), Pb (II), As (V), and Cr (VI): Kinetic, equilibrium, and thermodynamic studies. Environ. Monit. Assess. 2021, 193, 1–23. [Google Scholar] [CrossRef] [PubMed]
- Behra, P.; Bonnissel-Gissinger, P.; Alnot, M.; Revel, R.; Ehrhardt, J.J. XPS and XAS study of the sorption of Hg (II) onto pyrite. Langmuir 2001, 17, 3970–3979. [Google Scholar] [CrossRef]
- Biesinger, M.C. X-ray Photoelectron Spectroscopy (XPS) Reference Pages. 2009–2021. Available online: http://www.xpsfitting.com/2015/11/mercury.html (accessed on 28 November 2022).
- Biesinger, M.C. X-ray Photoelectron Spectroscopy (XPS) Reference Pages. 2009–2021. Available online: http://www.xpsfitting.com/search/label/Lead (accessed on 28 November 2022).
- Santos, M.D.; da Silva Júnior, F.M.R.; Zurdo, D.V.; Baisch, P.R.M.; Muccillo-Baisch, A.L.; Madrid, Y. Selenium and mercury concentration in drinking water and food samples from a coal mining area in Brazil. Environ. Sci. Pollut. Res. 2019, 26, 15510–15517. [Google Scholar] [CrossRef] [PubMed]
- Leenhouts, D. SCIENCING. Difference in Properties of Main Group & Transition Metals. 2018. Available online: https://sciencing.com/difference-between-halogen-halide-5650203.html (accessed on 17 January 2023).
- Bao, S.; Li, K.; Ning, P.; Peng, J.; Jin, X.; Tang, L. Highly effective removal of mercury and lead ions from wastewater by mercaptoamine-functionalised silica-coated magnetic nano-adsorbents: Behaviours and mechanisms. Appl. Surf. Sci. 2017, 393, 457–466. [Google Scholar] [CrossRef]
- Esposito, A.; Pagnanelli, F.; Vegliò, F. pH-related equilibria models for biosorption in single metal systems. Chem. Eng. Sci. 2002, 57, 307–313. [Google Scholar] [CrossRef]
- Kennepohl, D.; Farmer, S.; Reusch, W.; Soderberg, T. LibreTexts Chemistry. Acidity and Basicity of Amines. 2020. Available online: https://chem.libretexts.org/Bookshelves/Organic_Chemistry/Map%3A_Organic_Chemistry_(Vollhardt_and_Schore)/21%3A_Amines_and_Their_Derivatives/21.04%3A_Acidity__and__Basicity__of_Amines (accessed on 20 January 2023).
- Dahman, Y. Nanotechnology and Functional Materials for Engineers; Elsevier: Toronto, ON, Canada, 2017. [Google Scholar]
- Boudrahem, F.; Aissani-Benissad, F.; Soualah, A. Adsorption of lead (II) from aqueous solution by using leaves of date trees as an adsorbent. J. Chem. Eng. Data 2011, 56, 1804–1812. [Google Scholar] [CrossRef]
- Ugrina, M.; Čeru, T.; Nuić, I.; Trgo, M. Comparative Study of Mercury(II) Removal from Aqueous Solutions onto Natural and Iron-Modified Clinoptilolite Rich Zeolite. Processes 2020, 8, 1523. [Google Scholar] [CrossRef]
- Giraldo, L.; Moreno-Piraján, J. Pb2+ adsorption from aqueous solutions on activated carbons obtained from lignocellulosic residues. Braz. J. Chem. Eng. 2008, 25, 143–151. [Google Scholar] [CrossRef]
- Ji, C.; Ren, Y.; Yu, H.; Hua, M.; Lv, L.; Zhang, W. Highly efficient and selective Hg (II) removal from water by thiol-functionalized MOF-808: Kinetic and mechanism study. Chem. Eng. J. 2022, 430, 132960. [Google Scholar] [CrossRef]
- Shahzad, W.; Badawi, A.K.; Rehan, Z.A.; Khan, A.M.; Khan, R.A.; Shah, F.; Ali, S.; Ismail, B. Enhanced visible light photocatalytic performance of Sr0.3(Ba, Mn)0.7ZrO3 perovskites anchored on graphene oxide. Ceram. Int. 2022, 48, 24979–24988. [Google Scholar] [CrossRef]
- Sahoo, T.R.; Prelot, B. Adsorption Processes for the Removal of Contaminants from Wastewater: The Perspective Role of Nanomaterials and Nanotechnology. In Nanomaterials for the Detection and Removal of Wastewater Pollutants; Elsevier: Amsterdam, The Netherlands, 2020; pp. 161–222. [Google Scholar]
- Yoder, C. Metallic, Covalent and Ionic Radii(r)*. Wired Chemist: 2022. Available online: https://www.wiredchemist.com/chemistry/data/metallic-radii (accessed on 7 February 2023).
- Reactivity Series. BYJU’S, 2022. Available online: https://byjus.com/chemistry/reactivity-series/ (accessed on 7 February 2023).
- Vo, T.S.; Hossain, M.M.; Jeong, H.M.; Kim, K. Heavy metal removal applications using adsorptive membranes. Nano Converg. 2020, 7, 36. [Google Scholar] [CrossRef] [PubMed]
- Fiol, N.; de la Torre, F.; Demeyere, P.; Florido, A.; Villaescusa, I. Vegetable waste-based sensors for metal ion determination. Sens. Actuators B Chem. 2007, 122, 187–194. [Google Scholar] [CrossRef]
- Easley, R.A.; Byrne, R.H. The ionic strength dependence of lead (II) carbonate complexation in perchlorate media. Geochim. Cosmochim. Acta 2011, 75, 5638–5647. [Google Scholar] [CrossRef]
- Karapinar, H.S.; Kilicel, F.; Ozel, F.; Sarilmaz, A. Fast and effective removal of Pb (II), Cu (II) and Ni (II) ions from aqueous solutions with TiO2 nanofibers: Synthesis, adsorption-desorption process and kinetic studies. Int. J. Environ. Anal. Chem. 2021, 1–21. [Google Scholar] [CrossRef]


Disclaimer/Publisher’s Note: The statements, opinions and data contained in all publications are solely those of the individual author(s) and contributor(s) and not of MDPI and/or the editor(s). MDPI and/or the editor(s) disclaim responsibility for any injury to people or property resulting from any ideas, methods, instructions or products referred to in the content. |
© 2023 by the authors. Licensee MDPI, Basel, Switzerland. This article is an open access article distributed under the terms and conditions of the Creative Commons Attribution (CC BY) license (https://creativecommons.org/licenses/by/4.0/).