Abstract
The accurate prediction of coal structure is important to guide the exploration and development of coal reservoirs. Most prediction models are interpreted for a single sensitive coal seam, and the selection of sensitive parameters is correlated with the coal structure, but they ignore the interactions between different attributes. Part of it introduces the concept of the geological strength index (GSI) of coal rocks in order to achieve a multi-element macroscopic description and quantitative characterization of coal structure; however, the determination of coal structure involves some uncertainties among the properties of coal, such as lithology, gas content and tectonic fracture, due to their complex nature. Fuzzy inference systems provide a knowledge discovery process to handle uncertainty. The study shows that a type-2 fuzzy inference system (T2-FIS) with multi-attribute fusion is used to effectively fuse pre-stack and post-stack seismic inversion reservoir parameters and azimuthal seismic attribute parameters in order to produce more accurate prediction results for the Hengling block in the Shanxi area. The fuzzy set rules generated in this paper can provide a more reliable prediction of coal structure in the GSI system. The proposed system has been tested on various datasets and the results show that it is capable of providing reliable and high-quality coal structure predictions.
1. Introduction
Coal structure indexes the internal structural characteristics of coal reservoirs under the action of tectonic stress. The fractional anisotropy of coal structure can directly reflect the differential distribution characteristics of the coalbed methane (CBM) selection area and is an important parameter for coal reservoir quality evaluation [1]. Using continuous logging parameters to predict coal structure is a valuable tool for geologists and mining engineers. By understanding the sensitivity between logging parameters and coal structure, it is possible to make reasonable predictions about the most suitable mining areas and to enhance hazard warning capabilities in the high fracture areas of coal mines, such as gas protrusions and roof collapses [2,3].
Although an increasing number of sensitive logging reflections have been identified, experimental results from different core analyses [4] have demonstrated their limited predictive relevance. Shi et al. (2020) [5] intended to develop a quantitative coal structure identification model based on the kernel Fisher discriminant method through the idea of dimensionality reduction, which was applied to CBM in the Qinshui Basin. Mou et al. (2020) [6] developed a new method to predict index sensitivity by using tectonic coal stress concentrations. Zhang et al. (2021) [7] used a combination of logging curves and structural curvature to estimate the coal structure index of the degree of damage and predicted it by multiple linear regression methods. Some studies have calculated coal structure vulnerability indices by integrating two tools, the analytic hierarchy process and geographic information systems. These studies have identified some early warning values for water-inrush hazard areas for roughly classified coal structure results [8]. Other studies have implemented an elastic impedance inversion method for the fluid factor and brittleness coefficient, using both as effective pore-fluid bulk moduli to estimate coal structural distribution [9,10]. However, the use of multiple solutions for the inversion reduces the accuracy of the predictions, whereas they become more accurate with the addition of rich logging parameters, but the well extrapolation process still requires the inversion of seismic waves in order to solve for the relevant parameters, resulting in a certain error accumulation [11,12].
The Geological Strength Index (GSI) is a rock quality evaluation tool, formally proposed by Evert Hoek et al. (1997) [13], which has been widely used to assist in predicting coal structures. It is based on a numerical scale that assesses various parameters, such as lithology, stratigraphy, and structural complexity. However, the GSI chart relies on visual examination and if the number of core samples examined is insufficient, there may be an increase in subjective uncertainty [14]. Fuzzy inference systems (FISs) offer a more reliable method of predicting coal structures in a way that approximates human reasoning and decision-making, taking into account the uncertainty of the data. Fuzzy Logic Systems (FLSs) offer a non-traditional approach to perceptual modeling and have been successfully applied in the fields of control, information retrieval and system modeling, etc. The related singleton fuzzification works have been widely implemented to build predictive models of coal structures [15,16,17,18,19] and have been integrated into mainstream engineering software, such as Geolog, MATLAB and Python [20,21,22]. Compared to its type-1 fuzzy set (T1-FS) counterpart for rock parameters, the interval type-2 fuzzy logic system (IT2-FLS) in this study shows better performance in four areas, i.e., uncertainty simulation, rule base volume, control surface smoothness and adaptability.
In this paper, the high-resolution reservoir inversion results and fracture seismic attribute information are used to fuzzy fuse multiple attributes according to the GSI chart. The integrated attributes depend on the rule number and training results of the fuzzy model, which can effectively and accurately predict subsurface reservoir structures. In the data mining process, we inherit the methods used to obtain previous results and realize the data-driven sample acquisition based on the data, which saves the cost of human labeling. The training set is combined with the information fusion capability of the fuzzy system, which, in turn, improves the prediction accuracy of the coal body structure. Therefore, this study uses IT2-FLS combined with GSI in order to provide a theoretical basis for the accurate prediction of coal structure by multi-attribute fusion.
2. Geological Setting
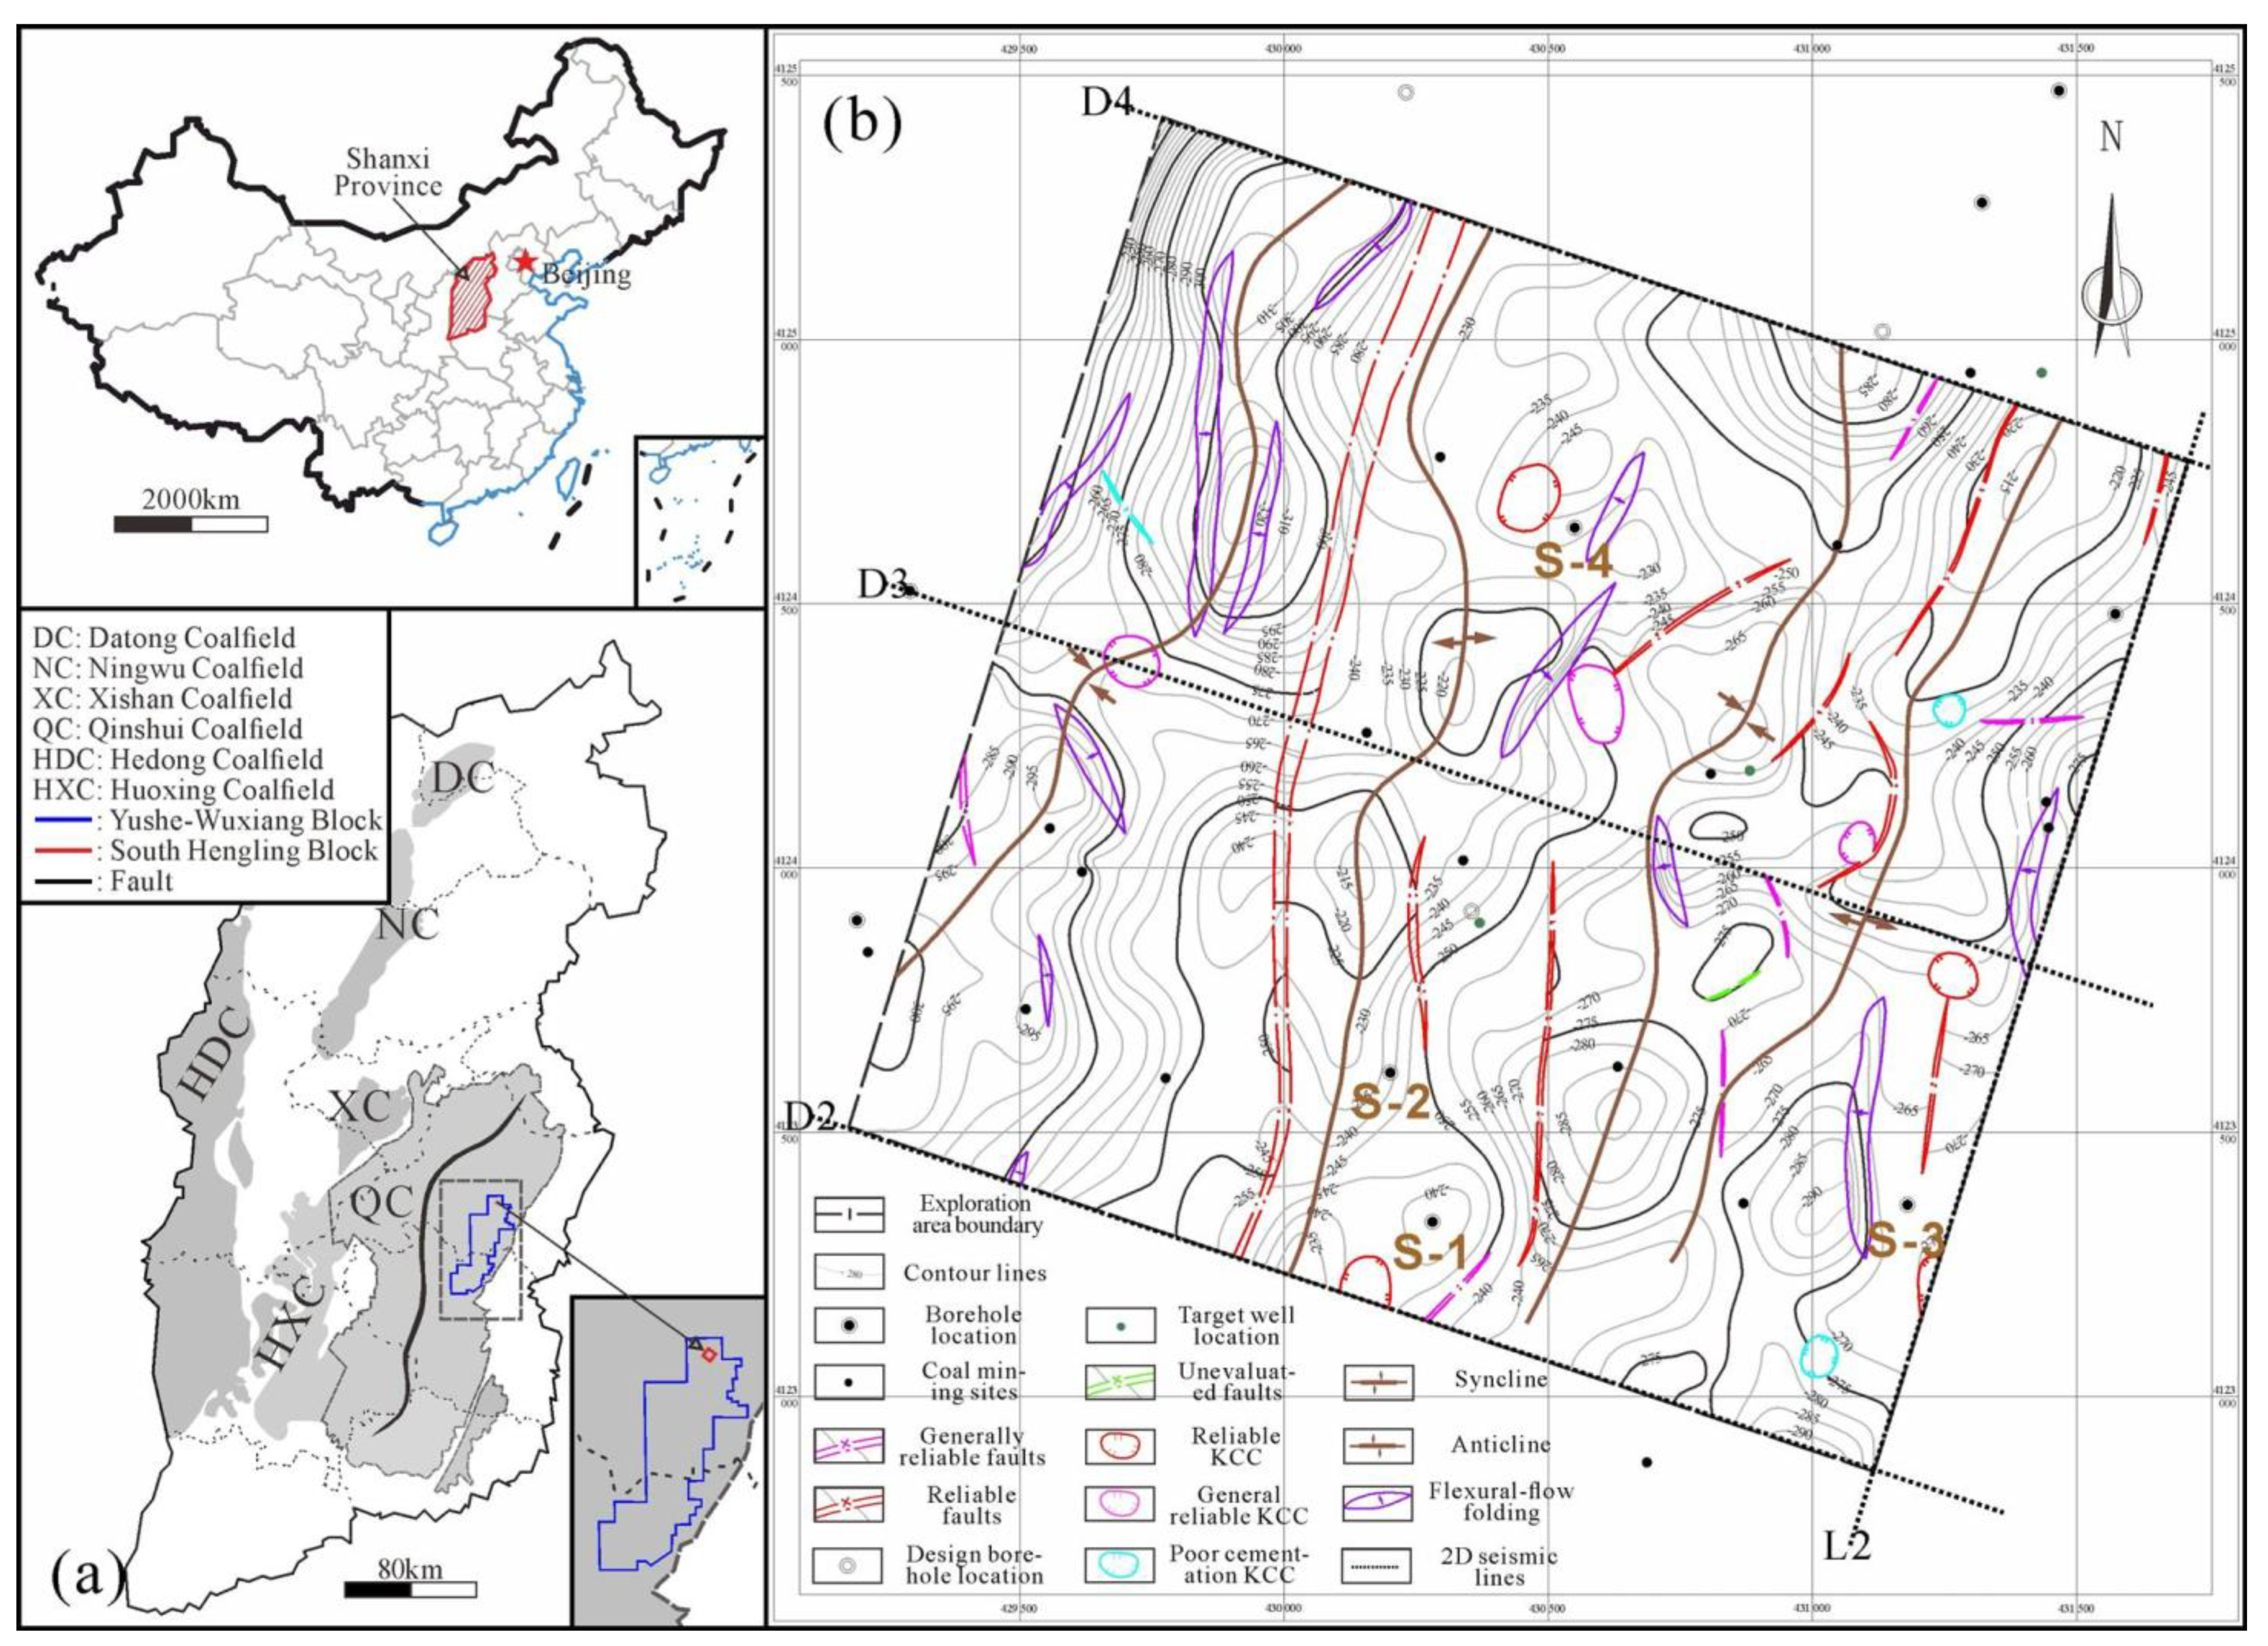
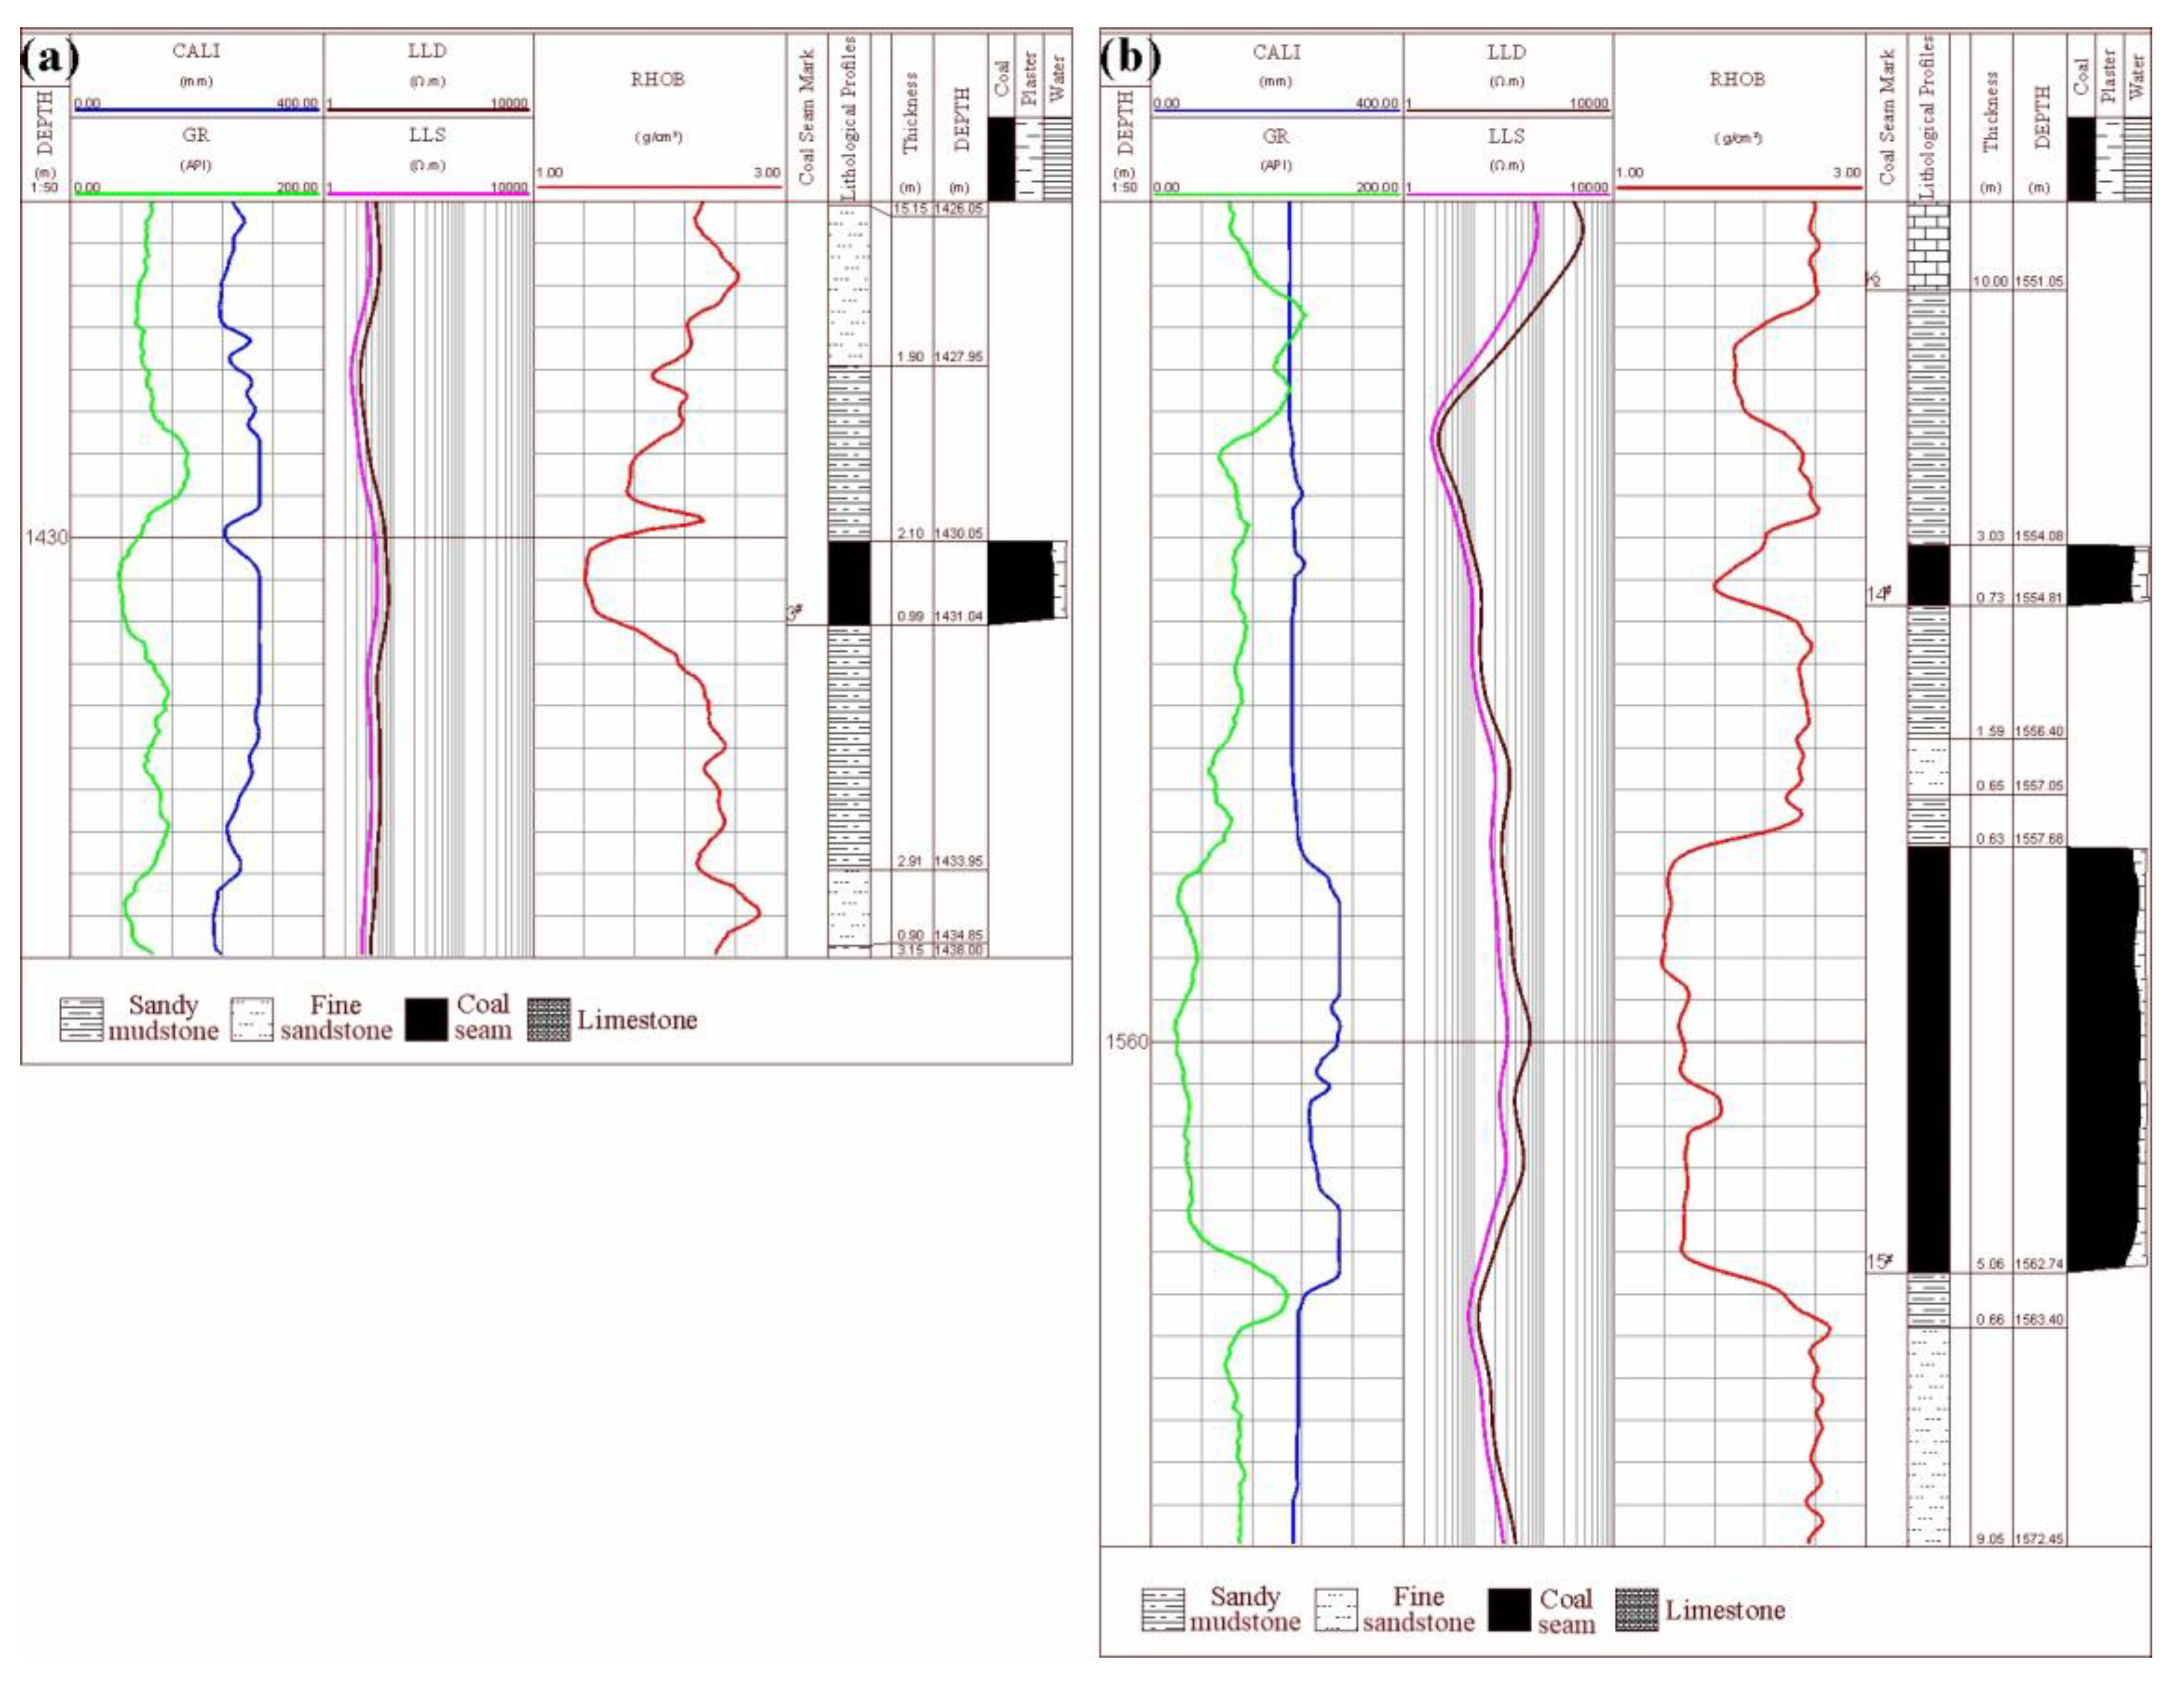
The South Hengling Block is located on the eastern synclinorium of the Qinshui Basin and covers an area of 3.9 km2 (Figure 1). The area is part of the North China Fault Block and is subject to east-west extrusive stresses in the basin tectonics, with well-developed trap columns, folds and fault structures. By the end of 2022, the Hengling Block had significant exploration potential with new proven coal-bed methane reserves of 7707 million cubic meters [23]. The district has two development strata. One is the No. 15 coal seam of the Carboniferous Taiyuan Formation located above the weathering and stripping surface of the Ordovician. The thickness of the seam ranges from 106.30 m to 158.69 m and averages 123.71 m (Figure 2b). The buried depth of the stable mineable coal seam is greater than 1500 m, with a coal thickness of 4.35 m–7.08 m and an average of 5.18 m. It contains one to three layers of interbedded gangue, mainly cleat and granular coal, locally developed primary structural coal, of which the macro coal rock type is mainly semi-bright coal, with a small amount of bright coal on top. The coal type is mainly anthracite. The other set of continuous deposits is the No. 3 coal seam in the central part of the Shanxi Formation, buried around 1410 m–1580 m deep, with a stratigraphic thickness ranging from 26.92 m to 66.80 m and averaging 49.22 m (Figure 2a). The No. 3 coal seam is thinner and partially mineable, with a thickness of 0.54 m–2.59 m and an average of 0.9 m. It contains zero to one layers of interbedded gangue, dominated by fractured-fractured-grained coal, which is semi-bright coal. The types are anthracite and lean coals. The specific assignment of the two sets of mineable coal seams in the study area is given in Table 1.

Figure 1.
Location of Shanxi Province in China and the South Hengling Block of Qinshui Basin (a), and the elevation plan of the bottom interface of the Taiyuan Formation in the study area (b).

Figure 2.
The 1:50 logging curves and lithologic interpretations of Coal Seam No.3 (a) and Coal Seam No.15 (b).

Table 1.
List of mineable coal seam characteristics.
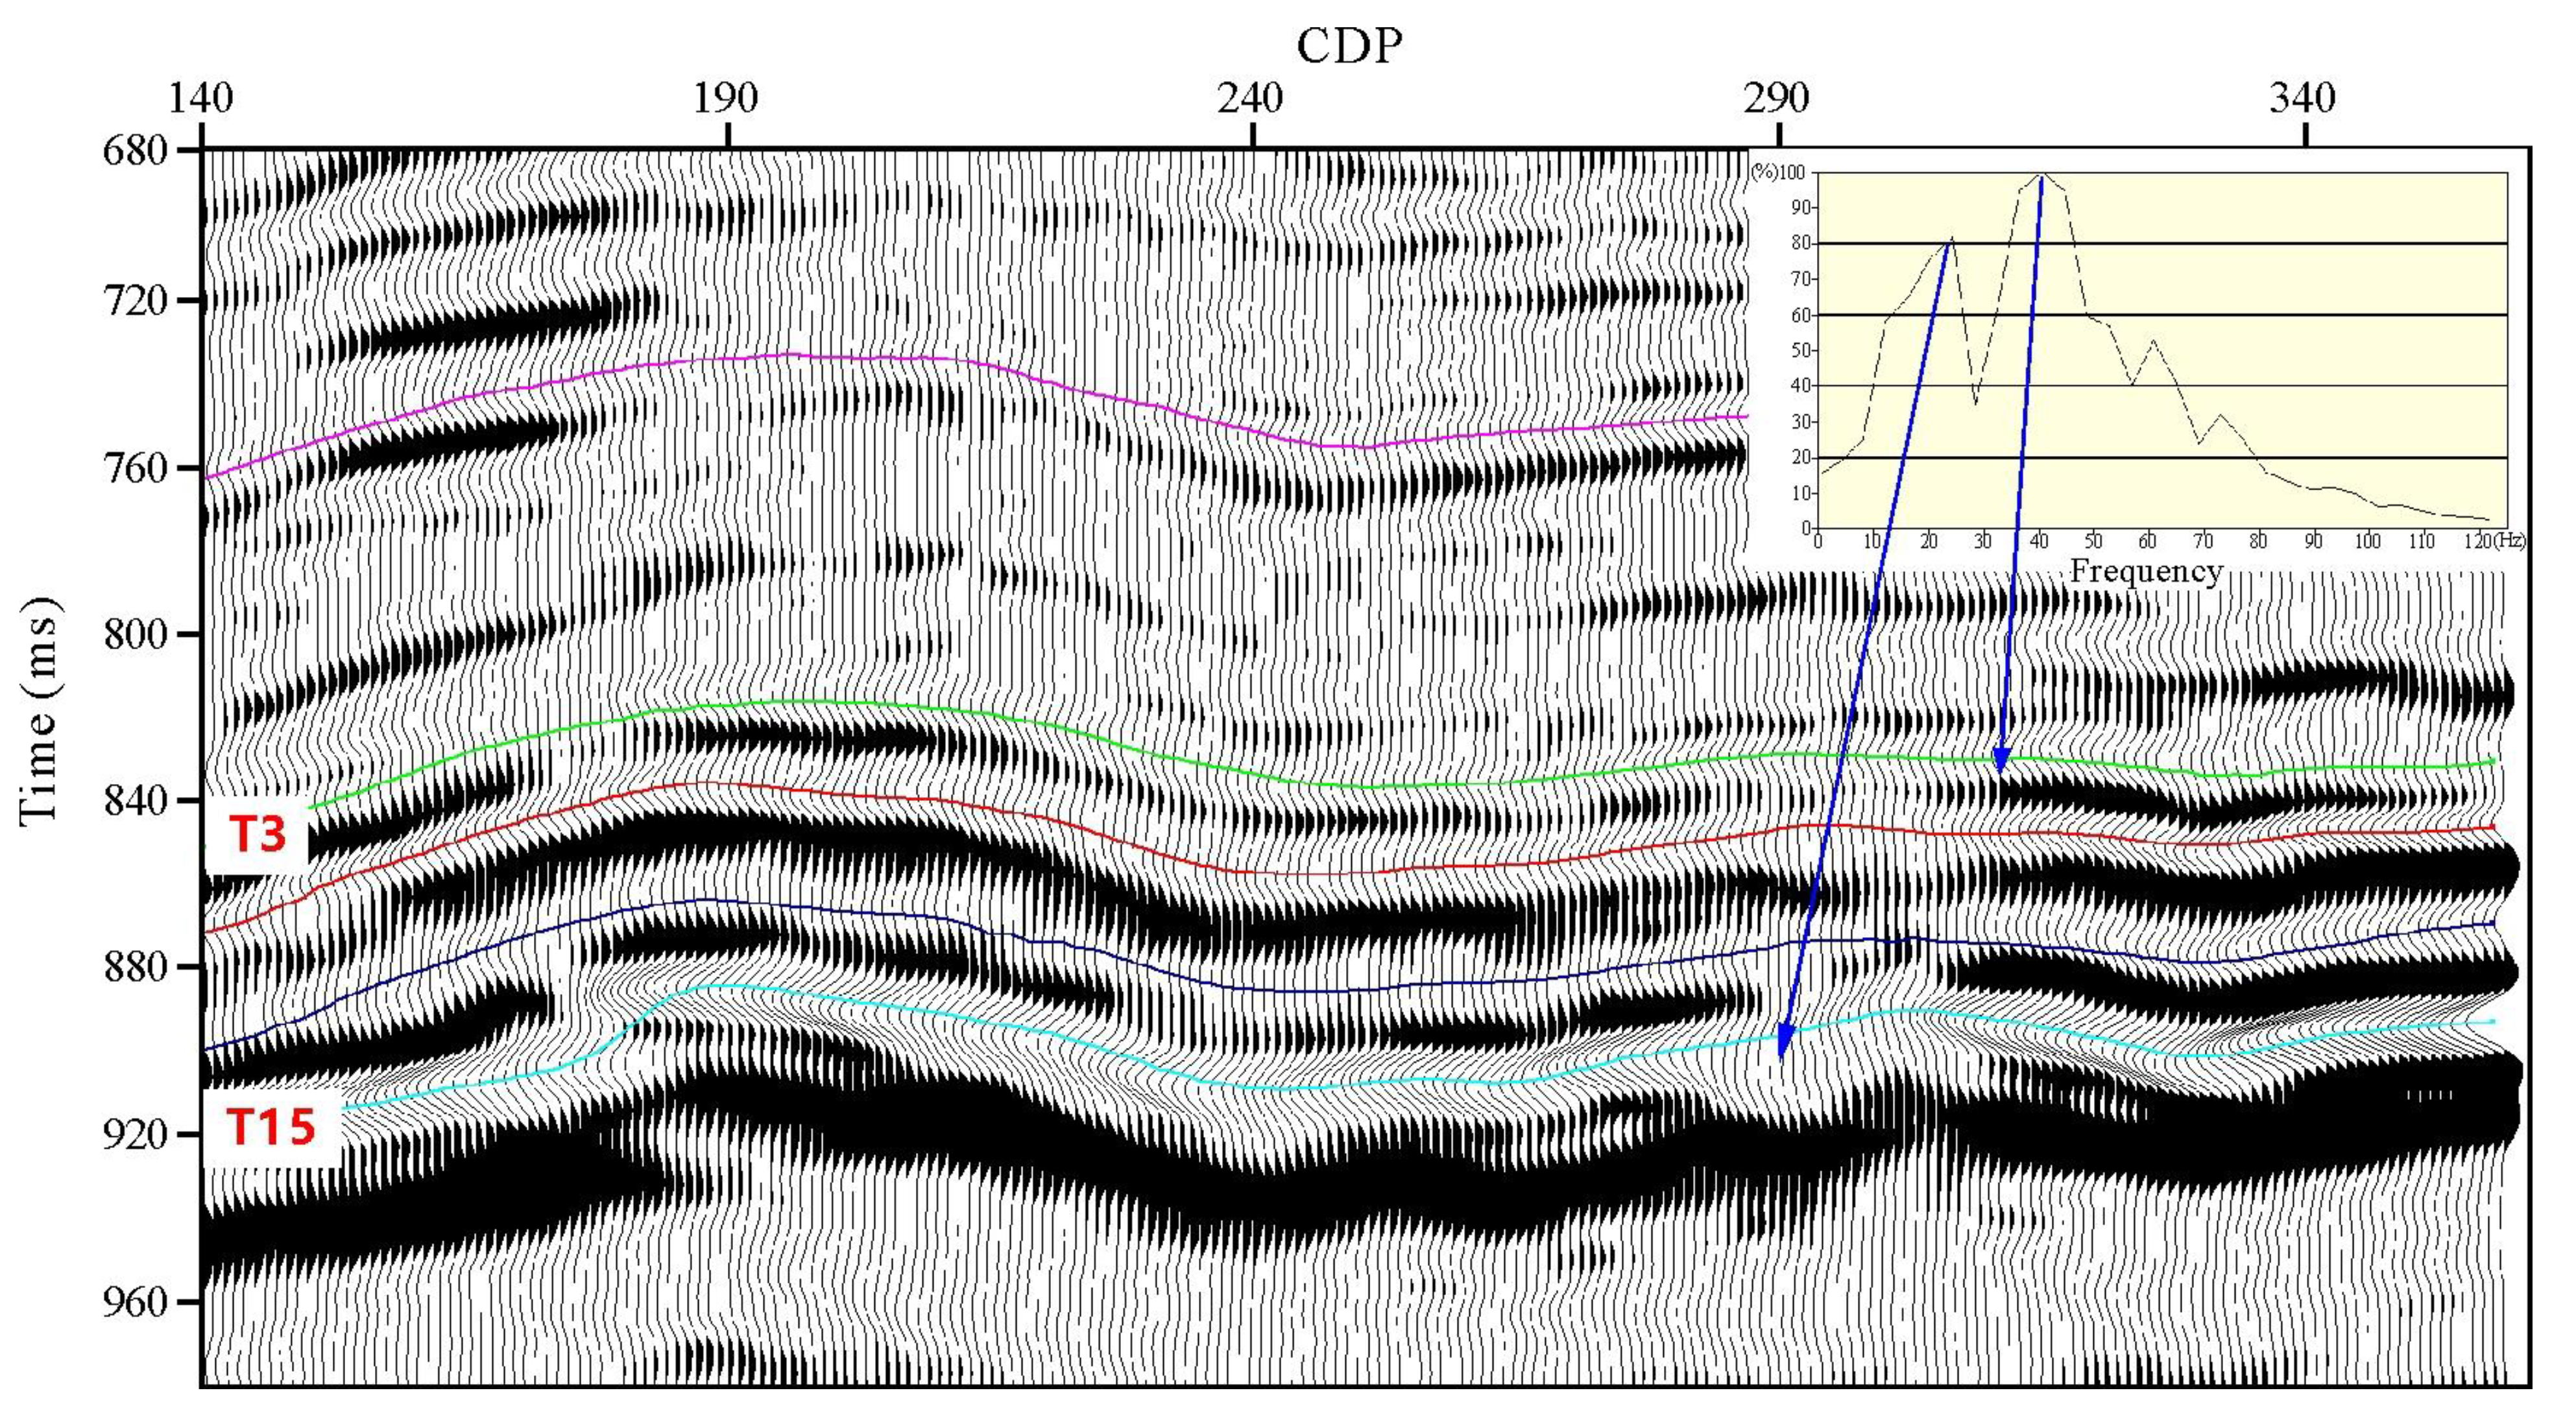
Figure 3 shows the typical seismic profile of a survey line in the work area. The spectrum analysis revealed that the spectrum of seismic data in the study area decreased with increasing depth, and the spectrum showed a double-peaked phenomenon. The curves with different colors in the figure represent five layer sequence interfaces, from top to bottom, K10, T3, T8, T11 and T15 interfaces, and this paper only focuses on the study of the T3 and T15 layer sequence interfaces.

Figure 3.
A typical common depth point (CDP) seismic profile of a survey line in the work area. The blue arrows represent the location of the area where the double-peaked phenomenon corresponds to the two sets of coal seams. The curves with different colors represent five layer sequence interfaces, from top to bottom, K10, T3, T8, T11 and T15 interfaces.
The T3 section is the Shanxi Group stratum where the No. 3 coal seam was located, with a main frequency of about 45 Hz and a seismic resolution of about 18 m. There are obvious differences in wave impedance between the No. 3 coal seam and its top and bottom plate of surrounding rocks, forming a strong energy, prominent waveform and continuous traceable reflection wave. The section T15 stratum is the Taiyuan Group stratum where the No. 15 coal seam was located. The main frequency reduced to 25 Hz and the highest resolution of inversion was about 25 m. The weathering crust at the top interface of this section of coal seam was in unconformity contact with the overlying strata, forming a weak reflection wave energy and poor continuity, and most of the profiles present a composite wave pattern with poor continuity. In summary, the geological conditions in this area are relatively complex.
3. Methods
3.1. Logging the Multi-Parameter Interpretation Model
According to the description of the Chinese national standard GB/T 30050-2013 document [24], the classification of coal structure is roughly divided into four types of structures, including primary, cataclastic, fragmentation and mylonitized structures. This criterion has been combined with GSI in order to quantify the strength of the indicator factors for different structures [25]. The industrial consensus is to use wireline logs to extract the physical parameters of the coal body in order to effectively quantify the coal structure [26,27]. The method relies on multi-parameter logging datasets and lots of experience accumulated by engineers, but the non-uniqueness of seismic attribute inversion makes it difficult to apply to 3D seismic prediction work [28]. By analyzing the descriptive information of the drilled coal cores in the geological survey report for the well fields that have been surveyed, information about the relevant coal structure can be mined and the type of coal structure can be judged based on the modified quantitative GSI chart.
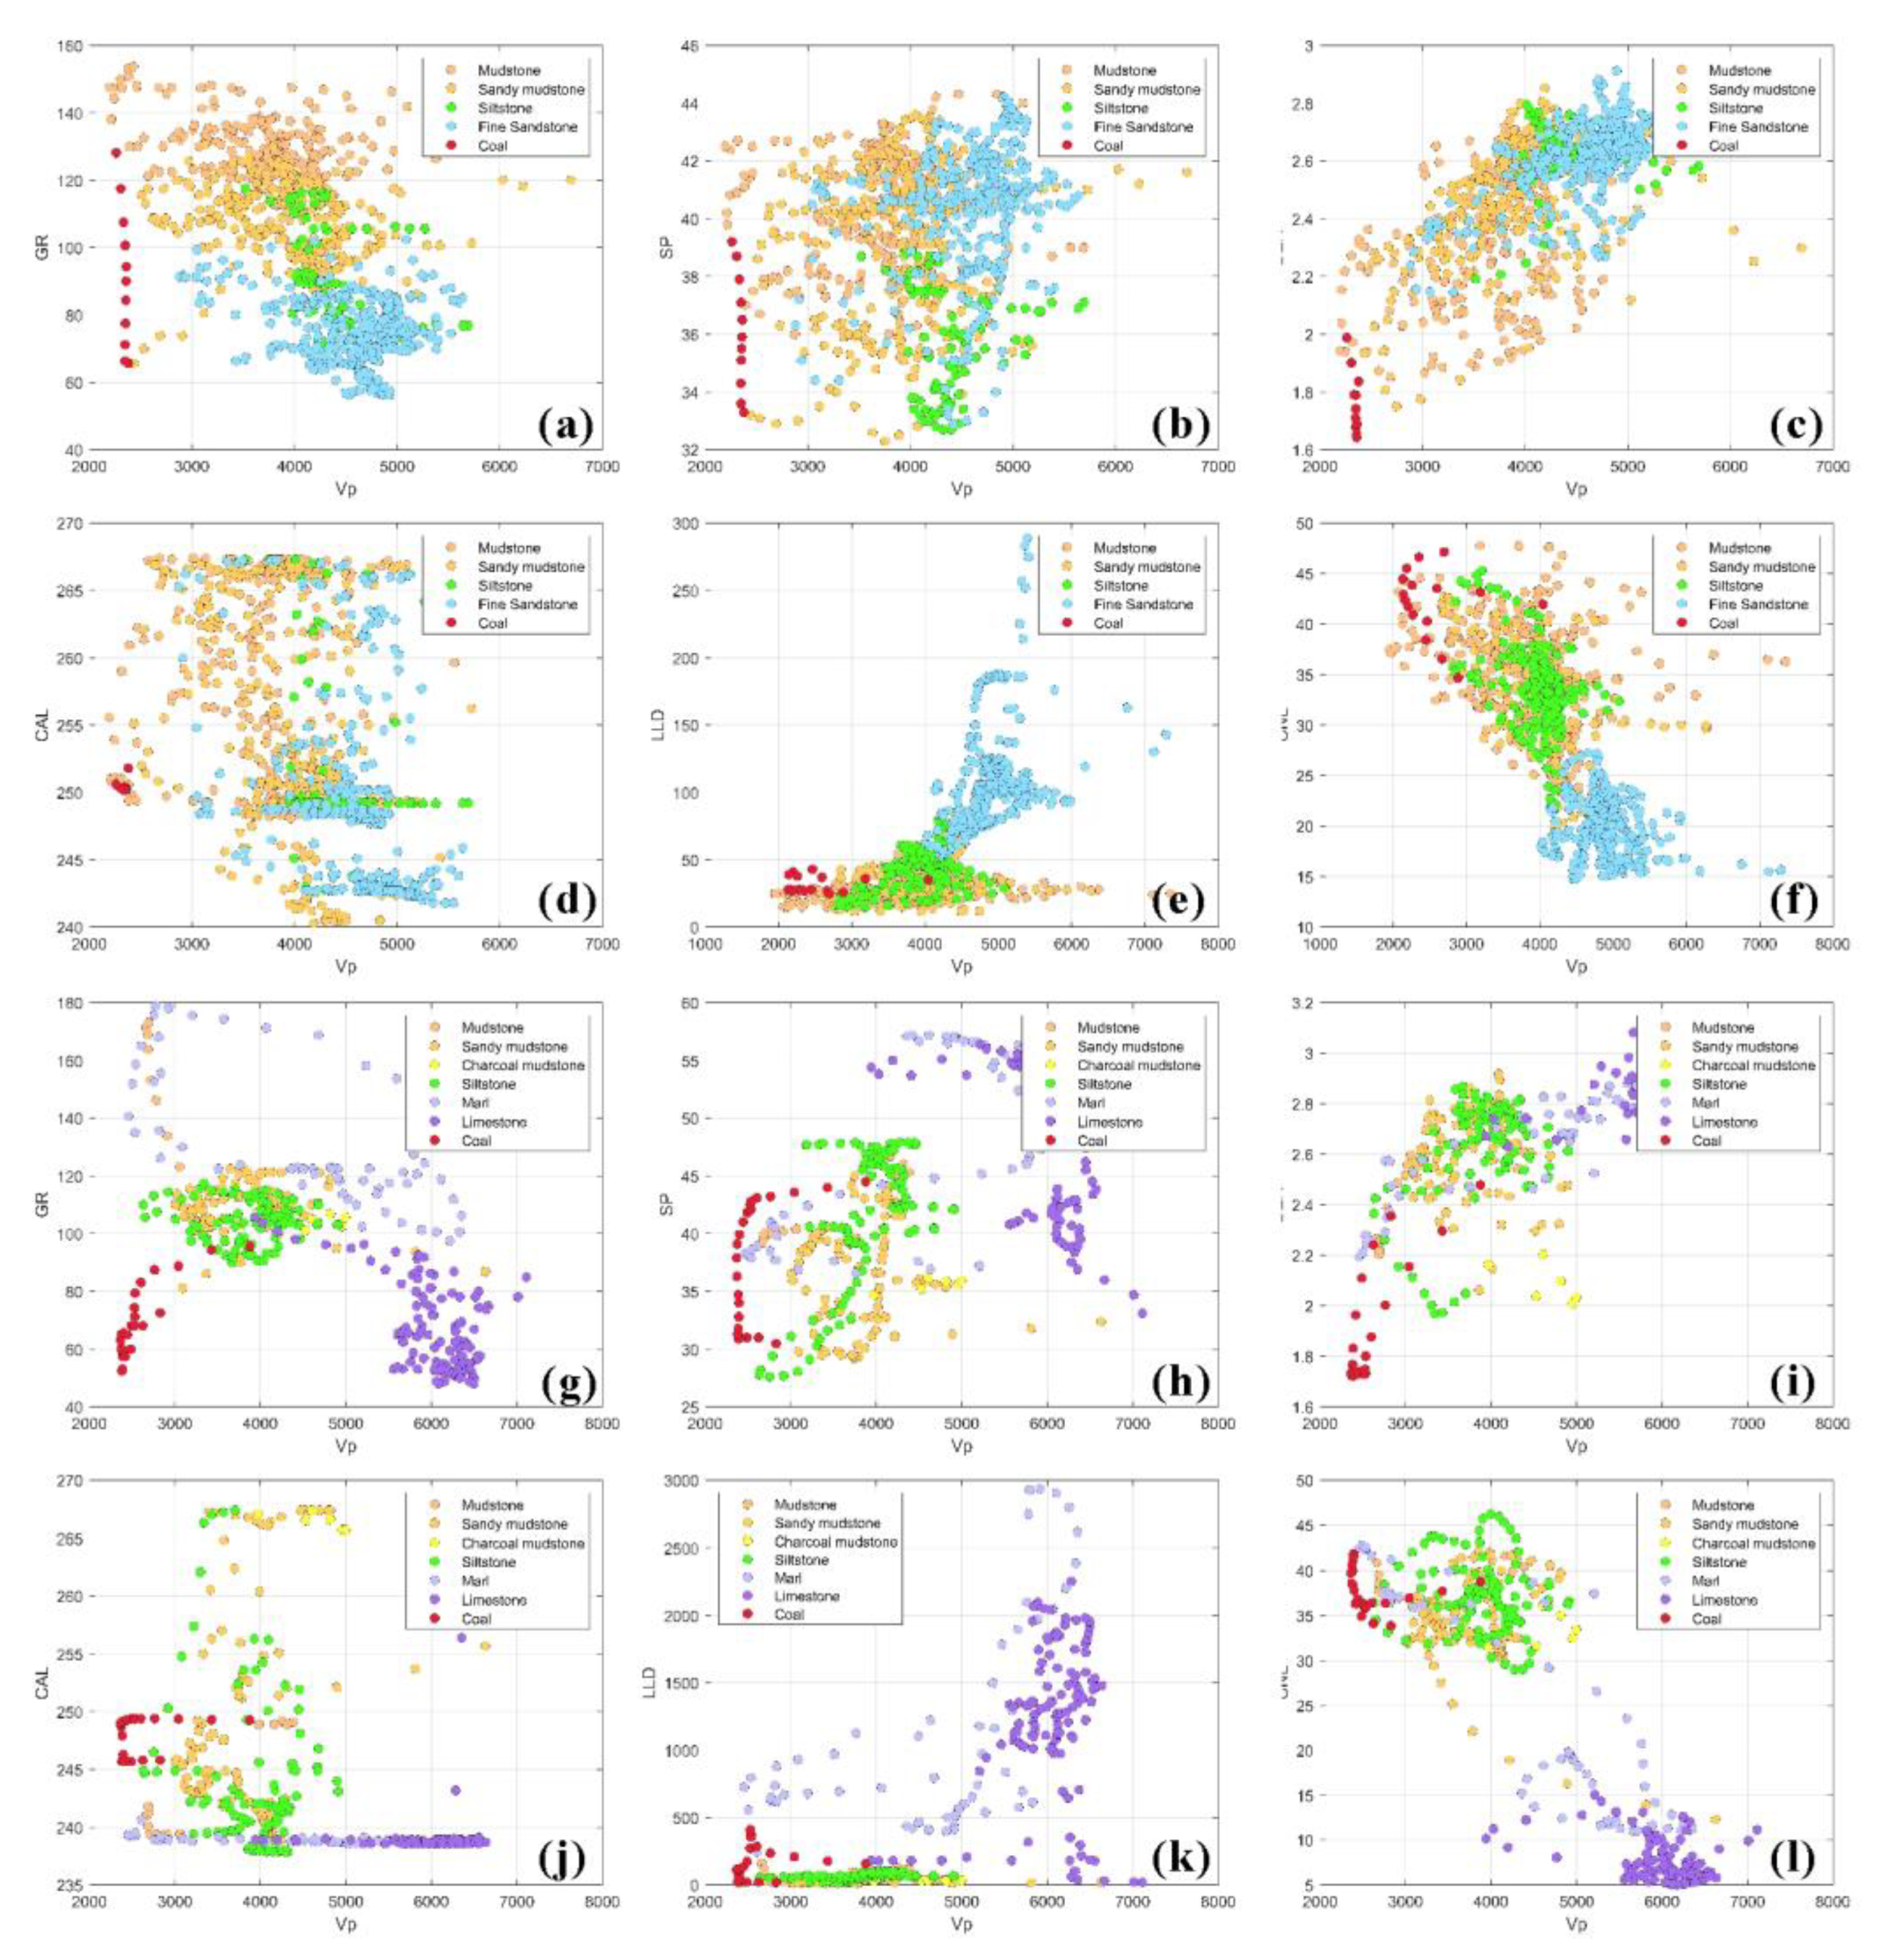
It can be seen from the petrophysical analysis of the two sets of coal seams in the concentrated area (Figure 4) that the density, caliper log and deep laterolog values of the coal seams are low, but due to the damage suffered by the coal structure, which makes the coal gangue entrained with some radioactive material, it may have abnormally high values of gamma and spontaneous potential. To some extent, the petrophysical quantity plates can provide insight into the statistical distribution law related to the coal seam. By referring to information from the neighboring areas [29], it was determined that the following logging multi-parameter prediction model for coal structure was established using gamma, density, deep laterolog, interval transit time and caliper curves:
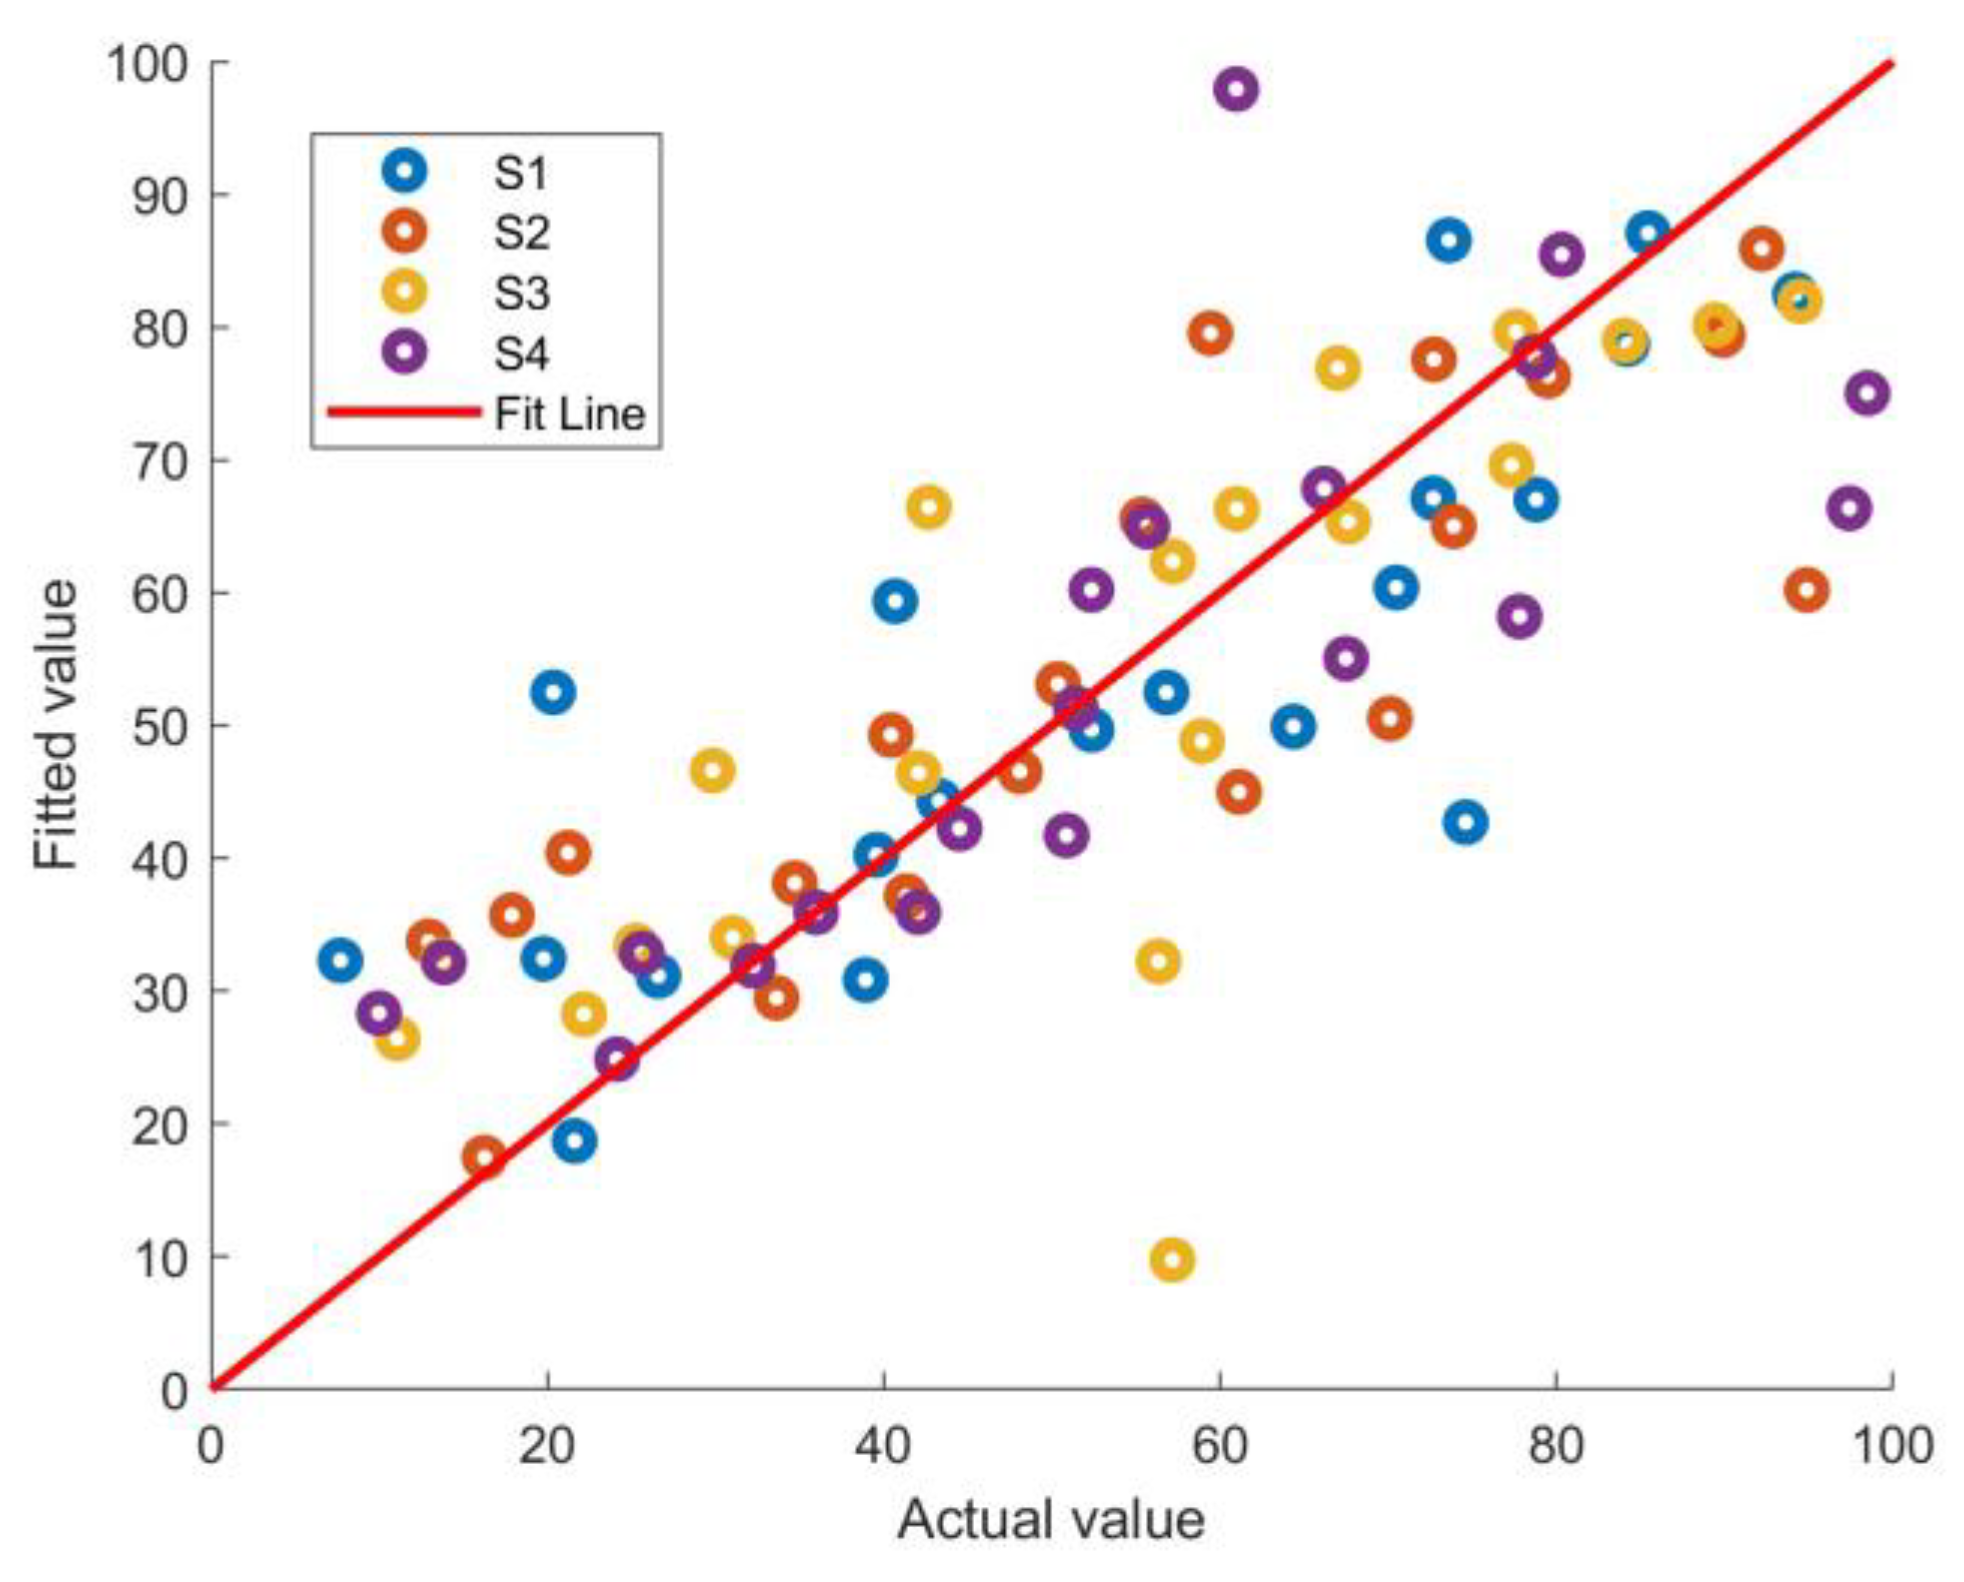
where GSI is the structural GSI value of the coal body, Gr is the gamma value, rho is the bulk density, Rd is the resistivity, AC is the interval transit time and CAL is the caliper curves. By establishing an empirical formulation of the regression equation shown in Equation (1), the rich multi-parameter logging data is converted into a descriptive and quantitative characterization of the coal seam. As shown in the Figure 5, the true and fitted values match well, and the multi-parameter prediction model yields highly accurate predictions and enables a better understanding of the characteristics and trends of the data. Therefore, the GSI values obtained from this model will be used as the output data of the fuzzy training system in the next subsection.

Figure 4.
Cross plots of P-wave velocity with GR: gamma (a,g), SP: spontaneous potential (b,h), DEN: density (c,i), CAL: caliper log (d,j), LLD: deep laterolog (e,k) and CNL: compensated neutron log (f,l) in the petrophysical analysis, where (a–f) belong to coal seam No. 3 and (g–l) belong to coal seam No. 15.

Figure 5.
Comparison of the actual GSI value and the fitted GSI value.
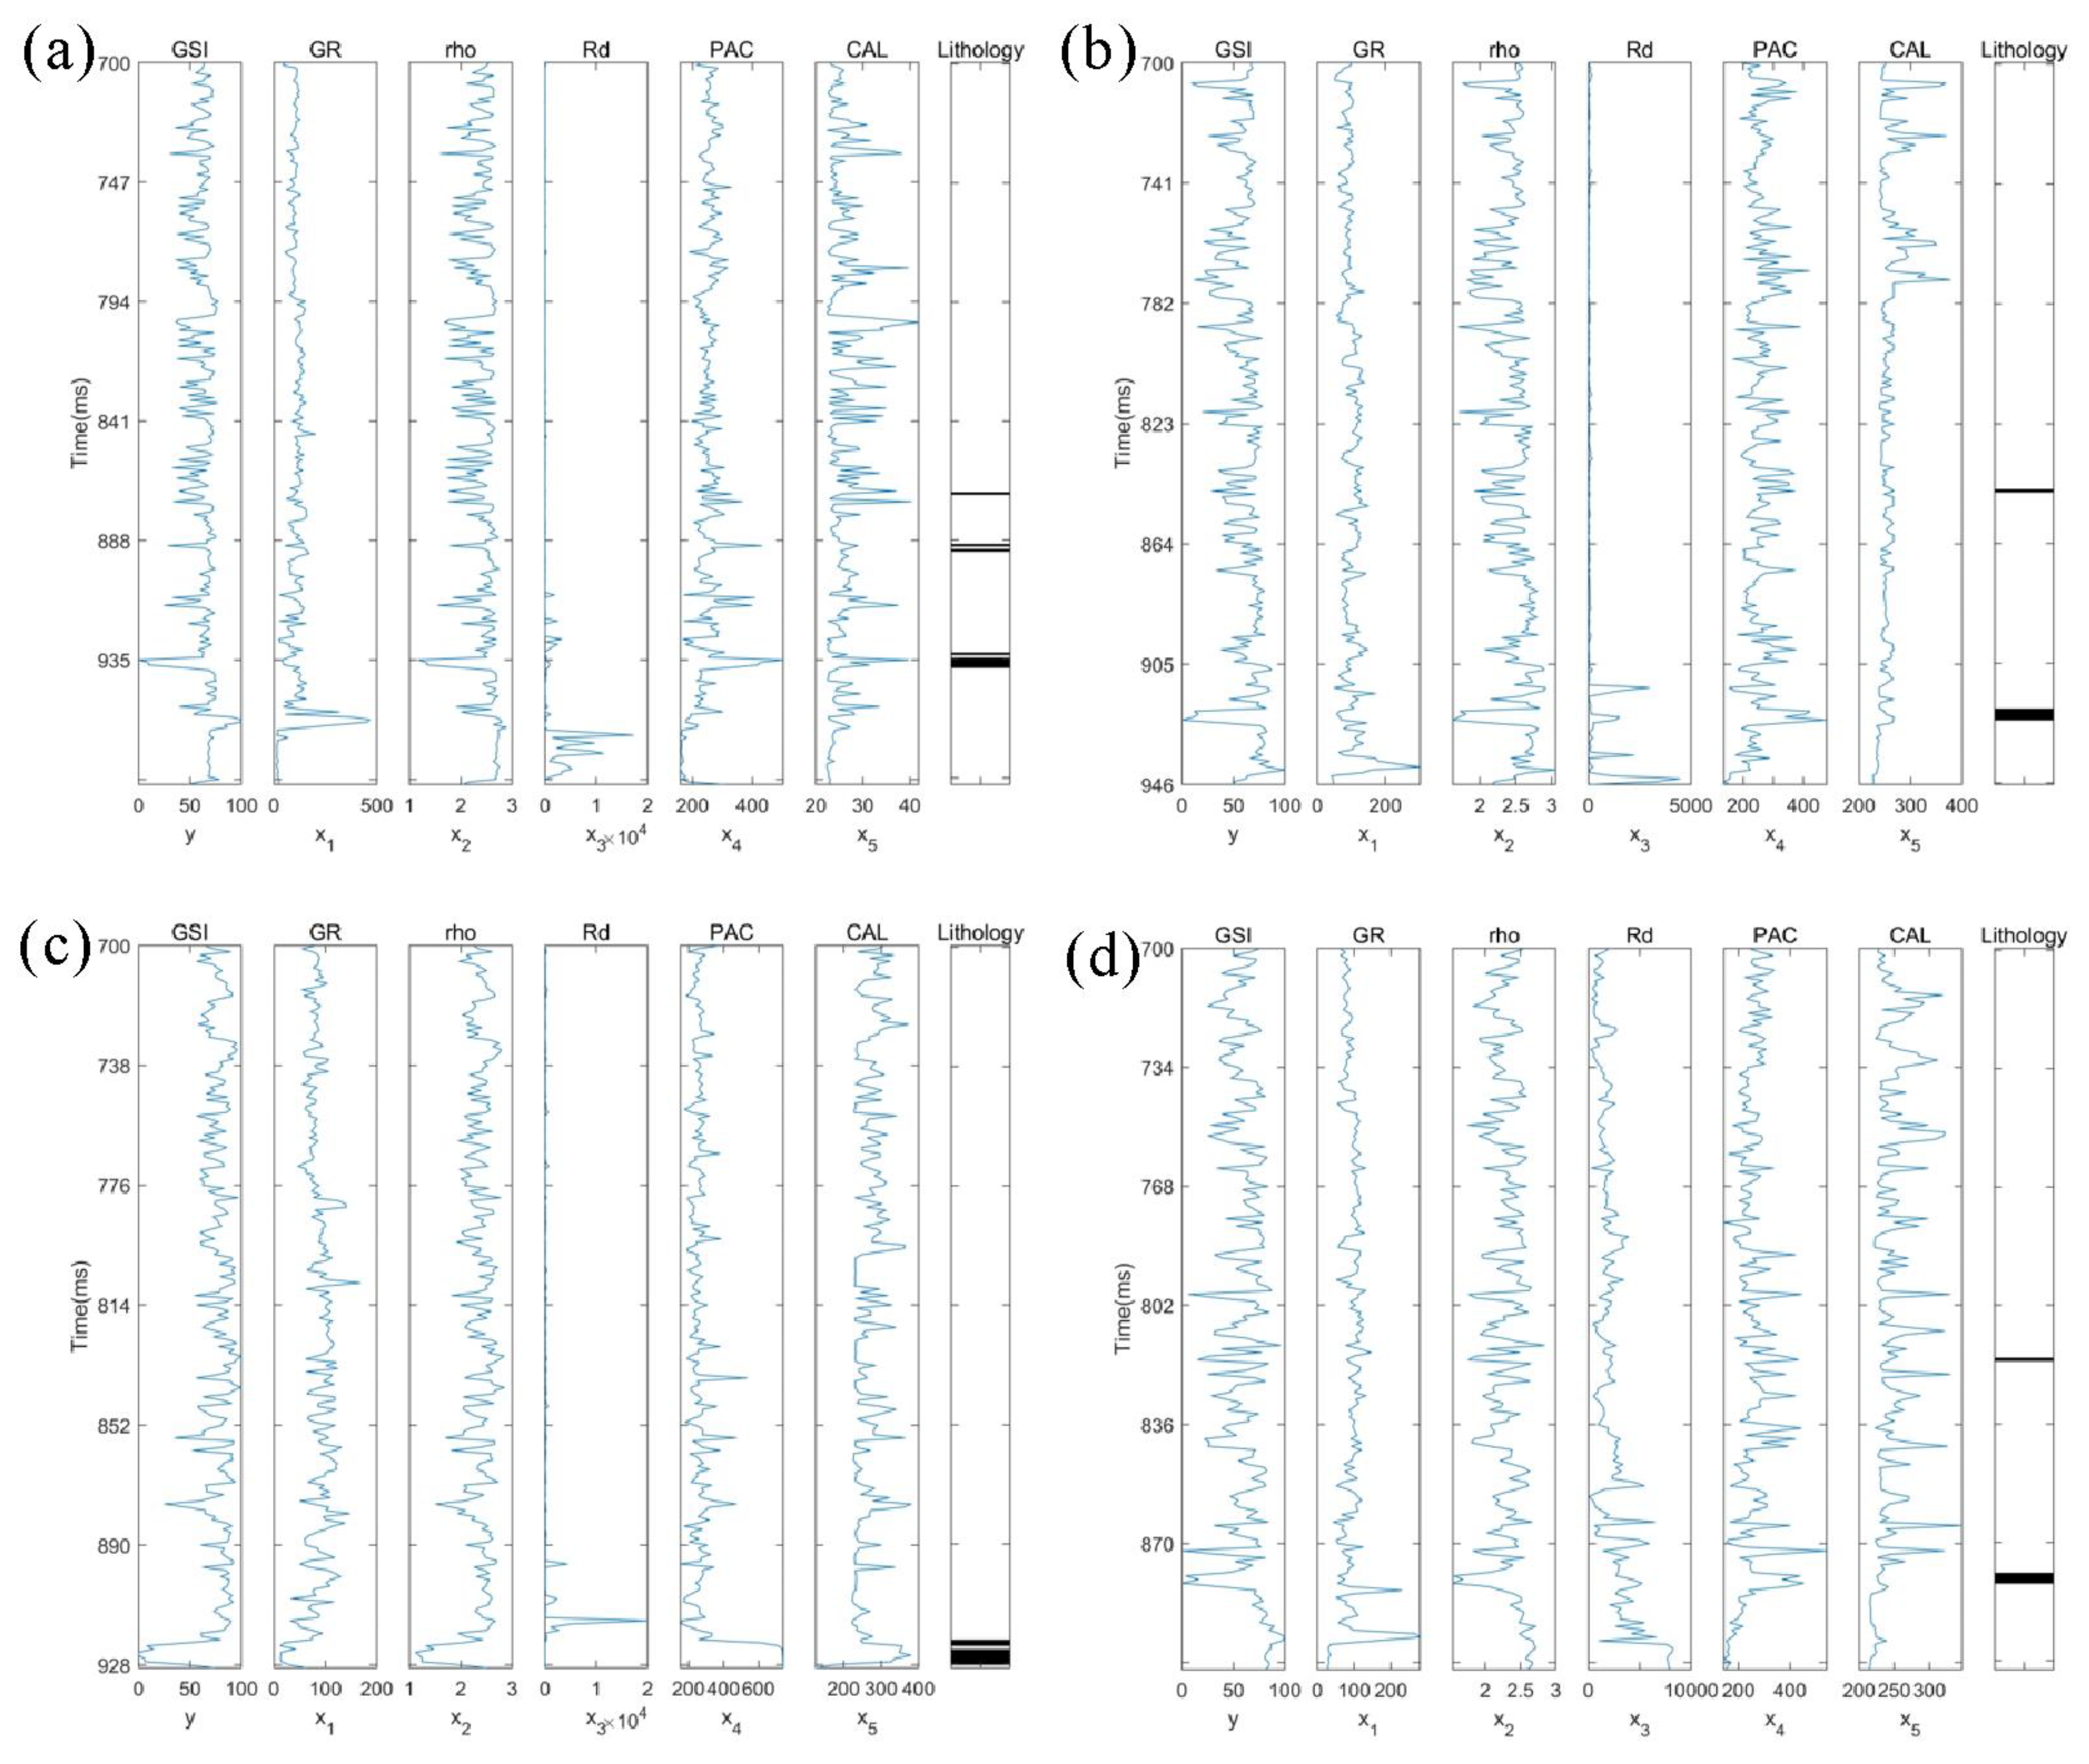
The comprehensive evaluation curve of the coal structure on the well was obtained by fitting the GSI of the characteristic parameters from the logging data. It can be seen from Figure 6 that the GSI values of the shallow coal body structure are generally larger than 50, which belong to the primary structure and fractured structure. The GSI value of the deep-seated coal structure is generally less than 30, which belongs to the fractured structure and vesicular structure. This is related to the changes in coal by geological conditions during the formation process. With an increase in depth, the composition, structure and properties of coal will also change. Specifically, as the depth of the coal seam increases, factors such as pressure, temperature, and pore water chemical environment will change, and these changes will cause physical and chemical reactions in the coal, such as compaction, metamorphism and cracking of the coal. These reactions can cause the organic matter, minerals and pore structure of coal to change and form a more complex structure. In addition, deeper coal seams are usually subject to higher ground and tectonic stresses, which can also lead to fracture and deformation of the coal and the formation of more complex structures.

Figure 6.
(a–d) Schematic diagram of the predicted GSI and other characteristic parameters for the logging of four wells in the work area.
It should be noted that the establishment of the empirical formula needs to consider the influence of several factors, such as coal seam characteristics, geological conditions and logging instrument performance. The reliability and accuracy of the empirical formula are also affected by the amount of sample data, feature selection and model training, so it is necessary to focus on data quality and model tuning during the process of establishing the empirical formula. Furthermore, the GSI values obtained from this polynomial model can be used as the output training set for the fuzzy logic system.
3.2. Construction of Geological Strength Index (GSI) with Type-2 Fuzzy Logic
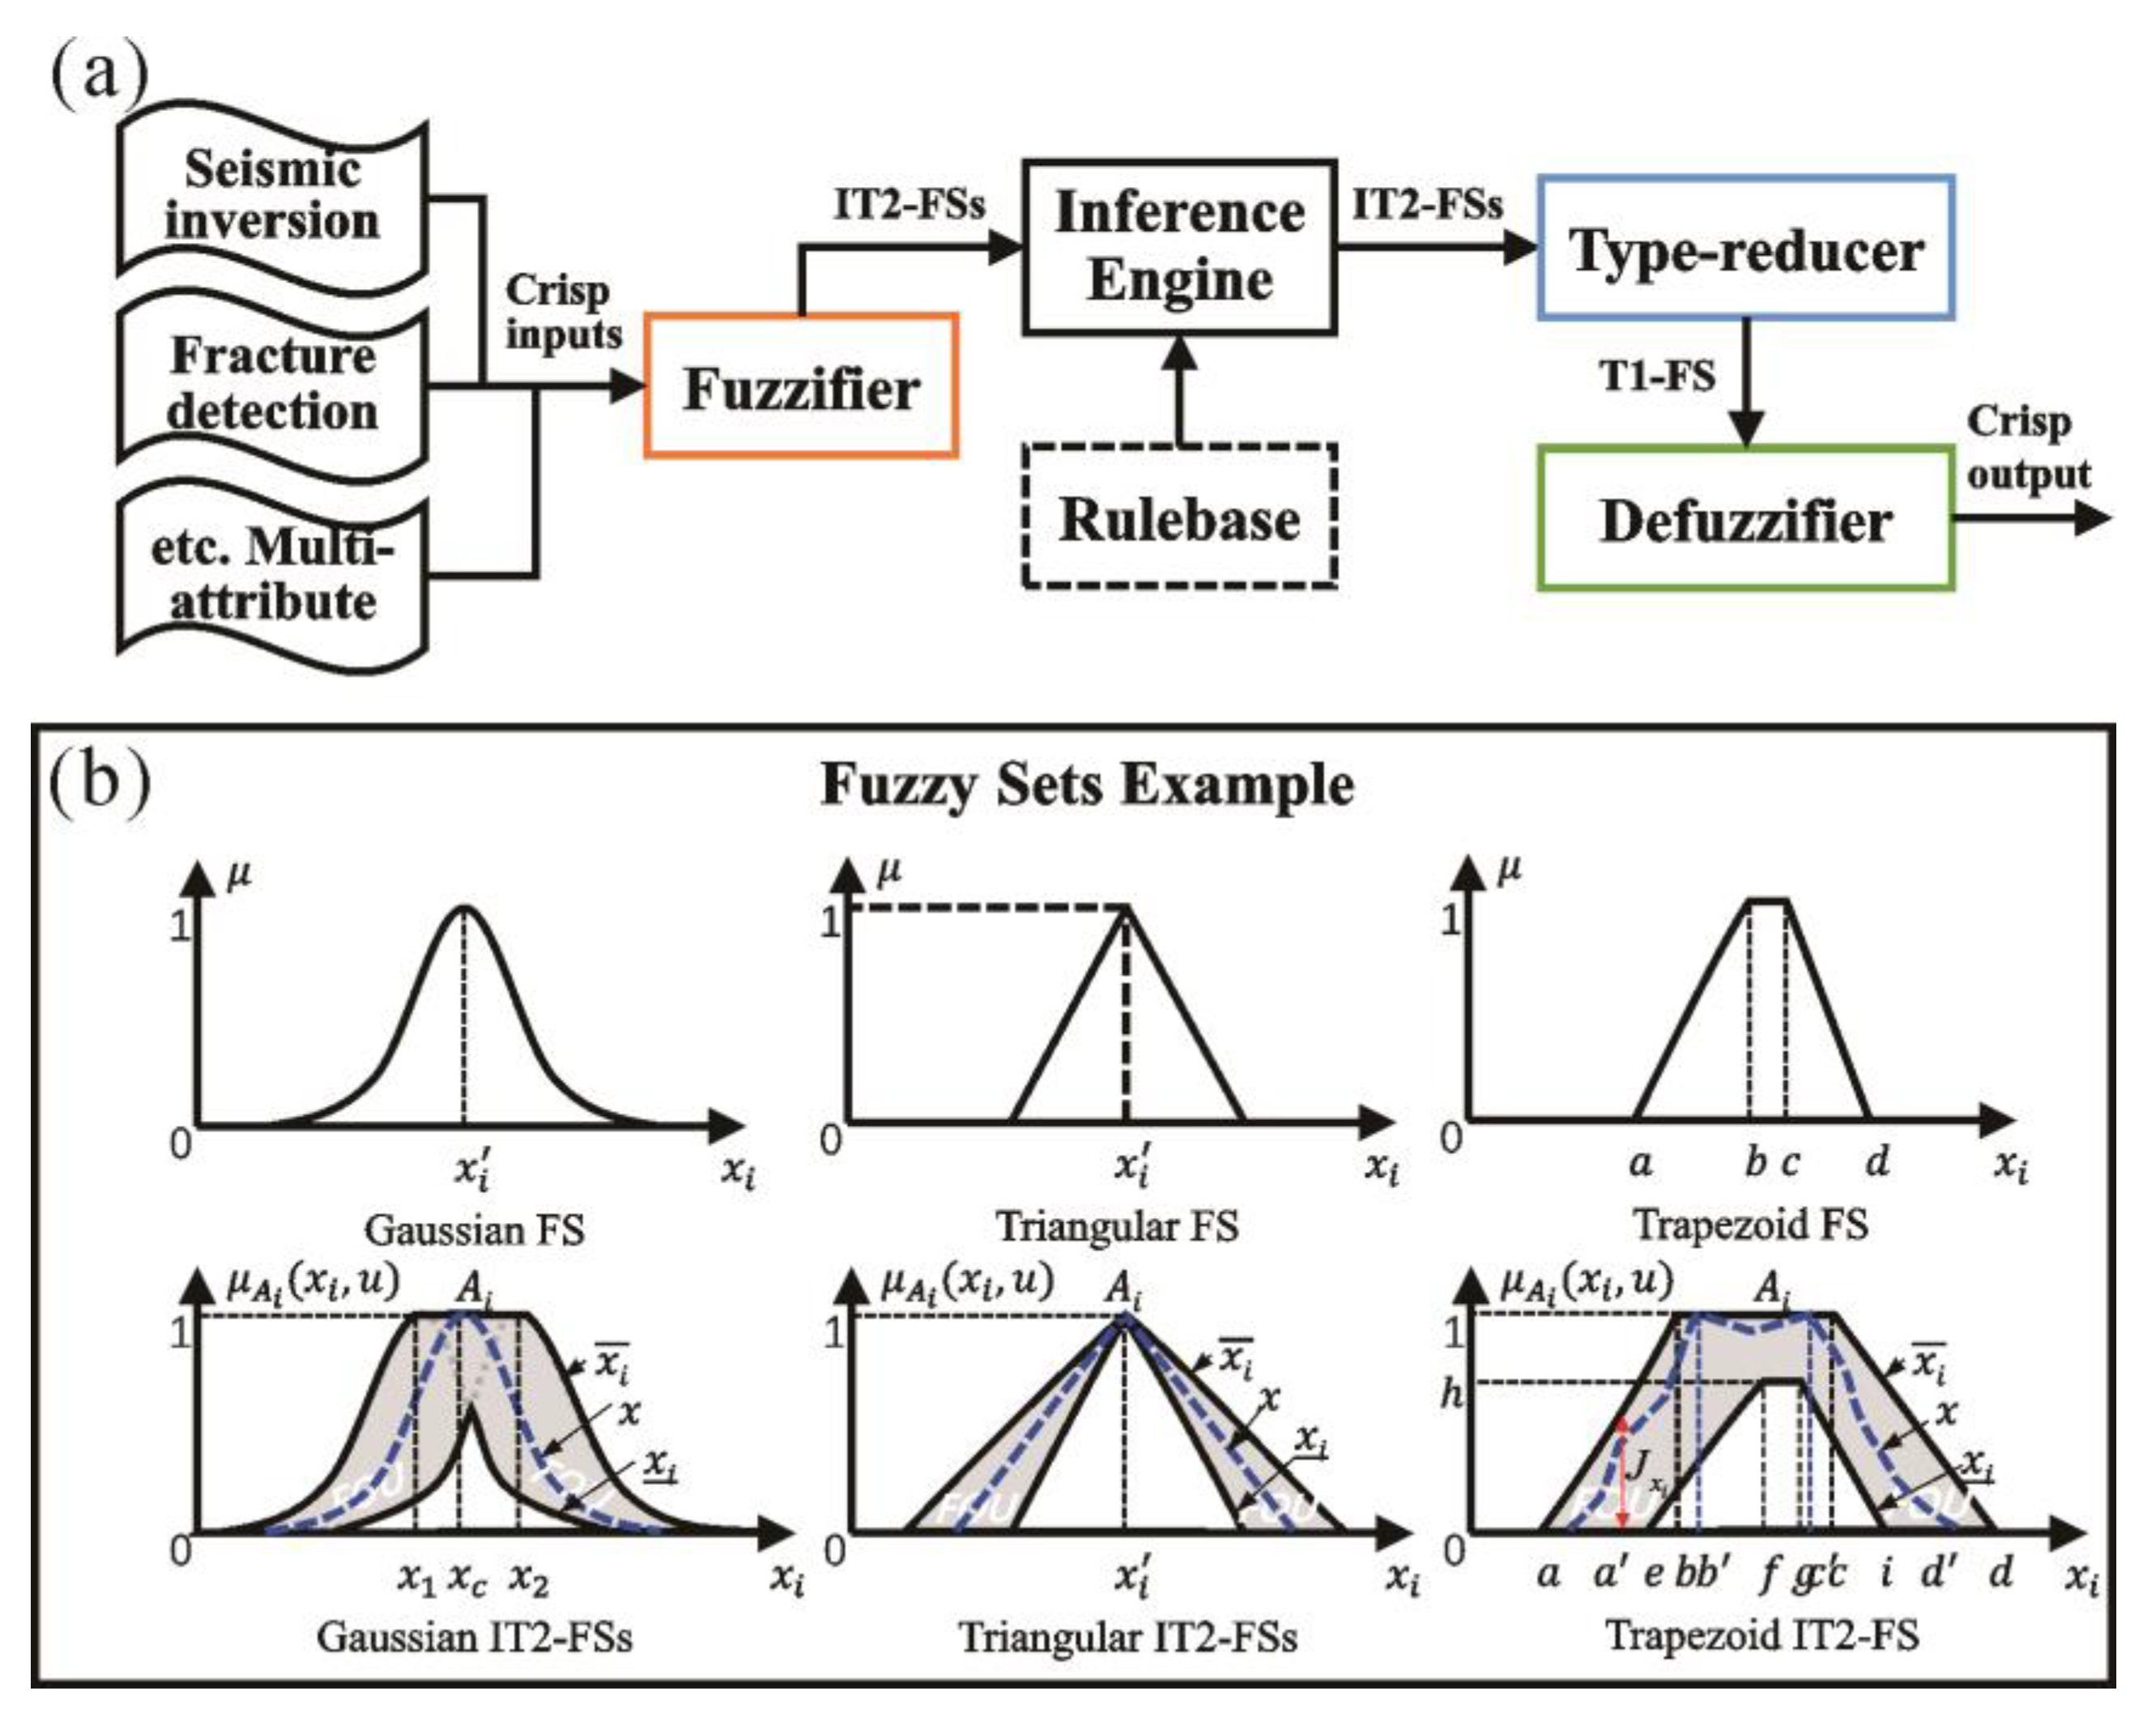
The popularity of the early GSI was to build a bridge of communication between the experimentally measured strength parameters of rock masses and the deformation characteristics of rock outcrops [30]. It has been shown that the GSI chart can quantify the degree of tectonic deformation as a quantitative classification indicator, which gives measurability to descriptive language that relies on visual methods to obtain words with unclear meanings, such as bulky, well-interlaced, partially disturbed, etc. Within the limits of the GSI chart, this artificial deblurring process will yield results with little variation, depending on the understanding and experience of different people. However, the artificial deblurrer is not universally applicable for seismic wavefield signals from non-outcropping rock blocks. The research and application of type-one fuzzy logic in the mathematical manipulation of perception began as early as 1965 [31]. IT2-FLS, as an extension of type-one and generalized type-two fuzzy logic, can add additional fuzzy set freedom and training performance, and is currently the most widely used system. The IT2-FLS consists roughly of five parts (Figure 7a), of which the clear input–output data pairs are:
where and , represents the number of categories at the input and represents the number of samples in each category. Equation (2) represents the multiple-input single-output model.

Figure 7.
Structural design of IT2-FLS (a) with the membership functions design (b). Taking the Trapezoid IT2-FS as an example, nine points (a, b, c, d, e, f, g, i, h) can be used to represent an IT2 FS, the blue dashed line is the center of gravity of the IT2 FS, represents the upper FS limit, represents the lower FS limit, and the gray part sandwiched by the upper and lower limits is the footprint of uncertainty (FOU).
A fuzzifier is a set of membership functions (MFs) that maps the input variable between 0 and 1, denoted as:
where is a fuzzy set with a membership level of . is called a secondary membership variable with a definition domain , which is called the footprint of uncertainty (FOU) of (Figure 4b). The width size of FOU is directly related to the imparted uncertainty [32], whereas and represent the upper and lower bounds of the data set, respectively. There are three types of MFs commonly used in IT2-FLS (Figure 7b) and the choice of MFs is not rigid and often depends on the actual application of the fuzzy system being implemented. For example, Gaussian MFs with wider coverage are often chosen for nonlinear signal response approximation simulations, whereas linear MFs are more suitable for applications such as data space quantization and pattern recognition classification.
The role of the rule base is to extract the influence of the rule between the output variable () and the input variable (). The Mamdani rule was the first rule proposed [33], and the Takagi–Sugeno–Kang (TSK) model was transformed into multiple linear subsystem fits based on Mamdani [34]. These two IF–THEN rules are expressed as follows:
where denotes the rule index number, represents the maximum number of rules, , and are all interval fuzzy sets, denotes the centroid of Mamdani rule, is the weight factor of the TSK rule and, when , the TSK rule is equivalent to the Mamdani rule. For the convenience of calculation, the Mamdani rule was chosen in this paper.
The inference engine is designed to calculate the firing interval of the rule, divided into:
where is the minimum t-norm operation, or:
where is the product t-norm operation. The role of is to center on the weighted average of the rule output data. Both of the firing intervals have a wide range of applications, and the distinction in terms of performance is not very obvious. Therefore, either of the two inference engines can be chosen.
A type reducer is a technical module used to defuzzify the fuzzy set, and in this paper, is the central-of-sets type reducer was chosen, defined as:
where is the center of the output fuzzy set , determined according to the following definition:
Here, and are defined as:
Finally, the defuzzifier was used to obtain a clear output:
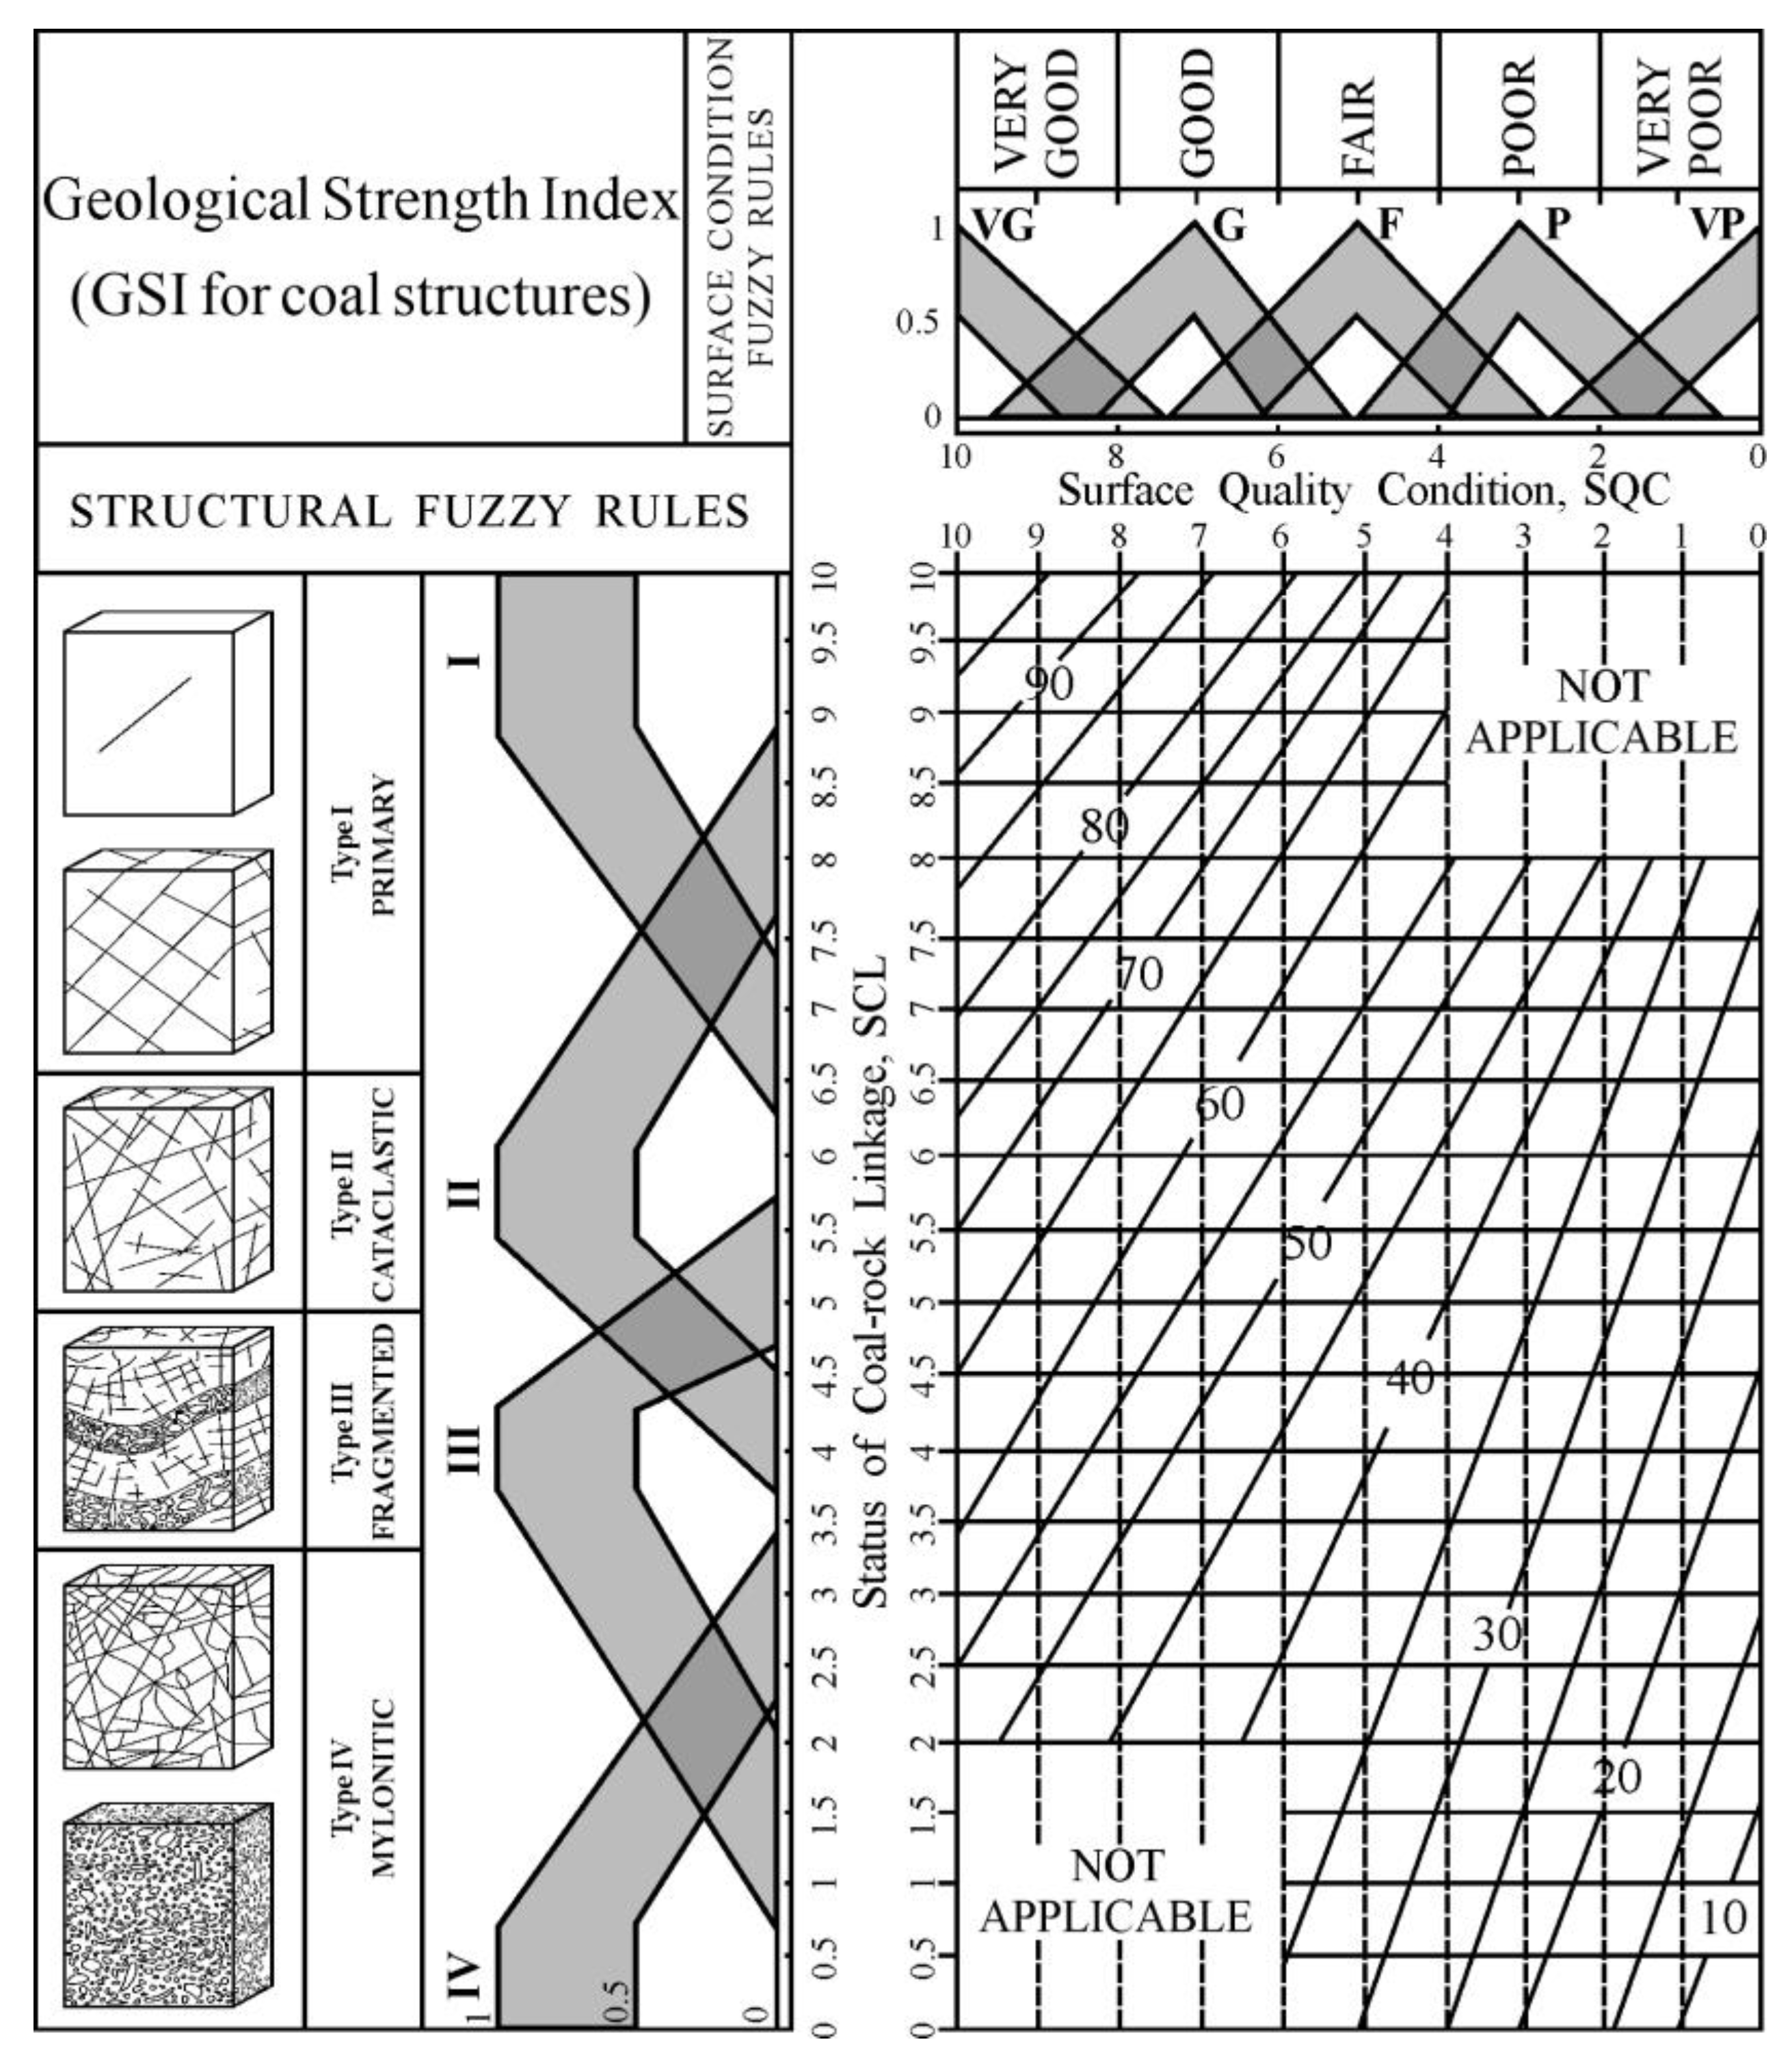
IT2-FLS can replace the textual description language in the traditional GSI system chart when considering the combinations of different MFs (Figure 8). This study benefits from the availability of a free open-source MATLAB/Simulink toolbox developed by Taskin et al. (2015) [35], which makes it possible to extend the findings of this study to practical applications.

Figure 8.
GSI system chart with IT2-FLS. “NOT APPLICABLE” means that it is not applicable in this range.
As shown in Figure 8, the process of embedding an aggregated fuzzy system into a GSI system first requires the identification of the parameters used to calculate the GSI, including the lithology parameters and the fracture development degree parameters. Then, each parameter should be converted into linguistic variables by fuzzification techniques in order to obtain a fuzzy set for each parameter. Next, all the fuzzy sets need to be input into the aggregated fuzzy system for processing in order to calculate the final geological strength index. This process requires the use of hierarchical analysis to determine the weights of each input parameter. The output of the aggregated fuzzy system will be mapped to the corresponding position of the GSI system in order to obtain the final GSI value. By embedding the aggregated fuzzy system into the GSI table, more accurate and reliable GSI values can be obtained, which helps to better predict the coal structure.
3.3. Multi-Attribute Data Mining Based on Fuzzy Sets
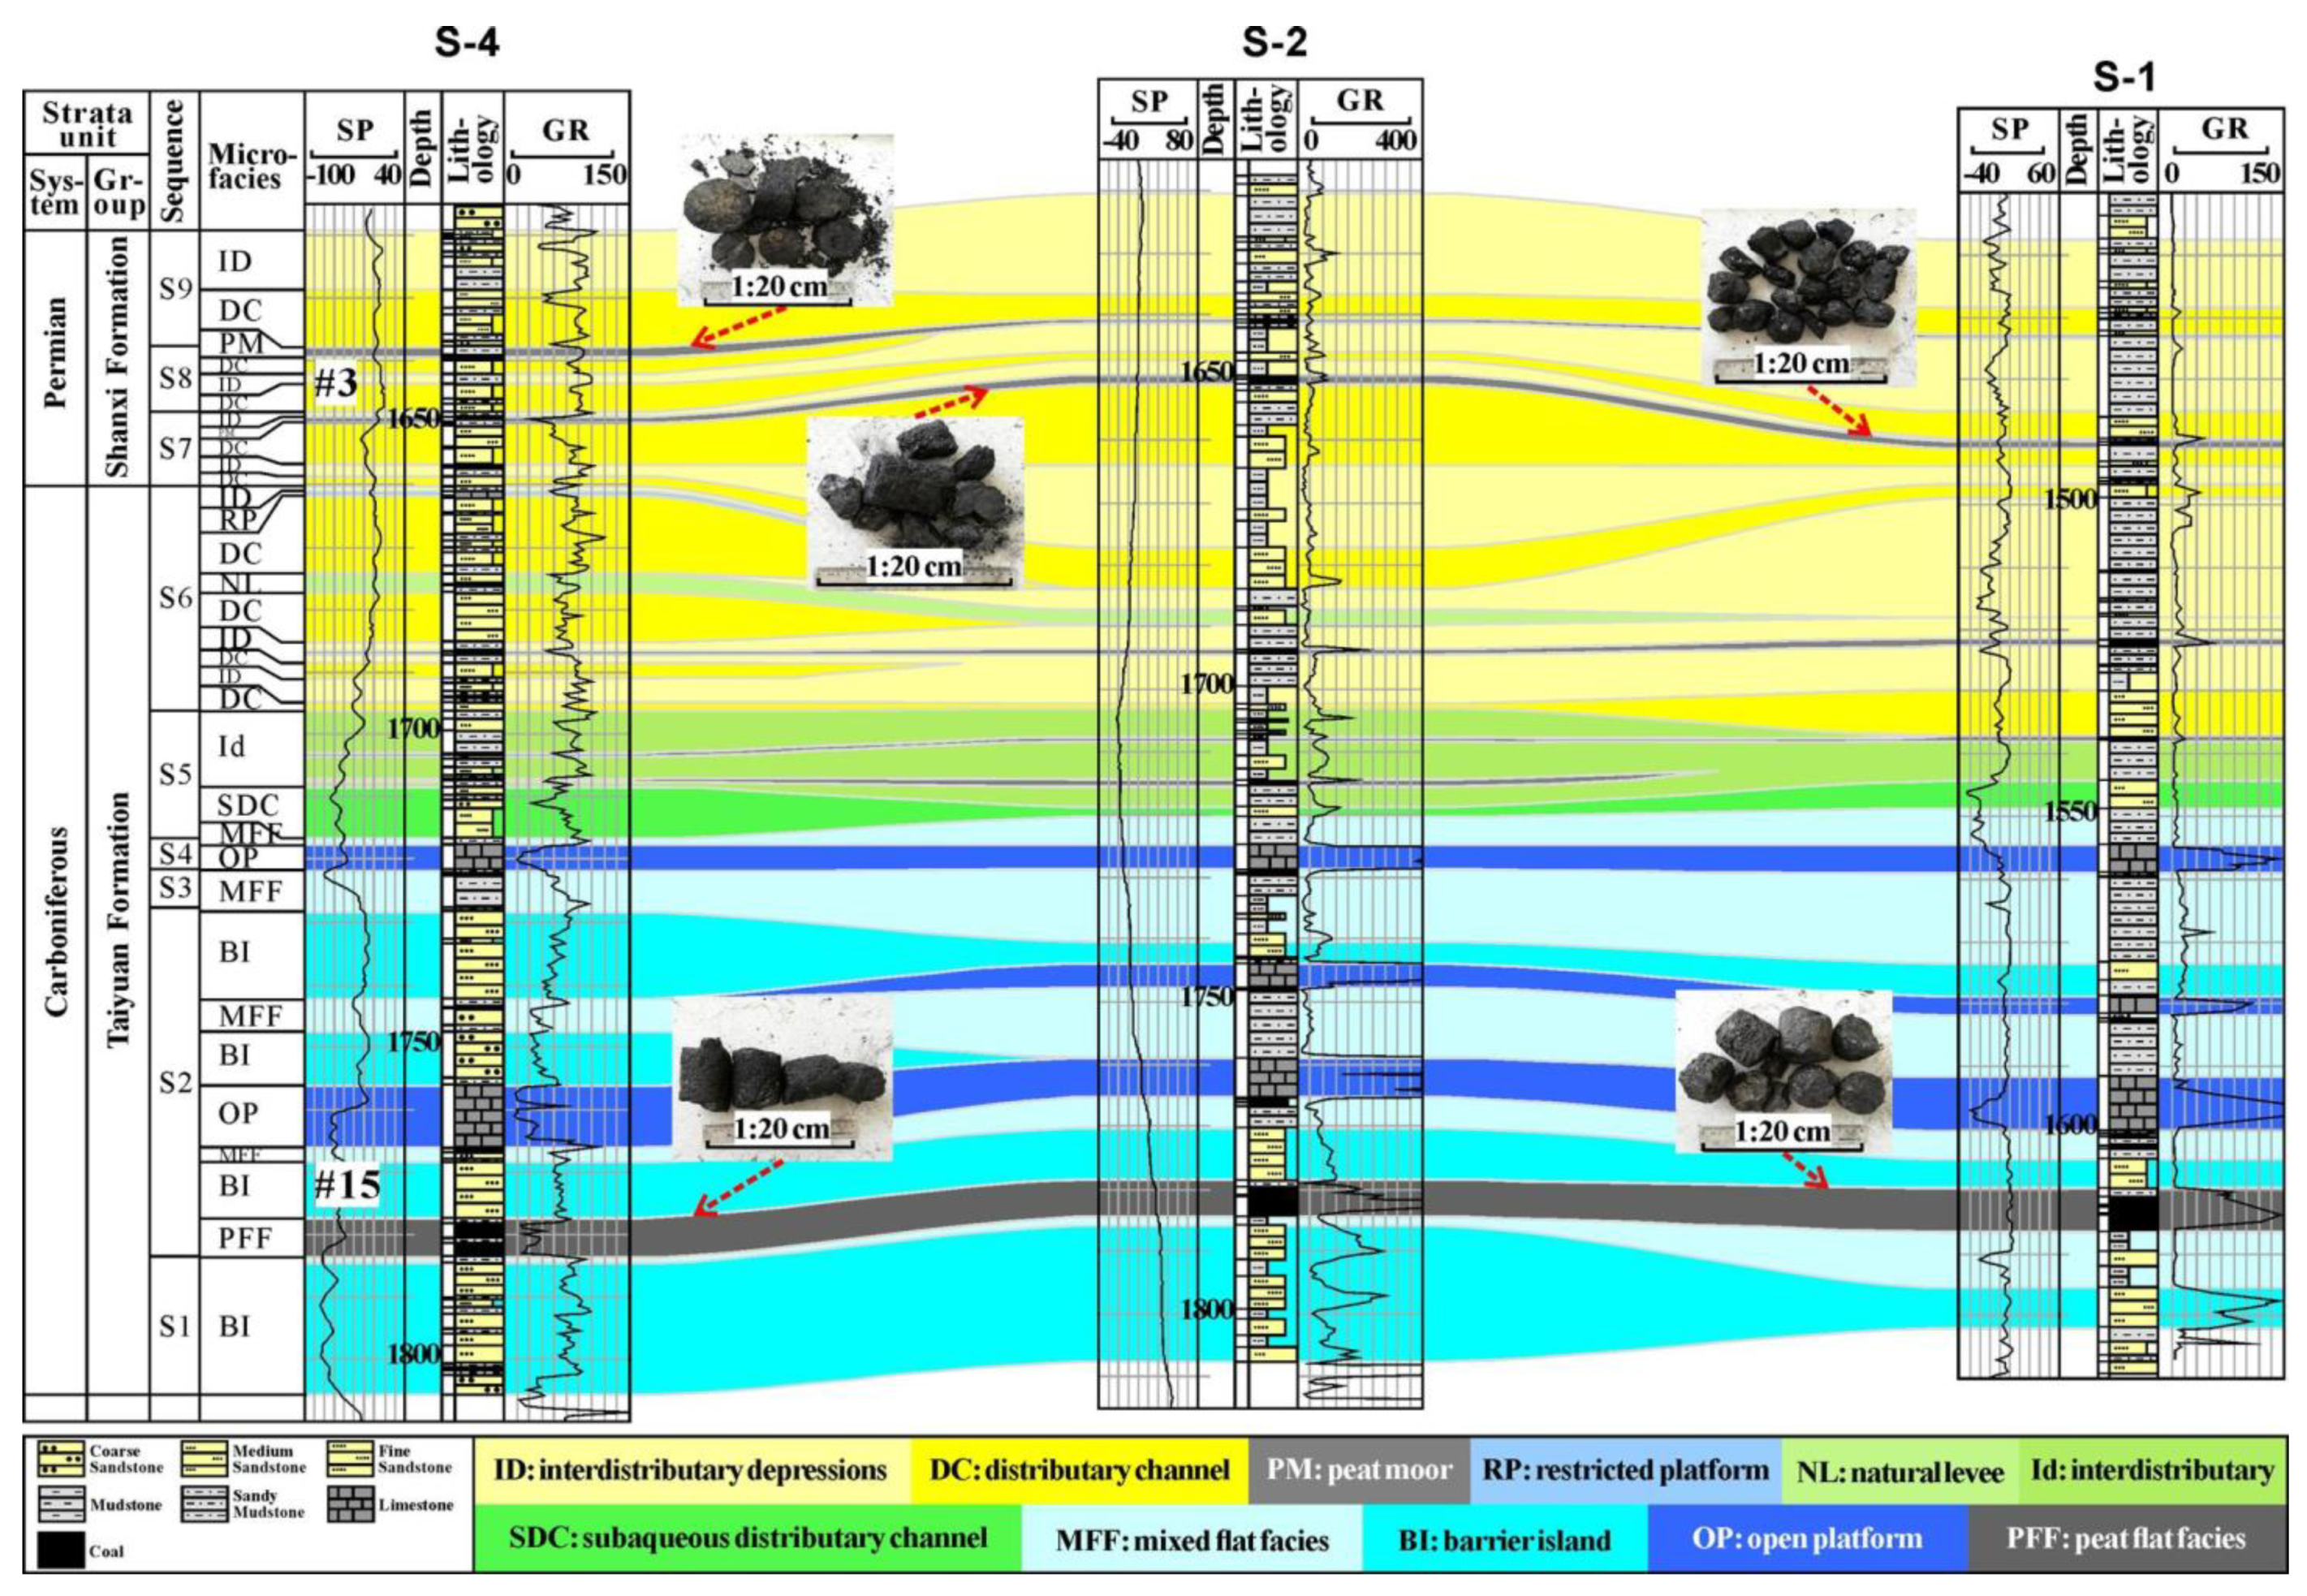
The main coal-bearing rock systems in this area are the Shanxi and Taiyuan formations, of which the Shanxi Formation is a deltaic sedimentary system, the upper part of the Taiyuan Formation is a deltaic sedimentary system and the lower part is a barrier coastal sedimentary system. The sedimentary microphases developed in the Shanxi Formation are mainly interdiversion depressions, diversion channels and peat bogs, etc. The sedimentary microphases developed in the upper part of the Taiyuan Formation are mainly submerged diversion channels and interdiversion bays, and the sedimentary microphases developed in the lower part of the Taiyuan Formation are mainly barrier islands, lagoons, sand pings, mud pings, mixed pings, open terraces and peat bogs (Figure 9), whose lithology is directly related to the preservation of CBM. However, the various logging parameters in the 3D work zone were difficult to obtain by inversion, so we needed to mine the data comprehensively within a limited number of attribute parameters.

Figure 9.
Profile of sedimentary connecting wells of coal samples from coalbed methane blocks in Hengling.
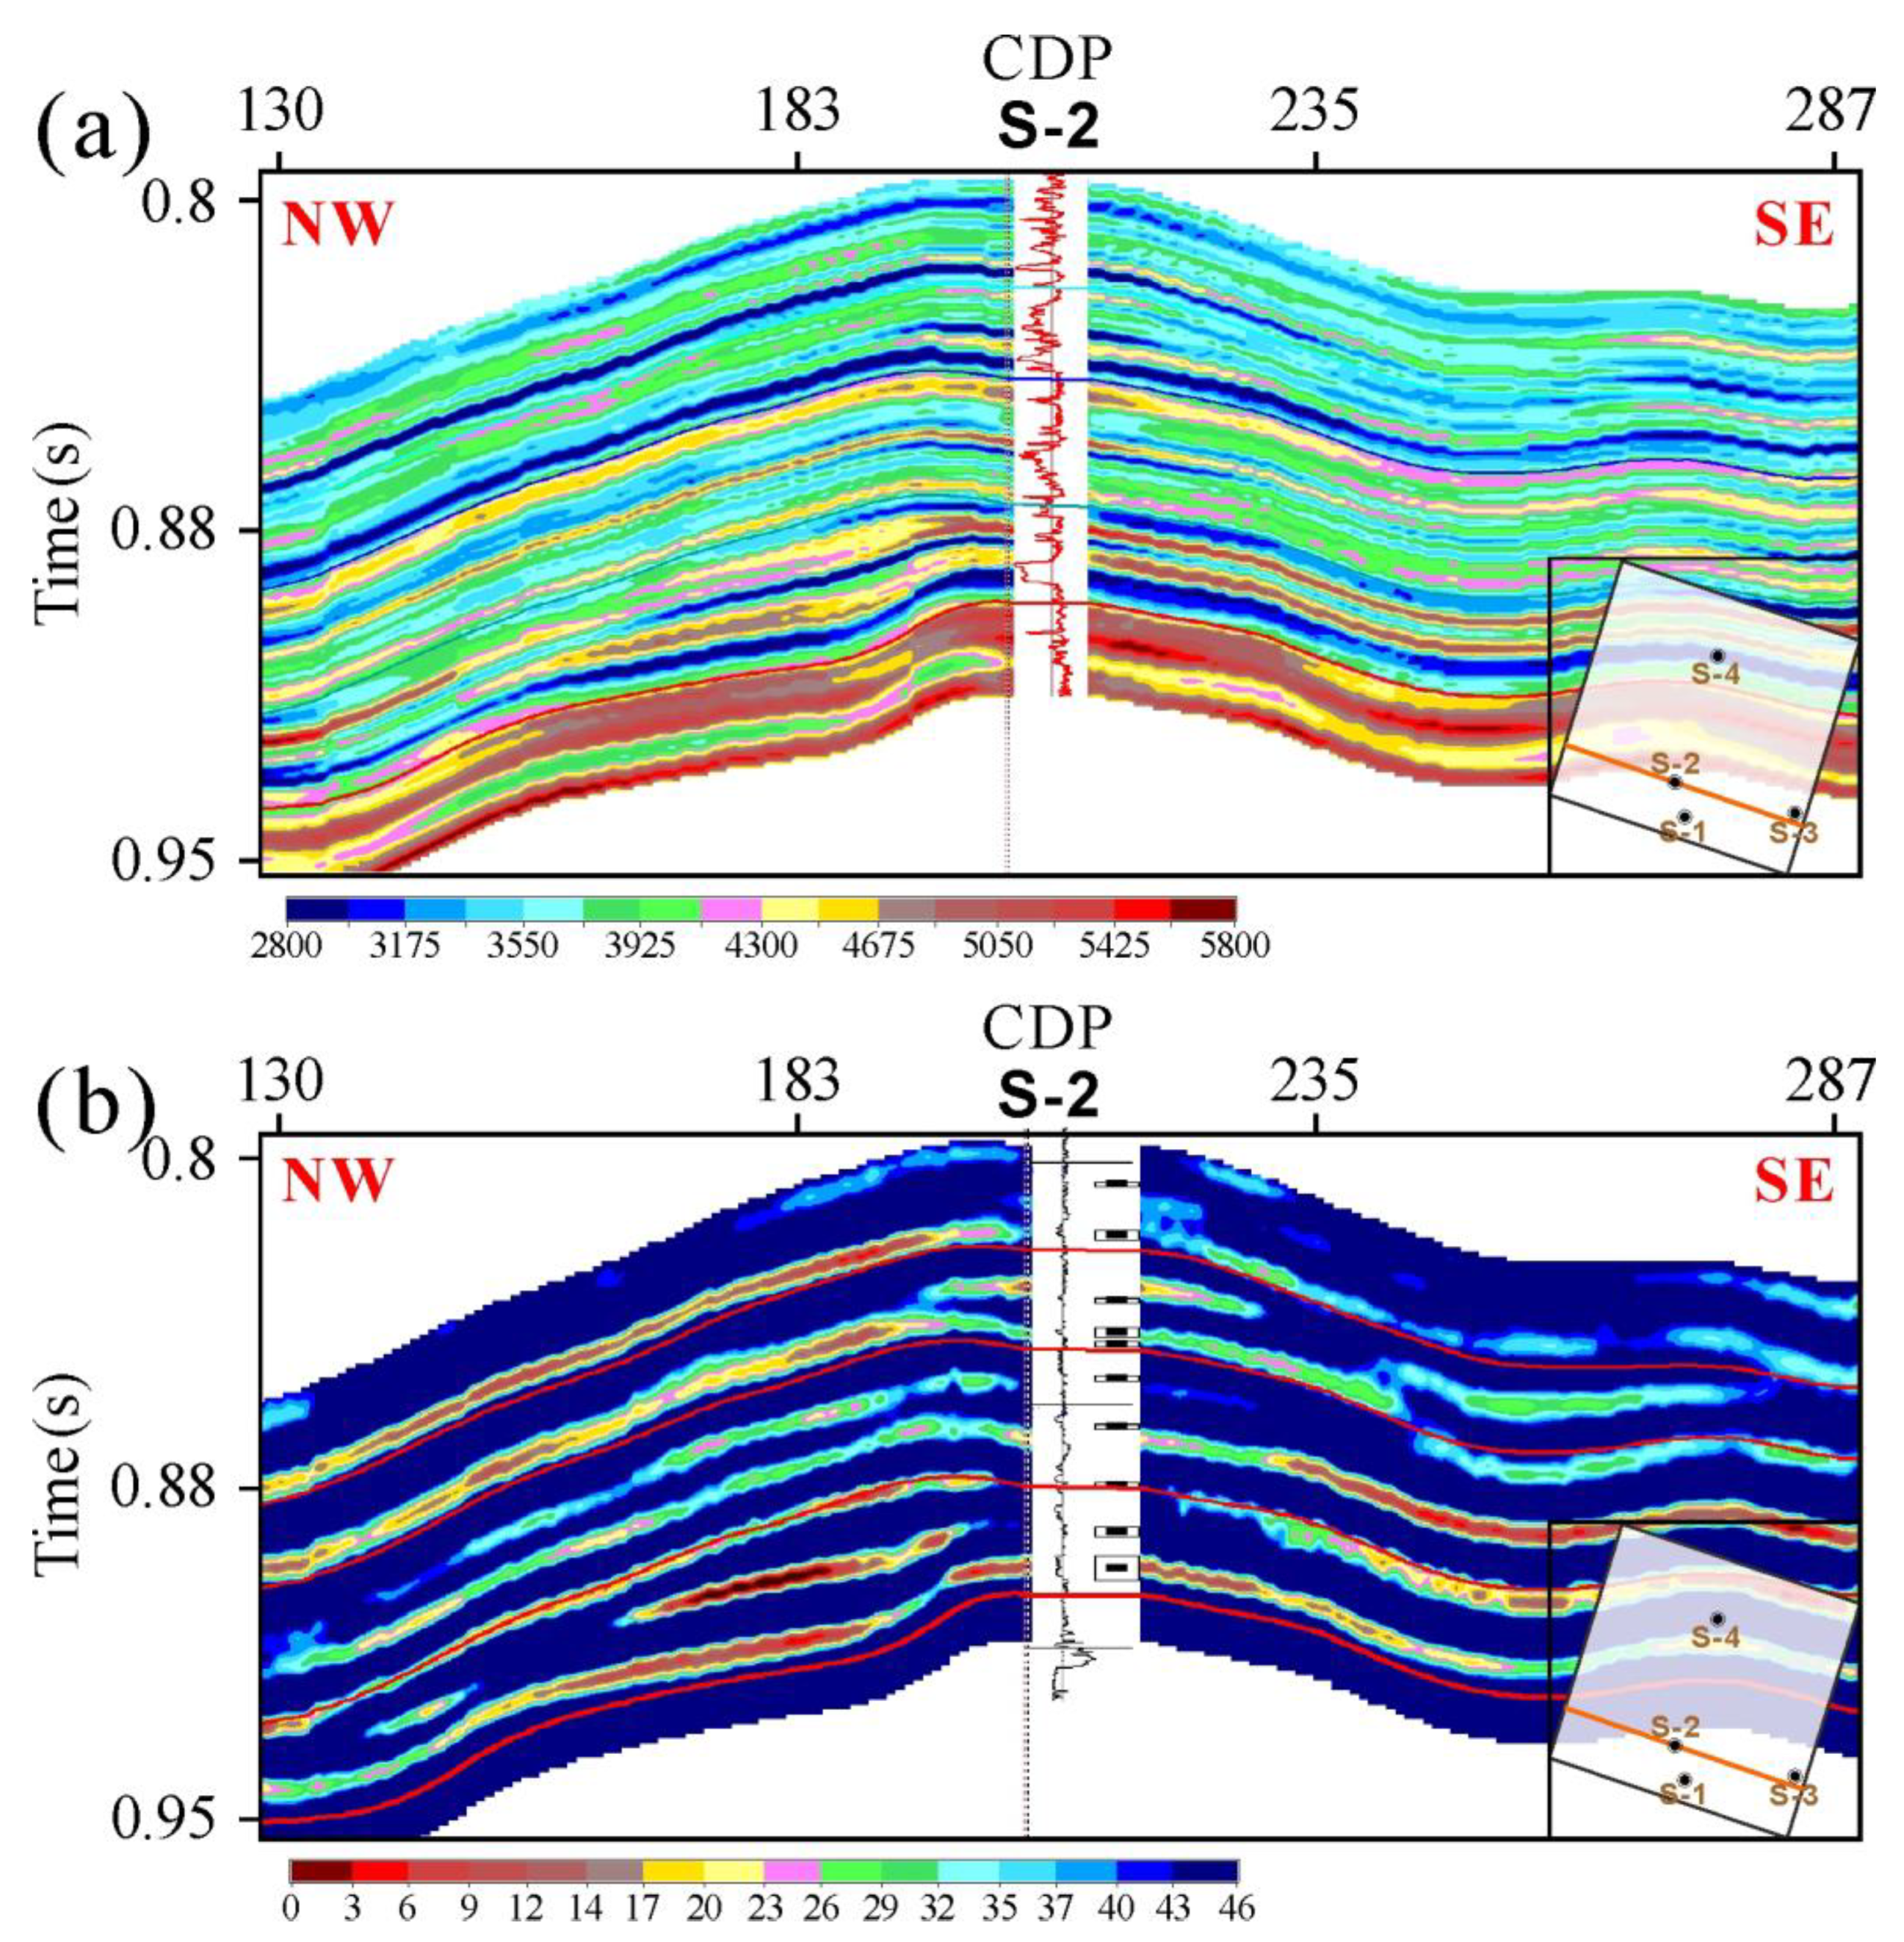
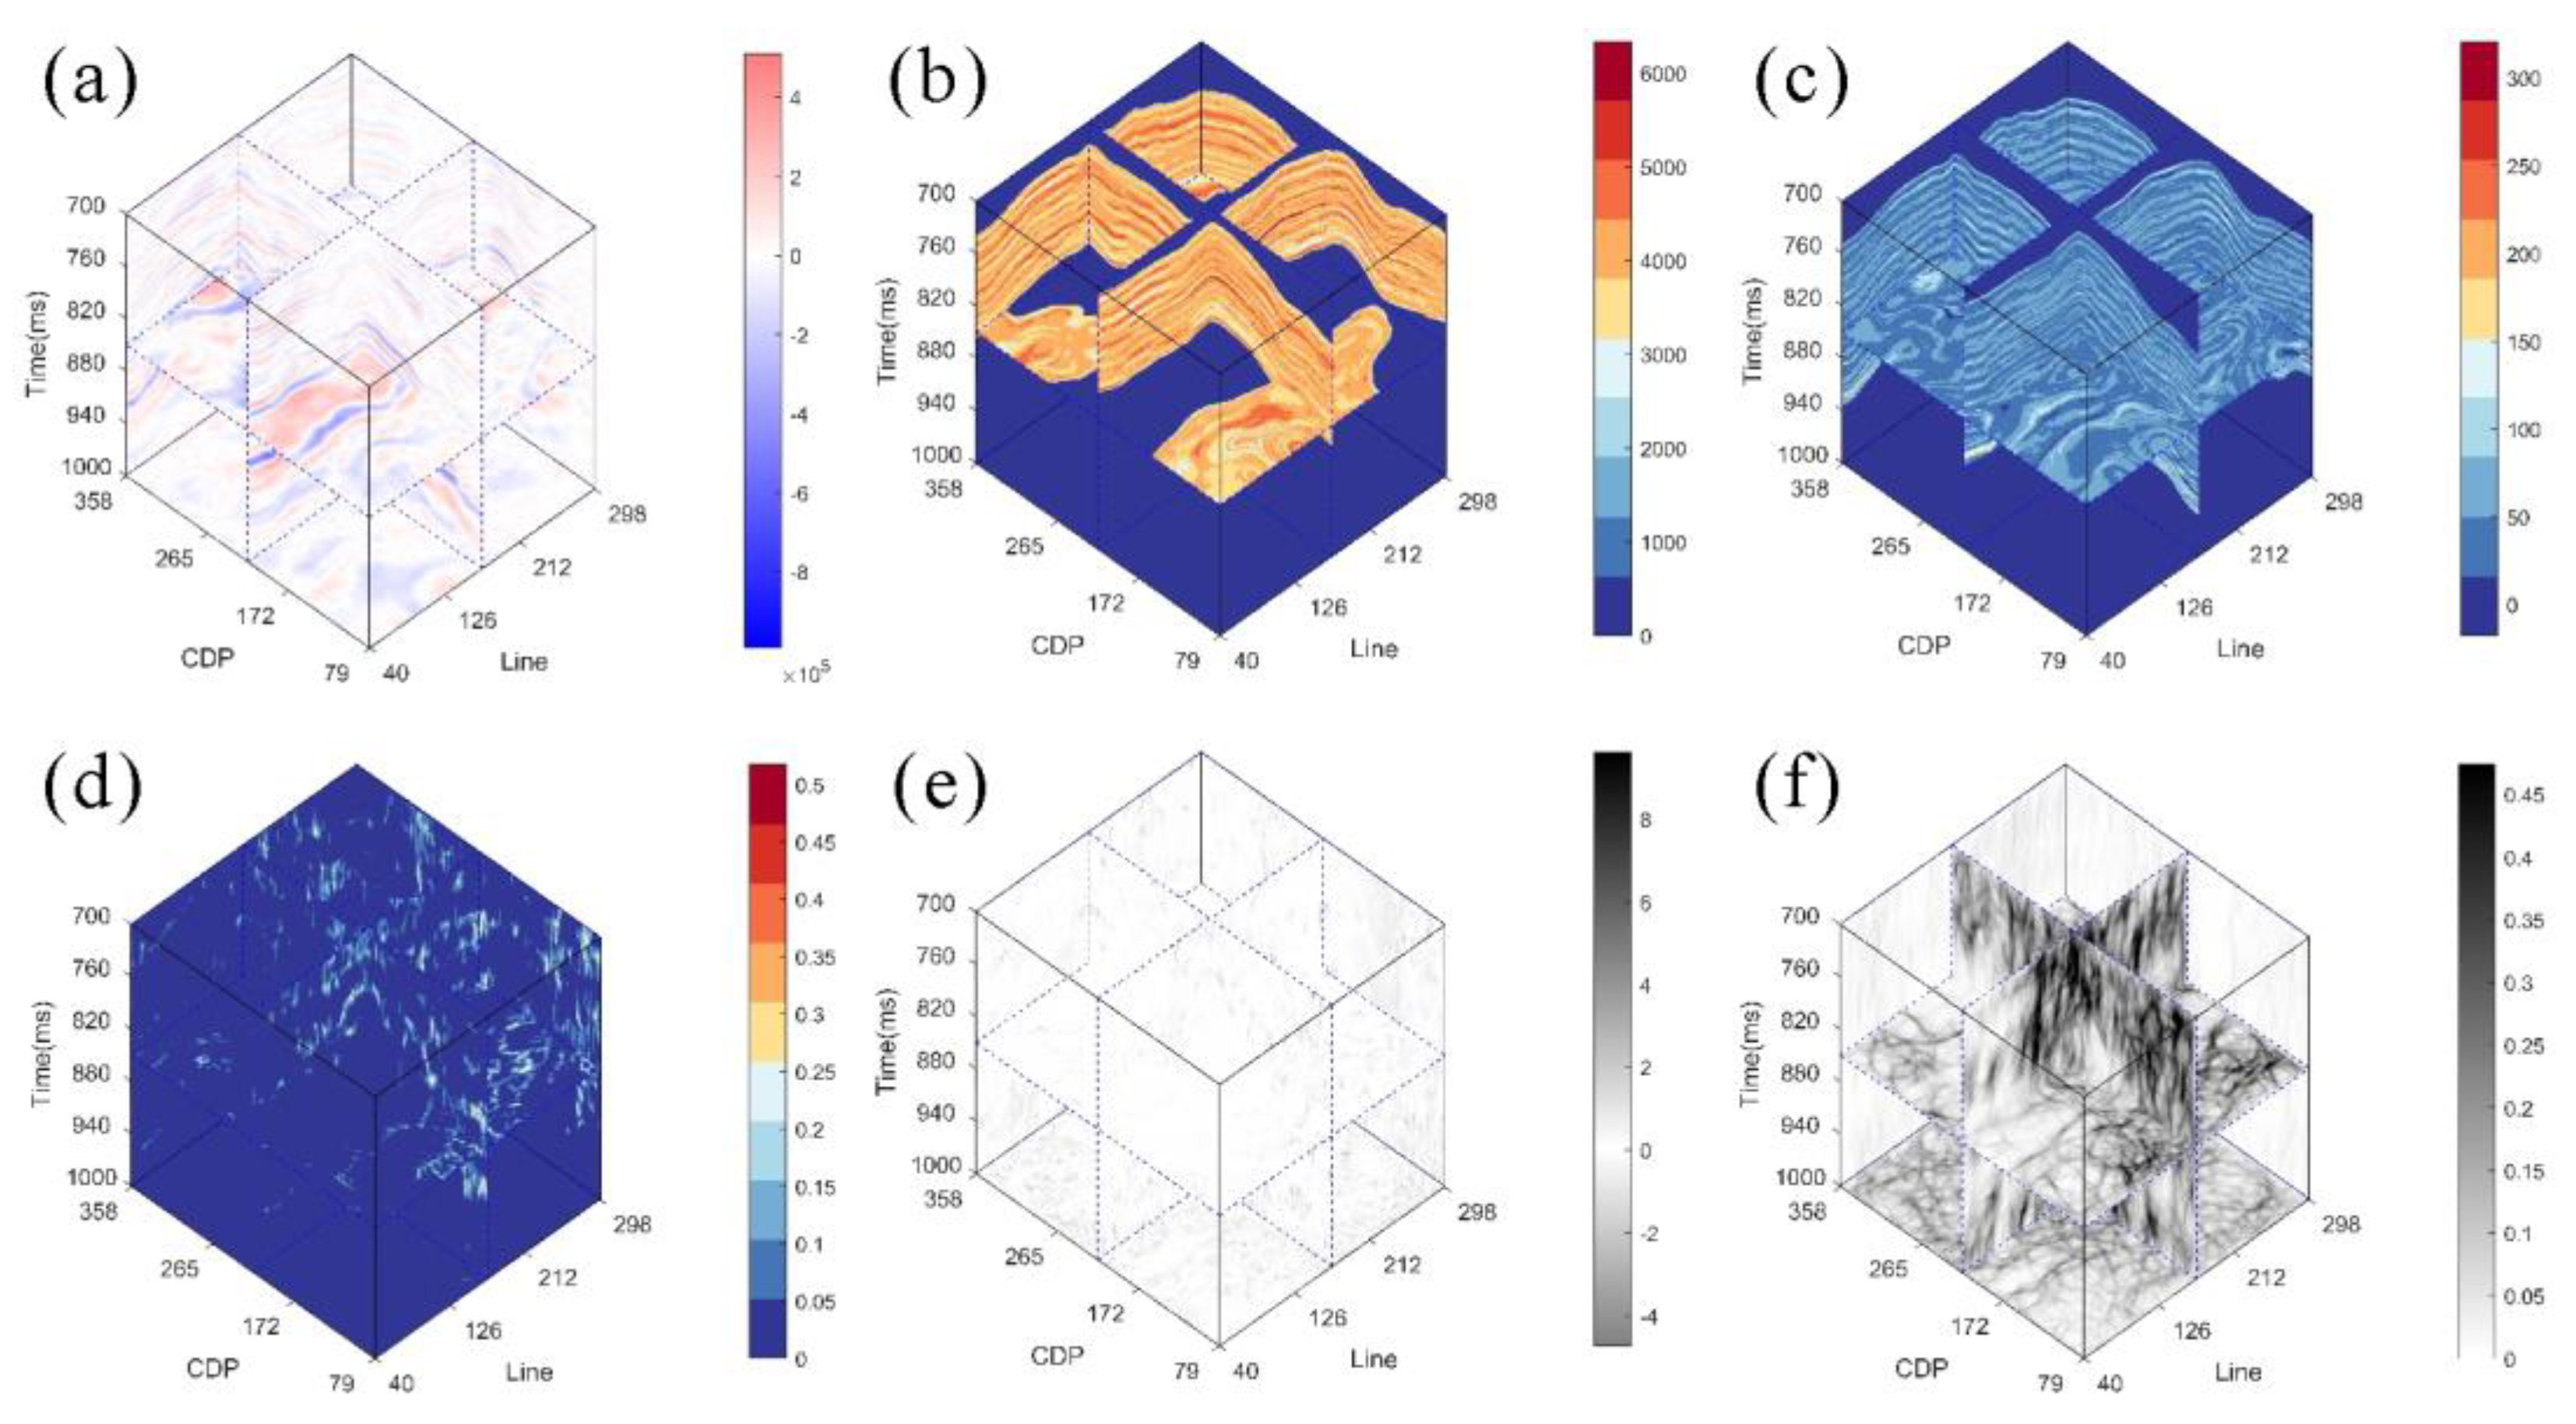
In this study, a seismic phase-controlled nonlinear chaos inversion technique [10] was used, which has great advantages for the identification of thin coal seams. As shown in Figure 10a, a comparison of the post-stack inversion profile of well S-2 with a logging curve shows that the reservoir characteristics of the profile were obvious, with low-velocity coal seams (dark blue), high-velocity limestone (red), medium- to high-velocity sand (yellow) and mud shale (light blue), and the inversion profile is very effective in identifying lithology. The pre-stack inversion profile (Figure 10b) on the S-2 well corresponded well to the gas-bearing properties, with high values of full hydrocarbon detection. The two 3D data volumes were entered into the IT2-FLS as rock block characterization parameters (Figure 11b,c).

Figure 10.
(a) Post-stack nonlinear impedance inversion profile and (b) Lamé coefficient multiplied density profile. The logging curves in the figures are the P-wave velocity and hydrocarbon detection curves, respectively. The graphical identification is coal rock. The locations of the post-stack and pre-stack inversion profiles are shown in the lower right corner, respectively.

Figure 11.
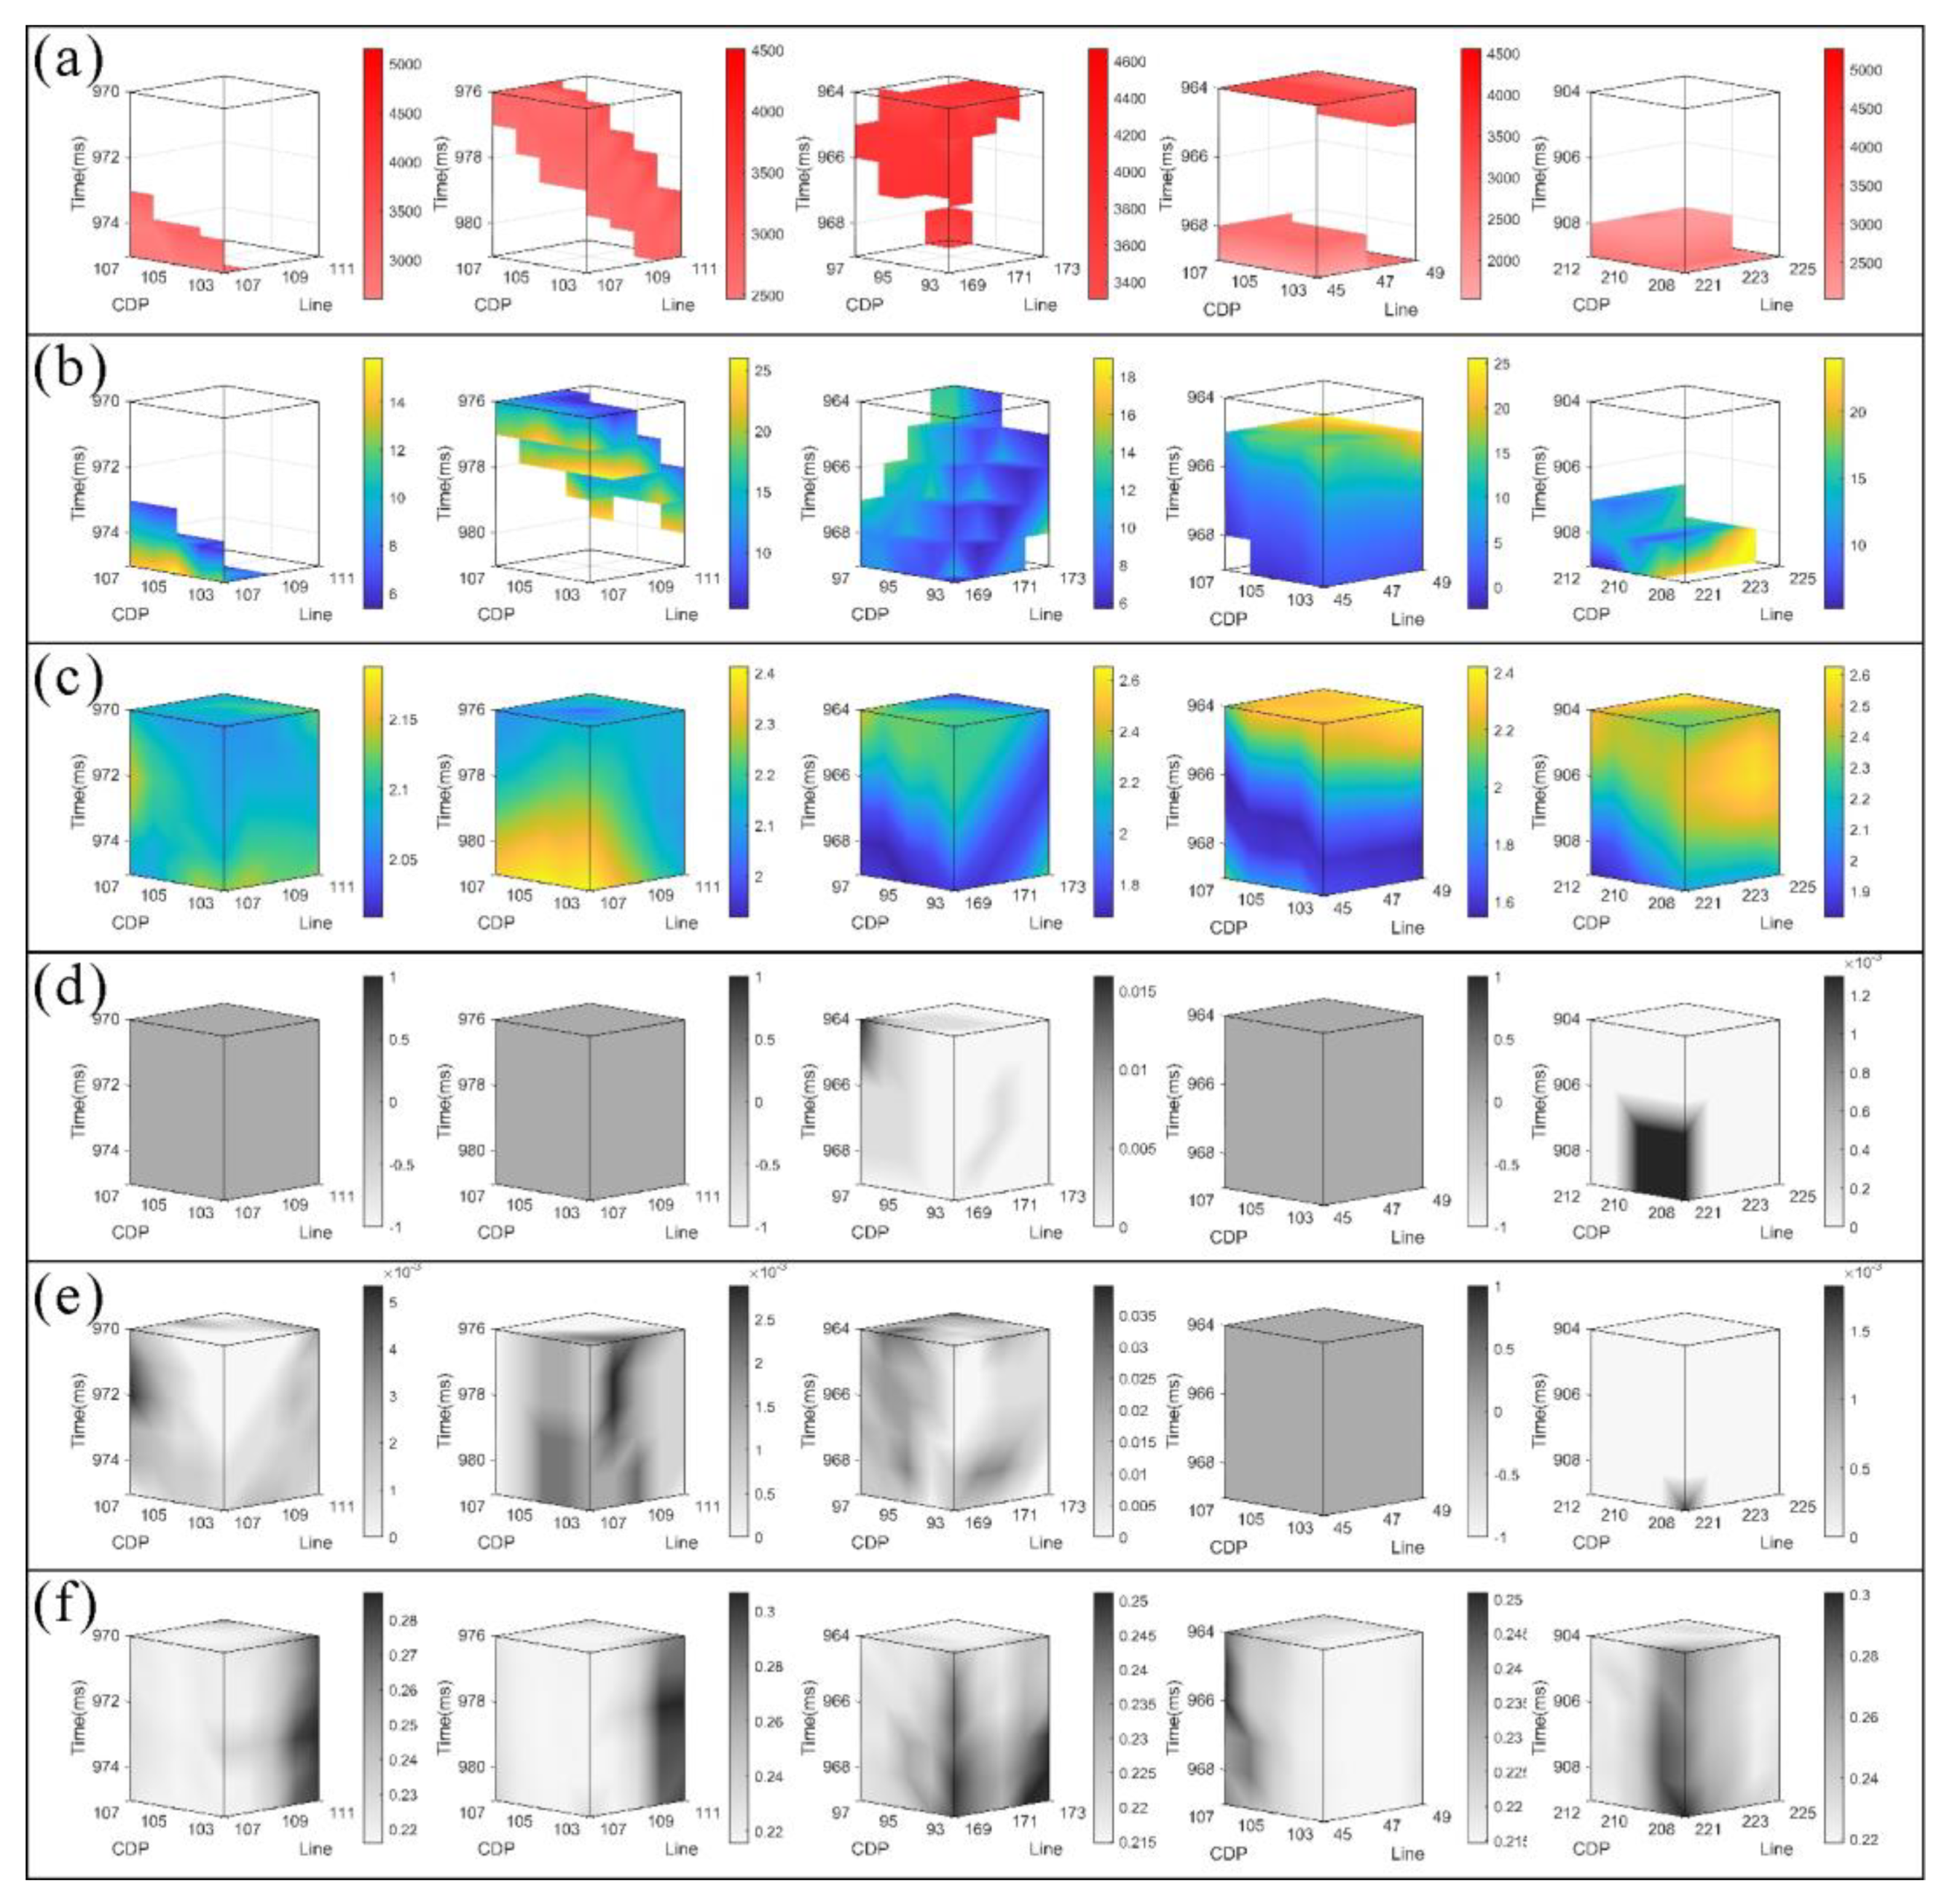
(a) Seismic pure wave volume, (b) post-stack impedance volume, (c) pre-stack Larmé coefficient times density volume, (d) coherence volume, (e) curvature volume and (f) optimal surface voting volume for OVT domains with integrated multi-directional information.
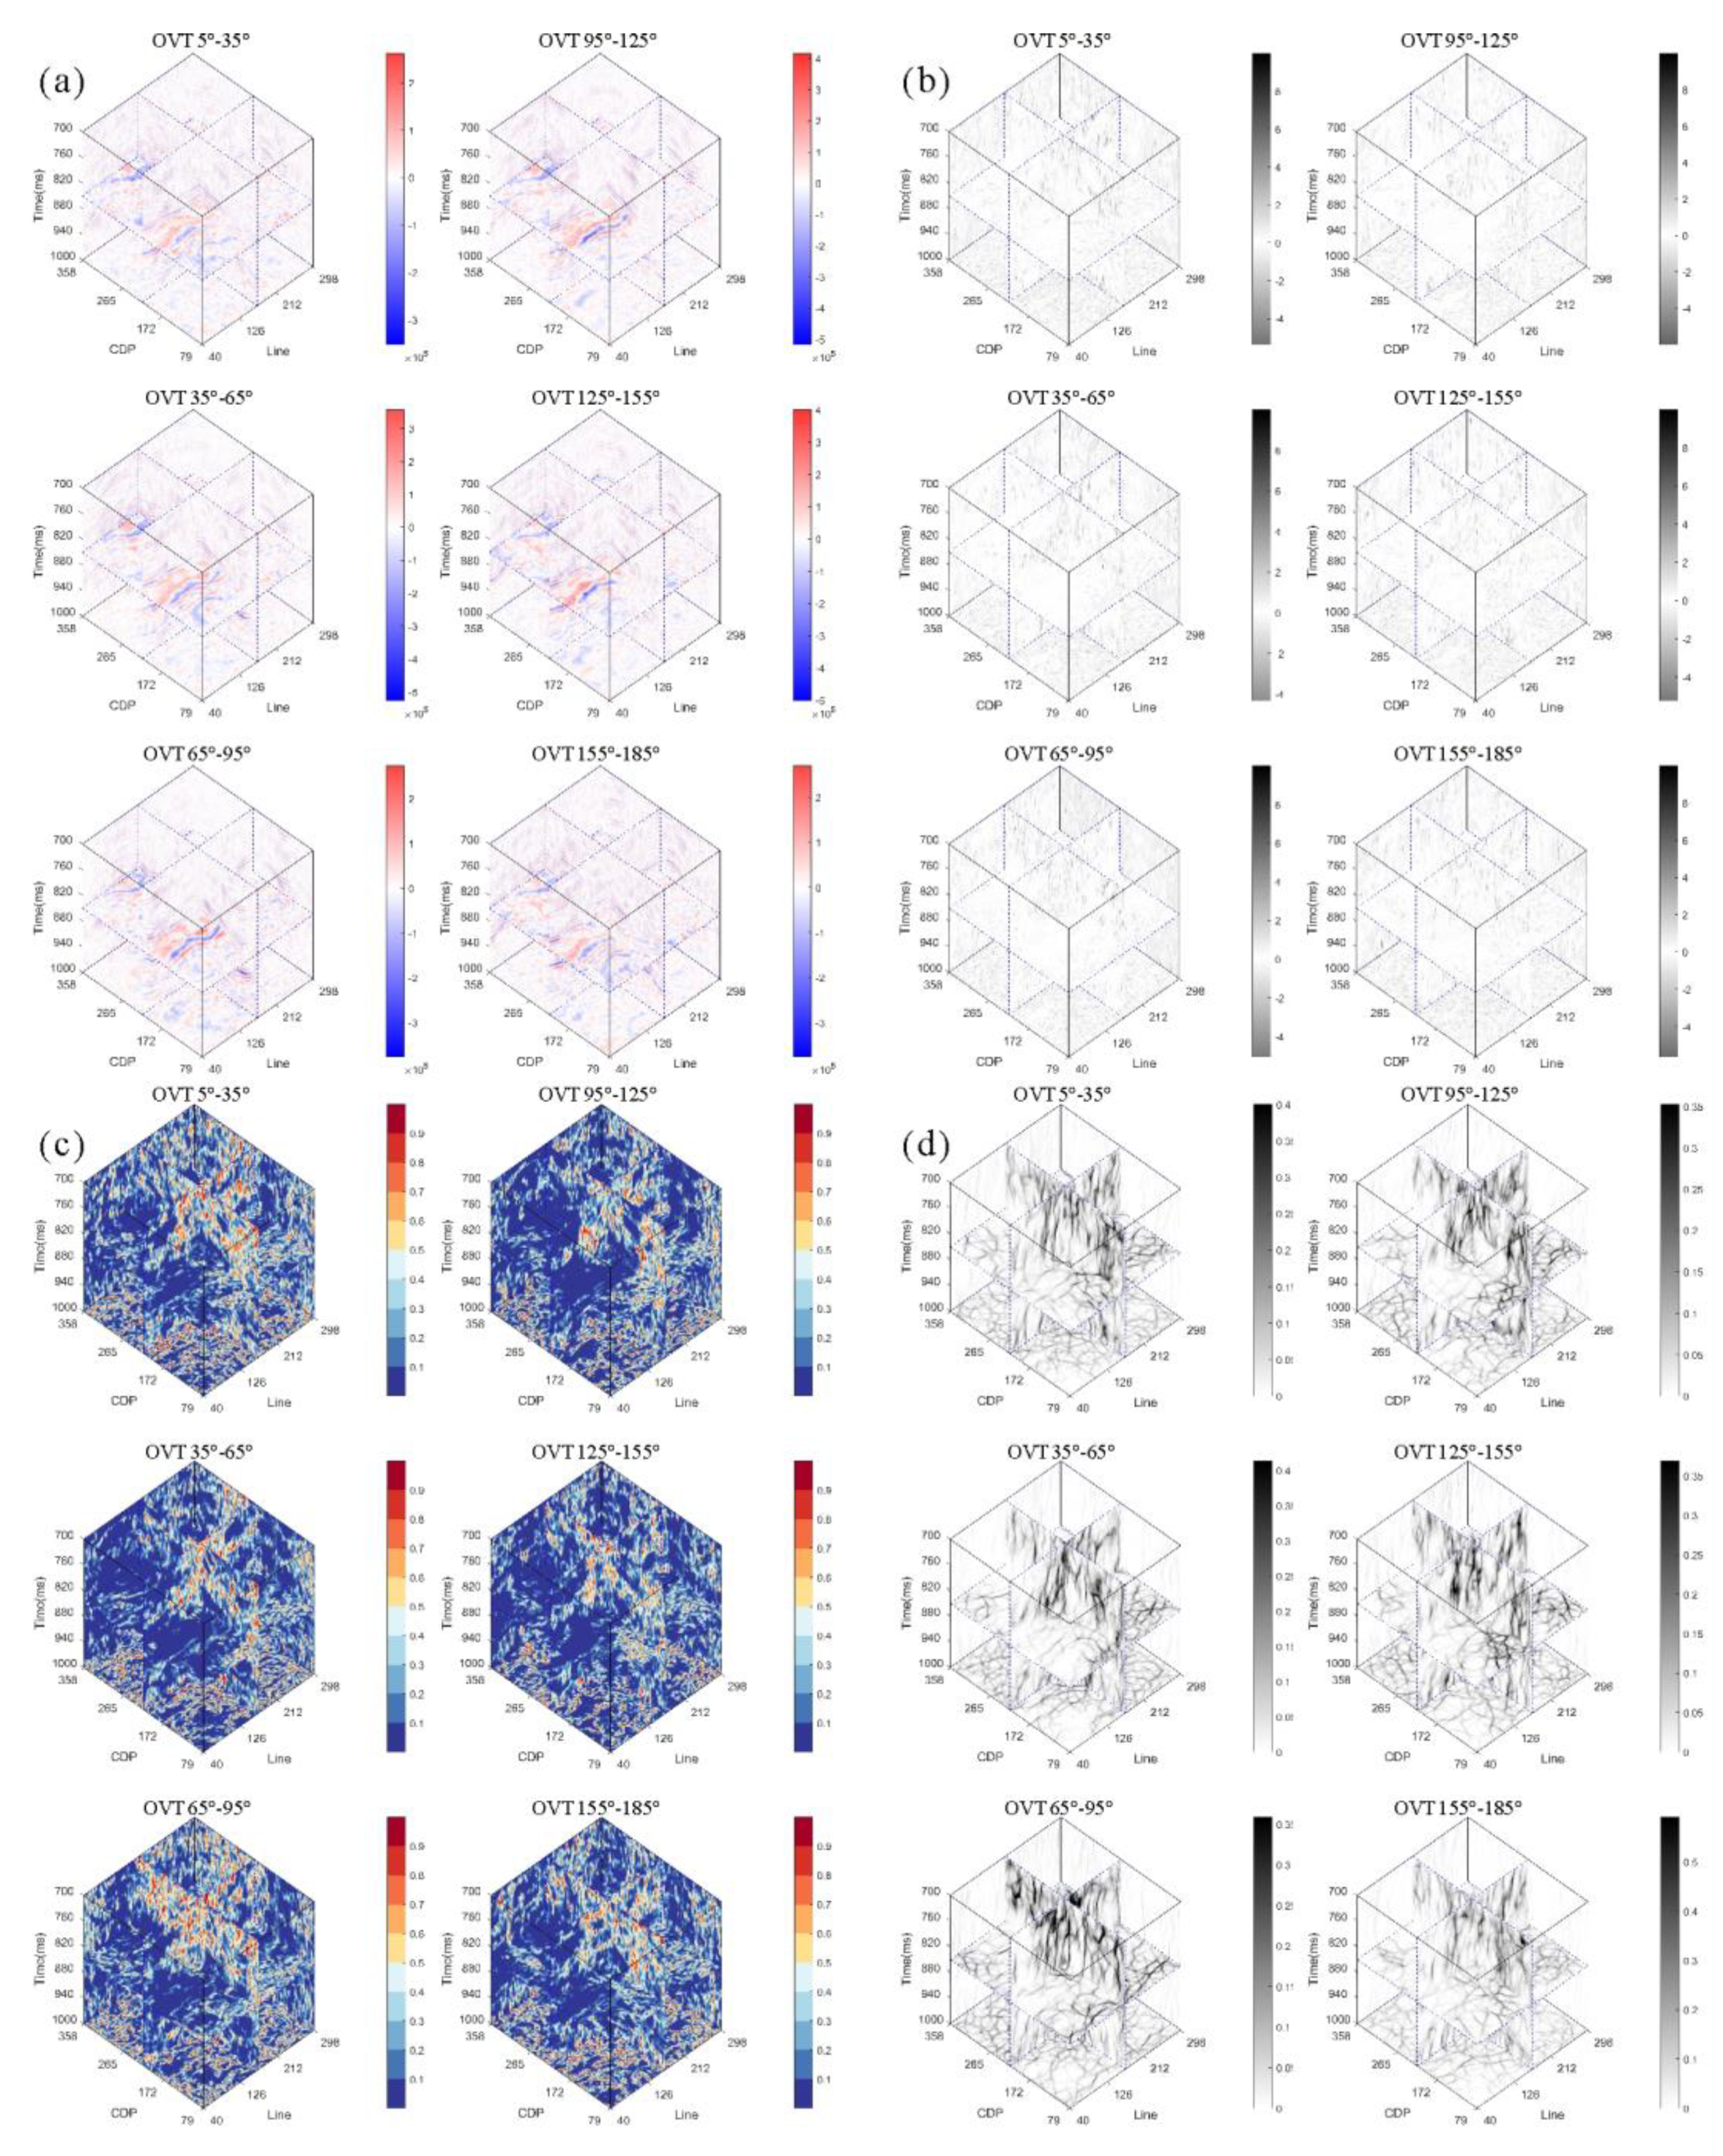
We also calculated the coherent and curvature data volumes for the coal-rock linkage in the GSI chart (Figure 11d,e). In order to fully employ the wide azimuthal stacked forepath set data obtained from the Offset Vector Tile (OVT) domain processing, we applied the optimal surface voting crack detection technique of Wu et al. (2018) [36] to the azimuthal seismic information because the azimuthal information added by OVT helps in the extraction of the 3D spatial seed points. As shown in Figure 12d, we can observe the fracture growth with six different elements of orientation information, and we can combine the multi-directional fracture characteristics (Figure 12a–c) to obtain the integrated fracture parameter of the OVT domain (Figure 11f). This new fracture attribute parameter is more recognizable than the traditional fracture attribute parameter feature, so we input this parameter into the IT2-FLS as a comprehensive indicator of the current status of coal-rock linkage (SCL).

Figure 12.
(a) Seismic pure wave volumes, (b) curvature volumes, (c) coherent volumes and (d) optimal surface voting volumes for six orientations in the OVT domain.
Finally, we combine the surface quality conditions (SQCs) in the GSI table of IT2-FLS with inverse physical parameters, such as p-wave velocity, density and the Lamé coefficient, and the current SCL with seismic property indices, such as the seismic coherence cube, curvature and OVT domain optimal voting volume, etc. Combined with our current published methods [37], we can achieve multi-attribute 3D data mining of target lithologies. The method is inspired by seismic data collected with drilling logs, and extracts annotation information and interpretation results along the well trajectory, which effectively solves the most time-consuming process of creating and collecting labels in a huge amount of seismic data.
4. Application of Fuzzy Logic Multi-Attribute Fusion
Considering the coal structural system, the task of this study was to investigate the structural spreading of the coal mass in the target area using a multi-attribute 3D seismic fusion method. The fuzzy output is the multi-parameter predictive coal structure model of the logging wells calculated by regression Equation (1), and the input () is the factors that may affect the coal structure. We selected five attributes (), including seismic impedance, Larmé×density, Vp/Vs ratio, curvature and OVT optimal surface voting volumes, and obtained the input data pairs () by automatically acquiring the coal rock locations of each data set by the program. In order to show the 3D structure of coal rocks, we only kept the parameters related to coal rocks for each group of attributes (Figure 10). The structure of the inversion volume related to lithology is shown in Figure 13a–c, and the development of multi-directional fractures is shown in Figure 13d–f.

Figure 13.
Multi-attribute presentation of coal structure based on data mining. These are the post-stack impedance volume (a), pre-stack Larmé×density volume (b), pre-stack Vp/Vs volume (c), coherent volume (d), curvature volume (e) and OVT optimal surface voting volume (f), respectively.
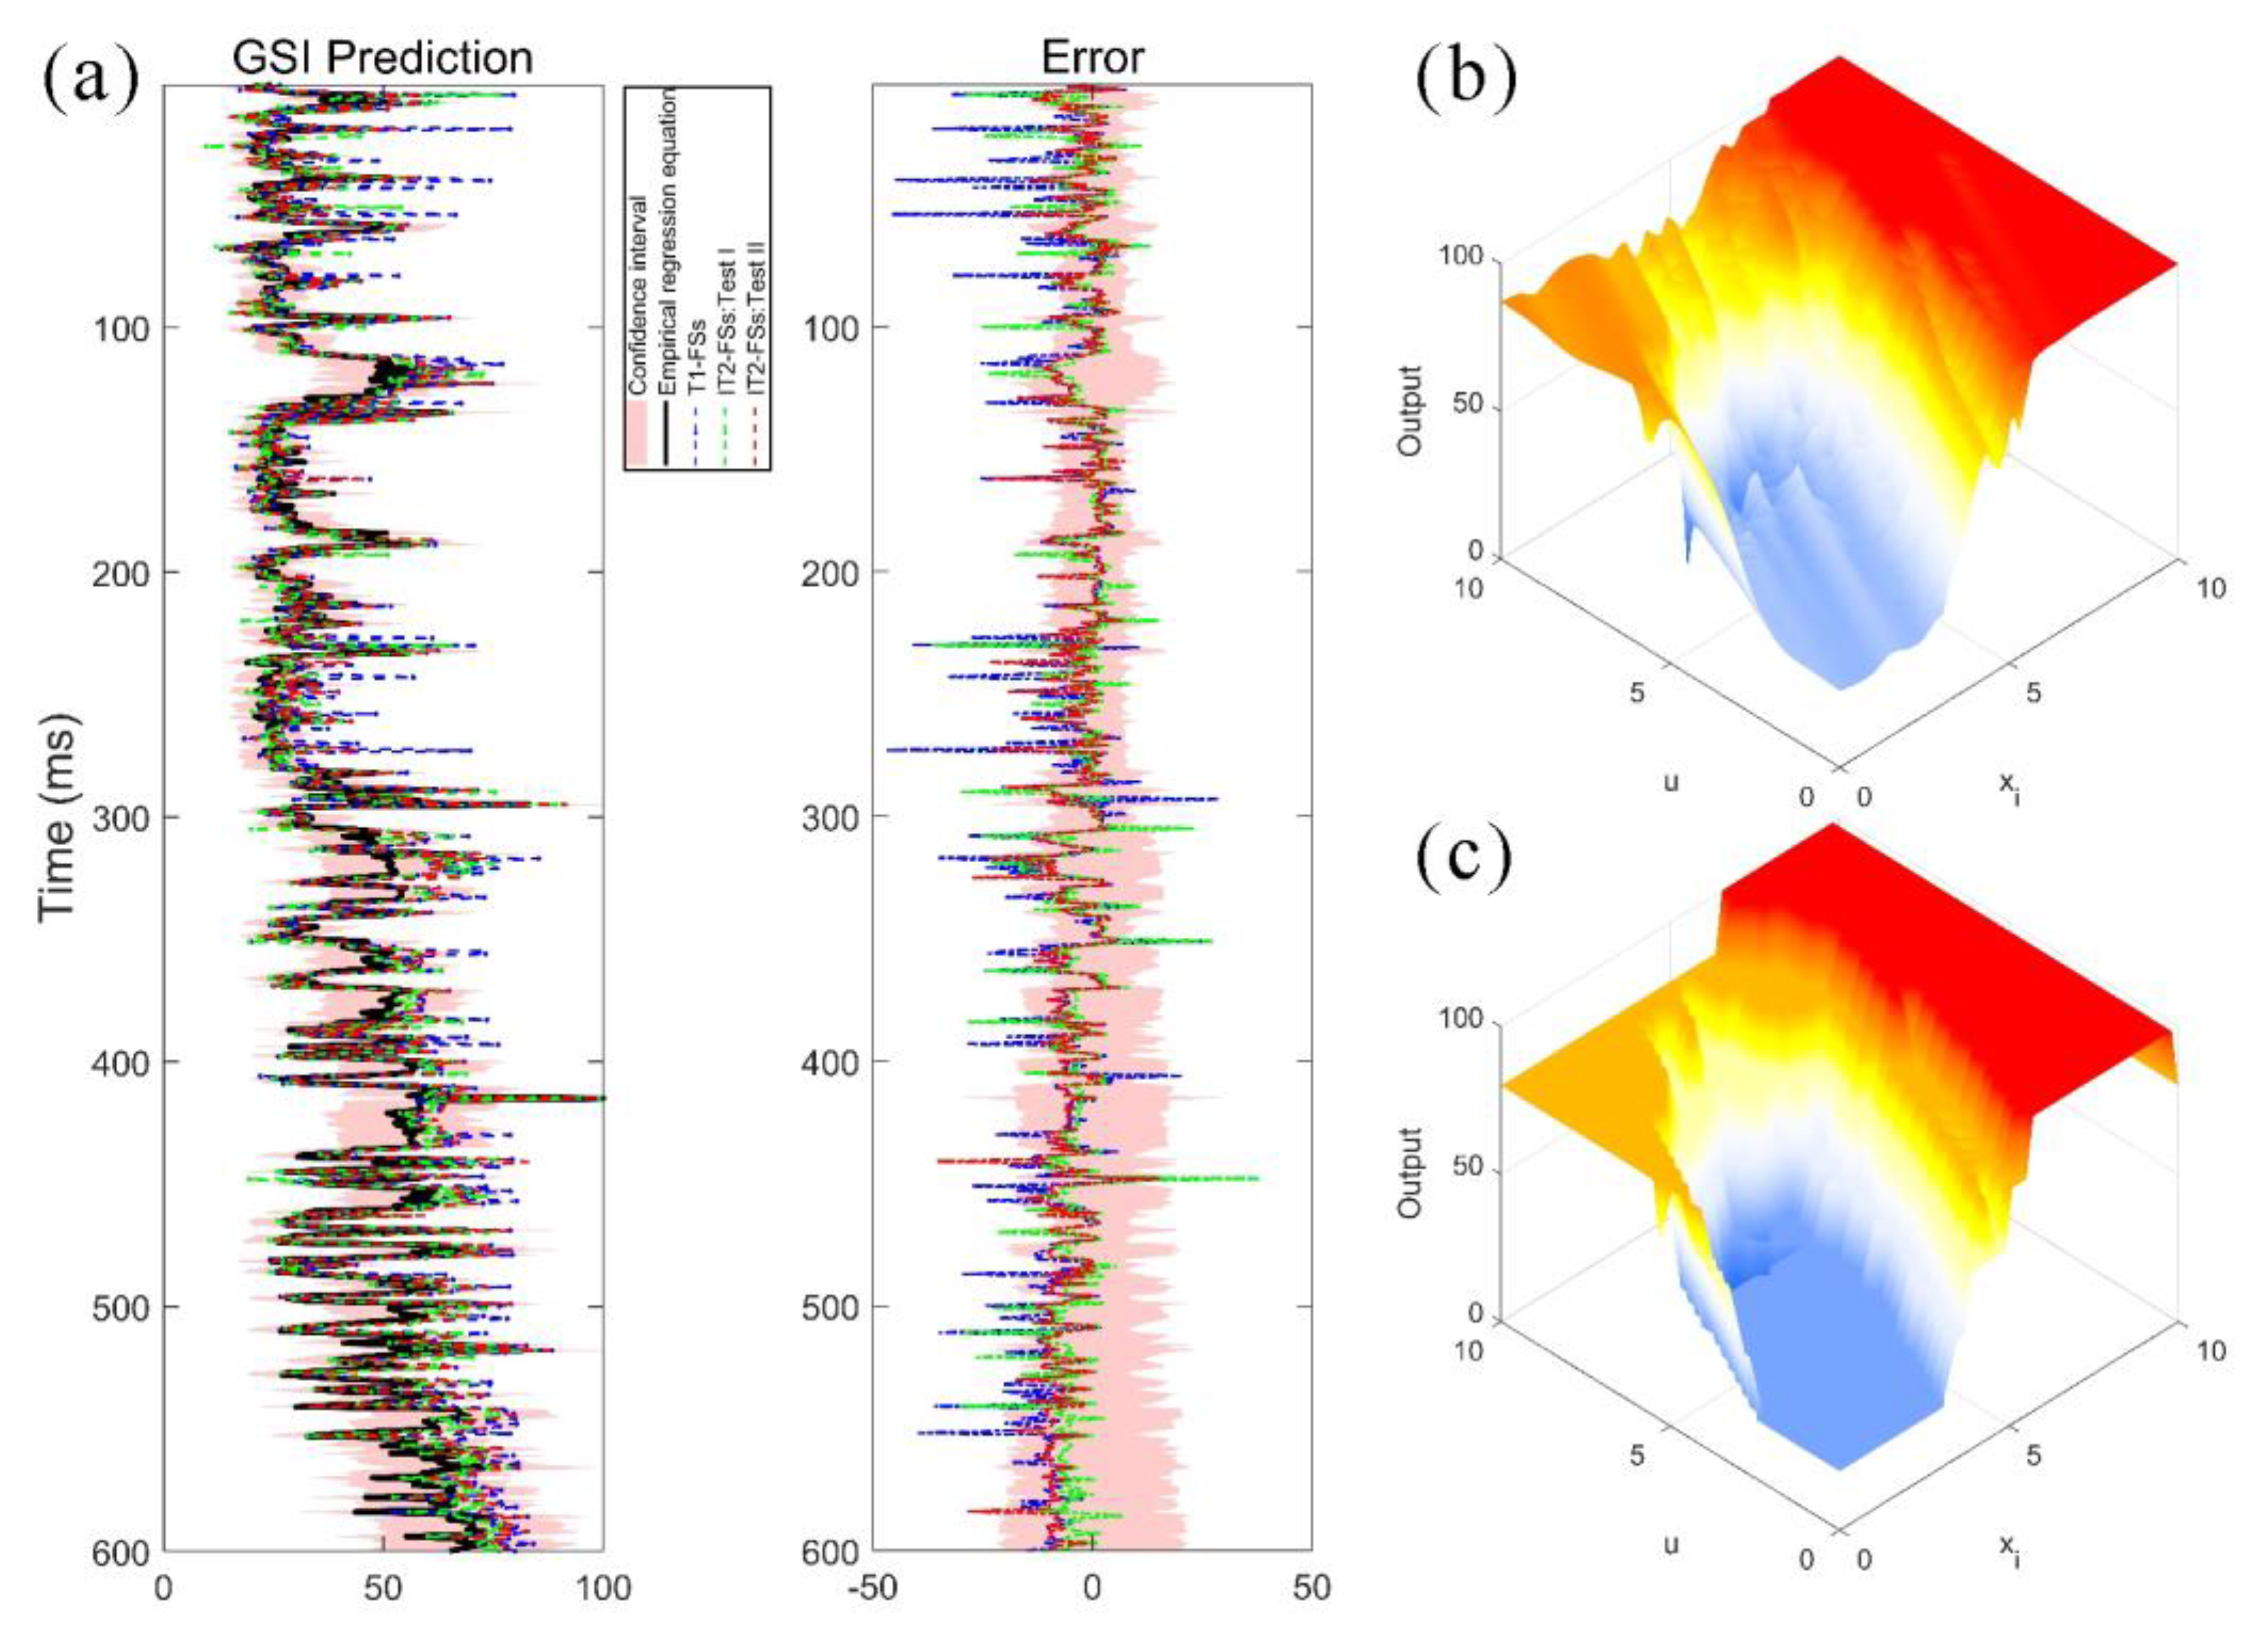
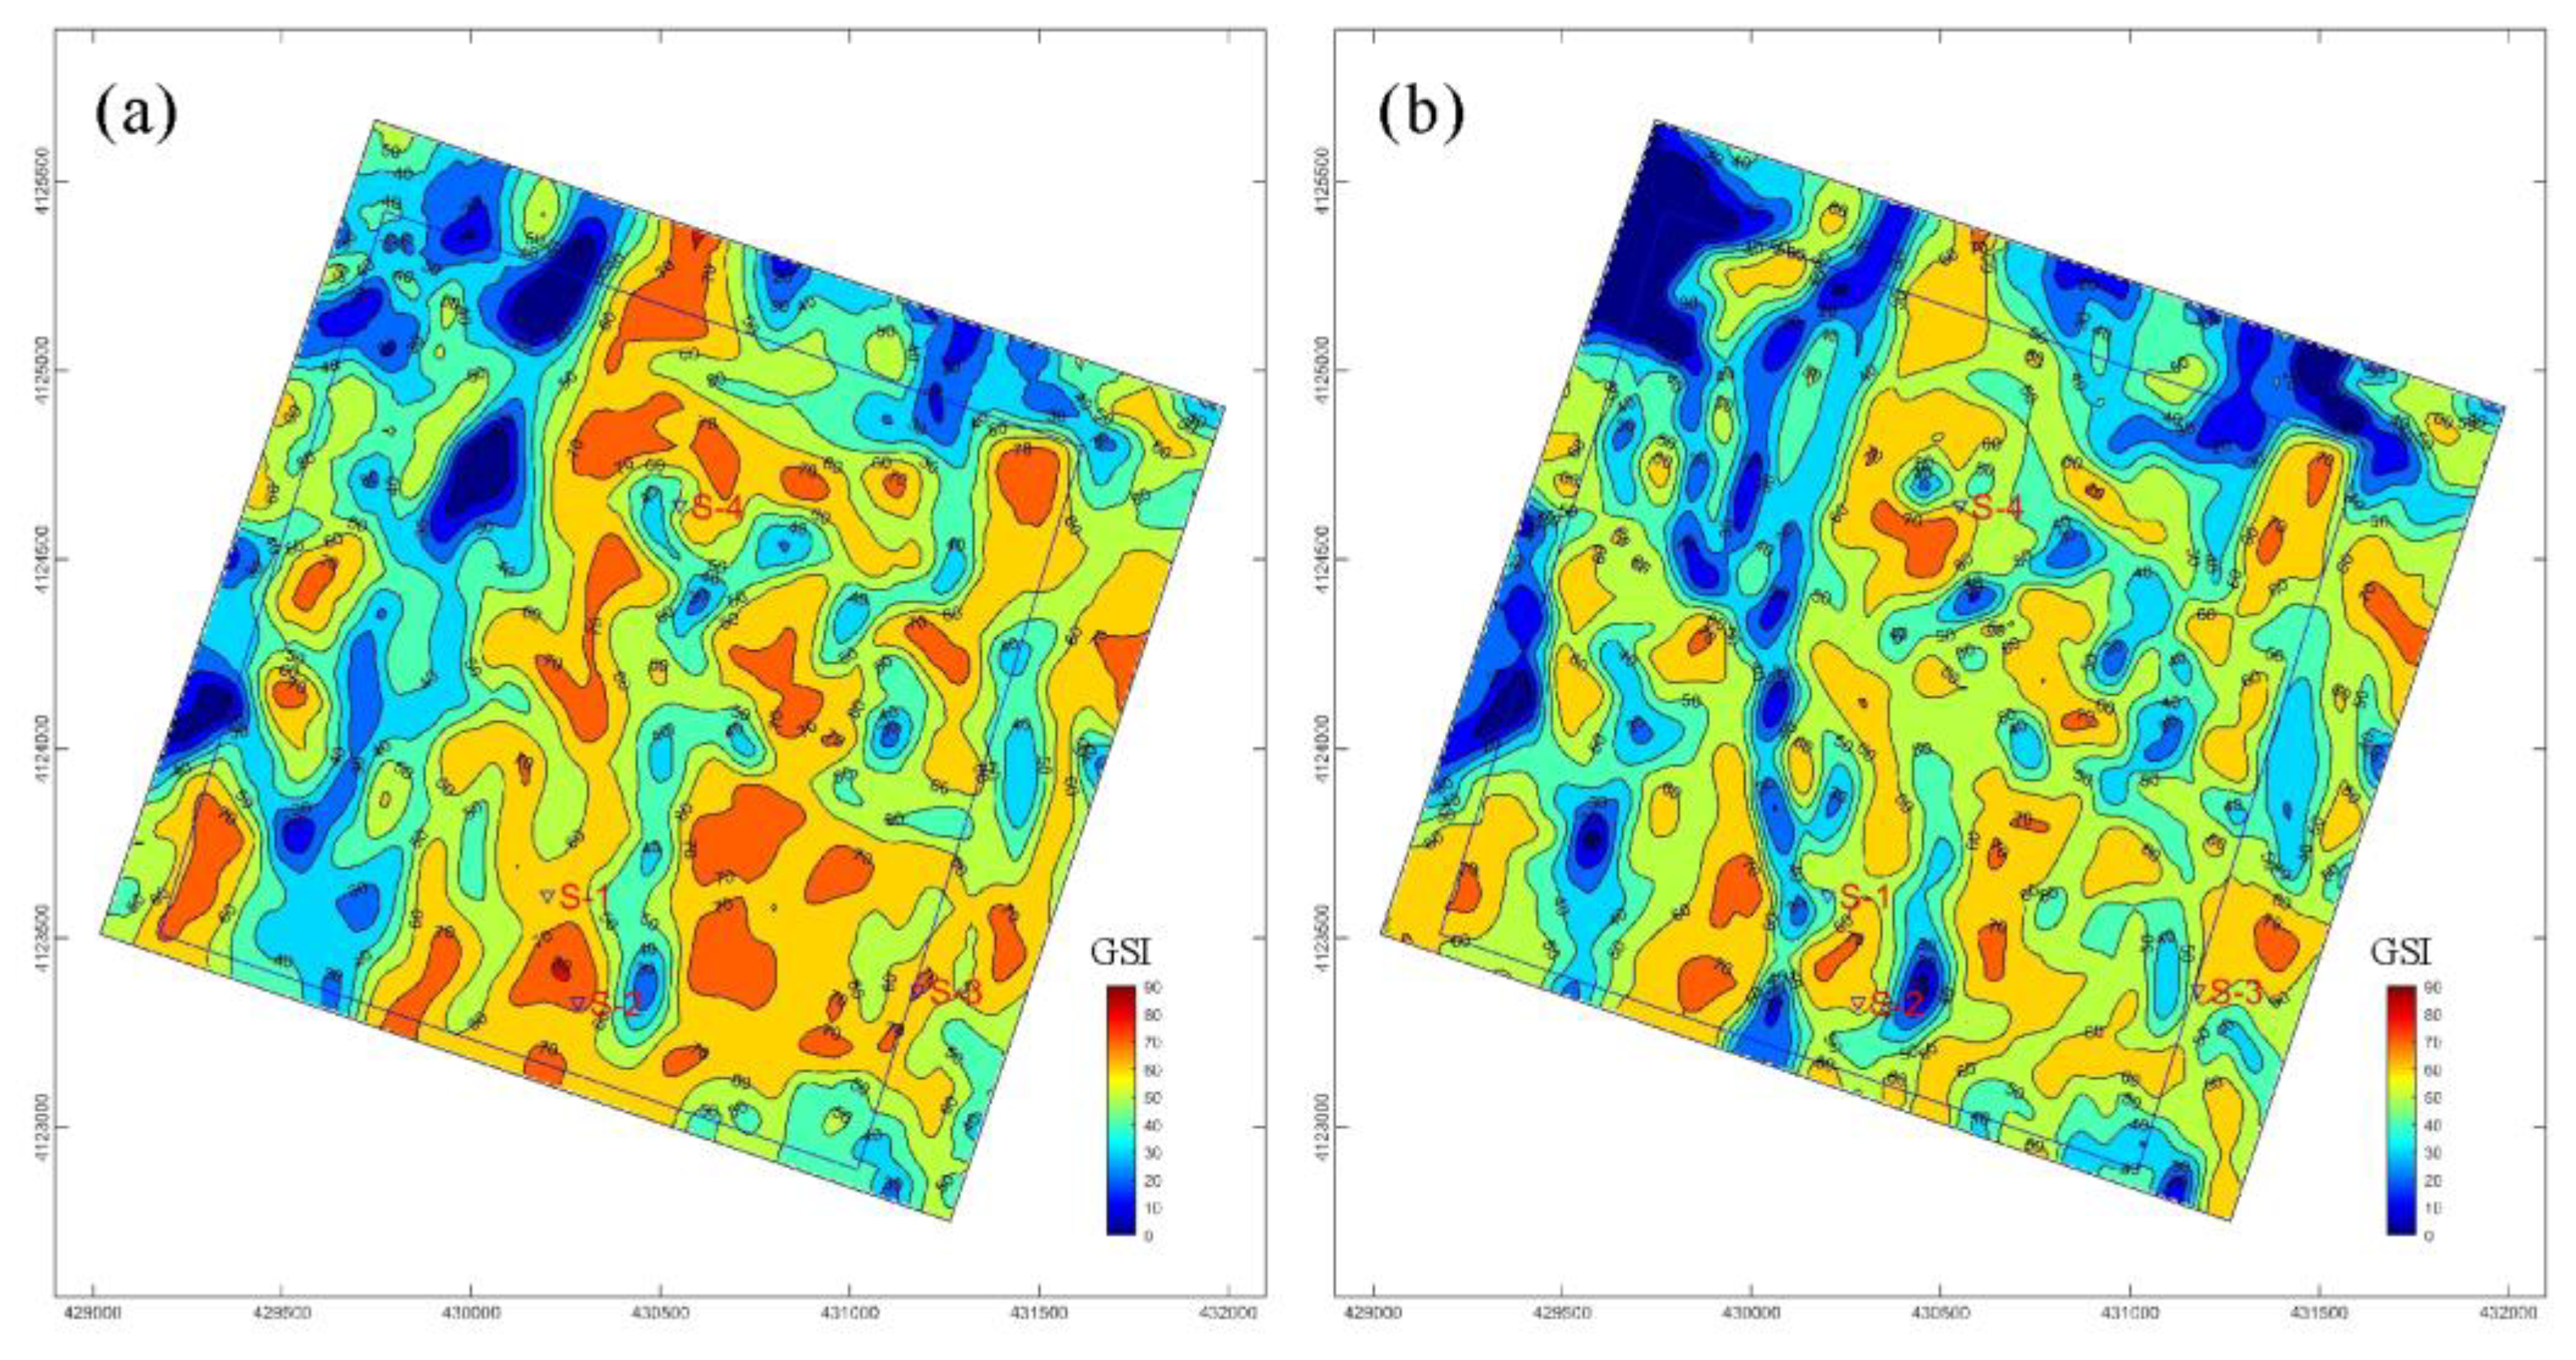
According to the IT2-FLS-GSI chart, we covered five fuzzy sets () in each inverse body attribute and four fuzzy sets () in the crack detection attribute, and used the collected data corresponding to the training set () to obtain the complete fuzzy rule base. The fuzzy sets () only need to be selected from the centers of the predefined fuzzy sets (). The defuzzified GSI prediction model () was obtained (Figure 14), which can be quantified to represent the GSI values of the input data pairs (). As seen in Figure 14a, the multi-attribute fuzzy fusion GSI model and the logging multi-parameter GSI model both have the same prediction trend and smoother output, whereas the error size of both is maintained between . Adding or subtracting rules or changing the MFs will have some effect on the error, and achieving accurate results requires constant fine-tuning and pruning of the model. Based on the rule base, we plotted the visual appearance of the fuzzy prediction model. Both are generally consistent in appearance, but the results from the secondary tests show that the continuous fuzzy prediction model (Figure 14b) is more accurate than the piecewise fuzzy prediction model (Figure 14c). After applying to the whole working area, Figure 15a shows the predicted structure of coal mass No.3, with a higher content of primary coal in the southeast and west. Figure 15b shows the predicted structural section of coal mass No.15. It can be seen that the central and northwestern parts of the study area have a lower GSI, more tectonic coal content and softer coal quality.

Figure 14.
(a) GSI and error analysis of fuzzy system prediction, where the pink area represents the confidence interval, the black line is the GSI calculated by the logging multi-parameter regression equation, the black dashed line is the T1-FS prediction result and the green and red dashed lines are the results of two trials of piecewise and continuous types of IT2-FS, respectively; (b) continuous fuzzy prediction model; and (c) piecewise fuzzy prediction model.

Figure 15.
Predicted section of coal structure from coal seam No. 3 (a) and coal seam No. 15 (b).
5. Discussion
In this paper, a type-two fuzzy logic prediction model was proposed to compare with the coal structure interpreted using logging data. The overall coal structure prediction results of the study area were basically consistent with the core-taking description, with a matching degree of more than 75%. According to the description of the coal structure of the actual coal core, it was found that the northwestern part of coal seam No.15 in the study area had a lower GSI, which indicates more tectonic coal content and softer coal quality, whereas the eastern part had a higher GSI value, indicating more primary structural coal content and harder coal quality. Coal seam No. 3 was mainly dominated by crushed grain coal, followed by fractured coal, in which the GSI values were higher in the southeast and west, and the content of primary coal was higher. The predicted results of this study can be used as the basis for further exploratory work in this area.
From the predicted results in Figure 15, in connection with the geological structure of the work area in Figure 1b, it can be seen that there was a certain correspondence between the location of large faults in the geological structure and the high value of GSI. Generally speaking, the activity of the fault will lead to fragmentation and deformation of the surrounding rocks, and a certain stress field will also be formed. All of these factors will have an impact on the mechanical properties of the surrounding rocks. Therefore, when the area with high GSI values happens to be located near a large fault, this may indicate that there is a high concentration of stress in the area, which leads to an increase in the mechanical strength index of the rock. Therefore, the influence of geological formations on high GSI values should be fully considered when planning and designing projects in order to reduce the risk of possible geological hazards.
Different types of coal structures affect the development of CBM through pore structure differences. Xu et al. (2019) [38] concluded that fractured-fragmented and primary-fragmented coals are favorable for gas adsorption percolation, but the former has more developed adsorption pores, whereas fractured-fragmented coals are subjected to strong tectonic stress, which leads to the destruction of pore structure and are thus unfavorable for CBM storage and transportation. The results of the analysis of the coal structure of coal seam No. 3 and coal seam No. 15 in this area show that fractured coal and fractured grain coal are mainly developed in this area, which is presumed to be favorable for the production of coalbed methane.
However, this study is based on limited sample data and does not take into account possible spatial heterogeneity. Therefore, future research should use more data and more samples in order to verify these predicted results, and should consider the impact of spatial heterogeneity.
6. Conclusions
This paper introduces a multi-attribute fusion coal structure prediction method based on a type-two fuzzy logic inference system, and combines the quantification capability of GSI, which can be useful for predicting semantic uncertainty. The multi-attribute data source in the fuzzy logic system inherits the content of the previous related results, which improves the accuracy of the data source and the convenience of the data mining process. We also make full use of the multi-directional nature of the seismic data in the OVT domain in order to achieve the fine portrayal of fracture detection, and these datasets provide strong support for fuzzy logic-based multi-attribute fusion. Through practical applications in the study area, we focused on the effective use of data, such as 3D inversion data volumes and seismic attribute volumes, thus solving the problem that conventional prediction methods cannot be carried out in well-free areas and achieving quantitative discrimination of coal structure. This study is beneficial for further work on the reservoir evaluation of CBM. For example, it is important to further investigate the relationship between coal structure and permeability, gas content and formation pressure.
Author Contributions
Conceptualization, X.C. and Y.T.; methodology, X.C. and Y.T.; software, X.C. and H.H.; validation, X.C., Y.T., H.H. and L.W.; formal analysis, X.C., H.H. and L.W.; investigation, X.C., J.W., Z.G. and C.M.; resources, X.C. and H.H.; data curation, X.C., J.W., Z.G. and C.M.; writing—original draft preparation, X.C.; writing—review and editing, X.C., Y.T., H.H. and L.W.; visualization, X.C.; supervision, M.S.; project administration, Y.T., H.H. and L.W.; funding acquisition, H.H. and M.S. All authors have read and agreed to the published version of the manuscript.
Funding
The authors were grateful to receive support from the National Natural Science Foundation of China (No. 41974124).
Data Availability Statement
The original contributions presented in this study are included in the article. Further inquiries can be directed to the corresponding author.
Acknowledgments
We sincerely thank Ahmet Taskin and Tufan Kumbasar for providing access to the IT2-FLS MATLAB/SIMULINK toolbox.
Conflicts of Interest
The authors declare that the research was conducted in the absence of any commercial or financial relationships that could be construed as a potential conflict of interest.
References
- Li, L.; Liu, D.; Cai, Y.; Wang, Y.; Jia, Q. Coal structure and its implications for coalbed methane exploitation: A review. Energy Fuels 2020, 35, 86–110. [Google Scholar] [CrossRef]
- Huang, B.; Qin, Y.; Zhang, W.; Wang, G. Identification of the coal structure and prediction of the fracturability in the No. 8 coal reservoir, Gujiao block, China. Energy Explor. Exploit. 2018, 36, 204–229. [Google Scholar] [CrossRef]
- Lv, F.; Gao, W. A prediction model of coal structure based on logging parameters in Liupanshui Coalfield, Guizhou, China. Arab. J. Geosci. 2021, 14, 1–18. [Google Scholar] [CrossRef]
- Wang, Y.Z.; Mao, C.; Liu, J.L. Pore Characteristics of Coal Reservoir in Jixi Basin. In Proceedings of the International Field Exploration and Development Conference, Chengdu, China,, 16–18 October 2019; Springer: Singapore, 2020; pp. 842–851. [Google Scholar] [CrossRef]
- Shi, J.; Zeng, L.; Dong, S.; Wang, J.; Zhang, Y. Identification of coal structures using geophysical logging data in Qinshui Basin, China: Investigation by kernel Fisher discriminant analysis. Int. J. Coal Geol. 2020, 217, 103314. [Google Scholar] [CrossRef]
- Mou, J.; Liu, H.; Zou, Y.; Li, Q. A new method to determine the sensitivity of coal and gas outburst prediction index. Arab. J. Geosci. 2020, 13, 465. [Google Scholar] [CrossRef]
- Zhang, J.; Zhang, Y.; Wang, J.; Wen, X. Prediction of gas pressure in thin coal seams in the Qinglong Coal Mine in Guizhou Province, China. J. Pet. Explor. Prod. Technol. 2021, 11, 4075–4086. [Google Scholar] [CrossRef]
- Qiao, W.; Li, W.; Zhang, X.; Niu, Y.; Chen, Y.; Wang, Y.; Xing, T. Prediction of floor water disasters based on fractal analysis of geologic structure and vulnerability index method for deep coal mining in the Yanzhou mining area. Geomat. Nat. Hazards Risk 2019, 10, 1306–1326. [Google Scholar] [CrossRef]
- Zhang, S.; Huang, H.; Dong, Y.; Yang, X.; Wang, C.; Luo, Y. Direct estimation of the fluid properties and brittleness via elastic impedance inversion for predicting sweet spots and the fracturing area in the unconventional reservoir. J. Nat. Gas Sci. Eng. 2017, 45, 415–427. [Google Scholar] [CrossRef]
- Huang, H.; Yuan, S.; Zhang, Y.; Zeng, J.; Mu, W. Use of nonlinear chaos inversion in predicting deep thin lithologic hydrocarbon reservoirs: A case study from the Tazhong oil field of the Tarim Basin, China. Geophysics 2016, 81, B221–B234. [Google Scholar] [CrossRef]
- Yang, Z.; Li, Z.; Zhu, J.; Yi, H.; Hu, J.; Feng, G. Deriving dynamic subsidence of coal mining areas using InSAR and logistic model. Remote Sens. 2017, 9, 125. [Google Scholar] [CrossRef]
- Ma, J.; Yang, J.; Zhu, Z.; Cao, H.; Li, S.; Du, X. Decision-making fusion of InSAR technology and offset tracking to study the deformation of large gradients in mining areas-Xuemiaotan mine as an example. Front. Earth Sci. 2022, 10, 962362. [Google Scholar] [CrossRef]
- Hoek, E.; Brown, E.T. Practical estimates of rock mass strength. Int. J. Rock Mech. Min. Sci. 1997, 34, 1165–1186. [Google Scholar] [CrossRef]
- Marinos, P.; Hoek, E. GSI: A geologically friendly tool for rock mass strength estimation. In Proceedings of the ISRM International Symposium, Melbourne, VIC, Australia, 19–24 November 2000; OnePetro, 2000. [Google Scholar]
- Zhang, Y.J.; Cao, W.G.; Zhao, M.H. Application of fuzzy sets to geological strength index (GSI) system used in rock slope. Soils and Rock Instrumentation, Behavior, and Modeling, GeoHunan International Conference, Changsha, China, 3–6 August 2009; American Society of Civil Engineers: Reston, VA, USA, 3–6 August; pp. 30–35. [Google Scholar] [CrossRef]
- Bashari, A.; Beiki, M.; Talebinejad, A. Estimation of deformation modulus of rock masses by using fuzzy clustering-based modeling. Int. J. Rock Mech. Min. Sci. 2011, 48, 1224–1234. [Google Scholar] [CrossRef]
- Sonmez, H.; Gokceoglu, C.; Ulusay, R. An application of fuzzy sets to the geological strength index (GSI) system used in rock engineering. Eng. Appl. Artif. Intell. 2003, 16, 251–269. [Google Scholar] [CrossRef]
- Liu, H.; Sang, S.; Wang, G.G.; Li, Y.; Li, M.; Liu, S. Evaluation of the synergetic gas-enrichment and higher-permeability regions for coalbed methane recovery with a fuzzy model. Energy 2012, 39, 426–439. [Google Scholar] [CrossRef]
- Lei, Z.; Jienan, P.; Xiaomin, Z. Fuzzy comprehensive evaluation of mining geological condition in the No. 9 coal seam, Linhuan coal mine, Huaibei Coalfield, China. Procedia Environ. Sci. 2012, 12, 9–16. [Google Scholar] [CrossRef]
- Moosavi, N.; Bagheri, M.; Nabi-Bidhendi, M.; Heidari, R. Porosity prediction using Fuzzy SVR and FCM SVR from well logs of an oil field in south of Iran. Acta Geophys. 2022, 71, 769–782. [Google Scholar] [CrossRef]
- Woo, J.; Rhee, C.W.; Jeoung, T.J.; Jang, S. Application of Multi-Resolution Graph-based Clustering for electrofacies prediction: A case study from the Horn River Shale, British Columbia, Canada. Geosci. J. 2020, 24, 507–518. [Google Scholar] [CrossRef]
- Fuchs, C.; Spolaor, S.; Nobile, M.S.; Kaymak, U. pyFUME: A Python package for fuzzy model estimation. In Proceedings of the IEEE International Conference on Fuzzy Systems (FUZZ-IEEE), Glasgow, UK, 19–24 July 2020; IEEE: New York, NY, USA; pp. 1–8. [Google Scholar] [CrossRef]
- Jiang, W.; Zhang, P.; Li, D.; Li, Z.; Wang, J.; Duan, Y.; Wu, J.; Liu, N. Reservoir characteristics and gas production potential of deep coalbed methane: Insights from the no. 15 coal seam in Shouyang block, Qinshui Basin, China. Unconv. Resour. 2022, 2, 12–20. [Google Scholar] [CrossRef]
- GB/T 30050-2013; Classification of Coal-Body Structure. China National Coal Association: Beijing, China, 2013.
- Dong, Z.; Zhang, X.; Yang, W.; Lei, M.; Zhang, C.; Wan, J.; Han, L. Automatic Cutting Speed Control System of Boom-Type Roadheader Based on Geological Strength Index. Minerals 2022, 12, 1582. [Google Scholar] [CrossRef]
- Hampson, D.P.; Schuelke, J.S.; Quirein, J.A. Use of multiattribute transforms to predict log properties from seismic data. Geophysics 2001, 66, 220–236. [Google Scholar] [CrossRef]
- Zhang, Z.; Qin, Y.; Wang, G.; Sun, H.; You, Z.; Jin, J.; Yang, Z. Evaluation of coal body structures and their distributions by geophysical logging methods: Case study in the Laochang block, eastern Yunnan, China. Nat. Resour. Res. 2021, 30, 2225–2239. [Google Scholar] [CrossRef]
- Wang, L.; Zhou, H.; Dai, H.; Yu, B.; Liu, W.; Wang, N. Poststack seismic inversion using a patch-based Gaussian mixture modelPatch-based GMM for poststack inversion. Geophysics 2021, 86, R685–R699. [Google Scholar] [CrossRef]
- Liu, D.; Wang, Y.; Ni, X.; Tao, C.; Fan, J.; Wu, X.; Zhao, S. Classification of coal structure combinations and their influence on hydraulic fracturing: A case study from the Qinshui Basin, China. Energies 2020, 13, 4559. [Google Scholar] [CrossRef]
- Hussian, S.; Mohammad, N.; Ur Rehman, Z.; Khan, N.M.; Shahzada, K.; Ali, S.; Tahir, M.; Raza, S.; Sherin, S. Review of the geological strength index (GSI) as an empirical classification and rock mass property estimation tool: Origination, modifications, applications, and limitations. Adv. Civ. Eng. 2020, 2020, 6471837. [Google Scholar] [CrossRef]
- Zadeh, L.A. Fuzzy sets. Inf. Control. 1965, 8, 338–353. [Google Scholar] [CrossRef]
- Mendel, J.M.; John, R.B. Type-2 fuzzy sets made simple. IEEE Trans. Fuzzy Syst. 2002, 10, 117–127. [Google Scholar] [CrossRef]
- Coupland, S.; John, R. Geometric type-1 and type-2 fuzzy logic systems. IEEE Trans. Fuzzy Syst. 2007, 15, 3–15. [Google Scholar] [CrossRef]
- Takagi, T.; Sugeno, M. Fuzzy identification of systems and its applications to modeling and control. IEEE Trans. Syst. Man Cybern. 1985, SMC-15, 116–132. [Google Scholar] [CrossRef]
- Taskin, A.; Kumbasar, T. An open source Matlab/Simulink toolbox for interval type-2 fuzzy logic systems. In Proceedings of the IEEE Symposium Series on Computational Intelligence, Cape Town, South Africa, 7–10 December 2015; IEEE: New York, NY, USA; pp. 1561–1568. [Google Scholar] [CrossRef]
- Wu, X.; Fomel, S. Automatic fault interpretation with optimal surface voting. Geophysics 2018, 83, O67–O82. [Google Scholar] [CrossRef]
- Cui, X.; Huang, H.; Hao, Y.; Li, L.; Luo, Y.; Zeng, J.; Tian, Z.; Shen, Y.; Hu, Y. Supervised post-stack 3D seismic data classification via multi-scale and multi-label consistent PCA-LDA. Geophysics 2022, 88, 1–98. [Google Scholar] [CrossRef]
- Xu, X.; Meng, Z.; Wang, Y. Experimental comparisons of multiscale pore structures between primary and disturbed coals and their effects on adsorption and seepage of coalbed methane. J. Pet. Sci. Eng. 2019, 174, 704–715. [Google Scholar] [CrossRef]
Disclaimer/Publisher’s Note: The statements, opinions and data contained in all publications are solely those of the individual author(s) and contributor(s) and not of MDPI and/or the editor(s). MDPI and/or the editor(s) disclaim responsibility for any injury to people or property resulting from any ideas, methods, instructions or products referred to in the content. |
© 2023 by the authors. Licensee MDPI, Basel, Switzerland. This article is an open access article distributed under the terms and conditions of the Creative Commons Attribution (CC BY) license (https://creativecommons.org/licenses/by/4.0/).

