
Facies and Carbon Isotope Variations during the Kungurian (Early Permian) in the Chihsia Formation in the Lower Yangtze Region of South China

Abstract
1. Introduction
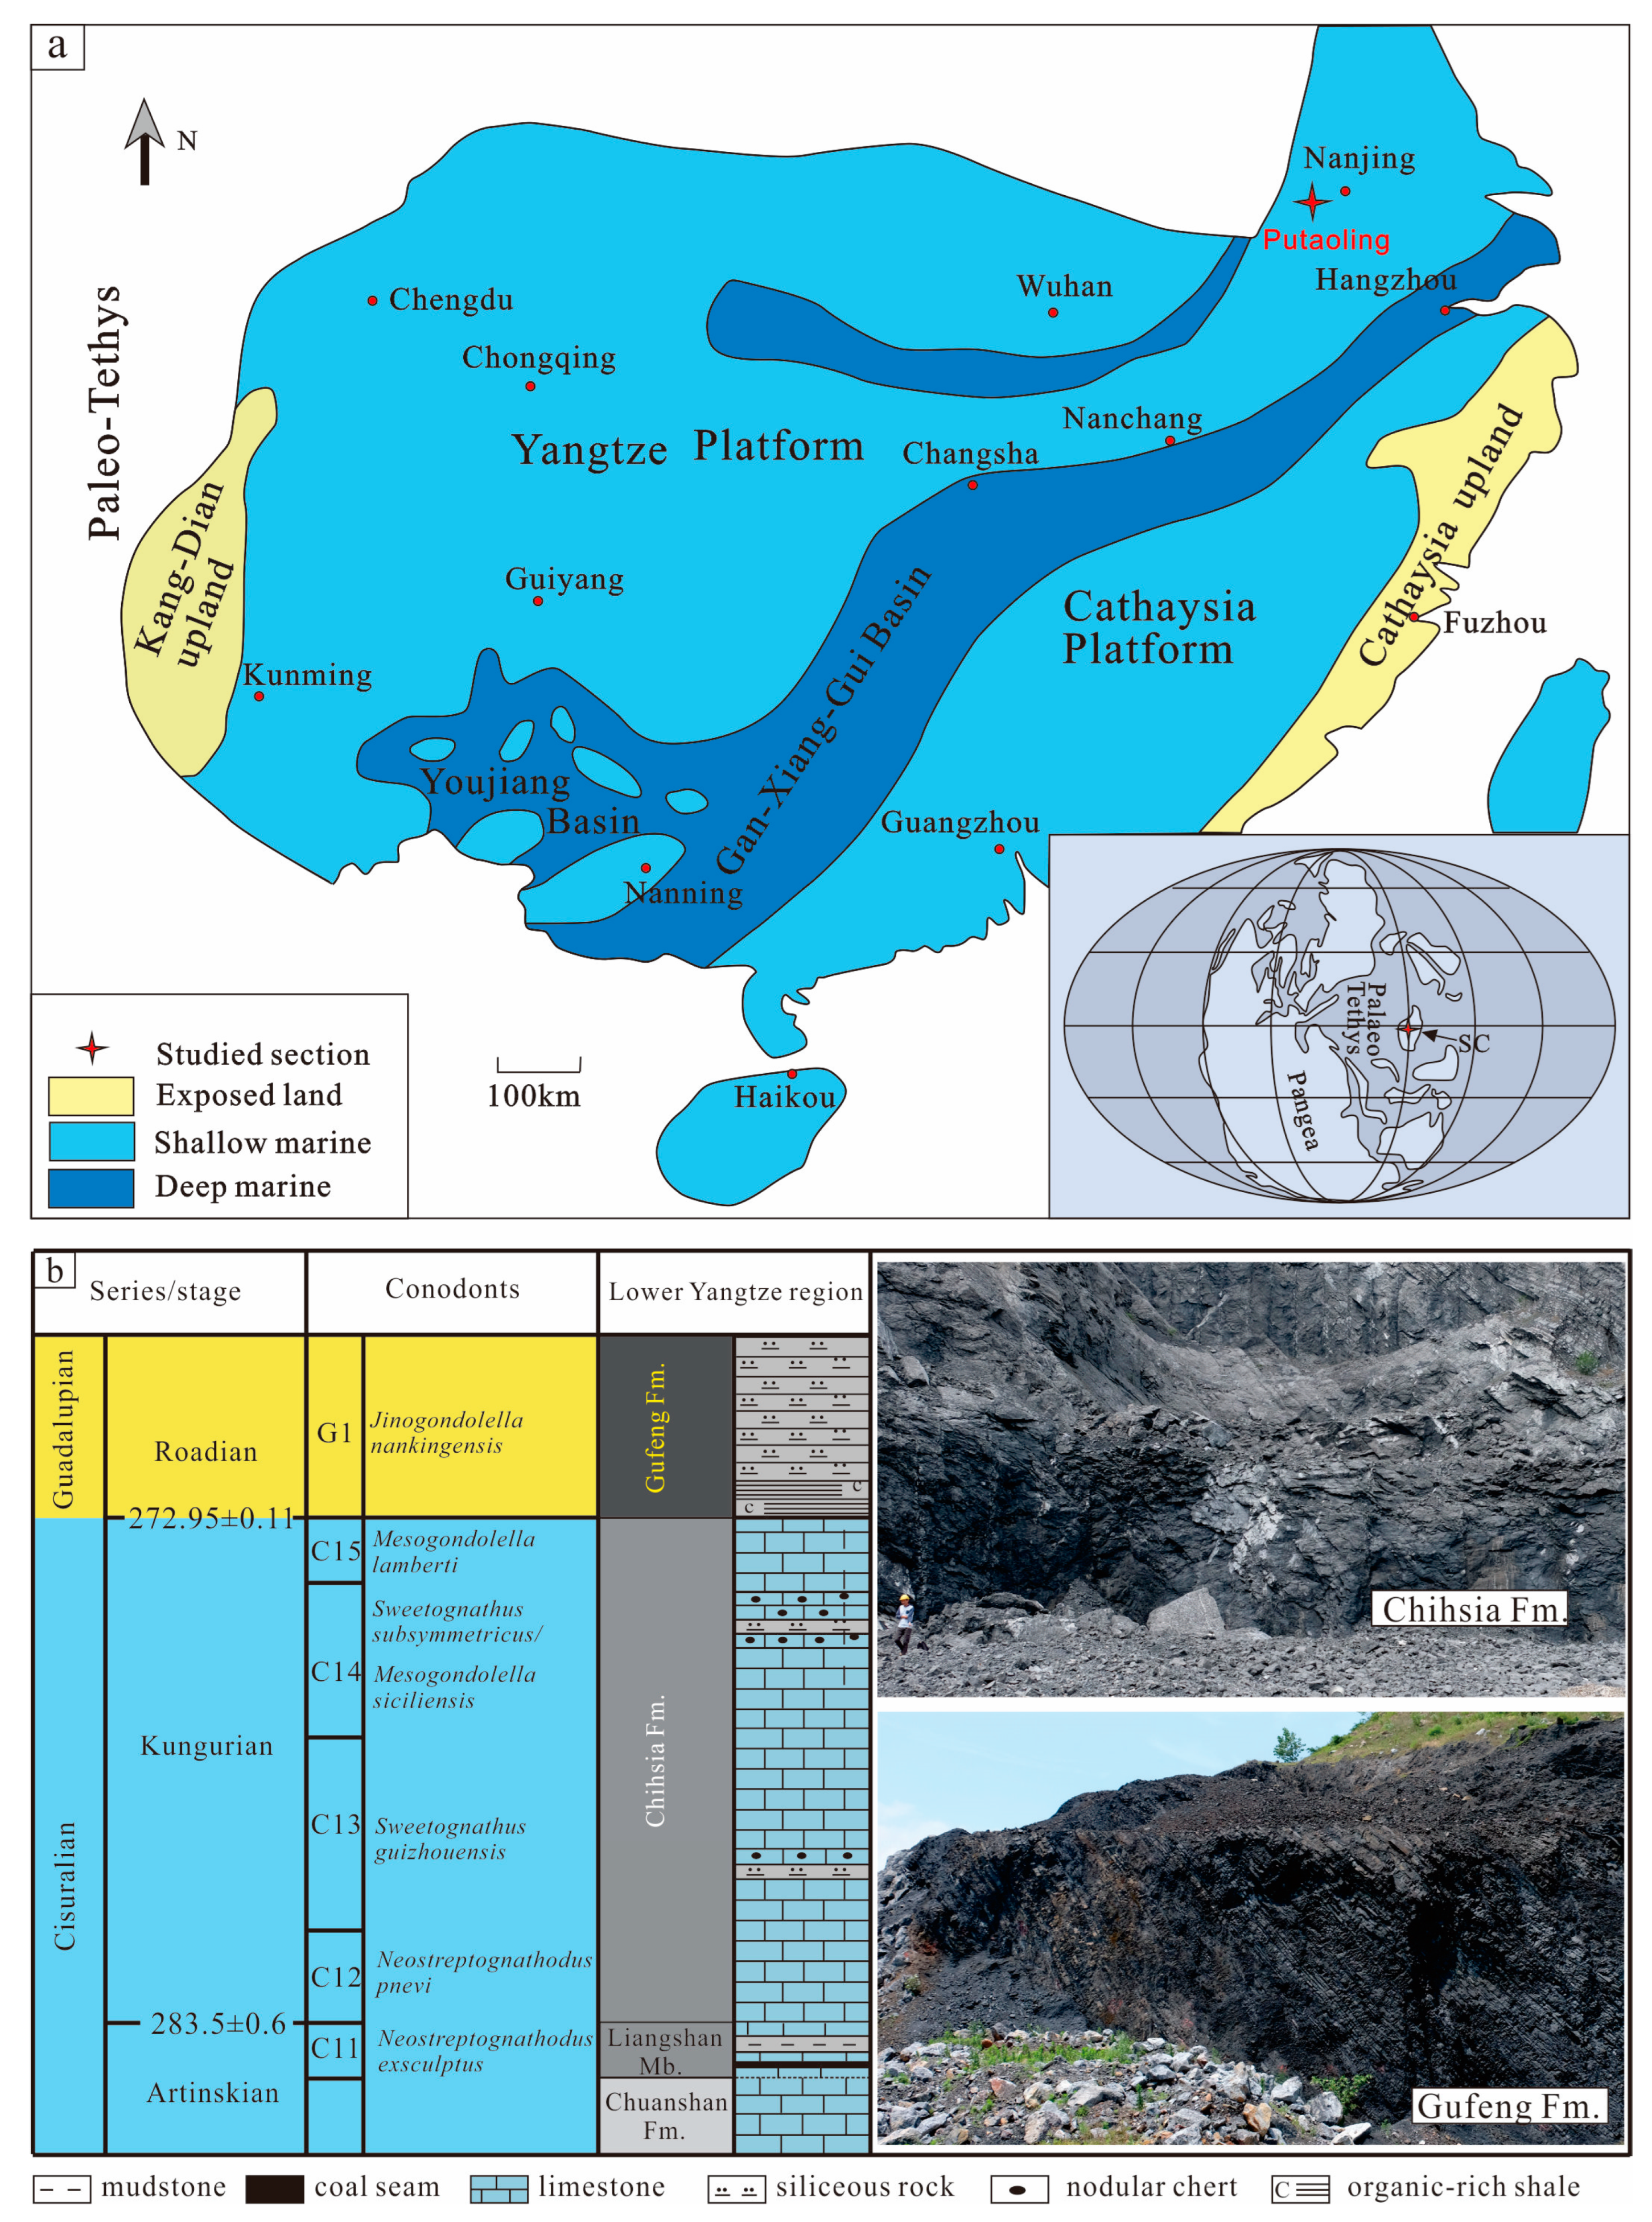
2. Geological Setting

3. Methods
4. Results
4.1. Analyses of Facies
4.1.1. Facies and Facies Associations
4.1.2. Transgressive-Regressive (TR) Sequence
4.2. Geochemistry
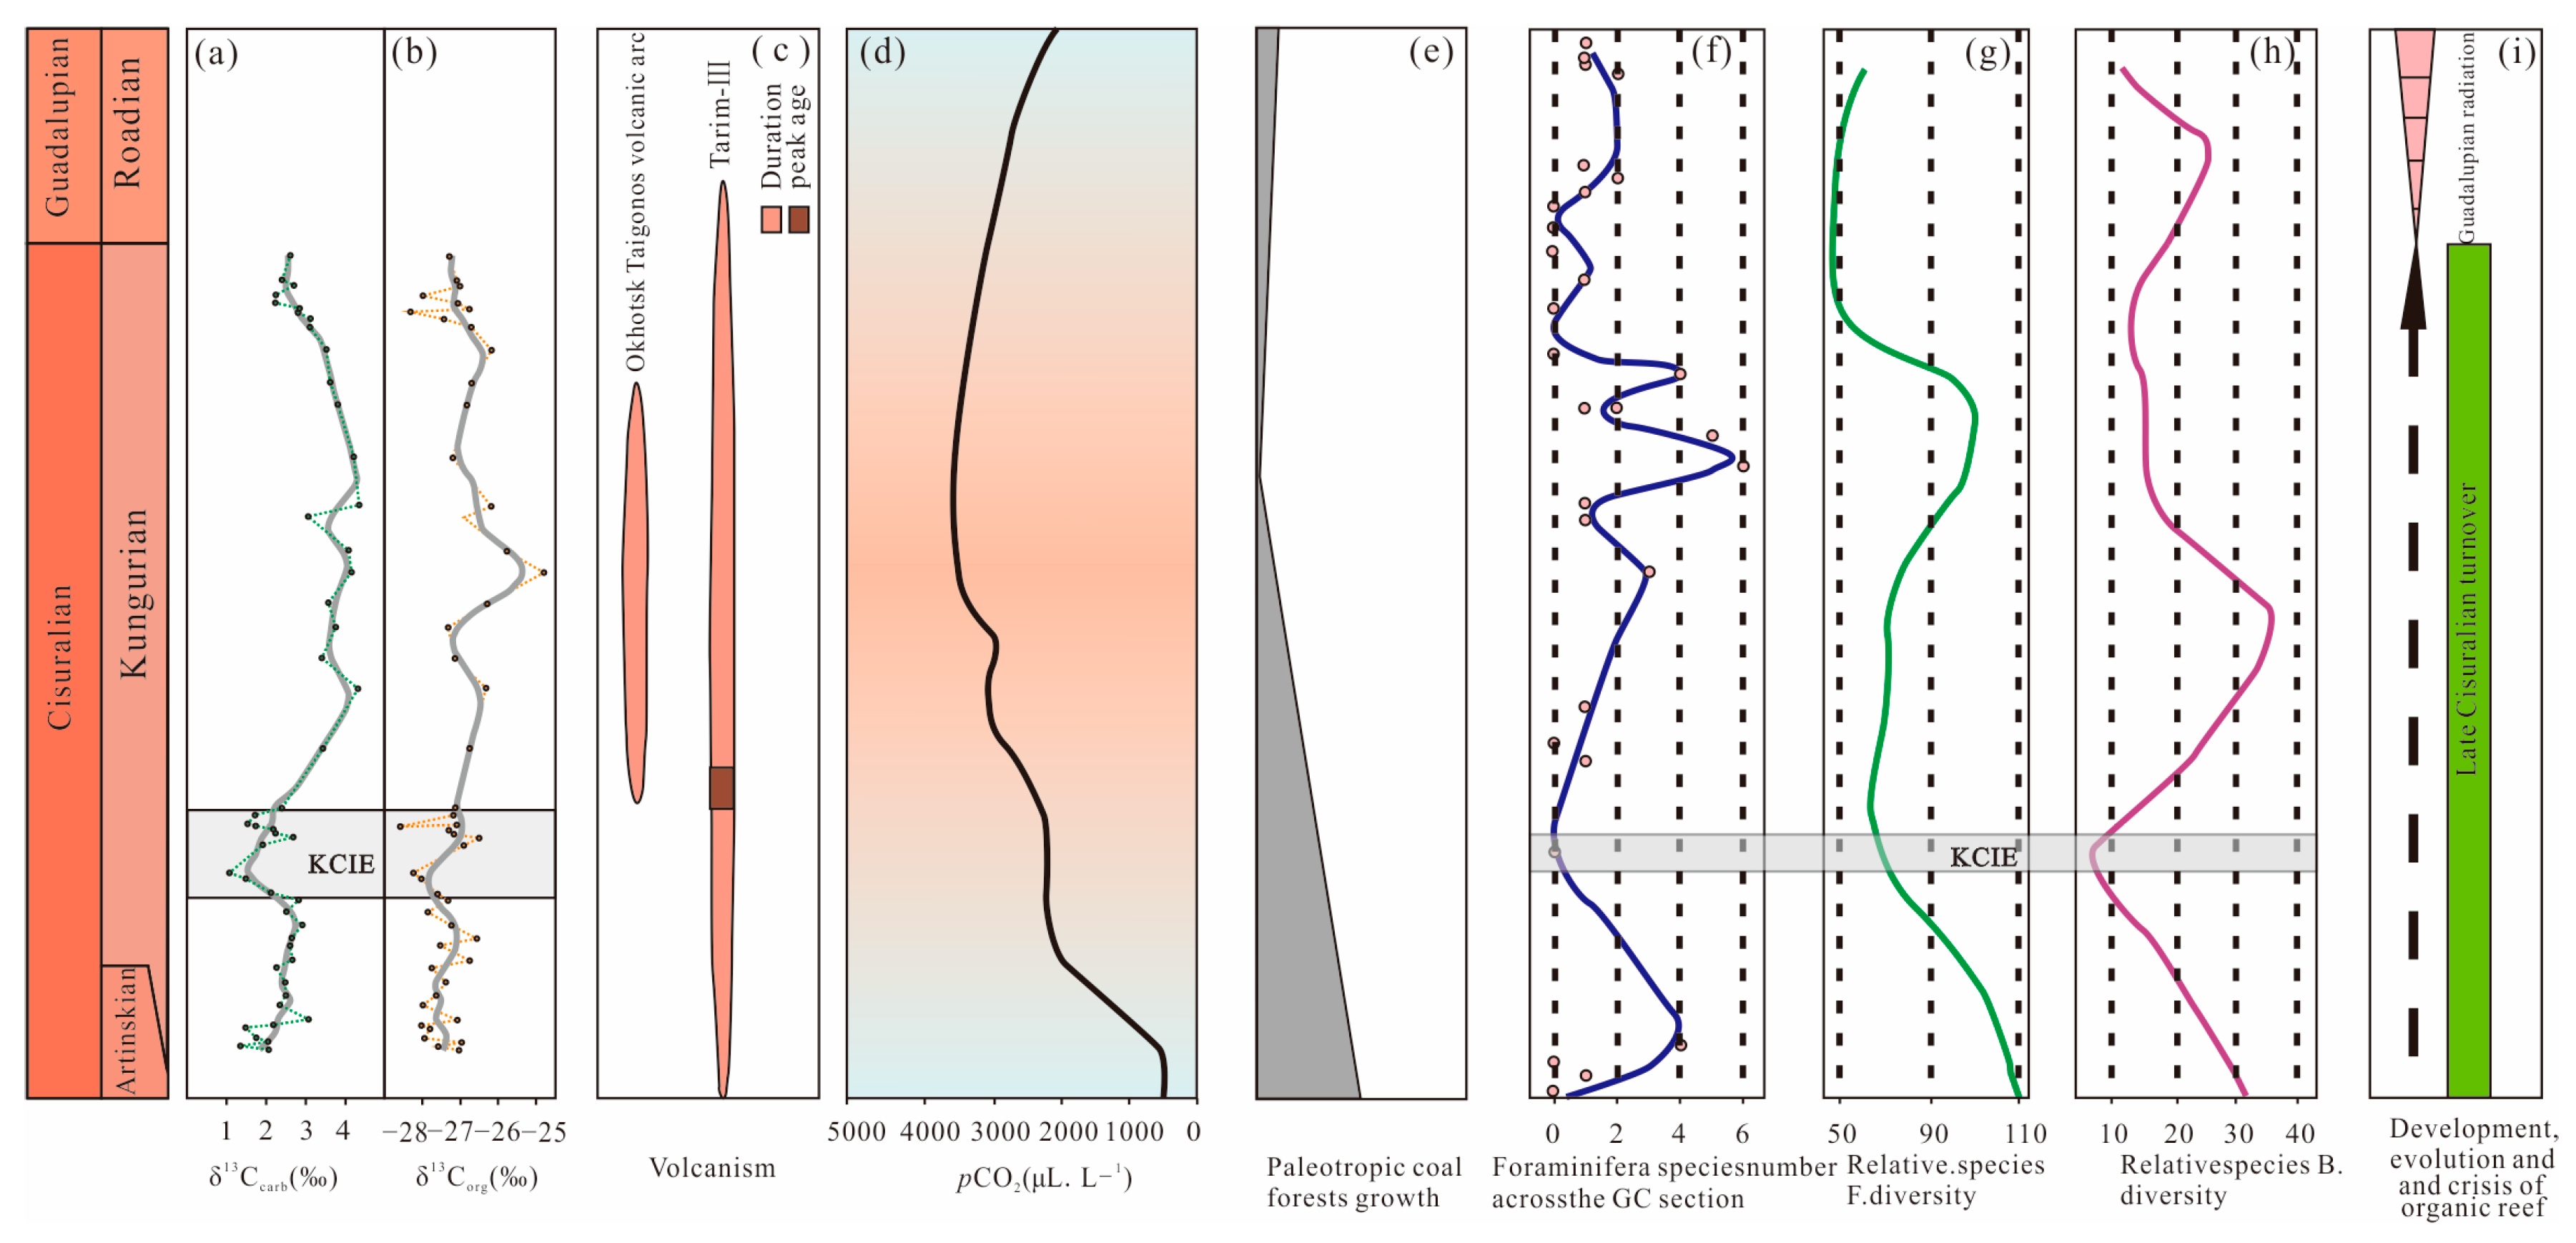
5. Discussion
5.1. Diagenesis Effects on the Carbon Isotopic Compositions
5.2. Global Correlation of Kungurian Carbon-Isotope Excursions
5.3. Causes of the KICE during the Early Kungurian

6. Conclusions
Author Contributions
Funding
Data Availability Statement
Conflicts of Interest
References
- Smith, L.B., Jr.; Read, J.F. Rapid onset of late Paleozoic glaciation on Gondwana: Evidence from Upper Mississippian strata of the Midcontinent, United States. Geology 2000, 28, 279–282. [Google Scholar] [CrossRef]
- Fielding, C.R.; Frank, T.D. Onset of the glacioeustatic signal recording late Palaeozoic Gondwanan ice growth: New data from palaeotropical East Fife, Scotland. Palaeogeogr. Palaeoclimatol. Palaeoecol. 2015, 426, 121–138. [Google Scholar] [CrossRef]
- Tian, X.; Chen, J.; Yao, L.; Hu, K.; Qi, Y.; Wang, X. Glacio-eustasy and δ13C across the Mississippian–Pennsylvanian boundary in the eastern Paleo-Tethys Ocean (South China): Implications for mid-Carboniferous major glaciation. Geol. J. 2020, 55, 2704–2716. [Google Scholar] [CrossRef]
- Huang, S.; Shi, H.; Zhang, M.; Shen, L.; Liu, J.; Wu, W. Strontium Isotope Evolution and Global Sea-Level Changes of Carboniferous and Permian Marine Carbonate, Upper Yangtze Platform. Acta Sedimentol. Sin. 2013, 19, 481–487, (In Chinese with English abstract). [Google Scholar]
- Laya, J.C.; Tucker, M.E.; Gröcke, D.R.; Perez-Huerta, A. Carbon, oxygen and strontium isotopic composition of low-latitude Permian carbonates (Venezuelan Andes): Climate proxies of tropical Pangea. Geol. Soc. Lond. Spec. Publ. 2013, 376, 367–385. [Google Scholar] [CrossRef]
- Isbell, J.L.; Henry, L.C.; Gulbranson, E.L.; Limarino, C.O.; Fraiser, M.L.; Koch, Z.J.; Ciccioli, P.L.; Dineen, A.A. Glacial paradoxes during the late Paleozoic ice age: Evaluating the equilibrium line altitude as a control on glaciation. Gondwana Res. 2012, 22, 1–19. [Google Scholar] [CrossRef]
- Montañez, I.P.; Poulsen, C.J. The Late Paleozoic Ice Age: An Evolving Paradigm. Annu. Rev. Earth Planet. Sci. 2013, 41, 629–656. [Google Scholar] [CrossRef]
- Mii, H.; Grossman, E.L.; Yancey, T.E. Carboniferous isotope stratigraphies of North America: Implications for Carboniferous paleoceanography and Mississippian glaciation. Geol. Soc. Am. Bull. 1999, 111, 960–973. [Google Scholar] [CrossRef]
- Bruckschen, P.; Oesmann, S.; Veizer, J. Isotope stratigraphy of the European Carboniferous: Proxy signals for ocean chemistry, climate and tectonics. Chem. Geol. 1999, 161, 127–163. [Google Scholar] [CrossRef]
- Saltzman, M.R.; González, L.A.; Lohmann, K.C. Earliest Carboniferous cooling step triggered by the Antler orogeny? Geology 2000, 28, 347–350. [Google Scholar] [CrossRef]
- Kametaka, M.; Nagai, H.; Zhu, S.; Takebe, M. Middle Permian Radiolarians from Anmenkou, Chaohu, Northeastern Yangtze platform, China. Isl. Arc 2009, 18, 108–125. [Google Scholar] [CrossRef]
- Chen, J.; Montañez, I.P.; Qi, Y.; Shen, S.; Wang, X. Strontium and carbon isotopic evidence for decoupling of pCO2 from continental weathering at the apex of the late Paleozoic glaciation. Geology 2018, 46, 395–398. [Google Scholar] [CrossRef]
- Yao, L.; Aretz, M.; Chen, J.; Qi, Y. Earliest Carboniferous stromatolites from the Qianheishan Formation, Dashuigou section, northwestern China: Implications for microbial proliferation after the end-Devonian mass extinction. Geol. J. 2020, 55, 3361–3376. [Google Scholar] [CrossRef]
- Yao, L.; Aretz, M.; Wignall, P.B.; Chen, J.; Vachard, D.; Qi, Y.; Shen, S.; Wang, X. The longest delay: Re-emergence of coral reef ecosystems after the Late Devonian extinctions. Earth-Sci. Rev. 2020, 203, 103060. [Google Scholar] [CrossRef]
- Eyles, N. Earth’s glacial record and its tectonic setting. Earth-Sci. Rev. 1993, 35, 1–248. [Google Scholar] [CrossRef]
- Jones, A.T.; Fielding, C.R. Sedimentological record of the late Paleozoic glaciation in Queensland, Australia. Geology 2004, 32, 153–156. [Google Scholar] [CrossRef]
- Isbell, J.L.; Miller, M.F.; Wolfe, K.L.; Lenaker, P.A. Timing of late Paleozoic glaciation in Gondwana: Was glaciation responsible for the development of Northern Hemisphere cyclothems? Spec. Pap. Geol. Soc. Am. 2003, 370, 5–24. [Google Scholar]
- Liu, C.; Jarochowska, E.; Du, Y.; Vachard, D.; Munnecke, A. Microfacies and carbon isotope records of Mississippian carbonates from the isolated Bama Platform of Youjiang Basin, South China: Possible responses to climate-driven upwelling. Palaeogeogr. Palaeoclimatol. Palaeoecol. 2015, 438, 96–112. [Google Scholar] [CrossRef]
- Liu, C.; Jarochowska, E.; Du, Y.; Munnecke, A.; Dai, X. Prevailing anoxia in the Kungurian (Permian) of South China: Possible response to divergent climate trends between the tropics and Gondwana. Gondwana Res. 2017, 49, 81–93. [Google Scholar] [CrossRef]
- Liu, C.; Du, Y.; Jarochowska, E.; Yan, J.; Munnecke, A.; Lu, G. A major anomaly in the carbon cycle during the late Cisuralian (Permian): Timing, underlying triggers and implications. Palaeogeogr. Palaeoclimatol. Palaeoecol. 2018, 491, 112–122. [Google Scholar] [CrossRef]
- Lu, J.; Zhou, K.; Yang, M.; Zhang, P.; Shao, L.; Hilton, J. Records of organic carbon isotopic composition (δ13Corg) and volcanism linked to changes in atmospheric pCO2 and climate during the Late Paleozoic Icehouse. Glob. Planet. Chang. 2021, 207, 103654. [Google Scholar] [CrossRef]
- Cheng, C.; Li, S.; Zhao, W.; Peng, L. The characteristics of microfacies and clay minerals of the Chihsia Formation carbonate rocks of Middle Permian in Susong, Anhui and its implication for sedimentary facies and paleoclimate. Acta Geol. Sin. 2016, 90, 1208–1219, (In Chinese with English abstract). [Google Scholar]
- Chang, Y.; Dong, S.; Huang, D. On tectonics of “Poly-basement with one cover” in middle-lower Yangtze craton China. Volcanol. Miner. Resour. 1996, 17, 1–15, (In Chinese with English abstract). [Google Scholar]
- Yin, H. South China defined as part of Tethyan archipelagic ocean system. Earth Sci.-J. China Univ. Geosci. 1999, 24, 1–12, (In Chinese with English abstract). [Google Scholar]
- Yang, B. Guadalupian Conodont Successions in Xuanhan, Sichuan and Chaohu, Anhui, South China and Their Correlation; The University of Chinese Academy of Sciences: Beijing, China, 2015; (In Chinese with English abstract). [Google Scholar]
- Jin, Y.; Shang, Q.; Wang, X. Permian stratigraphy of China. In Biostratigraphy of China; Zhang, W.T., Chen, P.J., Palmer, A.R., Eds.; Science Press: Beijing, China, 2003; pp. 331–378. [Google Scholar]
- Yao, X.; Zhou, Y.; Hinnov, L.A. Astronomical forcing of a Middle Permian chert sequence in Chaohu, South China. Earth Planet. Sci. Lett. 2015, 422, 206–221. [Google Scholar] [CrossRef]
- Shen, S.; Zhang, H.; Zhang, Y.; Yuan, D.; Chen, B.; He, W.; Mu, L.; Lin, W.; Wang, W.; Chen, J. Permian integrative stratigraphy and timescale of China. Sci. China Earth Sci. 2019, 62, 154–188. [Google Scholar] [CrossRef]
- Wei, H.; Chen, D.; Wang, J.; Yu, H.; Tucker, M.E. Organic accumulation in the lower Chihsia Formation (Middle Permian) of South China: Constraints from pyrite morphology and multiple geochemical proxies. Palaeogeogr. Palaeoclimatol. Palaeoecol. 2012, 353, 73–86. [Google Scholar] [CrossRef]
- Wilson, J.L. The Stratigraphy of Carbonate Deposits. In Carbonate Facies in Geologic History; Springer Study Edition; Springer: New York, NY, USA, 1975. [Google Scholar]
- Randazzo, V.; Le Goff, J.; Di Stefano, P.; Reijmer, J.; Todaro, S.; Cacciatore, M.S. Carbonate slope re-sedimentation in a tectonically-active setting (Western Sicily Cretaceous Escarpment, Italy). Sedimentology 2020, 67, 2360–2391. [Google Scholar] [CrossRef]
- Huang, H.; He, D.; Li, Y.; Wang, B. The prototype and its evolution of the Sichuan sedimentary basin and adjacent areas during Liangshan and Qixia stages in Permian. Acta Petrol. Sin. 2017, 33, 1317–1337, (In Chinese with English abstract). [Google Scholar]
- Wang, Y.; Wen, Y.; Hong, H.; Xia, M.; Fan, Y.; Wen, L.; Kong, L.; Wu, C. Carbonate slope facies sedimentary characteristics of the Late Permian to Early Triassic in northern Sichuan Basin. J. Palaeogeogr. 2009, 11, 143–156, (In Chinese with English abstract). [Google Scholar]
- Shen, C.; Tan, X.; Li, L.; Shi, K.; Su, C.; Lian, C.; Li, H.; Xiao, D. Sedimentary characters of carbonate platform marginal slope of the Early Cambrian in northern Sichuan Basin and perspective of deformation structure. J. Palaeogeogr. 2015, 17, 321–334, (In Chinese with English abstract). [Google Scholar]
- Ross, C.A.; Ross, J.R.P. Late Paleozoic transgressive–regressive deposition. In Sea-Level Changes—An Integrated Approach; Wilgus, C.K., Hastings, B.S., Kendall, C.G.S.C., Posamentier, H.W., Ross, C.A., Van Wagoner, J.C., Eds.; SEPM Special Publications; Society of Economic Paleontologists, Mineralogists: Tulsa, OK, USA, 1988; Volume 42, pp. 227–247. [Google Scholar]
- Embry, A.F. Transgressive–Regressive (T–R) Sequence Stratigraphy. In Proceedings of the 22nd Annual Gulf Coast Section SEPM Foundation Bob F. Perkins Research Conference, Houston, TX, USA, 8–11 December 2002; pp. 151–172. [Google Scholar]
- Peng, X.; Xu, J.; Fang, C.; Shen, S.; Zhang, C. Sequence stratigraphic characteristics and shale gas exploration prospect of Middle Permian Qixia Formation in the Xuancheng Guangde Basin. East China Geol. 2022, 43, 154–166. [Google Scholar]
- Vail, P.R. Seismic stratigraphy interpretation using sequence stratigraphy: Part 1: Seismic stratigraphy interpretation procedure. AAPG Spec. Vol. 1987, 27, 1–10. [Google Scholar]
- Qiu, Z.; Wang, Q.; Zou, C.; Yan, D.; Wei, H. Transgressive–regressive sequences on the slope of an isolated carbonate platform (Middle–Late Permian, Laibin, South China). Facies 2014, 60, 327–345. [Google Scholar] [CrossRef]
- Korte, C.; Kozur, H.W.; Veizer, J. δ13C and δ18O values of Triassic brachiopods and carbonate rocks as proxies for coeval seawater and palaeotemperature. Palaeogeogr. Palaeoclimatol. Palaeoecol. 2005, 226, 287–306. [Google Scholar] [CrossRef]
- Wynn, T.C.; Read, J.F. Carbon–oxygen isotope signal of Mississippian slope carbonates, Appalachians, USA: A complex response to climate-driven fourth-order glacio-eustasy. Palaeogeogr. Palaeoclimatol. Palaeoecol. 2007, 256, 254–272. [Google Scholar] [CrossRef]
- Kaufman, A.J.; Knoll, A.H. Neoproterozoic variations in the C-isotopic composition of seawater: Stratigraphic and biogeochemical implications. Precambrian Res. 1995, 73, 27–49. [Google Scholar] [CrossRef]
- Wang, D.; Feng, X. Research on carbon and oxygen geochemistry of Lower Paleozoic in North China. Acta Geol. Sin. 2002, 76, 400–408, (In Chinese with English abstract). [Google Scholar]
- Lehmann, M.F.; Bernasconi, S.M.; Barbieri, A.; McKenzie, J.A. Preservation of organic matter and alteration of its carbon and nitrogen isotope composition during simulated and in situ early sedimentary diagenesis. Geochim. Cosmochim. Acta 2002, 66, 3573–3584. [Google Scholar] [CrossRef]
- Marais, D.J.D.; Strauss, H.; Summons, R.E.; Hayes, J. Carbon isotope evidence for the stepwise oxidation of the Proterozoic environment. Nature 1992, 359, 605–609. [Google Scholar] [CrossRef] [PubMed]
- Li, P.; Wu, X.; Bai, X.; Yan, J.; Wang, H.; Huang, J. Sediment carbon pool and organic carbon burial in the Permian Qixia Formation at Shangsi Section in Guangyuan, Sichuan Province. J. Palaeogeogr. 2010, 12, 301–306, (In Chinese with English abstract). [Google Scholar]
- Birgenheier, L.P.; Frank, T.D.; Fielding, C.R.; Rygel, M.C. Coupled carbon isotopic and sedimentological records from the Permian system of eastern Australia reveal the response of atmospheric carbon dioxide to glacial growth and decay during the late Palaeozoic Ice Age. Palaeogeogr. Palaeoclimatol. Palaeoecol. 2010, 286, 178–193. [Google Scholar] [CrossRef]
- Van de Wetering, N.; Esterle, J.S.; Golding, S.D.; Rodrigues, S.; Götz, A.E. Carbon isotopic evidence for rapid methane clathrate release recorded in coals at the terminus of the Late Palaeozoic Ice Age. Sci. Rep. 2019, 9, 16544. [Google Scholar] [CrossRef]
- Tierney, K.E. Carbon and Strontium Isotope Stratigraphy of the Permian from Nevada and China: Implications from an Icehouse to Greenhouse Transition; The Ohio State University: Columbus, OH, USA, 2010. [Google Scholar]
- Frank, D.; Reichstein, M.; Bahn, M.; Thonicke, K.; Frank, D.; Mahecha, M.D.; Smith, P.; Van der Velde, M.; Vicca, S.; Babst, F. Effects of climate extremes on the terrestrial carbon cycle: Concepts, processes and potential future impacts. Glob. Chang. Biol. 2015, 21, 2861–2880. [Google Scholar] [CrossRef]
- Fielding, C.R.; Frank, T.D.; Isbell, J.L. The late Paleozoic ice age—A review of current understanding and synthesis of global climate patterns, Resolving the late Paleozoic ice age in time and space. Geol. Soc. Am. Spec. Pap. 2008, 441, 343–354. [Google Scholar]
- Chen, B.; Joachimski, M.M.; Shen, S.; Lambert, L.L.; Lai, X.; Wang, X.; Chen, J.; Yuan, D. Permian ice volume and palaeoclimate history: Oxygen isotope proxies revisited. Gondwana Res. 2013, 24, 77–89. [Google Scholar] [CrossRef]
- Wang, Y.; Wang, J.; Chen, J.; Wang, W.; Shen, S.; Henderson, C.M. Progress, problems and prospects on the stratigraphy and correlation of the Kungurian Stage, Early Permian (Cisuralian) Series. Acta Geol. Sin.-Engl. Ed. 2011, 85, 387–398. [Google Scholar] [CrossRef]
- Jin, Y.; Wang, X.; Shang, Q.; Wang, Y.; Sheng, J. Chronostratigraphic subdivision and correlation of the Permian in China. Acta Geol. Sin. 1999, 2, 97–108, (In Chinese with English abstract). [Google Scholar]
- Saunders, A.; Reichow, M. The Siberian Traps and the End-Permian mass extinction: A critical review. Chin. Sci. Bull. 2009, 54, 20–37. [Google Scholar] [CrossRef]
- Zhang, Y.; Zhang, K. Early Permian Qiangtang flood basalts, northern Tibet, China: A mantle plume that disintegrated northern Gondwana? Gondwana Res. 2017, 44, 96–108. [Google Scholar] [CrossRef]
- Biakov, A. Permian biospheric events in Northeast Asia. Stratigr. Geol. Correl. 2012, 20, 199–210. [Google Scholar] [CrossRef]
- Dickens, G.R.; O’Neil, J.R.; Rea, D.K.; Owen, R.M. Dissociation of oceanic methane hydrate as a cause of the carbon isotope excursion at the end of the Paleocene. Paleoceanography 1995, 10, 965–971. [Google Scholar] [CrossRef]
- Hesselbo, S.P.; Gröcke, D.R.; Jenkyns, H.C.; Bjerrum, C.J.; Farrimond, P.; Morgans Bell, H.S.; Green, O.R. Massive dissociation of gas hydrate during a Jurassic oceanic anoxic event. Nature 2000, 406, 392–395. [Google Scholar] [CrossRef] [PubMed]
- Jiang, G.; Kennedy, M.J.; Christie-Blick, N. Stable isotopic evidence for methane seeps in Neoproterozoic postglacial cap carbonates. Nature 2003, 426, 822–826. [Google Scholar] [CrossRef] [PubMed]
- Wei, H.; Wang, J.; Yu, H.; Huang, B. Role of sea level fluctuation on the formation of organic carbon-rich sediments in the Chihsian formation in Sangzhi Area, western Hunan province. Earth Sci.-J. China Univ. Geosci. 2013, 38, 266–276, (In Chinese with English abstract). [Google Scholar]
- Yan, J.; Zhao, K. Palaeogeography, palaeoclimate and palaeooceanic evolution in the Permian-Triassic East Tethys region coupled with multi-layer events on the surface of the Earth. Sci. China Ser. D Earth Sci. 2002, 32, 751–759, (In Chinese with English abstract). [Google Scholar]
- Liu, X.; Yan, J.; Xue, W.; Ma, Z.; Li, B. Geobiological processes of Marine source rocks in the Middle Permian Qixia Formation, South China. Sci. China Earth Sci. 2014, 44, 1185–1192, (In Chinese with English abstract). [Google Scholar]
- Kump, L.R.; Arthur, M.A. Interpreting carbon-isotope excursions: Carbonates and organic matter. Chem. Geol. 1999, 161, 181–198. [Google Scholar] [CrossRef]
- Davydov, V.I.; Biakov, A.S. Discovery of shallow-marine biofacies conodonts in a bioherm within the Carboniferous–Permian transition in the Omolon Massif, NE Russia near the North paleo-pole: Correlation with a warming spike in the southern hemisphere. Gondwana Res. 2015, 28, 888–897. [Google Scholar] [CrossRef]
- Davydov, V.; Biakov, A.; Isbell, J.; Crowley, J.; Schmitz, M.; Vedernikov, I. Middle Permian U–Pb zircon ages of the “glacial” deposits of the Atkan Formation, Ayan-Yuryakh anticlinorium, Magadan province, NE Russia: Their significance for global climatic interpretations. Gondwana Res. 2016, 38, 74–85. [Google Scholar] [CrossRef]
- Waterhouse, J.; Shi, G. Climatic implications from the sequential changes in diversity and biogeographic affinities for brachiopods and bivalves in the Permian of eastern Australia and New Zealand. Gondwana Res. 2013, 24, 139–147. [Google Scholar] [CrossRef]
- Xu, Y.; Wei, X.; Luo, Z.; Liu, H.; Cao, J. The Early Permian Tarim Large Igneous Province: Main characteristics and a plume incubation model. Lithos 2014, 204, 20–35. [Google Scholar] [CrossRef]
- Sato, A.M.; Llambías, E.J.; Basei, M.A.S.; Castro, C.E. Three stages in the Late Paleozoic to Triassic magmatism of southwestern Gondwana, and the relationships with the volcanogenic events in coeval basins. J. S. Am. Earth Sci. 2015, 63, 48–69. [Google Scholar] [CrossRef]
- Cleal, C.J.; Thomas, B.A. Palaeozoic tropical rainforests and their effect on global climates: Is the past the key to the present? Geobiology 2005, 3, 13–31. [Google Scholar] [CrossRef]
- Kiessling, W. Secular variations in the Phanerozoic reef ecosystem. Soc. Sediment. Geol. Spec. Publ. 2002, 72, 625–690. [Google Scholar]
- Flügel, E.; Kiessling, W. Patterns of Phanerozoic reef crises. Soc. Sediment. Geol. Spec. Publ. 2002, 72, 691–734. [Google Scholar]
- Weidlich, O. Middle and Late Permian reefs—Distributional patterns and reservoir potential. Soc. Sediment. Geol. Spec. Publ. 2002, 72, 339–390. [Google Scholar]


| No. | Lithology | TOC/% | δ13Ccarb/‰ | δ18Ocarb/‰ | δ13Corg/‰ | 13Δ/‰ |
|---|---|---|---|---|---|---|
| T-1 | Limestone | 0.41 | 2.1 | −7.6 | −27.0 | 29.1 |
| T-2 | Limestone | 0.28 | 1.3 | −7.2 | −27.6 | 28.9 |
| T-3 | Limestone | 1.41 | 2.1 | −7.0 | −27.0 | 29.0 |
| T-4 | Limestone | 0.30 | 1.7 | −7.0 | −27.9 | 29.7 |
| T-5 | Limestone | 0.81 | 1.5 | −7.0 | −27.8 | 29.3 |
| T-6 | Limestone | 1.89 | 2.2 | −7.3 | −28.0 | 30.2 |
| T-7 | Limestone | 0.26 | 3.1 | −7.4 | −27.1 | 30.2 |
| T-8 | Limestone | 0.49 | 2.4 | −7.4 | −28.0 | 30.3 |
| T-9 | Limestone | 0.35 | 2.5 | −6.9 | −27.6 | 30.1 |
| T-10 | Limestone | 0.44 | 2.5 | −9.3 | −27.4 | 29.9 |
| T-11 | Limestone | 0.34 | 2.3 | −7.9 | −27.8 | 30.0 |
| T-12 | Limestone | 0.87 | 2.7 | −7.3 | −26.8 | 29.4 |
| T-13 | Limestone | 1.26 | 2.6 | −6.6 | −27.5 | 30.1 |
| T-14 | Limestone | 0.14 | 2.6 | −5.3 | −26.6 | 29.2 |
| T-15 | Limestone | 0.47 | 2.9 | −5.7 | −27.3 | 30.2 |
| T-16 | Limestone | 1.51 | 2.5 | −5.5 | −27.9 | 30.4 |
| T-17 | Limestone | 0.50 | 2.8 | −5.1 | −27.3 | 30.2 |
| T-18 | Limestone | 1.60 | 2.1 | −5.4 | −27.6 | 29.7 |
| T-19 | Limestone | 0.39 | 1.5 | −5.5 | −28.0 | 29.5 |
| T-20 | Limestone | 1.06 | 1.1 | −5.7 | −28.2 | 29.3 |
| T-21 | Limestone | 0.30 | 1.9 | −6.6 | −26.9 | 28.8 |
| T-22 | Limestone | 2.12 | 2.2 | −6.9 | −27.2 | 29.4 |
| T-23 | Limestone | 2.00 | 2.7 | −4.9 | −26.5 | 29.2 |
| T-24 | Limestone | 0.94 | 2.2 | −6.6 | −27.3 | 29.5 |
| T-25 | Limestone | 1.26 | 1.5 | −6.5 | −27.1 | 28.6 |
| T-26 | Limestone | 0.39 | 1.7 | −7.9 | −28.6 | 30.3 |
| T-27 | Limestone | 1.19 | 1.7 | −8.6 | −27.2 | 28.9 |
| T-28 | Limestone | 1.68 | 2.4 | −7.7 | −27.1 | 29.5 |
| T-29 | Limestone | 0.57 | 3.5 | −5.1 | −26.8 | 30.2 |
| T-30 | Limestone | 0.33 | 4.3 | −5.1 | −26.3 | 30.7 |
| T-31 | Limestone | 0.34 | 3.4 | −8.5 | −27.1 | 30.6 |
| T-32 | Limestone | 0.97 | 3.8 | −5.8 | −27.3 | 31.1 |
| T-33 | Limestone | 0.32 | 3.6 | −5.7 | −26.3 | 29.9 |
| T-34 | Limestone | 0.23 | 4.2 | −6.1 | −24.8 | 29.0 |
| T-35 | Limestone | 0.32 | 4.1 | −5.8 | −25.8 | 29.9 |
| T-36 | Limestone | 0.70 | 3.1 | −6.2 | −26.9 | 30.0 |
| T-37 | Limestone | 0.27 | 4.4 | −6.1 | −26.2 | 30.5 |
| T-38 | Limestone | 0.34 | 4.2 | −5.8 | −27.2 | 31.4 |
| T-39 | Limestone | 0.20 | 3.8 | −5.3 | −26.8 | 30.7 |
| T-40 | Limestone | 0.29 | 3.6 | −6.9 | −26.7 | 30.3 |
| T-41 | Limestone | 0.18 | 3.5 | −7.2 | −26.2 | 29.7 |
| T-42 | Limestone | 0.27 | 3.1 | −6.2 | −26.7 | 29.8 |
| T-43 | Calcareous shale | 0.61 | 3.1 | −6.2 | −27.4 | 30.6 |
| T-44 | Limestone | 1.18 | 2.8 | −6.9 | −28.3 | 31.1 |
| T-45 | Calcareous shale | 1.82 | 2.8 | −6.4 | −26.8 | 29.6 |
| T-46 | Limestone | 1.57 | 2.2 | −6.4 | −27.1 | 29.3 |
| T-47 | Limestone | 0.51 | 2.3 | −7.4 | −28.0 | 30.2 |
| T-48 | Limestone | 0.33 | 2.7 | −6.4 | −27.0 | 29.7 |
| T-49 | Limestone | 0.65 | 2.4 | −7.1 | −27.1 | 29.5 |
| T-50 | Limestone | 0.75 | 2.6 | −5.6 | −27.3 | 29.9 |
Disclaimer/Publisher’s Note: The statements, opinions and data contained in all publications are solely those of the individual author(s) and contributor(s) and not of MDPI and/or the editor(s). MDPI and/or the editor(s) disclaim responsibility for any injury to people or property resulting from any ideas, methods, instructions or products referred to in the content. |
© 2023 by the authors. Licensee MDPI, Basel, Switzerland. This article is an open access article distributed under the terms and conditions of the Creative Commons Attribution (CC BY) license (https://creativecommons.org/licenses/by/4.0/).
Share and Cite
Fang, C.; Zhang, C.; Bai, X.; Tang, H.; Chao, J.; Wei, H. Facies and Carbon Isotope Variations during the Kungurian (Early Permian) in the Chihsia Formation in the Lower Yangtze Region of South China. Minerals 2023, 13, 551. https://doi.org/10.3390/min13040551
Fang C, Zhang C, Bai X, Tang H, Chao J, Wei H. Facies and Carbon Isotope Variations during the Kungurian (Early Permian) in the Chihsia Formation in the Lower Yangtze Region of South China. Minerals. 2023; 13(4):551. https://doi.org/10.3390/min13040551
Chicago/Turabian StyleFang, Chaogang, Chengcheng Zhang, Xiao Bai, Hailei Tang, Jiangqin Chao, and Hengye Wei. 2023. "Facies and Carbon Isotope Variations during the Kungurian (Early Permian) in the Chihsia Formation in the Lower Yangtze Region of South China" Minerals 13, no. 4: 551. https://doi.org/10.3390/min13040551
APA StyleFang, C., Zhang, C., Bai, X., Tang, H., Chao, J., & Wei, H. (2023). Facies and Carbon Isotope Variations during the Kungurian (Early Permian) in the Chihsia Formation in the Lower Yangtze Region of South China. Minerals, 13(4), 551. https://doi.org/10.3390/min13040551